brynmawr...•fiction: story, poem, play •nonfiction: biography, autobiography, article, interview...
TRANSCRIPT

Presentation

National Council of Teachers of Mathematics http://standards.nctm.org/
New Standards http://www.ncee.org/store/products/index.jsp Pennsylvania Academic Standards http://www.pde.state.pa.us/
GRADE 3,5,8, & 11 STANDARDS AND ELIGIBLE CONTENT (PSSA 2004) http://www.pde.state.pa.us/
Assessment Anchors (PSSA 2005)[Coming Soon!]
Mathematics Standards


National Assessment of Educational Progress
Web Site

100
90
80
70
60
50
40
30
20
10
0
PSSA % Content by
Grade Level
Numbers
Algebra
Geometry
Measurement
Data
5th 8th 11th

2003 NAEP Emphasis by Grade Level
100 90 80 70 60 50 40 30
20 10
0
Numbers
Algebra
Geometry
Measurement
Data
4th 8th 12th

NCTM Emphasis Across the Grades
Number
Algebra
Geometry
Measurement
Data Analysis and Probability
Pre-K–2 3–5 6–8 9–12
NCTM.Org

Assessments • The International Mathematics and Science Study
• http://timss.bc.edu/TIMSS1/Items.html • National Assessment of Educational Progress
• http://nces.ed.gov/nationsreportcard/ • Council of Chief State School Officers
• http://www.ccsso.org/chief_state_school officers/state_education_agencies/ • Pennsylvania System of School Assessment
• http://www.pde.state.pa.us/
• Local Assessment
Your web site.

PSSA Sample Tests
• BB Sample PSSA Tests 5,8,11\A. 5thPssaTest\5th Grade PSSA Sample Test.HTM

No Child Left Behind

W HAT ARE THE INDICATORS? •SSSS tttt uuuu dddd eeee nnnn tttt AAAA cccc hhhh iiii eeee vvvv eeee mmmm eeee nnnn tttt
•PPPP aaaa rrrr tttt iiii cccc iiii pppp aaaa tttt iiii oooo nnnn RRRR aaaa tttt eeee IIII nnnn AAAA ssss ssss eeee ssss ssss mmmm eeee nnnn tttt ssss
•AAAA tttt tttt eeee nnnn dddd aaaa nnnn cccc eeee –––– KKKK ----8888
•4444 ----yyyy eeee aaaa rrrr GGGG rrrr aaaa dddd uuuu aaaa tttt iiii oooo nnnn RRRR aaaa tttt eeee ––––
SSSS eeee cccc oooo nnnn dddd aaaa rrrr yyyy

A DEQUATE
-
35% 45% 56% 67% 78% 89% 100%
2004 2003 2002
Y EARLY PROGRESS
MATH – % Proficient by Year
2007 2006 2005
2010 2009 2008 2011 2012 2013 2014

SUMMARY OF NCLB RESULTS
Econ.
LEP
IEP
Asian
Hispanic
Black
White
All
TOTAL
Y OR N
Partic.
Rate
>94.5%
Attend.
/Grad.
>94.5%
Rdg
AYP > 45%
N > 39
Math
AYP > 35%
N > 39
School
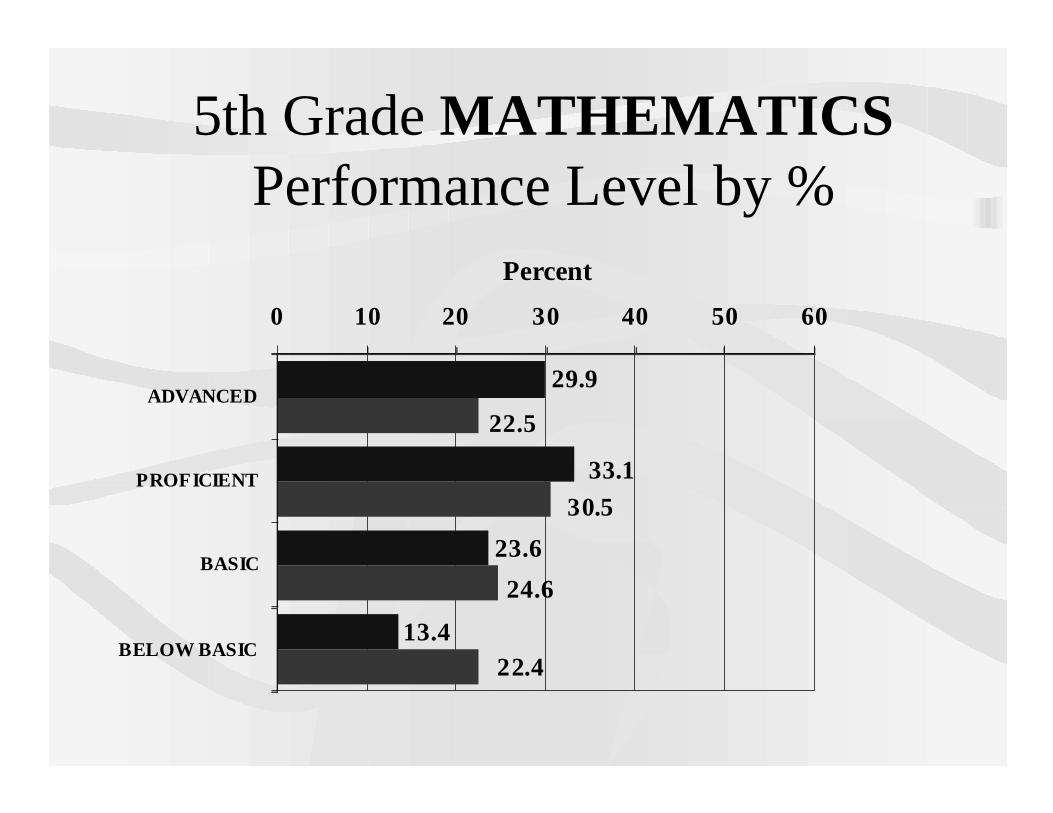
5th Grade MATHEMATICS Performance Level by %
29.9
23.6
13.4
33.1
22.4
24.6
30.5
22.5
0 10 20 30 40 50 60
ADVANCED
PROFICIENT
BASIC
BELOW BASIC
Percent

Grade 5 Average Percent Correct by Math Standard
16.5 17.6
11.8
5.9
9.4
5.9
10.6 10.6
5.9 5.9
8.9
12.4
6.4
4.2
5.3
3.8
6.1 6.2
3.8 3.6
5.8
4.3
7.4
10.3
13.4
6.3
4.2
6.4
4.2 3.9
0
5
10
15
2.1
Nu
mb
er
2.2
Co
mp
.
2.3
Me
as.
2.4
Re
as.
2.6
Sta
t.
2.7
Pro
ba
b.
2.8
Alg
Fu
n
2.9
Ge
om
2.1
0T
rig
2.1
1C
alc
BLDG AVG %
STATE AVG %
PERFECT %

Percent Math Open Ended Tasks Results Grade 5
8
24
29
23
10
67
14
24
16
27
11
0
5
10
15
20
25
30
35
5-Adv. 4-Sat. 3-Almost 2-Partial 1-Minimal 0-Zero
Building Dis tric t State

Math Performance Levels
1179 and lower
1179 and lower
1169 and lower
Below Basic
1180 - 13091180 - 12991170 - 1299Basic
1310 - 14891300 - 15091300 - 1459Proficient
1490 and higher
1510 and higher
1460 and higher
Advanced
Grade 11Grade 8Grade 5

5th Grade Advanced Student Math Scores
60
65
70
75
80
85
Individual Student Report
14 Students
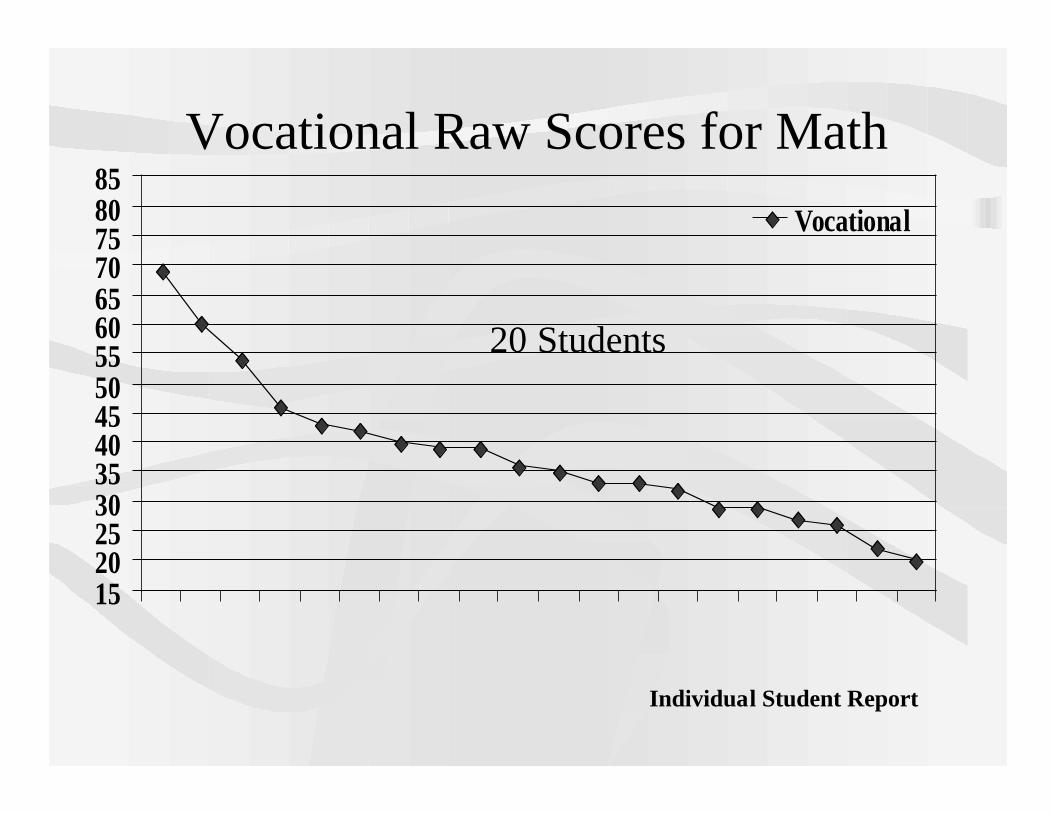
Vocational Raw Scores for Math
15 20 25 30 35 40 45 50 55 60 65 70 75 80 85
Vocational
Individual Student Report
20 Students
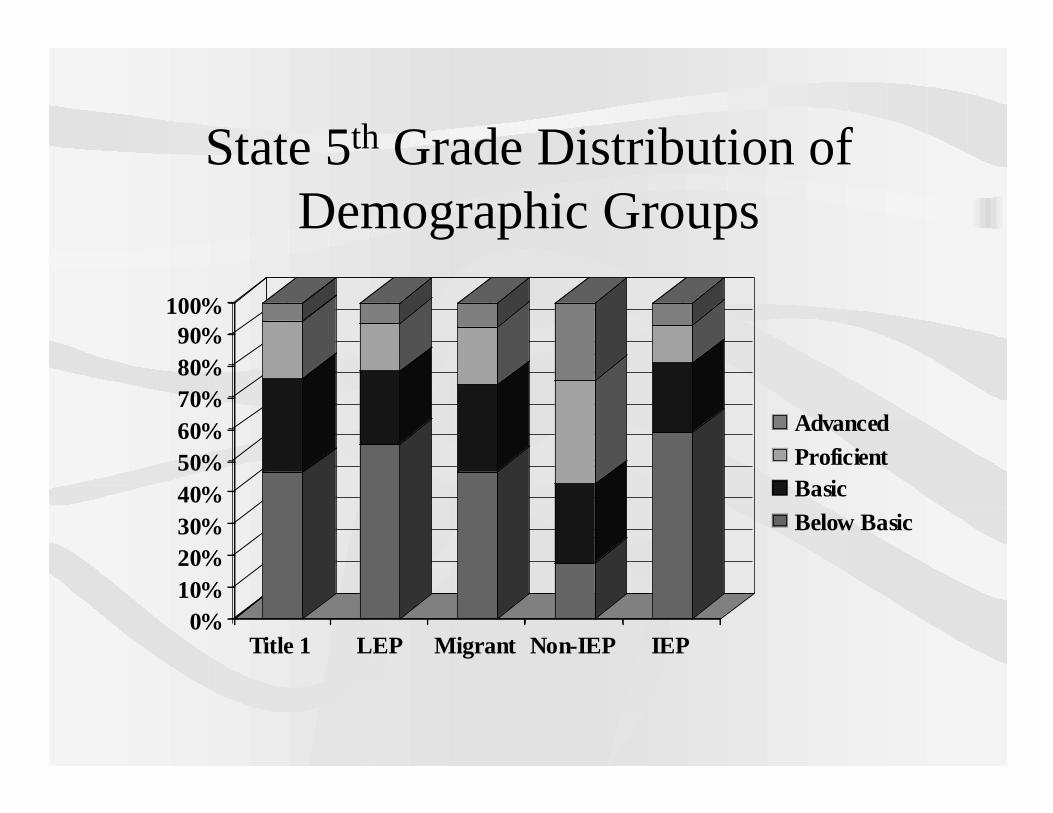
State 5th Grade Distribution of Demographic Groups
0% 10% 20% 30% 40% 50% 60% 70% 80% 90%
100%
Title 1 LEP Migrant Non-IEP IEP
Advanced Proficient Basic Below Basic

5th Grade Point Distribution By Math Standard Area
14 15
10
5
8
5
9 9
5 5
0
2
4
6
8
10
12
14
16
18
20 2.1 Numbers
2.2 Computation
2.3 Measurement
2.4 Reasoning
2.6 Statistics
2.7 Prob & Data Anal
2.8 Alg & Funct
2.9 Geometry
2.10 Trig
2.11 Calculus

Sample Guiding Questions! • Define or describe the highest level of mathematics that you offer
to all students? • How have you integrated mathematics across all disciplines and
vice versa? • Does the level of math offerings accessible to all off your
students match or exceed the standards and/or assessments required by the Pennsylvania Department of Education and No Child Left Behind for all students?
• Is your mathematics curriculum sequenced in the same order as the state standards and in the same order that they are assessed?
• Which sub populations are not performing well? • Do you include a unit in every math course focusing on
communications skills that are particularly related to mathematics and how often is it reviewed? Briefly describe the objectives of the unit.
• How much time is allocated for the teaching of mathematics to all students at each grade level?

TIME
IS
OF
THE
ESSENCE

All Curricula
All Curricula Containing Math Assessment Anchors
All Math courses + Math Tutoring
All Math Courses
All Math Courses Containing only
Assessment Anchors
Interdisciplinary Infusion Team
One period = 2/3 hr. One day = 6 hours
1 course = (2/3 x 180)/ 6 = 20 days 25% REDUCTION FACTOR = 20 – 5 = 15 DAYS

RESEARCH Standards Based Curricula
• CoMap Elementary
The Consortium for Mathematics and its
Applications
• ShowmeCenter Middle School
• COMPASS High School Curricular Options in Mathematics Programs
for All Secondary Students

Research on Mathematics Education
Grover J. (Russ) Whitehurst, Ph.D.
Director
Institute of Education Sciences
United States Department of Education

Achievement Tracking and Grouping
Assessment for Instruction Structured Peer Feedback Conceptual Understanding
Curriculum Implementation
Teachers Alignment

The Math Wars
Skills-based Approaches Constructivist Approaches
Extrinsically motivated Intrinsically motivated
Skill-relevant problems Authentic problems
Children should master standard facts & concepts
Children should develop their own understanding
Knowledge is imparted Knowledge is constructed

Checks on Constructivism
• Many routes to understanding
• Limits on working memory
• Inefficiency of discovery
• Role of work in learning

Elements of State Math Reforms
• State-wide standards
• Linked state-wide assessments
• Accountability for results

Students can do no better than
the assignments they
are given

Getting Ready! The 2004 PSSA
Assessment and Accountability
January 2004

Purpose and Goals
• Clarify what is expected on PSSA
• Provide an update on assessment system
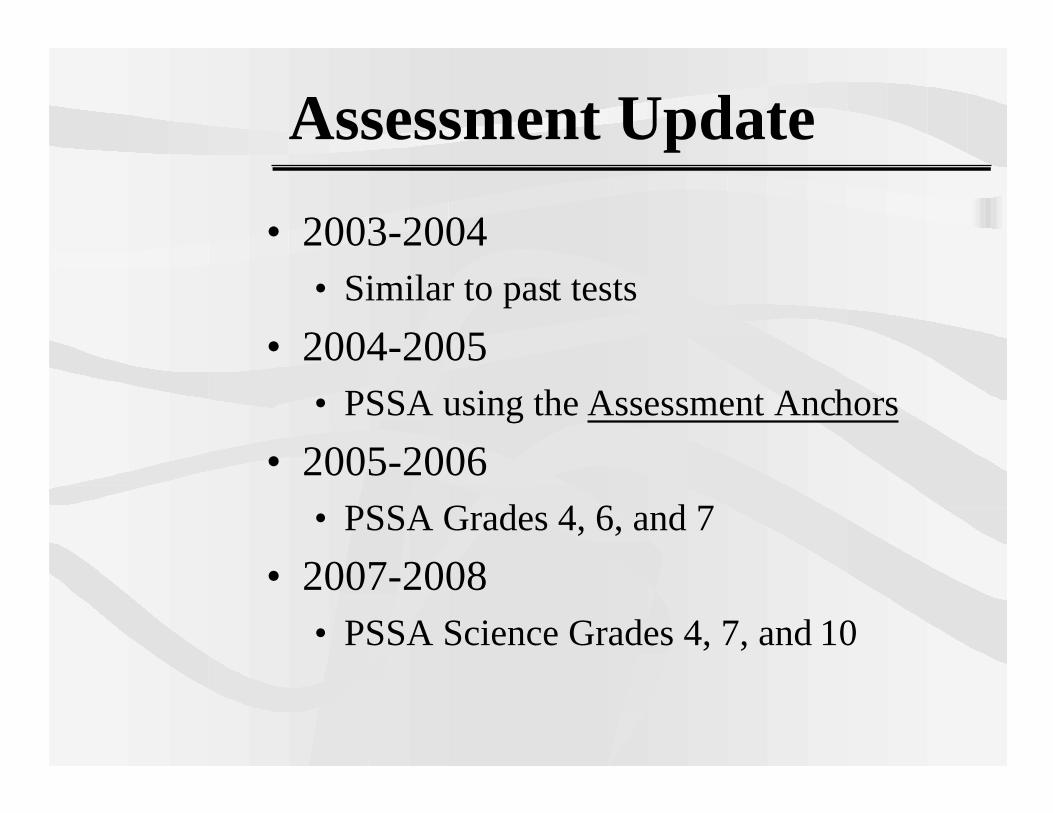
Assessment Update
• 2003-2004 • Similar to past tests
• 2004-2005 • PSSA using the Assessment Anchors
• 2005-2006 • PSSA Grades 4, 6, and 7
• 2007-2008 • PSSA Science Grades 4, 7, and 10

What You Need to Know

Tools You Have
• Test Design/Format
• Test Blueprint
• Standards/Eligible Content
• Released Items/Rubrics
• Accommodations Policy

Test Design and Format

Test Design • Common versus Matrix • Weights
• Items: • Multiple-choice Items•1 point • Reading Task•4 points • Math Task•5 points
• Standards: • The more items per standard, the more
heavily ‘weighted’ that standard

- - - - -
Current Test Format # of Open Ended Items
TOTAL
# of Multiple Choice Items
Test Length # of # of # of# of Common Grade Matrix # of Points (Not strictly Common Items Matrix ItemsItemstimed) Items
171 _ hours 1
3 30-min. 25 1 17+25+8=50- - - - - 1 Field(10 Field Test(3 sessions)
Test)
Reading
4 hours 52 52+8=60265, 8,
80-min. 72 2 1 72+8=803611 40(3 sessions) 80 80+8=88
2 hours
3 30-min. 60 10 2 1 60+10=70
(4 sessions)
Math 4 hours
5, 8, 60-min. 70 15 3 1 70+15=85
11 (4 sessions)

Test Blueprints

Sample Reading Test Blueprint Percent of Test
Standards Category *Gr. 3 Gr. 5 Gr. 8 Gr. 11
1.1 Learning to Read Independently
36 or 38 21.7 18.0 30.0
1.2 Reading Critcally in All Content Areas
24 or 26 18.3 16.0 11.0
1.3 Reading, Analyzing and Interpreting Literature
36 or 38 33.3 36.0 24.0
1.7 Characteristics and Function of the English Language **
13.3 15.0 16.0
1.8 Research **
13.3 15.0 19.0 Percent 100 100 100 100
Number of Points 50 60 80 88
*The number of points per standards category varies depending on which matrix form a student takes. For all students the total number of points was 50. **Standards categories 1.7 and 1.8 are not assessed at Grade 3

Sample Mathematics Test Blueprint Percents
Standards Category Grade 3 Grade 5 Grade 8 Grade 11
2.1 Numbers, Number Systems and Number Relationships
14.3 17.6 11.8 5.9
2.2 Computation and Estimation 14.3 17.6 11.8 11.8
2.3 Measurement and Estimation 11.4 11.8 11.8 11.8
2.4 Mathematical Reasoning and Connections 7.1 5.9 5.9 5.9
2.6 Statistics and Data Analysis 10.0 9.4 11.8 11.8
2.7 Probability and Predictions 7.1 5.9 5.9 5.9
2.8 Algebra and Functions 10.0 8.2 17.6 22.4
2.9 Geometry 11.4 11.8 11.8 12.9
2.10 Trigonometry 7.1 5.9 5.9 5.9
2.11 Concepts of Calculus 7.1 5.9 5.9 5.9
Percent Number of points
100 100 100 100 70 85 85 85
Standard 2.5 is included in the above standards and is not a stand alone.

Standards and Eligible Content

Sample Grade 5 Math Eligible Content
2.2 Computation and Estimation
Up to 4 operations.
Include division up to four digits.
A. Create and solve word problems involving addition, subtraction, division and multiplication of whole numbers.
Eligible ContentStandard Statement

Sample Grade 3 Reading Eligible Content 1.1.3 Learning to Read Independently
Items may ask students to identify text type at a broad level, such as
•Fiction: story, poem, play
•Nonfiction: biography, autobiography, article, interview
Third-grade students will not be expected to make fine distinctions among genre, such as folk tale, fairy tale, or fable.
Items that address a purpose for reading will assess a general purpose, such as enjoyment, for learning information, to learn how to do something, etc.
A. Identify the purposes and types of text (e.g., literature, information) before reading
Eligible ContentStandard Statement

So what?
• How could the Eligible Content help teachers organize their curriculum?
• How would you use the Eligible Content to inform instructional practice?

Released Items and Rubrics

What’s out there now?
• See Assessment Handbook
• 2003 Items on the website
• Rubrics are only for this year’s test

Administration Highlights
• Who takes the test?
• When?
• How? • Allowable resources
• Accommodations
• Which test:
PSSA or PASA

Who takes the test?
• All students must take test including IEP and ELL.
• “Non-Assessed” students: • Parental request
• Alternate assessment
• Extended absence
• Student refusal

How? • Allowable Materials
• The Rubrics
• Calculators when specified
• Formula Sheets
• Non-Allowable Materials • Calculators for non-calculator use
items
• Dictionaries
• Textbooks

Accommodations
• Revised Accommodations Policy on Website for ELL, 504 and IEP
• New for ELL
• Use of an interpreter
• Use of bilingual dictionaries

Taking the PASA
• Six criteria
• The number of proficient and advanced scores for AYP cannot exceed 1% of the total population assessed in the district.
• Contact Lynda Lupp in the Bureau of Special Education for more information
(717) 783-2311

Where we’re headed • Maintain rigor and alignment
• Take mystery out of test
• Provide access to test
• Give teachers information they can use
• Provide more resources and tools
• Focus on development of local assessments

