determining importance in nonfiction. good readers distinguish the differences between fiction and...
TRANSCRIPT
DETERMININGIMPORTANCE IN
NONFICTION
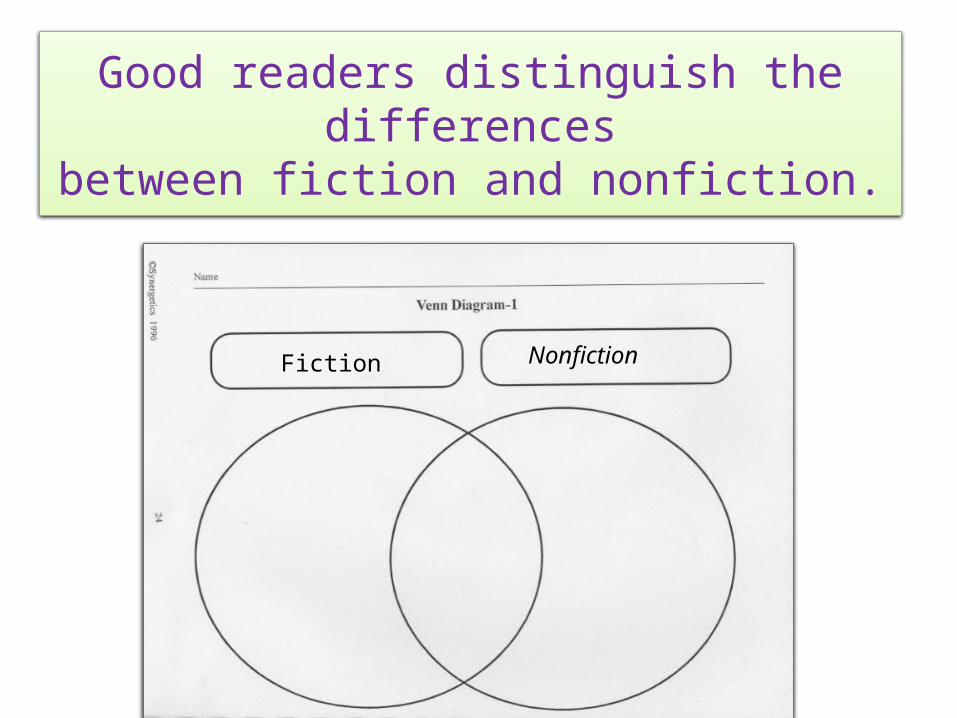
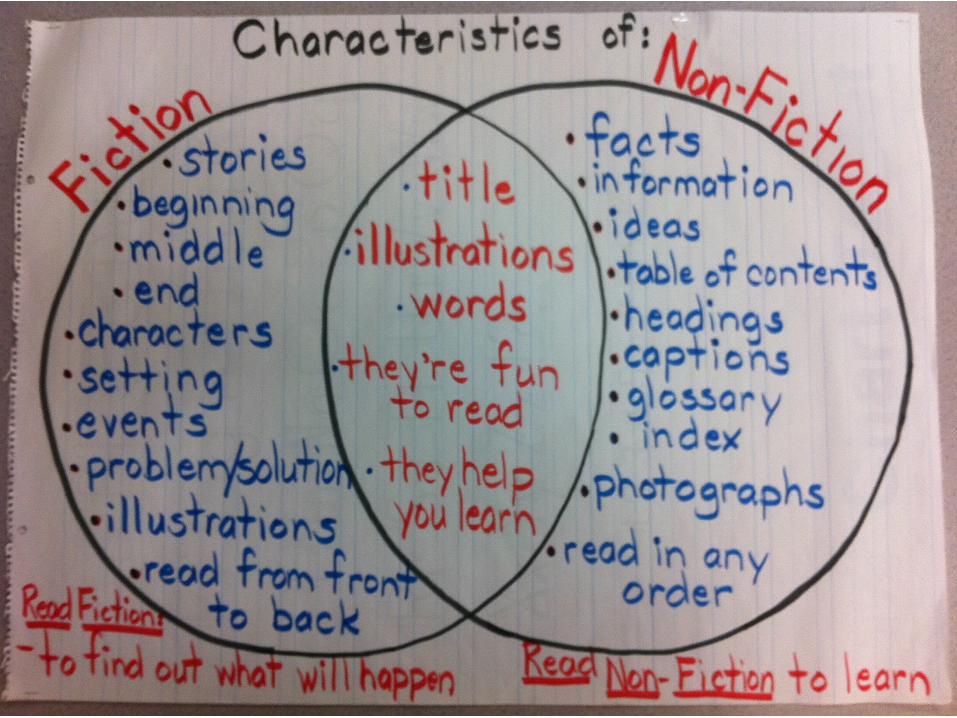
Good readers distinguish the differences
between fiction and nonfiction.
Fiction Nonfiction
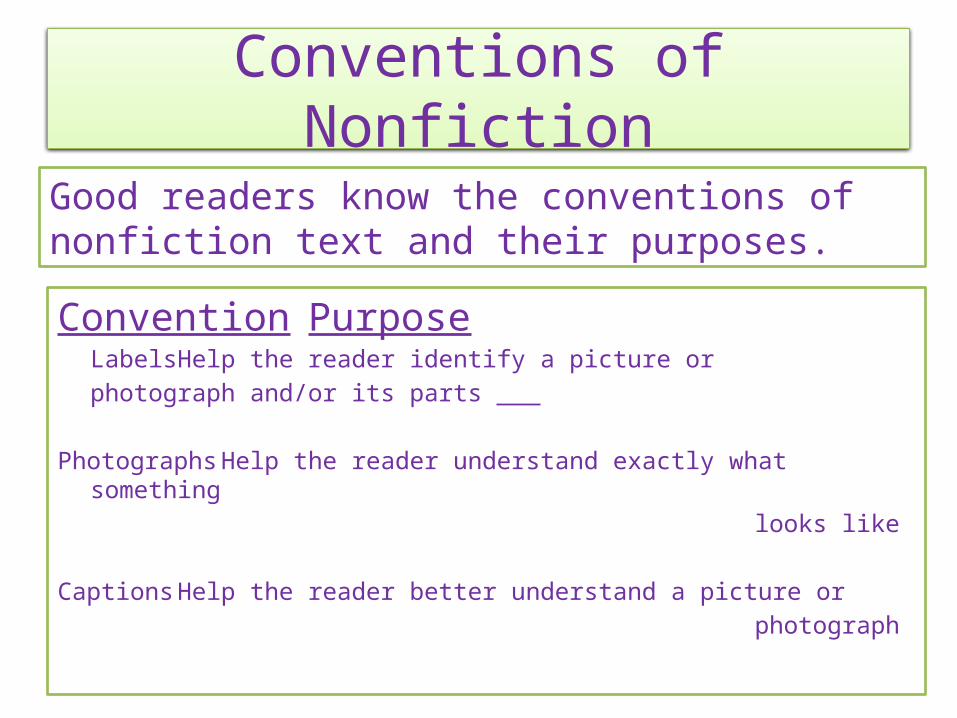
Conventions of Nonfiction
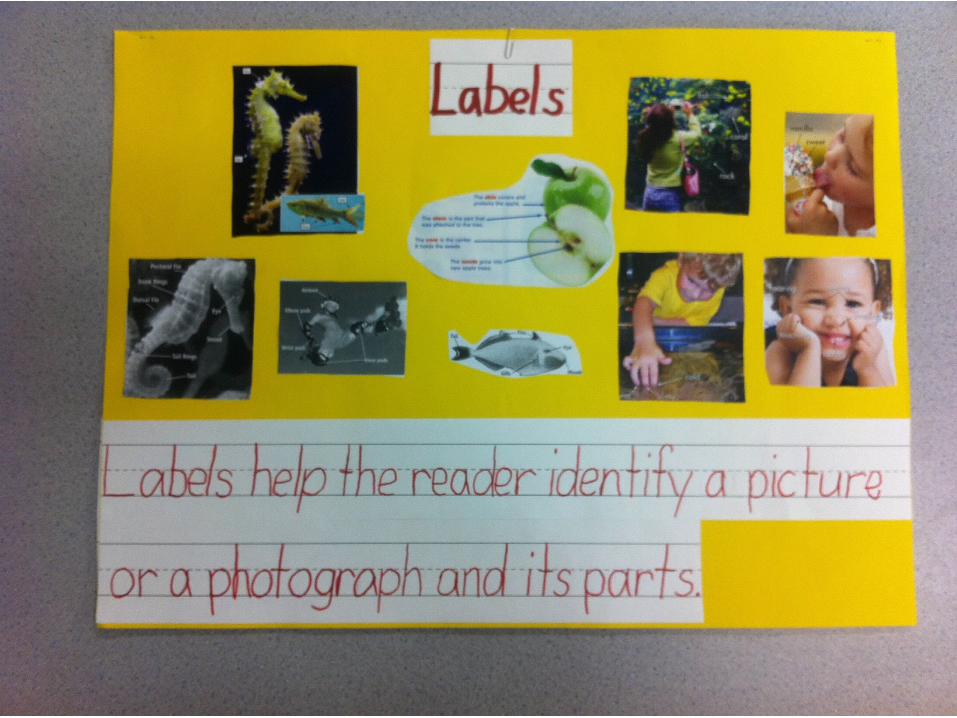
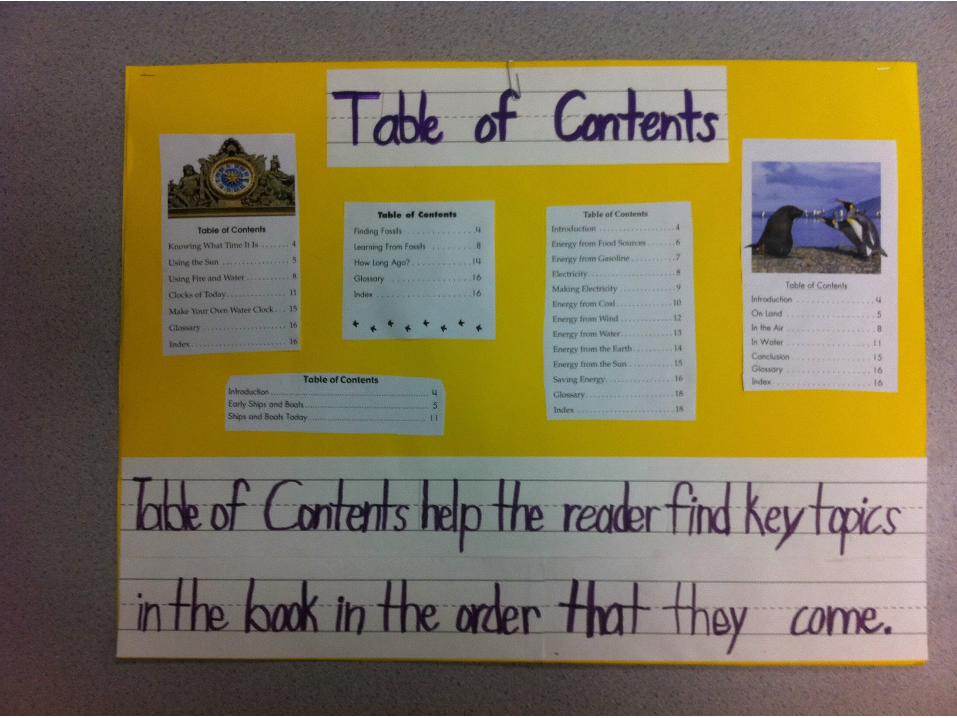
Good readers know the conventions of nonfiction text and their purposes.
Convention PurposeLabels Help the reader identify a picture or
photograph and/or its parts
Photographs Help the reader understand exactly what something
looks like
Captions Help the reader better understand a picture or photograph
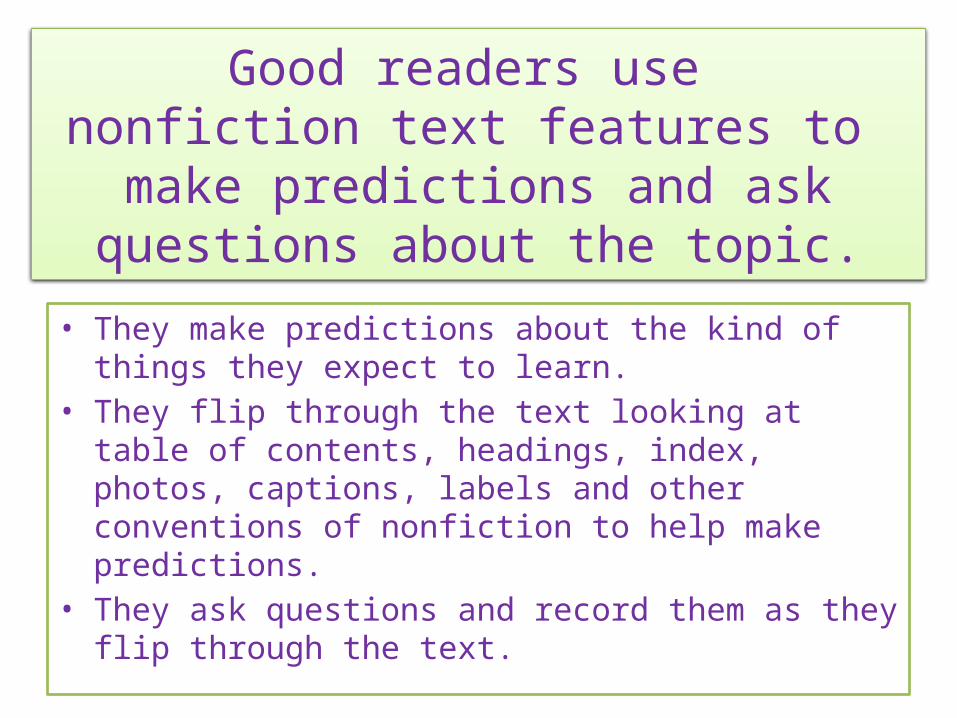
Good readers use nonfiction text features to make predictions and ask questions about the topic.
• They make predictions about the kind of things they expect to learn.
• They flip through the text looking at table of contents, headings, index, photos, captions, labels and other conventions of nonfiction to help make predictions.
• They ask questions and record them as they flip through the text.
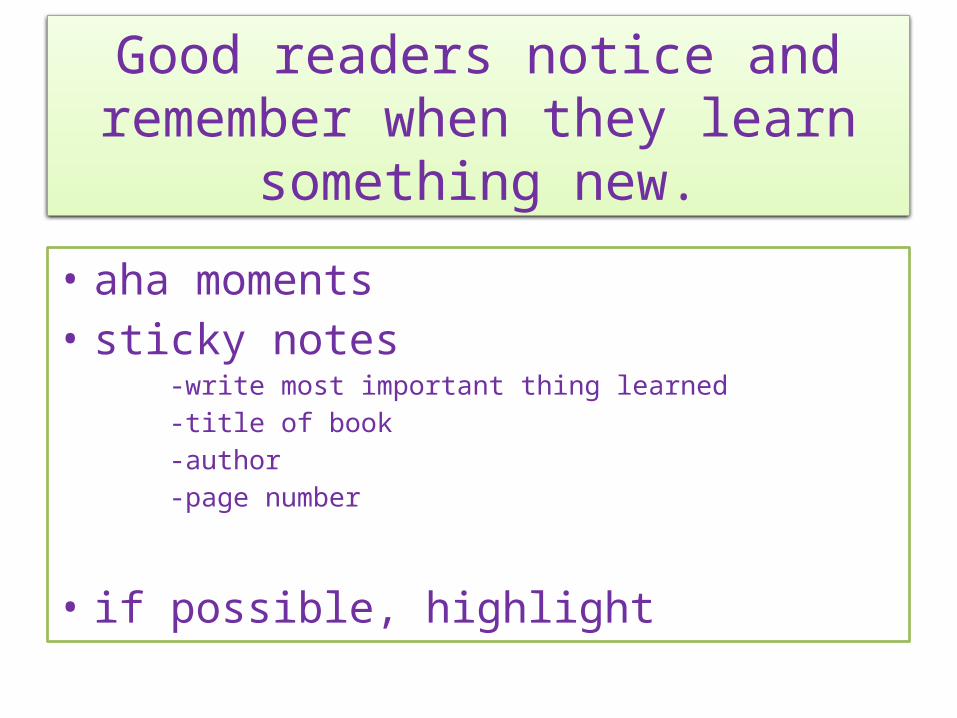
Good readers notice and remember when they learn
something new.
• aha moments • sticky notes -write most important thing learned -title of book -author -page number
• if possible, highlight
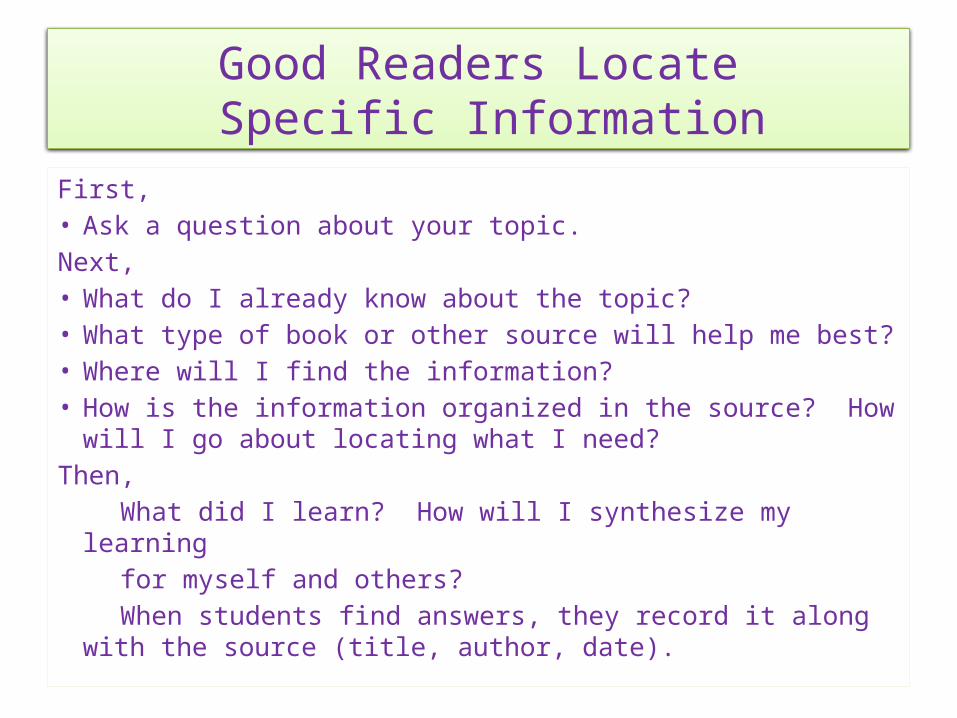
Good Readers Locate Specific Information
First,• Ask a question about your topic.Next,• What do I already know about the topic?• What type of book or other source will help me best?• Where will I find the information?• How is the information organized in the source? How will I go
about locating what I need?Then, What did I learn? How will I synthesize my learning for myself and others? When students find answers, they record it along with the source
(title, author, date).
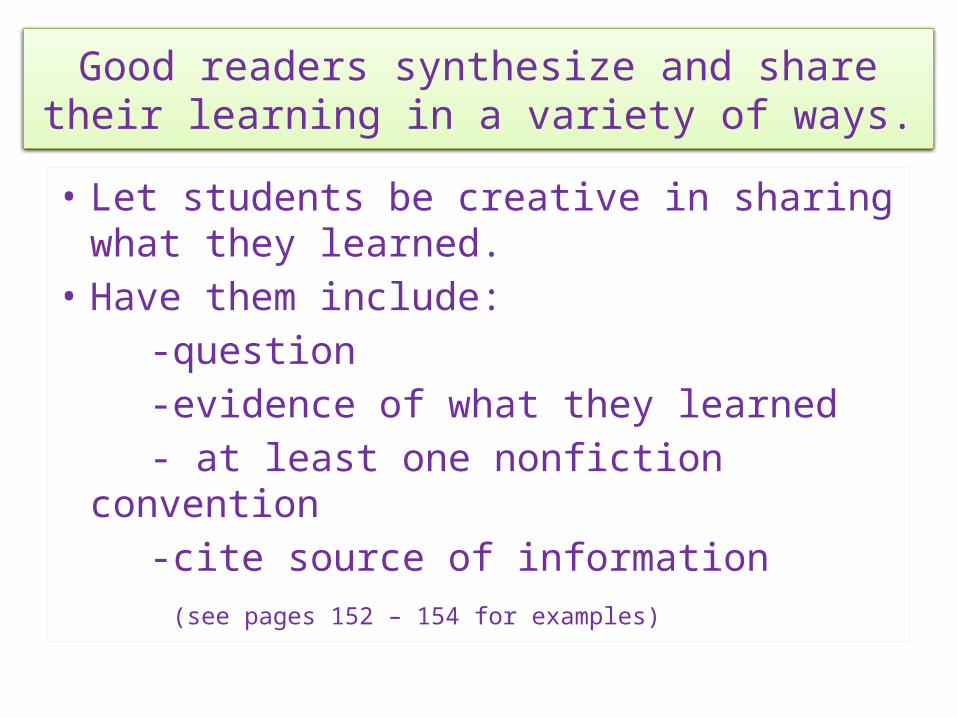
Good readers synthesize and sharetheir learning in a variety of ways.
• Let students be creative in sharing what they learned.
• Have them include: -question -evidence of what they learned - at least one nonfiction convention -cite source of information (see pages 152 – 154 for examples)
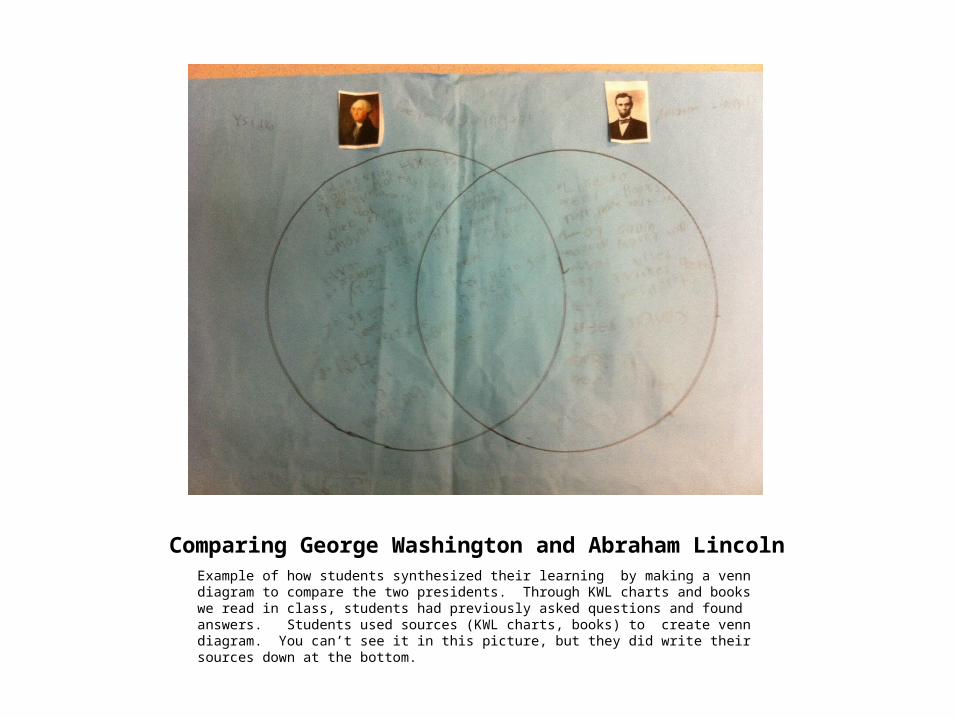
Comparing George Washington and Abraham LincolnExample of how students synthesized their learning by making a venn diagram to compare the two presidents. Through KWL charts and books we read in class, students had previously asked questions and found answers. Students used sources (KWL charts, books) to create venn diagram. You can’t see it in this picture, but they did write their sources down at the bottom.
THANK YOU!