© 2015 ihs ihs.com ihs automotive us vehicle market outlook adapting to the next stage april 14,...
TRANSCRIPT

© 2015 IHS
ihs.com
IHS AUTOMOTIVE
US Vehicle Market OutlookAdapting To The Next StageApril 14, 2015
John McBride, Vice President, IHS Automotive, Americas
2
Contents
© 2015 IHS
• Economic Backdrop
• Beneath The Surface: Understanding Distinct Markets
• Makes and Segments
• Conquest Marketing
• Major Trends
Comcast Spotlight | April 2015
© 2015 IHS 3
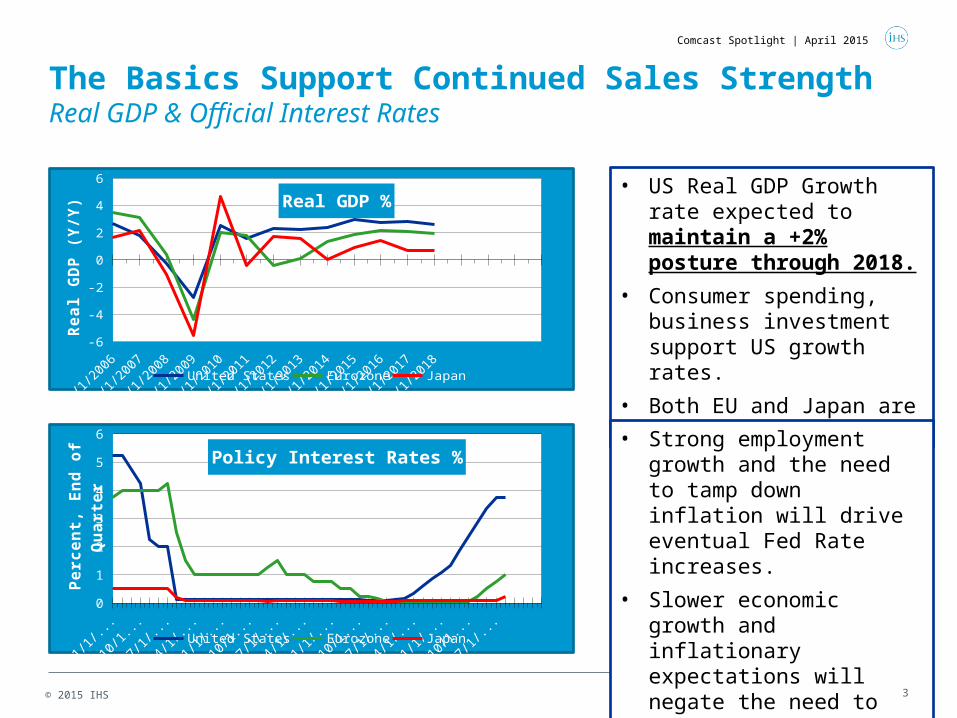
The Basics Support Continued Sales StrengthReal GDP & Official Interest Rates
2006 2007 2008 2009 2010 2011 2012 2013 2014 2015 2016 2017 2018-6
-4
-2
0
2
4
6
Real GDP %
United States Eurozone Japan
Re
al G
DP
(Y
/Y)
• US Real GDP Growth rate expected to maintain a +2% posture through 2018.
• Consumer spending, business investment support US growth rates.
• Both EU and Japan are challenged.
2007 2008 2009 2010 2011 2012 2013 2014 2015 2016 20170
1
2
3
4
5
6
Policy Interest Rates %
United States Eurozone Japan
Pe
rce
nt,
En
d o
f Q
ua
rte
r • Strong employment growth and the need to tamp down inflation will drive eventual Fed Rate increases.
• Slower economic growth and inflationary expectations will negate the need to raise official rates in Japan and EU.
Comcast Spotlight | April 2015
© 2015 IHS 4
Comcast Spotlight | April 2015
2007
2007
2007
2007
2008
2008
2008
2008
2009
2009
2009
2009
2010
2010
2010
2010
2011
2011
2011
2011
2012
2012
2012
2012
2013
2013
2013
2013
2014
2014
2014
2014
2015
2015
2015
2015
2016
2016
2016
2016
2017
2017
2017
2017
0
2
4
6
8
10
12
Unemployment Rate
An
nu
al p
erc
en
t c
ha
ng
e
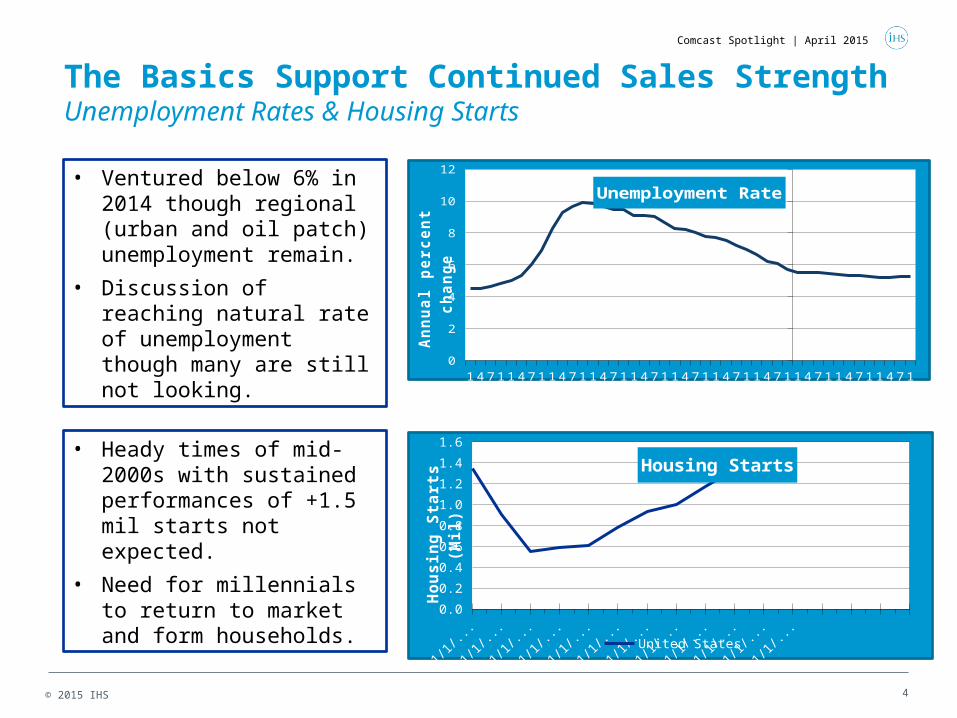
• Ventured below 6% in 2014 though regional (urban and oil patch) unemployment remain.
• Discussion of reaching natural rate of unemployment though many are still not looking.
2006 2007 2008 2009 2010 2011 2012 2013 2014 2015 2016 20170.0
0.2
0.4
0.6
0.8
1.0
1.2
1.4
1.6
Housing Starts
United States
Ho
us
ing
Sta
rts
(M
il)• Heady times of mid-2000s
with sustained performances of +1.5 mil starts not expected.
• Need for millennials to return to market and form households.
The Basics Support Continued Sales StrengthUnemployment Rates & Housing Starts
© 2015 IHS 5
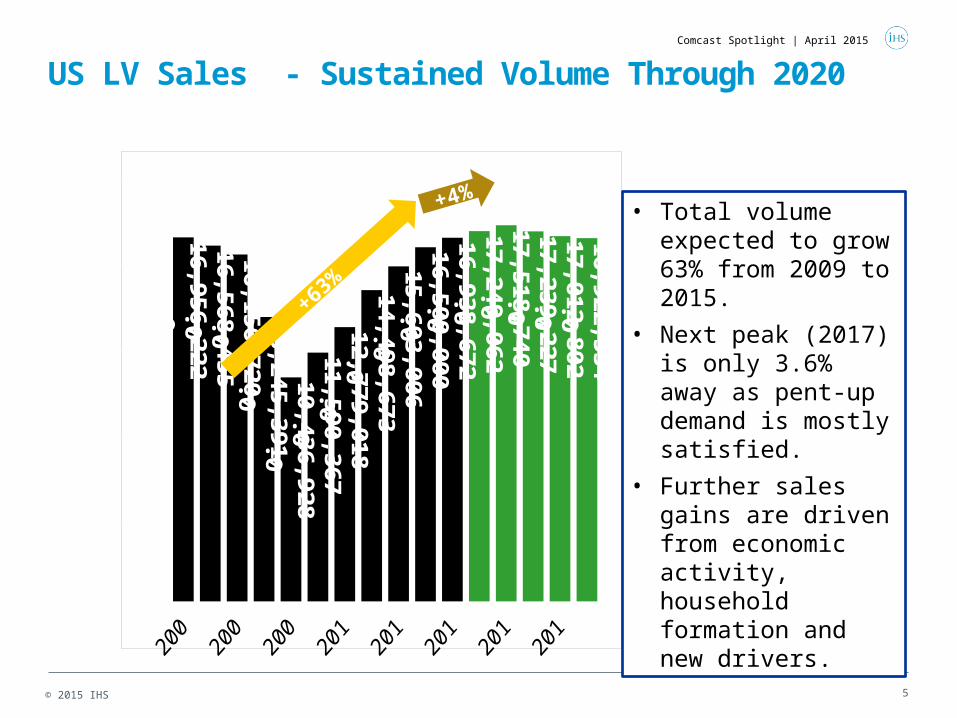
US LV Sales - Sustained Volume Through 2020
0
4,000,000
8,000,000
12,000,000
16,000,000
20,000,000
16,956,222.016,568,455.016,156,720.0
13,245,391.010,436,928.0
11,590,367.012,779,018.0
14,498,673.015,603,006.0
16,500,000.016,938,672.0
17,249,062.017,518,740.017,239,227.017,012,802.016,922,534.0
• Total volume expected to grow 63% from 2009 to 2015.
• Next peak (2017) is only 3.6% away as pent-up demand is mostly satisfied.
• Further sales gains are driven from economic activity, household formation and new drivers.
+4%
+63%
Comcast Spotlight | April 2015
6
Contents
© 2015 IHS
• Economic Backdrop
• Beneath The Surface: Understanding Distinct Markets
• Makes and Segments
• Conquest Marketing
• Major Trends
Comcast Spotlight | April 2015
© 2015 IHS 7
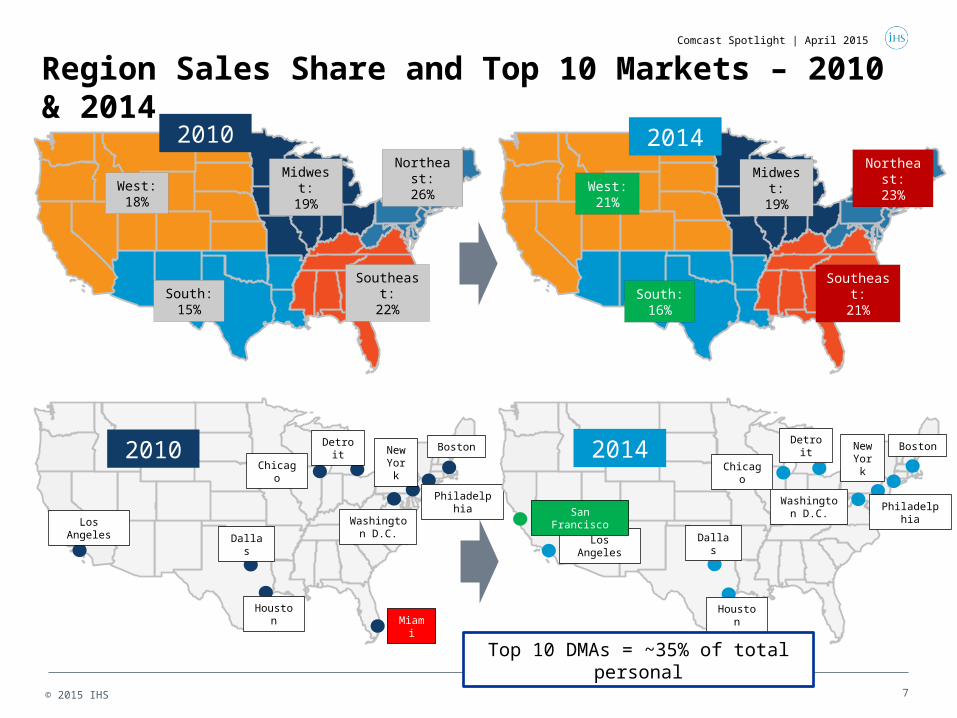
Region Sales Share and Top 10 Markets – 2010 & 2014
2010
Dallas
Houston
Chicago
Detroit
Washington D.C.
Philadelphia
New York
Los Angeles
Miami
Boston 2014
Los Angeles Dallas
Houston
San Francisco
Chicago
Washington D.C. Philadelphia
BostonNew York
Detroit
West:18%
South:15%
Midwest:19%
Southeast:22%
Northeast:26%
2010
West:21%
South:16%
Midwest:19%
Southeast:21%
Northeast:23%
2014
Top 10 DMAs = ~35% of total personal
Comcast Spotlight | April 2015
© 2015 IHS 8
2014
Los Angeles
Dallas
Houston
Chicago
Detroit
Washington D.C.
Philadelphia
BostonNew York
Miami
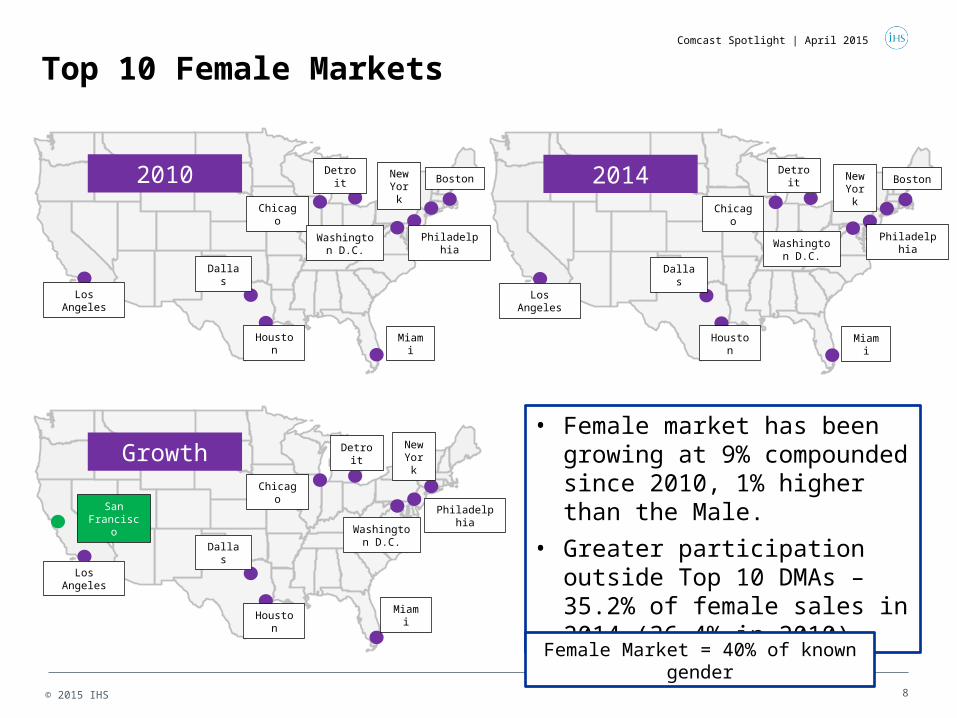
Top 10 Female Markets
2010
Los Angeles
Dallas
Houston
Chicago
Detroit
Washington D.C.
Philadelphia
BostonNew York
Miami
Growth
Los Angeles
Dallas
Houston
Chicago
Detroit
Washington D.C.
Philadelphia
Miami
New York
San Francisco
• Female market has been growing at 9% compounded since 2010, 1% higher than the Male.
• Greater participation outside Top 10 DMAs – 35.2% of female sales in 2014 (36.4% in 2010)
Female Market = 40% of known gender
Comcast Spotlight | April 2015
© 2015 IHS 9
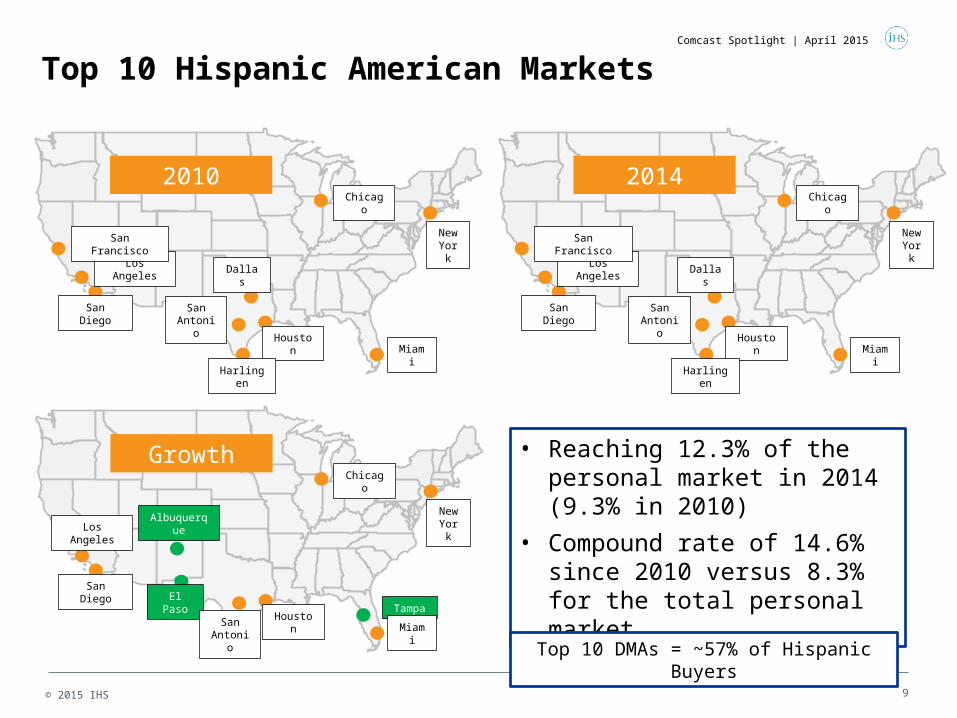
Top 10 Hispanic American Markets
2010
Los AngelesDallas
Houston
Chicago
New York
San Diego
San Francisco
San Antonio
Harlingen
Miami
2014
Los AngelesDallas
Houston
Chicago
New York
San Diego
San Francisco
San Antonio
Harlingen
Miami
Growth
Los Angeles
El Paso
Houston
Chicago
New York
San Diego
Albuquerque
San Antonio
Tampa
Miami
• Reaching 12.3% of the personal market in 2014 (9.3% in 2010)
• Compound rate of 14.6% since 2010 versus 8.3% for the total personal market.
Top 10 DMAs = ~57% of Hispanic Buyers
Comcast Spotlight | April 2015
© 2015 IHS 10
2014
Dallas
Houston
Chicago Detroit
Washington D.C. Philadelphia
New York
Los Angeles
Raleigh
Atlanta
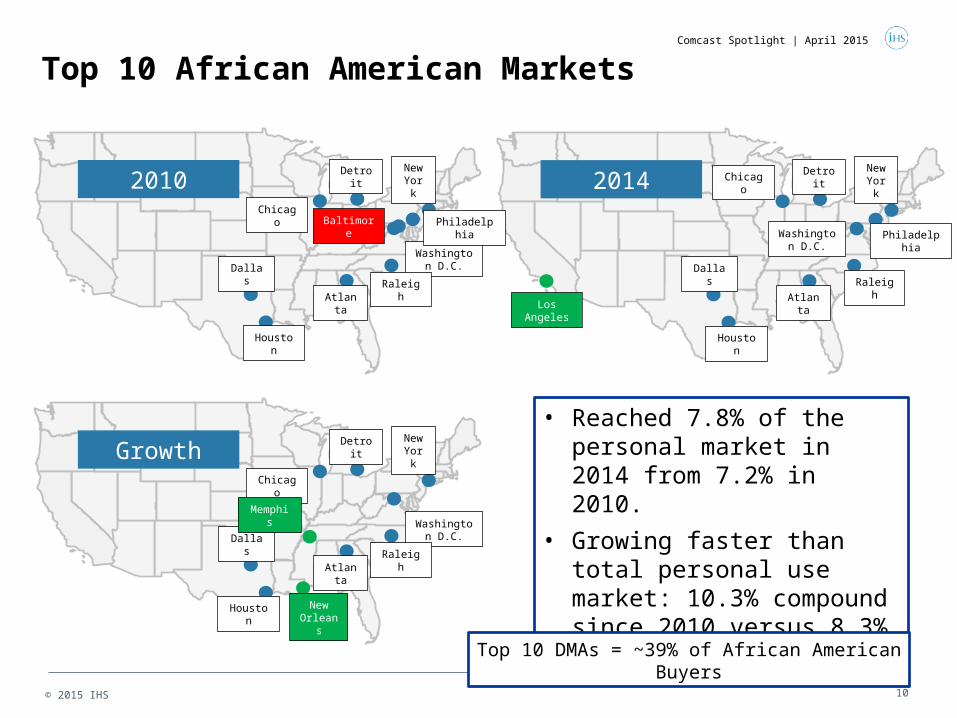
Top 10 African American Markets
2010
Dallas
Houston
Chicago
Detroit
Washington D.C.
Philadelphia
New York
Baltimore
RaleighAtlanta
Growth
Dallas
Houston
Chicago
Detroit
Washington D.C.
Memphis
New York
New Orleans
RaleighAtlanta
• Reached 7.8% of the personal market in 2014 from 7.2% in 2010.
• Growing faster than total personal use market: 10.3% compound since 2010 versus 8.3%
Top 10 DMAs = ~39% of African American Buyers
Comcast Spotlight | April 2015
© 2015 IHS 11
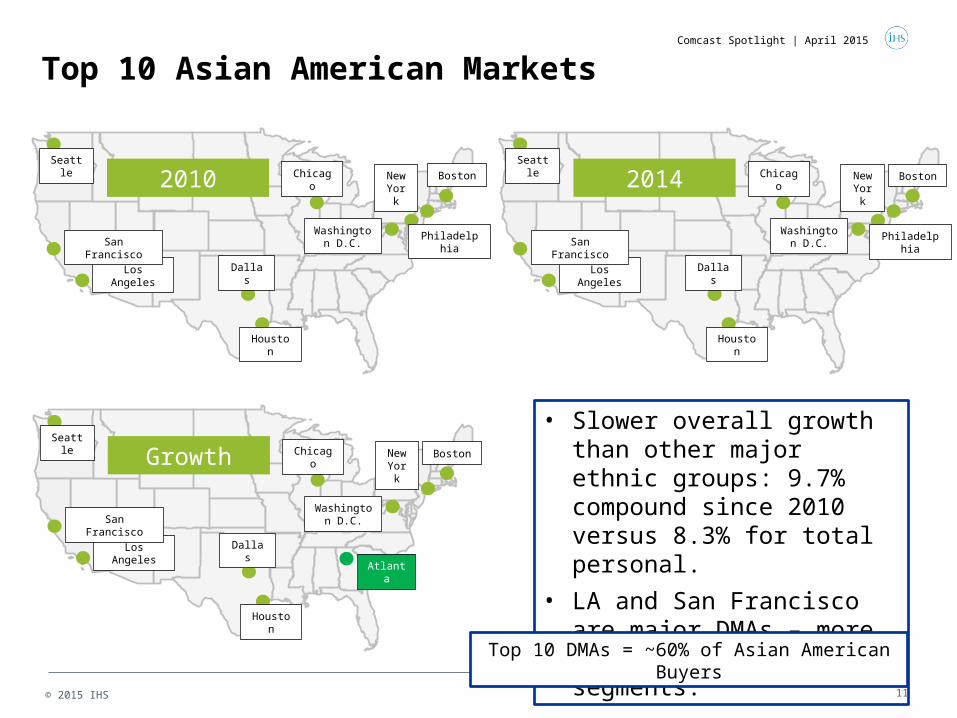
Top 10 Asian American Markets
2010
Los Angeles Dallas
Houston
San Francisco
SeattleChicago
Washington D.C.
New York
2014
Los Angeles Dallas
Houston
San Francisco
SeattleChicago
Washington D.C. Philadelphia
BostonNew York
Philadelphia
Boston
Growth
Los Angeles Dallas
Houston
San Francisco
SeattleChicago
Washington D.C.
Atlanta
BostonNew York
• Slower overall growth than other major ethnic groups: 9.7% compound since 2010 versus 8.3% for total personal.
• LA and San Francisco are major DMAs – more skewed towards luxury segments.
Top 10 DMAs = ~60% of Asian American Buyers
Comcast Spotlight | April 2015
© 2015 IHS 12
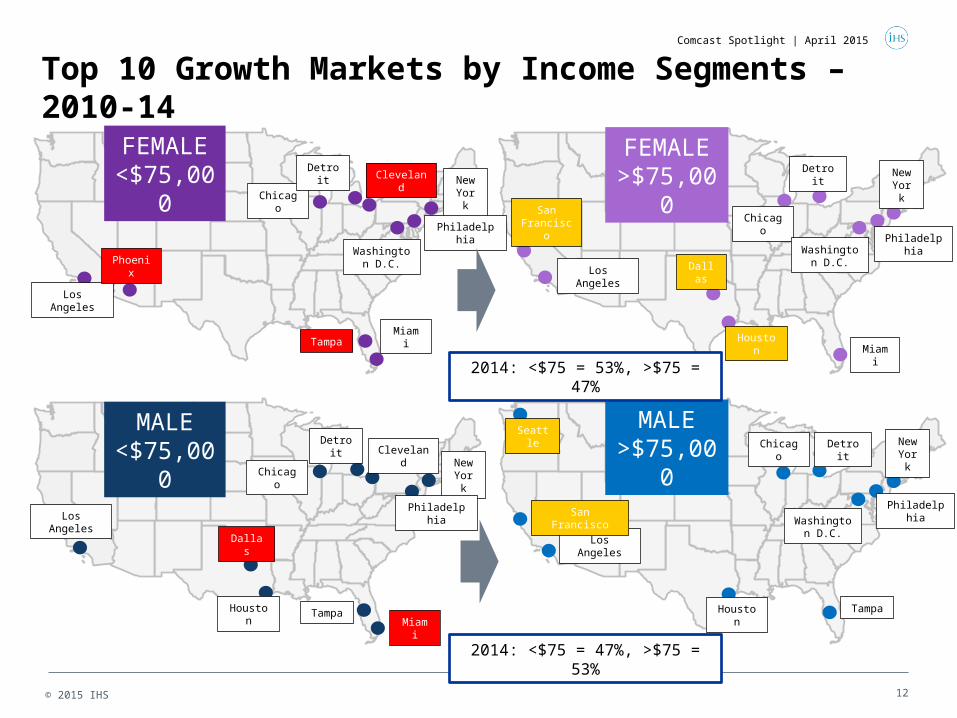
Top 10 Growth Markets by Income Segments – 2010-14
FEMALE<$75,000
FEMALE>$75,000
Los Angeles
Cleveland
Tampa
Chicago
Detroit
Washington D.C.
Philadelphia
Miami
New York
Los Angeles
Detroit
Houston
Chicago
New York
San Francisco
Dallas
Miami
Phoenix
Washington D.C.
Philadelphia
MALE<$75,000
MALE>$75,000
Dallas
Houston
Chicago
Detroit
New York
Los Angeles
Houston
San Francisco
SeattleChicago
Washington D.C.
New York
Los Angeles
Miami
Tampa
Philadelphia
ClevelandDetroit
Tampa
Philadelphia
2014: <$75 = 53%, >$75 = 47%
2014: <$75 = 47%, >$75 = 53%
Comcast Spotlight | April 2015
© 2015 IHS 13
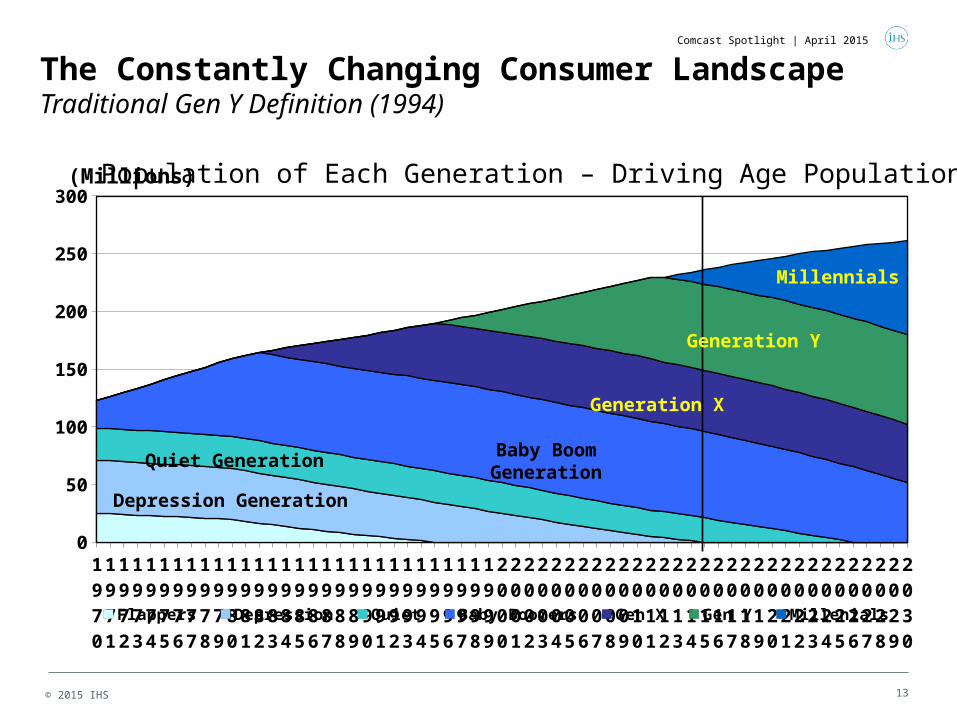
The Constantly Changing Consumer LandscapeTraditional Gen Y Definition (1994)
1970
1971
1972
1973
1974
1975
1976
1977
1978
1979
1980
1981
1982
1983
1984
1985
1986
1987
1988
1989
1990
1991
1992
1993
1994
1995
1996
1997
1998
1999
2000
2001
2002
2003
2004
2005
2006
2007
2008
2009
2010
2011
2012
2013
2014
2015
2016
2017
2018
2019
2020
2021
2022
2023
2024
2025
2026
2027
2028
2029
2030
0
50
100
150
200
250
300
Flappers Depression Quiet Baby Boomers Gen X Gen Y Millenials
(Millions)
Generation Y
Generation X
Baby Boom GenerationQuiet Generation
Depression Generation
Population of Each Generation – Driving Age Population
Millennials
Comcast Spotlight | April 2015
© 2015 IHS 14
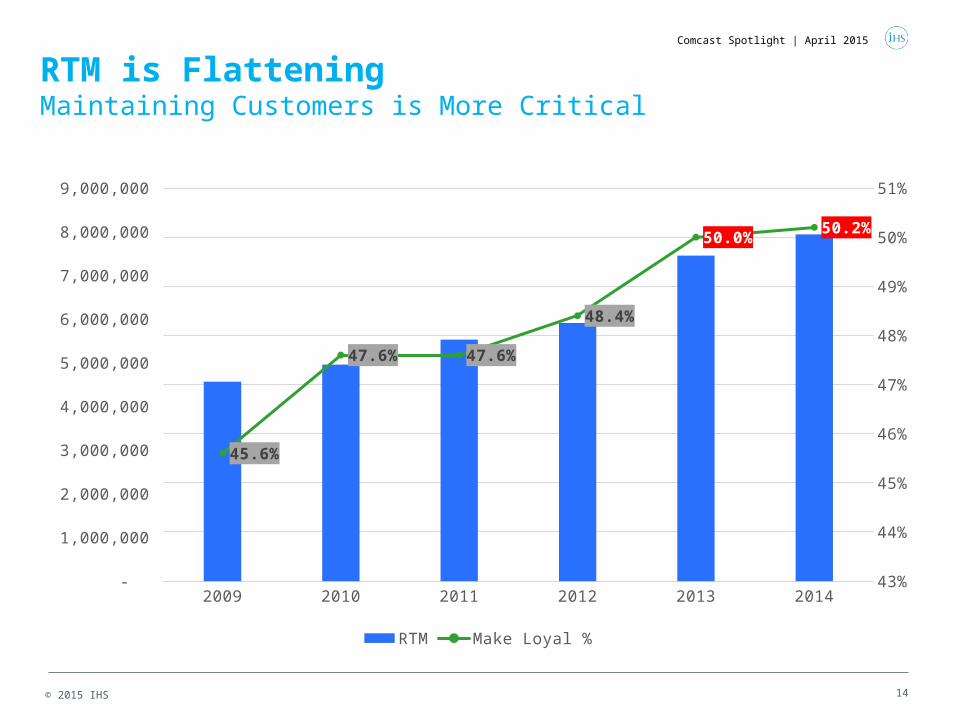
2009 2010 2011 2012 2013 201443%
44%
45%
46%
47%
48%
49%
50%
51%
-
1,000,000
2,000,000
3,000,000
4,000,000
5,000,000
6,000,000
7,000,000
8,000,000
9,000,000
45.6%
47.6% 47.6%
48.4%
50.0%50.2%
RTM Make Loyal %
RTM is FlatteningMaintaining Customers is More Critical
Comcast Spotlight | April 2015
15
Contents
© 2015 IHS
• Economic Backdrop
• Beneath The Surface: Understanding Distinct Markets
• Makes and Segments
• Conquest Marketing
• Major Trends
Comcast Spotlight | April 2015
© 2015 IHS 16
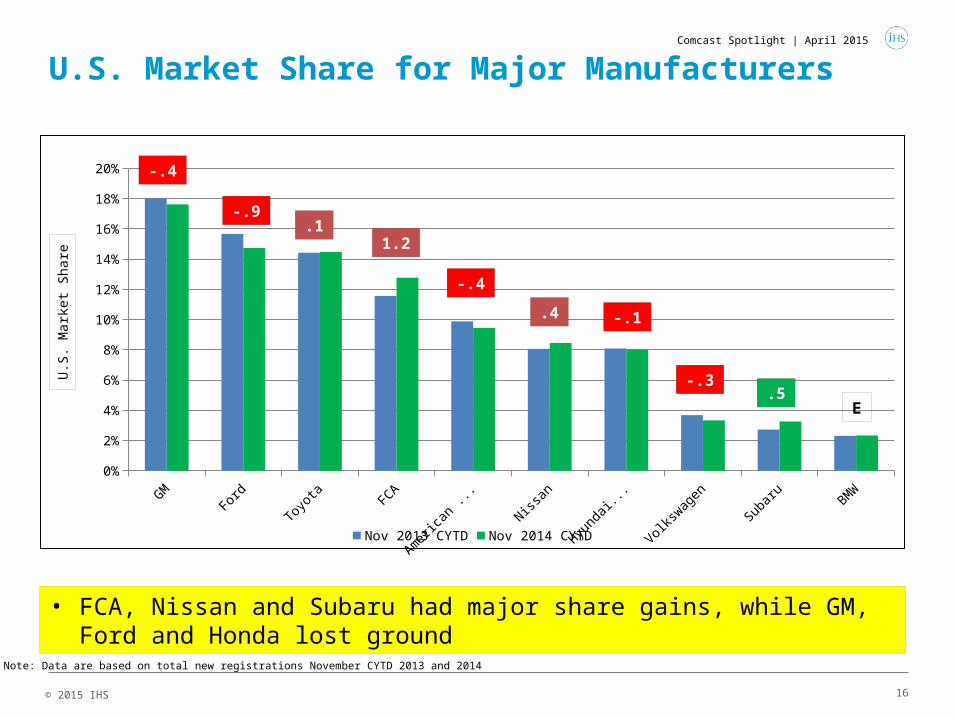
U.S. Market Share for Major Manufacturers
GM Ford Toyota FCA American Honda
Nissan Hyundai/Kia Volkswagen Subaru BMW0%
2%
4%
6%
8%
10%
12%
14%
16%
18%
20%
Nov 2013 CYTD Nov 2014 CYTD
-.4
1.2
-.4
.4 -.1
-.3.5
E
.1-.9
• FCA, Nissan and Subaru had major share gains, while GM, Ford and Honda lost ground
U.S
. Mar
ket S
hare
Note: Data are based on total new registrations November CYTD 2013 and 2014
Comcast Spotlight | April 2015
© 2015 IHS 17
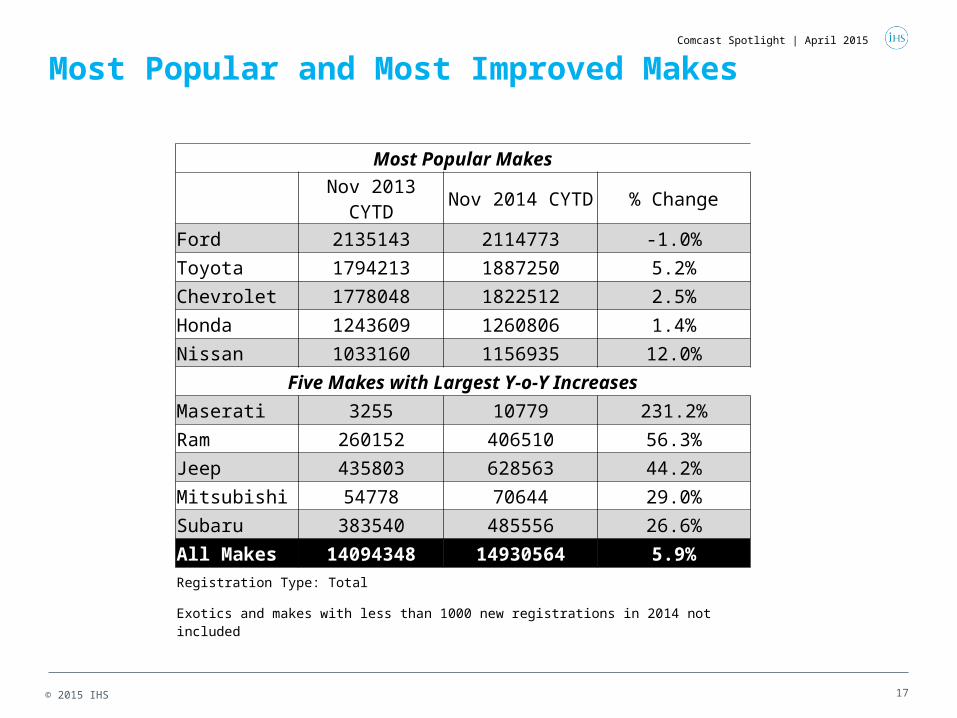
Most Popular and Most Improved Makes
Most Popular Makes
Nov 2013 CYTD Nov 2014 CYTD % Change
Ford 2135143 2114773 -1.0%
Toyota 1794213 1887250 5.2%
Chevrolet 1778048 1822512 2.5%
Honda 1243609 1260806 1.4%
Nissan 1033160 1156935 12.0%
Five Makes with Largest Y-o-Y Increases
Maserati 3255 10779 231.2%
Ram 260152 406510 56.3%
Jeep 435803 628563 44.2%
Mitsubishi 54778 70644 29.0%
Subaru 383540 485556 26.6%
All Makes 14094348 14930564 5.9%
Registration Type: Total
Exotics and makes with less than 1000 new registrations in 2014 not included
Comcast Spotlight | April 2015
© 2015 IHS 18
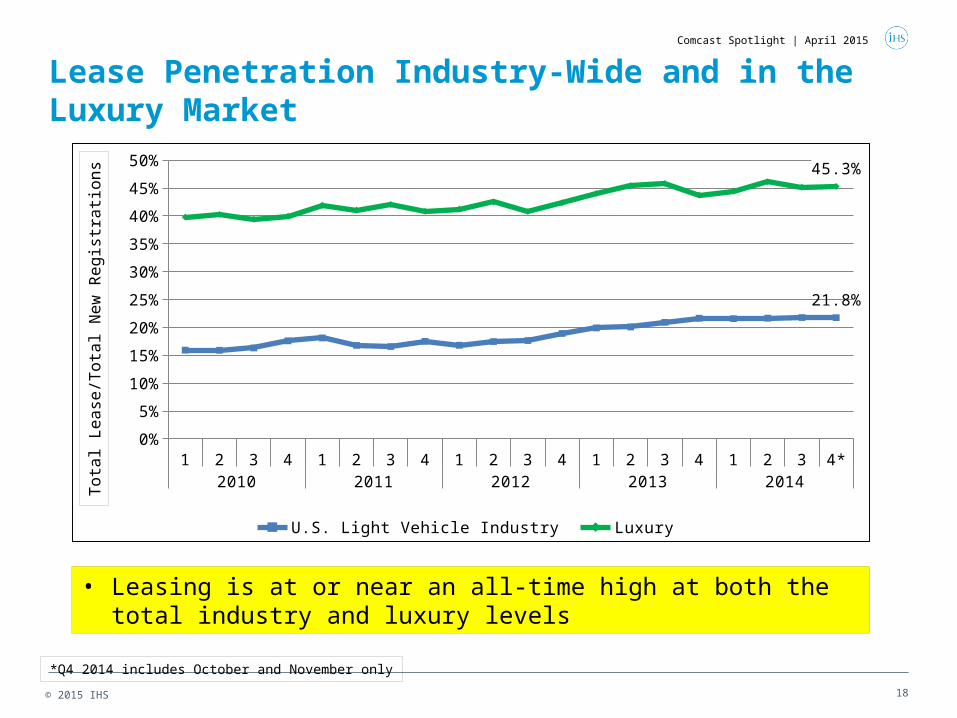
Lease Penetration Industry-Wide and in the Luxury Market
1 2 3 4 1 2 3 4 1 2 3 4 1 2 3 4 1 2 3 4*2010 2011 2012 2013 2014
0%
5%
10%
15%
20%
25%
30%
35%
40%
45%
50%
21.8%
45.3%
U.S. Light Vehicle Industry Luxury
Tota
l Le
ase
/To
tal N
ew
Re
gis
tra
tion
s
*Q4 2014 includes October and November only
• Leasing is at or near an all-time high at both the total industry and luxury levels
Comcast Spotlight | April 2015
© 2015 IHS 19
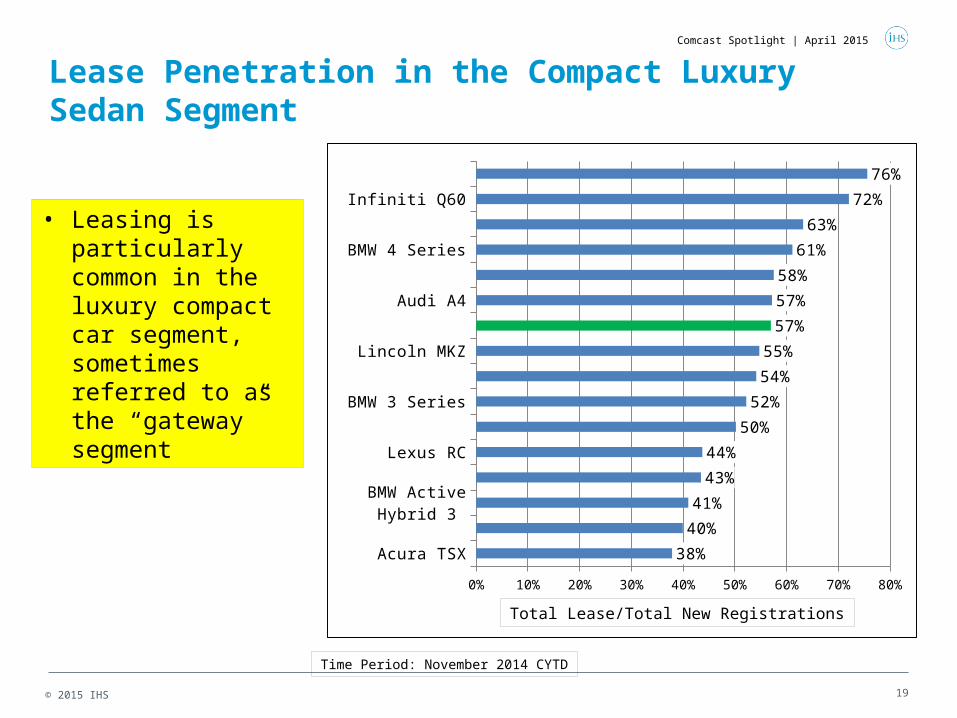
Lease Penetration in the Compact Luxury Sedan Segment
Acura TSX
Volvo S60
BMW Active Hybrid 3
Acura TL/TLX
Lexus RC
Cadillac ATS
BMW 3 Series
Cadillac ELR
Lincoln MKZ
Segment
Audi A4
Mercedes-Benz C Class
BMW 4 Series
Lexus IS
Infiniti Q60
Infiniti G/Q40/Q50
0% 10% 20% 30% 40% 50% 60% 70% 80%
38%
40%
41%
43%
44%
50%
52%
54%
55%
57%
57%
58%
61%
63%
72%
76%
• Leasing is particularly common in the luxury compact car segment, sometimes referred to as the “gateway” segment
Time Period: November 2014 CYTD
Total Lease/Total New Registrations
Comcast Spotlight | April 2015
© 2015 IHS 20
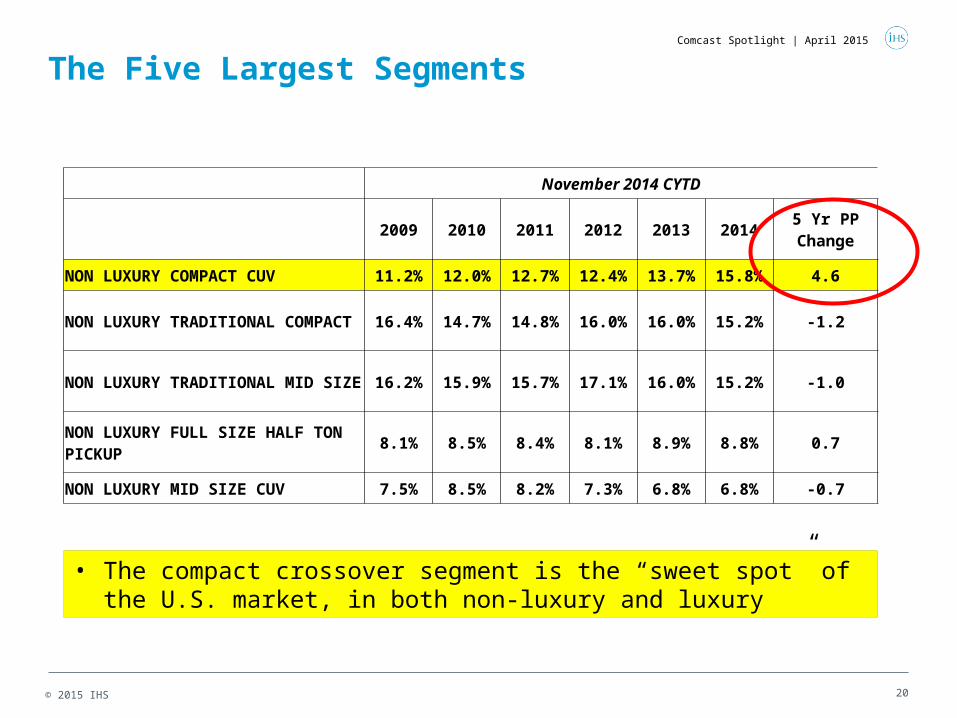
The Five Largest Segments
November 2014 CYTD
2009 2010 2011 2012 2013 20145 Yr PP Change
NON LUXURY COMPACT CUV 11.2% 12.0% 12.7% 12.4% 13.7% 15.8% 4.6
NON LUXURY TRADITIONAL COMPACT
16.4% 14.7% 14.8% 16.0% 16.0% 15.2% -1.2
NON LUXURY TRADITIONAL MID SIZE 16.2% 15.9% 15.7% 17.1% 16.0% 15.2% -1.0
NON LUXURY FULL SIZE HALF TON PICKUP
8.1% 8.5% 8.4% 8.1% 8.9% 8.8% 0.7
NON LUXURY MID SIZE CUV 7.5% 8.5% 8.2% 7.3% 6.8% 6.8% -0.7
• The compact crossover segment is the “sweet spot” of the U.S. market, in both non-luxury and luxury
Comcast Spotlight | April 2015
© 2015 IHS 21
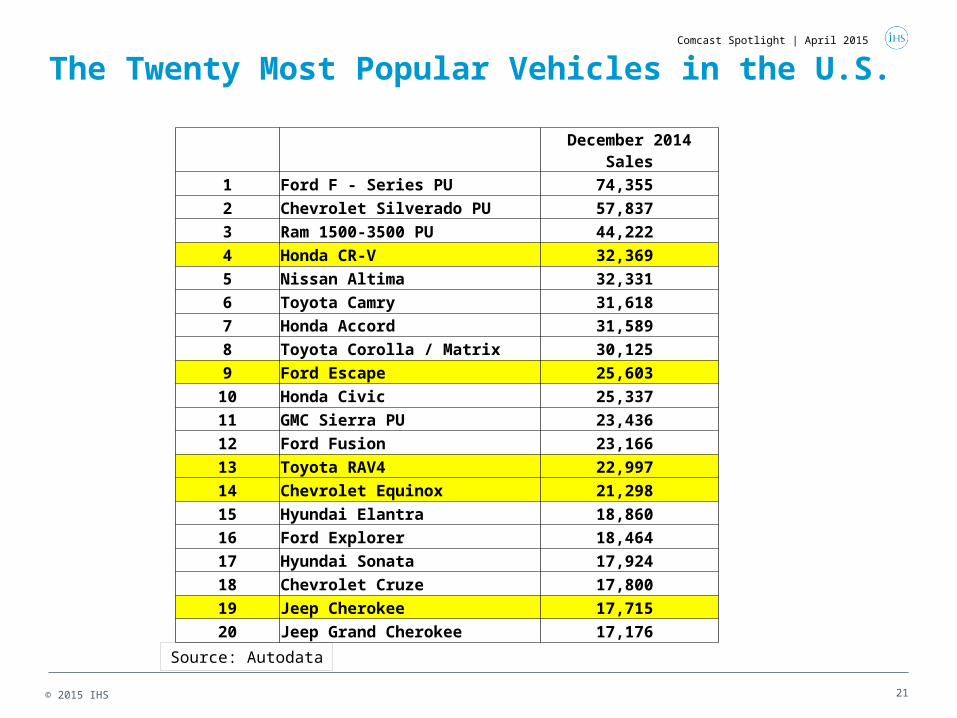
The Twenty Most Popular Vehicles in the U.S.
December 2014 Sales
1 Ford F - Series PU 74,355
2 Chevrolet Silverado PU 57,837
3 Ram 1500-3500 PU 44,222
4 Honda CR-V 32,369
5 Nissan Altima 32,331
6 Toyota Camry 31,618
7 Honda Accord 31,589
8 Toyota Corolla / Matrix 30,125
9 Ford Escape 25,603
10 Honda Civic 25,337
11 GMC Sierra PU 23,436
12 Ford Fusion 23,166
13 Toyota RAV4 22,997
14 Chevrolet Equinox 21,298
15 Hyundai Elantra 18,860
16 Ford Explorer 18,464
17 Hyundai Sonata 17,924
18 Chevrolet Cruze 17,800
19 Jeep Cherokee 17,715
20 Jeep Grand Cherokee 17,176
Source: Autodata
Comcast Spotlight | April 2015
© 2015 IHS 22
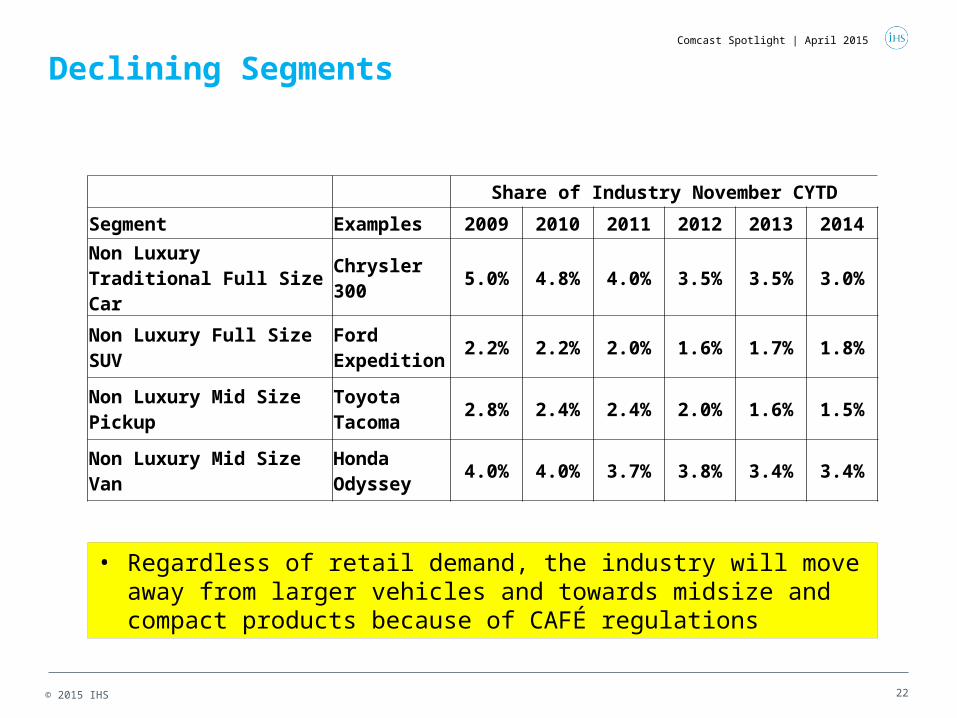
Declining Segments
Share of Industry November CYTD
Segment Examples 2009 2010 2011 2012 2013 2014
Non Luxury Traditional Full Size Car
Chrysler 300 5.0% 4.8% 4.0% 3.5% 3.5% 3.0%
Non Luxury Full Size SUVFord Expedition
2.2% 2.2% 2.0% 1.6% 1.7% 1.8%
Non Luxury Mid Size Pickup
Toyota Tacoma
2.8% 2.4% 2.4% 2.0% 1.6% 1.5%
Non Luxury Mid Size Van Honda Odyssey
4.0% 4.0% 3.7% 3.8% 3.4% 3.4%
• Regardless of retail demand, the industry will move away from larger vehicles and towards midsize and compact products because of CAFÉ regulations
Comcast Spotlight | April 2015
© 2015 IHS 23
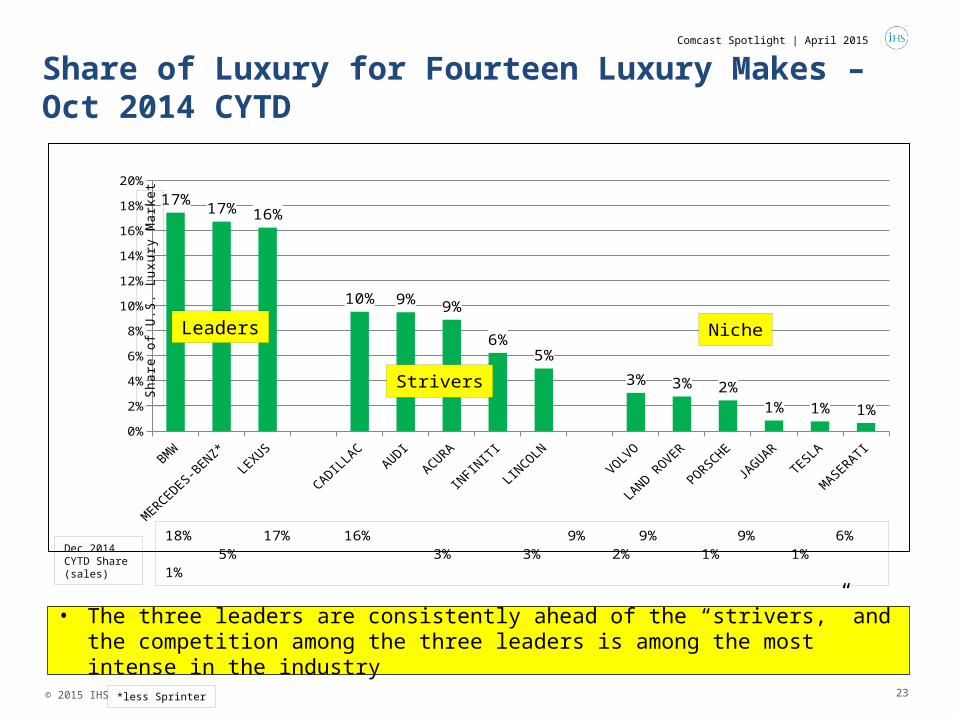
Share of Luxury for Fourteen Luxury Makes – Oct 2014 CYTD
• The three leaders are consistently ahead of the “strivers,” and the competition among the three leaders is among the most intense in the industry
BMW
MERCED
ES-BEN
Z*LEX
US
CADILLAC
AUDI
ACURA
INFINITI
LINCOLN
VOLVO
LAND ROVER
PORSCHE
JAGUAR
TESLA
MASERATI
0%
2%
4%
6%
8%
10%
12%
14%
16%
18%
20%
17% 17% 16%
10% 9% 9%
6%5%
3% 3% 2%1% 1% 1%
Sha
re o
f U
.S.
Luxu
ry M
arke
t
18% 17% 16% 9% 9% 9% 6% 5% 3% 3% 2% 1% 1% 1%
Strivers
Niche
Dec 2014 CYTD Share (sales)
*less Sprinter
Leaders
Comcast Spotlight | April 2015
© 2015 IHS 24
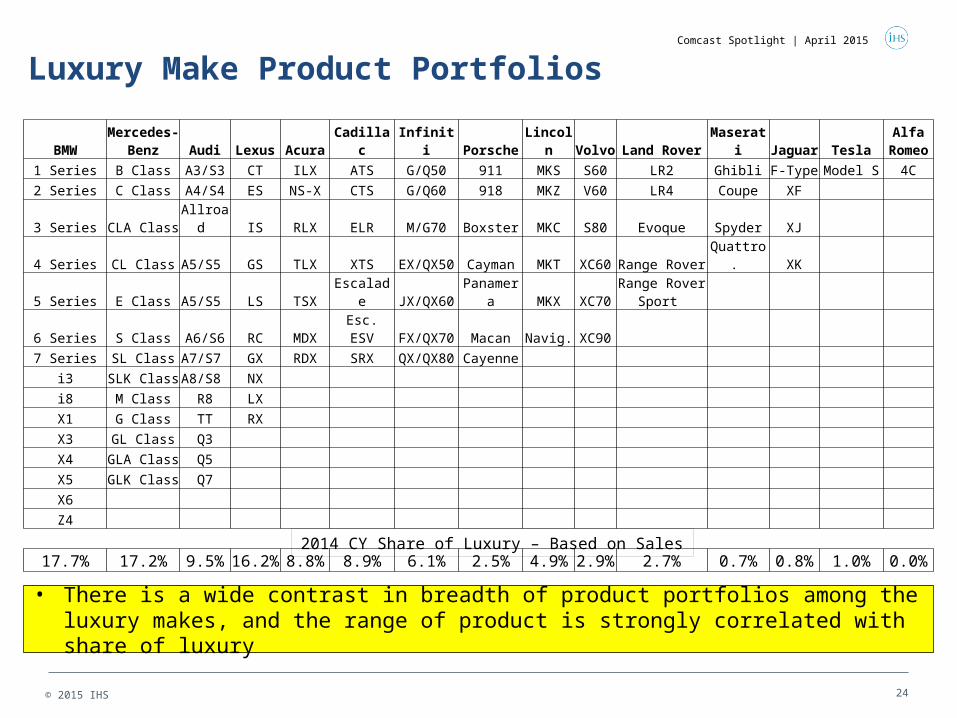
Luxury Make Product Portfolios
• There is a wide contrast in breadth of product portfolios among the luxury makes, and the range of product is strongly correlated with share of luxury
BMWMercedes-
Benz Audi Lexus Acura Cadillac Infiniti Porsche Lincoln Volvo Land Rover Maserati Jaguar TeslaAlfa
Romeo
1 Series B Class A3/S3 CT ILX ATS G/Q50 911 MKS S60 LR2 Ghibli F-Type Model S 4C
2 Series C Class A4/S4 ES NS-X CTS G/Q60 918 MKZ V60 LR4 Coupe XF
3 Series CLA Class Allroad IS RLX ELR M/G70 Boxster MKC S80 Evoque Spyder XJ
4 Series CL Class A5/S5 GS TLX XTS EX/QX50 Cayman MKT XC60 Range Rover Quattro. XK
5 Series E Class A5/S5 LS TSX Escalade JX/QX60 Panamera MKX XC70Range Rover
Sport
6 Series S Class A6/S6 RC MDX Esc. ESV FX/QX70 Macan Navig. XC90
7 Series SL Class A7/S7 GX RDX SRX QX/QX80 Cayenne
i3 SLK Class A8/S8 NX
i8 M Class R8 LX
X1 G Class TT RX
X3 GL Class Q3
X4 GLA Class Q5
X5 GLK Class Q7
X6
Z4
17.7% 17.2% 9.5% 16.2% 8.8% 8.9% 6.1% 2.5% 4.9% 2.9% 2.7% 0.7% 0.8% 1.0% 0.0%
2014 CY Share of Luxury – Based on Sales
Comcast Spotlight | April 2015
25
Contents
© 2015 IHS
• Economic Backdrop
• Beneath The Surface: Understanding Distinct Markets
• Makes and Segments
• Conquest Marketing
• Major Trends
Comcast Spotlight | April 2015
© 2015 IHS 26
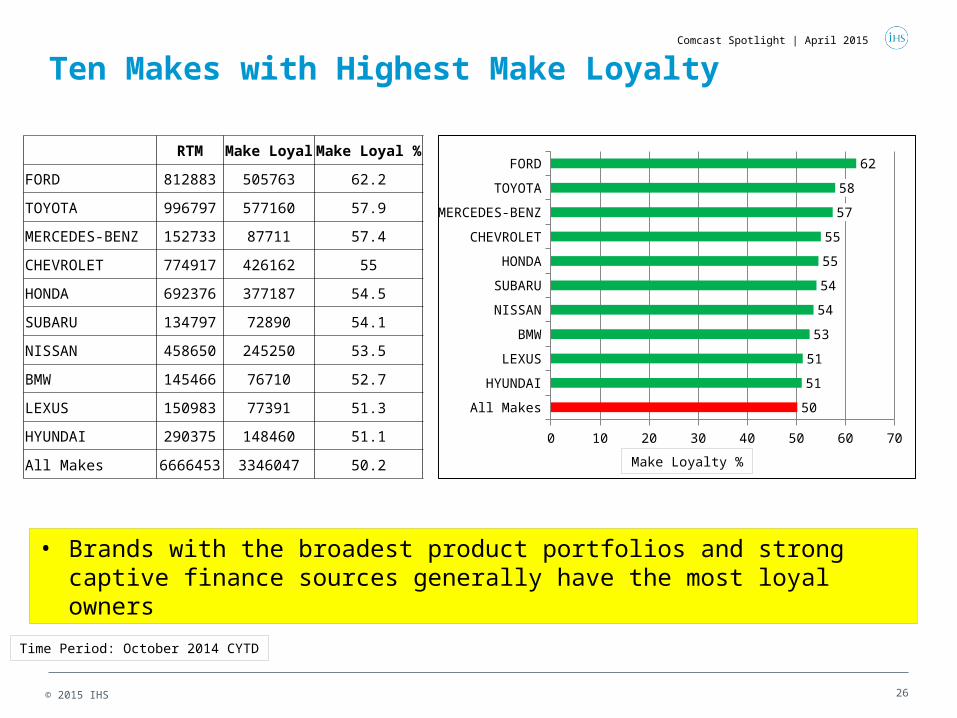
Ten Makes with Highest Make Loyalty
All Makes
HYUNDAI
LEXUS
BMW
NISSAN
SUBARU
HONDA
CHEVROLET
MERCEDES-BENZ
TOYOTA
FORD
0 10 20 30 40 50 60 70
50
51
51
53
54
54
55
55
57
58
62 RTM Make Loyal Make Loyal %
FORD 812883 505763 62.2
TOYOTA 996797 577160 57.9
MERCEDES-BENZ 152733 87711 57.4
CHEVROLET 774917 426162 55
HONDA 692376 377187 54.5
SUBARU 134797 72890 54.1
NISSAN 458650 245250 53.5
BMW 145466 76710 52.7
LEXUS 150983 77391 51.3
HYUNDAI 290375 148460 51.1
All Makes 6666453 3346047 50.2
• Brands with the broadest product portfolios and strong captive finance sources generally have the most loyal owners
Time Period: October 2014 CYTD
Make Loyalty %
Comcast Spotlight | April 2015
© 2015 IHS 27
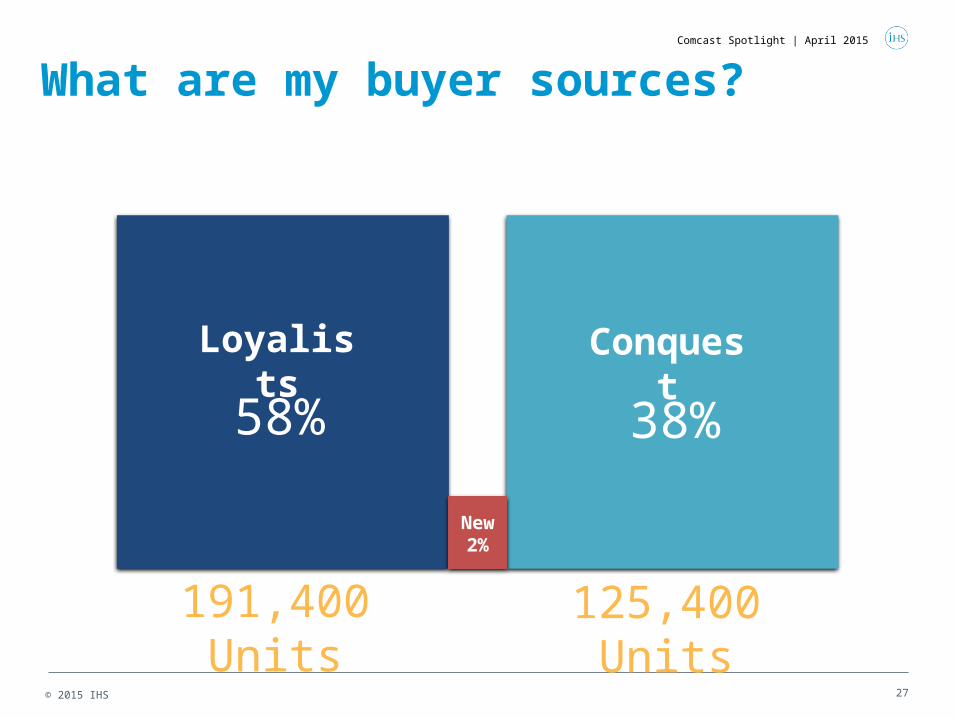
What are my buyer sources?
Loyalists Conquest
58% 38%
191,400 Units 125,400 Units
New2%
Comcast Spotlight | April 2015
© 2015 IHS 28
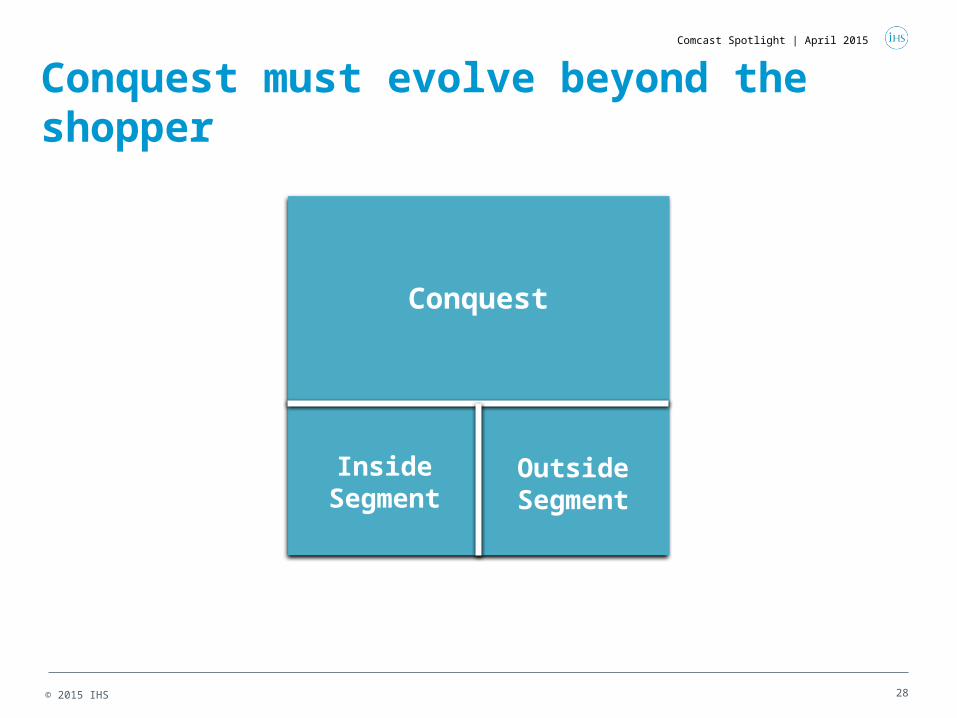
Conquest
Inside Segment
Outside Segment
Conquest must evolve beyond the shopper
Comcast Spotlight | April 2015
© 2015 IHS 29
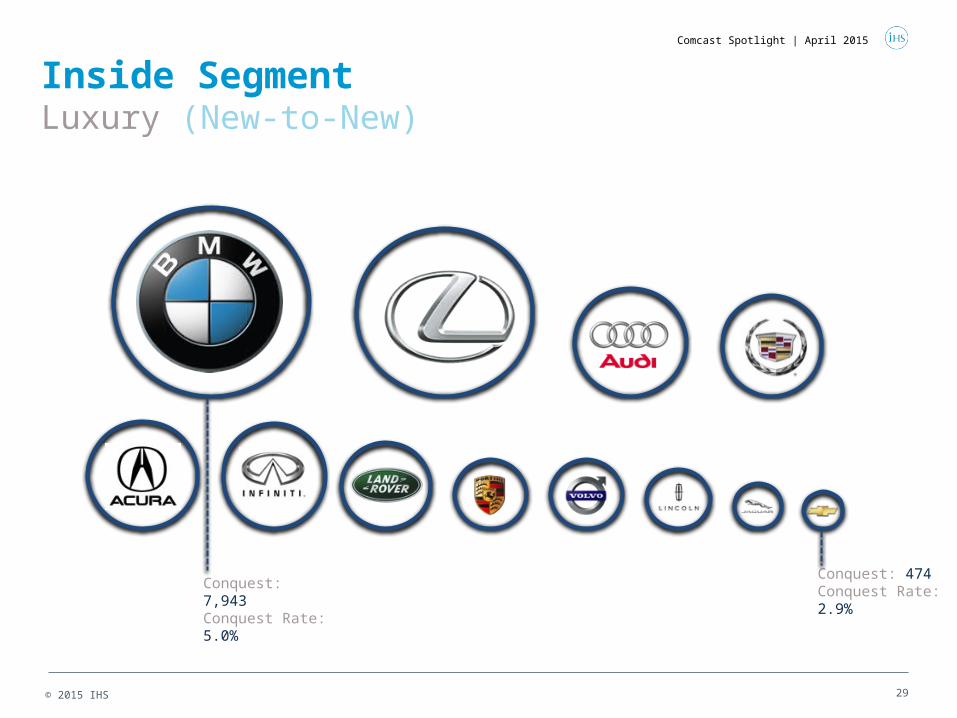
Inside SegmentLuxury (New-to-New)
Conquest: 7,943Conquest Rate: 5.0%
Conquest: 474Conquest Rate: 2.9%
Comcast Spotlight | April 2015
© 2015 IHS 30
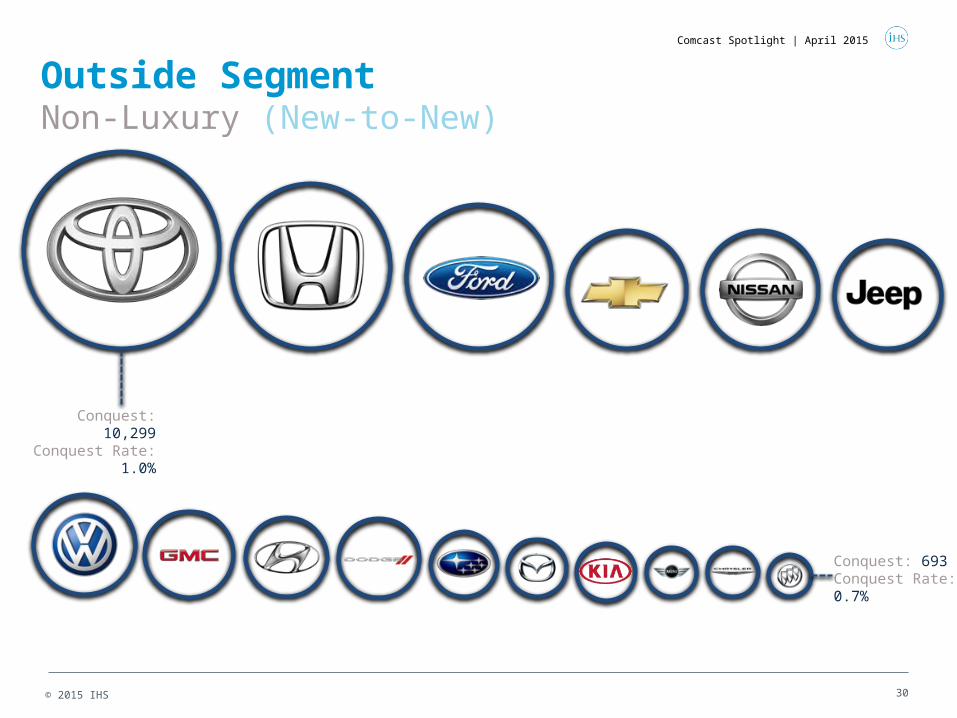
Outside SegmentNon-Luxury (New-to-New)
Conquest: 10,299Conquest Rate:
1.0%
Conquest: 693Conquest Rate: 0.7%
Comcast Spotlight | April 2015
© 2015 IHS 31
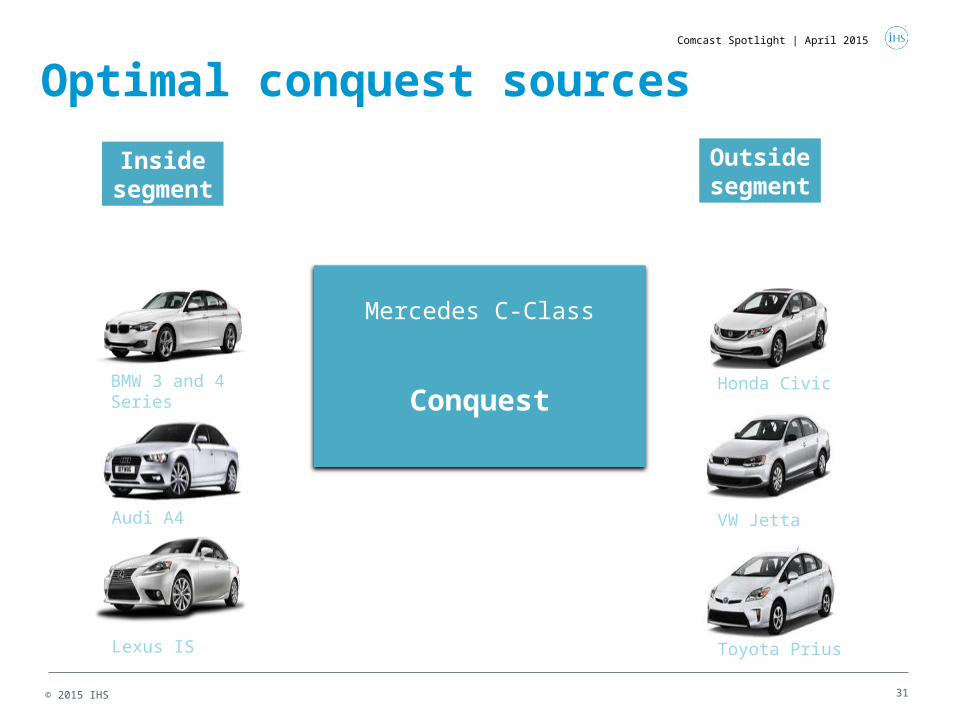
Optimal conquest sources
Conquest
Outside segment
Mercedes C-Class
VW Jetta
Toyota Prius
BMW 3 and 4 Series
Audi A4
Lexus IS
Honda Civic
Inside segment
Comcast Spotlight | April 2015
32
Contents
© 2015 IHS
• Economic Backdrop
• Beneath The Surface: Understanding Distinct Markets
• Makes and Segments
• Conquest Marketing
• Major Trends
Comcast Spotlight | April 2015
© 2015 IHS 33
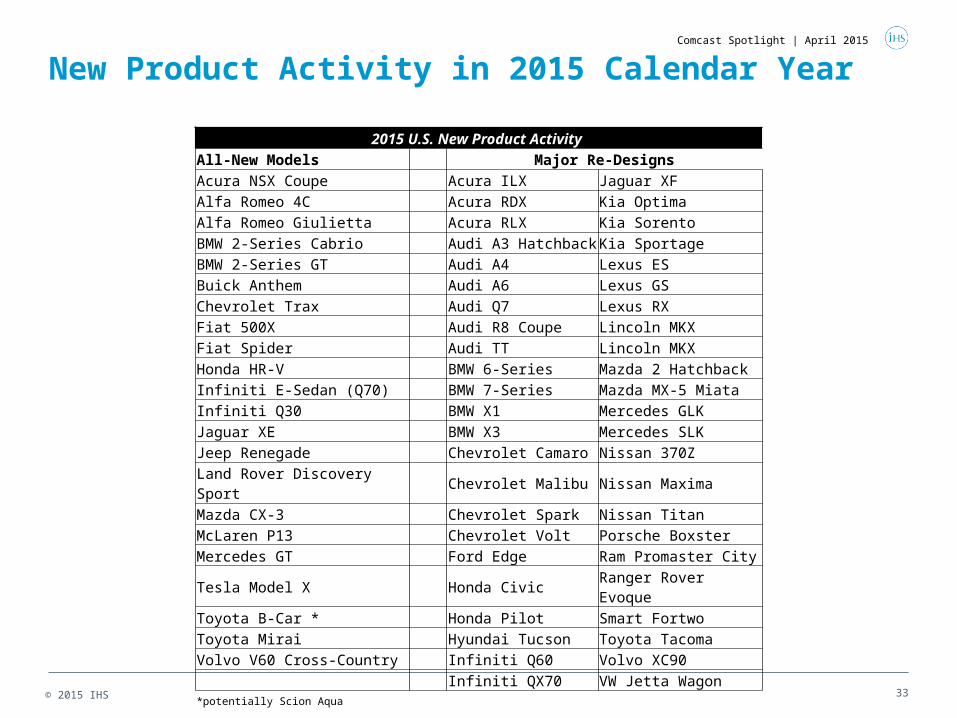
New Product Activity in 2015 Calendar Year
2015 U.S. New Product Activity All-New Models Major Re-DesignsAcura NSX Coupe Acura ILX Jaguar XFAlfa Romeo 4C Acura RDX Kia OptimaAlfa Romeo Giulietta Acura RLX Kia SorentoBMW 2-Series Cabrio Audi A3 Hatchback Kia SportageBMW 2-Series GT Audi A4 Lexus ESBuick Anthem Audi A6 Lexus GSChevrolet Trax Audi Q7 Lexus RXFiat 500X Audi R8 Coupe Lincoln MKXFiat Spider Audi TT Lincoln MKXHonda HR-V BMW 6-Series Mazda 2 HatchbackInfiniti E-Sedan (Q70) BMW 7-Series Mazda MX-5 MiataInfiniti Q30 BMW X1 Mercedes GLKJaguar XE BMW X3 Mercedes SLKJeep Renegade Chevrolet Camaro Nissan 370ZLand Rover Discovery Sport Chevrolet Malibu Nissan MaximaMazda CX-3 Chevrolet Spark Nissan TitanMcLaren P13 Chevrolet Volt Porsche BoxsterMercedes GT Ford Edge Ram Promaster CityTesla Model X Honda Civic Ranger Rover EvoqueToyota B-Car * Honda Pilot Smart FortwoToyota Mirai Hyundai Tucson Toyota TacomaVolvo V60 Cross-Country Infiniti Q60 Volvo XC90 Infiniti QX70 VW Jetta Wagon*potentially Scion Aqua
Comcast Spotlight | April 2015
© 2015 IHS 34
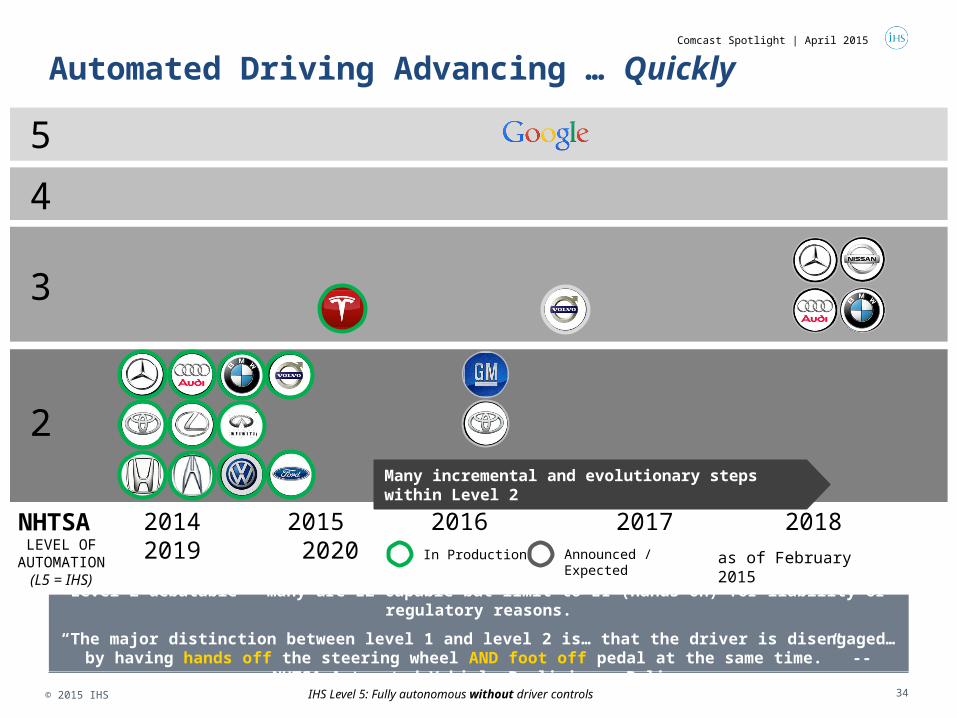
Automated Driving Advancing … Quickly
2
3
4
In Production Announced / Expected
Many incremental and evolutionary steps within Level 2
Level 2 debatable – many are L2-capable but limit to L1 (hands on) for liability or regulatory reasons.
“The major distinction between level 1 and level 2 is… that the driver is disengaged… by having hands off the steering wheel AND foot off pedal at the same time.” -- NHTSA Automated Vehicle Preliminary Policy
5
IHS Level 5: Fully autonomous without driver controls
NHTSA LEVEL OF
AUTOMATION(L5 = IHS)
2014 2015 2016 2017 2018 2019 2020 as of February 2015
Comcast Spotlight | April 2015
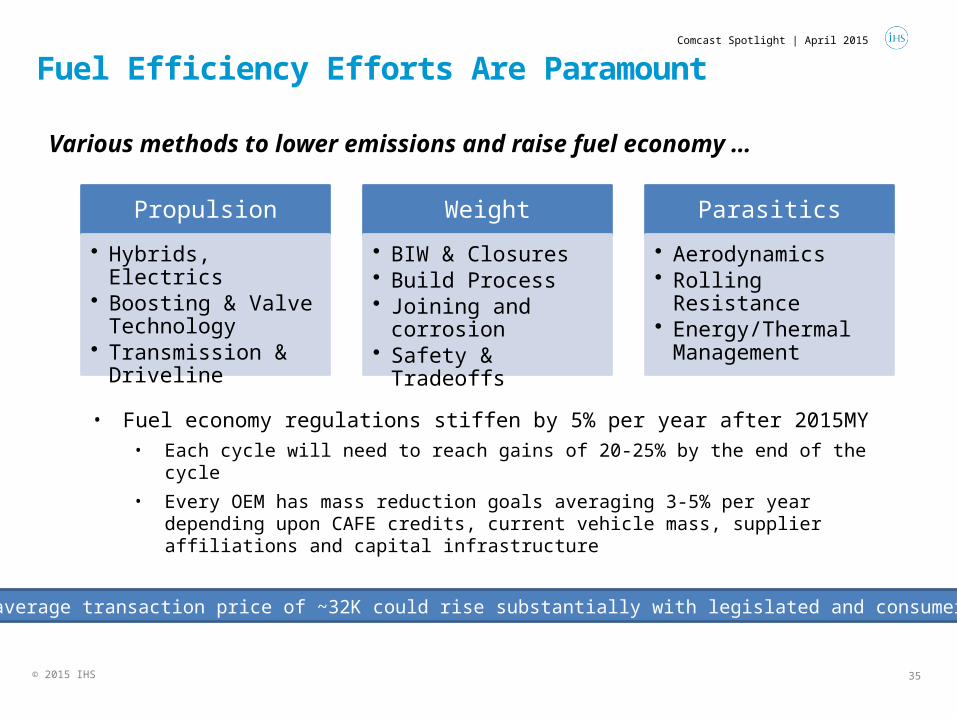
Fuel Efficiency Efforts Are Paramount
• Fuel economy regulations stiffen by 5% per year after 2015MY• Each cycle will need to reach gains of 20-25% by the end of the cycle
• Every OEM has mass reduction goals averaging 3-5% per year depending upon CAFE credits, current vehicle mass, supplier affiliations and capital infrastructure
Propulsion
• Hybrids, Electrics• Boosting & Valve
Technology• Transmission &
Driveline
Weight
• BIW & Closures• Build Process• Joining and corrosion• Safety & Tradeoffs
Parasitics
• Aerodynamics• Rolling Resistance• Energy/Thermal
Management
© 2015 IHS
Various methods to lower emissions and raise fuel economy …
Today’s average transaction price of ~32K could rise substantially with legislated and consumer content
Comcast Spotlight | April 2015
35
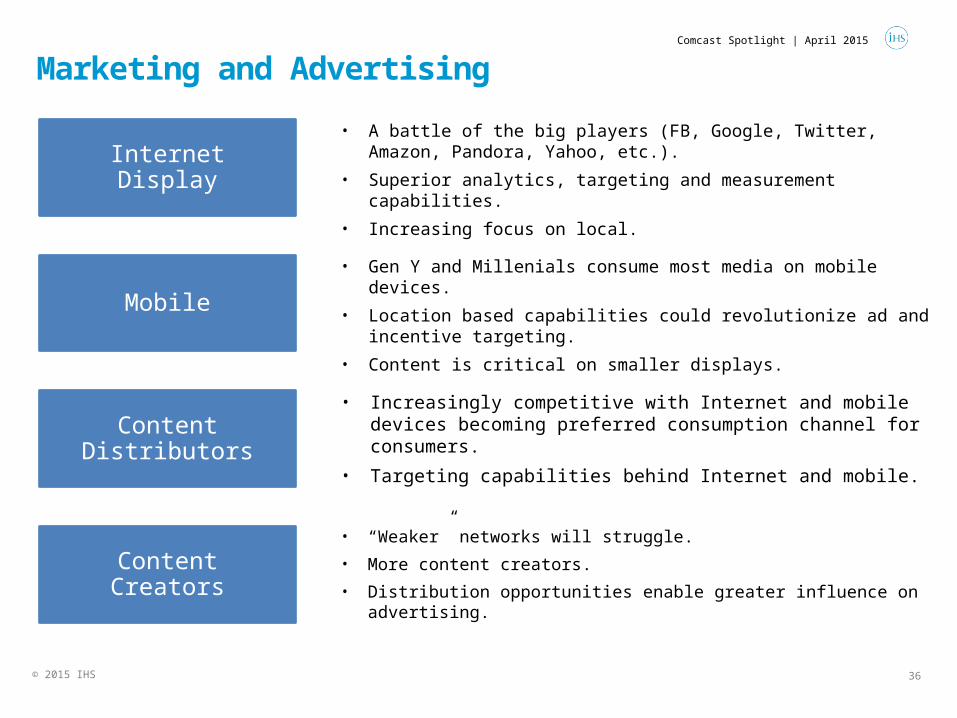
Marketing and Advertising
© 2015 IHS
Comcast Spotlight | April 2015
Internet Display
Mobile
Content Distributors
Content Creators
• A battle of the big players (FB, Google, Twitter, Amazon, Pandora, Yahoo, etc.).
• Superior analytics, targeting and measurement capabilities.
• Increasing focus on local.
• Gen Y and Millenials consume most media on mobile devices.
• Location based capabilities could revolutionize ad and incentive targeting.
• Content is critical on smaller displays.
• Increasingly competitive with Internet and mobile devices becoming preferred consumption channel for consumers.
• Targeting capabilities behind Internet and mobile.
• “Weaker” networks will struggle.
• More content creators.
• Distribution opportunities enable greater influence on advertising.
36
IHS Customer Care:• Americas: +1 800 IHS CARE (+1 800 447 2273); [email protected] • Europe, Middle East, and Africa: +44 (0) 1344 328 300; [email protected] • Asia and the Pacific Rim: +604 291 3600; [email protected]
© 2015 IHS. No portion of this report may be reproduced, reused, or otherwise distributed in any form without prior written consent, with the exception of any internal client distribution as may be permitted in the license agreement between client and IHS. Content reproduced or redistributed with IHS permission must display IHS legal notices and attributions of authorship. The information contained herein is from sources considered reliable but its accuracy and completeness are not warranted, nor are the opinions and analyses which are based upon it, and to the extent permitted by law, IHS shall not be liable for any errors or omissions or any loss, damage or expense incurred by reliance on information or any statement contained herein. For more information, please contact IHS at Customer Care (see phone numbers and email addresses above). All products, company names or other marks appearing in this publication are the trademarks and property of IHS or their respective owners.
Thank You
John McBrideVice President, IHS Automotive, Americas [email protected]