© 2011 pearson education, inc. chapter 19 atmospheric pollution
TRANSCRIPT

© 2011 Pearson Education, Inc.
CHAPTER 19
Atmospheric Pollution

© 2011 Pearson Education, Inc.
An introduction to air pollution: Donora Smog• On October 26, 1948, people in Donora,
Pennsylvania woke up to a dense fog that lasted 5 days• The town has a large steel mill that used high-sulfur
coal and a plant that roasted sulfur-containing ores
• People complained of difficulty breathing, stomach pain, headaches, nausea, and choking• Within 1 month, 70 people died and 6,000 got sick• Mill owners did not think their mills were responsible
• State and national laws now control air pollution• Culminating in the Clean Air Act (1970)

© 2011 Pearson Education, Inc.
Donora, Pennsylvania

© 2011 Pearson Education, Inc.
Air pollution essentials
• The atmosphere contains many gases• N2, O2, Ar, CO2, water vapor
• 40 trace gases: ozone, helium, hydrogen, nitrogen oxides
• Aerosols: microscopic liquid or solid particles (dust, pollen, sea salts, etc.) from land and water
• The Industrial Revolution changed the mixture of atmospheric gases and particles
• Air pollutants: substances in the atmosphere (gases and aerosols) that have harmful effects

© 2011 Pearson Education, Inc.
Pollutants• Three factors determine the level of air pollution• The amount of pollutants entering the air• The amount of space into which the pollution is added• Mechanisms that remove pollutants from the air
• Troposphere: the lower atmosphere• The site and source of weather, water vapor, clouds• Pollutants are removed within hours or days
• Pollutants in the upper troposphere can persist for days• Pollutants in the stratosphere are resistant to cleansing• Ozone-depleting chemicals (chlorine, bromine)

© 2011 Pearson Education, Inc.
Layers of the atmosphere

© 2011 Pearson Education, Inc.
Atmospheric cleansing
• Natural air pollutants: volcanoes, fires, dust storms• Plants emit volatile organic compounds• Mechanisms in the biosphere remove, assimilate, and
recycle natural pollutants• Hydroxyl radical (OH): a naturally occurring
compound• Oxidizes many gaseous pollutants to harmless
products brought to land or water by precipitation• Sea salts: a cleansing agent that helps form
raindrops• Picked up by wind flowing over oceans
• Sunlight: breaks down organic molecules

© 2011 Pearson Education, Inc.
Hydroxyl radicals
• They also remove anthropogenic pollutants from the air• Highly reactive hydrocarbons are rapidly oxidized• Nitrogen oxides are oxidized within a day• Less reactive substances (e.g., CO) take months
• Atmospheric levels of hydroxyl are determined by levels of anthropogenic air pollutants• Hydroxyl’s cleansing power is used up• Pollutants are able to build up
• Photochemical breakdown of ozone is a major source of hydroxyl radical

© 2011 Pearson Education, Inc.
The hydroxyl radical

© 2011 Pearson Education, Inc.
Smogs and brown clouds
• Industrial smog: smoke + fog• An irritating, grayish mix of soot, sulfur compounds,
and water vapor• In industrialized, cool areas that use coal• China, India, Korea, eastern European countries
• Photochemical smog: in cities with huge freeway systems• A brownish, irritating haze in warm, sunny areas• Arises during the morning traffic• Pollutants from vehicle exhaust are acted on by
sunlight• Nitrogen oxides, volatile organic compounds

© 2011 Pearson Education, Inc.
Industrial and photochemical smog

© 2011 Pearson Education, Inc.
Los Angeles air

© 2011 Pearson Education, Inc.
Inversions
• Weather conditions can intensify smog• Daytime air temperature is usually highest near the
ground• Warm air rises and carries air pollution up and away
• Temperature inversion: sometimes, warm air overlays cooler air• Often occurs at night and is usually short-lived• Sun heats the air and pollutants are carried away• Cloudy weather prevents heating air so pollutants
stay• Mountains can further trap smog (e.g., Los Angeles)

© 2011 Pearson Education, Inc.
Inversions harm health
• Long-term temperature inversions allow pollutants to build up to dangerous levels• People with breathing problems should stay inside
• Smog causes headaches, nausea, eye/throat irritation• It aggravates asthma, emphysema
• Air pollution disasters: air pollution reaches lethal levels• Under severe temperature inversions• In 1952, 4,000 people died in London

© 2011 Pearson Education, Inc.
Temperature inversion

© 2011 Pearson Education, Inc.
Atmospheric brown clouds
• Atmospheric brown cloud (ABC): relatively new• 1–3 km blanket of pollution over south/central Asia
• Similar to North Temperate Zone’s aerosol pollution• But persists year round and has a different make up
• ABC: black carbon and soot• From burning biomass and fossil fuels (coal, diesel)
• Impacts: dimming over large cities, less rainfall, heating of air, decreased reflection of snow and ice• Shrinking glaciers will reduce water sources• Weaker Indian monsoons, less crops, health effects

© 2011 Pearson Education, Inc.
Processes producing air pollution
• Incomplete combustion of fossil fuels and refuse• Creating gaseous and particulate products
• Evaporation: creates gaseous and particulate products
• Strong winds: pick up dust and other particles• Primary pollutants: direct products of combustion
and evaporation• Particulates, VOCs, CO, NOx, SO2, lead, air toxics
• Secondary pollutants: reactions of primary pollutants in the air• Ozone, peroxyacetyl, nitrates, sulfuric and nitric acids

© 2011 Pearson Education, Inc.
Prime sources of anthropogenic pollutants

© 2011 Pearson Education, Inc.
Primary pollutants
• Power plants: the major source of sulfur dioxide• Industrial plants: particulates• Transportation: carbon monoxide, nitrogen oxides• Burning fossil fuels and wastes: soot, smoke• Unburned fragments of fuel molecules: VOCs
• Nitrogen oxides (NOx): nitrogen gas is oxidized to nitric oxide (NO) under high combustion temperatures• Nitric oxide and oxygen form nitrogen dioxide (NO2;
photochemical smog) and nitrogen tetroxide (N2O4)
• Coal also contains sulfur and heavy metals

© 2011 Pearson Education, Inc.
Industrial pollution

© 2011 Pearson Education, Inc.
Tracking pollution
• Clearinghouse for Inventories and Emissions Factors• Operated by the EPA• Tracks trends in national emissions of primary
pollutants from all sources
• Ambient concentrations of pollutants in the air• Measured by the EPA• Thousands of monitoring stations in the U.S.
• 2008 air pollution levels in the U.S.: 116 million tons• 1970: 301 million tons• Shows the success of the Clean Air Act regulations

© 2011 Pearson Education, Inc.
U.S. emissions of five primary air pollutants

© 2011 Pearson Education, Inc.
Clean Air Act impacts

© 2011 Pearson Education, Inc.
Comparison of growth vs. emissions

© 2011 Pearson Education, Inc.
Getting the lead out• Lead: the sixth type of primary pollutant• Far smaller emissions than the first five primary
pollutants
• Added to gasoline to reduce engine knock• Phased out by the EPA during the 1980s and 1990s• Emissions remained airborne and traveled great
distances
• U.S. air concentrations have dropped by 99%• Decreased emissions in the U.S. and other nations
have had a global impact
• Further reductions must come from industry and smelters

© 2011 Pearson Education, Inc.
Toxics and radon
• Air concentrations of toxic chemicals and radon are small
• Some toxic compounds (e.g., benzene) come from transportation• Most come from industry and small businesses
• Radon: produced by spontaneous decay of fissionable material in rocks and soils• Escapes naturally• Seeps into buildings through foundation cracks and
basement floors• May collect in structures

© 2011 Pearson Education, Inc.
Secondary pollutants• Photochemical oxidants: ozone and other reactive
organic compounds formed by nitrogen oxides and VOCs• Sunlight provides the reaction’s energy
• Ozone concentrations in preindustrial times: 10–15 ppb• Unpolluted, summer air in North America: 20–50 ppb• Polluted air: 150 ppb or more (very unhealthy)
• Ambient U.S. ozone levels decreased 20% 1980–92• But only a few percent in the 2000s
• Ozone standards are leaders in nonattainment areas• 132 million live in areas not meeting ozone standards

© 2011 Pearson Education, Inc.
Ozone formation
• Nitrogen dioxide absorbs light energy and splits• Forms nitric oxide and atomic oxygen• The oxygen combines with oxygen gas, forming ozone
• Ozone and nitric oxide usually react to form NO2 and O2
• No accumulation of ozone
• When VOCs are present, nitric oxide reacts with them• Creates highly reactive, damaging peroxyacetyl nitrates
(PANs)• Oxidized PANs produce aldehydes and ketones• Ozone accumulates

© 2011 Pearson Education, Inc.
Formation of ozone and other photochemical oxidants

© 2011 Pearson Education, Inc.
Acid precipitation and deposition• Sulfuric acids and nitric acids • Products of sulfur dioxide and nitrogen oxides
reacting with atmospheric moisture and oxidants (e.g., hydroxyl)
• The acids in acid rain (acid deposition)
• Acid precipitation: any precipitation (rain, fog, mist, snow) more acidic than usual
• Acid deposition: acid precipitation plus dry-particle fallout
• Affects broad areas of North America, Europe and other industrialized nations • Precipitation is 10–1,000 times more acidic than usual

© 2011 Pearson Education, Inc.
Acid deposition

© 2011 Pearson Education, Inc.
Acids and bases
• An acid: any chemical that releases hydrogen ions (H+) when dissolved in water• Sour taste, corrosiveness• Ionizes (separates) to hydrogen ions + a negative ion• The more hydrogen ions, the more acidic the solution
• A base: any chemical that releases hydroxide ions (OHˉ) when dissolved in water• Bitter taste and caustic properties
• pH: the concentration of hydrogen ions• The pH scale ranges from 0 to 14

© 2011 Pearson Education, Inc.
The pH scale
• The pH scale: 0 (highly acidic) – 7 (neutral) – 14 (highly basic)• From 0 to 7: the concentration of H+ decreases • From 7 to 14: the concentration of OHˉ increases
• The numbers represent the negative logarithm (power of 10) of the H+ concentration in grams/liter (g/L)• A pH = 1: H+ concentration = 10-1 g/L
• There is a tenfold difference between units• A pH of 5 is ten times as acidic as a pH of 6

© 2011 Pearson Education, Inc.
The pH scale

© 2011 Pearson Education, Inc.
Extent and potency of acid precipitation
• Rainfall is normally slightly acidic (pH = 5.6)• Acid precipitation: any precipitation with a pH < 5.5
• Acid precipitation is now the norm over most of the industrialized world
• Eastern North America: rain and snow pH = 4.6 • Polluted air from the Midwest and industrial Canada• Can be as low as pH = 3.0
• Mountain forests east of Los Angeles have a pH = 2.8• 1,000 times more acidic than usual

© 2011 Pearson Education, Inc.
Acid deposition in eastern North America

© 2011 Pearson Education, Inc.
Natural sources of acid deposition
• Sulfuric acid (H2SO4) and nitric acid (HNO3)
• Occurs in a ratio of 2 to 1• But west U.S. and Canada have more nitric acid
• Burning fuels are oxidized by hydroxyl radicals in the troposphere• Forming sulfuric and nitric acid
• Natural sources of sulfur dioxide: 50–70 million tons/year (volcanoes, sea spray, microbial processes)
• Natural sources of nitrogen oxides: 30–40 million tons/year (lightning, biomass burning, microbial processes)

© 2011 Pearson Education, Inc.
Anthropogenic sources of acid deposition• Sulfur dioxide: 100–130 million tons/year• U.S. sources: fuel (coal) combustion
• Nitrogen oxides: 60–70 million tons/year• Most from transportation
• Anthropogenic sources: concentrated in industrialized areas• Emissions have increased 4x since 1900
• Old U.S. coal-burning power plants are reducing emissions• Deposition has decreased 33–35% in the past 15 years• Fossil-fuel-burning electric utility plants still emit SO2
and NOx

© 2011 Pearson Education, Inc.
Midwestern coal-burning power plant

© 2011 Pearson Education, Inc.
Impacts of air pollutants
• We are exposed to a mixture of pollutants that varies over time and place• Plants may be so stressed from pollution that they
become vulnerable to drought or insects
• Human health: every one of the primary and secondary air pollutants is a threat to human health
• Acute exposure can be life threatening• Chronic exposure: long-term exposure that causes
gradual deterioration and premature mortality
• Some pollutants contribute to lung cancer

© 2011 Pearson Education, Inc.
The respiratory system

© 2011 Pearson Education, Inc.
Long-term exposure and chronic effects• Sulfur dioxide: leads to bronchitis (inflammation of
the bronchi)• Ozone: leads to inflammation and scarring of the
lungs• Carbon monoxide: reduces the oxygen-carrying
capacity of the blood and leads to heart disease• Nitrogen oxides: impair lung function and affect the
immune system• Particulate matter: respiratory and cardiovascular
pathologies• Other factors (diet, exercise, genetics) influence
effects

© 2011 Pearson Education, Inc.
COPD
• Chronic obstructive pulmonary disease (COPD)• A slowly progressive lung disease that makes it hard
to breathe• The 4th leading cause of death: affects 18 million in
the U.S.• Affects 10% of adults over 40 worldwide• From smoking and burning wood or dung for fuel
• Involves three diseases: emphysema (destruction of the lung alveoli), bronchitis, and asthma

© 2011 Pearson Education, Inc.
Asthma• Most sensitive to air pollution: small children,
asthmatics, those with chronic pulmonary or heart disease, the elderly
• Asthma: an immune disorder• Impaired breathing caused by constricted airways• Is triggered by allergens (dust, mites, mold, pet
dander)• Is also triggered by pollution (ozone, particulates,
SO2)
• Causes 500,000 hospitalizations/year• 1.8 million visits to emergency departments
• In the last decade, U.S. asthma has doubled (to 23 million)

© 2011 Pearson Education, Inc.
Strong evidence• Studies of thousands of adults show strong evidence
of harm caused by fine particulates and sulfur pollution• Asthma, chronic bronchitis, cardiovascular problems,
etc.• Higher concentrations of fine particles correlate with
increased mortality from cardiopulmonary disease and lung cancer• The EPA used these studies to regulate fine particles
• Fine particles and ozone exceeded California standards• Meeting standards would save $28 billion/year in
avoided health costs, missed work, premature deaths, etc.

© 2011 Pearson Education, Inc.
Lead again
• Lead poisoning causes mental retardation• In the 1980s, elevated levels were present in adults
and children• Children: learning disabilities• Adults: high blood pressure
• The major source of lead: leaded gasoline• Inhaled, settled on food or other items put in the
mouth
• The EPA mandated elimination of leaded gasoline by 1996• Dramatically reduced lead in the environment
© 2011 Pearson Education, Inc.
Acute and carcinogenic effects
• Air pollution can kill people already suffering from heart or respiratory diseases• Lethal doses also occur in accidental poisoning
• Moderate air pollution can change cardiac rhythms in people with heart disease• Triggering fatal heart attacks
• Diesel: a likely human carcinogen• Benzene: clearly correlated with cancer• In motor fuels, solvents, explosives, smoke,
medicines• Linked to leukemia, blood disorders, damaged
immunity

© 2011 Pearson Education, Inc.
Diesel truck exhaust

© 2011 Pearson Education, Inc.
The environment
• Plants are more sensitive than humans to air pollution• Sulfur dioxide from smelters and power plants killed
large areas of vegetation
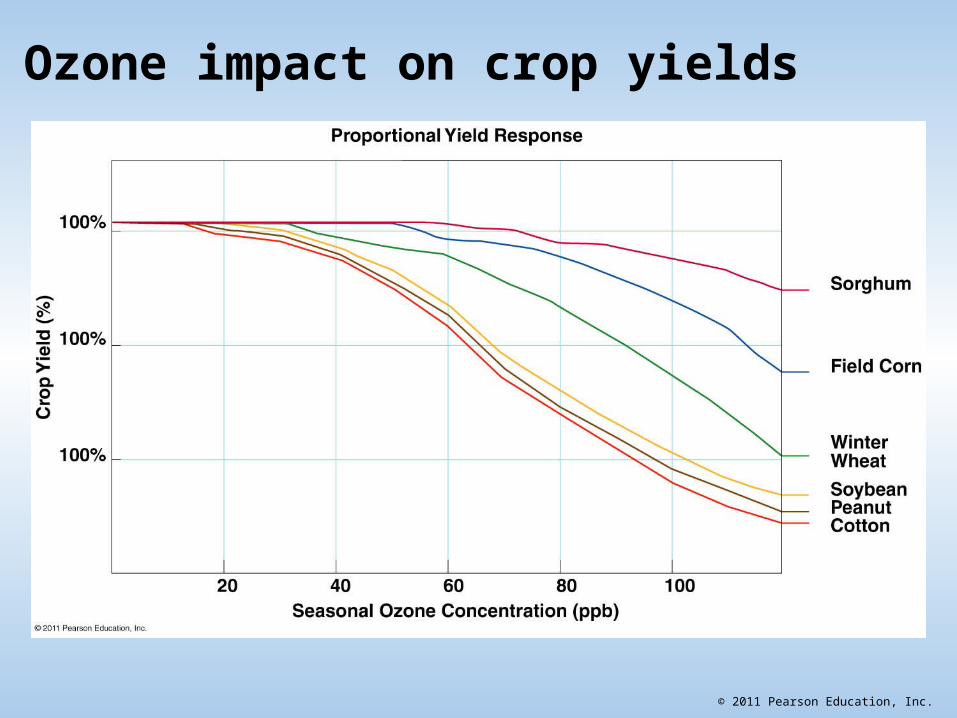
• Ozone damages crops, orchards, and forests• Ozone enters plants through stomata (pores)• Symptoms of damage: black flecks, yellow leaves
• Crops vary in their susceptibility to ozone• Soybeans, corn, wheat are damaged at ambient
ozone levels• Countries lose billions of dollars/year in lower yields

© 2011 Pearson Education, Inc.
Ambient ozone injury
© 2011 Pearson Education, Inc.
Ozone impact on crop yields

© 2011 Pearson Education, Inc.
Forest damage• Damage to trees and wild plants may exceed crop
damage• Ponderosa and Jeffrey pines in California were
damaged by ozone from the San Francisco-Oakland area• Trees weakened by ozone were susceptible to pine
beetles
• Tree damage starts at 40 ppb ozone• Intensifies with higher levels• California and the Appalachians have levels = 60 ppb• Resulting in 30%–50% less stem growth
• Ozone stress disrupts carbon and nutrient metabolism

© 2011 Pearson Education, Inc.
Effects on materials and aesthetics
• Particulates turn walls, windows, and surfaces dingy• Oxidation by ozone: deteriorates rubber• Sulfur dioxide and sulfur or nitrogen oxides corrode
metal• Weather and deteriorate stonework
• It costs hundreds of millions of dollars/year to clean or replace damaged materials• Historic statues and carvings are irreplaceable

© 2011 Pearson Education, Inc.
Effects of pollution on monuments

© 2011 Pearson Education, Inc.
Visibility
• A clear blue sky and visibility also have aesthetic values• We drive miles and spend money to live in less
polluted areas• Traffic and congestion cause the pollution we are
trying to avoid
• National parks and wilderness areas suffer pollution • Visibility is impaired by “regional haze”
• The EPA’s Regional Haze Rule (1999) aims to improve visibility and reduce emissions in parks and wilderness

© 2011 Pearson Education, Inc.
Effects of acid deposition: aquatic ecosystems• Acid deposition’s impacts on ecosystems were noted
45 years ago• Impact on aquatic ecosystems: an environment’s pH
affects enzymes, hormones, and other proteins• Organisms can regulate their internal pH within limits• A low pH overwhelms regulatory mechanisms, killing
or weakening the organism
• Ponds, lakes, and streams have a natural pH of 6–8• Eggs, sperm, and developing young are very
sensitive to small changes in pH

© 2011 Pearson Education, Inc.
Acid deposition harms aquatic life
• A pH below 5 kills organisms or impairs their reproduction
• Acid precipitation can leach heavy metals from soil, which are absorbed by organisms and are highly toxic• Mercury accumulates in fish in acidic lakes
• Ontario, Canada lost fish in 1,200 lakes• 346 lakes in the Adirondacks in New York lost fish
• The clear, blue lakes look healthy but contain only acid-loving moss growing on the bottom

© 2011 Pearson Education, Inc.
Neutralizing capacity
• Some areas receive acid precipitation but are not harmed
• Buffer: a substance that absorbs hydrogen ions• Maintains the pH at a relatively constant value• Acid neutralizing capacity (ANC): a system that is
protected from changes in its pH
• Limestone (CaCO3): obtained from soil• A natural buffer protecting many lakes
• Granitic rock in sensitive regions has a low ANC• The Clean Air Act reduced SO2 and NOx emissions• Decreased acid precipitation leads to fewer acidic
lakes

© 2011 Pearson Education, Inc.
Buffering

© 2011 Pearson Education, Inc.
Impacts on forests• Forests from Vermont to California died off during
the 1980s• 1.3 million acres in New England died
• Trees lose needles and become more susceptible to frost• Sugar maples suffer 20%–80% losses
• Acid precipitation adds sulfur and nitrogen to soil• Stimulating tree growth• But leaching out calcium and magnesium (buffers)• Toxic aluminum oxides are also leached from the soil• Tree growth is reduced
• Liming the soil restores tree health

© 2011 Pearson Education, Inc.
Impact on human artifacts
• Limestone and marble are used on buildings and monuments (artifacts)• Acid deposition rapidly erodes these structures• Hundred- or thousand-year-old structures are crumbling
• It costs billions of dollars/year to replace or repair structures• A Buddha statue in Japan is affected by acid
precipitation from China and Korea
• Destruction of buildings also reminds us of how we are decreasing the buffering capacities of ecosystems• Acid deposits cross national boundaries

© 2011 Pearson Education, Inc.
Bringing air pollution under control
• By the 1960s it was obvious that pollutants were overloading natural cleansing processes• Unrestricted pollution discharge could not continue
• The Clean Air Act of 1970 (CAA): passed by Congress• Amended in 1977 and 1990• Is administered by the EPA• The foundation of U.S. air-pollution control efforts• Ambient standards: levels protecting human health
and the environment
© 2011 Pearson Education, Inc.
The CAA and NAAQS• The CAA calls for identifying widespread pollutants• Sets ambient standards for five criteria pollutants (not
lead)• Establishes control methods to meet the standards
• Criteria pollutants: the most widespread and objectionable• Particulates, SO2, CO, NOx, ozone, lead
• National Ambient Air Quality Standards (NAAQS) set primary standards for criteria pollutants• The highest levels that won’t cause harm• Set long- and short-term levels to protect against
effects• The EPA lowered ozone and lead standards in 2008

© 2011 Pearson Education, Inc.
The NAAQS and NESHAPs• The EPA is required to review pollutants every 5
years• Then make adjustments based on science
• The NAAQS has far-reaching impacts on regulations• Proposed changes always generate controversies
• National Emission Standards for Hazardous Air Pollutants (NESHAPs)• Established under the CAA’s 1980 amendments• The EPA must track and regulate 187 toxic pollutants
• The National Emission Inventory: database of criteria and hazardous air pollutants the EPA uses to regulate pollutants

© 2011 Pearson Education, Inc.
Control strategies
• Command and control approach: regulations requiring industry to achieve a set limit on each pollutant using specific control equipment• The basic strategy of the CAA to keep criteria
pollutant emissions below primary standard levels• Assumes improved health through lower pollution• A region in violation of the standards has to come
back into compliance
• It is hard to implement this strategy: states and cities are unable or unwilling to enforce control

© 2011 Pearson Education, Inc.
1990 amendments
• Despite problems, total air pollutants decreased under the command and control approach
• The Clean Air Act Amendments of 1990 (CAAA): targeted specific pollutants more directly• Enforced aggressive compliance through sanctions
• State Implementation Plan (SIP): states must still carry out the mandates of the 1990 Act• Requires public comment before submitting to the
EPA• Designed to reduce emissions of every NAAQS
pollutant whose control standard has not been reached

© 2011 Pearson Education, Inc.
The SIP• Under SIP, polluters must apply for a permit
identifying the type, level, and reduction steps for a pollutant• Permit fees fund state air pollution control strategies
• The SIP is more flexible than command and control• Polluters can choose the most cost-effective strategy• The market system allocates pollution among utilities
• Attainment plans: submitted by areas of the U.S. that have not reached the required pollution levels through reasonably available control technology (RACT)
• Offending regions must reach standards in a set time frame

© 2011 Pearson Education, Inc.
Reducing particulates
• Before 1970, major sources of particulates were industrial stacks and open burning of refuse• The CAA prevents both of these• Disposal of refuse is now through landfilling• Industries installed filters, electrostatic precipitators,
etc. to reduce stack emissions
• Particulates are still emitted from steel mills, power plants, cement plants, smelters, construction sites• Diesel engines, wood-burning stoves, fires

© 2011 Pearson Education, Inc.
PM
• The EPA added new ambient air quality standards for particulates (PM2.5) in 1997
• Particulates smaller than 2.5 micrometers (microns) are the most dangerous to the lungs
• Larger particulates are still regulated
• 24-hour primary standards were lowered• Saving $9–$75 billion/year in health benefits• But the annual standard was not lowered
• In February 2009, a federal appeals court ruled the standards were inadequate and contrary to scientific data

© 2011 Pearson Education, Inc.
Controlling air toxics• 4.7 million tons/year of air toxics are released in the
U.S.• Stationary sources: factories, refineries, power plants• Mobile sources: cars, trucks, buses• Indoor sources: solvents, building materials
• Cause cancer, environmental contamination, accidents
• Congress identified 187 toxic pollutants• Maximum achievable control technology (MACT):
developed by the EPA• Substitution by nontoxics gives industry flexibility in
meeting goals

© 2011 Pearson Education, Inc.
National air toxics trends station

© 2011 Pearson Education, Inc.
Limiting pollutants from vehicles• Cars, trucks, and buses release almost half of all air
pollution• VOCs, CO, NOx (leads to ground-level ozone and
PANs)
• The CAA’s 90% reduction goal by 1975 was unrealistic• But a 2007 car releases 86% less pollution than a
1970 car• Despite more miles driven and increased cars
• Reductions in emissions are due to• Smaller cars• Catalytic converters that convert or remove pollutants

© 2011 Pearson Education, Inc.
Cutaway of a catalytic converter
© 2011 Pearson Education, Inc.
CAAA changes• Failure to meet air quality standards required that• New cars emit less VOCs and NOx
• Buses and trucks had to meet more stringent standards
• The EPA could control all nonroad engines (boats, etc.)
• Regions with high CO had to add oxygen to gasoline• More vehicle inspection stations have to be able to
measure emissions
• Fuel efficiency and consumption are negatively impacted by higher speed limits and larger, less efficient vehicles (SUVs)

© 2011 Pearson Education, Inc.
Fuel economy and light-duty vehicles

© 2011 Pearson Education, Inc.
CAFE standards
• Under the Energy Policy and Conservation Act of 1975, the National Highway Traffic Safety Administration sets CAFE standards for motor vehicles
• Corporate average fuel economy (CAFE) standards• Saves oil, helps energy security, decreases air pollution
• 1984 standards: 27.5 mpg (passenger cars), 20.7 mpg (light trucks, SUVs, minivans; 22.2 mpg by 2007)• These have never been reached
• The 2007 Energy Independence and Security Act• Raises all vehicle standards to 35 mpg by 2020

© 2011 Pearson Education, Inc.
Increasing CAFE standards
• In 2009, the Obama administration increased standards• A 5%/year fuel economy increase beginning in 2011• By 2016, standards for cars would be 39 mpg; for light
trucks it would be 30 mpg• New vehicle GHGs would be reduced 30% by 2016
• Raising CAFE standards addresses• Our dependence on foreign oil• Health issues from smog and particulates
• CO2 emissions and climate change

© 2011 Pearson Education, Inc.
Encouraging trends• Hybrid electric vehicles combine a conventional
gasoline motor with a battery-powered electric motor• High gasoline prices and increased manufacturing
increase demand• A bad economy and cheaper gasoline decrease
demand• Fuel efficiency can exceed 40 mpg• Hybrids are more expensive but fuel savings add up• Federal and state tax credits also offset higher prices
• People are also using mass transit (buses, subways, light rail)• Increased ridership could reduce oil imports
significantly

© 2011 Pearson Education, Inc.
Managing ozone• To control ozone: address the VOCs and NOx that
form it• Reducing emissions of VOCs from motor vehicles,
point sources (industries), and area sources (dry cleaners, print shops, household products)• Since the CAAA, emissions have declined 24%
• The 1997 revised ozone standard was strongly opposed by industry, but the Supreme Court upheld the EPA
• Implementation was delayed until 2004• Health benefits far outweighed compliance costs
• Some don’t think the current ozone standard is strict enough

© 2011 Pearson Education, Inc.
Down with NOx
• The EPA implemented regulations to reduce NOx emissions from mobile sources, power plants, industrial boilers, turbines
• Tier 2 Standards: emissions from all SUVs, trucks, passenger vans are held to the same standard as cars• They are not being met due to older, polluting cars
• NOx Budget Trading Program (NBP): the EPA establishes a market-based “cap and trade” system• Industries have flexibility in attaining the targets• States can come back to compliance

© 2011 Pearson Education, Inc.
NOx emissions under the NOx Budget Trading Program
© 2011 Pearson Education, Inc.
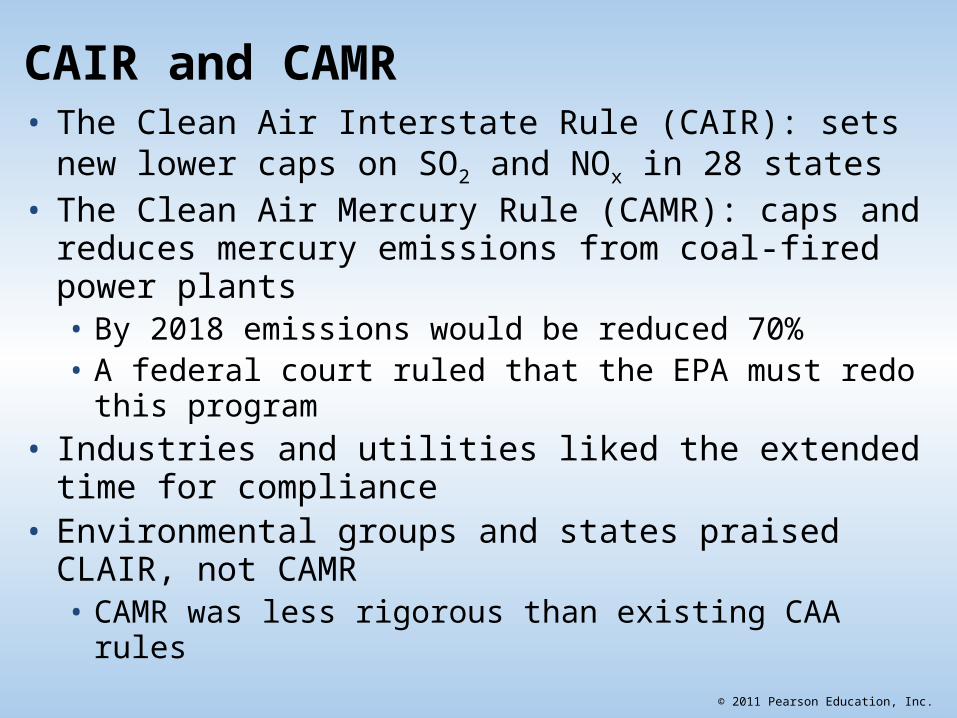
CAIR and CAMR• The Clean Air Interstate Rule (CAIR): sets new lower
caps on SO2 and NOx in 28 states• The Clean Air Mercury Rule (CAMR): caps and
reduces mercury emissions from coal-fired power plants• By 2018 emissions would be reduced 70%• A federal court ruled that the EPA must redo this
program• Industries and utilities liked the extended time for
compliance• Environmental groups and states praised CLAIR, not
CAMR• CAMR was less rigorous than existing CAA rules

© 2011 Pearson Education, Inc.
New source review program• Power plants and other industrial facilities built after
1970 must use “best available” pollution control technology• Exempting older facilities unless upgrades increased
pollution
• President Bush’s EPA: facilities needed updated pollution technologies when changes involved >20% of the plant’s value• Industries skirted the rules by calling improvements
“routine maintenance” and increased emissions
• A federal appeals court and the Supreme Court found the changes violated the CAA and simple logic

© 2011 Pearson Education, Inc.
Coping with acid deposition
• Despite evidence of the link between power plant emissions and acid deposition, no legal action was taken until 1990
• Pennsylvania and states that use coal to produce electricity argued that controlling SO2 emissions would make electricity too expensive
• New York and the New England states, environmental groups, and scientists argued for emission controls
• Two decades of action were lost due to political delays

© 2011 Pearson Education, Inc.
Title IV of the CAAA• Title IV of the CAAA mandates reduced SO2 and NOx
• A free-market approach grants emission allowances• New plants must buy existing allowances
• Regulating boilers and monitoring will reduce NOx
• Industries are meeting Title IV requirements by switching to low-sulfur coal, adding scrubbers, and trading emission allowances while saving money
• The EPA’s two-phase approach has reduced SO2 faster and cheaper than expected
• NOx emissions reductions are double Title IV objectives

© 2011 Pearson Education, Inc.
SO2 emissions under the Acid Rain Reduction Program

© 2011 Pearson Education, Inc.
Field news
• Air quality has improved, along with health benefits• Reduced acid deposition, some freshwater recovery,
improved forest conditions
• SO2 and sulfates have decreased
• Some acidified streams and lakes have recovered
• But nitrogen deposition is still a problem• The CAAA does not curb nitrogen emissions
• Sulfur has built up in the soil• Recovery depends on further reductions in sulfur
and nitrogen

© 2011 Pearson Education, Inc.
Costs and benefits
• We have air pollution because we want the goods and services that generate it• Benefits may be essential or trivial• But we want them if we can afford them
• Air pollution does not have to get worse• But remedies come at a price (e.g., economic cost)• Critics of control see lost opportunities for growth but
disregard the costs avoided (e.g., improved health)
• Cost-benefit analysis of the Acid Rain Reduction Program• For 2010, benefits = $122 billion, costs = $3 billion

© 2011 Pearson Education, Inc.
Destruction of the ozone layer
• Stratospheric ozone protects Earth from harmful ultraviolet radiation• Chlorofluorocarbons (CFCs) destroy the ozone layer• Despite skeptics, scientists have a strong consensus
on the ozone depletion problem
• Solar radiation emits electromagnetic waves• Ultraviolet (UV) waves are shorter than violet rays
(the shortest wavelengths visible to the human eye)
• UVB radiation is more energetic and damaging than UVA• But UVA can also cause damage

© 2011 Pearson Education, Inc.
The electromagnetic spectrum

© 2011 Pearson Education, Inc.
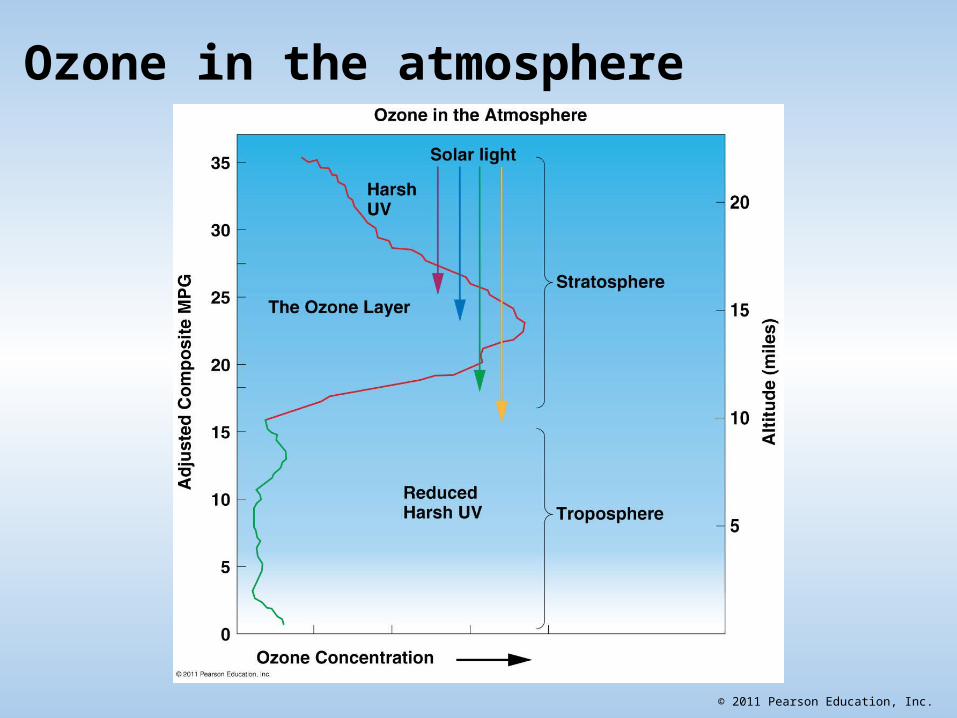
Ozone formation
• The ozone shield: stratospheric ozone that absorbs most (99%) UV radiation• The 1% UVB radiation causes skin cancer, and
damages crops and other life forms
• Ozone is formed in the stratosphere: • UV radiation splits O2 molecules into free oxygen (O)
O2 + UVB → O + O
• Some O combines with O2 to form ozone (O3)
O + O2 → O3
© 2011 Pearson Education, Inc.
Ozone in the atmosphere

© 2011 Pearson Education, Inc.
Amounts of stratospheric ozone can change
• Ozone can also be destroyed:• Some O combines with O3 to form 2 O2 molecules
O + O3 → O2 + O2
• O3 absorbs UVB and converts to O and O2
O3 + UVB → O + O2
• Ozone concentrations change• In the Northern Hemisphere, they are highest in
summer and at the equator• Other chemicals in the air can upset the equilibrium

© 2011 Pearson Education, Inc.
Halogens in the atmosphere
• Chlorofluorocarbons (CFCs): halogenated hydrocarbons• Nonreactive, nonflammable, nontoxic organic
molecules• Chlorine and fluorine atoms replace some hydrogens• Normally gaseous, but liquefy under some pressure
• Used in refrigerators, air conditioners, heat pumps• Production of plastic foams• Cleaning computer parts• Pressuring agent in aerosol cans

© 2011 Pearson Education, Inc.
Rowland and Molina
• Concluded that CFCs could damage stratospheric ozone through the release of chlorine atoms• Increased UV radiation would cause more skin cancer
• Intense UV radiation breaks CFCs apartCFCl3 + UV → Cl + CFCl2
• Chlorine atoms (Cl) would attack ozone, forming chlorine monoxide (ClO) and molecular oxygen (O2)
Cl + O3 → ClO + O2
• Two molecules of ClO would react and release more Cl and O2
ClO + ClO → 2 Cl + O2

© 2011 Pearson Education, Inc.
Chlorine is regenerated when reacting with O3• Chlorine catalytic cycle: chlorine is regenerated• Chlorine acts as a catalyst—promoting a chemical
reaction without being used up
• Every chlorine molecule lasts 40–100 years in the air• It can break down 100,000 O3 molecules
• The EPA banned CFC use in aerosol cans in 1978• Manufacturers switched to nondamaging substitutes• CFCs were still used in other applications
• Bromine, a soil fumigant and pesticide, depletes ozone• It is 60 times as potent as Cl

© 2011 Pearson Education, Inc.
Stratospheric ozone formation and destruction

© 2011 Pearson Education, Inc.
The ozone “hole”
• In 1985, scientists noticed a hole (serious thinning) in the stratospheric ozone layer over the South Pole• Ozone levels were 50% lower than normal
• In summer: gases (NO2, methane) trap Cl, preventing ozone depletion
• The Antarctic winter (in June) creates a vortex that traps stratospheric gases
• Extremely cold temperatures create stratospheric clouds• Cloud surfaces allow chemical reactions to release
Cl2

© 2011 Pearson Education, Inc.
The Antarctic’s ozone “hole”• Spring sunlight breaks up the stratospheric clouds• UV light attacks molecular chlorine• Initiating the chlorine cycle, which destroys ozone
• Summer (November) breaks up the vortex• Ozone-rich air returns to the area
• Ozone-poor air has spread over the Southern Hemisphere• Queensland, Australia: two out of three are expected
to develop skin cancer
• The ozone hole is now the size of North America• The Arctic does have 25% depletion, but no ozone
hole

© 2011 Pearson Education, Inc.
Ozone loss and the extent of the ozone hole

© 2011 Pearson Education, Inc.
Further ozone depletion
• Worldwide ozone losses of 3%–6% from 2002 to 2007
• Ozone losses of the 1980s will have caused 12 million people in the U.S. to develop skin cancer• More UVB radiation than ever reached Earth
• In 1987, UN member countries met in Montreal, Canada• The Montreal Protocol: 194 nations agreed to scale
back CFC production 50% by 2000• Amendments moved the target date for complete
phaseout of CFCs to January 1, 1996• CFCs are still being used

© 2011 Pearson Education, Inc.
Production and presence of ozone-depleting substances in the atmosphere

© 2011 Pearson Education, Inc.
Action in the United States• The U.S. was the leader in CFC production and use• After years of resistance, companies phased out
production• The CAAA’s Title VI, Protecting Stratospheric Ozone
program restricts production, use, emissions, and disposal of all ozone-depleting chemicals
• HCFCs (hydrochlorofluorocarbons) are short-term substitutes that will gradually be phased out
• Hydrofluorocarbons (HFCs) contain no chlorine• Bromine is not yet banned, due to the agricultural
industry• Phasing out CFCs also helps slow down climate
change

© 2011 Pearson Education, Inc.
Final thoughts
• The ozone story is a remarkable episode in human history
• The world has shown that it can respond collectively and effectively to a clearly perceived threat
• The scientific community played a crucial role• Alerting the world • Researching the threat
• Skeptics stressed uncertainties but scientific consensus convinced politicians to act

© 2011 Pearson Education, Inc.
CHAPTER 19
Atmospheric Pollution
Active Lecture Questions

© 2011 Pearson Education, Inc.
______ pollutants are the direct products of combustion and evaporation.
a. Primary
b. Secondary
c. Tertiary
d. Volatile organic
Review Question-1
© 2011 Pearson Education, Inc.
______ pollutants are the direct products of combustion and evaporation.
a. Primary
b. Secondary
c. Tertiary
d. Volatile organic
Review Question-1 Answer

© 2011 Pearson Education, Inc.
Rain, fog, mist, or snow that has a lower pH than usual is considered
a. primary air pollution.
b. acid precipitation.
c. volatile organic compounds (VOCs).
d. radon.
Review Question-2
© 2011 Pearson Education, Inc.
Rain, fog, mist, or snow that has a lower pH than usual is considered
a. primary air pollution.
b. acid precipitation.
c. volatile organic compounds (VOCs).
d. radon.
Review Question-2 Answer

© 2011 Pearson Education, Inc.
Which of the following are considered negative environmental effects of air pollution on the environment?
a. crop, orchard, and forest damage
b. effects on materials and aesthetics
c. reduced visibility in skies
d. all of the above
Review Question-3

© 2011 Pearson Education, Inc.
Which of the following are considered negative environmental effects of air pollution on the environment?
a. crop, orchard, and forest damage
b. effects on materials and aesthetics
c. reduced visibility in skies
d. all of the above
Review Question-3 Answer

© 2011 Pearson Education, Inc.
The ______ Act calls for identifying the most widespread pollutants, setting ambient standards, and establishing control methods and timetables to meet the standards.
a. Acid Pollution Reduction
b. VOC and Nitrogen Oxide Reduction
c. Clean Air
d. Command and Control
Review Question-4

© 2011 Pearson Education, Inc.
The ______ Act calls for identifying the most widespread pollutants, setting ambient standards, and establishing control methods and timetables to meet the standards.
a. Acid Pollution Reduction
b. VOC and Nitrogen Oxide Reduction
c. Clean Air
d. Command and Control
Review Question-4 Answer
© 2011 Pearson Education, Inc.
Ozone found in the stratosphere is called ______, whereas ozone found in the troposphere is called ______.
a. pollution; the ozone shield
b. primary pollution; secondary pollution
c. the ozone shield; pollution
d. secondary pollution; primary pollution
Review Question-5
© 2011 Pearson Education, Inc.
Ozone found in the stratosphere is called ______, whereas ozone found in the troposphere is called ______.
a. pollution; the ozone shield
b. primary pollution; secondary pollution
c. the ozone shield; pollution
d. secondary pollution; primary pollution
Review Question-5 Answer

© 2011 Pearson Education, Inc.
According to Fig. 19-10, which of the following statements are true?
a. CO emissions werehigher in 2007 thanin 1970.
b. VOC emissions werehigher in 2007 thanin 1970.
c. Pb emissions werehigher in 2007 thanin 1970.
d. All six air pollutantsemissions were higherin 1970 than in 2007.
Interpreting Graphs and Data-1

© 2011 Pearson Education, Inc.
According to Fig. 19-10, which of the following statements is true?
a. CO emissions werehigher in 2007 thanin 1970.
b. VOC emissions werehigher in 2007 thanin 1970.
c. Pb emissions werehigher in 2007 thanin 1970.
d. All six air pollutantsemissions were higherin 1970 than in 2007.
Interpreting Graphs and Data-1 Answer

© 2011 Pearson Education, Inc.
According to Fig. 19-14, a substance with a pH below 7 is considered
a. an acid.
b. a base.
c. neutral.
Interpreting Graphs and Data-2

© 2011 Pearson Education, Inc.
According to Fig. 19-14, a substance with a pH below 7 is considered
a. an acid.
b. a base.
c. neutral.
Interpreting Graphs and Data-2 Answer

© 2011 Pearson Education, Inc.
All of the following have reduced automobile emissions in the United States except
a. the catalytic converter.b. the elimination of federal speed limits in
1996.c. the establishment of vehicle inspection
stations.d. adding oxygen to gasoline to cut carbon
monoxide emissions.
Thinking Environmentally-1

© 2011 Pearson Education, Inc.
All of the following have reduced automobile emissions in the United States except
a. the catalytic converter.b. the elimination of federal speed limits in
1996.c. the establishment of vehicle inspection
stations.d. adding oxygen to gasoline to cut carbon
monoxide emissions.
Thinking Environmentally-1 Answer

© 2011 Pearson Education, Inc.
CFCs in the stratosphere are subject to intense ______, which break(s) them apart and allow(s) them to interact with ozone in a destructive way.
a. pollution
b. thermal inversions
c. UV radiation
d. all of the above
Thinking Environmentally-2

© 2011 Pearson Education, Inc.
CFCs in the stratosphere are subject to intense ______, which break(s) them apart and allow(s) them to interact with ozone in a destructive way.
a. pollution
b. thermal inversions
c. UV radiation
d. all of the above
Thinking Environmentally-2 Answer