% 1* 2#./:#; · besides gala business center, opp. wagh bakri tea lounge, off c.g. road,...
TRANSCRIPT
SINTEXPLA STICS TECHNOLOGY
To,The Manager, Capital Market (Listing) National Stock Exchange of India Ltd.Exchange Plaza, 5th Floor,Plot No : C / l , G Block Bandra Kurla Complex Bandra (E), Mumbai-400 051
Stock Code: Equity - SPTL
Dear Sir/Madam,
Ref No: SEC/NSE/BSE/2017-18 September 20, 2018
To,The Corporate Relationship Dept.BSE Limitedl sl Floor, New Trading Ring,Rotunda Building, P.J.Towers,Dalai Street, Mumbai-400 001
Stock Code: Equity 540653
Sub.: Submission of Annual Report of the Company for the Financial Year 2017-18
Pursuant to Regulation 34(1) of the SEBI (Listing Obligations and Disclosure Requirements) Regulations, 2015, please find enclosed herewith copy of Annual Report for the Financial Year 2017-18 as approved and adopted by the Members at the 3rd Annual General Meeting of the Company as per provisions of the Companies Act, 2013.
You are requested to kindly take the same on record.
Thanking you.
Yours' faithfully,For SINTEX PLASTICS TECHNOLOGY LIMITED
Manan Bhavsar Company Secretary
Enel: As above
SINTEX PLASTICS TECHNOLOGY LIMITED(Formerly known as Neev Educare Limited)
Regd. Office: In the premises of Sintex-BAPL Ltd, Near Seven Garnala, Kalol (N.G.) - 382721
Phone: +91-2764-253500 E-m ail: [email protected]
CIN: U74i 20GJ2015PLC084071 www.sintex-plastics.com
• INDIA • USA • FRANCE • GERMANY • HUNGARY • MOROCCO • POLAND • SLOVAKIA • TUNISIA

FORWARD LOOKING STATEMENT
In this Annual Report, we have disclosed forward-looking information to enable investors to fully appreciate our prospects and take informed investment decisions. This report and
other statements – written and oral – that we periodically make, contain forward-looking statements that set our anticipated results based on management plans and assumptions.
We have tried, where possible, to identify such statements by using words such as ‘anticipate’, ‘expect’, ‘project’, ‘intend’, ‘plan’, ‘believe’, and words of similar substance in connection
with any discussion of future performance.
We cannot, of course, guarantee that these forward-looking statements will be realised, although we believe we have been prudent in our assumptions. Achievement of results
is subject to risks, uncertainties, and potentially inaccurate assumptions. Should known or unknown risks or uncertainties materialise, or should underlying assumptions prove
inaccurate, actual results could vary materially from those anticipated, estimated, or projected. Readers should bear this in mind.
We undertake no obligation to publicly update any forward-looking statements, whether as a result of new information, future events, or otherwise.
Annual Report 2017 - 18 1
Corporate Information
BOARD OF DIRECTORS Mr. Arun P. Patel, Chairman
Mr. Dinesh B. Patel
Mr. Rahul A. Patel
Mr. Amit D. Patel, Managing Director
Mr. Pravin K. Laheri (w.e.f. 30th May, 2017)
Mr. Desh Raj Dogra (w.e.f. 30th May, 2017)
Mr. Sandeep M. Singhi (w.e.f. 9th August, 2017)
Dr. Gauri S. Trivedi (w.e.f. 9th August, 2017)
Mrs. Indira J. Parikh (w.e.f. 31st October, 2017)
Mr. Kiritbhai C. Shah (Upto 14th September, 2017)
Ms. Namita R. Shah (Upto 14th September, 2017)
AUDITORS M/s. R. Choudhary and Associates
Chartered Accountants
Ahmedabad
REGISTRAR AND SHARE TRANSFER AGENT Link Intime India Pvt. Ltd.
5th Floor, 506 to 508, Amarnath Business Center-1 (ABC-1),
Besides Gala Business Center, Opp. Wagh Bakri Tea Lounge,
Off C.G. Road, Ellisbridge, Ahmedabad – 380 006.
COMPANY SECRETARY AND COMPLIANCE OFFICER Mr. Manan Bhavsar
REGISTERED OFFICE In the premises of Sintex-BAPL Ltd.,
Near Seven Garnala, Kalol (N.G.) – 382 721
Tel (91-2764) 253500
E-mail : [email protected]
Website: www.sintexplastics.com
CIN: U74120GJ2015PLC084071 CONTENTSCorporate Information 1
Director’s Report 2
Management Discussion and Analysis 35
Report on Corporate Governance 47
Standalone Financial Statements 62
Consolidated Financial Statements 90
Form AOC-1 139
DIRECTOR’S REPORT
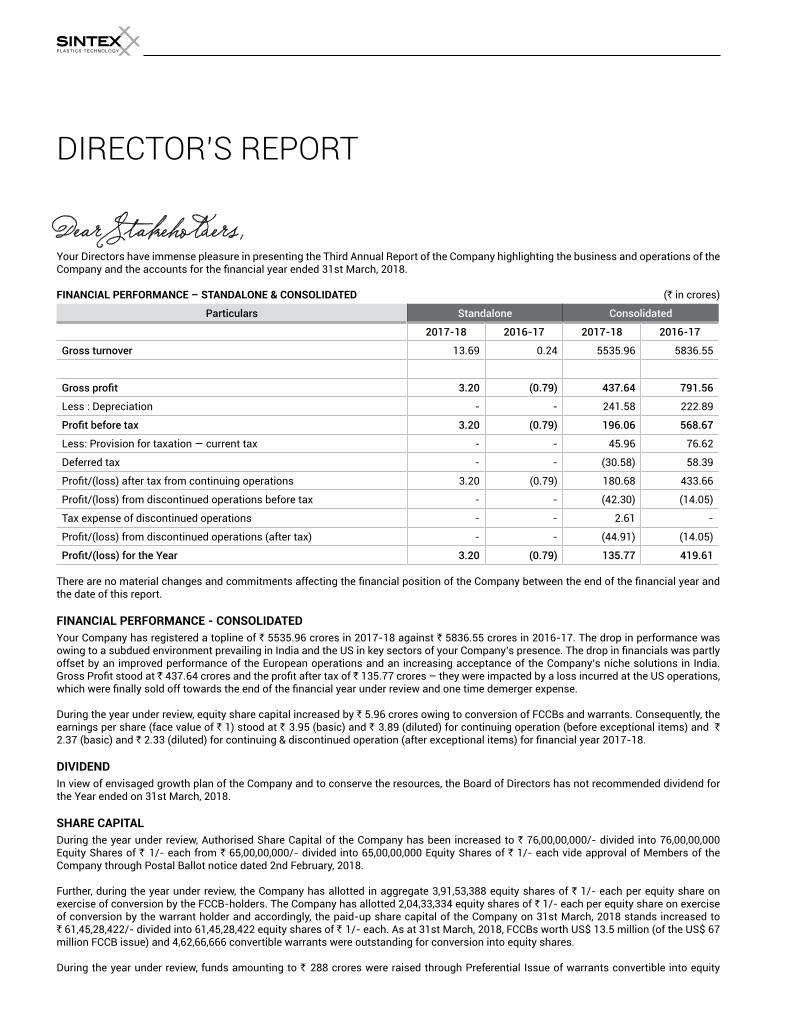
Dear Stakeholders,Your Directors have immense pleasure in presenting the Third Annual Report of the Company highlighting the business and operations of the Company and the accounts for the financial year ended 31st March, 2018.
FINANCIAL PERFORMANCE – STANDALONE & CONSOLIDATED (` in crores)
Particulars Standalone Consolidated
2017-18 2016-17 2017-18 2016-17
Gross turnover 13.69 0.24 5535.96 5836.55
Gross profit 3.20 (0.79) 437.64 791.56
Less : Depreciation - - 241.58 222.89
Profit before tax 3.20 (0.79) 196.06 568.67
Less: Provision for taxation — current tax - - 45.96 76.62
Deferred tax - - (30.58) 58.39
Profit/(loss) after tax from continuing operations 3.20 (0.79) 180.68 433.66
Profit/(loss) from discontinued operations before tax - - (42.30) (14.05)
Tax expense of discontinued operations - - 2.61 -
Profit/(loss) from discontinued operations (after tax) - - (44.91) (14.05)
Profit/(loss) for the Year 3.20 (0.79) 135.77 419.61
There are no material changes and commitments affecting the financial position of the Company between the end of the financial year and the date of this report.
FINANCIAL PERFORMANCE - CONSOLIDATED
Your Company has registered a topline of ` 5535.96 crores in 2017-18 against ` 5836.55 crores in 2016-17. The drop in performance was owing to a subdued environment prevailing in India and the US in key sectors of your Company’s presence. The drop in financials was partly offset by an improved performance of the European operations and an increasing acceptance of the Company’s niche solutions in India. Gross Profit stood at ` 437.64 crores and the profit after tax of ` 135.77 crores – they were impacted by a loss incurred at the US operations, which were finally sold off towards the end of the financial year under review and one time demerger expense.
During the year under review, equity share capital increased by ` 5.96 crores owing to conversion of FCCBs and warrants. Consequently, the earnings per share (face value of ` 1) stood at ` 3.95 (basic) and ` 3.89 (diluted) for continuing operation (before exceptional items) and `
2.37 (basic) and ` 2.33 (diluted) for continuing & discontinued operation (after exceptional items) for financial year 2017-18.
DIVIDEND
In view of envisaged growth plan of the Company and to conserve the resources, the Board of Directors has not recommended dividend for the Year ended on 31st March, 2018.
SHARE CAPITAL
During the year under review, Authorised Share Capital of the Company has been increased to ` 76,00,00,000/- divided into 76,00,00,000 Equity Shares of ` 1/- each from ` 65,00,00,000/- divided into 65,00,00,000 Equity Shares of ` 1/- each vide approval of Members of the Company through Postal Ballot notice dated 2nd February, 2018.
Further, during the year under review, the Company has allotted in aggregate 3,91,53,388 equity shares of ` 1/- each per equity share on exercise of conversion by the FCCB-holders. The Company has allotted 2,04,33,334 equity shares of ` 1/- each per equity share on exercise of conversion by the warrant holder and accordingly, the paid-up share capital of the Company on 31st March, 2018 stands increased to ` 61,45,28,422/- divided into 61,45,28,422 equity shares of ` 1/- each. As at 31st March, 2018, FCCBs worth US$ 13.5 million (of the US$ 67 million FCCB issue) and 4,62,66,666 convertible warrants were outstanding for conversion into equity shares.
During the year under review, funds amounting to ` 288 crores were raised through Preferential Issue of warrants convertible into equity
Annual Report 2017 - 18 /32
shares to Promoter Group Company, for repayment of the existing debt of the subsidiary(ies) and the same were pending for utilization as on 31st March, 2018.
FIXED DEPOSITS
During the year under review, your Company has not accepted any deposits within the meaning of Section 73 of the Companies Act, 2013 and the rules made there under.
STATE OF COMPANY’S AFFAIRS
Sintex is a globally renowned conglomerate straddling the composites and plastic solutions sectors with 35 manufacturing facilities and global footprint span across nine countries and four continents. The Company has come a long way from making tanks to developing complex niche solutions that cater to high-growth critical sectors.
The Company enjoys a strong presence in the European markets through its subsidiary Sintex NP SAS (Europe). In India, the Company operates through its subsidiaries Sintex-BAPL Limited (developing and delivering high-end custom moulded products and solutions to diverse sectors) and Sintex Prefab and Infra Limited (which undertakes EPC contracts for various infrastructure projects across the country).
PERFORMANCE OF SUBSIDIARIES
The Company enjoys a dominant presence in the plastic processing and custom moulding in India and across the globe through its subsidiaries. While Sintex-BAPL Limited caters to the Indian markets, Sintex NP has enabled the Company to create a strong recall among discerning global OEMs in Europe. Sintex Wausaukee, Sintex Logistics LLC catered to global OEMs operating in North America.
Sintex-BAPL Limited: The Company’s custom moulding operations can be classified into two segments 1) develops application-specific standard products catering to diverse sectors and 2) develops customer-specific products primarily catering to the automotive sector. The Company has subsidiaries namely BAPL Rototech Pvt. Ltd., Sintex Logistics LLC and Sintex NP have specific strategic road maps for each.
Application-specific custom moulded products: As the name suggests, this vertical comprises niche solutions that address critical sectors that are high on any Indian Government’s Social and Economic Requirement priority namely water management (the famous Sintex Water Tanks), sewerage management, fuel management, resources for the rural sector, environment management, warehousing, electrical, building material and power theft, among others. As such a large part of the business volumes comes from Government tenders. As prudent de-risking, the Company has created distribution channels that address retail requirement mushrooming pan India. In 2017-18, this flagship revenue contributor, performed significantly well registering a healthy overall growth. This was owing to increasing acceptance of the Company’s new-age products and the Company’s efforts in widening its service quotient to customers – leading to customer delight.
Customer-specific custom moulding: Plastics vertical primarily caters to the automotive segment supplying various components to global OEMs operating in India. The uptick in the automobile segment provided significant impetus to the fortune of this business – larger number of orders from existing and new customers enabled the Company post a healthy revenue growth over the previous year. Improved orders from the electrical customers also contributed to business and profit growth. The Company continued to expand its capability matrix (inaugurated a new paint shop in South India) which facilitates in expanding in opportunity canvass. This augurs
well for sustaining the Company’s growth momentum over the coming years.
BAPL Rototech Pvt. Ltd.: The Company manufacturing of plastic Fuel Tanks, Diesel Exhaust Fluid (DEF)/Urea Tanks/Adblue Tanks and CV exterior parts Fender, Mud Guards, snorkels etc leveraging the technology from Rototech S.R.L., Italy. Even as the technology transfer from its JV partner is in progress, the Company registered a healthy performance in 2017-18 with revenue growing by 542.96% over the previous year.
Sintex Logistics LLC: Prior to the close of Sintex Wausaukee, the Group formed Sintex Logistics LLC (a step down subsidiary to Sintex-BAPL Limited) to sustain Sintex’s marketing presence in the US to service OEMs in North America. The foundation of this venture was pivoted on the supply of SMC parts from Sintex-BAPL Limited, Kalol to Cummins Power. In addition, the Company has also received confirmed orders from Alstom Transportation and Siemens Mobility to supply parts to them in 2018 enabling the start-up to register significant growth in the first full year of its operations.
Sintex NP: In 2017, the group activity has been strong in most of the companies, driven by most of its market segments with an acceleration during the second half in non-automotive sectors. So even as the topline grew at about 5% over the previous year, the net profit increased by more than 15% owing to an increase contribution of value-added products in the revenue mix and benefit arising out of the teams continued efforts in raising operational efficiencies.
The Company’s R&D efforts continued to operate aligned to Sintex NP’s strategic blueprint. Many projects initiated in 2016 relating to aeronautics, thermoplastic composite applications gathered momentum in the current year. Furthermore, the team deliberated extensively on plastronics issues with electronics solutions on soft supports. These efforts are expected to yield results over the medium term.
Sintex Wausaukee Composites Inc: Sintex Wausaukee is based on its expertise in manufacturing highly engineered composite and fiber-glass components across diverse OEM sectors (construction equipment, agriculture, medical injecting and mass transit).
However, a subdued business environment in key user sectors led to low business volumes. This coupled with operational expenses exerted considerable financial pressure on the Company. During 2017, the management could not make any significant headway in improving the performance of the Company. In Fall 2017, Sintex Wausaukee Composites (SWC) was sold to one of its major customer Carfair Composites USA Inc. in an asset sale of the Wausaukee WI and Gillett WI facilities and equipment culminating in the close of the Sintex Wausaukee Composites Inc. The sale of SWC to Carfair Composites USA Inc., was completed on 25 Sep 2017.
Sintex Prefab and Infra Ltd.: Fiscal 2017-18 was a good year for the Company having achieved considerable success in all product verticals of the Company’s presence namely Mass Housing, Prefabricated shelters, Sanitation and Sewage Treatment solutions.
In the Mass Housing Project vertical, the team successfully executed the Puducherry Slum Clearance Board, LDA Para projects, among others to customer satisfaction. In the prefabricated structure vertical, the team focused on executed heartening business volumes catering to diverse user segments namely Rural health, Portcabin Huts for Police Housing Board, Schools, Mid Day meal kitchen projects, Creche for children, Housing, Schools and Anganwadis etc.
CHANGES IN SUBSIDIARIES, ASSOCIATES AND JOINT VENTURES/WHOLLY OWNED SUBSIDIARIES
During the year under review, Sintex Wausaukee Composites Inc,
Amarange Inc. and Southgate Business Corp. ceased to be step down subsidiaries of the Company. Sintex France SAS and Sintex NP SAS, step down subsidiaries of the Company had been merged by absorption and the name has been changed from Sintex France SAS to Sintex NP. During the year under review, Sintex Austria B.V. merged with Sintex Holdings B.V. Further, Sintex Logistics LLC became step down subsidiary of the Company.
There was no other change during the year in the status of subsidiaries, associates and joint ventures/ wholly-owned subsidiaries.
PLASTIBELL PLANT ACQUISITION
SNP acquired a French plant in Dole from Plastibell, a PSB Group Company. The deal has enabled SNP to acquire all the tangible assets and the existing business with all the major customers such as Schneider, Bubendorff, Merck, Rossignol, Davey Bickforrd etc. This will further enhance the business in the non-automotive segment of SNP and increase the customer base.
DETAILS OF POLICY DEVELOPED AND IMPLEMENTED BY THE COMPANY ON ITS CORPORATE SOCIAL RESPONSIBILITY INITIATIVES
During the year under review, the provisions for Corporate Social Responsibility under Section 135(1) of the Companies Act, 2013 were not applicable to the Company.
INTERNAL FINANCIAL CONTROLS (“IFC”) AND THEIR ADEQUACY
As per the provisions of the Companies Act, 2013, the Directors have the responsibility for ensuring that the Company has implemented robust system / framework for IFCs to provide them with reasonable assurance regarding the adequacy and operating effectiveness of controls to enable the Directors to meet with their responsibility.
The Company has in place a sound financial control system and framework in place to ensure:
• The orderly and efficient conduct of its business,• Safeguarding of its assets,
• The prevention and detection of frauds and errors,
• The accuracy and completeness of the accounting records and
• The timely preparation of reliable financial information.
A formal documented IFC framework has been implemented by the Company. The Board regularly reviews the effectiveness of controls and takes necessary corrective actions where weaknesses are identified as a result of such reviews. This review covers entity level controls, process level controls, fraud risk controls and Information Technology environment. Based on this evaluation, there is nothing that has come to the attention of the Directors to indicate any material break down in the functioning of these controls, procedures or systems during the year. There have been no significant events during the year that have materially affected, or are reasonably likely to materially affect, our internal financial controls. The management has also come to a conclusion that the IFC and other financial reporting was effective during the year and is adequate considering the business operations of the Company.
AUDITORS AND AUDITORS’ REPORT
The Audit Committee and the Board of Directors in their respective meetings held on 16th July, 2018 have recommended appointment of M/s. B S R & Associates LLP, (FRN 116231W/W-100024), Chartered Accountants, Ahmedabad, as Statutory Auditors of the Company to fill the casual vacancy caused due to resignation of M/s. R. Choudhary & Associates, Chartered Accountants,
Ahmedabad subject to approval of the Members at the 3rd Annual General Meeting of the Company for a term of 5 years. Accordingly, a resolution, proposing appointment of M/s. B S R & Associates LLP, as Statutory Auditors of the Company for a term of five consecutive years i.e. from the Conclusion of 3rd Annual General Meeting till the conclusion of 8th Annual General Meeting of the Company pursuant to Section 139 of the Companies Act, 2013, forms part of notice calling 3rd Annual General Meeting of the Company.
In this regard, the Company has received a certificate to the effect that they satisfy the criteria provided under Section 141 of the Companies Act, 2013 and that the appointment, if any made, shall be in accordance with the applicable provisions of the Companies Act, 2013 and the rules framed thereunder.
Pursuant to Regulation 33(1)(d) of SEBI (Listing Obligations and Disclosure Requirements) Regulations, 2015, the Auditors have also confirmed that they have valid certificate issued by the Peer Review Board of the Institute of Chartered Accountants of India (ICAI).
There were no qualifications, observations, reservation or comments or other remarks in the Auditors Report, which have any adverse effect on the functioning of the Company. The notes on financial statement referred to in the Auditor’s Report are self-explanatory and do not call for any further comments. The Statutory Auditors have not reported any incident of fraud to the Audit Committee of the Company in the year under review.
SECRETARIAL AUDIT REPORT
Pursuant to the provisions of Section 204 of the Companies Act, 2013 and the Companies (Appointment and Remuneration of Managerial Personnel) Rules, 2014, the Company has appointed M/s. M. C. Gupta & Co., Company Secretaries, Ahmedabad to undertake the Secretarial Audit of the Company. The Secretarial Audit Report for the financial year 2017-18 is annexed herewith as ‘Annexure - A’. There were no qualifications, observations, reservation or comments or other remarks in the Secretarial Audit Report, which have any adverse effect on the functioning of the company.
DIRECTORS AND KEY MANAGERIAL PERSONNEL
Mr. Dinesh B. Patel, Director is due to retire by rotation at this Annual General Meeting in terms of Section 152(6) of the Companies Act, 2013 and is eligible for reappointment.
During the year under review, Mr. Kirit C. Shah and Ms. Namita R. Shah ceased to be Directors of the Company w.e.f. 14th September, 2017 due to resignation. Mrs. Indira J. Parikh was appointed as an Additional Director in the category of Independent Director of the Company w.e.f. 31st October, 2017. Mrs. Indira J. Parikh holds the office up to the ensuing Annual General Meeting. The Company has received notice from a Member pursuant to the provisions of Section 160 of the Companies Act, 2013 proposing her appointment as Director of the Company. The Board of Directors of the Company has recommended appointment of Mrs. Indira J. Parikh as Independent Director under the Companies Act, 2013, to hold office till the conclusion of the 5th Annual General Meeting of the Company in the calendar year 2020.
As stipulated under Regulation 36(3) of the Securities and Exchange Board of India (Listing Obligations and Disclosure Requirements) Regulations, 2015, brief profiles of the Directors proposed to be appointed, nature of their expertise in specific functional areas, names of the companies in which they hold directorships and shareholding are provided in the Notice attached forming part of the Annual Report.
The Independent Directors have been updated with their roles, rights and responsibilities in the Company by specifying them in their appointment letter along with necessary documents, reports and
Annual Report 2017 - 18 /54
internal policies to enable them to familiarise with the Company’s procedures and practices.
All Independent Directors have given declarations that they meet the criteria of Independence as laid down under Section 149(6) of the Companies Act, 2013 and the Securities and Exchange Board of India (Listing Obligations and Disclosure Requirements) Regulations, 2015.
During the year under review, Ms. Nimisha Modi ceased to be Manager of the Company w.e.f. 14th September, 2017 due to resignation. The Company has appointed Mr. Amit D. Patel as the Managing Director of the Company w.e.f. 15th September, 2017 subject to approval of Members of the Company at ensuing General Meeting. Consequent to resignation of Mr. Jaiminkumar Damani as Chief Financial Officer of the Company w.e.f. 14th September, 2017, the Company has appointed Mr. Gaurav Agrawal as the Chief Financial Officer of the Company w.e.f. 15th September, 2017.
DIRECTORS’ AND OFFICERS’ LIABILITY INSURANCE:
The Company has taken Directors’ and Officers’ Liability Policy to provide coverage against the liabilities arising on them.
BOARD EVALUATION
Pursuant to the provisions of the Companies Act, 2013 and the SEBI (Listing Obligations and Disclosure Requirements) Regulations, 2015, the Board has carried out through a structured evaluation process covering various aspects of the Board functioning such as composition of the Board & committees, experience & competencies, performance of specific duties & obligations, contribution at the meetings. The manner in which the evaluation has been carried out has been explained in the Corporate Governance Report, which forms part of the Annual Report.
DIRECTORS’ RESPONSIBILITY STATEMENT
To the best of knowledge and belief and according to the information and explanations obtained, your Directors make the following statements in terms of Section 134(3)(c) of the Companies Act, 2013 that:
(a) in the preparation of the annual accounts, the applicable accounting standards had been followed along with proper explanation relating to material departures;
(b) the Directors had selected such accounting policies and applied them consistently and made judgments and estimates that are reasonable and prudent so as to give a true and fair view of the state of affairs of the Company at the end of the financial year and of the profit and loss of the Company for that period;
(c) the Directors had taken proper and sufficient care for the maintenance of adequate accounting records in accordance with the provisions of the Companies Act, 2013 for safeguarding the assets of the Company and for preventing and detecting fraud and other irregularities;
(d) the Directors had prepared the annual accounts on a going concern basis; and
(e) the Directors had laid down internal financial controls to be followed by the Company and that such internal financial controls are adequate and were operating effectively;
(f) the systems to ensure compliance with the provisions of all applicable laws were in place and that such systems were adequate and operating effectively.
Sintex Plastics ESOP 2018
The Board of your Company at its Meeting held on 16th July, 2018, has approved Sintex Plastics Technology Limited -Employees Stock Option Plan-2018, which is subject to approval of Members at the ensuing Annual General Meeting. The Scheme is in compliance with the SEBI (Share Based Employee Benefits) Regulations, 2014. Details as specified by SEBI under Regulation 14 of the SEBI (Share Based Employee Benefits) Regulations, 2014 are available and will be available from time to time on website of the Company at the link http://www.sintexplastics.com/investors/.
Secretarial Standards
The Directors state that applicable Secretarial Standards, i.e. SS-1 and SS-2, relating to ‘Meetings of the Board of Directors’ and ‘General Meetings’, respectively, have been duly followed by the Company.
MEETINGS OF THE BOARD OF DIRECTORS
Regular meetings of the Board are held to discuss and decide on various business strategies, policies and other issues. During the year, 10 Board Meetings were convened and held on 6th May, 2017, 15th May, 2017, 30th May, 2017, 31st July, 2017, 9th August, 2017, 14th September, 2017, 31st October, 2017, 6th December, 2017, 11th January, 2018 and 2nd February, 2018. The intervening gap between the two consecutive meetings was not more than one hundred and twenty days. Detailed information on the Meetings of the Board is included in the Corporate Governance Report, which forms part of the Annual Report.
COMMITTEE OF BOARD OF DIRECTORS
In compliance with the requirements of applicable laws and as part of the best governance practice, the Company has following Committees of the Board as on 31st March, 2018:
i. Audit Committee
ii. Nomination and Remuneration Committee
iii. Stakeholders’ Relationship Committee
iv. Share & Debenture Transfer Committee
AUDIT COMMITTEE
The Committee consists of Members viz. Mr. Desh Raj Dogra (Chairman), Dr. Gauri S. Trivedi (Vice Chairperson), Mr. Amit D. Patel and Mrs. Indira J. Parikh. There were no instances, where recommendations of Audit Committee were not accepted by the Board of Directors.
The details of the Committees along with their composition, number of meetings held and attendance at the meetings are provided in the Corporate Governance Report.
INDEPENDENT DIRECTORS’ MEETING
The Independent Directors met on 11th January, 2018, without the attendance of Non-Independent Directors and members of the Management. The Independent Directors reviewed the performance of Non-Independent Directors and the Board as a whole; the performance of the Chairman of the Company, taking into account the views of Executive Directors and Non-Executive Directors and assessed the quality, quantity and timeliness of flow of information between the Company Management and the Board that is necessary for the Board to effectively and reasonably perform their duties.
EXTRA ORDINARY GENERAL MEETINGS / POSTAL BALLOT
During the year under review, 2 Extra Ordinary General Meetings were held on 10th May, 2017 and 11th May, 2017, for the purpose of shifting of Registered Office and approval under Sections 180 and 186 of the Companies Act, 2013 and other requisite matters of the Company.
Further, during the year under review, the Company sought the approval of the Members through postal ballot notice dated 2nd February, 2018 for Increase in Authorised Share Capital and Preferential Issue of Convertible Warrants. Said resolutions were passed with requisite majority on 10th March, 2018.
Consolidated financial statementsThe Board reviewed the affairs of the Company’s subsidiaries during the year at regular intervals. In accordance with section 129(3) of the Companies Act, 2013, the Company has prepared Consolidated Financial Statements of the Company and all its subsidiaries, which form part of this Annual Report. The Consolidated Financial Statements have been prepared on the basis of audited financial statements of the Company and its subsidiaries, as approved by their respective Board of Directors. Further a statement containing salient features of the Financial Statements of each subsidiary in Form AOC-1 forms part of the Consolidated Financial Statements. The statement also provides the details of performance and financial position of each subsidiary.
POLICIES
• Remuneration policy The Board has, on the recommendation of the Nomination &
Remuneration Committee framed a policy for selection and appointment of the Directors, the senior management and their remuneration. The details of remuneration policy are stated in the Corporate Governance Report.
• Code of Practices and Procedures for Fair Disclosure of Unpublished Price Sensitive Information
Pursuant to the Securities and Exchange Board of India (Prohibition of Insider Trading) Regulations, 2015, the Company adopted the Code of Practices and Procedures for Fair Disclosure of Unpublished Price Sensitive Information as per Regulation 8 set out in Schedule A to said regulations, in order to protect investors’ interest.
• Whistle blower policy The Company has adopted a Whistle Blower Policy through
which the Company encourages its employees to bring to the attention of Senior Management, including Audit Committee, any unethical behaviour and improper practices and wrongful conduct taking place in the Company. The details of the same is explained in the Corporate Governance Report and also posted on the website of the Company at the link http://www.sintexplastics.com/investors/policies/.
• Code of Conduct to Regulate, Monitor and Report Trading by Insiders
In pursuance to the Securities and Exchange Board of India (Prohibition of Insider Trading) Regulations, 2015, the Company adopted the Code of Conduct to regulate, monitor and report trading by the employees, insiders and connected person(s), in order to protect investors’ interest as approved by the Board in its meeting held on 9th August, 2017.
In pursuance to the Securities and Exchange Board of India (Listing Obligations and Disclosure Requirements) Regulations, 2015, the Company adopted Policy on Determination of Materiality of Events, Policy on Preservation of Documents
and Website Content Archival Policy in its meeting held on 9th August, 2017. The details of the said policies are forming part of the Corporate Governance Report.
Particulars of loans given, investments made, guarantees given and securities provided
Particulars of loans given, investments made, guarantees given and securities provided under Section 186 of the Companies Act, 2013 are provided in the standalone financial statement (Please refer to Note 4 & 5 to the standalone financial statement), which are proposed to be utilized for the general business purpose of the recipient.
Contracts and arrangements with related partiesNo transactions have been entered into by your Company with any related parties during the financial year 2017-18 and hence there are no information required to be provided under Section 134(3)(h) of the Companies Act, 2013 read with rule 8(2) of the Companies (Accounts) Rules, 2014 in form AOC-2 and under Section 188(2) of the Companies Act, 2013.
Significant and Material Orders impacting going concern basis passed by the regulators or courts or tribunals
No significant or material orders impacting going concern basis were passed by the regulators or courts or tribunals which impact the going concern status and Company’s operations in future.
Management Discussion and Analysis ReportThe Management Discussion and Analysis Report on the operations of the Company, as required under the SEBI (Listing Obligations and Disclosure Requirements) Regulations, 2015 is provided in a separate section and forms part of this Annual Report.
CORPORATE GOVERNANCE
Corporate Governance is, essentially, a philosophy. It encompasses not only the regulatory and legal requirements, but also the voluntary practices developed by the Company to protect the best interests of all stakeholders. The Company complies with all the Standards, Guidelines and Principles governing disclosures and obligations set out by the Securities and Exchange Board of India (SEBI) and the Stock Exchanges on corporate governance.
A separate report on Corporate Governance along with Statutory Auditor’s Certificate on compliance with the conditions of Corporate Governance as per Securities and Exchange Board of India (Listing Obligations and Disclosure Requirements) Regulations, 2015 with the Stock Exchanges is provided as a part of this Annual Report.
Your Company has made all information, required by investors, available on the Company’s website www.sintexplastics.com
EXTRACT OF THE ANNUAL RETURN
As required under the provisions of sub-section 3(a) of Section 134 and sub-section (3) of Section 92 of the Companies Act, 2013 read with Rule 12 of the Companies (Management and Administration) Rules, 2014, the extracts of annual return in Form No. MGT-9 forms part of this report as ‘Annexure - B’.
BUSINESS RESPONSIBILITY REPORT
The Business Responsibility Report for the year ended 31st March, 2018 as stipulated under Regulation 34 of the SEBI (Listing Obligations and Disclosure Requirements) Regulations, 2015 is annexed, which forms part of this report as ‘Annexure -C’
Risk Management
Annual Report 2017 - 18 /76
The Company recognizes that risk is an integral part of business and is committed to managing the risks in a proactive and efficient manner. During the year, the Board of Directors has reviewed the risks associated with the business of the Company, its root causes and the efficacy of the measures taken to mitigate the same. There are no risks which in the opinion of the Board threaten the existence of the Company.
CONSERVATION OF ENERGY, TECHNOLOGY ABSORPTION AND FOREIGN EXCHANGE EARNINGS AND OUTGO
During the year, since the Company was not engaged in manufacturing business. Hence, there is no such information which is required to be appended pursuant to Section 134(3)(m) of the Companies Act, 2013 read with Companies (Accounts) Rules, 2014.
Particulars of employeesThe information required pursuant to Section 197 read with Rule 5 of The Companies (Appointment and Remuneration of Managerial Personnel) Rules, 2014 in respect of employees of the Company, forms part of this report as ‘Annexure D’. Having regard to the provisions of the first proviso to Section 136(1) of the Act, this Annual Report is being sent to all the members and others entitled thereto, excluding the said annexure. Members who are interested in obtaining these particulars may write to the Company Secretary at the Registered Office of the Company. The aforesaid annexure is also available for inspection by members at the Registered Office of the Company, 21 days before the 3rd Annual General Meeting and up to the date of Annual General Meeting during business hours on working days.
GENERAL
Your Directors state that no disclosure or reporting is required in
respect of the following items as there were no transactions on these items during the year under review:
1. Details relating to deposits covered under Chapter V of the Companies Act, 2013.
2. Issue of equity shares with differential rights as to dividend, voting or otherwise.
3. Issue of shares (including sweat equity shares) to employees of the Company under any scheme.
Your Directors further state that during the year under review, there were no cases filed pursuant to the Sexual Harassment of Women at Workplace (Prevention, Prohibition and Redressal) Act, 2013.
ACKNOWLEDGEMENT
Your Directors would like to express their appreciation for the assistance and co-operation received from the Banks, Members, Esteemed Customers and Suppliers & Buyers during the year under review. Your Directors also wish to place on record their deep sense of appreciation for the committed services by the Employees of the Company.
BY ORDER OF THE BOARD OF DIRECTORS
Arun P. PatelDate: 16th July, 2018 ChairmanPlace: Ahmedabad DIN: 00830809
Annexure – “A” To Directors’ Report Form No. MR - 3
SECRETARIAL AUDIT REPORT
for the financial year ended 31st March, 2018[Pursuant to section 204(1) of the Companies Act, 2013 and Rule No.9 of the Companies (Appointment and Remuneration
of Managerial Personnel) Rules, 2014]
To,The Members,Sintex Plastics Technology Limited,In the Premises of Sintex- BAPL Limited,Near Seven Garnala,Kalol – 382 721 (Gujarat)
We have conducted the Secretarial Audit of the compliance of applicable statutory provisions and the adherence to good corporate practices by Sintex Plastics Technology Limited (CIN: U74120GJ2015PLC084071). Secretarial Audit was conducted in a manner that provided us a reasonable basis for evaluating the corporate conducts/statutory compliances and expressing my opinion thereon.
Based on our verification of the Company’s books, papers, minute books, forms and returns filed and other records maintained by the Company and also the information provided by the Company, its officers, agents and authorized representatives during the conduct of Secretarial Audit, we hereby report that in our opinion, the Company has, during the audit period covering the financial year ended on 31st March, 2018 complied with the statutory provisions listed hereunder and also that the Company has proper Board-processes and Compliance-mechanism in place to the extent, in the manner and subject to the reporting made hereinafter.
We have examined the books, papers, minute books, forms and returns filed and other records maintained by the Company, having its Registered Office at “In the Premises of Sintex- BAPL Limited, Near Seven Garnala, Kalol – 382 721 (Gujarat) for the financial year ended on 31st March, 2018 according to the provisions of:
(i) The Companies Act, 2013 (the Act) and the Rules made thereunder;
(ii) The Securities Contracts (Regulation) Act, 1956 (‘SCRA’) and the Rules made thereunder;
(iii) The Depositories Act, 1996 and the Regulations and Bye-laws framed thereunder;
(iv) Foreign Exchange Management Act, 1999 and the Rules and Regulations made thereunder to the extent of Foreign Direct Investment, Overseas Direct Investment and External Commercial Borrowings;
(v) The following Regulations and Guidelines prescribed under the Securities and Exchange Board of India Act, 1992 (‘SEBI Act’):
(a) The Securities and Exchange Board of India (Substantial Acquisition of Shares and Takeovers) Regulations, 2011;
(b) The Securities and Exchange Board of India (Prohibition of Insider Trading) Regulations, 2015;
(c) The Securities and Exchange Board of India (Issue of Capital and Disclosure Requirements) Regulations, 2009;
(d) The Securities and Exchange Board of India (Share Based Employee Benefits) Regulations, 2014; (Not applicable to the Company during the Audit Period)
(e) The Securities and Exchange Board of India (Issue and Listing of Debt Securities) Regulations, 2008; (Not applicable to the Company during the Audit Period)
(f) The Securities and Exchange Board of India (Registrars to an Issue and Share Transfer Agents) Regulations, 1993 regarding the Companies Act and dealing with client;
(g) The Securities and Exchange Board of India (Delisting of Equity Shares) Regulations, 2009; and (Not applicable to the Company during the Audit Period)
(h) The Securities and Exchange Board of India (Buyback of Securities) Regulations, 1998; (Not applicable to the Company during the Audit Period)
(vi) The Company having no major business activity, no other specific laws were applicable to the Company.
Annual Report 2017 - 18 /98
We have also examined compliance with the applicable clauses of the following:
(i) Secretarial Standards issued by The Institute of Company Secretaries of India.
(ii) Provisions of Securities and Exchange Board of India (Listing Obligations and Disclosure Requirements) Regulations, 2015.
During the period under review the Company has complied with the provisions of the Act, Rules, Regulations, Guidelines, Standards, etc. mentioned above.
We further report that
The Board of Directors of the Company is duly constituted with proper balance of Executive Directors, Non-Executive Directors and Independent Directors. The changes in the composition of the Board of Directors that took place during the period under review were carried out in compliance with the provisions of the Act.
Adequate notice is given to all Directors to schedule the Board Meetings, agenda and detailed notes on agenda were usually sent seven days in advance, and a system exists for seeking and obtaining further information and clarifications on the agenda items before the meeting and for meaningful participation at the meeting.
There were no dissenting views on any matters.
We further report that there are adequate systems and processes in the Company commensurate with the size and operations of the Company to monitor and ensure compliance with applicable laws, rules, regulations and guidelines.
We further report that during the audit period the Company has no specific events / actions having a major bearing on the Company’s affairs in pursuance of the above referred laws, rules, regulations, guidelines, standards, etc, except the following:
1. The Company had entered into a Composite Scheme of Arrangement with Sintex Industries Limited, Sintex-BAPL Limited, Sintex Prefab and Infra Limited and their respective shareholders and creditors having appointed date as 1st April, 2016. The Scheme had been approved by the Hon. National Company Law Tribunal, Ahmedabad Bench on 23rd March, 2017 and the effective date of the scheme was fixed as 12th May, 2017. Accordingly, the shareholders of Sintex Industries Limited have been issued 55,49,41,700 Equity Shares of the Company on 30th May, 2017. The said Scheme is under progressive implementation.
2. The above stated Equity Shares of the Company allotted on 30th May, 2017 were listed on BSE Limited and National Stock Exchange of India Limited as part of the Scheme. The CIN number issued by MCA is yet to be updated for its listed status.
3. The Company has two vertical through its Wholly Owned Subsidiaries (WOS) namely Sintex – BAPL Limited and of Sintex Prefab and Infra Limited and has ceased to be a subsidiary of Sintex Industries Limited as per the Composite Scheme of Arrangement.
4. The Company has allotted from time to time, aggregating to 3,91,53,388 Equity Shares of Re. 1/- each on conversion of FCCB issued by Sintex Industries Limited, the demerged Company as part of the Scheme.
5. The Company has on 10th March, 2018 through Postal ballot increased its Authorised Share Capital from ` 65 crores to ` 76 Crores and obtained permission of shareholders by way of Special Resolution to issue upto 6,67,00,000 Warrants on Preferential allotment basis convertible into one equity share of ` 1/- each at a premium of ` 89/- per share to Star Line Leasing Limited, one of the promoter group Companies. The Company, on 26th March, 2018 has allotted 2,04,33,334 Equity Shares on exercise of conversion of warrants in part, by the Warrant holder, during the year under review.
6. On 14th December, 2017, the Company has created a pledge on 49% of its equity investment in Sintex- BAPL Limited, the Wholly owned subsidiary, of the company in favour of Vistra ITCL (India) Limited, the Security Trustee to secure the term loan facility availed by Sintex- BAPL Limited.
Place: Ahmedabad Date: 16 July, 2018 For M. C. Gupta & Co, Company Secretaries UCN: S1986GJ003400
_______________ Mahesh C. Gupta Proprietor FCS: 2047 (CP: 1028)
Note: This Report is to be read with Our Letter of even date which is annexed as Annexure “A” and forms an integral part of this report.
Annexure: “A”
To,The Members,Sintex Plastics Technology Limited,In the Premises of Sintex- BAPL Limited,Near Seven Garnala,Kalol – 382 721 (Gujarat)
Our Report of even date is to be read along with this Letter;
1. Maintenance of Secretarial Record is the responsibility of the management of the Company. Our responsibility is to express an opinion on Secretarial Records based on our Audit.
2. We have followed the audit practices and processes as were appropriate to obtain reasonable assurance about the correctness of the contents of the Secretarial Records. The verification was done on test basis to ensure that correct facts are reflected in Secretarial records. We believe that the processes and practices, we followed provide a reasonable basis for our opinion.
3. We have not verified the correctness and appropriateness of financial records and books of accounts of the Company.
4. Wherever required, we have obtained the Management Representation about the compliance of laws, rules and regulations and happening of events etc.
5. The compliance of the provisions of Corporate and other applicable laws, rules, regulations, standards is the responsibility of the management. Our examination was limited to the verification of the procedures on test basis.
6. The Secretarial Audit report is neither an assurance as to the future viability of the Company nor of the efficacy or effectiveness with which the management has conducted the affairs of the Company.
Place: Ahmedabad Date: 16 July, 2018 For M. C. Gupta & Co, Company Secretaries UCN: S1986GJ003400
_______________ Mahesh C. Gupta Proprietor FCS: 2047 (CP: 1028)
Annual Report 2017 - 18 /1110
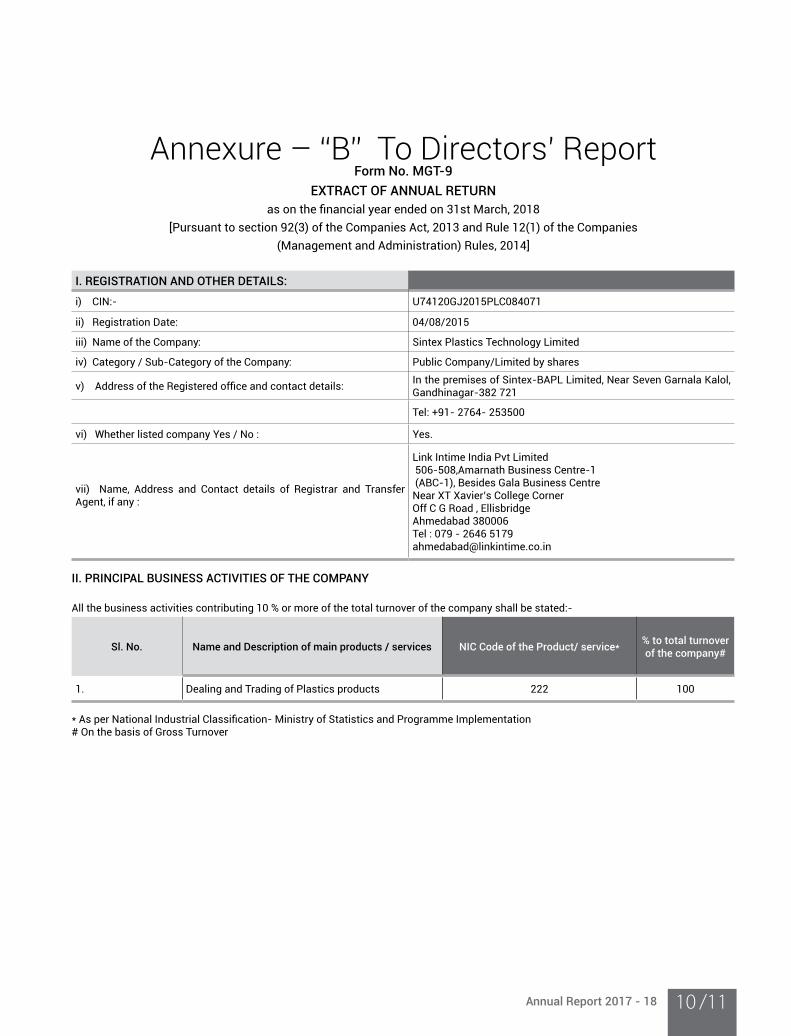
Annexure – “B” To Directors’ Report Form No. MGT-9
EXTRACT OF ANNUAL RETURNas on the financial year ended on 31st March, 2018
[Pursuant to section 92(3) of the Companies Act, 2013 and Rule 12(1) of the Companies
(Management and Administration) Rules, 2014]
I. REGISTRATION AND OTHER DETAILS:
i) CIN:- U74120GJ2015PLC084071
ii) Registration Date: 04/08/2015
iii) Name of the Company: Sintex Plastics Technology Limited
iv) Category / Sub-Category of the Company: Public Company/Limited by shares
v) Address of the Registered office and contact details: In the premises of Sintex-BAPL Limited, Near Seven Garnala Kalol, Gandhinagar-382 721
Tel: +91- 2764- 253500
vi) Whether listed company Yes / No : Yes.
vii) Name, Address and Contact details of Registrar and Transfer Agent, if any :
Link Intime India Pvt Limited 506-508,Amarnath Business Centre-1 (ABC-1), Besides Gala Business CentreNear XT Xavier’s College CornerOff C G Road , EllisbridgeAhmedabad 380006Tel : 079 - 2646 [email protected]
II. PRINCIPAL BUSINESS ACTIVITIES OF THE COMPANY
All the business activities contributing 10 % or more of the total turnover of the company shall be stated:-
Sl. No. Name and Description of main products / services NIC Code of the Product/ service* % to total turnover of the company#
1. Dealing and Trading of Plastics products 222 100
* As per National Industrial Classification- Ministry of Statistics and Programme Implementation# On the basis of Gross Turnover
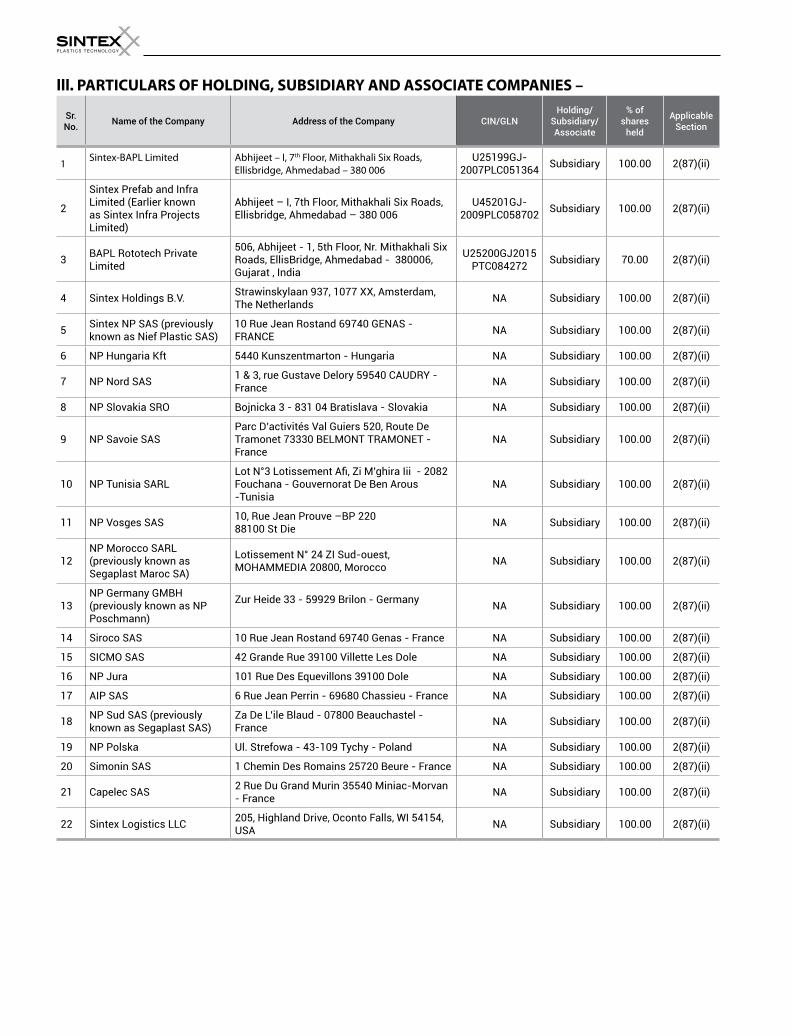
lll. PARTICULARS OF HOLDING, SUBSIDIARY AND ASSOCIATE COMPANIES –
Sr. No.
Name of the Company Address of the Company CIN/GLNHolding/
Subsidiary/ Associate
% of shares
held
Applicable Section
1Sintex-BAPL Limited Abhijeet – I, 7th Floor, Mithakhali Six Roads,
Ellisbridge, Ahmedabad – 380 006
U25199GJ-2007PLC051364
Subsidiary 100.00 2(87)(ii)
2
Sintex Prefab and Infra Limited (Earlier known as Sintex Infra Projects Limited)
Abhijeet – I, 7th Floor, Mithakhali Six Roads, Ellisbridge, Ahmedabad – 380 006
U45201GJ-2009PLC058702
Subsidiary 100.00 2(87)(ii)
3BAPL Rototech Private Limited
506, Abhijeet - 1, 5th Floor, Nr. Mithakhali Six Roads, EllisBridge, Ahmedabad - 380006, Gujarat , India
U25200GJ2015PTC084272
Subsidiary 70.00 2(87)(ii)
4 Sintex Holdings B.V. Strawinskylaan 937, 1077 XX, Amsterdam, The Netherlands
NA Subsidiary 100.00 2(87)(ii)
5Sintex NP SAS (previously known as Nief Plastic SAS)
10 Rue Jean Rostand 69740 GENAS - FRANCE
NA Subsidiary 100.00 2(87)(ii)
6 NP Hungaria Kft 5440 Kunszentmarton - Hungaria NA Subsidiary 100.00 2(87)(ii)
7 NP Nord SAS1 & 3, rue Gustave Delory 59540 CAUDRY - France
NA Subsidiary 100.00 2(87)(ii)
8 NP Slovakia SRO Bojnicka 3 - 831 04 Bratislava - Slovakia NA Subsidiary 100.00 2(87)(ii)
9 NP Savoie SASParc D’activités Val Guiers 520, Route De Tramonet 73330 BELMONT TRAMONET - France
NA Subsidiary 100.00 2(87)(ii)
10 NP Tunisia SARLLot N°3 Lotissement Afi, Zi M’ghira Iii - 2082 Fouchana - Gouvernorat De Ben Arous -Tunisia
NA Subsidiary 100.00 2(87)(ii)
11 NP Vosges SAS10, Rue Jean Prouve –BP 22088100 St Die
NA Subsidiary 100.00 2(87)(ii)
12NP Morocco SARL (previously known as Segaplast Maroc SA)
Lotissement N° 24 ZI Sud-ouest, MOHAMMEDIA 20800, Morocco
NA Subsidiary 100.00 2(87)(ii)
13NP Germany GMBH (previously known as NP Poschmann)
Zur Heide 33 - 59929 Brilon - GermanyNA Subsidiary 100.00 2(87)(ii)
14 Siroco SAS 10 Rue Jean Rostand 69740 Genas - France NA Subsidiary 100.00 2(87)(ii)
15 SICMO SAS 42 Grande Rue 39100 Villette Les Dole NA Subsidiary 100.00 2(87)(ii)
16 NP Jura 101 Rue Des Equevillons 39100 Dole NA Subsidiary 100.00 2(87)(ii)
17 AIP SAS 6 Rue Jean Perrin - 69680 Chassieu - France NA Subsidiary 100.00 2(87)(ii)
18NP Sud SAS (previously known as Segaplast SAS)
Za De L’ile Blaud - 07800 Beauchastel - France
NA Subsidiary 100.00 2(87)(ii)
19 NP Polska Ul. Strefowa - 43-109 Tychy - Poland NA Subsidiary 100.00 2(87)(ii)
20 Simonin SAS 1 Chemin Des Romains 25720 Beure - France NA Subsidiary 100.00 2(87)(ii)
21 Capelec SAS2 Rue Du Grand Murin 35540 Miniac-Morvan - France
NA Subsidiary 100.00 2(87)(ii)
22 Sintex Logistics LLC205, Highland Drive, Oconto Falls, WI 54154, USA
NA Subsidiary 100.00 2(87)(ii)
Annual Report 2017 - 18 /1312
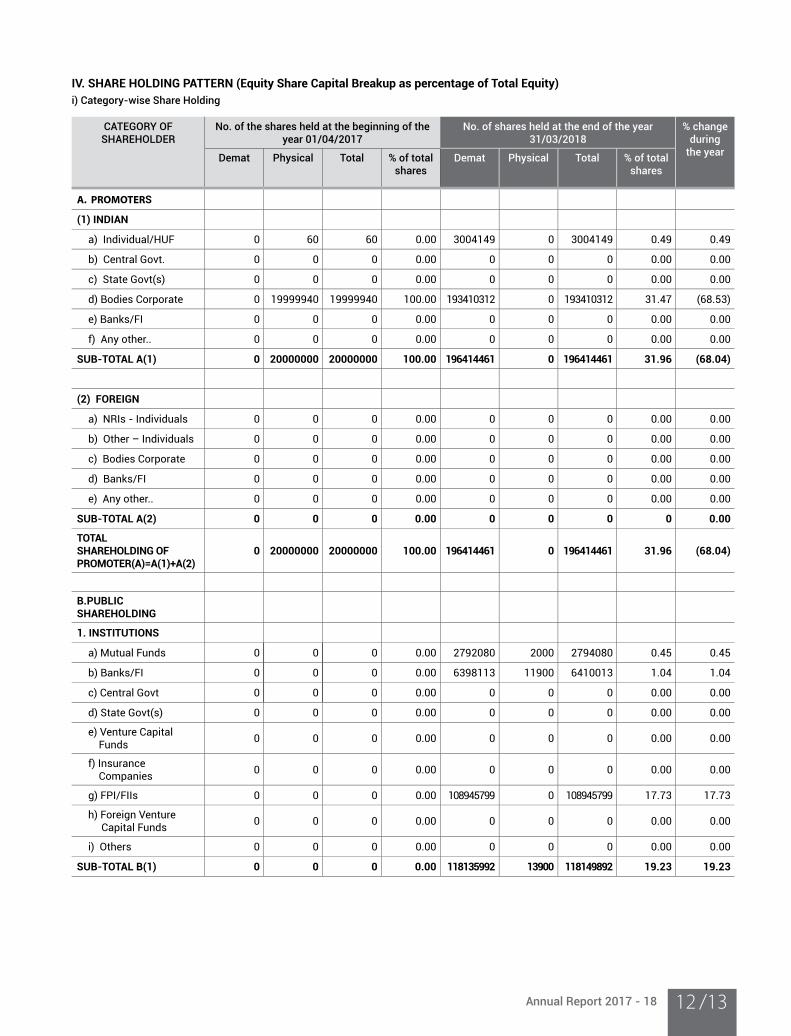
IV. SHARE HOLDING PATTERN (Equity Share Capital Breakup as percentage of Total Equity)
i) Category-wise Share Holding
CATEGORY OF SHAREHOLDER
No. of the shares held at the beginning of the year 01/04/2017
No. of shares held at the end of the year 31/03/2018
% change during
the yearDemat Physical Total % of total shares
Demat Physical Total % of total shares
A. PROMOTERS
(1) INDIAN
a) Individual/HUF 0 60 60 0.00 3004149 0 3004149 0.49 0.49
b) Central Govt. 0 0 0 0.00 0 0 0 0.00 0.00
c) State Govt(s) 0 0 0 0.00 0 0 0 0.00 0.00
d) Bodies Corporate 0 19999940 19999940 100.00 193410312 0 193410312 31.47 (68.53)
e) Banks/FI 0 0 0 0.00 0 0 0 0.00 0.00
f) Any other.. 0 0 0 0.00 0 0 0 0.00 0.00
SUB-TOTAL A(1) 0 20000000 20000000 100.00 196414461 0 196414461 31.96 (68.04)
(2) FOREIGN
a) NRIs - Individuals 0 0 0 0.00 0 0 0 0.00 0.00
b) Other – Individuals 0 0 0 0.00 0 0 0 0.00 0.00
c) Bodies Corporate 0 0 0 0.00 0 0 0 0.00 0.00
d) Banks/FI 0 0 0 0.00 0 0 0 0.00 0.00
e) Any other.. 0 0 0 0.00 0 0 0 0.00 0.00
SUB-TOTAL A(2) 0 0 0 0.00 0 0 0 0 0.00
TOTAL SHAREHOLDING OF PROMOTER(A)=A(1)+A(2)
0 20000000 20000000 100.00 196414461 0 196414461 31.96 (68.04)
B.PUBLIC SHAREHOLDING
1. INSTITUTIONS
a) Mutual Funds 0 0 0 0.00 2792080 2000 2794080 0.45 0.45
b) Banks/FI 0 0 0 0.00 6398113 11900 6410013 1.04 1.04
c) Central Govt 0 0 0 0.00 0 0 0 0.00 0.00
d) State Govt(s) 0 0 0 0.00 0 0 0 0.00 0.00
e) Venture Capital Funds
0 0 0 0.00 0 0 0 0.00 0.00
f) Insurance Companies
0 0 0 0.00 0 0 0 0.00 0.00
g) FPI/FIIs 0 0 0 0.00 108945799 0 108945799 17.73 17.73
h) Foreign Venture Capital Funds
0 0 0 0.00 0 0 0 0.00 0.00
i) Others 0 0 0 0.00 0 0 0 0.00 0.00
SUB-TOTAL B(1) 0 0 0 0.00 118135992 13900 118149892 19.23 19.23
CATEGORY OF SHAREHOLDER
No. of the shares held at the beginning of the year 01/04/2017
No. of shares held at the end of the year 31/03/2018
% change during
the yearDemat Physical Total % of total shares
Demat Physical Total % of total shares
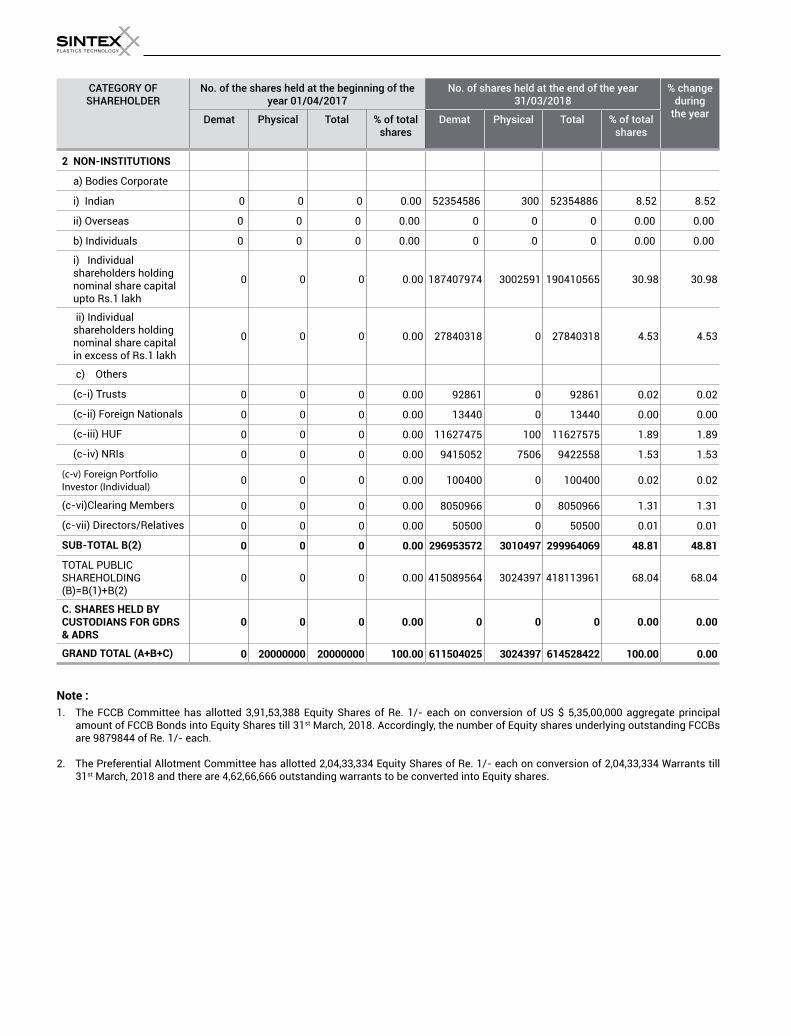
2 NON-INSTITUTIONS
a) Bodies Corporate
i) Indian 0 0 0 0.00 52354586 300 52354886 8.52 8.52
ii) Overseas 0 0 0 0.00 0 0 0 0.00 0.00
b) Individuals 0 0 0 0.00 0 0 0 0.00 0.00
i) Individual shareholders holding nominal share capital upto Rs.1 lakh
0 0 0 0.00 187407974 3002591 190410565 30.98 30.98
ii) Individual shareholders holding nominal share capital in excess of Rs.1 lakh
0 0 0 0.00 27840318 0 27840318 4.53 4.53
c) Others
(c-i) Trusts 0 0 0 0.00 92861 0 92861 0.02 0.02
(c-ii) Foreign Nationals 0 0 0 0.00 13440 0 13440 0.00 0.00
(c-iii) HUF 0 0 0 0.00 11627475 100 11627575 1.89 1.89
(c-iv) NRIs 0 0 0 0.00 9415052 7506 9422558 1.53 1.53
(c-v) Foreign Portfolio
Investor (Individual)0 0 0 0.00 100400 0 100400 0.02 0.02
(c-vi)Clearing Members 0 0 0 0.00 8050966 0 8050966 1.31 1.31
(c-vii) Directors/Relatives 0 0 0 0.00 50500 0 50500 0.01 0.01
SUB-TOTAL B(2) 0 0 0 0.00 296953572 3010497 299964069 48.81 48.81
TOTAL PUBLIC SHAREHOLDING (B)=B(1)+B(2)
0 0 0 0.00 415089564 3024397 418113961 68.04 68.04
C. SHARES HELD BY CUSTODIANS FOR GDRS & ADRS
0 0 0 0.00 0 0 0 0.00 0.00
GRAND TOTAL (A+B+C) 0 20000000 20000000 100.00 611504025 3024397 614528422 100.00 0.00
Note :
1. The FCCB Committee has allotted 3,91,53,388 Equity Shares of Re. 1/- each on conversion of US $ 5,35,00,000 aggregate principal amount of FCCB Bonds into Equity Shares till 31st March, 2018. Accordingly, the number of Equity shares underlying outstanding FCCBs are 9879844 of Re. 1/- each.
2. The Preferential Allotment Committee has allotted 2,04,33,334 Equity Shares of Re. 1/- each on conversion of 2,04,33,334 Warrants till 31st March, 2018 and there are 4,62,66,666 outstanding warrants to be converted into Equity shares.
Annual Report 2017 - 18 /1514
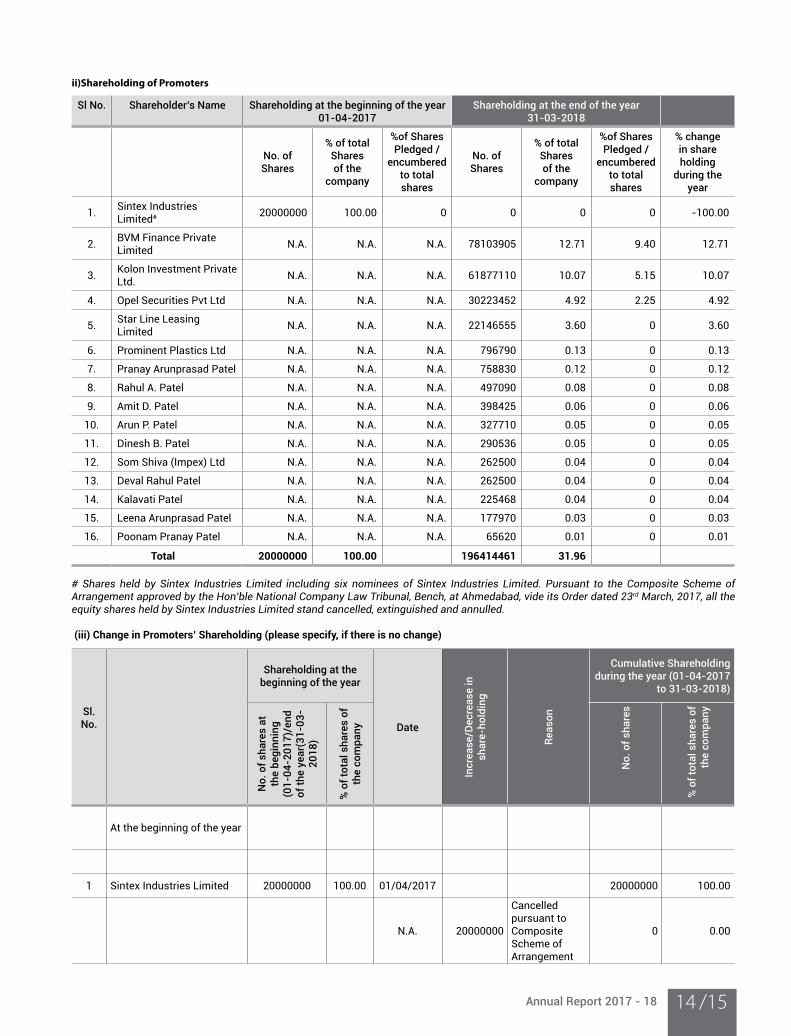
ii)Shareholding of Promoters
Sl No. Shareholder’s Name Shareholding at the beginning of the year 01-04-2017
Shareholding at the end of the year 31-03-2018
No. of Shares
% of total Shares of the
company
%of Shares Pledged /
encumbered to total shares
No. of Shares
% of total Shares of the
company
%of Shares Pledged /
encumbered to total shares
% change in share holding
during the year
1.Sintex Industries Limited# 20000000 100.00 0 0 0 0 -100.00
2.BVM Finance Private Limited
N.A. N.A. N.A. 78103905 12.71 9.40 12.71
3.Kolon Investment Private Ltd.
N.A. N.A. N.A. 61877110 10.07 5.15 10.07
4. Opel Securities Pvt Ltd N.A. N.A. N.A. 30223452 4.92 2.25 4.92
5.Star Line Leasing Limited
N.A. N.A. N.A. 22146555 3.60 0 3.60
6. Prominent Plastics Ltd N.A. N.A. N.A. 796790 0.13 0 0.13
7. Pranay Arunprasad Patel N.A. N.A. N.A. 758830 0.12 0 0.12
8. Rahul A. Patel N.A. N.A. N.A. 497090 0.08 0 0.08
9. Amit D. Patel N.A. N.A. N.A. 398425 0.06 0 0.06
10. Arun P. Patel N.A. N.A. N.A. 327710 0.05 0 0.05
11. Dinesh B. Patel N.A. N.A. N.A. 290536 0.05 0 0.05
12. Som Shiva (Impex) Ltd N.A. N.A. N.A. 262500 0.04 0 0.04
13. Deval Rahul Patel N.A. N.A. N.A. 262500 0.04 0 0.04
14. Kalavati Patel N.A. N.A. N.A. 225468 0.04 0 0.04
15. Leena Arunprasad Patel N.A. N.A. N.A. 177970 0.03 0 0.03
16. Poonam Pranay Patel N.A. N.A. N.A. 65620 0.01 0 0.01
Total 20000000 100.00 196414461 31.96
# Shares held by Sintex Industries Limited including six nominees of Sintex Industries Limited. Pursuant to the Composite Scheme of Arrangement approved by the Hon’ble National Company Law Tribunal, Bench, at Ahmedabad, vide its Order dated 23rd March, 2017, all the equity shares held by Sintex Industries Limited stand cancelled, extinguished and annulled.
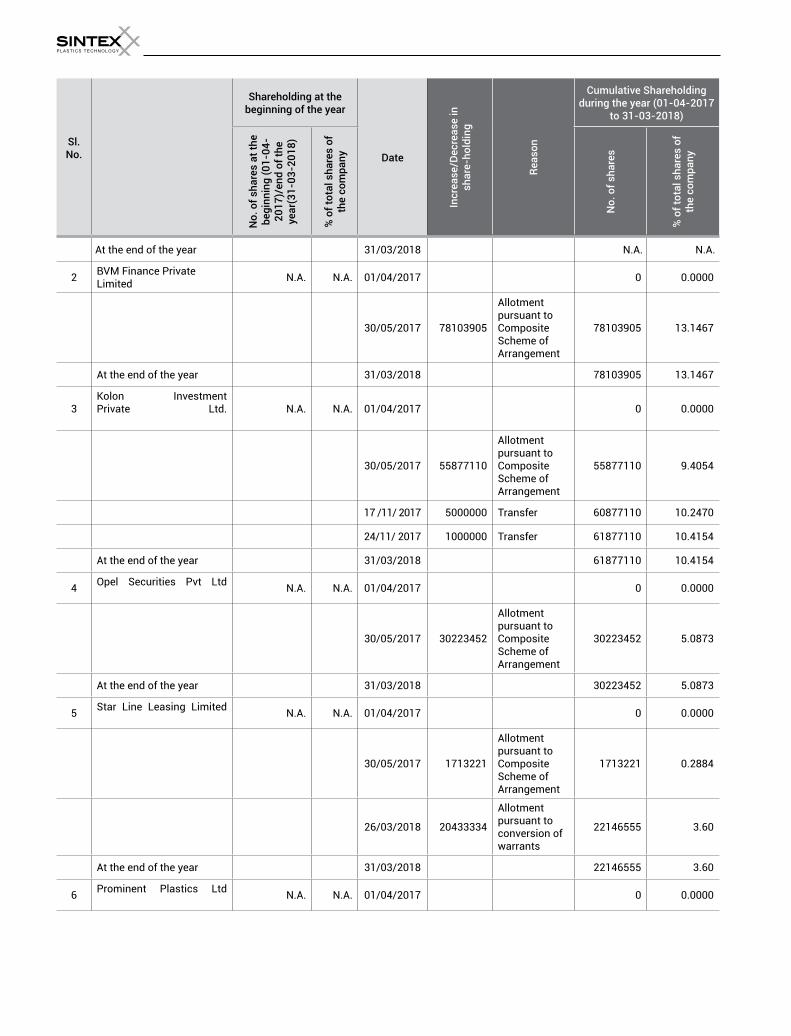
(iii) Change in Promoters’ Shareholding (please specify, if there is no change)
Sl. No.
Shareholding at the beginning of the year
Date
Incr
ease
/Dec
reas
e in
sh
are-
hold
ing
Rea
son
Cumulative Shareholding during the year (01-04-2017
to 31-03-2018)
No.
of s
hare
s at
th
e be
ginn
ing
(01-
04-2
017)
/end
of
the
year
(31-
03-
20
18
)
% o
f tot
al s
hare
s of
th
e co
mpa
ny
No.
of s
hare
s
% o
f tot
al s
hare
s of
th
e co
mpa
ny
At the beginning of the year
1 Sintex Industries Limited 20000000 100.00 01/04/2017 20000000 100.00
N.A. 20000000
Cancelled pursuant to Composite Scheme of Arrangement
0 0.00
Sl. No.
Shareholding at the beginning of the year
Date
Incr
ease
/Dec
reas
e in
sh
are-
hold
ing
Rea
son
Cumulative Shareholding during the year (01-04-2017
to 31-03-2018)
No.
of s
hare
s at
the
begi
nnin
g (0
1-04
-20
17)/
end
of th
e ye
ar(
31
-03
-20
18
)
% o
f tot
al s
hare
s of
th
e co
mpa
ny
No.
of s
hare
s
% o
f tot
al s
hare
s of
th
e co
mpa
ny
At the end of the year 31/03/2018 N.A. N.A.
2BVM Finance Private Limited
N.A. N.A. 01/04/2017 0 0.0000
30/05/2017 78103905
Allotment pursuant to Composite Scheme of Arrangement
78103905 13.1467
At the end of the year 31/03/2018 78103905 13.1467
3Kolon Investment Private Ltd.
N.A. N.A. 01/04/2017 0 0.0000
30/05/2017 55877110
Allotment pursuant to Composite Scheme of Arrangement
55877110 9.4054
17 /11/ 2017 5000000 Transfer 60877110 10.2470
24/11/ 2017 1000000 Transfer 61877110 10.4154
At the end of the year 31/03/2018 61877110 10.4154
4Opel Securities Pvt Ltd
N.A. N.A. 01/04/2017 0 0.0000
30/05/2017 30223452
Allotment pursuant to Composite Scheme of Arrangement
30223452 5.0873
At the end of the year 31/03/2018 30223452 5.0873
5Star Line Leasing Limited
N.A. N.A. 01/04/2017 0 0.0000
30/05/2017 1713221
Allotment pursuant to Composite Scheme of Arrangement
1713221 0.2884
26/03/2018 20433334
Allotment pursuant to conversion of warrants
22146555 3.60
At the end of the year 31/03/2018 22146555 3.60
6Prominent Plastics Ltd
N.A. N.A. 01/04/2017 0 0.0000
Annual Report 2017 - 18 /1716
Sl. No.
Shareholding at the beginning of the year
Date
Incr
ease
/Dec
reas
e in
sh
are-
hold
ing
Rea
son
Cumulative Shareholding during the year (01-04-2017
to 31-03-2018)
No.
of s
hare
s at
the
begi
nnin
g (0
1-04
-20
17)/
end
of th
e ye
ar(
31
-03
-20
18
)
% o
f tot
al s
hare
s of
th
e co
mpa
ny
No.
of s
hare
s
% o
f tot
al s
hare
s of
th
e co
mpa
ny
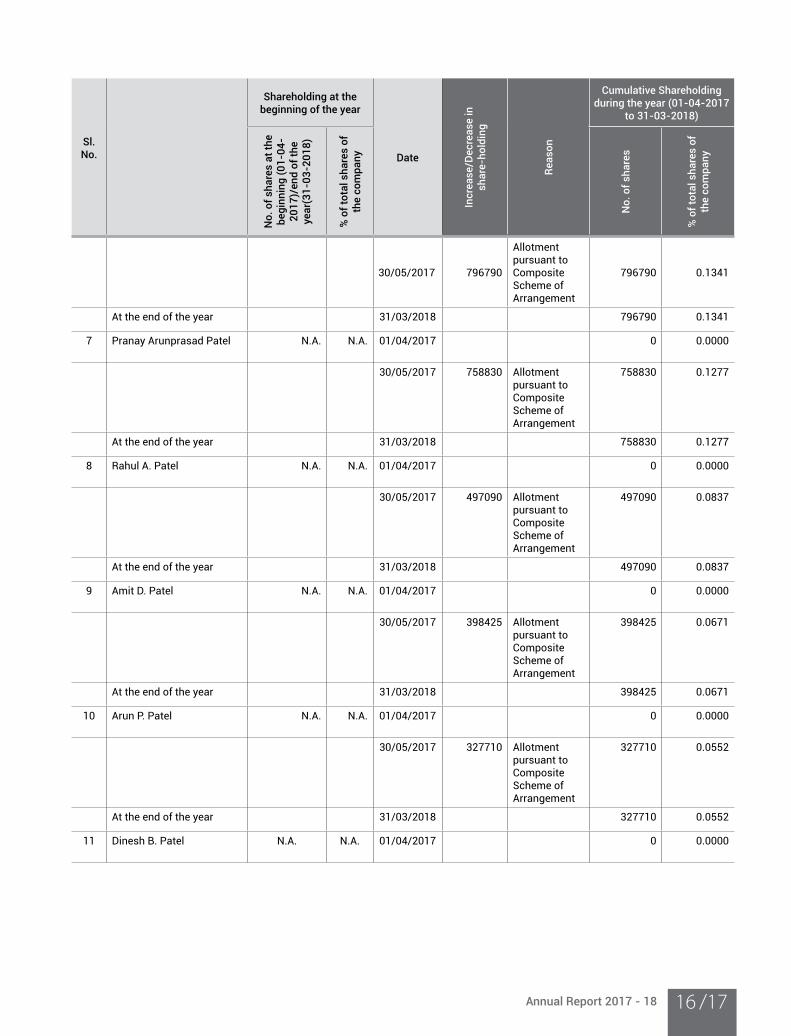
30/05/2017 796790
Allotment pursuant to Composite Scheme of Arrangement
796790 0.1341
At the end of the year 31/03/2018 796790 0.1341
7 Pranay Arunprasad Patel
N.A. N.A. 01/04/2017 0 0.0000
30/05/2017 758830 Allotment pursuant to Composite Scheme of Arrangement
758830 0.1277
At the end of the year 31/03/2018 758830 0.1277
8 Rahul A. Patel
N.A. N.A. 01/04/2017 0 0.0000
30/05/2017 497090 Allotment pursuant to Composite Scheme of Arrangement
497090 0.0837
At the end of the year 31/03/2018 497090 0.0837
9 Amit D. Patel
N.A. N.A. 01/04/2017 0 0.0000
30/05/2017 398425 Allotment pursuant to Composite Scheme of Arrangement
398425 0.0671
At the end of the year 31/03/2018 398425 0.0671
10 Arun P. Patel
N.A. N.A. 01/04/2017 0 0.0000
30/05/2017 327710 Allotment pursuant to Composite Scheme of Arrangement
327710 0.0552
At the end of the year 31/03/2018 327710 0.0552
11 Dinesh B. Patel
N.A. N.A. 01/04/2017 0 0.0000
Sl. No.
Shareholding at the beginning of the year
Date
Incr
ease
/Dec
reas
e in
sh
are-
hold
ing
Rea
son
Cumulative Shareholding during the year (01-04-2017
to 31-03-2018)
No.
of s
hare
s at
the
begi
nnin
g (0
1-04
-20
17)/
end
of th
e ye
ar(
31
-03
-20
18
)
% o
f tot
al s
hare
s of
th
e co
mpa
ny
No.
of s
hare
s
% o
f tot
al s
hare
s of
th
e co
mpa
ny
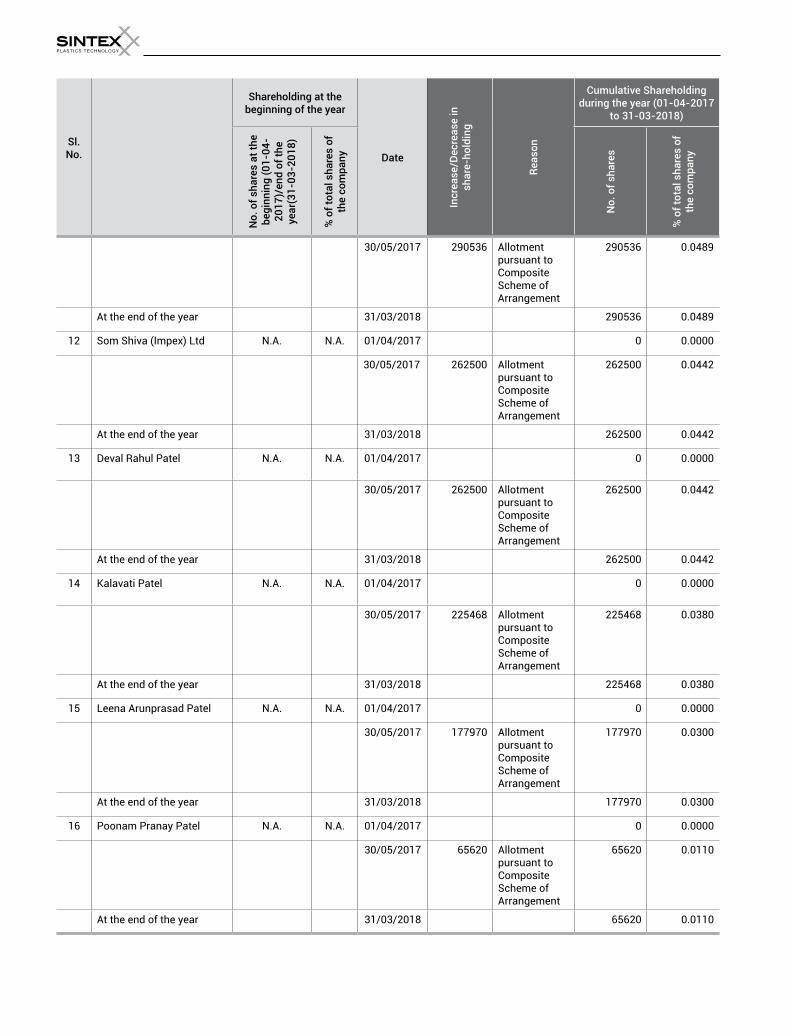
30/05/2017 290536 Allotment pursuant to Composite Scheme of Arrangement
290536 0.0489
At the end of the year 31/03/2018 290536 0.0489
12 Som Shiva (Impex) Ltd N.A. N.A. 01/04/2017 0 0.0000
30/05/2017 262500 Allotment pursuant to Composite Scheme of Arrangement
262500 0.0442
At the end of the year 31/03/2018 262500 0.0442
13 Deval Rahul Patel
N.A. N.A. 01/04/2017 0 0.0000
30/05/2017 262500 Allotment pursuant to Composite Scheme of Arrangement
262500 0.0442
At the end of the year 31/03/2018 262500 0.0442
14 Kalavati Patel
N.A. N.A. 01/04/2017 0 0.0000
30/05/2017 225468 Allotment pursuant to Composite Scheme of Arrangement
225468 0.0380
At the end of the year 31/03/2018 225468 0.0380
15 Leena Arunprasad Patel N.A. N.A. 01/04/2017 0 0.0000
30/05/2017 177970 Allotment pursuant to Composite Scheme of Arrangement
177970 0.0300
At the end of the year 31/03/2018 177970 0.0300
16 Poonam Pranay Patel N.A. N.A. 01/04/2017 0 0.0000
30/05/2017 65620 Allotment pursuant to Composite Scheme of Arrangement
65620 0.0110
At the end of the year 31/03/2018 65620 0.0110
Annual Report 2017 - 18 /1918
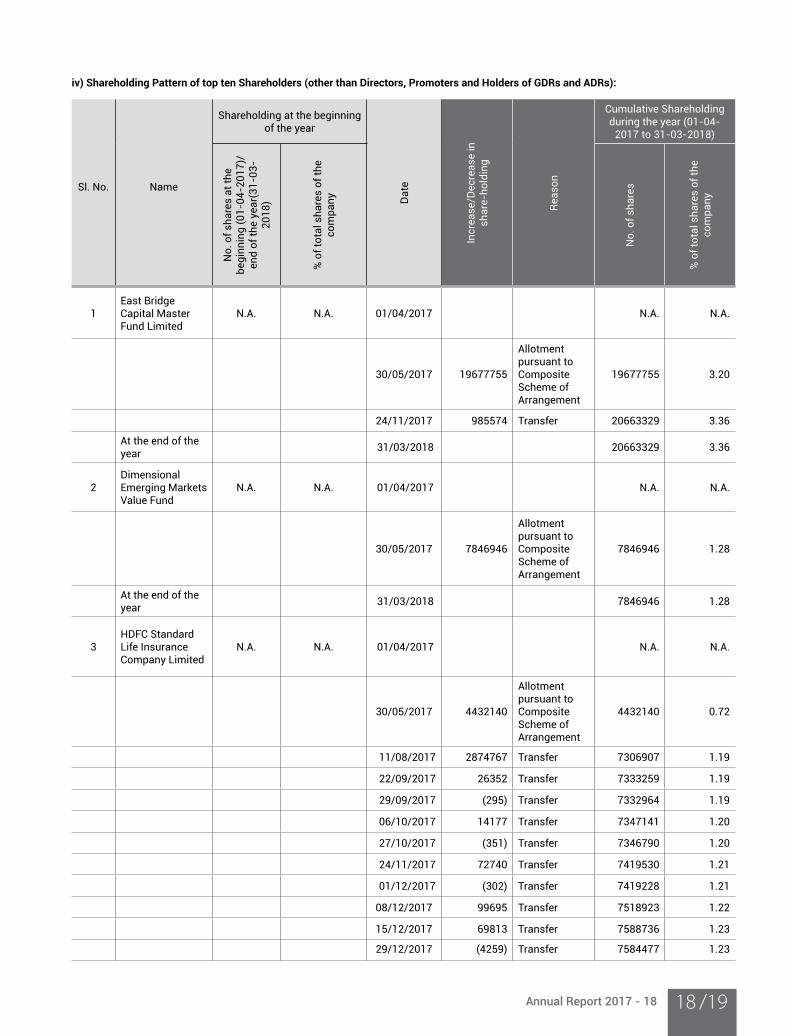
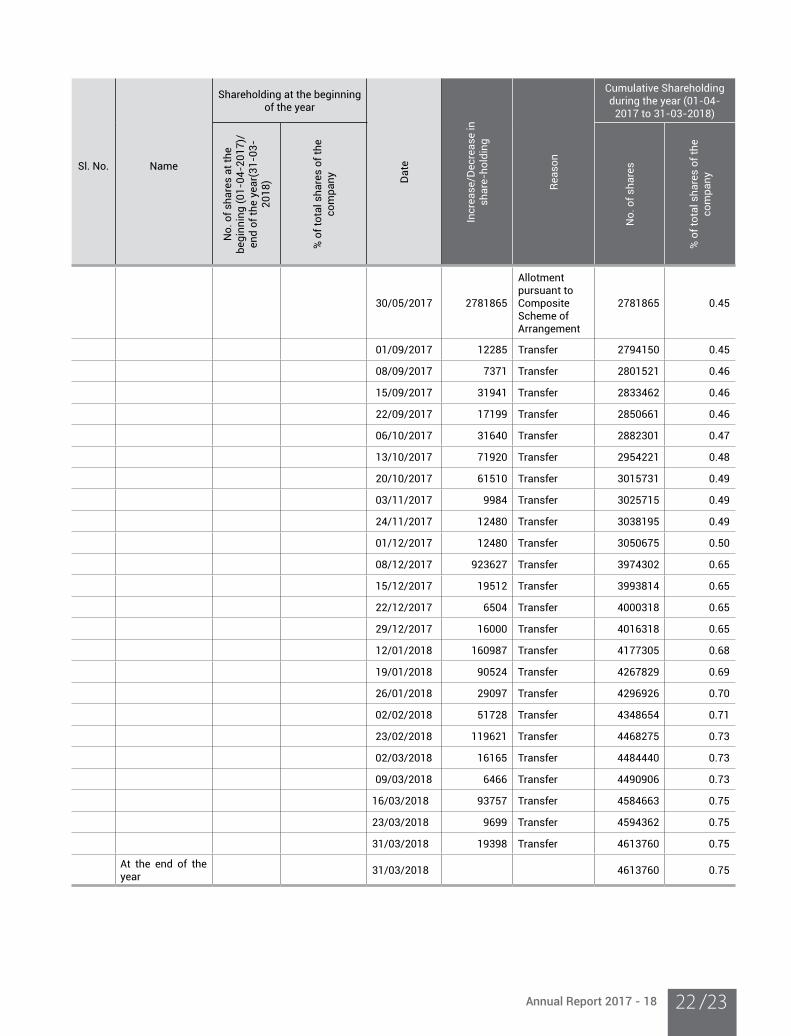
iv) Shareholding Pattern of top ten Shareholders (other than Directors, Promoters and Holders of GDRs and ADRs):
Sl. No.
Name
Shareholding at the beginning of the year
Da
te
Incr
ease
/Dec
rea
se in
sh
are
-ho
ldin
g
Rea
son
Cumulative Shareholding during the year (01-04-
2017 to 31-03-2018)
No
. of
sha
res
at
the
beg
inn
ing
(0
1-0
4-2
01
7)/
end
of
the
yea
r(3
1-0
3-
20
18
)
% o
f to
tal s
ha
res
of
the
com
pa
ny
No
. of
sha
res
% o
f to
tal s
ha
res
of
the
com
pa
ny
1East Bridge Capital Master Fund Limited
N.A. N.A. 01/04/2017 N.A. N.A.
30/05/2017 19677755
Allotment pursuant to Composite Scheme of Arrangement
19677755 3.20
24/11/2017 985574 Transfer 20663329 3.36
At the end of the year
31/03/2018 20663329 3.36
2Dimensional Emerging Markets Value Fund
N.A. N.A. 01/04/2017 N.A. N.A.
30/05/2017 7846946
Allotment pursuant to Composite Scheme of Arrangement
7846946 1.28
At the end of the year
31/03/2018 7846946 1.28
3HDFC Standard Life Insurance Company Limited
N.A. N.A. 01/04/2017 N.A. N.A.
30/05/2017 4432140
Allotment pursuant to Composite Scheme of Arrangement
4432140 0.72
11/08/2017 2874767 Transfer 7306907 1.19
22/09/2017 26352 Transfer 7333259 1.19
29/09/2017 (295) Transfer 7332964 1.19
06/10/2017 14177 Transfer 7347141 1.20
27/10/2017 (351) Transfer 7346790 1.20
24/11/2017 72740 Transfer 7419530 1.21
01/12/2017 (302) Transfer 7419228 1.21
08/12/2017 99695 Transfer 7518923 1.22
15/12/2017 69813 Transfer 7588736 1.23
29/12/2017 (4259) Transfer 7584477 1.23
Sl. No.
Name
Shareholding at the beginning of the year
Da
te
Incr
ease
/Dec
rea
se in
sh
are
-ho
ldin
g
Rea
son
Cumulative Shareholding during the year (01-04-
2017 to 31-03-2018)
No
. of
sha
res
at
the
beg
inn
ing
(0
1-0
4-2
01
7)/
end
of
the
yea
r(3
1-0
3-
20
18
)
% o
f to
tal s
ha
res
of
the
com
pa
ny
No
. of
sha
res
% o
f to
tal s
ha
res
of
the
com
pa
ny
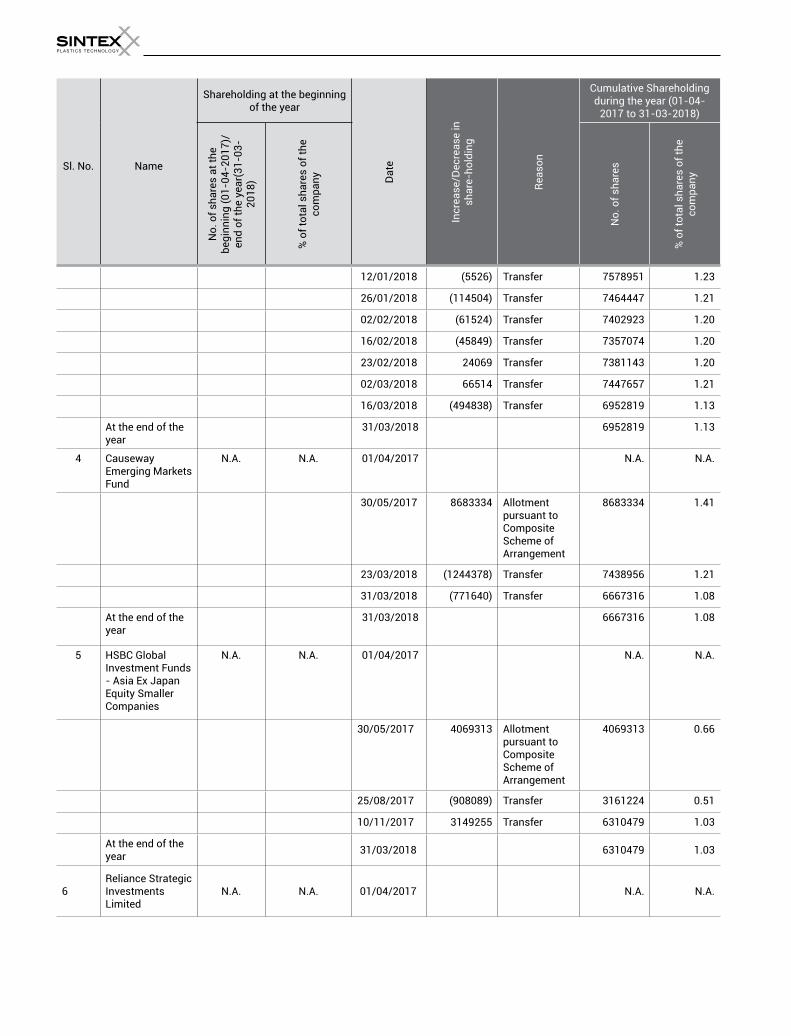
12/01/2018 (5526) Transfer 7578951 1.23
26/01/2018 (114504) Transfer 7464447 1.21
02/02/2018 (61524) Transfer 7402923 1.20
16/02/2018 (45849) Transfer 7357074 1.20
23/02/2018 24069 Transfer 7381143 1.20
02/03/2018 66514 Transfer 7447657 1.21
16/03/2018 (494838) Transfer 6952819 1.13
At the end of the year
31/03/2018 6952819 1.13
4 Causeway Emerging Markets Fund
N.A. N.A. 01/04/2017 N.A. N.A.
30/05/2017 8683334 Allotment pursuant to Composite Scheme of Arrangement
8683334 1.41
23/03/2018 (1244378) Transfer 7438956 1.21
31/03/2018 (771640) Transfer 6667316 1.08
At the end of the year
31/03/2018 6667316 1.08
5 HSBC Global Investment Funds - Asia Ex Japan Equity Smaller Companies
N.A. N.A. 01/04/2017 N.A. N.A.
30/05/2017 4069313 Allotment pursuant to Composite Scheme of Arrangement
4069313 0.66
25/08/2017 (908089) Transfer 3161224 0.51
10/11/2017 3149255 Transfer 6310479 1.03
At the end of the year
31/03/2018 6310479 1.03
6Reliance Strategic Investments Limited
N.A. N.A. 01/04/2017 N.A. N.A.
Annual Report 2017 - 18 /2120
Sl. No.
Name
Shareholding at the beginning of the year
Da
te
Incr
ease
/Dec
rea
se in
sh
are
-ho
ldin
g
Rea
son
Cumulative Shareholding during the year (01-04-
2017 to 31-03-2018)
No
. of
sha
res
at
the
beg
inn
ing
(0
1-0
4-2
01
7)/
end
of
the
yea
r(3
1-0
3-
20
18
)
% o
f to
tal s
ha
res
of
the
com
pa
ny
No
. of
sha
res
% o
f to
tal s
ha
res
of
the
com
pa
ny
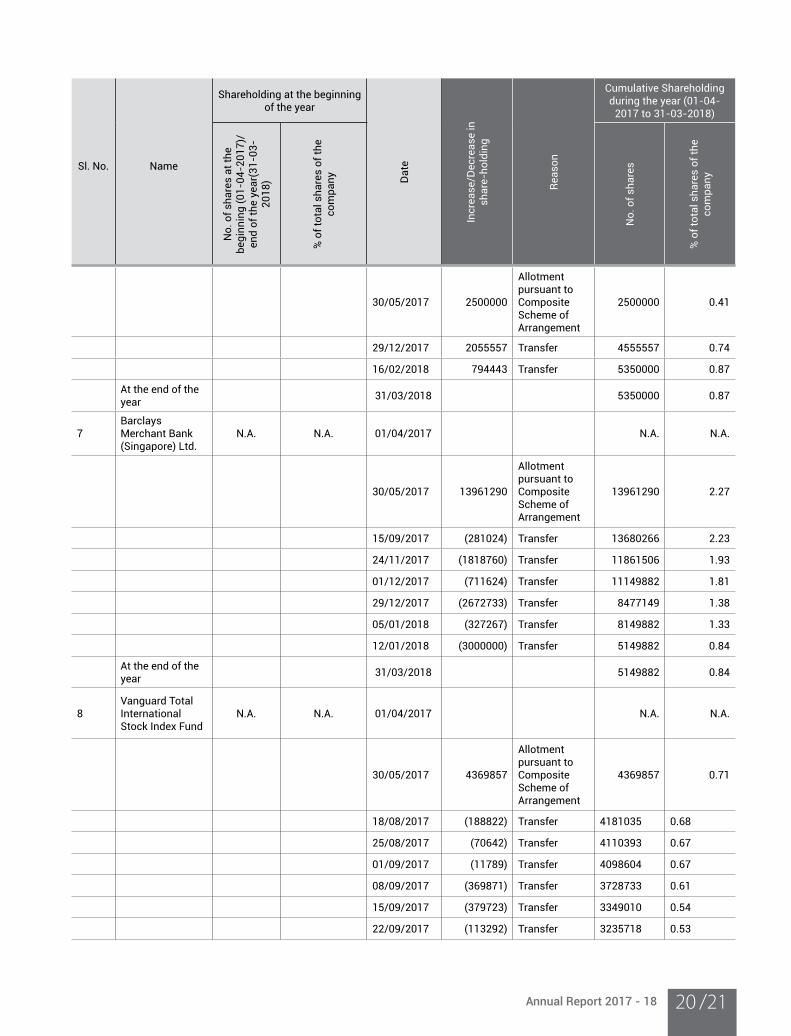
30/05/2017 2500000
Allotment pursuant to Composite Scheme of Arrangement
2500000 0.41
29/12/2017 2055557 Transfer 4555557 0.74
16/02/2018 794443 Transfer 5350000 0.87
At the end of the year
31/03/2018 5350000 0.87
7Barclays Merchant Bank (Singapore) Ltd.
N.A. N.A. 01/04/2017 N.A. N.A.
30/05/2017 13961290
Allotment pursuant to Composite Scheme of Arrangement
13961290 2.27
15/09/2017 (281024) Transfer 13680266 2.23
24/11/2017 (1818760) Transfer 11861506 1.93
01/12/2017 (711624) Transfer 11149882 1.81
29/12/2017 (2672733) Transfer 8477149 1.38
05/01/2018 (327267) Transfer 8149882 1.33
12/01/2018 (3000000) Transfer 5149882 0.84
At the end of the year
31/03/2018 5149882 0.84
8Vanguard Total International Stock Index Fund
N.A. N.A. 01/04/2017 N.A. N.A.
30/05/2017 4369857
Allotment pursuant to Composite Scheme of Arrangement
4369857 0.71
18/08/2017 (188822) Transfer 4181035 0.68
25/08/2017 (70642) Transfer 4110393 0.67
01/09/2017 (11789) Transfer 4098604 0.67
08/09/2017 (369871) Transfer 3728733 0.61
15/09/2017 (379723) Transfer 3349010 0.54
22/09/2017 (113292) Transfer 3235718 0.53
Sl. No.
Name
Shareholding at the beginning of the year
Da
te
Incr
ease
/Dec
rea
se in
sh
are
-ho
ldin
g
Rea
son
Cumulative Shareholding during the year (01-04-
2017 to 31-03-2018)
No
. of
sha
res
at
the
beg
inn
ing
(0
1-0
4-2
01
7)/
end
of
the
yea
r(3
1-0
3-
20
18
)
% o
f to
tal s
ha
res
of
the
com
pa
ny
No
. of
sha
res
% o
f to
tal s
ha
res
of
the
com
pa
ny
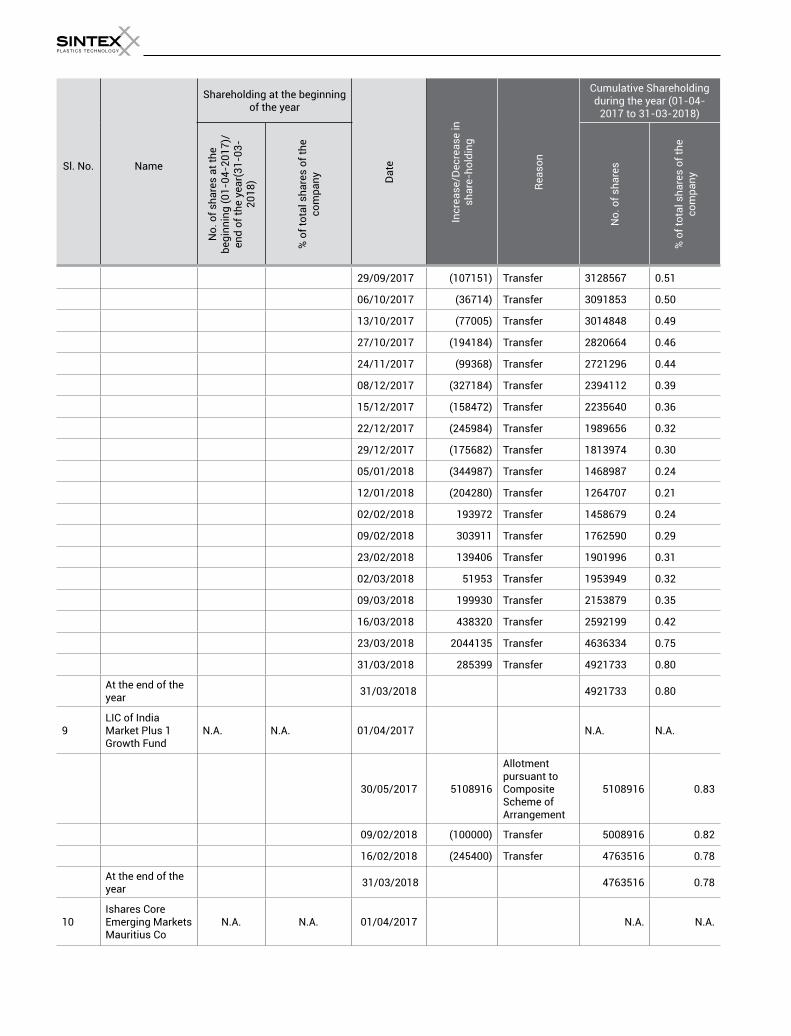
29/09/2017 (107151) Transfer 3128567 0.51
06/10/2017 (36714) Transfer 3091853 0.50
13/10/2017 (77005) Transfer 3014848 0.49
27/10/2017 (194184) Transfer 2820664 0.46
24/11/2017 (99368) Transfer 2721296 0.44
08/12/2017 (327184) Transfer 2394112 0.39
15/12/2017 (158472) Transfer 2235640 0.36
22/12/2017 (245984) Transfer 1989656 0.32
29/12/2017 (175682) Transfer 1813974 0.30
05/01/2018 (344987) Transfer 1468987 0.24
12/01/2018 (204280) Transfer 1264707 0.21
02/02/2018 193972 Transfer 1458679 0.24
09/02/2018 303911 Transfer 1762590 0.29
23/02/2018 139406 Transfer 1901996 0.31
02/03/2018 51953 Transfer 1953949 0.32
09/03/2018 199930 Transfer 2153879 0.35
16/03/2018 438320 Transfer 2592199 0.42
23/03/2018 2044135 Transfer 4636334 0.75
31/03/2018 285399 Transfer 4921733 0.80
At the end of the year
31/03/2018 4921733 0.80
9LIC of India Market Plus 1 Growth Fund
N.A. N.A. 01/04/2017 N.A. N.A.
30/05/2017 5108916
Allotment pursuant to Composite Scheme of Arrangement
5108916 0.83
09/02/2018 (100000) Transfer 5008916 0.82
16/02/2018 (245400) Transfer 4763516 0.78
At the end of the year
31/03/2018 4763516 0.78
10Ishares Core Emerging Markets Mauritius Co
N.A. N.A. 01/04/2017 N.A. N.A.
Annual Report 2017 - 18 /2322
Sl. No.
Name
Shareholding at the beginning of the year
Da
te
Incr
ease
/Dec
rea
se in
sh
are
-ho
ldin
g
Rea
son
Cumulative Shareholding during the year (01-04-
2017 to 31-03-2018)
No
. of
sha
res
at
the
beg
inn
ing
(0
1-0
4-2
01
7)/
end
of
the
yea
r(3
1-0
3-
20
18
)
% o
f to
tal s
ha
res
of
the
com
pa
ny
No
. of
sha
res
% o
f to
tal s
ha
res
of
the
com
pa
ny
30/05/2017 2781865
Allotment pursuant to Composite Scheme of Arrangement
2781865 0.45
01/09/2017 12285 Transfer 2794150 0.45
08/09/2017 7371 Transfer 2801521 0.46
15/09/2017 31941 Transfer 2833462 0.46
22/09/2017 17199 Transfer 2850661 0.46
06/10/2017 31640 Transfer 2882301 0.47
13/10/2017 71920 Transfer 2954221 0.48
20/10/2017 61510 Transfer 3015731 0.49
03/11/2017 9984 Transfer 3025715 0.49
24/11/2017 12480 Transfer 3038195 0.49
01/12/2017 12480 Transfer 3050675 0.50
08/12/2017 923627 Transfer 3974302 0.65
15/12/2017 19512 Transfer 3993814 0.65
22/12/2017 6504 Transfer 4000318 0.65
29/12/2017 16000 Transfer 4016318 0.65
12/01/2018 160987 Transfer 4177305 0.68
19/01/2018 90524 Transfer 4267829 0.69
26/01/2018 29097 Transfer 4296926 0.70
02/02/2018 51728 Transfer 4348654 0.71
23/02/2018 119621 Transfer 4468275 0.73
02/03/2018 16165 Transfer 4484440 0.73
09/03/2018 6466 Transfer 4490906 0.73
16/03/2018 93757 Transfer 4584663 0.75
23/03/2018 9699 Transfer 4594362 0.75
31/03/2018 19398 Transfer 4613760 0.75
At the end of the year
31/03/2018 4613760 0.75
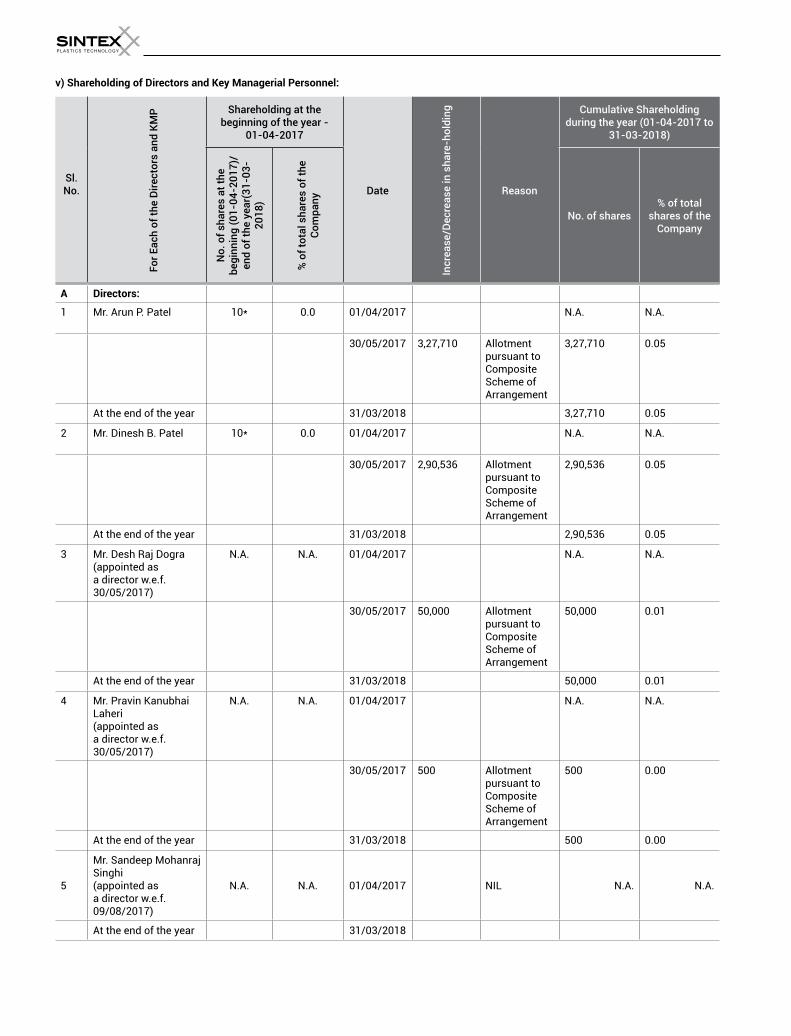
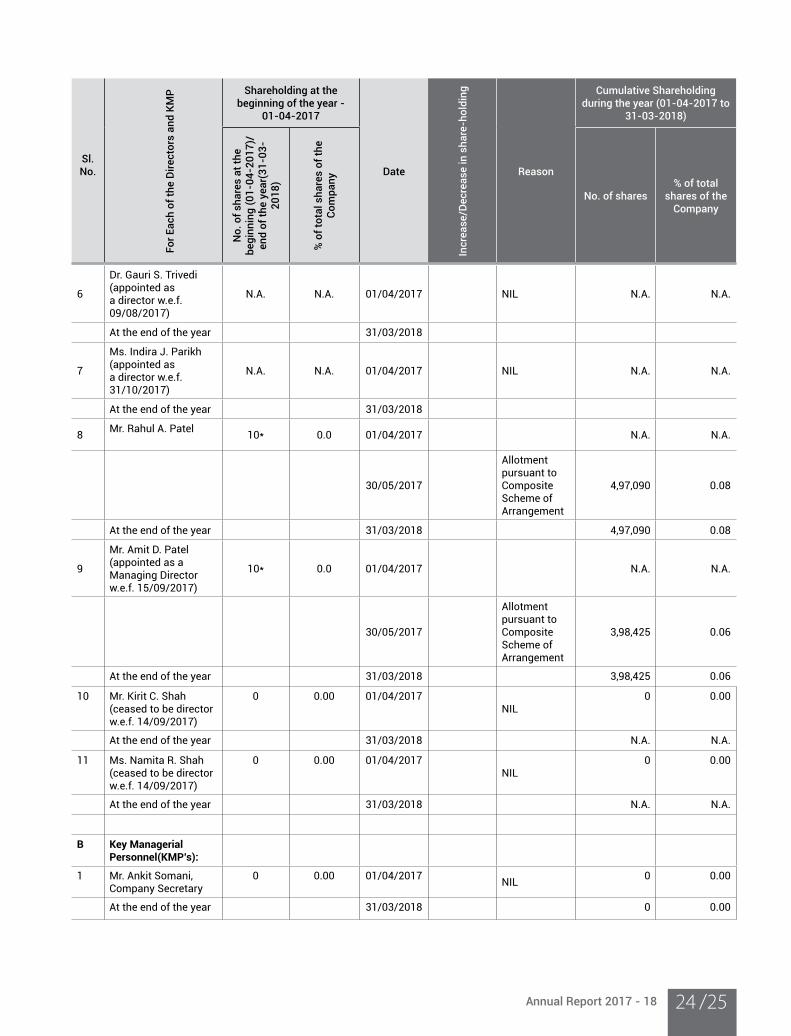
v) Shareholding of Directors and Key Managerial Personnel:
Sl. No.
Fo
r Eac
h of
the
Dire
ctor
s an
d KM
P Shareholding at the beginning of the year -
01-04-2017
Date
Incr
ease
/Dec
reas
e in
sha
re-h
oldi
ng
Reason
Cumulative Shareholding during the year (01-04-2017 to
31-03-2018)
No.
of s
hare
s at
the
begi
nnin
g (0
1-04
-201
7)/
end
of th
e ye
ar(3
1-03
-2
01
8)
% o
f tot
al s
hare
s of
the
Co
mp
an
y
No. of shares% of total
shares of the Company
A Directors:
1 Mr. Arun P. Patel 10* 0.0 01/04/2017 N.A. N.A.
30/05/2017 3,27,710 Allotment pursuant to Composite Scheme of Arrangement
3,27,710 0.05
At the end of the year 31/03/2018 3,27,710 0.05
2 Mr. Dinesh B. Patel 10* 0.0 01/04/2017 N.A. N.A.
30/05/2017 2,90,536 Allotment pursuant to Composite Scheme of Arrangement
2,90,536 0.05
At the end of the year 31/03/2018 2,90,536 0.05
3 Mr. Desh Raj Dogra (appointed as a director w.e.f. 30/05/2017)
N.A. N.A. 01/04/2017 N.A. N.A.
30/05/2017 50,000 Allotment pursuant to Composite Scheme of Arrangement
50,000 0.01
At the end of the year 31/03/2018 50,000 0.01
4 Mr. Pravin Kanubhai Laheri (appointed as a director w.e.f. 30/05/2017)
N.A. N.A. 01/04/2017 N.A. N.A.
30/05/2017 500 Allotment pursuant to Composite Scheme of Arrangement
500 0.00
At the end of the year 31/03/2018 500 0.00
5
Mr. Sandeep Mohanraj Singhi (appointed as a director w.e.f. 09/08/2017)
N.A. N.A. 01/04/2017 NIL N.A. N.A.
At the end of the year 31/03/2018
Annual Report 2017 - 18 /2524
Sl. No.
Fo
r Eac
h of
the
Dire
ctor
s an
d KM
P Shareholding at the beginning of the year -
01-04-2017
Date
Incr
ease
/Dec
reas
e in
sha
re-h
oldi
ng
Reason
Cumulative Shareholding during the year (01-04-2017 to
31-03-2018)
No.
of s
hare
s at
the
begi
nnin
g (0
1-04
-201
7)/
end
of th
e ye
ar(3
1-03
-2
01
8)
% o
f tot
al s
hare
s of
the
Co
mp
an
y
No. of shares% of total
shares of the Company
6
Dr. Gauri S. Trivedi (appointed as a director w.e.f. 09/08/2017)
N.A. N.A. 01/04/2017 NIL N.A. N.A.
At the end of the year 31/03/2018
7
Ms. Indira J. Parikh (appointed as a director w.e.f. 31/10/2017)
N.A. N.A. 01/04/2017 NIL N.A. N.A.
At the end of the year 31/03/2018
8Mr. Rahul A. Patel
10* 0.0 01/04/2017 N.A. N.A.
30/05/2017
Allotment pursuant to Composite Scheme of Arrangement
4,97,090 0.08
At the end of the year 31/03/2018 4,97,090 0.08
9
Mr. Amit D. Patel(appointed as a Managing Director w.e.f. 15/09/2017)
10* 0.0 01/04/2017 N.A. N.A.
30/05/2017
Allotment pursuant to Composite Scheme of Arrangement
3,98,425 0.06
At the end of the year 31/03/2018 3,98,425 0.06
10 Mr. Kirit C. Shah(ceased to be director w.e.f. 14/09/2017)
0 0.00 01/04/2017NIL
0 0.00
At the end of the year 31/03/2018 N.A. N.A.
11 Ms. Namita R. Shah (ceased to be director w.e.f. 14/09/2017)
0 0.00 01/04/2017NIL
0 0.00
At the end of the year 31/03/2018 N.A. N.A.
B Key Managerial Personnel(KMP’s):
1 Mr. Ankit Somani, Company Secretary
0 0.00 01/04/2017NIL
0 0.00
At the end of the year 31/03/2018 0 0.00
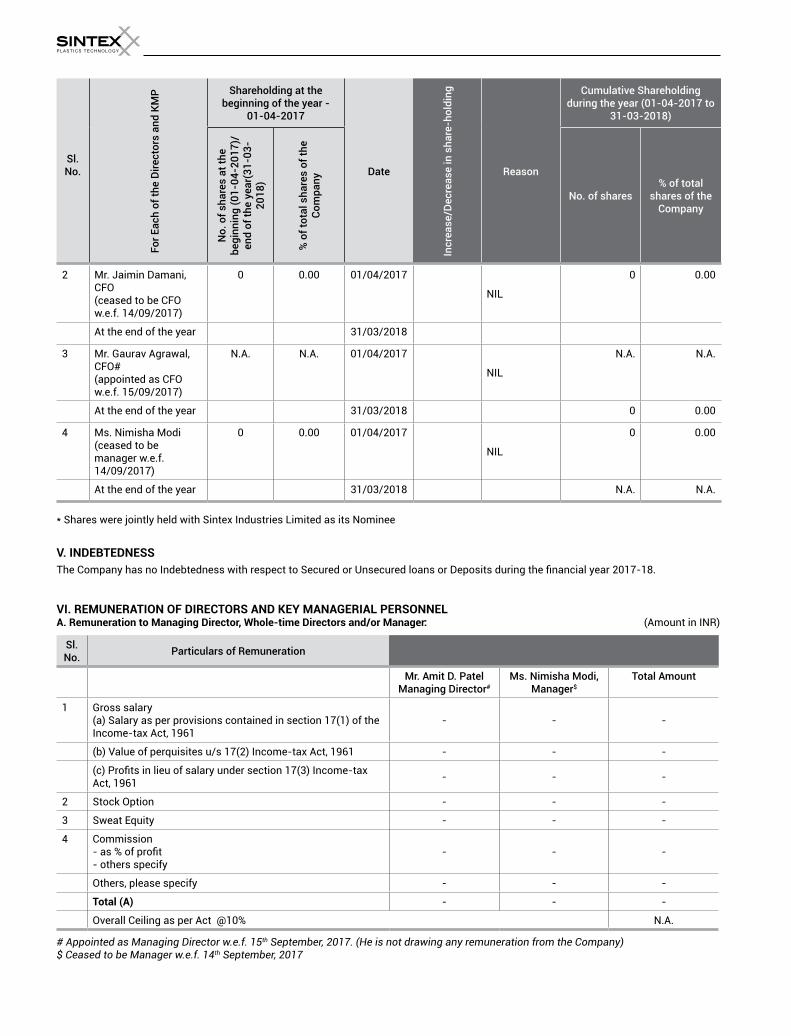
Sl. No.
Fo
r Eac
h of
the
Dire
ctor
s an
d KM
P Shareholding at the beginning of the year -
01-04-2017
Date
Incr
ease
/Dec
reas
e in
sha
re-h
oldi
ng
Reason
Cumulative Shareholding during the year (01-04-2017 to
31-03-2018)
No.
of s
hare
s at
the
begi
nnin
g (0
1-04
-201
7)/
end
of th
e ye
ar(3
1-03
-2
01
8)
% o
f tot
al s
hare
s of
the
Co
mp
an
y
No. of shares% of total
shares of the Company
2 Mr. Jaimin Damani, CFO (ceased to be CFO w.e.f. 14/09/2017)
0 0.00 01/04/2017
NIL
0 0.00
At the end of the year 31/03/2018
3 Mr. Gaurav Agrawal, CFO# (appointed as CFO w.e.f. 15/09/2017)
N.A. N.A. 01/04/2017
NIL
N.A. N.A.
At the end of the year 31/03/2018 0 0.00
4 Ms. Nimisha Modi (ceased to be manager w.e.f. 14/09/2017)
0 0.00 01/04/2017
NIL
0 0.00
At the end of the year 31/03/2018 N.A. N.A.
* Shares were jointly held with Sintex Industries Limited as its Nominee
V. INDEBTEDNESS
The Company has no Indebtedness with respect to Secured or Unsecured loans or Deposits during the financial year 2017-18.
VI. REMUNERATION OF DIRECTORS AND KEY MANAGERIAL PERSONNELA. Remuneration to Managing Director, Whole-time Directors and/or Manager: (Amount in INR)
Sl. No.
Particulars of Remuneration
Mr. Amit D. PatelManaging Director#
Ms. Nimisha Modi, Manager$
Total Amount
1 Gross salary (a) Salary as per provisions contained in section 17(1) of the Income-tax Act, 1961
- - -
(b) Value of perquisites u/s 17(2) Income-tax Act, 1961 - - -
(c) Profits in lieu of salary under section 17(3) Income-tax Act, 1961
- - -
2 Stock Option - - -
3 Sweat Equity - - -
4 Commission- as % of profit- others specify
- - -
Others, please specify - - -
Total (A) - - -
Overall Ceiling as per Act @10% N.A.
# Appointed as Managing Director w.e.f. 15th September, 2017. (He is not drawing any remuneration from the Company)$ Ceased to be Manager w.e.f. 14th September, 2017
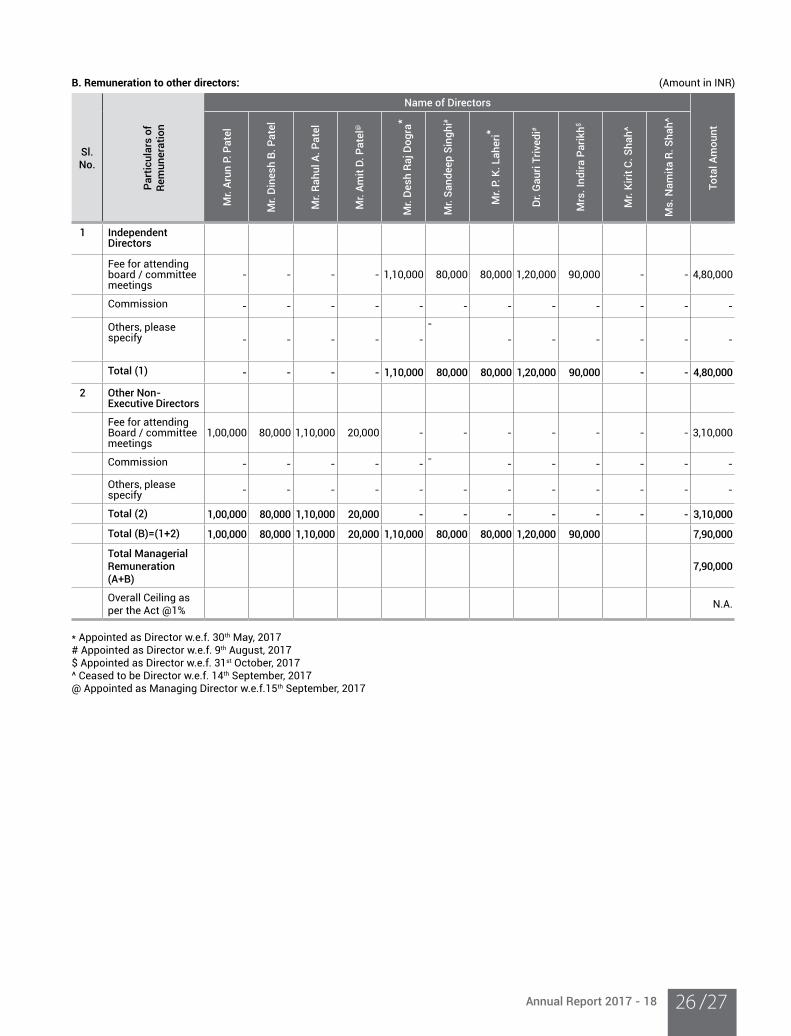
Annual Report 2017 - 18 /2726
B. Remuneration to other directors: (Amount in INR)
Sl. No.
Part
icul
ars
of
Rem
un
era
tio
n
Name of Directors
Tota
l Am
ount
Mr.
Arun
P. P
atel
Mr.
Din
esh
B. P
atel
Mr.
Rahu
l A. P
atel
Mr.
Amit
D. P
atel
@
Mr.
Des
h Ra
j Dog
ra*
Mr.
Sand
eep
Sing
hi#
Mr.
P. K
. Lah
eri*
Dr.
Gau
ri Tr
ived
i#
Mrs
. Ind
ira P
arik
h$
Mr.
Kirit
C. S
hah^
Ms.
Nam
ita R
. Sha
h^
1 Independent Directors
Fee for attending board / committee meetings
- - - - 1,10,000 80,000 80,000 1,20,000 90,000 - - 4,80,000
Commission - - - - - - - - - - - -
Others, please specify - - - - -
- - - - - - -
Total (1) - - - - 1,10,000 80,000 80,000 1,20,000 90,000 - - 4,80,000
2 Other Non-Executive Directors
Fee for attending Board / committee meetings
1,00,000 80,000 1,10,000 20,000 - - - - - - - 3,10,000
Commission - - - - - - - - - - - -
Others, please specify - - - - - - - - - - - -
Total (2) 1,00,000 80,000 1,10,000 20,000 - - - - - - - 3,10,000
Total (B)=(1+2) 1,00,000 80,000 1,10,000 20,000 1,10,000 80,000 80,000 1,20,000 90,000 7,90,000
Total Managerial Remuneration (A+B)
7,90,000
Overall Ceiling as per the Act @1%
N.A.
* Appointed as Director w.e.f. 30th May, 2017# Appointed as Director w.e.f. 9th August, 2017$ Appointed as Director w.e.f. 31st October, 2017^ Ceased to be Director w.e.f. 14th September, 2017@ Appointed as Managing Director w.e.f.15th September, 2017
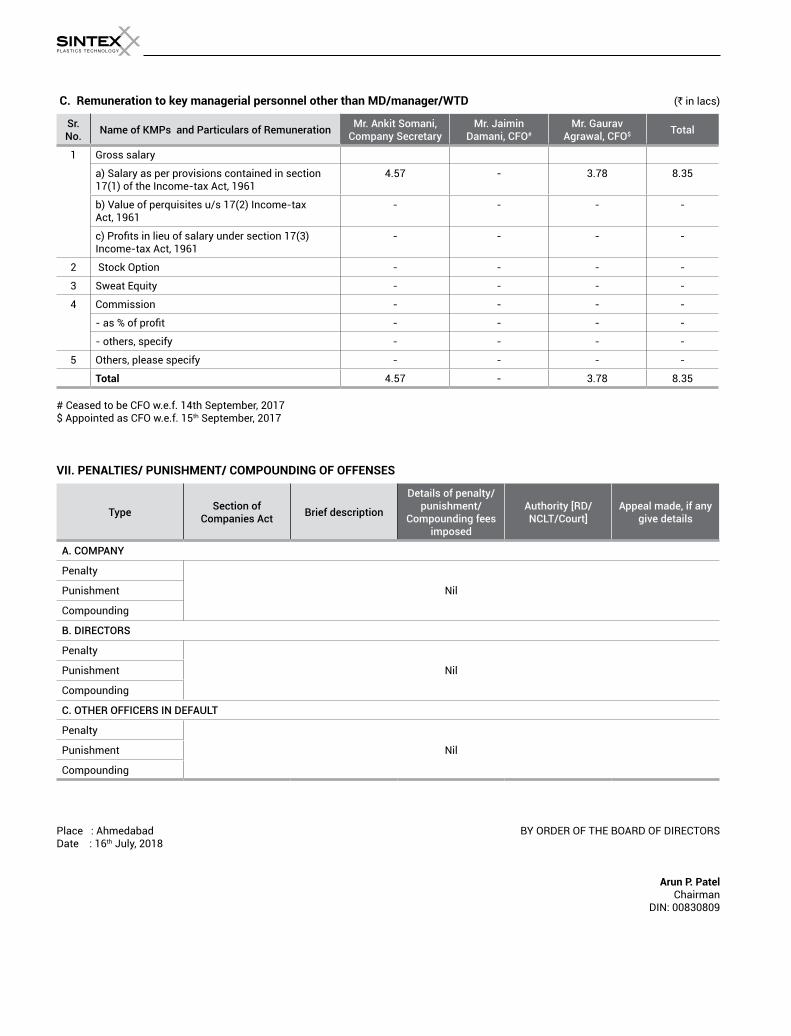
C. Remuneration to key managerial personnel other than MD/manager/WTD (` in lacs)
Sr.No.
Name of KMPs and Particulars of Remuneration Mr. Ankit Somani, Company Secretary
Mr. Jaimin Damani, CFO#
Mr. Gaurav Agrawal, CFO$ Total
1 Gross salary
a) Salary as per provisions contained in section17(1) of the Income-tax Act, 1961
4.57 - 3.78 8.35
b) Value of perquisites u/s 17(2) Income-taxAct, 1961
- - - -
c) Profits in lieu of salary under section 17(3)Income-tax Act, 1961
- - - -
2 Stock Option - - - -
3 Sweat Equity - - - -
4 Commission - - - -
- as % of profit - - - -
- others, specify - - - -
5 Others, please specify - - - -
Total 4.57 - 3.78 8.35
# Ceased to be CFO w.e.f. 14th September, 2017$ Appointed as CFO w.e.f. 15th September, 2017
VII. PENALTIES/ PUNISHMENT/ COMPOUNDING OF OFFENSES
Type Section of Companies Act
Brief description
Details of penalty/punishment/
Compounding fees imposed
Authority [RD/ NCLT/Court]
Appeal made, if any give details
A. COMPANY
Penalty
NilPunishment
Compounding
B. DIRECTORS
Penalty
NilPunishment
Compounding
C. OTHER OFFICERS IN DEFAULT
Penalty
NilPunishment
Compounding
Place : Ahmedabad BY ORDER OF THE BOARD OF DIRECTORSDate : 16th July, 2018 Arun P. Patel Chairman
DIN: 00830809
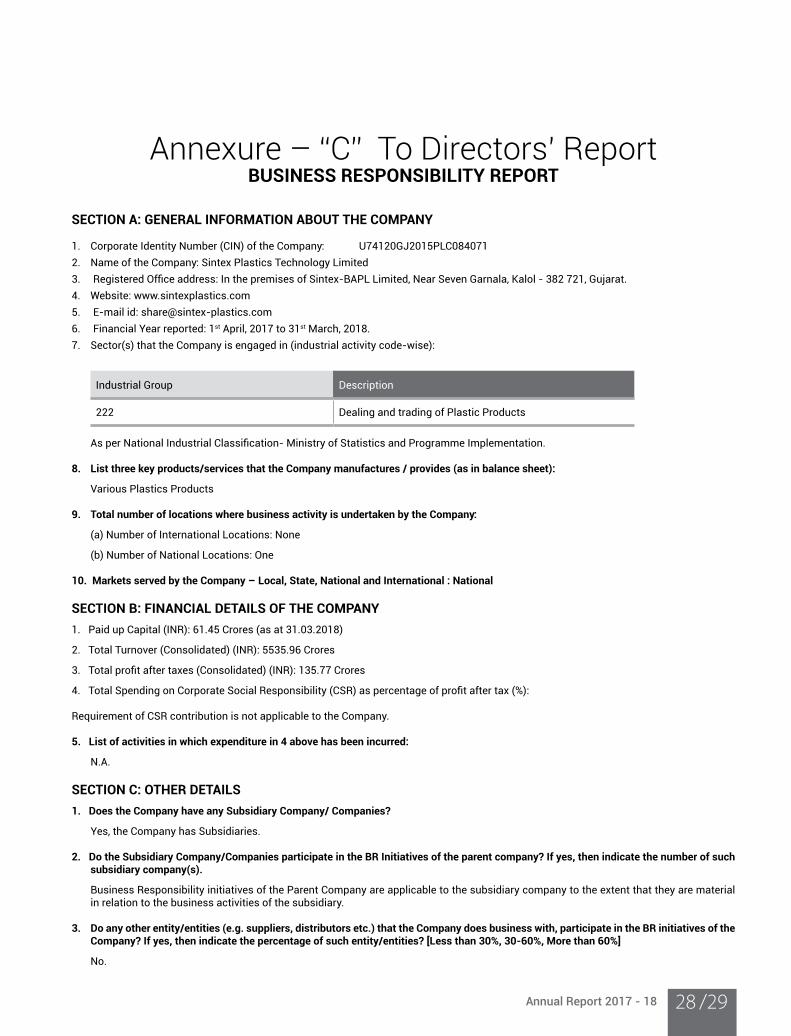
Annual Report 2017 - 18 /2928
SECTION A: GENERAL INFORMATION ABOUT THE COMPANY
1. Corporate Identity Number (CIN) of the Company: U74120GJ2015PLC084071
2. Name of the Company: Sintex Plastics Technology Limited
3. Registered Office address: In the premises of Sintex-BAPL Limited, Near Seven Garnala, Kalol - 382 721, Gujarat. 4. Website: www.sintexplastics.com
5. E-mail id: [email protected]
6. Financial Year reported: 1st April, 2017 to 31st March, 2018.
7. Sector(s) that the Company is engaged in (industrial activity code-wise):
Industrial Group Description
222 Dealing and trading of Plastic Products
As per National Industrial Classification- Ministry of Statistics and Programme Implementation.
8. List three key products/services that the Company manufactures / provides (as in balance sheet):
Various Plastics Products
9. Total number of locations where business activity is undertaken by the Company:
(a) Number of International Locations: None
(b) Number of National Locations: One
10. Markets served by the Company – Local, State, National and International : National
SECTION B: FINANCIAL DETAILS OF THE COMPANY
1. Paid up Capital (INR): 61.45 Crores (as at 31.03.2018)
2. Total Turnover (Consolidated) (INR): 5535.96 Crores
3. Total profit after taxes (Consolidated) (INR): 135.77 Crores
4. Total Spending on Corporate Social Responsibility (CSR) as percentage of profit after tax (%):
Requirement of CSR contribution is not applicable to the Company.
5. List of activities in which expenditure in 4 above has been incurred:
N.A.
SECTION C: OTHER DETAILS
1. Does the Company have any Subsidiary Company/ Companies?
Yes, the Company has Subsidiaries.
2. Do the Subsidiary Company/Companies participate in the BR Initiatives of the parent company? If yes, then indicate the number of such subsidiary company(s).
Business Responsibility initiatives of the Parent Company are applicable to the subsidiary company to the extent that they are material in relation to the business activities of the subsidiary.
3. Do any other entity/entities (e.g. suppliers, distributors etc.) that the Company does business with, participate in the BR initiatives of the Company? If yes, then indicate the percentage of such entity/entities? [Less than 30%, 30-60%, More than 60%]
No.
Annexure – “C” To Directors’ ReportBUSINESS RESPONSIBILITY REPORT
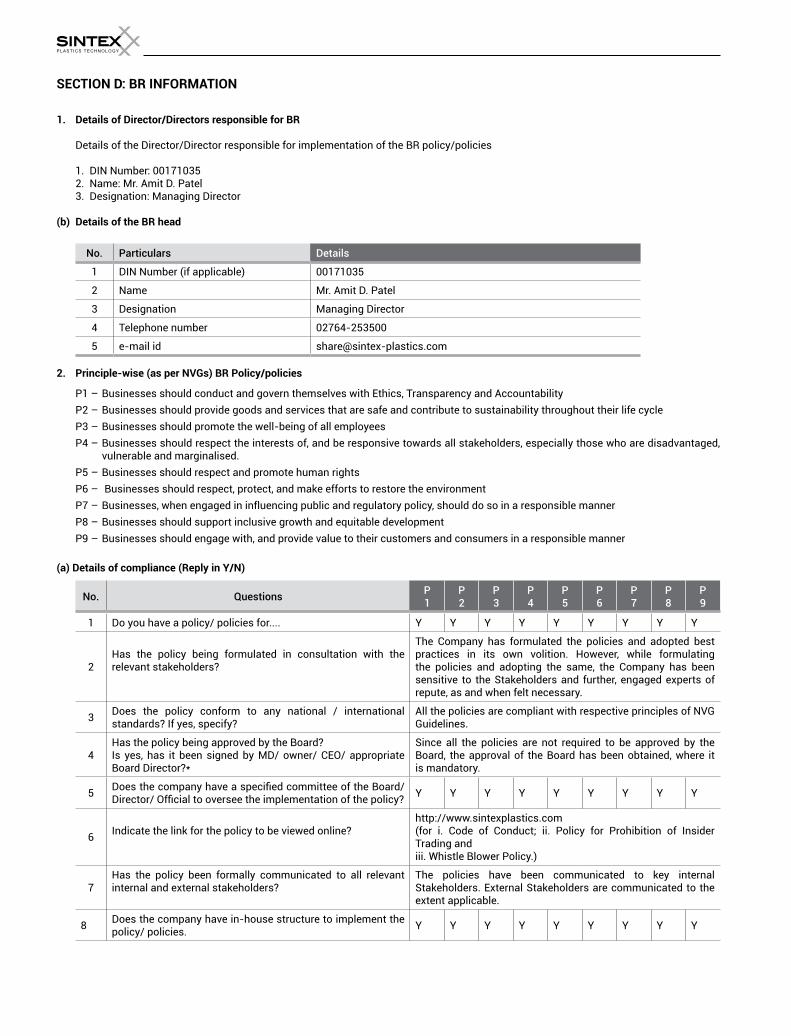
SECTION D: BR INFORMATION
1. Details of Director/Directors responsible for BR
Details of the Director/Director responsible for implementation of the BR policy/policies
1. DIN Number: 00171035 2. Name: Mr. Amit D. Patel 3. Designation: Managing Director
(b) Details of the BR head
No. Particulars Details
1 DIN Number (if applicable) 00171035
2 Name Mr. Amit D. Patel
3 Designation Managing Director
4 Telephone number 02764-253500
5 e-mail id [email protected]
2. Principle-wise (as per NVGs) BR Policy/policies
P1 – Businesses should conduct and govern themselves with Ethics, Transparency and Accountability
P2 – Businesses should provide goods and services that are safe and contribute to sustainability throughout their life cycle
P3 – Businesses should promote the well-being of all employees
P4 – Businesses should respect the interests of, and be responsive towards all stakeholders, especially those who are disadvantaged, vulnerable and marginalised.
P5 – Businesses should respect and promote human rights
P6 – Businesses should respect, protect, and make efforts to restore the environment
P7 – Businesses, when engaged in influencing public and regulatory policy, should do so in a responsible manner
P8 – Businesses should support inclusive growth and equitable development
P9 – Businesses should engage with, and provide value to their customers and consumers in a responsible manner
(a) Details of compliance (Reply in Y/N)
No. QuestionsP1
P2
P3
P4
P5
P6
P7
P8
P9
1 Do you have a policy/ policies for.... Y Y Y Y Y Y Y Y Y
2Has the policy being formulated in consultation with the relevant stakeholders?
The Company has formulated the policies and adopted best practices in its own volition. However, while formulating the policies and adopting the same, the Company has been sensitive to the Stakeholders and further, engaged experts of repute, as and when felt necessary.
3Does the policy conform to any national / international standards? If yes, specify?
All the policies are compliant with respective principles of NVG Guidelines.
4Has the policy being approved by the Board? Is yes, has it been signed by MD/ owner/ CEO/ appropriate Board Director?*
Since all the policies are not required to be approved by the Board, the approval of the Board has been obtained, where it is mandatory.
5Does the company have a specified committee of the Board/ Director/ Official to oversee the implementation of the policy? Y Y Y Y Y Y Y Y Y
6Indicate the link for the policy to be viewed online?
http://www.sintexplastics.com(for i. Code of Conduct; ii. Policy for Prohibition of Insider Trading andiii. Whistle Blower Policy.)
7Has the policy been formally communicated to all relevant internal and external stakeholders?
The policies have been communicated to key internal Stakeholders. External Stakeholders are communicated to the extent applicable.
8Does the company have in-house structure to implement the policy/ policies.
Y Y Y Y Y Y Y Y Y
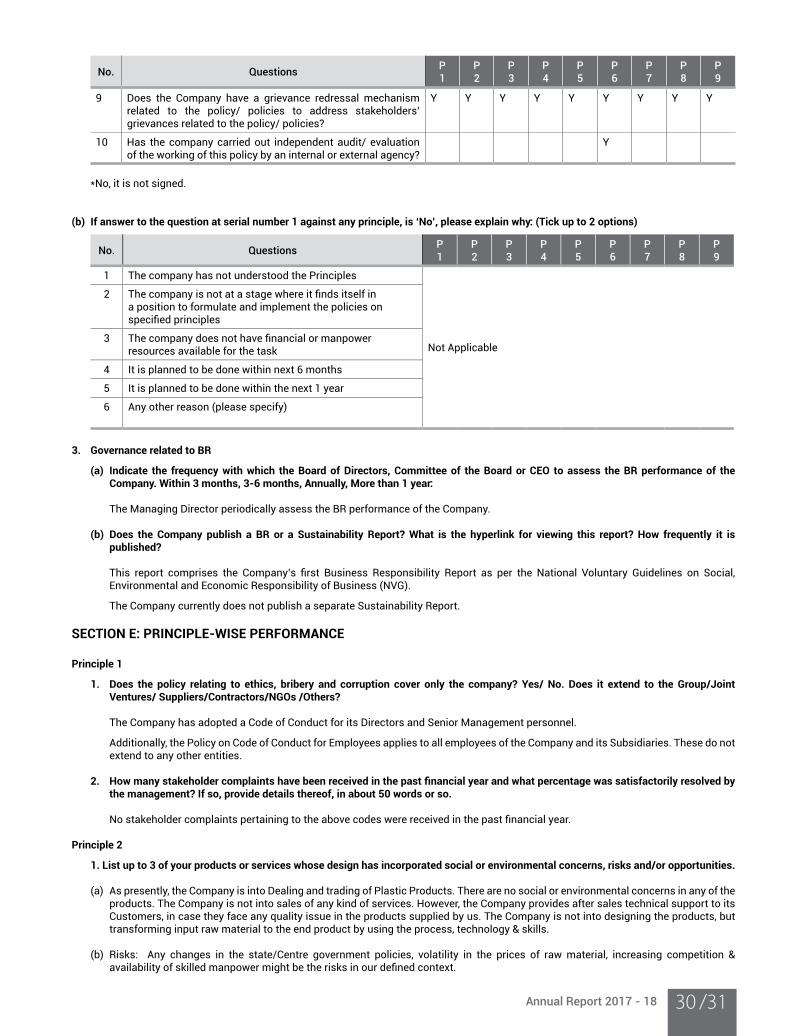
Annual Report 2017 - 18 /3130
No. QuestionsP1
P2
P3
P4
P5
P6
P7
P8
P9
9 Does the Company have a grievance redressal mechanism related to the policy/ policies to address stakeholders’ grievances related to the policy/ policies?
Y Y Y Y Y Y Y Y Y
10 Has the company carried out independent audit/ evaluation of the working of this policy by an internal or external agency?
Y
*No, it is not signed.
(b) If answer to the question at serial number 1 against any principle, is ‘No’, please explain why: (Tick up to 2 options)
No. QuestionsP1
P2
P3
P4
P5
P6
P7
P8
P9
1 The company has not understood the Principles
Not Applicable
2 The company is not at a stage where it finds itself in a position to formulate and implement the policies on specified principles
3 The company does not have financial or manpower resources available for the task
4 It is planned to be done within next 6 months
5 It is planned to be done within the next 1 year
6 Any other reason (please specify)
3. Governance related to BR
(a) Indicate the frequency with which the Board of Directors, Committee of the Board or CEO to assess the BR performance of the Company. Within 3 months, 3-6 months, Annually, More than 1 year:
The Managing Director periodically assess the BR performance of the Company.
(b) Does the Company publish a BR or a Sustainability Report? What is the hyperlink for viewing this report? How frequently it is published?
This report comprises the Company’s first Business Responsibility Report as per the National Voluntary Guidelines on Social, Environmental and Economic Responsibility of Business (NVG).
The Company currently does not publish a separate Sustainability Report.
SECTION E: PRINCIPLE-WISE PERFORMANCE
Principle 1
1. Does the policy relating to ethics, bribery and corruption cover only the company? Yes/ No. Does it extend to the Group/Joint Ventures/ Suppliers/Contractors/NGOs /Others?
The Company has adopted a Code of Conduct for its Directors and Senior Management personnel.
Additionally, the Policy on Code of Conduct for Employees applies to all employees of the Company and its Subsidiaries. These do not extend to any other entities.
2. How many stakeholder complaints have been received in the past financial year and what percentage was satisfactorily resolved by the management? If so, provide details thereof, in about 50 words or so.
No stakeholder complaints pertaining to the above codes were received in the past financial year.
Principle 2
1. List up to 3 of your products or services whose design has incorporated social or environmental concerns, risks and/or opportunities.
(a) As presently, the Company is into Dealing and trading of Plastic Products. There are no social or environmental concerns in any of the products. The Company is not into sales of any kind of services. However, the Company provides after sales technical support to its Customers, in case they face any quality issue in the products supplied by us. The Company is not into designing the products, but transforming input raw material to the end product by using the process, technology & skills.
(b) Risks: Any changes in the state/Centre government policies, volatility in the prices of raw material, increasing competition & availability of skilled manpower might be the risks in our defined context.
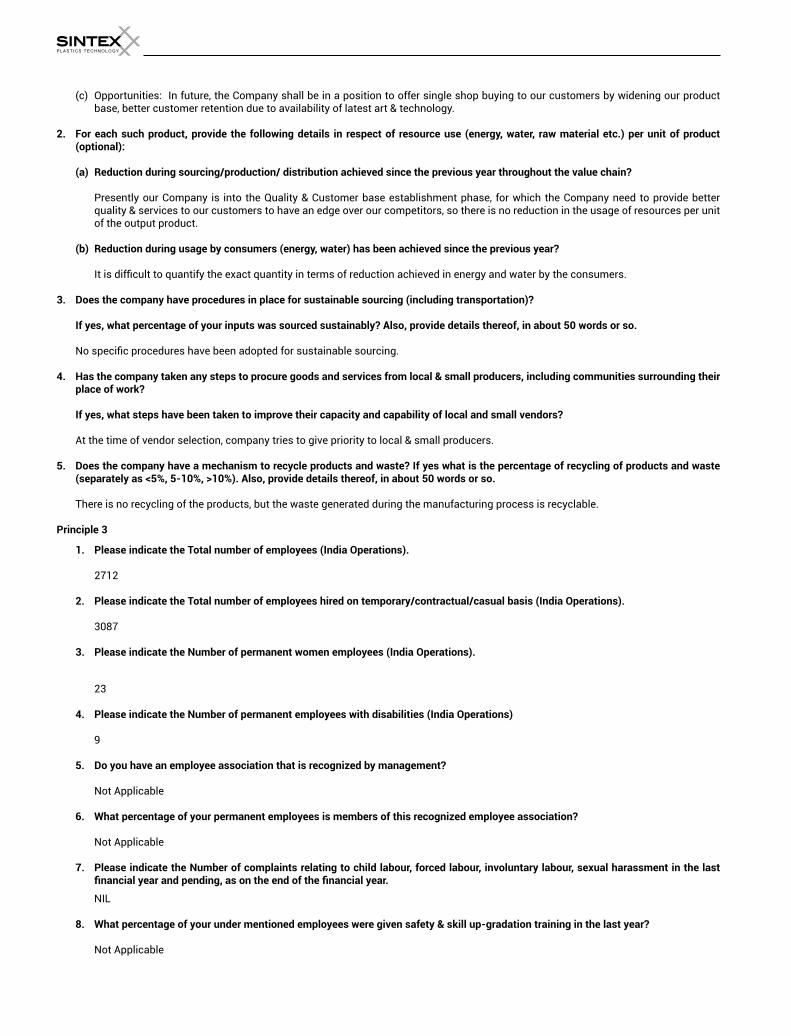
(c) Opportunities: In future, the Company shall be in a position to offer single shop buying to our customers by widening our product base, better customer retention due to availability of latest art & technology.
2. For each such product, provide the following details in respect of resource use (energy, water, raw material etc.) per unit of product (optional):
(a) Reduction during sourcing/production/ distribution achieved since the previous year throughout the value chain?
Presently our Company is into the Quality & Customer base establishment phase, for which the Company need to provide better quality & services to our customers to have an edge over our competitors, so there is no reduction in the usage of resources per unit of the output product.
(b) Reduction during usage by consumers (energy, water) has been achieved since the previous year?
It is difficult to quantify the exact quantity in terms of reduction achieved in energy and water by the consumers.
3. Does the company have procedures in place for sustainable sourcing (including transportation)?
If yes, what percentage of your inputs was sourced sustainably? Also, provide details thereof, in about 50 words or so.
No specific procedures have been adopted for sustainable sourcing.
4. Has the company taken any steps to procure goods and services from local & small producers, including communities surrounding their place of work?
If yes, what steps have been taken to improve their capacity and capability of local and small vendors?
At the time of vendor selection, company tries to give priority to local & small producers. 5. Does the company have a mechanism to recycle products and waste? If yes what is the percentage of recycling of products and waste
(separately as <5%, 5-10%, >10%). Also, provide details thereof, in about 50 words or so.
There is no recycling of the products, but the waste generated during the manufacturing process is recyclable.
Principle 3
1. Please indicate the Total number of employees (India Operations).
2712
2. Please indicate the Total number of employees hired on temporary/contractual/casual basis (India Operations).
3087
3. Please indicate the Number of permanent women employees (India Operations).
23
4. Please indicate the Number of permanent employees with disabilities (India Operations) 9
5. Do you have an employee association that is recognized by management?
Not Applicable
6. What percentage of your permanent employees is members of this recognized employee association?
Not Applicable
7. Please indicate the Number of complaints relating to child labour, forced labour, involuntary labour, sexual harassment in the last financial year and pending, as on the end of the financial year.
NIL
8. What percentage of your under mentioned employees were given safety & skill up-gradation training in the last year?
Not Applicable
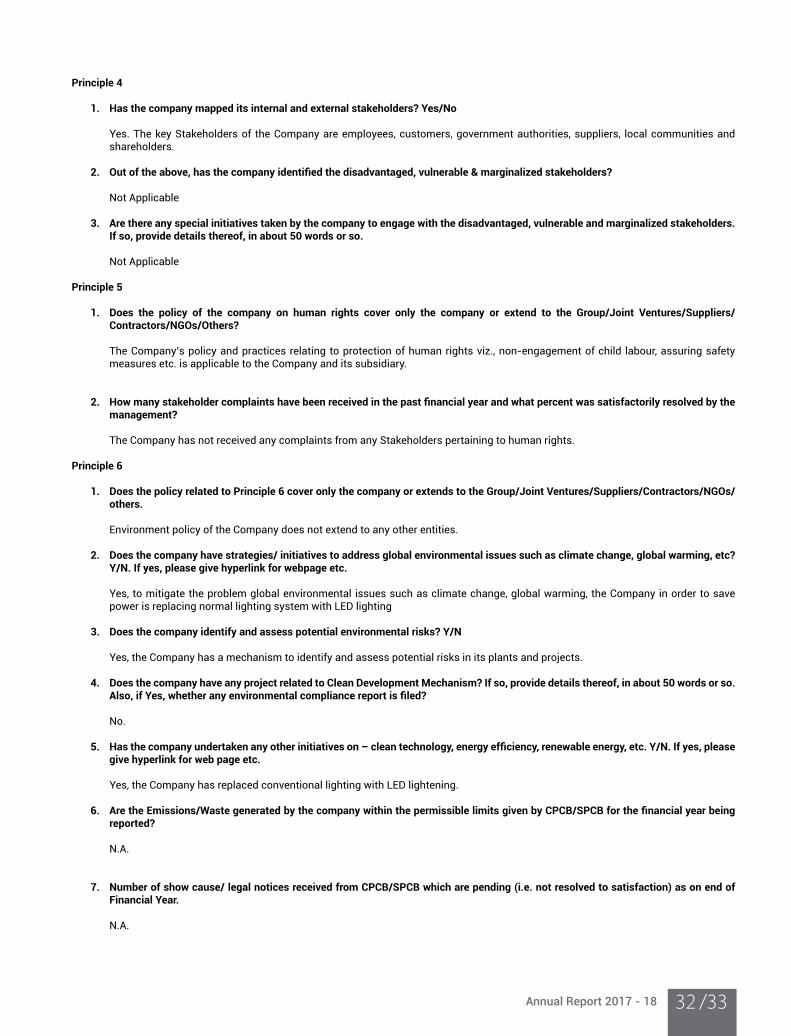
Annual Report 2017 - 18 /3332
Principle 4
1. Has the company mapped its internal and external stakeholders? Yes/No
Yes. The key Stakeholders of the Company are employees, customers, government authorities, suppliers, local communities and shareholders.
2. Out of the above, has the company identified the disadvantaged, vulnerable & marginalized stakeholders?
Not Applicable
3. Are there any special initiatives taken by the company to engage with the disadvantaged, vulnerable and marginalized stakeholders. If so, provide details thereof, in about 50 words or so.
Not Applicable
Principle 5
1. Does the policy of the company on human rights cover only the company or extend to the Group/Joint Ventures/Suppliers/Contractors/NGOs/Others?
The Company’s policy and practices relating to protection of human rights viz., non-engagement of child labour, assuring safety measures etc. is applicable to the Company and its subsidiary.
2. How many stakeholder complaints have been received in the past financial year and what percent was satisfactorily resolved by the management?
The Company has not received any complaints from any Stakeholders pertaining to human rights.
Principle 6
1. Does the policy related to Principle 6 cover only the company or extends to the Group/Joint Ventures/Suppliers/Contractors/NGOs/others.
Environment policy of the Company does not extend to any other entities.
2. Does the company have strategies/ initiatives to address global environmental issues such as climate change, global warming, etc? Y/N. If yes, please give hyperlink for webpage etc. Yes, to mitigate the problem global environmental issues such as climate change, global warming, the Company in order to save
power is replacing normal lighting system with LED lighting 3. Does the company identify and assess potential environmental risks? Y/N
Yes, the Company has a mechanism to identify and assess potential risks in its plants and projects.
4. Does the company have any project related to Clean Development Mechanism? If so, provide details thereof, in about 50 words or so. Also, if Yes, whether any environmental compliance report is filed?
No.
5. Has the company undertaken any other initiatives on – clean technology, energy efficiency, renewable energy, etc. Y/N. If yes, please give hyperlink for web page etc.
Yes, the Company has replaced conventional lighting with LED lightening.
6. Are the Emissions/Waste generated by the company within the permissible limits given by CPCB/SPCB for the financial year being reported?
N.A.
7. Number of show cause/ legal notices received from CPCB/SPCB which are pending (i.e. not resolved to satisfaction) as on end of
Financial Year. N.A.
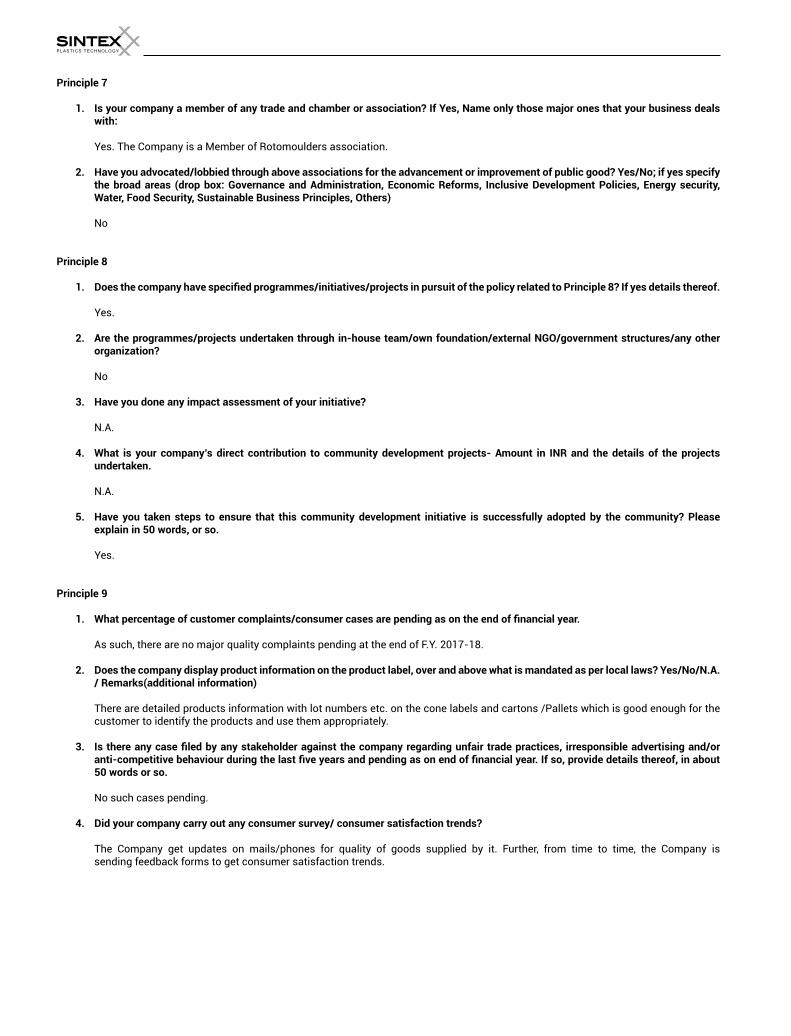
Principle 7
1. Is your company a member of any trade and chamber or association? If Yes, Name only those major ones that your business deals with:
Yes. The Company is a Member of Rotomoulders association.
2. Have you advocated/lobbied through above associations for the advancement or improvement of public good? Yes/No; if yes specify the broad areas (drop box: Governance and Administration, Economic Reforms, Inclusive Development Policies, Energy security, Water, Food Security, Sustainable Business Principles, Others)
No
Principle 8
1. Does the company have specified programmes/initiatives/projects in pursuit of the policy related to Principle 8? If yes details thereof. Yes.
2. Are the programmes/projects undertaken through in-house team/own foundation/external NGO/government structures/any other organization?
No
3. Have you done any impact assessment of your initiative?
N.A.
4. What is your company’s direct contribution to community development projects- Amount in INR and the details of the projects undertaken.
N.A.
5. Have you taken steps to ensure that this community development initiative is successfully adopted by the community? Please explain in 50 words, or so.
Yes.
Principle 9
1. What percentage of customer complaints/consumer cases are pending as on the end of financial year.
As such, there are no major quality complaints pending at the end of F.Y. 2017-18 .
2. Does the company display product information on the product label, over and above what is mandated as per local laws? Yes/No/N.A. / Remarks(additional information)
There are detailed products information with lot numbers etc. on the cone labels and cartons /Pallets which is good enough for the customer to identify the products and use them appropriately.
3. Is there any case filed by any stakeholder against the company regarding unfair trade practices, irresponsible advertising and/or anti-competitive behaviour during the last five years and pending as on end of financial year. If so, provide details thereof, in about 50 words or so.
No such cases pending.
4. Did your company carry out any consumer survey/ consumer satisfaction trends? The Company get updates on mails/phones for quality of goods supplied by it. Further, from time to time, the Company is
sending feedback forms to get consumer satisfaction trends.
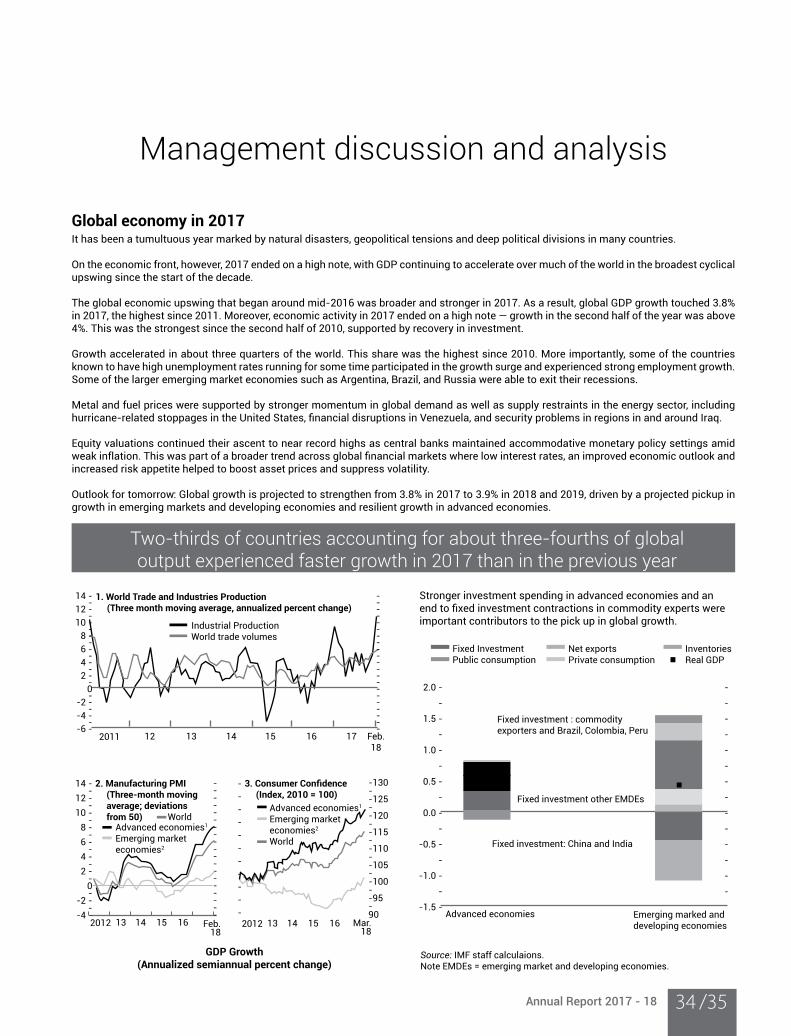
Annual Report 2017 - 18 /3534
Management discussion and analysis
Global economy in 2017It has been a tumultuous year marked by natural disasters, geopolitical tensions and deep political divisions in many countries.
On the economic front, however, 2017 ended on a high note, with GDP continuing to accelerate over much of the world in the broadest cyclical upswing since the start of the decade.
The global economic upswing that began around mid-2016 was broader and stronger in 2017. As a result, global GDP growth touched 3.8% in 2017, the highest since 2011. Moreover, economic activity in 2017 ended on a high note — growth in the second half of the year was above 4%. This was the strongest since the second half of 2010, supported by recovery in investment.
Growth accelerated in about three quarters of the world. This share was the highest since 2010. More importantly, some of the countries known to have high unemployment rates running for some time participated in the growth surge and experienced strong employment growth. Some of the larger emerging market economies such as Argentina, Brazil, and Russia were able to exit their recessions.
Metal and fuel prices were supported by stronger momentum in global demand as well as supply restraints in the energy sector, including hurricane-related stoppages in the United States, financial disruptions in Venezuela, and security problems in regions in and around Iraq.
Equity valuations continued their ascent to near record highs as central banks maintained accommodative monetary policy settings amid weak inflation. This was part of a broader trend across global financial markets where low interest rates, an improved economic outlook and increased risk appetite helped to boost asset prices and suppress volatility.
Outlook for tomorrow: Global growth is projected to strengthen from 3.8% in 2017 to 3.9% in 2018 and 2019, driven by a projected pickup in growth in emerging markets and developing economies and resilient growth in advanced economies.
Two-thirds of countries accounting for about three-fourths of global output experienced faster growth in 2017 than in the previous year
Stronger investment spending in advanced economies and an end to fixed investment contractions in commodity experts were important contributors to the pick up in global growth.
Fixed InvestmentPublic consumption
Fixed investment : commodityexporters and Brazil, Colombia, Peru
Fixed investment other EMDEs
Fixed investment: China and India
Advanced economies
2.0 -
-
1.5 -
-
1.0 -
-
0.5 -
-
0.0 -
-
-0.5 -
-
-1.0 -
-
-1.5 -
-
-
-
-
-
-
-
-
-
-
-
-
-
-
Emerging marked anddeveloping economies
Source: IMF staff calculaions.Note EMDEs = emerging market and developing economies.
Net exportsPrivate consumption
InventoriesReal GDP
1. World Trade and Industries Production (Three month moving average, annualized percent change)
Industrial ProductionWorld trade volumes
2011 12 13 14 15 16 17 Feb.18
14 --
12 --
10 --
8 --
6 --
4 --
2 --0-
-2 --
-4 --
-6 -
---------------------
2. Manufacturing PMI (Three-month moving
average; deviations from 50)
3. Consumer Confidence (Index, 2010 = 100)
Advanced economies1
Emerging market economies2
Advanced economies1
Emerging market economies2
World
World
14 --
12 --
10 --
8 --
6 --
4 --
2 --0-
-2 --
-4 -
-130--125--120--115--110--105--100--95-90
-
-
-
-
-
-
-
-
-
-
-
-------------------
2012 13 14 15 16 Feb.18
2012 13 14 15 16 Mar.18
GDP Growth(Annualized semiannual percent change)
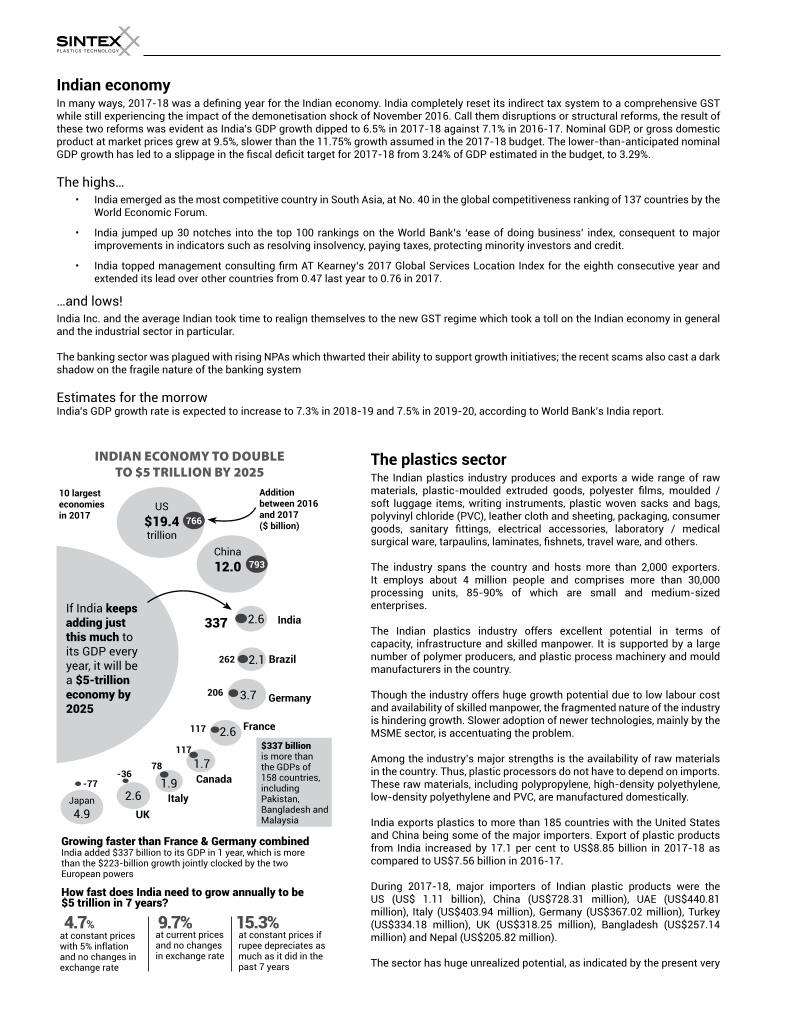
Indian economyIn many ways, 2017-18 was a defining year for the Indian economy. India completely reset its indirect tax system to a comprehensive GST while still experiencing the impact of the demonetisation shock of November 2016. Call them disruptions or structural reforms, the result of these two reforms was evident as India’s GDP growth dipped to 6.5% in 2017-18 against 7.1% in 2016-17. Nominal GDP, or gross domestic product at market prices grew at 9.5%, slower than the 11.75% growth assumed in the 2017-18 budget. The lower-than-anticipated nominal GDP growth has led to a slippage in the fiscal deficit target for 2017-18 from 3.24% of GDP estimated in the budget, to 3.29%.
The highs…• India emerged as the most competitive country in South Asia, at No. 40 in the global competitiveness ranking of 137 countries by the
World Economic Forum.
• India jumped up 30 notches into the top 100 rankings on the World Bank’s ‘ease of doing business’ index, consequent to major improvements in indicators such as resolving insolvency, paying taxes, protecting minority investors and credit.
• India topped management consulting firm AT Kearney’s 2017 Global Services Location Index for the eighth consecutive year and extended its lead over other countries from 0.47 last year to 0.76 in 2017.
…and lows!India Inc. and the average Indian took time to realign themselves to the new GST regime which took a toll on the Indian economy in general and the industrial sector in particular.
The banking sector was plagued with rising NPAs which thwarted their ability to support growth initiatives; the recent scams also cast a dark shadow on the fragile nature of the banking system
Estimates for the morrowIndia’s GDP growth rate is expected to increase to 7.3% in 2018-19 and 7.5% in 2019-20, according to World Bank’s India report.
The plastics sectorThe Indian plastics industry produces and exports a wide range of raw materials, plastic-moulded extruded goods, polyester films, moulded / soft luggage items, writing instruments, plastic woven sacks and bags, polyvinyl chloride (PVC), leather cloth and sheeting, packaging, consumer goods, sanitary fittings, electrical accessories, laboratory / medical surgical ware, tarpaulins, laminates, fishnets, travel ware, and others.
The industry spans the country and hosts more than 2,000 exporters. It employs about 4 million people and comprises more than 30,000 processing units, 85-90% of which are small and medium-sized enterprises.
The Indian plastics industry offers excellent potential in terms of capacity, infrastructure and skilled manpower. It is supported by a large number of polymer producers, and plastic process machinery and mould manufacturers in the country.
Though the industry offers huge growth potential due to low labour cost and availability of skilled manpower, the fragmented nature of the industry is hindering growth. Slower adoption of newer technologies, mainly by the MSME sector, is accentuating the problem.
Among the industry’s major strengths is the availability of raw materials in the country. Thus, plastic processors do not have to depend on imports. These raw materials, including polypropylene, high-density polyethylene, low-density polyethylene and PVC, are manufactured domestically.
India exports plastics to more than 185 countries with the United States and China being some of the major importers. Export of plastic products from India increased by 17.1 per cent to US$8.85 billion in 2017-18 as compared to US$7.56 billion in 2016-17.
During 2017-18, major importers of Indian plastic products were the US (US$ 1.11 billion), China (US$728.31 million), UAE (US$440.81 million), Italy (US$403.94 million), Germany (US$367.02 million), Turkey (US$334.18 million), UK (US$318.25 million), Bangladesh (US$257.14 million) and Nepal (US$205.82 million).
The sector has huge unrealized potential, as indicated by the present very
INDIAN ECONOMY TO DOUBLE
TO $5 TRILLION BY 2025
10 largest economiesin 2017
If India keeps adding just this much to its GDP every year, it will be a $5-trillion economy by 2025
Additionbetween 2016and 2017($ billion)
US
$19.4trillion
China
12.0
2.6
2.1
3.7
2.6
1.7
1.92.6Japan
4.9
India
Brazil
Germany
France
Canada
Italy
UK
766
793
337
262
206
117
117
78-36
-77
$337 billionis more than the GDPs of 158 countries, including Pakistan, Bangladesh and Malaysia
Growing faster than France & Germany combinedIndia added $337 billion to its GDP in 1 year, which is more than the $223-billion growth jointly clocked by the two European powers
How fast does India need to grow annually to be$5 trillion in 7 years?
4.7% 9.7% 15.3%at constant prices with 5% inflation and no changes in exchange rate
at current prices and no changes in exchange rate
at constant prices if rupee depreciates as much as it did in the past 7 years
Annual Report 2017 - 18 /3736
low per capita consumption levels of polymers in India which is ~11 kg vis-a-vis 38 kg in China, 65 kg in Europe and the global average of ~28 kg.
As a step towards reaching its optimum potential, the Government has drawn out a blueprint for setting up 18 plastic parks at an investment of Rs 40 crore (US$6.2 million) to increase the domestic production of plastics. This will help the sector achieve environmentally sustainable growth and increase employment.
The Composites sectorAccording to ‘Global Composites Market by type, by application, by manufacturing process, by region, Competition Forecast & Opportunities, 2012-2022’, Global composites market is projected to reach US$42 billion by 2022.
The major drivers for growth in this market are increasing demand for lightweight materials in the aerospace and defence and automotive industry, corrosion and chemical resistance materials demand in construction and pipe and tank industry and electrical resistivity and low flame retardant materials demand in E&E industry.
Moreover, with increasing popularity of renewable energy and rising interest in establishing huge wind power plants, demand for composites is likely to further increase in the coming years.
Composites adoption in India has been relatively muted with a market size less than US$ 400 million, due to limited demand side manoeuvrability (lack of awareness on composites) and supply side issues (poor technology adoption, lack of value chain ecosystem, delivery capability, cost, etc.). As a result, the per capita consumption of composites in India is around 0.25 Kg, against 2.2 kg in China and 10 kg in US.
Even though India has a significant labour arbitrage, due to limited capabilities of the existing players in this sector and global deals entered into by large OEM customers such as Airbus and Boeing, the industry’s ability to leverage its competitive advantage has been limited.
The current rate of growth in the composites industry is a meagre 6% in spite of huge untapped potential.
The composites industry, also known as reinforced plastics (combination of polymer, glass fibre or carbon fibre) industry is aligning with the Union Government’s ‘Make in India’ programme and expects immediate intervention in the form of special grants, incentives and sops for growth needed to achieve its full potential.
Sintex Plastics Technology Limited Headquartered in Kalol, Gujarat, Sintex Plastics Technology Limited is a globally-respected conglomerate with a large and growing presence in plastics processing. The Company has an expansive presence in India and across the globe through its subsidiaries that cater to diverse high-growth sectors.
The Company’s presence in India is catered to by its two subsidiaries Sintex-BAPL Limited and Sintex Prefab & Infra Limited.
Sintex-BAPL LimitedThe Company develops and delivers custom moulding solutions for various user sectors in India. This Company also has a global presence through its step-down international subsidiaries, namely Sintex NP SAS (Europe), Sintex Wausaukee Composites Inc. (the US) and Sintex Logistics.
• Sintex NP: This is a large conglomerate of small companies with niche expertise catering to leading global brands operating in Europe.
• Sintex Wausaukee: The Company marked its presence in the large and lucrative US markets. But due to strategic reasons its operations were discontinued and substituted by Sintex Logistics LLC.
• Sintex Logistics LLC: This is the recent addition to the Company’s global footprint. This marketing and business development outfit will source solutions from the Indian operations for its US clients.
• BAPL Rototech Pvt. Ltd: BAPL Rototech manufactures plastic components using Roto-Moulding and Blow Moulding technologies for the needs of the Automotive industry in Commercial Vehicle (CV) segment in India and globally.
Sintex Prefab & Infra Ltd: undertakes manufacture and sale of prefabricated structures and medium-sized EPC orders for various infrastructure projects.
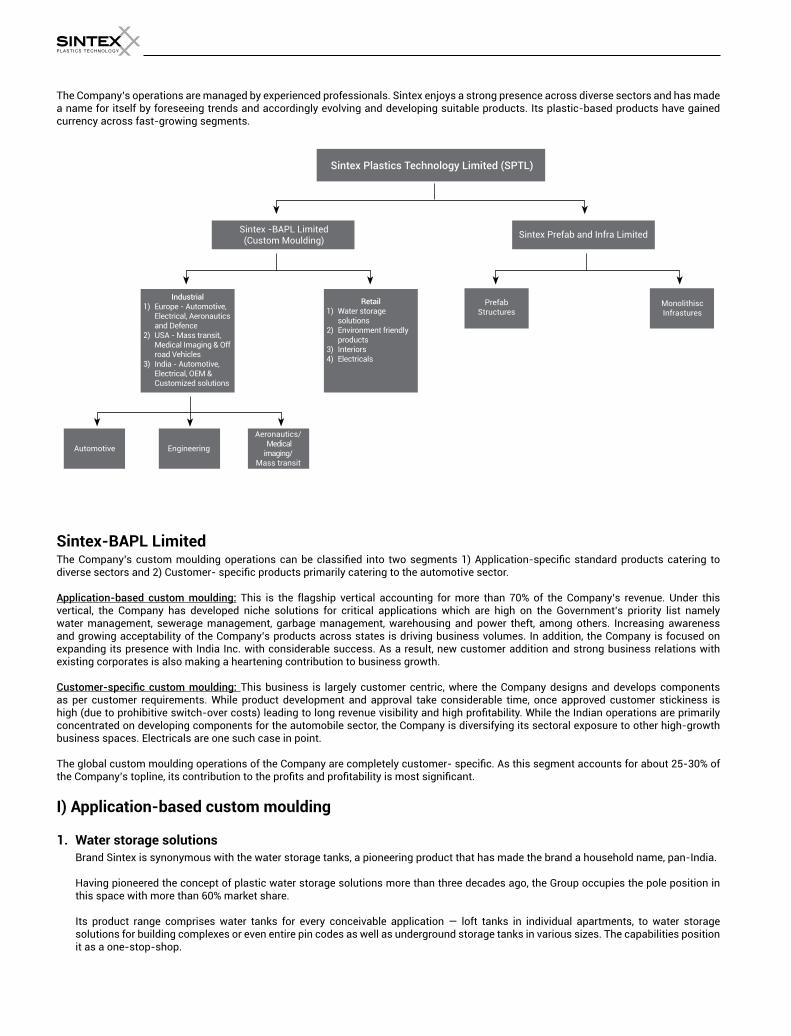
The Company’s operations are managed by experienced professionals. Sintex enjoys a strong presence across diverse sectors and has made a name for itself by foreseeing trends and accordingly evolving and developing suitable products. Its plastic-based products have gained currency across fast-growing segments.
Sintex-BAPL Limited The Company’s custom moulding operations can be classified into two segments 1) Application-specific standard products catering to diverse sectors and 2) Customer- specific products primarily catering to the automotive sector.
Application-based custom moulding: This is the flagship vertical accounting for more than 70% of the Company’s revenue. Under this vertical, the Company has developed niche solutions for critical applications which are high on the Government’s priority list namely water management, sewerage management, garbage management, warehousing and power theft, among others. Increasing awareness and growing acceptability of the Company’s products across states is driving business volumes. In addition, the Company is focused on expanding its presence with India Inc. with considerable success. As a result, new customer addition and strong business relations with existing corporates is also making a heartening contribution to business growth.
Customer-specific custom moulding: This business is largely customer centric, where the Company designs and develops components as per customer requirements. While product development and approval take considerable time, once approved customer stickiness is high (due to prohibitive switch-over costs) leading to long revenue visibility and high profitability. While the Indian operations are primarily concentrated on developing components for the automobile sector, the Company is diversifying its sectoral exposure to other high-growth business spaces. Electricals are one such case in point.
The global custom moulding operations of the Company are completely customer- specific. As this segment accounts for about 25-30% of the Company’s topline, its contribution to the profits and profitability is most significant.
I) Application-based custom moulding
1. Water storage solutions Brand Sintex is synonymous with the water storage tanks, a pioneering product that has made the brand a household name, pan-India.
Having pioneered the concept of plastic water storage solutions more than three decades ago, the Group occupies the pole position in this space with more than 60% market share.
Its product range comprises water tanks for every conceivable application — loft tanks in individual apartments, to water storage solutions for building complexes or even entire pin codes as well as underground storage tanks in various sizes. The capabilities position it as a one-stop-shop.
Sintex Plastics Technology Limited (SPTL)
Sintex Prefab and Infra LimitedSintex -BAPL Limited(Custom Moulding)
Automotive Engineering
Aeronautics/ Medical imaging/
Mass transit
Prefab Structures
Monolithisc Infrastures
Industrial1) Europe - Automotive,
Electrical, Aeronautics and Defence
2) USA - Mass transit, Medical Imaging & Off road Vehicles
3) India - Automotive, Electrical, OEM & Customized solutions
Retail1) Water storage
solutions2) Environment friendly
products3) Interiors4) Electricals
Annual Report 2017 - 18 /3938
While the tanks have remained the flagship product, the Company has in recent times introduced path-breaking products that have strengthened its dominance in the water storage solution space. The triple walled white tanks has been one of the its most successful innovations which has been widely accepted by the Indian masses. The Company has two products in this segment — one for the affluent, branded as ‘Sintex Pure’ and one for the aspiring, marketed under the ‘Titus’ brand. Its unique two-lid offering has attracted consumers and trade partners.
Titus has been performing extremely well. The sales volumes have multiplied five times when compared to the volumes registered in the first year of launch. To further increase penetration, the Company has created three eye-catching Titus colours, namely yellow, green and blue with an aim of capturing rural regional markets.
As an extension to this product segment, the Company developed Sintex Pure, a premium Triple layer, antibacterial water tank. It effectively fights bacteria and microorganisms, resulting in greater hygiene in the water supply with resultant health advantage. Sintex Pure has gained wide acceptance in a short period among consumers pan-India. It commands 37% of the total water tank business and is expected to sustain its growth momentum over the medium term.
Further, water storage business competition was addressed when the Company leveraged blow-moulding technology for manufacture of value-for-money tank variants launched under the ‘Renotuf’ brand. This move facilitated effective management of competitive pressure and met low and mid-market customer expectations. The company has done some design modifications to ensure longer durability
The Company also offers ready-to-use future-oriented products in the form of underground tanks or sumps. Since underground storage provides a larger addressable opportunity compared to overhead storage, the Company wishes to replace the existing RCC underground tanks with its sumps.
From an operations standpoint, the Company has upgraded its Quality Assurance Systems to latest standards like ISO 14000:2004, Six Sigma improvements etc.
The Group also developed an in-house shrink-wrap solution for superior product packaging which eliminated in-transit damage to premium tanks, thereby improving customer experience with its brand.
The Dealer Management System rolled out under Sintex-Shikhar initiative has increased visibility of the product brand in the secondary market. This in turn has facilitated creation of a stronger distributor-retailer bond. Moreover, the visible data of Sintex-Shikhar throws light on enormous further opportunities for Sintex in the retail market.
In order to take this initiative forward the Company launched a more user-friendly version of Sintex-Shikhar. Besides, innovative schemes introduced by the Company continued to strengthen the retailer-Sintex connect.
In addition to improving product quality, the Company has undertaken several initiatives for enhanced service efficiency. Several technology upgradations towards this end accommodate business needs. Examples include mobile apps for the sales force, and quality apps upgraded to a full-fledged complaint management system backed by a dedicated call center.
Further, the Company’s a dedicated web portal tracks consignments at the retail level so as to minimise inventory pileups at the retailers’ end.
After-sales-service has seen strengthened. More on-the-field work force have been deployed, along with a call-center backed complaint closure system. In addition, the Company has also started providing installation services to customers requesting higher capacity storage solutions.
Management of modern trade leverage in the form of Ultratech Building solutions has been continued for the third consecutive year. The Company registered 51% growth in business through this route. In a bid to replicate this success, the Company is tying up with more such initiatives.
2. Factory Made Doors & Plastic sections Sintex leveraged its intellectual pool and resident technology. Such inroads into the building products space offer a prudent mix of ready-
to-use and do-it-yourself products.
The Group’s extruded product basket comprises doors, kitchen cabinets and non-load bearing partitions, among others. The long-lasting, value-for-money and environment-friendly alternatives over wooden/aluminum variants have found ready acceptance with the large and fast growing middle-income segment of Indian society.
Focused marketing has led to segmentation of the Company’s product basket into distinct categories – interior panels and ready-made doors.
Doors: Factory-Made Doors (ready for installation) are the flagship product within this vertical being marketed under Indiana and Micra brands. Both have received healthy customer acceptance. To strengthen its product offering, the Group launched the Sierra brand, a premium range of doors with stylish designs and superior finish.
During 2017-18, Sierra registered a healthy 92% volume growth while the Indiana range which is the largest selling product had a flattish year. Going forward, the Company has drawn a blueprint to strengthen penetration of this product pan-India. In addition, the team is also
developing internal doors which should be launched over the coming years as part of its strategic roadmap to extend its presence from the bathroom to other parts of the home.
Panels: Till now, the Group manufactured hollow profiles used in kitchen and bathroom furniture and non-load bearing panels. The Group continued to introduce new sections and shades in line with customer aspiration and market trends. Recently, Sintex launched a superior-grade paneling material resembling timber which has received good customer response.
During 2017-18, the hollow section business grew in single digits over the previous year. The Company established a presence in new markets namely Maharashtra, Madhya Pradesh, Delhi and Punjab. Their contribution in the current year promises to strengthen business growth going forward. As part of its business development strategy, the Company is coming up with High Gloss, Textured and Digital Finish for interiors as these are trends in vogue.
3. Sub-ground structures This product vertical comprises unique liquid storage solutions to address sewage systems in India. The Group’s product basket
comprises septic tanks, packaged treatment solutions and biogas holders.
Septic tanks: The Group developed underground septic tanks for storage of liquid waste (for about 50-500 people) which has secured approvals from numerous municipalities and governmental agencies along with the Ministry of Non-Renewable Energy. The Company continued to market large volumes of this product in urban India to promote space saving, in itself a USP.
Packaged waste water treatment solutions: Sintex group have developed decentralised packaged waste water treatment solutions (large
and small capacity variants) in collaboration with Aqua Nishihara, Japanese global leaders in this space. This unique solution reduces BOD levels by 90-95% depending on the product. The product has received the acceptance watermark from key authorities:
• Accepted by the Bill and Melinda Gates Foundation as an effective solution for managing sewerage.
• Received approval from the Ministry of Urban Development as an effective solution for managing liquid waste.
• Mentioned in the CPHEEO manual which showcases the opportunity canvas in keeping with the Central Government’s intent to clean up India.
• Received MES approval from ENC Inc. for MBBR technology. This approval is expected to be an inflection point for this revenue vertical since MBBR technology is widely accepted all over the country. This approval will allow the Group to participate in large government projects initiated by MES, CPWD, Railway, ONGC, Police Housing, Housing Boards and other Government and private sector institutions.
The Company has propagated awareness of the product and its effectiveness by participating in seminars and by organising contractor workshops. Sintex has created customised variants in which the treated water can be used for gardening, toilet flushing, floor washing and in cooling tower, along with construction activities. The aim is to widen the opportunity canvas.
The Company has created a dedicated cell consisting of service managers and technicians for after- sales services (including AMCs) to ensure product performance.
Biogas holders: The Company pioneered portable, prefabricated and moulded biogas plants in India to primarily address the fuel and sanitation needs of rural India — an issue high on the Central Government’s priority list.
The biogas plant uses livestock excreta and leftover food to generate biogas which is used to fuel rural kitchens. Any remnant can thereafter be used as fertiliser. The product has received approval from the Ministry of Non-Renewable Energy which enables the Company to market this product seamlessly to government agencies pan-India. Biogas plants have gained significant acceptance in many states. In addition, Sintex has successfully marketed its biogas solutions to dairy farms across different states.
4. Pollution management solutions Public opinion is that the problem of garbage in India is assuming gigantic proportions and the volumes are staggering. Around 10 million
tonnes of garbage are generated in metropolitan cities of Delhi, Mumbai, Chennai, Hyderabad, Kolkata and Bangalore.
To address the waste management burden, the Central Government had launched Swachh Bharat Abhiyaan and set specific targets. With the revision in Municipal Solid Waste Management Rules of 2016, waste generators are expected to segregate waste into three categories – Biodegradables, Dry Waste and Domestic Hazardous Waste. The institutional generators, market associations, event organizers and hotels and restaurants are made directly responsible for segregation and sorting their waste into categories – Recyclable, Inert Debris, Organic or Kitchen Waste and Hazardous Waste including Bio Medical Waste. Further, the Government is also planning to mandate a 4-bin system in days to come.
As a result, one of the biggest consumers of bins are the municipal corporations and urban local bodies.
To facilitate effective management of the growing garbage load, Sintex provides a range of plastic waste bins labelled as Roto Moulding, Blow Moulding and Injection Moulding.
Sintex has developed an entire range of Plastic Waste Bins to address all segregation and handling issues ranging from 10 Ltrs. to 1100 Ltrs. There are over a hundred such types of bins manufactured with both utility and aesthetic value. The product basket also includes customization from household bins to wheeled bins.
Annual Report 2017 - 18 /4140
The Company’s key clientele includes municipal corporations, urban local bodies, infrastructure companies, hotels, restaurants, resorts, residential and commercial complexes, schools, colleges and institutions, among others. Company presence is noticeable across India.
Sintex has progressed to offering colour coded bins. Different coloured bins are much in demand as it helps in differentiating its use easily. Further, in a country where most of the cleaning personnel are drawn from low educational levels, the colour-coding helps them to match the bin to its use. Pedal operated bins are also catching up though awareness of such solutions are yet to penetrate every segment. Another innovation is the sensor operated feminine hygiene bins, besides the pedal operated ones.
Urban India is the world’s 3rd largest garbage generator and by 2050 waste is expected to rise to 436 million tonnes.
5. Sandwich panels Continuous Sandwich panels are increasingly finding acceptance as roofing and cladding solutions for two important reasons which
comprise their USPs. Sandwich panels provide superior heat insulation and noise reduction.
At Sintex, these are made on a continuous line, by extruding polyurethane foam (PuF) between two layers of pre-painted steel. Strict parameters and stringent quality checks ensure that the highest quality products are made available to customers.
Sandwich panels are typically used as roof, wall, partition or in false ceiling. In recent times, they are being increasingly used in construction, both for industrial use, in warehousing, as well as in household applications.
While customers acknowledge that Sintex’s sandwich panels for best in class performance in both heat insulation and noise reduction, the product provides additional benefits as being leakage and corrosion proof.
In addition to roof panels and wall panels, Sintex also offers a basket of accessories, namely ridge caps, end caps, side caps, L-angle, etc. Recently, flashings, hinge type doors and windows have also been added to its product basket to widen the opportunity canvas. Sintex also provides installation services for large cold storage applications.
Sintex has been able to leverage the Central Government’s focus on cold chain network, to garner a significant share of the potato storage market, primarily in Gujarat. This model is now being extended to other markets as well. Significant inroads have been made in creating storage facilities for onion flakes and fisheries, as well as dairy and dairy products.
In 2017-18, the Company executed large orders for pharma applications. Through Fabtech, the Company supplied sandwich panels for clean rooms to the pharma industry. Another concern, Luwa India, which provides turnkey solutions in controlled atmosphere, has used the Company’s sandwich panels for various projects across India.
The team developed special panels for dairy applications which led to business from dairies like Jaipur Dairy (through NDDB, Anand), thus creating a new window of opportunity.
In addition to the private sector, Sintex has also made an entry into the government sector, with a large warehousing project for Balmer Lawrie & Co. Ltd. The Company has supplied large volumes of its sandwich panels to HAL, GSIDC and NTPC. In addition, the Company’s products have found increasing acceptance by education institutions.
In order to de-risk from overdependence on institutional customers, the Company is exploring opportunities in the retail space. There is significant opportunity to up-sell and cross-sell to customers of profiled steel sheets and concrete, respectively. A separate sales team has been created to develop the Company’s presence in this area. Distributors have been appointed across the country, and several tools have been created to build awareness and facilitate conversion.
Exports of sandwich panels to Bhutan, South Africa, Ethiopia and Bangladesh gained momentum over the previous year. The Company is hopeful of strengthening its international presence in the coming years.
6. Electrical Products/ Solutions Power theft was a major concern for power utilities across India as the nation was plagued with more than 20% T&D losses which
significantly dented the profitability of power utilities. To address this issue on an urgent basis, Sintex leveraged the unique SMC material promoted to develop enclosures. It had built in features incorporated as a solution against power theft.
SMC material has intrinsic benefit and superior performance parameters such as shock proof, rust proof and zero resale value. It thus offered durable maintenance free solutions even for open-to-sky public place installation.
A segment which started with tamper-proof meter box manufacture now offers all kinds of enclosures for the power transmission and distribution sector. As a result, Sintex is one of the largest manufacturers of electrical enclosures, catering to state electricity boards and circle offices all over India.
In addition, the Company’s product basket comprises loop- in/loop-out boxes, polymeric insulators, insulator boxes, cross arms and service connection boxes among others, with special features and other accessories used in national electrification. It operates in the mid- (440 to 1,200 volts) and high-voltage (up to 11 kilovolt-amperes) segments.
In the recent past, the Company graduated from supply of empty boxes to fully-fitted, ready-to-use enclosures for diverse applications, strengthening its position as a preferred business partner.
Further, aligning with the nation’s clarion call for providing ‘Electricity to All’, the Company introduced the BPL kit. This is a mandatory requirement under the initiative, comprising an electricity board with basic fitments (MCBs, switches, a bulb holder and a plug point). This product resulted in large business volumes from many states in South and West India.
The Company has compartmentalized its business into three segments so as to focus on growth of each individual segment and the collective revenue vertical. The three segments are – 1) Business from Electricity Boards (EB), 2) Non-EB business and 3) the retail segment.
Business from Electricity Boards: This is segment functions on a B-G model with the Group catering to the requirements of various State DISCOMs (electricity distribution companies of India) and Central Government agencies. This segment is the key revenue generator accounting for more than 70% of the revenue for SMC business. The key product basket comprises DTC/LTCT Meter Boxes, Service Connection Boxes, Consumer Meter Boxes, LT Distribution Boxes, BPL Kits and V-Cross Arms.
The Company is an approved supplier under government’s key power reform programs namely Saubhagya Yojana, Deen Dayal Upadhyaya Gram Jyoti Yojana, and the Integrated Power Development Scheme which aim to provide 24 x 7 quality power to urban and rural India.
The Government’s initiatives towards ‘Power for All’ and dream of Ujwal Bharat has mandated various schemes and projects. The Government has also focused on financial and operational efficiency to turn around DISCOMs under its comprehensive power sector programme UDAY (Ujwal DISCOM Assurance Yojna). These policies and projects linked to them have resulted in significant business volumes for the Company.
Majority of the business accrues from Gujarat, Uttar Pradesh, Andhra Pradesh, Chhattisgarh and Kerala. To sustain business growth, the Company is working on widening its footprint across the Indian landmass with a concerted effort on select progressive states.
Non-EB business: Under this vertical the Company works with leading private sector power distribution companies, providing a slew of products namely cable trays, junction boxes, RTU, SMC Sheet/CHQ, IP, LED, MCB/RCCB and Plug & Socket, among others.
Further, the Company has established a presence in the Telecom sector by developing specialised enclosure for energy saving equipment. In addition, there has been a steady demand for cable trays from this user segment. The Group has also developed specialised and customized enclosures for housing critical and specialised equipment which have generated significant interest among telecom players.
The team has also developed important stand-alone products which will enable it to cater to a wider spectrum of user sectors, thereby expanding its opportunity canvas over the coming years.
Retail segment: The Group has set up a retail channel for its product vertical to cater to small volume businesses across India.
7. Industrial products Industrial containers: The first plastic product from Sintex which finds a special place in the Sintex product basket even today. Industrial
containers cater to almost all industries, namely chemicals, processing, textile, food, pharma and battery, among others. The products find application in high growth, sunrise sectors, namely renewable energy.
The Company enjoys the preferred supplier position with leading corporates such as Vardhman Industries, RSWM, Trident, Arvind Ltd, Raymond, ITC, Sun Pharma, Amara Raja Batteries, Thermax, Raj Industries, Mylan Labs and others.
In the course of the year, the Company focused on a move from selling products to offering solutions to its customers. The team also worked on horizontal and vertical expansion of its customers and product base.
With the revival of the industrial growth towards the close of the previous financial year (2017-18), the Company expects demand for this product to remain buoyant in the current year.
Pallets: Sintex pioneered roto-moulded plastic pallets in the country which find significant application in the food and pharma segments where Good Manufacturing Practices (GMP) norms are to be complied with.
Moreover, lack of space is mandating corporates towards the vertical (for storage purposes). This generates sizeable demand for pallets. The Company has successfully executed mega projects for RMSCL, ITC, Britannia, FDC, GSK, and Biocon. Recently, the Company entered into EP & DP pallets (Engineering Polymer Pallets, Dunnage Pallets), which are required for granular storage as static storage solutions.
The Company is optimistic of receiving large projects from esteemed business organizations.
Insulated boxes: The Company continued to develop new variants of insulated boxes for the Mid-Day meal Program, which were well received by the user community. Further, the Company ventured successfully into frozen foods by providing custom designed insulated
Annual Report 2017 - 18 /4342
boxes. The Company’s association with several government programs such as Dudh Sanjeevani Yojana, has extended the product awareness and brand recall in India. In addition, the Company has established a strong recall in the sea food space by establishing healthy business relations with fisheries departments of various state governments.
FRP underground tanks: A relatively new product in the Sintex basket. The Company’s single and double wall fuel storage tanks are positioned as a safe and cost effective alternative to MS fuel storage tanks. The double wall storage tanks ensure that leakages, if any, are detected before the fuel contaminates groundwater. The Company markets its products to government and private sector oil marketing companies which include the likes of HPCL, Shell, IOCL, Essar and Reliance. In addition, the FRP underground and above ground storage tanks are also used for water storage and conservation, chemical storage and sewage treatment plants.
II) Customer-specific custom moulding
1. India operations
The Company has enjoyed a legacy of partnering all major automobile OEMs operating in India in developing and delivering plastic parts and components for their vehicles for over three decades. The Company manufacturing facilities are proximate to all automobile assembling hubs in India, enabling it to bond healthy relations with automobile majors, and in turn leading to sustained growth in business volumes.
Capability-enhancing alliances in the area of product design (HIVEC, Japan), interior and exterior design and engineering (Daeji Metal Corp, Korea), design and manufacture of air induction systems and DFT design and development (Kautex) have enabled the Company to stay at the cutting edge of technology. In addition, it has seamlessly facilitated dynamic needs of the automobile sector.
As a prudent de-risking measure, Sintex leveraged its expertise and capabilities in the composites field to establish a meaningful presence in precision parts and off-highway component spaces, thereby creating flanking revenue verticals. Over the years, these verticals have emerged as important business and profitability drivers for the Company.
Automotive components: Sintex-BAPL Limited facilitates transformation of conventional metals and alloys used in automotives into polymeric material and composites. The reduced vehicle weight without compromising strength or efficiency also leads to greater fuel efficiency. Sintex thereby plays an important role in environmental conservation.
The Company specialises in manufacturing injection-moulded plastic components for the auto industry. It employs cutting-edge technologies like vacuum forming, PU foaming, ultrasonic and hotplate welding, spray painting, decorative painting and assembly to manufacture best-in-class products. The Group’s product basket comprises exterior and interior systems, under-the-hood systems and plastic components. As the largest business vertical it accounts for majority of overall revenues.
In 2017-18, the Company performed significantly better, owing to the addition of new customers and more business from existing ones.
Sintex secured business in Tata Motors for timing cover, engine cover and roof rail. It also secured business in new Hyundai Motors for design, development and supplies to existing platforms. In the two-wheeler segment, the team was able to increase their share of business with the TVS Group by ensuring parts supply for scooters and motorcycles.
As a prudent business strategy, the Company is working on graduating from static components to the more critical moving components. This is a business space which is relatively uncluttered owing to technology barriers and high precision operations. Sintex-BAPL has made considerable headway in this direction.
The Company’s recently commissioned state-of-the-art paint shop at its Oragadam plant (South India) received approvals from prestigious OEM’s in the region (Hyundai Motors, Ford Motors, Daimler India and TVS Motors). This enables the Company to provide an additional service to its clients.
The team is working closely with the M&M Group which seeks to convert select metal components to plastic. It promises to add value to the Company’s growth. Further, the Company has received new RFQs from Tata Motors, Force Motors and Hyundai Group companies for their upcoming programs. These factors hold promise for a healthy performance in the current year.
Since this is a long gestation business where the development to delivery cycle is prolonged, the Company periodically engages with prospective customers. The strategy promises business growth over the medium term. Accordingly, the team established contacts with new OEMs namely PSA, Kia Motors, M.G.Motors (SAIC Group), Foton Motors and received RFQs, a first step in the development cycle. The team intends to engage closely with its customers to transform these RFQs into confirmed business. Further, the Company is in discussion with various two-wheeler OEMs including VW, Isuzu, Honda Motorcycle, Suzuki Motorcycle, Yamaha and Royal Enfield on the prospects of establishing a healthy business relation over the medium term.
Precision parts: The Company forayed into the precision parts space and leveraged its association with Sintex NP, its European counterpart. The move addresses the requirements of electrical, auto-electrical and aerospace sectors to promote small/very small high precision parts.
Fiscal 2017-18 was a good year for the Company as business volumes increased from the electrical and auto-electrical spaces.
In the electrical space, the Company secured additional business volumes from Schneider as part of its vendor consolidation strategy. Higher demand and streamlined supplies achieved promising volumes with Socomec Group.
As part of its business development blueprint, the Company continued its discussion with global OEMs for supplies of electrical components for their Indian/global operations.
Sintex-BAPL plans to expand its Pithampur facility to cater to increased demand from existing customers and likely new demand arising from business development initiatives.
In the auto space, the Company maintained business volumes of airbag covers despite intense competition. The Company participated in the new airbag programs of Renault Nissan and Ford through TRW Rane. It was also awarded two new businesses of Borgwarner’s thermal division which should translate into business revenue in the current year.
With automotive industry gearing up to the BS-VI standards applicable from 2020, a host of safety features will become mandatory by 2020. This provides immense potential for Sintex-BAPL to expand business in the space of critical precision engine parts, fuel system parts and driver and passenger safety products. As the Company secures these businesses, it plans to add requisite capacities for precision injection moulding.
Off-highway components: The Group entered the off-highway products space following the commission of a new composite manufacturing facility equipped with LRTM (light resin transfer moulding) capabilities at Pune — the first of its kind composites unit in India. The unit bagged the prestigious order to develop and supply components to Siemens USA for an upcoming metro railway line in Calgary, Canada. Recently, the Group enhanced the capability of its LRTM facility by adding one of India’s most sophisticated new paint booths capable of painting large railway parts.
Fiscal 2017-18 was an inflection point for this business segment when Sintex entered into a global partnership with Alstom. The watermark to Company capabilities added expertise in this business space. As a result the Company was awarded AMTRAK program for supply of vestibule parts to Alstom USA for manufacture and delivery in the next three years.
As a first, the team started manufacturing train seats at the Pune LRTM cell for Siemens to be fitted in Calgary trains for modernization of existing rolling stock. The success has opened the door for a Sintex-BAPL pitch for two more seating programs in USA.
Further, on the international business front, the Company initiated commercial discussions with Alstom and Siemens on interior and exterior parts to be exported to the US and Europe.
In India, the Company pitched for FRP parts for the Mumbai Metro, new long distance train programs of Indian Railways and toilet modules for coaches.
Going forward, the Company is focused on establishing a strong presence in major metro projects in India. A host of new products involving metals parts-to plastic conversion, floor panels and SMC for interiors/exterior parts are under development towards this goal.
Moreover, the Company is exploring opportunities for export of off-highway FRP parts. To this end, Sintex-BAPL is co-ordinating with its subsidiary Sintex Logistics in the US to market its capabilities and credentials and to secure business from global OEMs there.
Sintex-BAPL plans to start HVAC assembly in India in the coming financial year, thus providing assembled HVAC solutions out of India to off-highway equipment players across the globe. The Company also plans to start developing injection moulded parts for key OEMs in this market segment over the coming years.
Awards and Recognition won by Sintex BAPL Sintex BAPL - ICM division (Auto Business) has been awarded in last one year with Hyundai- Best Performance Appreciation Award,
Hyundai - Best Performer for Inventory Management, SL Lumax- Appreciation Award for Container Management System, Schneider Electric- Kappa Robustness Award and Mahindra & Mahindra- Supplier Business Capability Building - Mentoring Zone. Sintex BAPL Ltd. also received ET Now HR Talent Management Leadership Award in category of Best Employer Brand Award.
BAPL Rototech Pvt. Ltd.
BAPL Rototech is a joint venture company between Sintex-BAPL and Rototech Srl (Italy). It manufactures plastic components using Roto-Moulding and Blow Moulding technologies for the needs of the Automotive industry in Commercial Vehicle (CV) segment in India and globally.
The Company’s product basket includes plastic fuel tanks, diesel exhaust fluid/urea tanks/ AdBlue tanks and CV exterior parts fender, mud guards, snorkels etc. manufactured at its operating facility in Pithampur, Madhya Pradesh.
Its customer profile includes some of the leading brands in the automotive sector, namely Volvo Eicher, Volvo (India, Thailand & Japan), Tata Motors, UD Truck, Escorts and Eicher Polaris.
With an objective towards pollution reduction, the Hon’ble Supreme Court of India has issued a directive to the Central Government to enforce BS-VI norms by 2020 for the automotive industry in general and the commercial vehicle segment in particular. This means that the Commercial Vehicle segment will progressively need to migrate from December 2019 to comply with BS-Vl norms and shift completely towards the use of Diesel Exhaust Fluid (DEF) Tank in all CV vehicle and plastic fuel tank for weight reduction. This opens interesting opportunity windows for the Company over the coming years.
Annual Report 2017 - 18 /4544
2. International operations European operations: The Sintex NP Group represents the Sintex presence in the European composites market. The Group has carved
a niche for itself on the back of its technological expertise and geographically-dispersed manufacturing facilities in Europe and North Africa.
The Sintex NP Group operates in France, Germany, Eastern Europe (Poland, Hungary and Slovakia) and North Africa (Tunisia and Morocco). It caters to players in car manufacture, electrical/electromechanical equipment manufacture, aeronautics/defense, household appliances, medical, construction, sport and leisure sectors, among others.
The Group’s key clients include globally-renowned brands like Faurecia, Schneider, Legrand, ABB, Areva, EADS, Siemens, Safran Aircraft Engines (previously Snecma), ThyssenKrupp Automotive, Valeo, Visteon, Alstom and General Motors among others.
Overall, Sintex NP has been Sintex’s most profitable business acquisition. It has made a sizeable contribution to business growth and profits. Sintex NP’s consolidated topline and net profit grew at a 5-year CAGR (upto 2016) of 11.38% and 7.17%, respectively.
In 2017, Group activity has been strong among most companies, driven by its market segments; in the second half of the year, growth was catalysed by the non-automotive sectors. While the consolidated revenue grew by close to 6%, net profit jumped by more than 15%.
During the year, the Group made another acquisition when NP JURA bought over the operating facility of Plastibell in October 2017. This addition to NP JURA will facilitate use of production capabilities with increase in profitability.
Research and development aligned to the Group’s strategic blueprint continued in 2017. Key projects initiated in 2016 on aeronautics thermoplastic composite applications gained momentum. The R&D team is also exploring ideas related to Plastronics with electronics solutions on soft supports.
An important change occurred in the Group’s legal structure when the management proceeded with a merger to absorb SINTEX NP from the parent company SINTEX FRANCE in December 2017.
The financial situation of the SINTEX NP, its European and North-African industrial footprint and technological differentiation, as well as the sectoral and client diversity are added advantages of the significantly improved economic conditions in Europe in 2018.
The US operations: Sintex Wausaukee Corporation had been supplying composite solutions to OEMs in a wide range of markets and had business relationship with globally-reputed companies in such as Caterpillar, Siemens, John Deere, New Flyer Industries, Case New Holland and Phillips Medical Systems, among others.
The business mandated a huge team of highly skilled personnel which resulted in a high cost operation. Depressed demand in the user sectors coupled with high cost of operations leg towards significant performance pressure. Year 2017 did not result in significant improvement in the financial performance of Sintex Wausaukee. As a result, in the second half of 2017, Sintex Wausaukee Composites (SWC) was sold to a major customer Carfair Composites USA Inc.
Sintex Logistics LLC Prior to the closure of Sintex Wausaukee, the Group formed Sintex Logistics, LLC to maintain its presence in the world’s largest economy.
This Company will be a step-down subsidiary of Sintex-BAPL Limited. Its focus will be on developing business opportunities with OEMs in North America, for which solutions would be developed by Sintex BAPL in India.
The foundation of this business is pivotal to the supply of SMC parts from Sintex BAPL in Kalol to OEM Cummins Power. In addition, the Company also has confirmed orders from Alstom Transportation and Siemens Mobility to supply parts to them in 2018.
This outsourcing model is expected to assist the American business conglomerates to optimise costs, and had generated considerable interest. The Company expects the business to grow at about 40% CAGR for next three years.
Sintex Prefab & Infra Limited This business comprises of two distinct segments – the social infrastructure segment and the infrastructure piece.
Social infrastructure: This segment consists of the prefabricated structures (Prefabs) and monolithic construction verticals. Both are novel technologies for creating social infrastructure economically and with speed.
Prefabricated structures: The prefabricated structures are completely knock-down kits that are generally assembled at the site by trained professionals, thereby minimizing wastage and improving their cost effectiveness. It positioned prefabs as India’s preferred solution for strengthening community infrastructure comprising of toilet blocks, mid-day meal kitchens, health-care centres, classrooms and hostels, police chowkis, camps for labourers and army shelters, among others.
These basic amenities have remained largely overlooked during the previous two decades. As a result, the demand for these products is largely driven by governmental policies and budgetary allocations. The recent corporate mandate to invest a portion of profits towards social upliftment initiatives has driven the demand for prefabs. Governmental initiatives like the Swachh Bharat Abhiyan, Sarva Shiksha Abhiyan and the Clean Ganga Mission are key drivers for this vertical.
Sintex’s prefab portfolio comprises toilet blocks, kitchens, health centres, classrooms and hostels, police chowkis and site offices, among others. The Company’s manufacturing plants cover 80% of India’s geography for execution with different materials for various climatic conditions, utility structures, sanitation programs and varied requirements.
Monolithic construction: Having pioneered this technology in 2005 in India, Sintex continues to remain the dominant player in this space. Monolithic construction offers various benefits such as time and cost saving, strength and eco-friendliness as compared to traditional techniques. This positions it as preferred construction technique for low-cost residential projects and hence critical in addressing the national housing shortage. The Group manufactures formwork in-house, which facilitates an assured low-cost, high-quality resource availability and product customisaton, an edge over those who need to import the formwork. Although returns from this business are healthy, the elongated working capital cycle puts pressure on overall business profitability. As a result, the Group has taken a strategic decision to reduce its exposure in this business.
Infrastructure projects: In less than six years of business operation, the Group has completed large important projects, strengthening its expertise in civil and mechanical construction. The Company’s most recent completion was the successful completion of Phases I and II of the spinning unit of Sintex Industries Limited.
In mass housing Sintex successfully executed a project of Puducherry Slum Clearance Board, LDA Para projects (EWS, MMIG & LIG and Phase 1 to 6).
In the social infrastructure space the Company executed and delivered a sizeable number of projects in rural health, port cabin huts for the Police Housing Board, schools, mid-day meal kitchens, creche for children, housing, schools and anganwadis etc.
The Company continues to dominate temporary shelter space and portable housing segment with bunk housing solutions. In addition, the Company retained its leadership position in toilet blocks by delivering these unique solutions in bulk to key CSR companies which build large scale community toilet blocks to support CSR initiative ‘Making India open defecation free’.
The Company also received heartening business volumes from the corporate sector to implement CSR initiatives under the Swachch Bharat Abhiyan. In order to meet the portability requirement in the sanitation segment, we developed Mobile Toilet Van in various sizes. In addition, the Company also developed practical and dependable solutions for desk and rack for rural schooling sector which was well received by the customer segment.
The Government’s drive to uplift the rural masses in India through its path-breaking policies holds promise for sustaining the Company’s growth momentum over the coming years.
Further, the Government’s focus on modernizing and creating new infrastructure augurs well for the growth of this business segment going forward. The management will continue to cherry pick projects which promise seamless execution and regular cash flow as it would help in improve overall organisational profitability.
Human resources Sintex believes that its intellectual capital represents its most valuable asset, from the top floor to the shop floor. In line with this, the
Company has positioned employee engagement as a key priority. Even as the Company increased its presence across various business segments, its stringent HR goals have helped create an organisation which is recognised as a ‘centre of excellence’. The Company’s endeavour was not just to increase its workforce in simple numerical terms, but to ensure that competencies are enhanced in line with changing business needs. Consequently, different teams have collaborated to create an optimal working culture, inculcate industry-best practices and foster an ethically-motivated culture. The Group comprised a 5391-strong workforce as on March 31, 2018.
Risk management Risk management at Sintex Plastics Technology is an integral part of the business model, focusing on making the business model
emerge stronger and ensuring that profitable business growth becomes sustainable. The risk management framework encompasses strategy and operations and seeks to proactively identify, address and mitigate existing and emerging risks. The risk management framework goes beyond traditional boundaries in order to involve all key managers of the Company.
Internal control systems At Sintex, rigorous internal control systems and procedures have facilitated optimal resource utilisation. The Company has put in place
a seamless system of checks and balances at every stage of the production and dispatch cycle, ensured strict operational and quality compliance and removed procedural bottlenecks. An Audit Committee headed by a Non-Executive Independent Director, reviews audit observations on a periodic basis.
Cautionary statement This document contains statements about expected events, and financial and forward-looking operational results of Sintex Plastics
Technology Limited. By their nature, forward-looking statements require the Company to make assumptions and are subject to inherent risks and uncertainties. There is a significant chance that the assumptions, predictions and other forward-looking statements may not prove to be accurate. Readers are cautioned not to place undue reliance on forward-looking statements as a number of factors could cause assumptions, and actual results and events to differ materially from those expressed here.
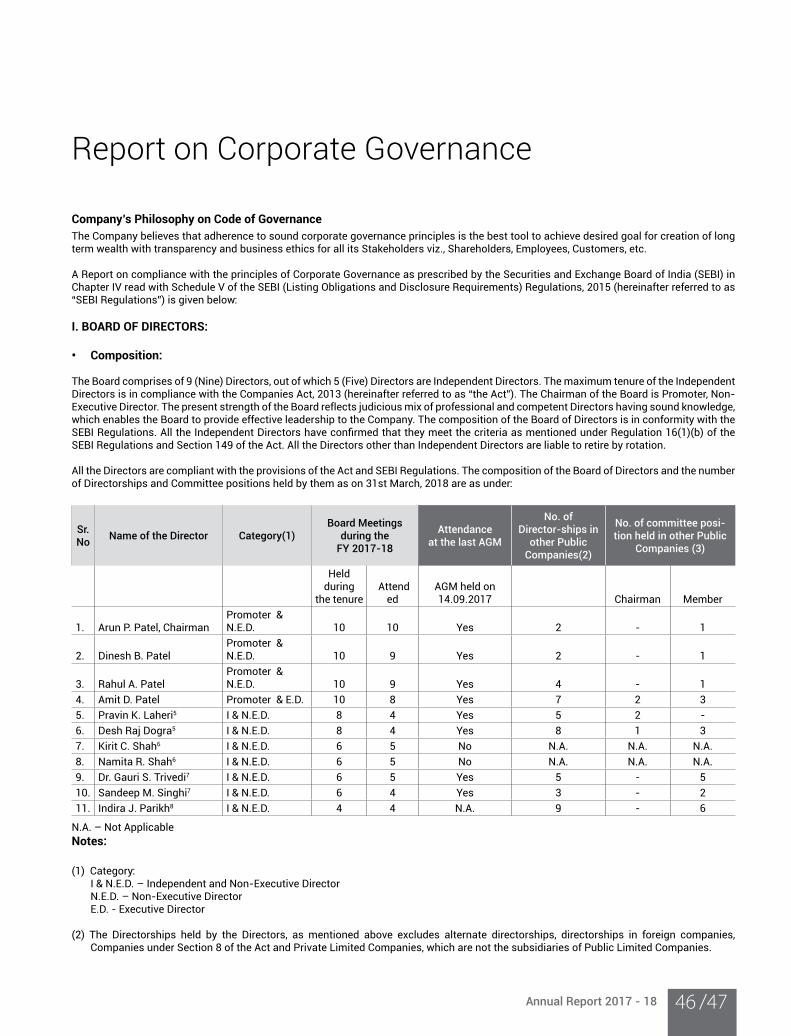
Annual Report 2017 - 18 /4746
Report on Corporate Governance
Company’s Philosophy on Code of GovernanceThe Company believes that adherence to sound corporate governance principles is the best tool to achieve desired goal for creation of long term wealth with transparency and business ethics for all its Stakeholders viz., Shareholders, Employees, Customers, etc.
A Report on compliance with the principles of Corporate Governance as prescribed by the Securities and Exchange Board of India (SEBI) in Chapter IV read with Schedule V of the SEBI (Listing Obligations and Disclosure Requirements) Regulations, 2015 (hereinafter referred to as “SEBI Regulations”) is given below:
I. BOARD OF DIRECTORS:
• Composition:
The Board comprises of 9 (Nine) Directors, out of which 5 (Five) Directors are Independent Directors. The maximum tenure of the Independent Directors is in compliance with the Companies Act, 2013 (hereinafter referred to as “the Act”). The Chairman of the Board is Promoter, Non-Executive Director. The present strength of the Board reflects judicious mix of professional and competent Directors having sound knowledge, which enables the Board to provide effective leadership to the Company. The composition of the Board of Directors is in conformity with the SEBI Regulations. All the Independent Directors have confirmed that they meet the criteria as mentioned under Regulation 16(1)(b) of the SEBI Regulations and Section 149 of the Act. All the Directors other than Independent Directors are liable to retire by rotation.
All the Directors are compliant with the provisions of the Act and SEBI Regulations. The composition of the Board of Directors and the number of Directorships and Committee positions held by them as on 31st March, 2018 are as under:
Sr. No
Name of the Director Category(1) Board Meetings
during the FY 2017-18
Attendanceat the last AGM
No. ofDirector-ships in
other Public Companies(2)
No. of committee posi-tion held in other Public
Companies (3)
Held during
the tenure Attend
edAGM held on 14.09.2017 Chairman Member
1. Arun P. Patel, ChairmanPromoter & N.E.D. 10 10 Yes 2 - 1
2. Dinesh B. PatelPromoter & N.E.D. 10 9 Yes 2 - 1
3. Rahul A. PatelPromoter & N.E.D. 10 9 Yes 4 - 1
4. Amit D. Patel Promoter & E.D. 10 8 Yes 7 2 3
5. Pravin K. Laheri5 I & N.E.D. 8 4 Yes 5 2 -
6. Desh Raj Dogra5 I & N.E.D. 8 4 Yes 8 1 3
7. Kirit C. Shah6 I & N.E.D. 6 5 No N.A. N.A. N.A.
8. Namita R. Shah6 I & N.E.D. 6 5 No N.A. N.A. N.A.
9. Dr. Gauri S. Trivedi7 I & N.E.D. 6 5 Yes 5 - 5
10. Sandeep M. Singhi7 I & N.E.D. 6 4 Yes 3 - 2
11. Indira J. Parikh8 I & N.E.D. 4 4 N.A. 9 - 6
N.A. – Not Applicable
Notes:
(1) Category: I & N.E.D. – Independent and Non-Executive Director N.E.D. – Non-Executive Director E.D. - Executive Director
(2) The Directorships held by the Directors, as mentioned above excludes alternate directorships, directorships in foreign companies, Companies under Section 8 of the Act and Private Limited Companies, which are not the subsidiaries of Public Limited Companies.
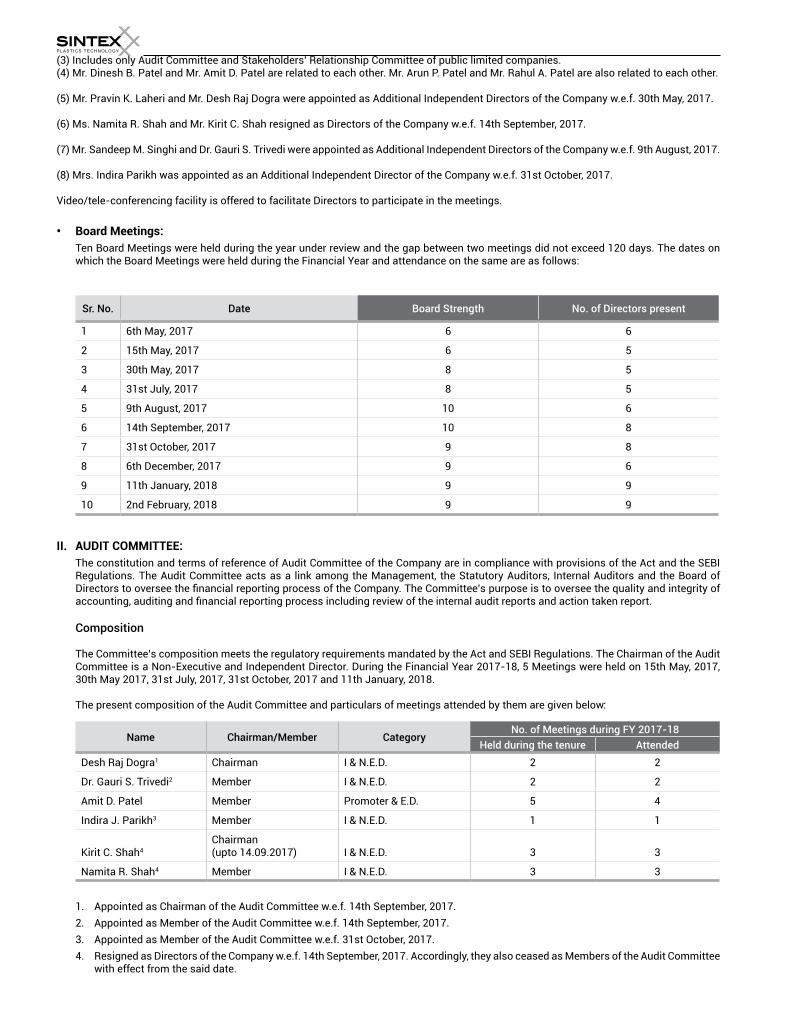
(3) Includes only Audit Committee and Stakeholders’ Relationship Committee of public limited companies.(4) Mr. Dinesh B. Patel and Mr. Amit D. Patel are related to each other. Mr. Arun P. Patel and Mr. Rahul A. Patel are also related to each other.
(5) Mr. Pravin K. Laheri and Mr. Desh Raj Dogra were appointed as Additional Independent Directors of the Company w.e.f. 30th May, 2017.
(6) Ms. Namita R. Shah and Mr. Kirit C. Shah resigned as Directors of the Company w.e.f. 14th September, 2017.
(7) Mr. Sandeep M. Singhi and Dr. Gauri S. Trivedi were appointed as Additional Independent Directors of the Company w.e.f. 9th August, 2017.
(8) Mrs. Indira Parikh was appointed as an Additional Independent Director of the Company w.e.f. 31st October, 2017.
Video/tele-conferencing facility is offered to facilitate Directors to participate in the meetings.
• Board Meetings:
Ten Board Meetings were held during the year under review and the gap between two meetings did not exceed 120 days. The dates on which the Board Meetings were held during the Financial Year and attendance on the same are as follows:
Sr. No. Date Board Strength No. of Directors present
1 6th May, 2017 6 6
2 15th May, 2017 6 5
3 30th May, 2017 8 5
4 31st July, 2017 8 5
5 9th August, 2017 10 6
6 14th September, 2017 10 8
7 31st October, 2017 9 8
8 6th December, 2017 9 6
9 11th January, 2018 9 9
10 2nd February, 2018 9 9
II. AUDIT COMMITTEE:
The constitution and terms of reference of Audit Committee of the Company are in compliance with provisions of the Act and the SEBI Regulations. The Audit Committee acts as a link among the Management, the Statutory Auditors, Internal Auditors and the Board of Directors to oversee the financial reporting process of the Company. The Committee’s purpose is to oversee the quality and integrity of accounting, auditing and financial reporting process including review of the internal audit reports and action taken report.
Composition
The Committee’s composition meets the regulatory requirements mandated by the Act and SEBI Regulations. The Chairman of the Audit Committee is a Non-Executive and Independent Director. During the Financial Year 2017-18, 5 Meetings were held on 15th May, 2017, 30th May 2017, 31st July, 2017, 31st October, 2017 and 11th January, 2018.
The present composition of the Audit Committee and particulars of meetings attended by them are given below:
Name Chairman/Member CategoryNo. of Meetings during FY 2017-18
Held during the tenure Attended
Desh Raj Dogra1 Chairman I & N.E.D. 2 2
Dr. Gauri S. Trivedi2 Member I & N.E.D. 2 2
Amit D. Patel Member Promoter & E.D. 5 4
Indira J. Parikh3 Member I & N.E.D. 1 1
Kirit C. Shah4
Chairman(upto 14.09.2017) I & N.E.D. 3 3
Namita R. Shah4 Member I & N.E.D. 3 3
1. Appointed as Chairman of the Audit Committee w.e.f. 14th September, 2017.
2. Appointed as Member of the Audit Committee w.e.f. 14th September, 2017.
3. Appointed as Member of the Audit Committee w.e.f. 31st October, 2017.
4. Resigned as Directors of the Company w.e.f. 14th September, 2017. Accordingly, they also ceased as Members of the Audit Committee with effect from the said date.
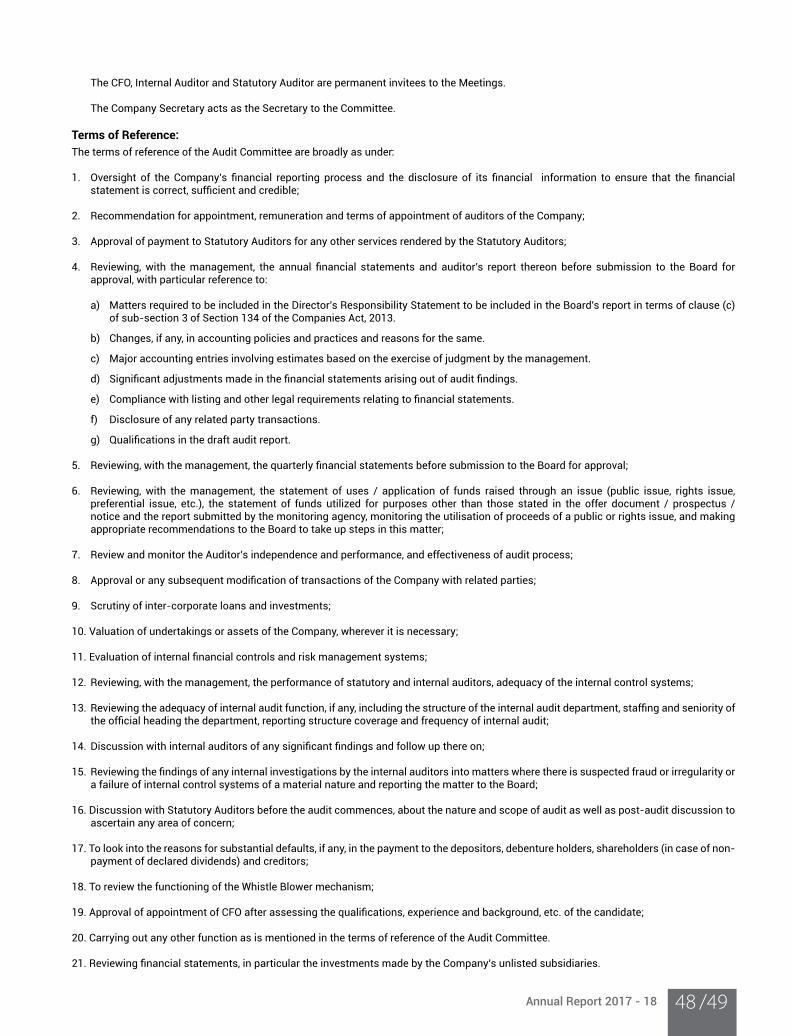
Annual Report 2017 - 18 /4948
The CFO, Internal Auditor and Statutory Auditor are permanent invitees to the Meetings.
The Company Secretary acts as the Secretary to the Committee.
Terms of Reference:The terms of reference of the Audit Committee are broadly as under:
1. Oversight of the Company's financial reporting process and the disclosure of its financial information to ensure that the financial statement is correct, sufficient and credible;
2. Recommendation for appointment, remuneration and terms of appointment of auditors of the Company;
3. Approval of payment to Statutory Auditors for any other services rendered by the Statutory Auditors;
4. Reviewing, with the management, the annual financial statements and auditor's report thereon before submission to the Board for approval, with particular reference to:
a) Matters required to be included in the Director's Responsibility Statement to be included in the Board's report in terms of clause (c) of sub-section 3 of Section 134 of the Companies Act, 2013.
b) Changes, if any, in accounting policies and practices and reasons for the same.
c) Major accounting entries involving estimates based on the exercise of judgment by the management.
d) Significant adjustments made in the financial statements arising out of audit findings.
e) Compliance with listing and other legal requirements relating to financial statements.
f) Disclosure of any related party transactions.
g) Qualifications in the draft audit report.
5. Reviewing, with the management, the quarterly financial statements before submission to the Board for approval;
6. Reviewing, with the management, the statement of uses / application of funds raised through an issue (public issue, rights issue, preferential issue, etc.), the statement of funds utilized for purposes other than those stated in the offer document / prospectus / notice and the report submitted by the monitoring agency, monitoring the utilisation of proceeds of a public or rights issue, and making appropriate recommendations to the Board to take up steps in this matter;
7. Review and monitor the Auditor's independence and performance, and effectiveness of audit process;
8. Approval or any subsequent modification of transactions of the Company with related parties;
9. Scrutiny of inter-corporate loans and investments;
10. Valuation of undertakings or assets of the Company, wherever it is necessary;
11. Evaluation of internal financial controls and risk management systems;
12. Reviewing, with the management, the performance of statutory and internal auditors, adequacy of the internal control systems;
13. Reviewing the adequacy of internal audit function, if any, including the structure of the internal audit department, staffing and seniority of the official heading the department, reporting structure coverage and frequency of internal audit;
14. Discussion with internal auditors of any significant findings and follow up there on;
15. Reviewing the findings of any internal investigations by the internal auditors into matters where there is suspected fraud or irregularity or a failure of internal control systems of a material nature and reporting the matter to the Board;
16. Discussion with Statutory Auditors before the audit commences, about the nature and scope of audit as well as post-audit discussion to ascertain any area of concern;
17. To look into the reasons for substantial defaults, if any, in the payment to the depositors, debenture holders, shareholders (in case of non-payment of declared dividends) and creditors;
18. To review the functioning of the Whistle Blower mechanism;
19. Approval of appointment of CFO after assessing the qualifications, experience and background, etc. of the candidate;
20. Carrying out any other function as is mentioned in the terms of reference of the Audit Committee.
21. Reviewing financial statements, in particular the investments made by the Company's unlisted subsidiaries.
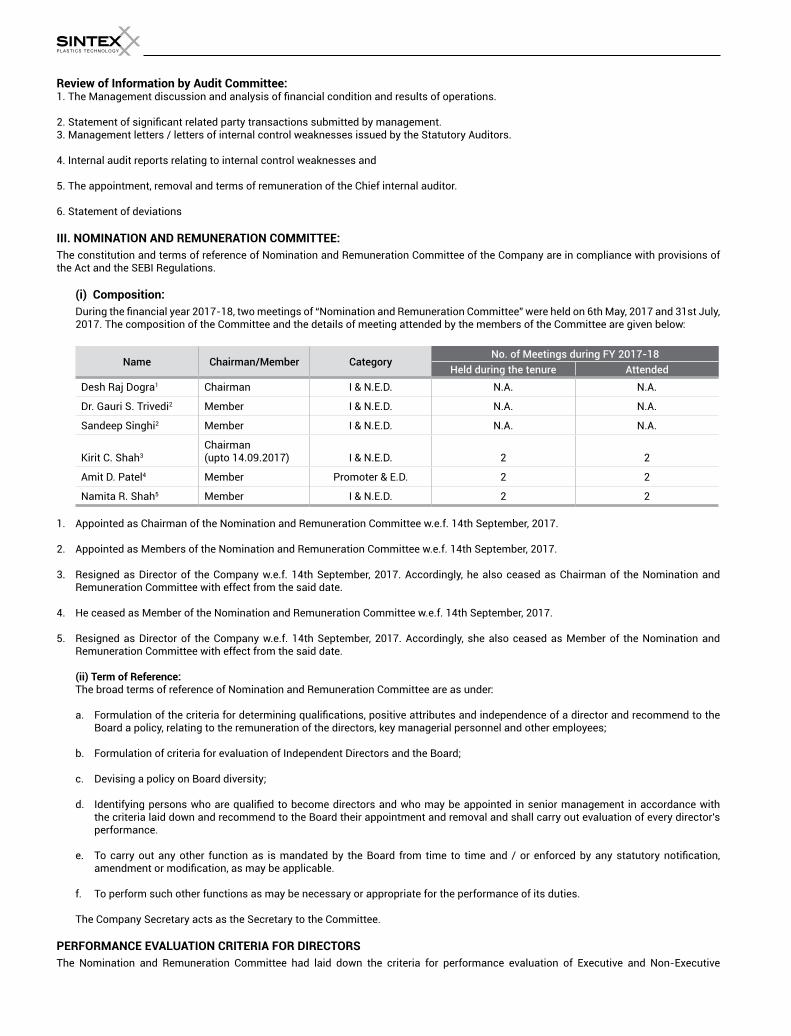
Review of Information by Audit Committee:1. The Management discussion and analysis of financial condition and results of operations.
2. Statement of significant related party transactions submitted by management.3. Management letters / letters of internal control weaknesses issued by the Statutory Auditors.
4. Internal audit reports relating to internal control weaknesses and
5. The appointment, removal and terms of remuneration of the Chief internal auditor.
6. Statement of deviations
III. NOMINATION AND REMUNERATION COMMITTEE:
The constitution and terms of reference of Nomination and Remuneration Committee of the Company are in compliance with provisions of the Act and the SEBI Regulations.
(i) Composition: During the financial year 2017-18, two meetings of “Nomination and Remuneration Committee” were held on 6th May, 2017 and 31st July,
2017. The composition of the Committee and the details of meeting attended by the members of the Committee are given below:
Name Chairman/Member CategoryNo. of Meetings during FY 2017-18
Held during the tenure Attended
Desh Raj Dogra1 Chairman I & N.E.D. N.A. N.A.
Dr. Gauri S. Trivedi2 Member I & N.E.D. N.A. N.A.
Sandeep Singhi2 Member I & N.E.D. N.A. N.A.
Kirit C. Shah3
Chairman(upto 14.09.2017) I & N.E.D. 2 2
Amit D. Patel4 Member Promoter & E.D. 2 2
Namita R. Shah5 Member I & N.E.D. 2 2
1. Appointed as Chairman of the Nomination and Remuneration Committee w.e.f. 14th September, 2017.
2. Appointed as Members of the Nomination and Remuneration Committee w.e.f. 14th September, 2017.
3. Resigned as Director of the Company w.e.f. 14th September, 2017. Accordingly, he also ceased as Chairman of the Nomination and Remuneration Committee with effect from the said date.
4. He ceased as Member of the Nomination and Remuneration Committee w.e.f. 14th September, 2017.
5. Resigned as Director of the Company w.e.f. 14th September, 2017. Accordingly, she also ceased as Member of the Nomination and Remuneration Committee with effect from the said date.
(ii) Term of Reference: The broad terms of reference of Nomination and Remuneration Committee are as under:
a. Formulation of the criteria for determining qualifications, positive attributes and independence of a director and recommend to the Board a policy, relating to the remuneration of the directors, key managerial personnel and other employees;
b. Formulation of criteria for evaluation of Independent Directors and the Board;
c. Devising a policy on Board diversity;
d. Identifying persons who are qualified to become directors and who may be appointed in senior management in accordance with the criteria laid down and recommend to the Board their appointment and removal and shall carry out evaluation of every director's performance.
e. To carry out any other function as is mandated by the Board from time to time and / or enforced by any statutory notification, amendment or modification, as may be applicable.
f. To perform such other functions as may be necessary or appropriate for the performance of its duties.
The Company Secretary acts as the Secretary to the Committee.
PERFORMANCE EVALUATION CRITERIA FOR DIRECTORS
The Nomination and Remuneration Committee had laid down the criteria for performance evaluation of Executive and Non-Executive
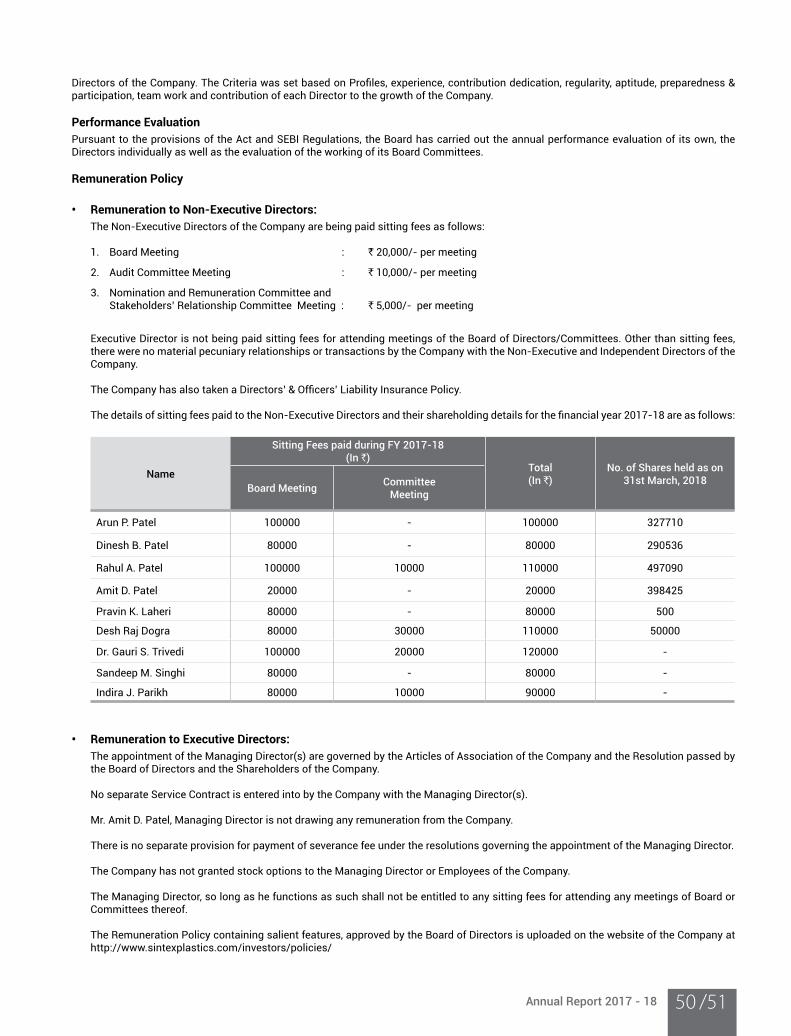
Annual Report 2017 - 18 /5150
Directors of the Company. The Criteria was set based on Profiles, experience, contribution dedication, regularity, aptitude, preparedness & participation, team work and contribution of each Director to the growth of the Company.
Performance EvaluationPursuant to the provisions of the Act and SEBI Regulations, the Board has carried out the annual performance evaluation of its own, the Directors individually as well as the evaluation of the working of its Board Committees.
Remuneration Policy
• Remuneration to Non-Executive Directors: The Non-Executive Directors of the Company are being paid sitting fees as follows:
1. Board Meeting : ` 20,000/- per meeting
2. Audit Committee Meeting : ` 10,000/- per meeting
3. Nomination and Remuneration Committee and Stakeholders’ Relationship Committee Meeting : ` 5,000/- per meeting
Executive Director is not being paid sitting fees for attending meetings of the Board of Directors/Committees. Other than sitting fees, there were no material pecuniary relationships or transactions by the Company with the Non-Executive and Independent Directors of the Company.
The Company has also taken a Directors’ & Officers’ Liability Insurance Policy.
The details of sitting fees paid to the Non-Executive Directors and their shareholding details for the financial year 2017-18 are as follows:
Name
Sitting Fees paid during FY 2017-18(In `)
Total(In `)
No. of Shares held as on 31st March, 2018
Board Meeting CommitteeMeeting
Arun P. Patel 100000 - 100000 327710
Dinesh B. Patel 80000 - 80000 290536
Rahul A. Patel 100000 10000 110000 497090
Amit D. Patel 20000 - 20000 398425
Pravin K. Laheri 80000 - 80000 500
Desh Raj Dogra 80000 30000 110000 50000
Dr. Gauri S. Trivedi 100000 20000 120000 -
Sandeep M. Singhi 80000 - 80000 -
Indira J. Parikh 80000 10000 90000 -
• Remuneration to Executive Directors: The appointment of the Managing Director(s) are governed by the Articles of Association of the Company and the Resolution passed by
the Board of Directors and the Shareholders of the Company.
No separate Service Contract is entered into by the Company with the Managing Director(s).
Mr. Amit D. Patel, Managing Director is not drawing any remuneration from the Company.
There is no separate provision for payment of severance fee under the resolutions governing the appointment of the Managing Director.
The Company has not granted stock options to the Managing Director or Employees of the Company.
The Managing Director, so long as he functions as such shall not be entitled to any sitting fees for attending any meetings of Board or Committees thereof.
The Remuneration Policy containing salient features, approved by the Board of Directors is uploaded on the website of the Company at http://www.sintexplastics.com/investors/policies/
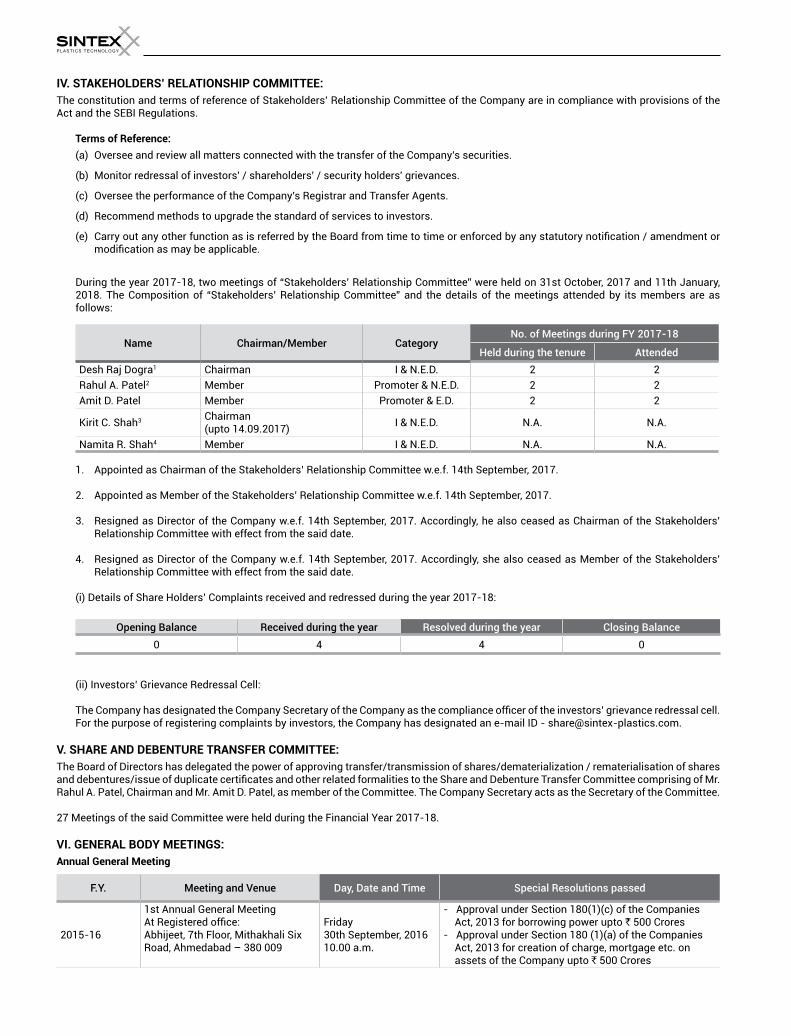
IV. STAKEHOLDERS’ RELATIONSHIP COMMITTEE:
The constitution and terms of reference of Stakeholders’ Relationship Committee of the Company are in compliance with provisions of the Act and the SEBI Regulations.
Terms of Reference:(a) Oversee and review all matters connected with the transfer of the Company's securities.
(b) Monitor redressal of investors' / shareholders' / security holders' grievances.
(c) Oversee the performance of the Company's Registrar and Transfer Agents.
(d) Recommend methods to upgrade the standard of services to investors.
(e) Carry out any other function as is referred by the Board from time to time or enforced by any statutory notification / amendment or modification as may be applicable.
During the year 2017-18, two meetings of “Stakeholders’ Relationship Committee” were held on 31st October, 2017 and 11th January, 2018. The Composition of “Stakeholders’ Relationship Committee” and the details of the meetings attended by its members are as follows:
Name Chairman/Member CategoryNo. of Meetings during FY 2017-18
Held during the tenure Attended
Desh Raj Dogra1 Chairman I & N.E.D. 2 2
Rahul A. Patel2 Member Promoter & N.E.D. 2 2
Amit D. Patel Member Promoter & E.D. 2 2
Kirit C. Shah3 Chairman(upto 14.09.2017)
I & N.E.D. N.A. N.A.
Namita R. Shah4 Member I & N.E.D. N.A. N.A.
1. Appointed as Chairman of the Stakeholders’ Relationship Committee w.e.f. 14th September, 2017.
2. Appointed as Member of the Stakeholders’ Relationship Committee w.e.f. 14th September, 2017.
3. Resigned as Director of the Company w.e.f. 14th September, 2017. Accordingly, he also ceased as Chairman of the Stakeholders’ Relationship Committee with effect from the said date.
4. Resigned as Director of the Company w.e.f. 14th September, 2017. Accordingly, she also ceased as Member of the Stakeholders’ Relationship Committee with effect from the said date.
(i) Details of Share Holders’ Complaints received and redressed during the year 2017-18:
Opening Balance Received during the year Resolved during the year Closing Balance0 4 4 0
(ii) Investors’ Grievance Redressal Cell:
The Company has designated the Company Secretary of the Company as the compliance officer of the investors’ grievance redressal cell. For the purpose of registering complaints by investors, the Company has designated an e-mail ID - [email protected].
V. SHARE AND DEBENTURE TRANSFER COMMITTEE:
The Board of Directors has delegated the power of approving transfer/transmission of shares/dematerialization / rematerialisation of shares and debentures/issue of duplicate certificates and other related formalities to the Share and Debenture Transfer Committee comprising of Mr. Rahul A. Patel, Chairman and Mr. Amit D. Patel, as member of the Committee. The Company Secretary acts as the Secretary of the Committee.
27 Meetings of the said Committee were held during the Financial Year 2017-18.
VI. GENERAL BODY MEETINGS:
Annual General Meeting
F.Y. Meeting and Venue Day, Date and Time Special Resolutions passed
2015-16
1st Annual General Meeting At Registered office:Abhijeet, 7th Floor, Mithakhali Six Road, Ahmedabad – 380 009
Friday30th September, 201610.00 a.m.
- Approval under Section 180(1)(c) of the Companies Act, 2013 for borrowing power upto ` 500 Crores
- Approval under Section 180 (1)(a) of the Companies Act, 2013 for creation of charge, mortgage etc. on assets of the Company upto ` 500 Crores
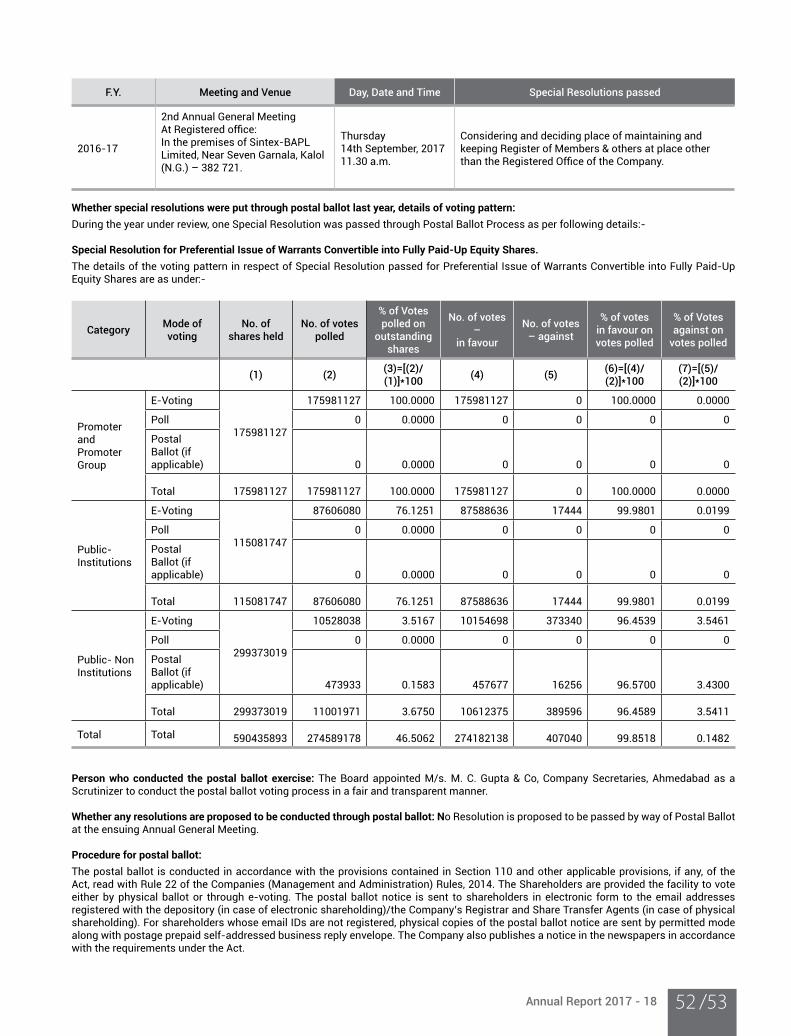
Annual Report 2017 - 18 /5352
F.Y. Meeting and Venue Day, Date and Time Special Resolutions passed
2016-17
2nd Annual General MeetingAt Registered office:In the premises of Sintex-BAPL Limited, Near Seven Garnala, Kalol (N.G.) – 382 721.
Thursday14th September, 201711.30 a.m.
Considering and deciding place of maintaining and keeping Register of Members & others at place other than the Registered Office of the Company.
Whether special resolutions were put through postal ballot last year, details of voting pattern:During the year under review, one Special Resolution was passed through Postal Ballot Process as per following details:-
Special Resolution for Preferential Issue of Warrants Convertible into Fully Paid-Up Equity Shares.
The details of the voting pattern in respect of Special Resolution passed for Preferential Issue of Warrants Convertible into Fully Paid-Up Equity Shares are as under:-
Category Mode of voting
No. of shares held
No. of votes polled
% of Votes polled on
outstanding shares
No. of votes –
in favour
No. of votes – against
% of votes in favour on votes polled
% of Votes against on
votes polled
(1) (2)(3)=[(2)/(1)]*100 (4) (5)
(6)=[(4)/(2)]*100
(7)=[(5)/(2)]*100
Promoter and Promoter Group
E-Voting
175981127
175981127 100.0000 175981127 0 100.0000 0.0000
Poll 0 0.0000 0 0 0 0
Postal Ballot (if applicable) 0 0.0000 0 0 0 0
Total 175981127 175981127 100.0000 175981127 0 100.0000 0.0000
Public- Institutions
E-Voting
115081747
87606080 76.1251 87588636 17444 99.9801 0.0199
Poll 0 0.0000 0 0 0 0
Postal Ballot (if applicable) 0 0.0000 0 0 0 0
Total 115081747 87606080 76.1251 87588636 17444 99.9801 0.0199
Public- Non Institutions
E-Voting
299373019
10528038 3.5167 10154698 373340 96.4539 3.5461
Poll 0 0.0000 0 0 0 0
Postal Ballot (if applicable) 473933 0.1583 457677 16256 96.5700 3.4300
Total 299373019 11001971 3.6750 10612375 389596 96.4589 3.5411
Total Total 590435893 274589178 46.5062 274182138 407040 99.8518 0.1482
Person who conducted the postal ballot exercise: The Board appointed M/s. M. C. Gupta & Co, Company Secretaries, Ahmedabad as a Scrutinizer to conduct the postal ballot voting process in a fair and transparent manner.
Whether any resolutions are proposed to be conducted through postal ballot: No Resolution is proposed to be passed by way of Postal Ballot at the ensuing Annual General Meeting.
Procedure for postal ballot:
The postal ballot is conducted in accordance with the provisions contained in Section 110 and other applicable provisions, if any, of the Act, read with Rule 22 of the Companies (Management and Administration) Rules, 2014. The Shareholders are provided the facility to vote either by physical ballot or through e-voting. The postal ballot notice is sent to shareholders in electronic form to the email addresses registered with the depository (in case of electronic shareholding)/the Company’s Registrar and Share Transfer Agents (in case of physical shareholding). For shareholders whose email IDs are not registered, physical copies of the postal ballot notice are sent by permitted mode along with postage prepaid self-addressed business reply envelope. The Company also publishes a notice in the newspapers in accordance with the requirements under the Act.
The Company fixes a cut-off date to reckon paid-up value of equity shares registered in the name of shareholders for the purpose of voting. Shareholders may cast their votes through e-voting during the voting period fixed for this purpose. Alternatively, shareholders may exercise their votes through physical ballot by sending duly completed and signed forms so as to reach the scrutinizer before a specified date and time. After completion of scrutiny of votes, the scrutinizer submits his report to the Chairman and the results of voting by postal ballot are announced by the Chairman or any Director of the Company duly authorized within 48 hours of conclusion of the voting period. The results are also displayed on the website of the Company (www.sintexplastics.com), besides being communicated to the Stock Exchanges, Depositories and Registrar and Share Transfer Agents. The resolutions, if passed by the requisite majority are deemed to have been passed on the last date specified for receipt of duly completed postal ballot forms or e-voting.
VII. SUBSIDIARY COMPANIES:
The Company has two material listed Indian subsidiary companies and therefore, the requirement of inducting an Independent Director of Holding Company on the Board of Directors of the subsidiary company is not applicable.
The financial statements, in particular the investments made by the unlisted subsidiary companies are reviewed quarterly by the Audit Committee of the Company. The minutes of the meetings of unlisted subsidiary companies are placed before the Company’s Board regularly.
The Board of Directors also reviews statement containing all significant transactions and arrangements entered into by the unlisted subsidiary companies.
The policy for determining Material Subsidiary as approved by the Board may be accessed on the Company’s website at the link: http://www.sintexplastics.com/investors/policies/
VIII. OTHER DISCLOSURES:
(i) Disclosure on materially significant related party transactions: No transactions of material nature have been entered into by your Company with any related parties as per Accounting Standard that may
have any potential conflict with the interests of your Company. The related party transactions have been disclosed in the financial section of Annual Report. The Audit Committee reviewed the related party transactions undertaken by the Company in the ordinary course of business.
Policy on materiality and dealing with related party transactions, approved by the Board of Directors is uploaded on the website of the Company at http://www.sintexplastics.com/investors/policies/
(ii) Details of non-compliance by the Company: There were no instances of non-compliance by the Company on any matters related to various capital markets or penalties imposed on
the Company by the Stock Exchange or SEBI or any statutory authority during the last 3 financial years. (iii) Code of Conduct: The Company has formulated and implemented a Code of Conduct for Board Members and Senior Management Personnel of the
Company, which is also posted on the website of the Company.
Requisite annual affirmations of compliance with the respective Codes have been made by the Directors and Senior Management of the Company.
(iv) CEO and CFO Certification: The Managing Director and the Chief Financial Officer of the Company give annual certification on financial reporting and internal
controls to the Board in terms of Regulation 17(8) of the SEBI Regulations. The Managing Director and the Chief Financial Officer also give quarterly certification on financial results while placing the financial results before the Board in terms of Regulation 33 of the SEBI Regulations.
(V) Code of Conduct for Prevention of Insider Trading: Code of Conduct for Prevention of Insider Trading, as approved by the Board of Directors, inter alia, prohibits purchase / sale of securities
of the Company by Directors and employees, while in possession of unpublished price sensitive information in relation to the Company.
(Vi) Compliance with the Mandatory Requirements of the SEBI Regulations: The Company has complied with all the mandatory requirements of the Code of Corporate Governance as stipulated under the SEBI
Regulations and has also updated its website under Regulation 46(2) of the SEBI Regulations. It has obtained a certificate affirming the compliances from Messrs R Choudhary & Associates, the Company's Statutory Auditors and the same is attached to this Report.
(Vii) Whistle Blower Policy: The Company has adopted a Whistle Blower Policy and has established the necessary vigil mechanism in line with the requirements
under the Act and the SEBI Regulations:
• For employees to report concerns about unethical behavior;
• To establish a mechanism to report to the management, concerns about unethical behavior, actual or suspected fraud or violation of the Integrity Policy; and
Annual Report 2017 - 18 /5554
• To ensure that adequate safeguards shall be provided to the whistle blowers against any victimization or vindictive practices like retaliation, threat or any adverse (direct or indirect) action on their employment and direct access to the Chairperson of the Audit Committee in exceptional cases. The Policy also ensures that strict confidentiality is maintained whilst dealing with concerns and also that no discrimination will be meted out to any person for a genuinely raised concern.
No personnel/ person has been denied access to the Audit Committee. During the year under review, there were no cases pertaining to
Whistle Blower Policy.
(Viii) Pursuant to regulation 43A of SEBI Regulations, the Board approved a Dividend Distribution Policy at its meeting held on May 9, 2018. The policy details various considerations based on which the Board may recommend or declare Dividend, current dividend track record, usage of retained earnings for corporate actions, etc. The policy is available on the Company’s website at http://www.sintexplastics.com/investors/policies/
(ix) The Company has not engaged in any activity involving commodity price risks or foreign exchange risk and hedging.
(x) Details of the familiarization programmes imparted to the Independent Directors are available on the website of the company at http://www.sintexplastics.com/investors/policies/
(xi) Others: The Company has a comprehensive and integrated risk management framework to effectively deal with uncertainty and associated risks
and enhances the Organisation’s capacity to build value. The Risk Management framework of the Company has been designed with an objective to develop a risk culture that encourages identifying risks and responding to them with appropriate actions.
IX. MEANS OF COMMUNICATION:
(i) Financial Results: The quarterly/half-yearly and annual results are normally published in Financial Express (Gujarati) (Ahmedabad Edition) and Financial Express (English) (All Editions).
(ii) The quarterly/half-yearly and annual results are also posted on Company’s website - www.sintexplastics.com
(iii) The company’s website www.sintexplastics.com contains a separate dedicated Section on Investors Relation where shareholder information is available. The Annual Report of the Company is also available on the website in a user-friendly and downloadable form.
(iv) The management discussion and analysis report is attached with the Directors’ Report in this Annual Report.
(v) Press Releases made by the Company from time to time are also displayed on the Company’s website- www.sintexplastics.com.
(vi) Corporate presentations made to institutional investors or to analysts are posted on the Company’s website- www.sintexplastics.com.
X. GENERAL SHAREHOLDER INFORMATION:
1. 3rd Annual General Meeting
Day, date and time Monday, September 17, 2018 10.30 A.M.
VenueIn the premises of Sintex-BAPL Ltd., Near Seven Garnala, Kalol (N.G.) – 382 721
Book closure dates 8th September, 2018 to 17th September, 2018
Financial Calendar
The Company follows the period of 1st April to 31st March, as the Financial Year. For the Financial year 2018-19, Financial Results will be announced as per the following tentative schedule:
1st quarter ending on 30th June, 2018 2nd week of July, 2018
2nd quarter ending on 30th September, 2018 2nd week of October, 2018
3rd quarter ending on 31st December, 2018 2nd week of January, 2019
Year ending on 31st March, 2019 1st week of May, 2019
Listing on Stock Exchanges:
The Equity Shares of the Company are listed with the following stock exchanges w.e.f. 8th August, 2017.
Stock Exchanges /Type of Instruments/ Stock Code Address Telephone No.
BSE Limited (BSE)Equity Shares* Equity – 540653
25th Floor, P.J. Towers,Dalal Street, Mumbai – 400 001 022 – 22721233/34
National Stock Exchange of India Ltd. (NSE)Equity Shares* Equity – SPTL
Exchange Plaza, Bandra Kurla Complex, Bandra (East), Mumbai – 400 051
022 – 26598235/36022 - 26598346
*Stock code
International Securities Identification Number (ISIN) ISIN is an identification number for traded shares. This number needs to be quoted in each transaction relating to the dematerialized
equity shares of the Company. Your Company’s ISIN number for its equity shares is INE501W01021.
Payment of Listing Fees and Depository Fees Annual listing fee for the year 2018-19 has been paid by the Company to BSE and NSE. Annual Custody/Issuer fee for the year 2018-19
has been paid by the Company to NSDL and CDSL.
3. Location of the depositories
Depository Address Telephone No.
National Securities Depository Ltd. (NSDL)
Trade World, 4th Floor, Kamala Mills Compound, Senapati Bapat Marg, Lower Parel, Mumbai – 400 013
022 – 2499 4200
Central Depository Services (India) Limited (CDSL)
Marathon Futurex, A-Wing, 25th floor, NM Joshi Marg, Lower Parel, Mumbai 400 013
022- 2302 3333
4. Market Price Data The monthly share price data of the Company during the year 2017-18 (listed w.e.f. 8th August, 2017) at BSE and NSE as compared to
BSE Sensex and CNX Nifty are as follows:
Month
BSE Limited National Stock Exchange of India Ltd.
Share Price SENSEX Share Price CNX Nifty
High (`)
Low (`)
High Low High (`)
Low(`)
High Low
August, 2017 136.50 100.70 32686.48 31128.02 136.50 100.70 10137.85 9685.55
September, 2017 111.50 88.35 32524.11 31081.83 111.35 88.20 10178.95 9687.55
October, 2017 100.00 89.90 33340.17 31440.48 99.90 89.80 10384.50 9831.05
November, 2017 90.50 74.90 33865.95 32683.59 90.40 75.10 10490.45 10094.00
December, 2017 84.80 67.00 34137.97 32565.16 84.90 66.55 10552.40 10033.35
January, 2018 95.40 72.20 36443.98 33703.37 95.40 72.20 11171.55 10404.65
February, 2018 75.90 64.80 36256.83 33482.81 75.85 64.65 11117.35 10276.30
March, 2018 68.15 55.00 34278.63 32483.84 68.25 55.50 10525.50 9951.90
[Source: This information is compiled from the data available from the websites of BSE and NSE]
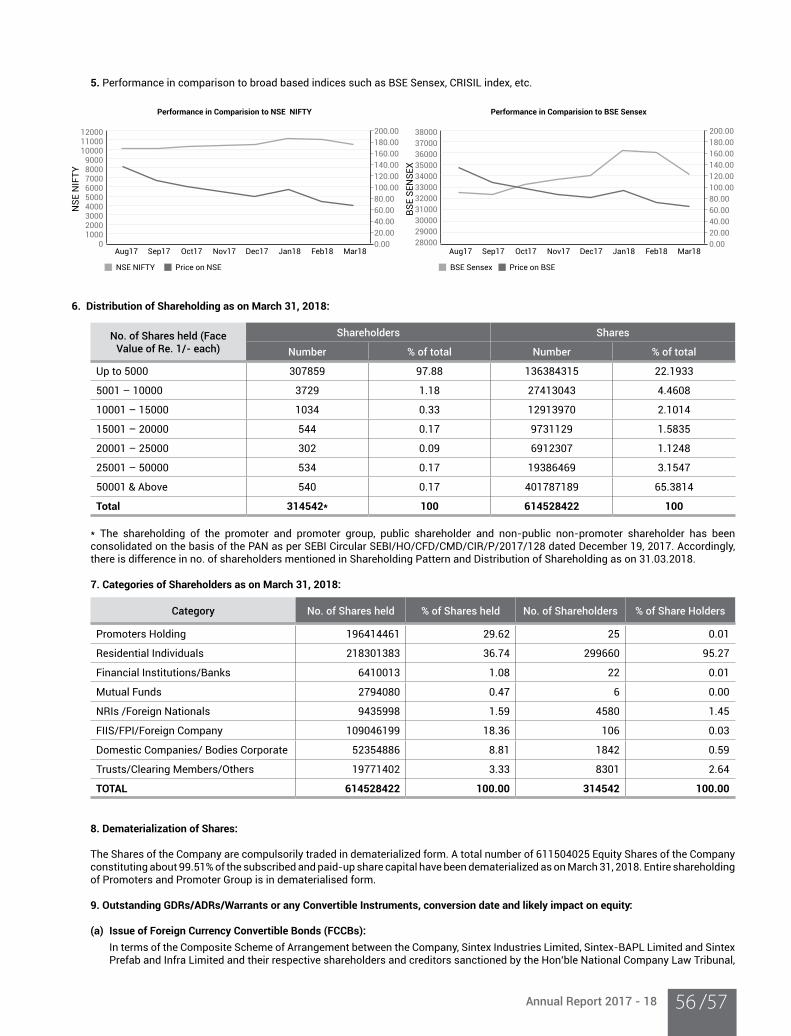
Annual Report 2017 - 18 /5756
5. Performance in comparison to broad based indices such as BSE Sensex, CRISIL index, etc.
6. Distribution of Shareholding as on March 31, 2018:
No. of Shares held (Face Value of Re. 1/- each)
Shareholders Shares
Number % of total Number % of total
Up to 5000 307859 97.88 136384315 22.1933
5001 – 10000 3729 1.18 27413043 4.4608
10001 – 15000 1034 0.33 12913970 2.1014
15001 – 20000 544 0.17 9731129 1.5835
20001 – 25000 302 0.09 6912307 1.1248
25001 – 50000 534 0.17 19386469 3.1547
50001 & Above 540 0.17 401787189 65.3814
Total 314542* 100 614528422 100
* The shareholding of the promoter and promoter group, public shareholder and non-public non-promoter shareholder has been consolidated on the basis of the PAN as per SEBI Circular SEBI/HO/CFD/CMD/CIR/P/2017/128 dated December 19, 2017. Accordingly, there is difference in no. of shareholders mentioned in Shareholding Pattern and Distribution of Shareholding as on 31.03.2018.
7. Categories of Shareholders as on March 31, 2018:
Category No. of Shares held % of Shares held No. of Shareholders % of Share Holders
Promoters Holding 196414461 29.62 25 0.01
Residential Individuals 218301383 36.74 299660 95.27
Financial Institutions/Banks 6410013 1.08 22 0.01
Mutual Funds 2794080 0.47 6 0.00
NRIs /Foreign Nationals 9435998 1.59 4580 1.45
FIIS/FPI/Foreign Company 109046199 18.36 106 0.03
Domestic Companies/ Bodies Corporate 52354886 8.81 1842 0.59
Trusts/Clearing Members/Others 19771402 3.33 8301 2.64
TOTAL 614528422 100.00 314542 100.00
8. Dematerialization of Shares:
The Shares of the Company are compulsorily traded in dematerialized form. A total number of 611504025 Equity Shares of the Company constituting about 99.51% of the subscribed and paid-up share capital have been dematerialized as on March 31, 2018. Entire shareholding of Promoters and Promoter Group is in dematerialised form.
9. Outstanding GDRs/ADRs/Warrants or any Convertible Instruments, conversion date and likely impact on equity:
(a) Issue of Foreign Currency Convertible Bonds (FCCBs):
In terms of the Composite Scheme of Arrangement between the Company, Sintex Industries Limited, Sintex-BAPL Limited and Sintex Prefab and Infra Limited and their respective shareholders and creditors sanctioned by the Hon’ble National Company Law Tribunal,
120001100010000
900080007000600050004000300020001000
0
200.00
180.00
160.00
140.00
120.00
100.00
80.00
60.00
40.00
20.00
0.00
NS
E N
IFT
Y
Performance in Comparision to NSE NIFTY
Aug17 Sep17 Oct17 Nov17 Dec17 Jan18 Feb18 Mar18
NSE NIFTY Price on NSE
200.00
180.00
160.00
140.00
120.00
100.00
80.00
60.00
40.00
20.00
0.00
38000
37000
36000
35000
34000
33000
32000
31000
30000
29000
28000
BS
E S
EN
SE
X
Performance in Comparision to BSE Sensex
Aug17 Sep17 Oct17 Nov17 Dec17 Jan18 Feb18 Mar18
BSE Sensex Price on BSE
Ahmedabad Bench, the Company is required to issue corresponding number of equity shares, to such Converting FCCB Holder, who are allotted equity shares of Sintex Industries Limited. The Company is accordingly authorized to issue and allot equity shares of ` 1 each under FCCBs for an aggregate amount not exceeding US$ 67 million.
Outstanding FCCBs pending for conversion as on 31st March, 2018 is USD 13.50 Million. After conversion of aforesaid FCCBs, paid up capital of the Company will increase by 98,79,844 equity shares of ` 1/- each amounting to ` 98.80 Lacs.
(b) Issue of warrants Pursuant to Shareholders approval dated 10th March, 2018, the Company has issued and alloted 6,67,00,000 Convertible warrants, at
an exercise price of ` 90/- per Warrant (including a premium of ` 89/-) to Star Line Leasing Limited, Company belonging to promoter group. The Preferential Allotment Committee has allotted 2,04,33,334 Equity Shares of Re. 1/- each on conversion of 2,04,33,334 Warrants till date and there are 4,62,66,666 outstanding warrants to be converted into equity shares.
10. Registrar and Share Transfer Agent (RTA):
Share transfers, dividend payment and all other investor related matters are attended to and processed by our Registrar and Share Transfer Agent viz. M/s. Link Intime India Pvt Ltd.
Link Intime India Pvt Limited 506-508,Amarnath Business Centre-1
(ABC-1), Besides Gala Business Centre
Near XT Xavier’s College Corner
Off C G Road, Ellisebridge
Ahmedabad 380006
Tel: +91 79 26465179 /86 / 87, E-mail: [email protected]
11. Share Transfer System: Pursuant to Regulation 39(2) of SEBI Regulations, Share transfer requests received in physical form will be registered and certificate
delivered within 15 days from the date of receipt, subject to documents being valid and complete in all respect and Demat requests will be normally confirmed within an average of 10 days from the date of receipt. With a view to expedite the process of share transfers, necessary authority has been delegated to the Share and Debenture Transfer Committee to approve the transfers of equity shares of the Company. The Share and Debenture Transfer Committee meet as and when required to consider the transfer proposals.
The Company obtained following certificate(s) from a Practicing Company Secretary and submitted the same to the stock exchanges
within stipulated time:
1. Certificate confirming due compliance of share transfer formalities by the Company pursuant to Regulation 40(9) of the SEBI Listing Regulations for half year ended 30th September, 2017 and 31st March, 2018 respectively with the Stock Exchanges and
2. Certificate regarding reconciliation of the share capital audit of the Company on quarterly basis.
12. Plant Locations:
Not Applicable
XI. Address for Correspondence
All Communications may be sent to the Company Secretary at the following address:
Sintex Plastics Technology Limited
In the premises of Sintex-BAPL Ltd.,
Near Seven Garnala,
Kalol (N.G.) – 382 721
Phone: +91 2764 253500
E-mail: [email protected]
Annual Report 2017 - 18 /5958
Non-mandatory requirementsThe non-mandatory requirements have been adopted to the extent and in the manner as stated under the appropriate headings detailed below:
1. Modified opinion(s) in audit report: The Company already has a regime of un-qualified financial statements. Auditors have raised no qualification on the financial statements.
2. Separate posts of Chairperson and CEO: Mr. Arun P. Patel is the Non-Executive Chairman.
3. Reporting of Internal Auditor The Internal Auditor of the Company is a permanent invitee to the Audit Committee Meeting and regularly attends the Meeting for
reporting their findings of the internal audit to the Audit Committee Members.
Declaration:It is hereby declared that the Company has obtained affirmation from all the Members of the Board and Senior Management personnel that they have complied with the “Code of Conduct and Ethics for Board Members and Senior Management” for the year ended on 31st March 2018.
Place: Ahmedabad Amit D. PatelDate: 16th July, 2018 Managing Director (DIN: 00171035)
Auditors’ Certificate Regarding Compliance ofConditions of Corporate Governance
ToThe Members Sintex Plastics Technology Limited
We have examined the compliance of the conditions of Corporate Governance by Sintex Plastics Technology Limited ("the Company"), for the year ended on 31st March 2018, as stipulated in Chapter IV of the SEBI (Listing Obligations and Disclosure Requirements) Regulations, 2015.
The compliance of conditions of Corporate Governance is the responsibility of the management of the Company. Our examination has been limited to a review of the procedures and implementation thereof, adopted by the Company for ensuring the compliance of the conditions of Corporate Governance as stipulated in the said Clause and applicable Regulations. It is neither an audit nor an expression of the opinion on the financial statements of the Company.
In our opinion and to the best of our information and according to the explanations given to us and the representations made by the Directors and the Management, we certify that the Company has complied with the conditions of Corporate Governance as stipulated in Chapter IV of the SEBI (Listing Obligations and Disclosure Requirements) Regulations, 2015.
We state that such compliance is neither an assurance as to the future viability of the Company nor the efficiency or effectiveness with which the management has conducted the affairs of the Company.
For R Choudhary & Associates
Chartered Accountants(FRN 101928W)
Ramchandra ChoudharyPartnerMembership No: 043979
Place: AhmedabadDate: 16th July, 2018
Annual Report 2017 - 18 /6160
CERTIFICATION BYCHIEF EXECUTIVE OFFICER (CEO) AND
CHIEF FINANCIAL OFFICER (CFO)pursuant to Clause 17(8) of the SEBI (Listing Obligations And Disclosure Requirements) Regulations, 2015
This is to certify to Board that-
A. We have reviewed financial statements and the cash flow statement for the year ended 31st March, 2018 and that to the best of our knowledge and belief:
(1) these statements do not contain any materially untrue statement or omit any material fact or contain statements that might be misleading;
(2) these statements together present a true and fair view of the Company’s affairs and are in compliance with existing accounting standards, applicable laws and regulations.
B. There are, to the best of our knowledge and belief, no transactions entered into by the Company during the year which are fraudulent, illegal or violative of the Company’s code of conduct.
C. We accept responsibility for establishing and maintaining internal controls for financial reporting and that We have evaluated the effectiveness of internal control systems of the Company pertaining to financial reporting and We have disclosed to the auditors and the audit committee, deficiencies in the design or operation of such internal controls, if any, of which We are aware and the steps We have taken or propose to take to rectify these deficiencies.
D. We have indicated to the auditors and the Audit committee
(1) significant changes in internal control over financial reporting during the year;
(2) significant changes in accounting policies during the year and that the same have been disclosed in the notes to the financial statements; and
(3) instances of significant fraud of which We have become aware and the involvement therein, if any, of the management or an employee having a significant role in the Company’s internal control system over financial reporting.
For Sintex Plastics Technology Limited For Sintex Plastics Technology Limited
Amit D. Patel Gaurav AgrawalManaging Director Chief Financial Officer(DIN: 00171035)
Place : AhmedabadDate : 9th May, 2018
Independent Auditor’s Report
To,The Members of Sintex Plastics Technology Limited
Report on the Standalone Ind AS Financial Statements
We have audited the accompanying standalone Ind AS financial statements of Sintex Plastics Technology Limited (“the Company”), which comprise the Balance Sheet as at 31 March, 2018, the Statement of Profit and Loss including other comprehensive income, the Statement of Cash Flows and the Statement of Changes in Equity for the year ended on that date and a summary of the significant accounting policies and other explanatory information (herein after referred to as “standalone Ind AS financial statements.”).
Management’s Responsibility for the Standalone Ind AS Financial Statements
The Company’s Board of Directors is responsible for the matters stated in Section 134(5) of the Companies Act, 2013 (“the Act”) with respect to the preparation of these standalone Ind AS financial statements that give a true and fair view of the financial position, financial performance including other comprehensive Income and cash flows and changes in equity of the Company in accordance with the accounting principles generally accepted in India, including the Indian Accounting Standards (Ind AS) prescribed under section 133 of the act.
This responsibility also includes maintenance of adequate accounting records in accordance with the provisions of the Act for safeguarding the assets of the Company and for preventing and detecting frauds and other irregularities; selection and application of appropriate accounting policies; making judgments and estimates that are reasonable and prudent; and design, implementation and maintenance of adequate internal financial controls, that were operating effectively for ensuring the accuracy and completeness of the accounting records, relevant to the preparation and presentation of the Standalone Ind AS financial statements that give a true and fair view and are free from material misstatement, whether due to fraud or error.
Auditors’ Responsibility
Our responsibility is to express an opinion on these standalone Ind AS financial statements based on our audit.
We have taken into account the provisions of the Act, the accounting and auditing standards and matters which are required to be included in the audit report under the provisions of the Act and the Rules made thereunder.
We have conducted our audit in accordance with the Standards on Auditing specified under Section 143(10) of the Act and other applicable authoritative pronouncement issued by the Institute of Chartered Accountants of India. Those Standards require that we comply with ethical requirements and plan and perform the audit to obtain reasonable assurance about whether the standalone Ind AS financial statements are free from material misstatement.
An audit involves performing procedures to obtain audit evidence about the amounts and the disclosures in the standalone Ind AS financial statements. The procedures selected depend on the auditor’s judgment, including the assessment of the risks of material misstatement of the standalone Ind AS financial statements, whether due to fraud or error. In making those risk assessments, the auditor considers internal financial control relevant to the Company’s preparation of the standalone Ind AS financial statements that give a true and fair view in order to design audit procedures that are appropriate in the circumstances. An audit also includes evaluating the appropriateness of the accounting policies used and the reasonableness of the accounting estimates made by the Company’s Directors, as well as evaluating the overall presentation of the standalone Ind AS financial statements.
We believe that the audit evidence we have obtained is sufficient and appropriate to provide a basis for our audit opinion on the standalone Ind AS financial statements.
Opinion
In our opinion and to the best of our information and according to the explanations given to us, the aforesaid standalone Ind AS financial statements give the information required by the Act in the manner so required and give a true and fair view in conformity with the accounting principles generally accepted in India, of the State of affairs of the company as at 31 March, 2018, and its financial performance including other comprehensive income, its cash flows and the changes in equity for the year ended on that date.
Report on Other Legal and Regulatory Requirements
1. As required by the Companies (Auditors’ Report) Order, 2016 (“the Order”) issued by the Central Government of India in exercise of powers conferred in terms of Section 143(11) of the Companies Act, 2013 and on the basis of such checks of the books and records of the Company as we considered appropriate and according to the information and explanation given to us, we give in the Annexure - A to statement on the matters specified in paragraphs 3 and 4 of the Order.
Annual Report 2017 - 18 /6362
2. As required by Section 143 (3) of the Act, we report that:
(a) We have sought and obtained all the information and explanations which to the best of our knowledge and belief were necessary for the purposes of our audit.
(b) In our opinion, proper books of account as required by law have been kept by the Company so far as it appears from our examination of those books.
(c) The Balance Sheet, the Statement of Profit and Loss including other comprehensive income, the Statement of Cash Flow and the Statement of Changes in Equity dealt with by this Report are in agreement with the books of account.
(d) In our opinion, the aforesaid standalone Ind AS financial statements comply with the Accounting Standards specified under Section 133 of the Act.
(e) On the basis of the written representations received from the directors as on 31 March, 2018 and taken on record by the Board of Directors, none of the directors is disqualified as on 31 March, 2018 from being appointed as a director in terms of Section 164 (2) of the Act.
(f) With respect to the adequacy of the internal financial controls over financial reporting of the Company and the operating effectiveness of such controls, refer to our separate Report in “Annexure B”.
(g) With respect to the other matters to be included in the Auditor’s Report in accordance with Rule 11 of the Companies (Audit and Auditors) Rules, 2014, in our opinion and to the best of our information and according to the explanations given to us:
i. The Company does not have any pending litigations as at March 31, 2018 which would impact its standalone Ind AS financial statements;
ii. The Company did not have any long-term contracts including derivative contracts for which there were any material foreseeable losses;
iii. There were no amounts which were required to be transferred to the Investor Education and Protection Fund by the Company during the year.
Place: Ahmedabad For, R Choudhary and Associates Date: May 9, 2018 Chartered Accountants
(Registration No. 101928W)
Ramchandra Choudhary Partner
M. No. 043979
(i) The Company does not have any fixed assets, hence paragraph 3(i) of the order is not applicable to the company. (ii) As explained to us, the inventories were physically verified during the year by the Management at reasonable intervals and no material
discrepancies were noticed on physical verification.
(iii) The Company has not granted any Secured or unsecured loan to companies, firms, Limited Liability Partnerships or other parties covered in the register maintained under Section 189 of the Companies Act, 2013. Hence paragraph 3 (iii) of the order is not applicable to the company.
(iv) In our opinion and according to the information and explanations given to us, the Company has complied with the provisions of
Sections 185 and 186 of the Companies Act, 2013 in respect of loans, investments, providing guarantees and securities.
(v) In our opinion and according to the information and explanations given to us, the Company has not accepted any deposit nor has any unclaimed deposit within the meaning of the provisions of Sections 73 to 76 or any other relevant provision of the Act and the rules framed thereunder. Therefore, the provisions of Clause (v) of paragraph 3 of the Order are not applicable to the Company.
(vi) The company is not required to maintain the cost records pursuant to the Companies (Cost Records and Audit) Rules, 2014 as prescribed by the Central Government under sub section (1) of the section 148 of the Act.
(vii) According to the information and explanations given to us and on the basis of our examination of the books of account, in respect of statutory dues:
a) the Company has generally been regular in depositing its undisputed statutory dues including income-tax, Sales-Tax, Goods and Service Tax, Wealth Tax, Service tax, value added tax, cess and Entertainment Tax etc. There are no undisputed dues payable in respect of aforesaid dues, were outstanding as on March 31, 2018 for a period of more than six months from the date they became payable.
b) there are no amounts in respect of income tax, sales tax, Goods and Service Tax, wealth tax, Value added tax, Cess, service tax etc. that have not been deposited with the appropriate authorities on account of any dispute.
(viii) The Company does not have any loans or borrowings from any financial institution or bank or government, nor it has issued any debentures, as at the balance sheet date so the provision of paragraph 3(viii) of the order is not applicable to the company.
(ix) The Company has not raised money by way of initial public offer or further public offer (including debt instrument) or any term loans
during the period under audit therefore, paragraph 3 (ix) of the order is not applicable to the company. (x) Based upon the audit procedures performed and to the best of our knowledge and according to the information and explanations
given to us, no fraud by the Company and no fraud on the Company by its officers or employees has been noticed or reported during the year.
(xi) In our opinion and acording to information and explanations given to us, the Company has complied with the requisite approvals mandated by the provisions of section 197 read with Schedule V of the Companies Act, 2013.
(xii) In our opinion, the company is not a Nidhi Company. Therefore paragraph 3 (xii) of the order is not applicable to the company.
(xiii) In our opinion and according to the information and explanations given to us the Company has complied with section 177 and 188 of the Companies Act, 2013, where appicable, for all transactions with the related parties and the details of related party transactions have been disclosed in the standalone Ind AS financial statements as required by the applicable accounting standards.
(xiv) The Company has made preferential allotment of shares during the year under review, in compliance with the requirements of section 42 of the Companies Act, 2013. The amount raised have been pending for utilisation.
(xv) In our opinion and according to the information and explanations given to us, during the year the Company has not entered into any
non-cash transactions with its directors or persons connected with him and covered under section 192 of the Companies Act, 2013. Accordingly, paragraph 3(xv) of the order is not applicable to the Company.
(xvi) The Company is not required to be registered under Section 45-I of the Reserve Bank of India Act,1934.
Place: Ahmedabad For, R Choudhary and Associates Date: May 9, 2018 Chartered Accountants
(Registration No. 101928W)
Ramchandra Choudhary Partner M. No. 043979
“Annexure A”to Independent Auditors’ Report for the period ended March 31, 2018
(Referred to in Paragraph 1 under the heading of “Report on Other Legal and Regulatory Requirements” of our Report of even date to the Standalone Ind AS financial statements)
Annual Report 2017 - 18 /6564
“Annexure-B” to the Independent Auditor’s Report (Referred to in our report of even date)
Report on the Internal Financial Controls under Clause (i) of Sub-section 3 of Section 143 of the Companies Act, 2013 (“the Act”)
We have audited the internal financial controls over financial reporting of Sintex Plastics Technology Limited (“the Company”) as of March 31, 2018 in conjunction with our audit of the standalone Ind AS financial statements of the Company for the year ended on that date.
Management’s Responsibility for Internal Financial ControlsThe Company’s management is responsible for establishing and maintaining internal financial controls based on the internal control over financial reporting criteria established by the Company considering the essential components of internal control stated in the Guidance Note on Audit of Internal Financial Controls Over Financial Reporting issued by the Institute of Chartered Accountants of India. These responsibilities include the design, implementation and maintenance of adequate internal financial controls that were operating effectively for ensuring the orderly and efficient conduct of its business, including adherence to company’s policies, the safeguarding of its assets, the prevention and detection of frauds and errors, the accuracy and completeness of the accounting records, and the timely preparation of reliable financial information, as required under the Companies Act, 2013.
Auditors’ ResponsibilityOur responsibility is to express an opinion on the Company’s internal financial controls over financial reporting based on our audit. We conducted our audit in accordance with the Guidance Note on Audit of Internal Financial Controls Over Financial Reporting (the “Guidance Note”) and the Standards on Auditing, issued by ICAI and deemed to be prescribed under section 143(10) of the Companies Act, 2013, to the extent applicable to an audit of internal financial controls, both applicable to an audit of Internal Financial Controls and, both issued by the Institute of Chartered Accountants of India. Those Standards and the Guidance Note require that we comply with ethical requirements and plan and perform the audit to obtain reasonable assurance about whether adequate internal financial controls over financial reporting was established and maintained and if such controls operated effectively in all material respects.
Our audit involves performing procedures to obtain audit evidence about the adequacy of the internal financial controls system over financial reporting and their operating effectiveness. Our audit of internal financial controls over financial reporting included obtaining an understanding of internal financial controls over financial reporting, assessing the risk that a material weakness exists, and testing and evaluating the design and operating effectiveness of internal control based on the assessed risk. The procedures selected depend on the auditor’s judgement, including the assessment of the risks of material misstatement of the financial statements, whether due to fraud or error.
We believe that the audit evidence we have obtained is sufficient and appropriate to provide a basis for our audit opinion on the Company’s internal financial controls system over financial reporting.
Meaning of Internal Financial Controls Over Financial ReportingA company’s internal financial control over financial reporting is a process designed to provide reasonable assurance regarding the reliability of financial reporting and the preparation of financial statements for external purposes in accordance with generally accepted accounting principles. A company’s internal financial control over financial reporting includes those policies and procedures that (1) pertain to the maintenance of records that, in reasonable detail, accurately and fairly reflect the transactions and dispositions of the assets of the company; (2) provide reasonable assurance that transactions are recorded as necessary to permit preparation of financial statements in accordance with generally accepted accounting principles, and that receipts and expenditures of the company are being made only in accordance with authorisations of management and directors of the company; and (3) provide reasonable assurance regarding prevention or timely detection of unauthorised acquisition, use, or disposition of the company’s assets that could have a material effect on the financial statements.
Inherent Limitations of Internal Financial Controls Over Financial ReportingBecause of the inherent limitations of internal financial controls over financial reporting, including the possibility of collusion or improper management override of controls, material misstatements due to error or fraud may occur and not be detected. Also, projections of any evaluation of the internal financial controls over financial reporting to future periods are subject to the risk that the internal financial control over financial reporting may become inadequate because of changes in conditions, or that the degree of compliance with the policies or procedures may deteriorate.
OpinionIn our opinion, the Company has, in all material respects, an adequate internal financial controls system over financial reporting and such internal financial controls over financial reporting were operating effectively as at March 31, 2018, based on the internal control over financial reporting criteria established by the Company considering the essential components of internal control stated in the Guidance Note on Audit of Internal Financial Controls Over Financial Reporting issued by the Institute of Chartered Accountants of India.
Place: Ahmedabad For, R Choudhary and Associates Date: May 9, 2018 Chartered Accountants
(Registration No. 101928W)
Ramchandra Choudhary
Partner M. No. 043979
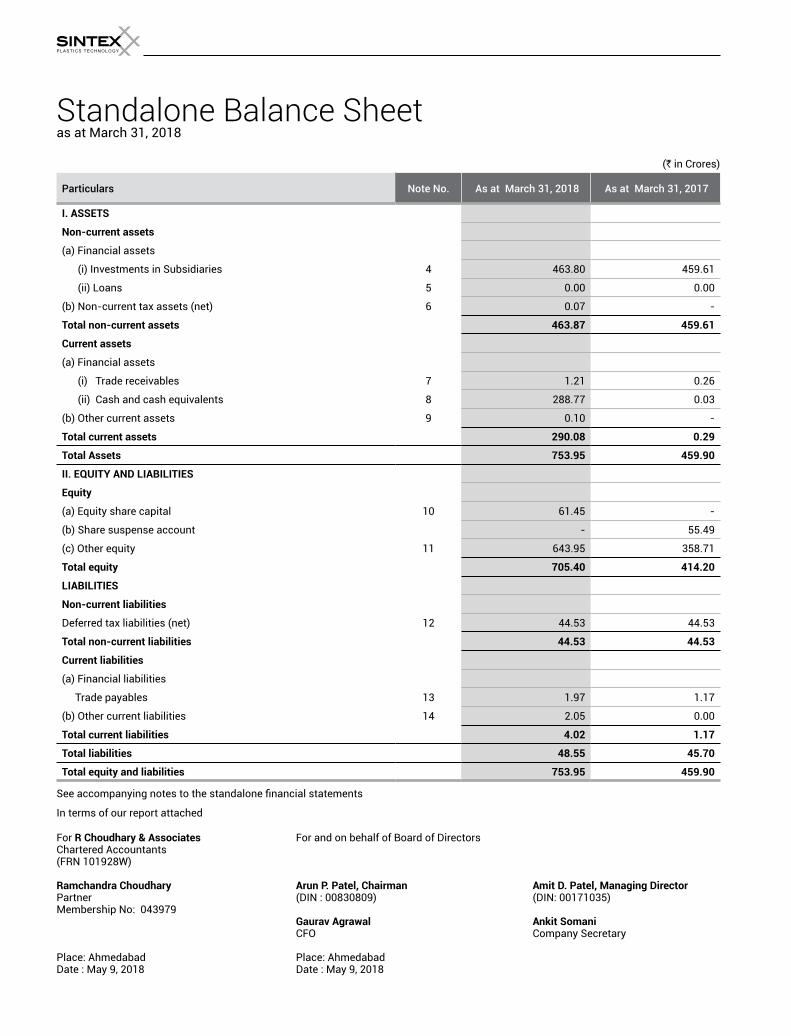
Standalone Balance Sheet as at March 31, 2018
(` in Crores)
Particulars Note No. As at March 31, 2018 As at March 31, 2017
I. ASSETS
Non-current assets
(a) Financial assets
(i) Investments in Subsidiaries 4 463.80 459.61
(ii) Loans 5 0.00 0.00
(b) Non-current tax assets (net) 6 0.07 -
Total non-current assets 463.87 459.61
Current assets
(a) Financial assets
(i) Trade receivables 7 1.21 0.26
(ii) Cash and cash equivalents 8 288.77 0.03
(b) Other current assets 9 0.10 -
Total current assets 290.08 0.29
Total Assets 753.95 459.90
II. EQUITY AND LIABILITIES
Equity
(a) Equity share capital 10 61.45 -
(b) Share suspense account - 55.49
(c) Other equity 11 643.95 358.71
Total equity 705.40 414.20
LIABILITIES
Non-current liabilities
Deferred tax liabilities (net) 12 44.53 44.53
Total non-current liabilities 44.53 44.53
Current liabilities
(a) Financial liabilities
Trade payables 13 1.97 1.17
(b) Other current liabilities 14 2.05 0.00
Total current liabilities 4.02 1.17
Total liabilities 48.55 45.70
Total equity and liabilities 753.95 459.90
See accompanying notes to the standalone financial statements
In terms of our report attached
For R Choudhary & Associates For and on behalf of Board of DirectorsChartered Accountants(FRN 101928W)
Ramchandra Choudhary Arun P. Patel, Chairman Amit D. Patel, Managing DirectorPartner (DIN : 00830809) (DIN: 00171035)Membership No: 043979 Gaurav Agrawal Ankit Somani CFO Company Secretary
Place: Ahmedabad Place: AhmedabadDate : May 9, 2018 Date : May 9, 2018
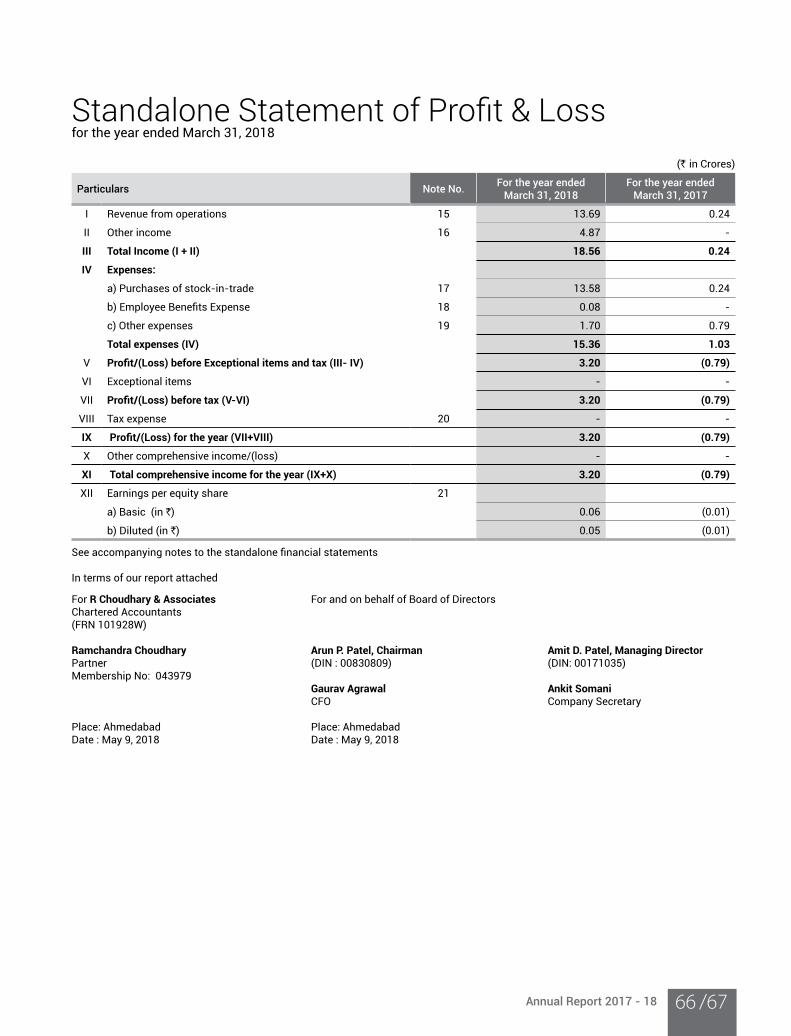
Annual Report 2017 - 18 /6766
Standalone Statement of Profit & Loss for the year ended March 31, 2018
(` in Crores)
Particulars Note No.For the year ended
March 31, 2018For the year ended
March 31, 2017
I Revenue from operations 15 13.69 0.24
II Other income 16 4.87 -
III Total Income (I + II) 18.56 0.24
IV Expenses:
a) Purchases of stock-in-trade 17 13.58 0.24
b) Employee Benefits Expense 18 0.08 -
c) Other expenses 19 1.70 0.79
Total expenses (IV) 15.36 1.03
V Profit/(Loss) before Exceptional items and tax (III- IV) 3.20 (0.79)
VI Exceptional items - -
VII Profit/(Loss) before tax (V-VI) 3.20 (0.79)
VIII Tax expense 20 - -
IX Profit/(Loss) for the year (VII+VIII) 3.20 (0.79)
X Other comprehensive income/(loss) - -
XI Total comprehensive income for the year (IX+X) 3.20 (0.79)
XII Earnings per equity share 21
a) Basic (in `) 0.06 (0.01)
b) Diluted (in `) 0.05 (0.01)
See accompanying notes to the standalone financial statements In terms of our report attached
For R Choudhary & Associates For and on behalf of Board of DirectorsChartered Accountants(FRN 101928W)
Ramchandra Choudhary Arun P. Patel, Chairman Amit D. Patel, Managing DirectorPartner (DIN : 00830809) (DIN: 00171035)Membership No: 043979 Gaurav Agrawal Ankit Somani CFO Company Secretary
Place: Ahmedabad Place: AhmedabadDate : May 9, 2018 Date : May 9, 2018
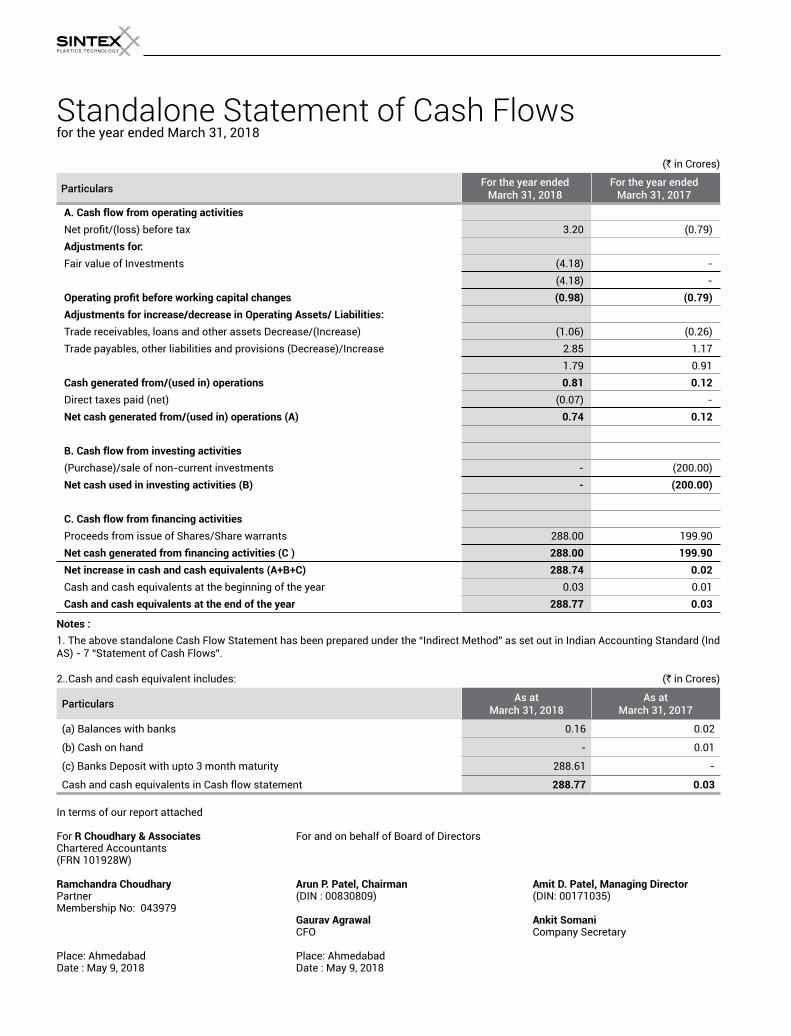
Standalone Statement of Cash Flowsfor the year ended March 31, 2018
(` in Crores)
ParticularsFor the year ended
March 31, 2018For the year ended
March 31, 2017
A. Cash flow from operating activities
Net profit/(loss) before tax 3.20 (0.79)Adjustments for:
Fair value of Investments (4.18) -
(4.18) -
Operating profit before working capital changes (0.98) (0.79)
Adjustments for increase/decrease in Operating Assets/ Liabilities:Trade receivables, loans and other assets Decrease/(Increase) (1.06) (0.26)Trade payables, other liabilities and provisions (Decrease)/Increase 2.85 1.17
1.79 0.91 Cash generated from/(used in) operations 0.81 0.12
Direct taxes paid (net) (0.07) -
Net cash generated from/(used in) operations (A) 0.74 0.12
B. Cash flow from investing activities
(Purchase)/sale of non-current investments - (200.00)Net cash used in investing activities (B) - (200.00)
C. Cash flow from financing activitiesProceeds from issue of Shares/Share warrants 288.00 199.90 Net cash generated from financing activities (C ) 288.00 199.90
Net increase in cash and cash equivalents (A+B+C) 288.74 0.02
Cash and cash equivalents at the beginning of the year 0.03 0.01 Cash and cash equivalents at the end of the year 288.77 0.03
Notes :
1. The above standalone Cash Flow Statement has been prepared under the “Indirect Method” as set out in Indian Accounting Standard (Ind AS) - 7 “Statement of Cash Flows”.
2..Cash and cash equivalent includes: (` in Crores)
ParticularsAs at
March 31, 2018As at
March 31, 2017
(a) Balances with banks 0.16 0.02
(b) Cash on hand - 0.01
(c) Banks Deposit with upto 3 month maturity 288.61 -
Cash and cash equivalents in Cash flow statement 288.77 0.03
In terms of our report attached
For R Choudhary & Associates For and on behalf of Board of DirectorsChartered Accountants(FRN 101928W)
Ramchandra Choudhary Arun P. Patel, Chairman Amit D. Patel, Managing DirectorPartner (DIN : 00830809) (DIN: 00171035)Membership No: 043979 Gaurav Agrawal Ankit Somani CFO Company Secretary
Place: Ahmedabad Place: AhmedabadDate : May 9, 2018 Date : May 9, 2018
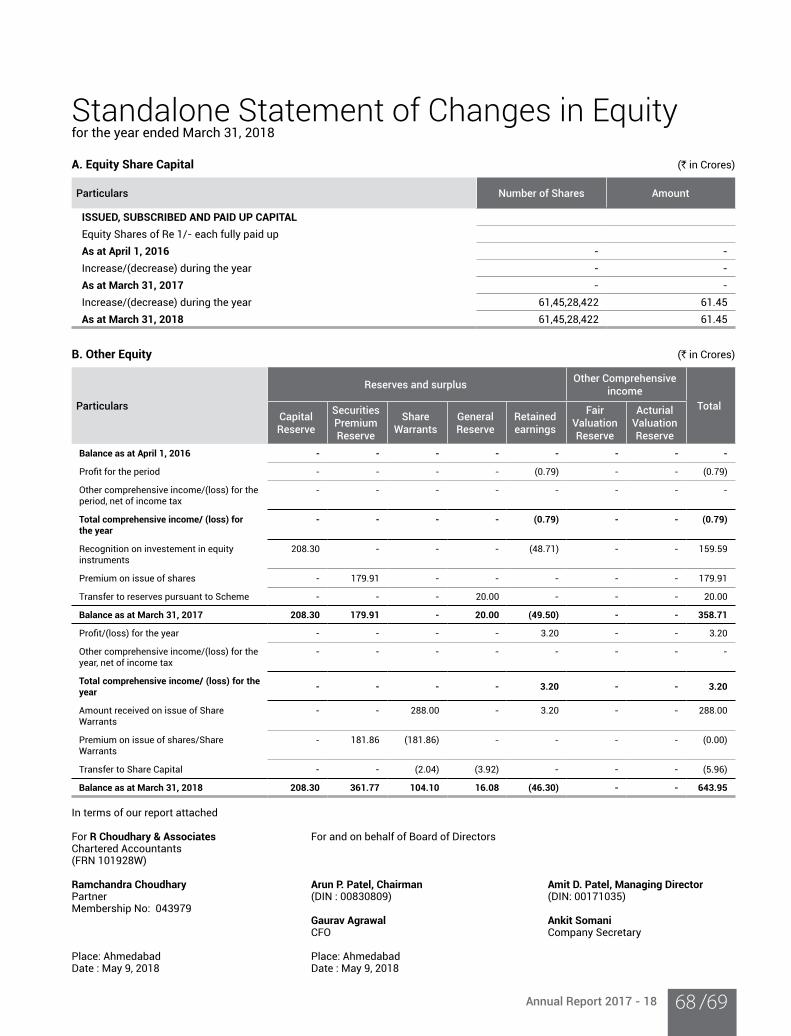
Annual Report 2017 - 18 /6968
Standalone Statement of Changes in Equityfor the year ended March 31, 2018
A. Equity Share Capital (` in Crores)
Particulars Number of Shares Amount
ISSUED, SUBSCRIBED AND PAID UP CAPITAL
Equity Shares of Re 1/- each fully paid up
As at April 1, 2016 - -
Increase/(decrease) during the year - -
As at March 31, 2017 - -
Increase/(decrease) during the year 61,45,28,422 61.45 As at March 31, 2018 61,45,28,422 61.45
B. Other Equity (` in Crores)
Particulars
Reserves and surplusOther Comprehensive
income
TotalCapital Reserve
Securities Premium Reserve
Share Warrants
General Reserve
Retained earnings
Fair Valuation Reserve
Acturial Valuation Reserve
Balance as at April 1, 2016 - - - - - - - -
Profit for the period - - - - (0.79) - - (0.79)
Other comprehensive income/(loss) for the period, net of income tax
- - - - - - - -
Total comprehensive income/ (loss) for the year
- - - - (0.79) - - (0.79)
Recognition on investement in equity instruments
208.30 - - - (48.71) - - 159.59
Premium on issue of shares - 179.91 - - - - - 179.91
Transfer to reserves pursuant to Scheme - - - 20.00 - - - 20.00
Balance as at March 31, 2017 208.30 179.91 - 20.00 (49.50) - - 358.71
Profit/(loss) for the year - - - - 3.20 - - 3.20
Other comprehensive income/(loss) for the year, net of income tax
- - - - - - - -
Total comprehensive income/ (loss) for the year
- - - - 3.20 - - 3.20
Amount received on issue of Share Warrants
- - 288.00 - 3.20 - - 288.00
Premium on issue of shares/Share Warrants
- 181.86 (181.86) - - - - (0.00)
Transfer to Share Capital - - (2.04) (3.92) - - - (5.96)
Balance as at March 31, 2018 208.30 361.77 104.10 16.08 (46.30) - - 643.95
In terms of our report attached
For R Choudhary & Associates For and on behalf of Board of DirectorsChartered Accountants(FRN 101928W)
Ramchandra Choudhary Arun P. Patel, Chairman Amit D. Patel, Managing DirectorPartner (DIN : 00830809) (DIN: 00171035)Membership No: 043979 Gaurav Agrawal Ankit Somani CFO Company Secretary
Place: Ahmedabad Place: AhmedabadDate : May 9, 2018 Date : May 9, 2018
Notes to the Standalone Financial Statementsfor the year ended March 31, 2018
1. General Information Sintex Plastics Technology Limited (“the Company”) is a holding Company of entities engaged in the manufacture of plastic products in
India, USA and Europe. The registered office of the Company is in the premises of Sintex-BAPL Limited, near seven garnala, Kalol (North Gujarat) and the headquarters of the Company is situated in Kalol (Gujarat).
The principal activities of the Company are to be in the business of Custom Moulding and Prefab products.
2. Significant Accounting policies
I. Statement of compliance
The financial statements have been prepared in accordance with the Indian Accounting Standards (referred to as “Ind AS”) as prescribed under Section 133 of the Companies Act, 2013 read with Companies (Indian Accounting Standards) Rules as amended from time to time.
II. Basis of preparation and presentation
The financial statements have been prepared on the historical cost basis except for certain financial instruments that are measured at fair values at the end of each reporting period, as explained in the accounting policies below.
Historical cost is generally based on the fair value of the consideration given in exchange for goods and services.
Fair value is the price that would be received to sell an asset or paid to transfer a liability in an orderly transaction between market participants at the measurement date, regardless of whether that price is directly observable or estimated using another valuation technique. In estimating the fair value of an asset or a liability, the Company takes in to account the characteristics of the asset or liability if market participants would take those characteristics into account when pricing the asset or liability at the measurement date.
In addition, for financial reporting purposes, fair value measurements are categorized into level 1, 2, or 3 based on the degree to which the inputs to the fair value measurements are observable and the significance of the inputs to the fair value measurements in its entirety, which are described as follows:
• Level 1 inputs are quoted prices (unadjusted) in active markets for identical assets or liabilities that the entity can access at the measurement date;
• Level 2 inputs are inputs, that are quoted prices included within level 1, that are observable for the asset or liability, either directly or indirectly; and
• Level 3 inputs are unobservable inputs for the asset or liability.
III. Revenue recognition
Revenue is measured at the fair value of the consideration received or receivable. Revenue is reduced for the estimated customer returns, rebates and other similar allowances.
Sale of goods Revenue from the sale of goods is recognised when the goods are delivered and titles have passed, at which time all the following
conditions are satisfied:• the Company has transferred to the buyer the significant risks and rewards of ownership of the goods;
• the Company retains neither continuing managerial involvement to the degree usually associated with ownership nor effective control over the goods sold;
• the amount of revenue can be measured reliably;
• it is probable that the economic benefits associated with the transaction will flow to the Company; and
• costs incurred or to be incurred in respect of the transaction can be measured reliably.
The Company recognizes revenues on sale of products, net of discounts, sales incentives, rebates granted, returns, sales taxes/Goods and Service Tax and duties when the products are delivered to customer or when delivered to a carrier for export sale, which is when title and risk and rewards of ownership pass to the customer. Sale of products is presented gross of manufacturing taxes like excise duty wherever applicable.
Export sales includes export benefits received as per the Import and Export Policy in respect of exports made under the said schemes as notified by government and recognised when there is reasonable assurance that the entity will comply with the conditions attached to them and that the benefit is received.
The Company provides warranty (refer to accounting policy on provisions) on certain products based on customer requirements for
Annual Report 2017 - 18 /7170
Notes to the Standalone Financial Statementsfor the year ended March 31, 2018
which liability is recognised at the time the product is sold.
Sale of services Income from service rendered is recognised on accrual basis based on the terms of agreements and when services are rendered.
Dividend and interest income Dividend income from investments is recognised when the shareholder’s right to receive payment has been established (provided that it
is probable that the economic benefits will flow to the Company and the amount of income can be measured reliably).
Interest income from a financial asset is recognised when it is probable that the economic benefits will flow to the Company and the amount of income can be measured reliably. Interest income is accrued on a time basis, by reference to the principal outstanding and at the effective interest rate applicable, which is the rate that exactly discounts estimated future cash receipts through the expected life of the financial asset to that asset’s net carrying amount on initial recognition.
IV. Leasing
Leases are classified as finance leases whenever the terms of the lease transfer substantially all the risks and rewards of ownership to the lessee. All other leases are classified as operating leases.
The Company as a lessor Amount due from the lessees under finance leases are recognised as receivables at the amount of the Company’s net investment in the
leases. Finance lease income is allocated to the accounting periods so as to reflect a constant periodic rate of return on the Company’s net investment outstanding in respect of the leases.
Rental income from operating leases is recognised on straight-line basis over the term of the relevant lease. Initial direct cost incurred in negotiating and arranging an operating lease are added to the carrying amount of the leased asset and recognised on straight-line basis over the lease term.
The Company as a lessee Assets held under finance leases are initially recognised as assets of the Company at their fair value at the inception of the lease or, if
lower, at the present value of the minimum lease payments. The corresponding liability to the lessor is included in the balance sheet as a finance lease obligation.
Lease payments are apportioned between finance expenses and reduction of the lease obligation so as to achieve a constant rate of interest on the remaining balance of the liability. Finance expenses are recognised immediately in Statement of Profit and Loss, unless they are directly attributable to qualifying assets, in which case they are capitalised in accordance with the Company’s general policy on borrowing costs. Contingent rentals are recognised as expenses in the periods in which they are incurred.
Lease payments under an operating lease shall be recognised as an expense on a straight-line basis over the lease term unless either:
a. another systematic basis is more representative of the time pattern of the user’s benefit even if the payments to the lessors are not on that basis; or
b. the payments to the lessor are structured to increase in line with expected general inflation to compensate for the lessor’s expected inflationary cost increases. If payments to the lessor vary because of factors other than general inflation, then this condition is not met.
V. Foreign currency translations
The functional currency of the Company has been determined on the basis of the primary economic environment in which it operates. The functional currency of the Company is INR.
In preparing the financial statements of each individual Company entity, transactions in currencies other than the entity’s functional currency (foreign currencies) are recognised at the rates of exchange prevailing at the dates of the transactions. At the end of each reporting period, monetary items denominated in foreign currencies are retranslated at the rates prevailing at that date. Non-monetary items carried at fair value that are denominated in foreign currencies are retranslated at the rates prevailing at the date when the fair value was determined. Non-monetary items that are measured in terms of historical cost in a foreign currency are not retranslated.
Exchange differences on monetary items are recognised in Statement of Profit and Loss in the period in which they arise except for:
• exchange differences on foreign currency borrowings relating to assets under construction for future productive use, which are included in the cost of those assets when they are regarded as an adjustment to interest costs on those foreign currency borrowings;
• exchange differences on monetary items receivable from or payable to a foreign operation for which settlement is neither planned nor likely to occur (therefore forming part of the net investment in the foreign operation), which are recognised initially in other
Notes to the Standalone Financial Statementsfor the year ended March 31, 2018
comprehensive income and reclassified from equity to Statement of Profit and Loss on repayment of the monetary items.
VI. Borrowing costs
Borrowing costs directly attributable to the acquisition, construction or production of qualifying assets, which are assets that necessarily take a substantial period of time to get ready for their intended use or sale, are added to the cost of those assets, until such time as the assets are substantially ready for their intended use or sale.
All other borrowing costs are recognised in the Statement of Profit and Loss in the period in which they are incurred.
VII. Employee Benefits
Retirement benefit costs and termination benefits Payments to defined contribution retirement benefit plans are recognised as an expense when employees have rendered service entitling
them to the contributions. For defined benefit retirement benefit plans, the cost of providing benefits is determined using the projected unit credit method, with actuarial valuations being carried out at the end of each annual reporting period. Remeasurement, comprising actuarial gains and losses, the effect of the changes to the asset ceiling (if applicable) and the return on plan assets (excluding interest), is reflected immediately in the statement of financial position with a charge or credit recognised in other comprehensive income in the period in which they occur. Remeasurement recognised in other comprehensive income is reflected immediately in retained earnings and will not be reclassified to profit or loss. Past service cost is recognised in profit or loss in the period of a plan amendment. Net interest is calculated by applying the discount rate at the beginning of the period to the net defined benefit liability or asset. Defined benefit costs are categorised as follows:
• service cost (including current service cost, past service cost, as well as gains and losses on curtailments and settlements);
• net interest expense or income; and
• remeasurement
The Company presents the first two components of defined benefit costs in profit or loss in the line item employee benefits expenses. Curtailment gains and losses are accounted for as past service costs. The retirement benefit obligation recognised in the statement of financial position represents the actual deficit or surplus in the Company’s defined benefit plans. Any surplus resulting from this calculation is limited to the present value of any economic benefits available in the form of refunds from the plans or reductions in future contributions to the plans. A liability for a termination benefit is recognised at the earlier of when the entity can no longer withdraw the offer of the termination benefit and when the entity recognises any related restructuring costs.
Short-term and other long-term employee benefits A liability is recognised for benefits accruing to employees in respect of wages and salaries, annual leave and sick leave in the period the
related service is rendered at the undiscounted amount of the benefits expected to be paid in exchange for that service.
Liabilities recognised in respect of short-term employee benefits are measured at the undiscounted amount of the benefits expected to be paid in exchange for the related service.
Liabilities recognised in respect of other long-term employee benefits are measured at the present value of the estimated future cash outflows expected to be made by the Company in respect of services provided by employees up to the reporting date.
VIII. Taxation
Income tax expense represents the sum of the tax currently payable and deferred tax.
Current tax Current tax is the amount of tax payable on the taxable income for the year as determined in accordance with the applicable tax rates and
the provisions of the Income Tax Act, 1961 and other applicable tax laws in the countries where the Company operates and generates taxable income.
Deferred tax Deferred tax is recognised on temporary differences between the carrying amounts of assets and liabilities in the financial statements
and the corresponding tax bases used in the computation of taxable profit. Deferred tax liabilities are generally recognised for all taxable temporary differences. Deferred tax assets are generally recognised for all deductible temporary differences to the extent that it is probable that taxable profits will be available against which those deductible temporary differences can be utilised. Such deferred tax assets and liabilities are not recognised if the temporary difference arises from the initial recognition (other than in a business combination) of assets and liabilities in a transaction that affects neither the taxable profit nor the accounting profit. In addition, deferred tax liabilities are not recognised if the temporary difference arises from the initial recognition of goodwill.
Annual Report 2017 - 18 /7372
Notes to the Standalone Financial Statementsfor the year ended March 31, 2018
Deferred tax liabilities are recognised for taxable temporary differences associated with investments in subsidiaries and associates, and interests in joint ventures, except where the Company is able to control the reversal of the temporary difference and it is probable that the temporary difference will not reverse in the foreseeable future. Deferred tax assets arising from deductible temporary differences associated with such investments and interests are only recognised to the extent that it is probable that there will be sufficient taxable profits against which to utilise the benefits of the temporary differences and they are expected to reverse in the foreseeable future.
The carrying amount of deferred tax assets is reviewed at the end of each reporting period and reduced to the extent that it is no longer probable that sufficient taxable profits will be available to allow all or part of the asset to be recovered.
Deferred tax assets and liabilities are measured at the tax rates that are expected to apply in the period in which the liability is settled or the asset realised, based on tax rates (and tax laws) that have been enacted or substantively enacted by the end of the reporting period.
The measurement of deferred tax liabilities and assets reflects the tax consequences that would follow from the manner in which the Company expects, at the end of the reporting period, to recover or settle the carrying amount of its assets and liabilities.
For the purposes of measuring deferred tax liabilities and deferred tax assets on non-depreciable assets the carrying amounts of such properties are presumed to be recovered entirely through sale.
Deferred tax assets and deferred tax liabilities are offset if a legally enforceable right exists to set off current tax assets against current tax liabilities and the deferred taxes relate to the same taxable entity and the same taxation authority.
Minimum Alternate Tax (MAT) paid in accordance with the tax laws, which gives future economic benefits in the form of adjustment to future income tax liability, is considered as an asset if there is convincing evidence that the Company will pay normal income tax. Accordingly, MAT is recognised as a deferred tax asset in the Balance Sheet when it is highly probable that future economic benefit associated with it will flow to the Company.
Current and deferred tax for the year Current and deferred tax are recognised in profit or loss, except when they are relate to items that are recognised in other comprehensive
income or directly in equity, in which case, the current and deferred tax are also recognized in other comprehensive income or directly in equity respectively. Where current tax or deferred tax arises from the initial accounting for a business combination, the tax effect is included in the accounting for the business combination.
IX. Property, plant and equipment The cost of property, plant and equipment comprises its purchase price net of any trade discounts and rebates, any import duties and
other taxes (other than those subsequently recoverable from the tax authorities), any directly attributable expenditure on making the asset ready for its intended use, including relevant borrowing costs for qualifying assets. Expenditure incurred after the property, plant and equipment have been put into operation, such as repairs and maintenance, are charged to the Statement of Profit and Loss in the period in which the costs are incurred. Major shut-down and overhaul expenditure is capitalised as the activities undertaken improves the economic benefits expected to arise from the asset.
An item of property, plant and equipment is derecognised upon disposal or when no future economic benefits are expected to arise from the continued use of the asset. Any gain or loss arising on the disposal or retirement of an item of property, plant and equipment is determined as the difference between the sales proceeds and the carrying amount of the asset and is recognized in Statement of Profit and Loss.
Assets in the course of construction are capitalised in the assets under construction account. At the point when an asset is operating at management’s intended use, the cost of construction is transferred to the appropriate category of property, plant and equipment and depreciation commences. Costs associated with the commissioning of an asset and any obligatory decommissioning costs are capitalised where the asset is available for use but incapable of operating at normal levels until a period of commissioning has been completed. Revenue generated from production during the trial period is capitalised.
X. Depreciation and amortisation Depreciable amount for assets is the cost of an asset, or other amount substituted for cost, less its estimated residual value. Depreciation
is provided on buildings and plant & machinery on a straight-line method and in case of other tangible assets, on written-down value method over the estimated useful lives of the assets as per the useful life prescribed in Schedule II to the Companies Act, 2013 except for plant and machinery. In respect of plant and machinery, the life of the assets has been assessed as under based on technical advice, taking into account the nature of the asset, the estimated usage of the asset, the operating conditions of the asset, past history of replacement, anticipated technological changes, manufacturers warranties and maintenance support, etc. The useful lives of plant and machinery has been estimated as 22 years and 30 years for different categories as technically determined.
When significant parts of plant and equipment are required to be replaced at intervals, the Company depreciates them separately based on their specific useful lives.
Notes to the Standalone Financial Statementsfor the year ended March 31, 2018
Intangible assets are amortised over their estimated useful lives on straight line method. The amortization rates used for various intangible assets are as under:
Class of assets Years
Technical knowhow 5 to 20 years
Software 5 years
Freehold land is not depreciated. Leasehold land is amortized over the period of the lease, except where the lease is convertible to freehold land under lease agreements at future dates at no additional cost.
The Company reviews the residual value, useful lives and depreciation method annually and, if expectations differ from previous estimates, the change is accounted for as a change in accounting estimate on a prospective basis.
Depreciation on the tangible fixed assets of the Company’s assets has been provided on straight-line method as per the estimated useful life of such assets as follows:
Class of assets Years
Buildings 15 to 60 years
Plant and machinery 11 to 30 years
Furniture and fixtures 3 to 10 years
Vehicles and aircrafts 5 to 10 years
Office equipment 3 to 10 years
XI. Intangible assets
Intangible assets with finite useful lives that are acquired separately are carried at cost less accumulated amortisation and accumulated impairment losses. Amortisation is recognised on a straight-line basis over their estimated useful lives. The estimated useful life and amortisation method are reviewed at the end of each reporting period, with the effect of any changes in estimate being accounted for on a prospective basis. Intangible assets with indefinite useful lives that are acquired separately are carried at cost less accumulated impairment losses.
Derecognition of intangible assets An intangible asset is derecognised on disposal, or when no future economic benefits are expected from use or disposal. Gains or losses
arising from derecognition of an intangible asset, measured as the difference between the net disposal proceeds and the carrying amount of the asset are recognised in the Statement of Profit and Loss when the asset is derecognised.
XII. Goodwill
Goodwill arising on an acquisition of a business is carried at cost as established at the date of acquisition of the business less accumulated impairment losses, if any.
For the purposes of impairment testing, goodwill is allocated to each of the Company’s cash-generating units (or company of cash-generating units) that is expected to benefit from the synergies of the combination.
A cash-generating unit to which goodwill has been allocated is tested for impairment annually, or more frequently when there is indication that the unit may be impaired. If the recoverable amount of the cash-generating unit is less than its carrying amount, the impairment loss is allocated first to reduce the carrying amount of any goodwill allocated to the unit and then to the other assets of the unit pro rata based on the carrying amount of each asset in the unit. Any impairment loss for goodwill is recognised directly in the Standalone Statement of Profit and Loss. An impairment loss recognised for goodwill is not reversed in subsequent periods.
On disposal of the relevant cash-generating unit, the attributable amount of goodwill is included in the determination of the profit or loss on disposal.
XIII. Impairment of non-current assets
At the end of each reporting period, the Company reviews the carrying amounts of its tangible and intangible assets to determine whether there is any indication that those assets have suffered an impairment loss. If any such indication exists, the recoverable amount of the asset is estimated in order to determine the extent of the impairment loss (if any). Where it is not possible to estimate the recoverable amount of an individual asset, the Company estimates the recoverable amount of the cash-generating unit to which the asset belongs. Where a reasonable and consistent basis of allocation can be identified, corporate assets are also allocated to individual cash-generating units, or otherwise they are allocated to the smallest Company of cash-generating units for which a reasonable and consistent allocation basis can be identified.
Annual Report 2017 - 18 /7574
Notes to the Standalone Financial Statementsfor the year ended March 31, 2018
Intangible assets with indefinite useful lives and intangible assets not yet available for use are tested for impairment at least annually, and whenever there is an indication that the asset may be impaired.
Recoverable amount is the higher of fair value less costs to sell and value in use. In assessing value in use, the estimated future cash flows are discounted to their present value using a pre-tax discount rate that reflects current market assessments of the time value of money and the risks specific to the asset for which the estimates of future cash flows have not been adjusted.
If the recoverable amount of an asset (or cash-generating unit) is estimated to be less than its carrying amount, the carrying amount of the asset (or cash-generating unit) is reduced to its recoverable amount. An impairment loss is recognised immediately in the Statement of Profit and Loss, unless the relevant asset is carried at a revalued amount, in which case the impairment loss is treated as a revaluation decrease.
Where an impairment loss subsequently reverses, the carrying amount of the asset (or a cash-generating unit) is increased to the revised estimate of its recoverable amount, but so that the increased carrying amount does not exceed the carrying amount that would have been determined had no impairment loss been recognised for the asset (or cash-generating unit) in prior years. A reversal of an impairment loss is recognised immediately in the Statement of Profit and Loss, unless the relevant asset is carried at a revalued amount, in which case the reversal of the impairment loss is treated as a revaluation increase.
XIV. Inventories
Inventories are stated at the lower of cost and net realisable value. Costs of inventories comprises of cost of purchase, cost of conversion and other costs including manufacturing overheads incurred in bringing them to their respective present location and condition. Cost of raw materials, traded goods and stores and spares are ascertained on weighted average basis. Net realisable value represents the estimated selling price for inventories less all estimated costs of completion and costs necessary to make the sale.
XI. Provisions
Provisions are recognised when the Company has a present obligation (legal or constructive), as a result of past events, and it is probable that an outflow of resources, that can be reliably estimated, will be required to settle such an obligation.
The amount recognised as a provision is the best estimate of the consideration required to settle the present obligation at the balance sheet date, taking into account the risks and uncertainties surrounding the obligation. When a provision is measured using the cash flows estimated to settle the present obligation, its carrying amount is the present value of those cash flows (when the effect of the time value of money is material).
When some or all of the economic benefits required to settle a provision are expected to be recovered from a third party, a receivable is recognized as an asset if it is virtually certain that reimbursement will be received and the amount of the receivable can be measured reliably.
XVI. Investments in subsidiaries and Joint venture
Investments in subsidiaries and joint venture are carried at cost less accumulated impairment losses, if any. Cost includes the purchase price and other costs directly attributable to the acquisition of investments. Where an indication of impairment exists, the carrying amount of the investment is assessed and written down immediately to its recoverable amount. On disposal of investments in subsidiaries and joint venture, the difference between net disposal proceeds and the carrying amounts are recognized in the Standalone Statement of Profit and Loss. Further, under Ind AS 101, while transitioning to Ind AS for previous GAAP, the Company had elected to measure its existing investments in subsidiaries on the date of transition at the previous GAAP carrying value.
XVII. Cash and cash Equivalents
Cash and cash equivalents comprise cash and deposits with banks and corporations and bank overdrafts. The Company considers all highly liquid investments with a remaining maturity at the date of purchase of three months or less and that are readily convertible to known amounts of cash to be cash equivalents.
XVIII. Financial Instruments
Financial assets and financial liabilities are recognised when a Company entity becomes a party to the contractual provisions of the instrument.
Financial assets and financial liabilities are initially measured at fair value. Transaction costs that are directly attributable to the acquisition or issue of financial assets and financial liabilities (other than financial assets and financial liabilities at fair value through Statement of Profit and Loss) are added to or deducted from the fair value of the financial assets or financial liabilities, as appropriate, on initial recognition. Transaction costs directly attributable to the acquisition of financial assets or financial liabilities at fair value through Profit and Loss are recognised immediately in Statement of Profit and Loss.
A. Financial assets
a) Recognition and initial measurement
(i) The Company initially recognises loans and advances, deposits, debt securities issues and subordinated liabilities on the date on
Notes to the Standalone Financial Statementsfor the year ended March 31, 2018
which they originate. All other financial instruments (including regular way purchases and sales of financial assets) are recognised on the trade date, which is the date on which the Company a party to the contractual provisions of the instrument. A financial asset or liability is initially measured at fair value plus, for an item not at FVTPL, transaction costs that are directly attributable to its acquisition or issue.
(ii) In case of investments in subsidiaries, joint ventures and associates the Company has chosen to measure its investments at deemed cost.
(iii) The Company has elected to apply the requirements pertaining to Level III financial instruments of deferring the difference between
the fair value at initial recognition and the transaction price prospectively to transactions entered into on or after the date of transition to Ind AS.
b) Classification
On initial recognition, a financial asset is classified as measured at; amortised cost, FVOCI or FVTPL
A financial asset is measured at amortised cost if it meets both of the following conditions and is not designated at FVTPL:
• The asset is held within a business model whose objective is to hold assets to collect contractual cash flows; and
• The contractual terms of the financial asset give rise on specified dates to cash flows that are solely payments of principal and interest on the principal amount outstanding
This category is the most relevant to the Company. After initial measurement, such financial assets are subsequently measured at amortised cost using the effective interest rate (EIR) method. Amortised cost is calculated by taking into account any discount or premium on acquisition and fees or costs that are an integral part of the EIR. The EIR amortisation is included in finance income in the profit or loss. The losses arising from impairment are recognised in the profit or loss. This category generally applies to trade and other receivables. For more information on receivables, refer to Note 7. A debt instrument is classified as FVOCI only if it meets both the of the following conditions and is not recognised at FVTPL;
• The asset is held within a business model whose objective is achieved by both collecting contractual cash flows and selling financial assets; and
• The contractual terms of the financial asset give rise on specified dates to cash flows that are solely payments of principal and interest on the principal amount outstanding
Debt instruments included within the FVTOCI category are measured initially as well as at each reporting date at fair value. Fair value movements are recognized in the other comprehensive income (OCI). However, the Company recognizes interest income, impairment losses & reversals and foreign exchange gain or loss in the P&L. On derecognition of the asset, cumulative gain or loss previously recognised in OCI is reclassified from the equity to P&L. Interest earned whilst holding FVTOCI debt instrument is reported as interest income using the EIR method.
All equity investments in scope of Ind AS 109 are measured at fair value. Equity instruments which are held for trading and contingent consideration recognised by an acquirer in a business combination to which Ind AS 103 applies are classified as at FVTPL. For all other equity instruments, the Company may make an irrevocable election to present in other comprehensive income subsequent changes in the fair value. The Company makes such election on an instrument-by-instrument basis. The classification is made on initial recognition and is irrevocable.
If the Company decides to classify an equity instrument as at FVTOCI, then all fair value changes on the instrument, excluding dividends, are recognized in the OCI. There is no recycling of the amounts from OCI to P&L, even on sale of investment. However, the Company may transfer the cumulative gain or loss within equity.
Equity instruments included within the FVTPL category are measured at fair value with all changes recognized in the P&L.
All other financial assets are classified as measured at FVTPL.
In addition, on initial recognition, the Company may irrevocably designate a financial asset that otherwise meets the requirements to be measured at amortised cost or at FVOCI as at FVTPL if doing so eliminates or significantly reduces accounting mismatch that would otherwise arise.
Annual Report 2017 - 18 /7776
Notes to the Standalone Financial Statementsfor the year ended March 31, 2018
c) Derecognition
A financial asset (or, where applicable, a part of a financial asset or part of a similar financial assets) is primarily derecognised (i.e. removed from the Company’s balance sheet) when:
• The rights to receive cash flows from the asset have expired, or
• The Company has transferred its rights to receive cash flows from the asset or has assumed an obligation to pay the received cash flows in full without material delay to a third party under a ‘pass-through’ arrangement and either (a) the Company has transferred substantially all the risks and rewards of the asset, or (b) the Company has neither transferred nor retained substantially all the risks and rewards of the asset, but has transferred control of the asset.
When the Company has transferred its rights to receive cash flows from an asset or has entered into a pass-through arrangement, it evaluates if and to what extent it has retained the risks and rewards of ownership. When it has neither transferred nor retained substantially all of the risks and rewards of the asset, nor transferred control of the asset, the Company continues to recognise the transferred asset to the extent of the Company’s continuing involvement. In that case, the Company also recognises an associated liability. The transferred asset and the associated liability are measured on a basis that reflects the rights and obligations that the Company has retained.
Continuing involvement that takes the form of a guarantee over the transferred asset is measured at the lower of the original carrying amount of the asset and the maximum amount of consideration that the Company could be required to repay.
d) Impairment
Impairment of financial assets In accordance with Ind AS 109, the Company applies expected credit loss (ECL) model for measurement and recognition of impairment
loss on the following financial assets and credit risk exposure:
a) Financial assets that are debt instruments, and are measured at amortised cost e.g., loans, debt securities, deposits, trade receivables and bank balance
b) Financial assets that are debt instruments and are measured as at FVTOCIc) Lease receivables under Ind AS 17d) Trade receivables or any contractual right to receive cash or another financial asset that result from transactions that are within the
scope of Ind AS 11 and Ind AS 18 (referred to as ‘contractual revenue receivables’ in these financial statements)e) Loan commitments which are not measured as at FVTPLf) Financial guarantee contracts which are not measured as at FVTPL
The Company follows ‘simplified approach’ for recognition of impairment loss allowance on:
I) Trade receivables or contract revenue receivables; and
II) All lease receivables resulting from transactions within the scope of Ind AS 17
The application of simplified approach does not require the Company to track changes in credit risk. Rather, it recognises impairment loss allowance based on lifetime ECLs at each reporting date, right from its initial recognition.
For recognition of impairment loss on other financial assets and risk exposure, the Company determines that whether there has been a significant increase in the credit risk since initial recognition. If credit risk has not increased significantly, 12-month ECL is used to provide for impairment loss. However, if credit risk has increased significantly, lifetime ECL is used. If, in a subsequent period, credit quality of the instrument improves such that there is no longer a significant increase in credit risk since initial recognition, then the entity reverts to recognising impairment loss allowance based on 12-month ECL.
Lifetime ECL are the expected credit losses resulting from all possible default events over the expected life of a financial instrument. The 12-month ECL is a portion of the lifetime ECL which results from default events that are possible within 12 months after the reporting date.
ECL is the difference between all contractual cash flows that are due to the Company in accordance with the contract and all the cash flows that the entity expects to receive (i.e., all cash shortfalls), discounted at the original EIR. When estimating the cash flows, an entity is required to consider:
i) All contractual terms of the financial instrument (including prepayment, extension, call and similar options) over the expected life of the financial instrument. However, in rare cases when the expected life of the financial instrument cannot be estimated reliably, then the entity is required to use the remaining contractual term of the financial instrument
Notes to the Standalone Financial Statementsfor the year ended March 31, 2018
ii) Cash flows from the sale of collateral held or other credit enhancements that are integral to the contractual terms
ECL impairment loss allowance (or reversal) recognized during the period is recognized as income/ expense in the statement of profit and loss (P&L). This amount is reflected under the head ‘other expenses’ in the P&L. The balance sheet presentation for various financial instruments is described below:
i) Financial assets measured as at amortised cost, contractual revenue receivables and lease receivables: ECL is presented as an allowance, i.e., as an integral part of the measurement of those assets in the balance sheet. The allowance reduces the net carrying amount. Until the asset meets write-off criteria, the Company does not reduce impairment allowance from the gross carrying amount.
ii) Loan commitments and financial guarantee contracts: ECL is presented as a provision in the balance sheet, i.e. as a liability.
iii) Debt instruments measured at FVTOCI: Since financial assets are already reflected at fair value, impairment allowance is not further reduced from its value. Rather, ECL amount is presented as ‘accumulated impairment amount’ in the OCI.
For assessing increase in credit risk and impairment loss, the Company combines financial instruments on the basis of shared credit risk characteristics with the objective of facilitating an analysis that is designed to enable significant increases in credit risk to be identified on a timely basis.
The Company does not have any purchased or originated credit-impaired (POCI) financial assets, i.e., financial assets which are credit impaired on purchase/ origination.
e. Effective interest method
The effective interest method is a method of calculating the amortised cost of a debt instrument and of allocating interest income over the relevant period. The effective interest rate is the rate that exactly discounts estimated future cash receipts (including all fees and points paid or received that form an integral part of the effective interest rate, transaction costs and other premiums or discounts) through the expected life of the debt instrument, or, where appropriate, a shorter period, to the net carrying amount on initial recognition.
Income is recognised on an effective interest basis for debt instruments other than those financial assets classified as at FVTPL.
B. Financial liabilities and equity instruments
a) Classification as debt or equity Debt and equity instruments issued by a Company entity are classified as either financial liabilities or as equity in accordance with the
substance of the contractual arrangements and the definitions of a financial liability and an equity instrument.
b) Equity instruments An equity instrument is any contract that evidences a residual interest in the assets of an entity after deducting all of its liabilities. Equity
instruments issued by the Company are recognised at the proceeds received, net of direct issue costs.
Repurchase of the Company’s own equity instruments is recognised and deducted directly in equity. No gain or loss is recognised in Statement of Profit and Loss on the purchase, sale, issue or cancellation of the Company’s own equity instruments.
c) Financial liabilities
Financial liabilities are classified as either financial liabilities ‘at FVTPL’ or ‘other financial liabilities’.
Financial liabilities at FVTPL
Financial liabilities are classified as at FVTPL when the financial liability is either held for trading or it is designated as at FVTPL.
Financial liabilities at FVTPL are stated at fair value, with any gains or losses arising on remeasurement recognised in Statement of Profit and Loss. The net gain or loss recognised in Statement of Profit and Loss incorporates any interest paid on the financial liability and is included in the ‘other gains and losses’ line item in the [statement of comprehensive income/Statement of Profit and Loss].
The Company derecognises financial liabilities when, and only when, the Company’s obligations are discharged, cancelled or they expire. The difference between the carrying amount of the financial liability derecognised and the consideration paid and payable is recognised in Statement of Profit and Loss.
d) Derivative financial instruments
The Company has entered into forward exchange contracts or principal only swap which are in substance of forward exchange contracts to manage its exposure to foreign currency cash flows.
Annual Report 2017 - 18 /7978
Notes to the Standalone Financial Statementsfor the year ended March 31, 2018
Derivatives are initially recognised at fair value at the date the derivative contracts are entered into and are subsequently remeasured to their fair value at the end of each reporting period
e) Reclassification of financial assets
The Company determines classification of financial assets and liabilities on initial recognition. After initial recognition, no reclassification is made for financial assets which are equity instruments and financial liabilities. For financial assets which are debt instruments, a reclassification is made only if there is a change in the business model for managing those assets. Changes to the business model are expected to be infrequent. The Company’s senior management determines change in the business model as a result of external or internal changes which are significant to the Company’s operations. Such changes are evident to external parties. A change in the business model occurs when the Company either begins or ceases to perform an activity that is significant to its operations. If the Company reclassifies financial assets, it applies the reclassification prospectively from the reclassification date which is the first day of the immediately next reporting period following the change in business model. The Company does not restate any previously recognised gains, losses (including impairment gains or losses) or interest.
The following table shows various reclassification and how they are accounted for:
Original classification Revised classification Accounting treatment
Amortised cost FVTPL Fair value is measured at reclassification date. Difference between previous amortized cost and fair value is recognised in P&L.
FVTPL Amortised CostFair value at reclassification date becomes its new gross carrying amount. EIR is calculated based on the new gross carrying amount.
Amortised cost FVTOCIFair value is measured at reclassification date. Difference between previous amortised cost and fair value is recognised in OCI. No change in EIR due to reclassification.
FVTOCI Amortised costFair value at reclassification date becomes its new amortised cost carrying amount. However, cumulative gain or loss in OCI is adjusted against fair value. Consequently, the asset is measured as if it had always been measured at amortised cost.
FVTPL FVTOCI Fair value at reclassification date becomes its new carrying amount. No other adjustment is required.
FVTOCI FVTPL Assets continue to be measured at fair value. Cumulative gain or loss previously recognized in OCI is reclassified to P&L at the reclassification date.
3. Critical Judgements in applying accounting policies and key sources of estimation uncertainty
3.1 Critical judgements in applying accounting policies
In the course of applying the policies outlined in all notes under section 2 above, the directors of the Company are required to make judgements, estimates and assumptions about the carrying amount of assets and liabilities that are not readily apparent from other sources. The estimates and associated assumptions are based on historical experience and other factors that are considered to be relevant. Actual results may differ from these estimates.
The estimates and underlying assumptions are reviewed on an ongoing basis. Revisions to accounting estimates are recognised in the period in which the estimate is revised if the revision affects only that period, or in the period of the revision and future period, if the revision affects current and future period.
3.2 Key sources of estimation uncertainty
i) Useful lives and residual value of property, plant and equipment
Company reviews the useful lives and residual values of property, plant and equipment at least once a year. Such lives are dependent upon an assessment of both the technical lives of the assets and also their likely economic lives based on various internal and external factors including relative efficiency and operating costs. Accordingly, useful lives are reviewed annually using the best information available to the Management.
ii) Fair value measurements and valuation process
Management uses its judgement in selecting an appropriate valuation technique for financial instruments not quoted in an active market. Valuation techniques commonly used by market participants are applied. Other financial instruments are valued using a discounted cash flow method based on assumptions supported, where possible, by observable market prices or rates.
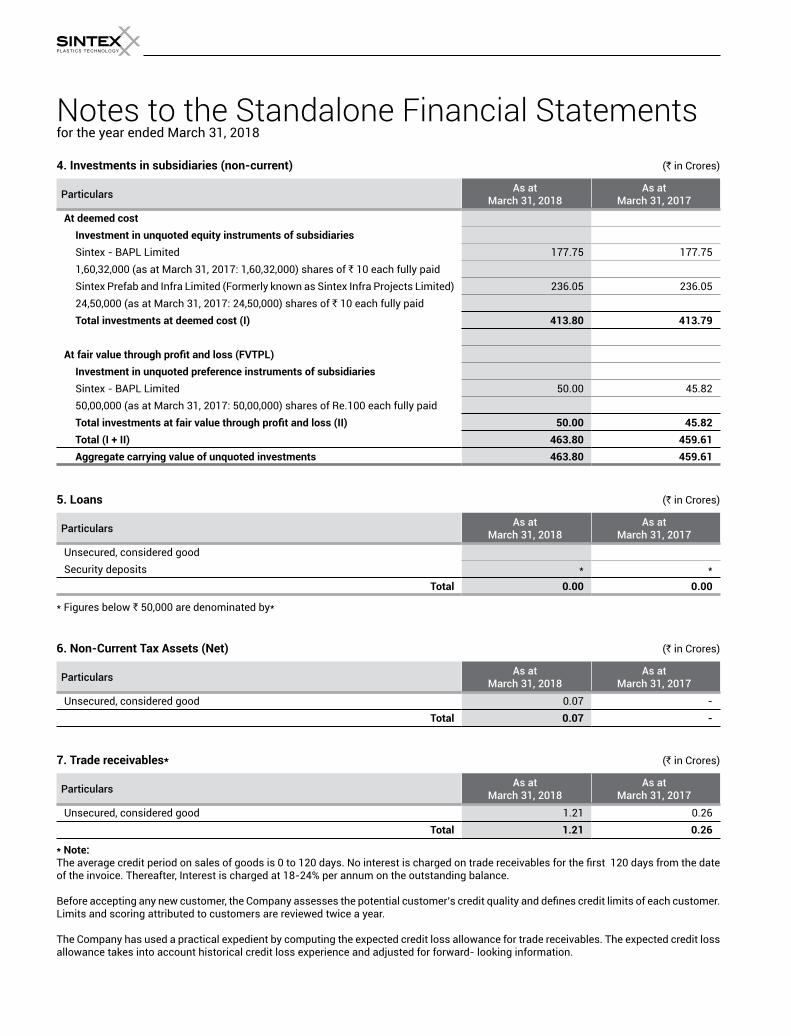
Notes to the Standalone Financial Statementsfor the year ended March 31, 2018
4. Investments in subsidiaries (non-current) (` in Crores)
ParticularsAs at
March 31, 2018As at
March 31, 2017
At deemed cost
Investment in unquoted equity instruments of subsidiaries
Sintex - BAPL Limited 177.75 177.75 1,60,32,000 (as at March 31, 2017: 1,60,32,000) shares of ` 10 each fully paid
Sintex Prefab and Infra Limited (Formerly known as Sintex Infra Projects Limited) 236.05 236.05 24,50,000 (as at March 31, 2017: 24,50,000) shares of ` 10 each fully paid
Total investments at deemed cost (I) 413.80 413.79
At fair value through profit and loss (FVTPL)Investment in unquoted preference instruments of subsidiaries
Sintex - BAPL Limited 50.00 45.82 50,00,000 (as at March 31, 2017: 50,00,000) shares of Re.100 each fully paid Total investments at fair value through profit and loss (II) 50.00 45.82
Total (I + II) 463.80 459.61
Aggregate carrying value of unquoted investments 463.80 459.61
5. Loans (` in Crores)
ParticularsAs at
March 31, 2018As at
March 31, 2017
Unsecured, considered good
Security deposits * *
Total 0.00 0.00
* Figures below ` 50,000 are denominated by*
6. Non-Current Tax Assets (Net) (` in Crores)
ParticularsAs at
March 31, 2018As at
March 31, 2017
Unsecured, considered good 0.07 -
Total 0.07 -
7. Trade receivables* (` in Crores)
ParticularsAs at
March 31, 2018As at
March 31, 2017
Unsecured, considered good 1.21 0.26 Total 1.21 0.26
* Note: The average credit period on sales of goods is 0 to 120 days. No interest is charged on trade receivables for the first 120 days from the date of the invoice. Thereafter, Interest is charged at 18-24% per annum on the outstanding balance. Before accepting any new customer, the Company assesses the potential customer’s credit quality and defines credit limits of each customer. Limits and scoring attributed to customers are reviewed twice a year. The Company has used a practical expedient by computing the expected credit loss allowance for trade receivables. The expected credit loss allowance takes into account historical credit loss experience and adjusted for forward- looking information.
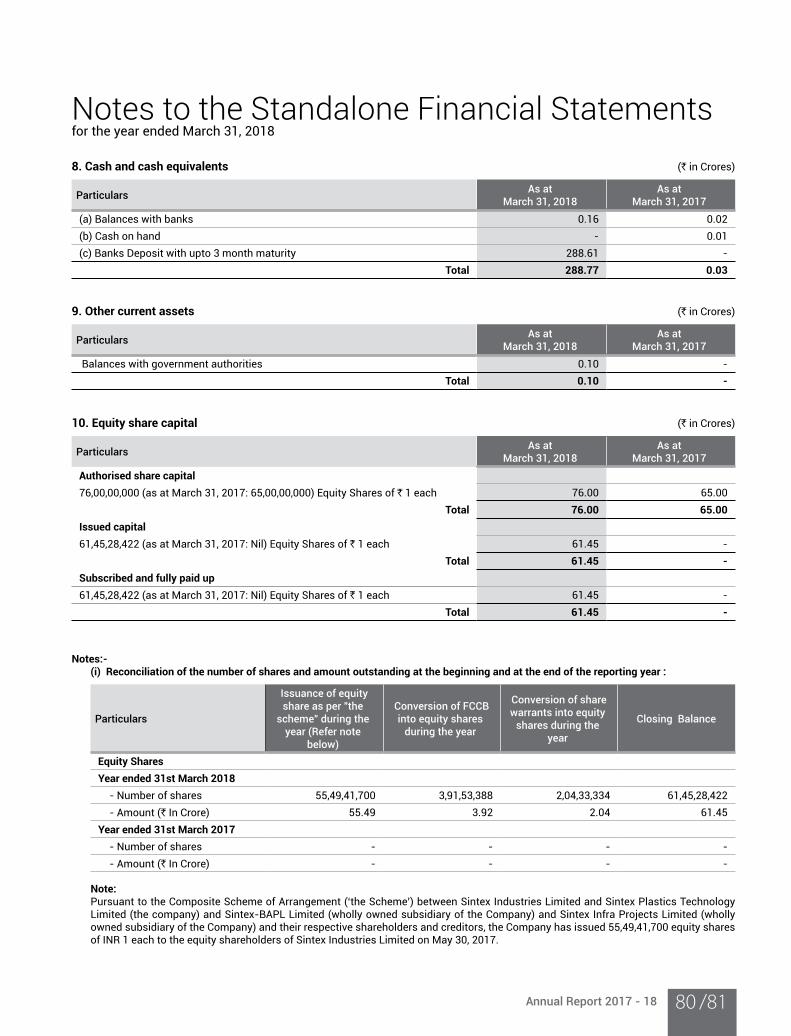
Annual Report 2017 - 18 /8180
Notes to the Standalone Financial Statementsfor the year ended March 31, 2018
8. Cash and cash equivalents (` in Crores)
ParticularsAs at
March 31, 2018As at
March 31, 2017
(a) Balances with banks 0.16 0.02 (b) Cash on hand - 0.01 (c) Banks Deposit with upto 3 month maturity 288.61 -
Total 288.77 0.03
9. Other current assets (` in Crores)
ParticularsAs at
March 31, 2018As at
March 31, 2017
Balances with government authorities 0.10 -
Total 0.10 -
10. Equity share capital (` in Crores)
ParticularsAs at
March 31, 2018As at
March 31, 2017
Authorised share capital
76,00,00,000 (as at March 31, 2017: 65,00,00,000) Equity Shares of ` 1 each 76.00 65.00 Total 76.00 65.00
Issued capital
61,45,28,422 (as at March 31, 2017: Nil) Equity Shares of ` 1 each 61.45 -
Total 61.45 -
Subscribed and fully paid up
61,45,28,422 (as at March 31, 2017: Nil) Equity Shares of ` 1 each 61.45 -
Total 61.45 -
Notes:- (i) Reconciliation of the number of shares and amount outstanding at the beginning and at the end of the reporting year :
Particulars
Issuance of equity share as per "the
scheme" during the year (Refer note
below)
Conversion of FCCB into equity shares
during the year
Conversion of share warrants into equity
shares during the year
Closing Balance
Equity Shares
Year ended 31st March 2018
- Number of shares 55,49,41,700 3,91,53,388 2,04,33,334 61,45,28,422 - Amount (` In Crore) 55.49 3.92 2.04 61.45
Year ended 31st March 2017
- Number of shares - - - -
- Amount (` In Crore) - - - -
Note: Pursuant to the Composite Scheme of Arrangement (‘the Scheme’) between Sintex Industries Limited and Sintex Plastics Technology
Limited (the company) and Sintex-BAPL Limited (wholly owned subsidiary of the Company) and Sintex Infra Projects Limited (wholly owned subsidiary of the Company) and their respective shareholders and creditors, the Company has issued 55,49,41,700 equity shares of INR 1 each to the equity shareholders of Sintex Industries Limited on May 30, 2017.
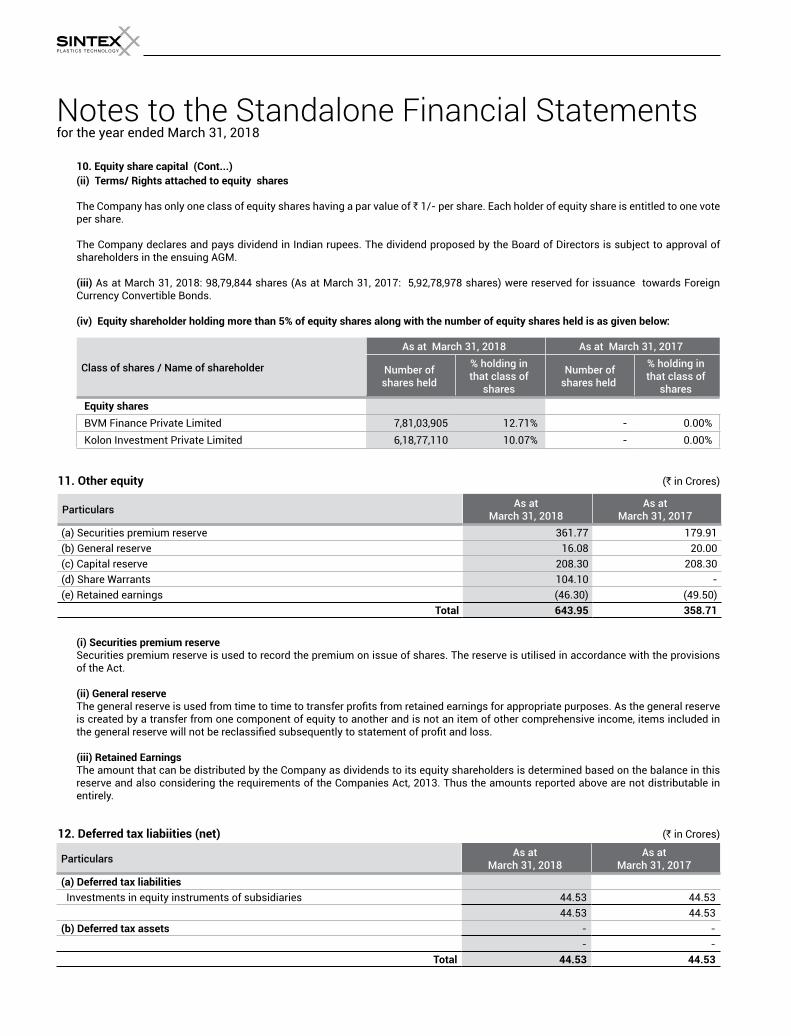
Notes to the Standalone Financial Statementsfor the year ended March 31, 2018
10. Equity share capital (Cont...)
(ii) Terms/ Rights attached to equity shares The Company has only one class of equity shares having a par value of ` 1/- per share. Each holder of equity share is entitled to one vote
per share. The Company declares and pays dividend in Indian rupees. The dividend proposed by the Board of Directors is subject to approval of
shareholders in the ensuing AGM. (iii) As at March 31, 2018: 98,79,844 shares (As at March 31, 2017: 5,92,78,978 shares) were reserved for issuance towards Foreign
Currency Convertible Bonds.
(iv) Equity shareholder holding more than 5% of equity shares along with the number of equity shares held is as given below:
Class of shares / Name of shareholder
As at March 31, 2018 As at March 31, 2017
Number of shares held
% holding in that class of
shares
Number of shares held
% holding in that class of
shares
Equity shares
BVM Finance Private Limited 7,81,03,905 12.71% - 0.00%Kolon Investment Private Limited 6,18,77,110 10.07% - 0.00%
11. Other equity (` in Crores)
ParticularsAs at
March 31, 2018As at
March 31, 2017
(a) Securities premium reserve 361.77 179.91 (b) General reserve 16.08 20.00 (c) Capital reserve 208.30 208.30 (d) Share Warrants 104.10 -
(e) Retained earnings (46.30) (49.50)Total 643.95 358.71
(i) Securities premium reserve Securities premium reserve is used to record the premium on issue of shares. The reserve is utilised in accordance with the provisions
of the Act. (ii) General reserve The general reserve is used from time to time to transfer profits from retained earnings for appropriate purposes. As the general reserve
is created by a transfer from one component of equity to another and is not an item of other comprehensive income, items included in the general reserve will not be reclassified subsequently to statement of profit and loss.
(iii) Retained Earnings The amount that can be distributed by the Company as dividends to its equity shareholders is determined based on the balance in this
reserve and also considering the requirements of the Companies Act, 2013. Thus the amounts reported above are not distributable in entirely.
12. Deferred tax liabiities (net) (` in Crores)
ParticularsAs at
March 31, 2018As at
March 31, 2017
(a) Deferred tax liabilities
Investments in equity instruments of subsidiaries 44.53 44.53 44.53 44.53
(b) Deferred tax assets - -
- -
Total 44.53 44.53
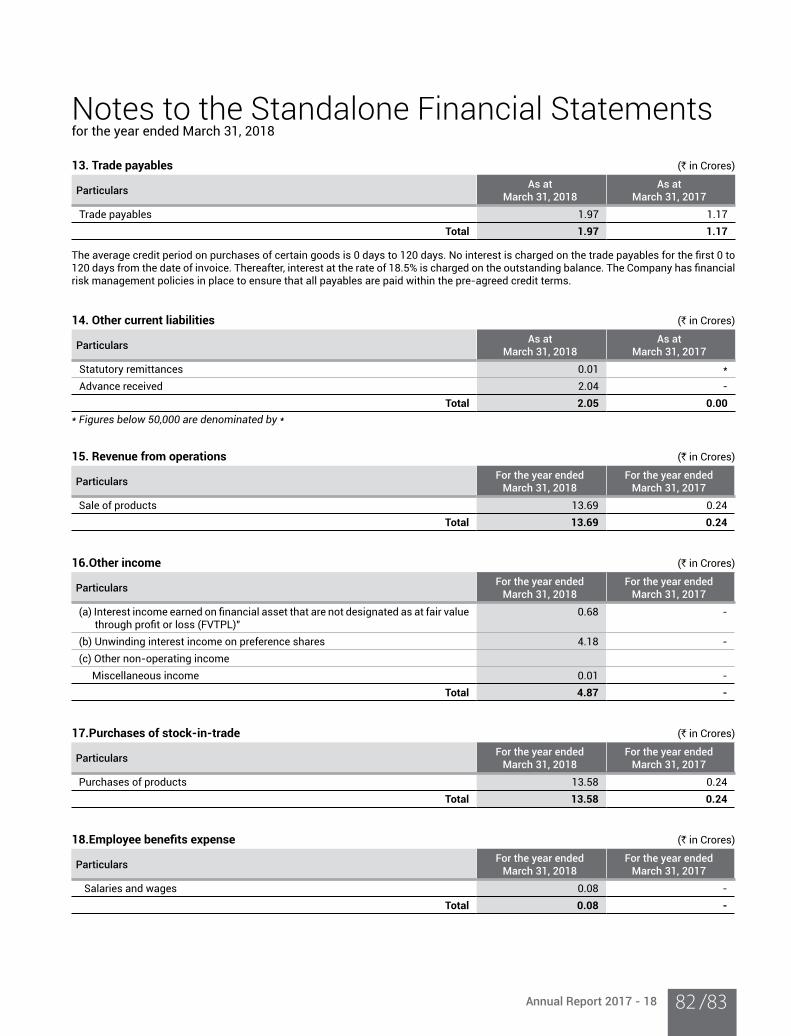
Annual Report 2017 - 18 /8382
Notes to the Standalone Financial Statementsfor the year ended March 31, 2018
13. Trade payables (` in Crores)
ParticularsAs at
March 31, 2018As at
March 31, 2017
Trade payables 1.97 1.17 Total 1.97 1.17
The average credit period on purchases of certain goods is 0 days to 120 days. No interest is charged on the trade payables for the first 0 to 120 days from the date of invoice. Thereafter, interest at the rate of 18.5% is charged on the outstanding balance. The Company has financial risk management policies in place to ensure that all payables are paid within the pre-agreed credit terms.
14. Other current liabilities (` in Crores)
ParticularsAs at
March 31, 2018As at
March 31, 2017
Statutory remittances 0.01 *
Advance received 2.04 -
Total 2.05 0.00
* Figures below 50,000 are denominated by *
15. Revenue from operations (` in Crores)
ParticularsFor the year ended
March 31, 2018For the year ended
March 31, 2017
Sale of products 13.69 0.24 Total 13.69 0.24
16.Other income (` in Crores)
ParticularsFor the year ended
March 31, 2018For the year ended
March 31, 2017
(a) Interest income earned on financial asset that are not designated as at fair value through profit or loss (FVTPL)"
0.68 -
(b) Unwinding interest income on preference shares 4.18 -
(c) Other non-operating income
Miscellaneous income 0.01 -
Total 4.87 -
17.Purchases of stock-in-trade (` in Crores)
ParticularsFor the year ended
March 31, 2018For the year ended
March 31, 2017
Purchases of products 13.58 0.24 Total 13.58 0.24
18.Employee benefits expense (` in Crores)
ParticularsFor the year ended
March 31, 2018For the year ended
March 31, 2017
Salaries and wages 0.08 -
Total 0.08 -
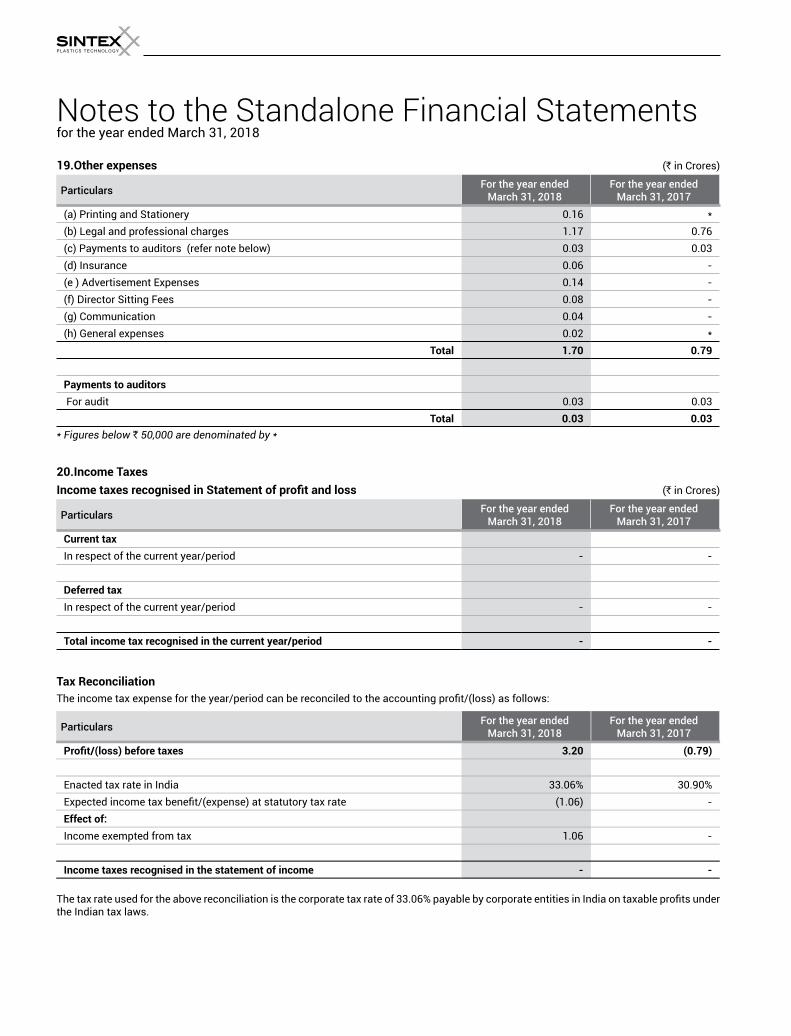
Notes to the Standalone Financial Statementsfor the year ended March 31, 2018
19.Other expenses (` in Crores)
ParticularsFor the year ended
March 31, 2018For the year ended
March 31, 2017
(a) Printing and Stationery 0.16 *
(b) Legal and professional charges 1.17 0.76 (c) Payments to auditors (refer note below) 0.03 0.03 (d) Insurance 0.06 -
(e ) Advertisement Expenses 0.14 -
(f) Director Sitting Fees 0.08 -
(g) Communication 0.04 -
(h) General expenses 0.02 *
Total 1.70 0.79
Payments to auditors
For audit 0.03 0.03 Total 0.03 0.03
* Figures below ` 50,000 are denominated by *
20.Income Taxes
Income taxes recognised in Statement of profit and loss (` in Crores)
ParticularsFor the year ended
March 31, 2018For the year ended
March 31, 2017
Current tax
In respect of the current year/period - -
Deferred tax
In respect of the current year/period - -
Total income tax recognised in the current year/period - -
Tax Reconciliation
The income tax expense for the year/period can be reconciled to the accounting profit/(loss) as follows:
ParticularsFor the year ended
March 31, 2018For the year ended
March 31, 2017
Profit/(loss) before taxes 3.20 (0.79)
Enacted tax rate in India 33.06% 30.90%Expected income tax benefit/(expense) at statutory tax rate (1.06) -
Effect of:
Income exempted from tax 1.06 -
Income taxes recognised in the statement of income - -
The tax rate used for the above reconciliation is the corporate tax rate of 33.06% payable by corporate entities in India on taxable profits under the Indian tax laws.
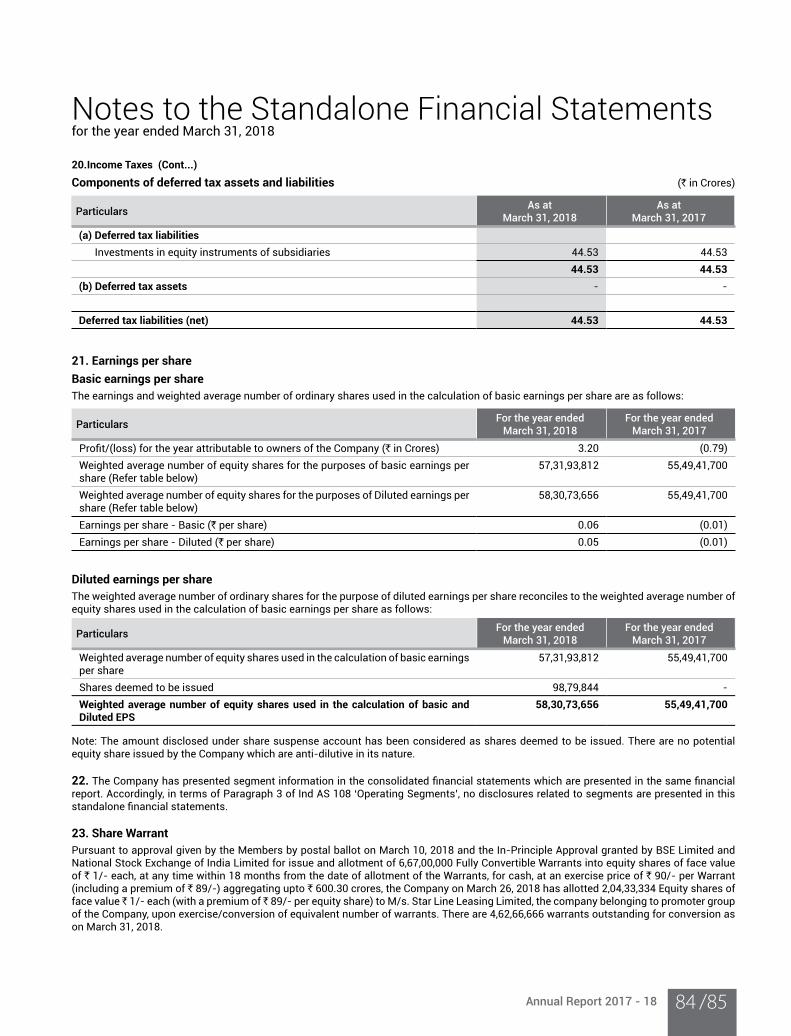
Annual Report 2017 - 18 /8584
Notes to the Standalone Financial Statementsfor the year ended March 31, 2018
20.Income Taxes (Cont...)
Components of deferred tax assets and liabilities (` in Crores)
ParticularsAs at
March 31, 2018As at
March 31, 2017
(a) Deferred tax liabilities
Investments in equity instruments of subsidiaries 44.53 44.53 44.53 44.53
(b) Deferred tax assets - -
Deferred tax liabilities (net) 44.53 44.53
21. Earnings per share
Basic earnings per share
The earnings and weighted average number of ordinary shares used in the calculation of basic earnings per share are as follows:
ParticularsFor the year ended
March 31, 2018For the year ended
March 31, 2017
Profit/(loss) for the year attributable to owners of the Company (` in Crores) 3.20 (0.79)Weighted average number of equity shares for the purposes of basic earnings per share (Refer table below)
57,31,93,812 55,49,41,700
Weighted average number of equity shares for the purposes of Diluted earnings per share (Refer table below)
58,30,73,656 55,49,41,700
Earnings per share - Basic (` per share) 0.06 (0.01)Earnings per share - Diluted (` per share) 0.05 (0.01)
Diluted earnings per share
The weighted average number of ordinary shares for the purpose of diluted earnings per share reconciles to the weighted average number of equity shares used in the calculation of basic earnings per share as follows:
ParticularsFor the year ended
March 31, 2018For the year ended
March 31, 2017
Weighted average number of equity shares used in the calculation of basic earnings per share
57,31,93,812 55,49,41,700
Shares deemed to be issued 98,79,844 -
Weighted average number of equity shares used in the calculation of basic and Diluted EPS
58,30,73,656 55,49,41,700
Note: The amount disclosed under share suspense account has been considered as shares deemed to be issued. There are no potential equity share issued by the Company which are anti-dilutive in its nature.
22. The Company has presented segment information in the consolidated financial statements which are presented in the same financial report. Accordingly, in terms of Paragraph 3 of Ind AS 108 ‘Operating Segments’, no disclosures related to segments are presented in this standalone financial statements.
23. Share Warrant
Pursuant to approval given by the Members by postal ballot on March 10, 2018 and the In-Principle Approval granted by BSE Limited and National Stock Exchange of India Limited for issue and allotment of 6,67,00,000 Fully Convertible Warrants into equity shares of face value of ` 1/- each, at any time within 18 months from the date of allotment of the Warrants, for cash, at an exercise price of ` 90/- per Warrant (including a premium of ` 89/-) aggregating upto ` 600.30 crores, the Company on March 26, 2018 has allotted 2,04,33,334 Equity shares of face value 1/- each (with a premium of 89/- per equity share) to M/s. Star Line Leasing Limited, the company belonging to promoter group of the Company, upon exercise/conversion of equivalent number of warrants. There are 4,62,66,666 warrants outstanding for conversion as on March 31, 2018.
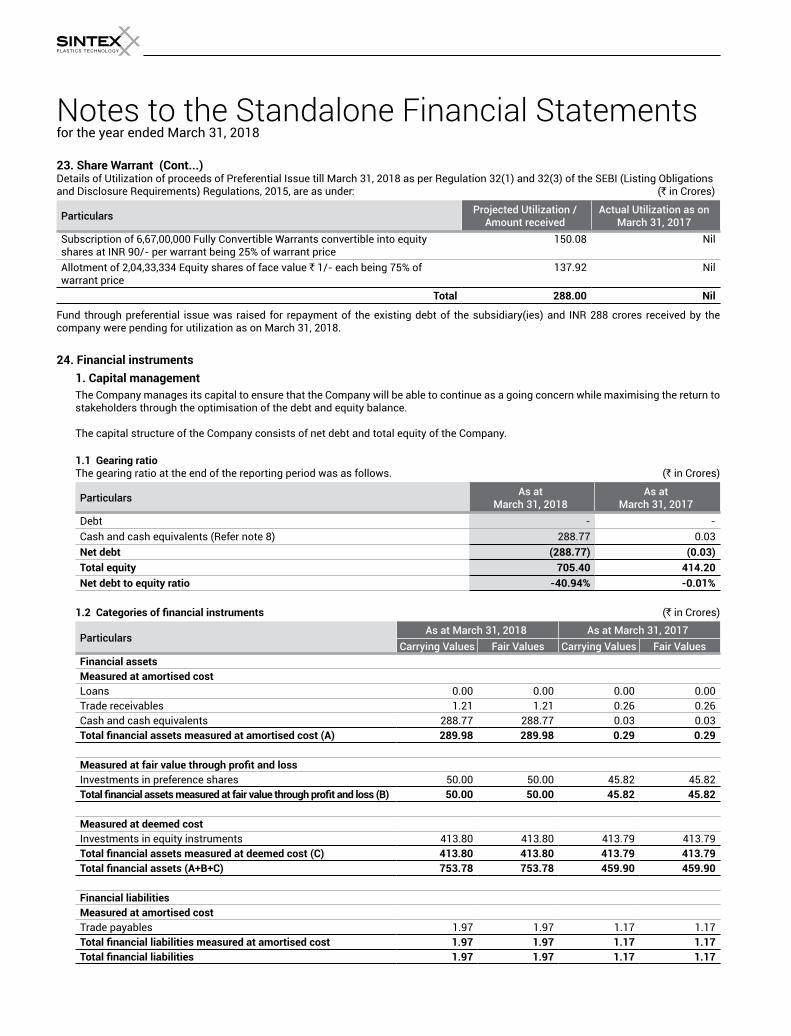
Notes to the Standalone Financial Statementsfor the year ended March 31, 2018
23. Share Warrant (Cont...)Details of Utilization of proceeds of Preferential Issue till March 31, 2018 as per Regulation 32(1) and 32(3) of the SEBI (Listing Obligations and Disclosure Requirements) Regulations, 2015, are as under: (` in Crores)
ParticularsProjected Utilization /
Amount receivedActual Utilization as on
March 31, 2017
Subscription of 6,67,00,000 Fully Convertible Warrants convertible into equity shares at INR 90/- per warrant being 25% of warrant price
150.08 Nil
Allotment of 2,04,33,334 Equity shares of face value ` 1/- each being 75% of warrant price
137.92 Nil
Total 288.00 Nil
Fund through preferential issue was raised for repayment of the existing debt of the subsidiary(ies) and INR 288 crores received by the company were pending for utilization as on March 31, 2018.
24. Financial instruments
1. Capital management
The Company manages its capital to ensure that the Company will be able to continue as a going concern while maximising the return to stakeholders through the optimisation of the debt and equity balance.
The capital structure of the Company consists of net debt and total equity of the Company.
1.1 Gearing ratio The gearing ratio at the end of the reporting period was as follows. (` in Crores)
ParticularsAs at
March 31, 2018As at
March 31, 2017
Debt - -
Cash and cash equivalents (Refer note 8) 288.77 0.03 Net debt (288.77) (0.03)
Total equity 705.40 414.20
Net debt to equity ratio -40.94% -0.01%
1.2 Categories of financial instruments (` in Crores)
ParticularsAs at March 31, 2018 As at March 31, 2017
Carrying Values Fair Values Carrying Values Fair Values
Financial assets
Measured at amortised cost
Loans 0.00 0.00 0.00 0.00 Trade receivables 1.21 1.21 0.26 0.26 Cash and cash equivalents 288.77 288.77 0.03 0.03 Total financial assets measured at amortised cost (A) 289.98 289.98 0.29 0.29
Measured at fair value through profit and lossInvestments in preference shares 50.00 50.00 45.82 45.82 Total financial assets measured at fair value through profit and loss (B) 50.00 50.00 45.82 45.82
Measured at deemed cost
Investments in equity instruments 413.80 413.80 413.79 413.79 Total financial assets measured at deemed cost (C) 413.80 413.80 413.79 413.79
Total financial assets (A+B+C) 753.78 753.78 459.90 459.90
Financial liabilities
Measured at amortised cost
Trade payables 1.97 1.97 1.17 1.17 Total financial liabilities measured at amortised cost 1.97 1.97 1.17 1.17
Total financial liabilities 1.97 1.97 1.17 1.17
Annual Report 2017 - 18 /8786
Notes to the Standalone Financial Statementsfor the year ended March 31, 2018
24. Financial instruments (Cont...)
2. Financial risk management objectives
The Company’s Corporate finance department provides services to business, co-ordinates access to domestic and international financial markets, monitors and manages the financial risks relating to the operations of the Company through internal risk reports which analyse the exposures by degree and magnitude of risks. These risks include market risk (including currency risk, interest rate risk and other price risk), credit risk and liquidity risk.
The Company seeks to minimize the effects of these risks by using derivative financial instruments to hedge risk exposures. The use of financial derivatives is governed by the Company’s policies approved by the Board of Directors, which provide written principles on foreign exchange risk, interest rate risk, credit risk, the use of financial derivatives and non-derivative financial instruments, and the investment of excess liquidity. Compliance with policies and exposure limits is reviewed by the Management on a continuous basis. The Company does not enter into or trade financial instruments, including derivatives for speculative purposes.
3. Market risk The Company’s activities is not exposed to the financial risks of changes in foreign currency exchange rates and interest rates on foreign
currency borrowings and variable interest loans. The Company has not entered into any foreign transactions and has not borrowed any funds during the reporting period.
4. Foreign currency risk management All transactions of the Company are in INR only.
5. Interest rate risk management The Company is not exposed to interest rate risk because the Company has not borrowed funds during the reporting period.
6. Credit risk management
Credit risk refers to the risk that a counterparty will default on its contractual obligations resulting in financial loss to the Company. Credit risk encompasses of both, the direct risk of default and the risk of deterioration of creditworthiness as well as concentration risks. The Company has adopted a policy of only dealing with creditworthy counterparties and obtaining sufficient collateral, where appropriate, as a means of mitigating the risk of financial loss from defaults. The Company uses publicly available financial information and its own trading records to rate its major customers. The Company’s exposure and the credit ratings of its counterparties are continuously monitored and the aggregate value of transactions concluded is spread amongst approved counterparties.
Trade receivables consist of a large number of customers, spread across diverse industries and geographical areas. Ongoing credit evaluation is performed on the financial condition of accounts receivable.
The Company does not have significant credit risk exposure to any single counterparty. Concentration of credit risk related to the above mentioned Company did not exceed 10% of gross monetary assets at any time during the year. Concentration of credit risk to any other counterparty did not exceed 10% of gross monetary assets at any time during the year.
The credit risk on liquid funds and derivative financial instruments is limited because the counterparties are banks with high credit-ratings assigned by international credit-rating agencies.
6.1 Collateral held as security and other credit enhancements The Company does not hold any collateral or other credit enhancements to cover its credit risk associated with its financial assets.
7. Liquidity risk management Liquidity risk refers to the risk of financial distress or extraordinary high financing costs arising due to shortage of liquid funds in a situation
where business conditions unexpectedly deteriorate and requiring financing. Ultimate responsibility for liquidity risk management rests with the board of directors, which has established an appropriate liquidity risk management framework for the management of the Company’s short, medium and long-term funding and liquidity management requirements. The Company manages liquidity risk by maintaining adequate reserves, banking facilities and reserve borrowing facilities, by continuously monitoring forecast and actual cash flows, and by matching the maturity profiles of financial assets and liabilities.
The following tables detail the Company’s remaining contractual maturity for its non-derivative financial liabilities with agreed repayment periods and its non-derivative financial assets. The tables have been drawn up based on the undiscounted cash flows of financial liabilities based on the earliest date on which the Company can be required to pay.
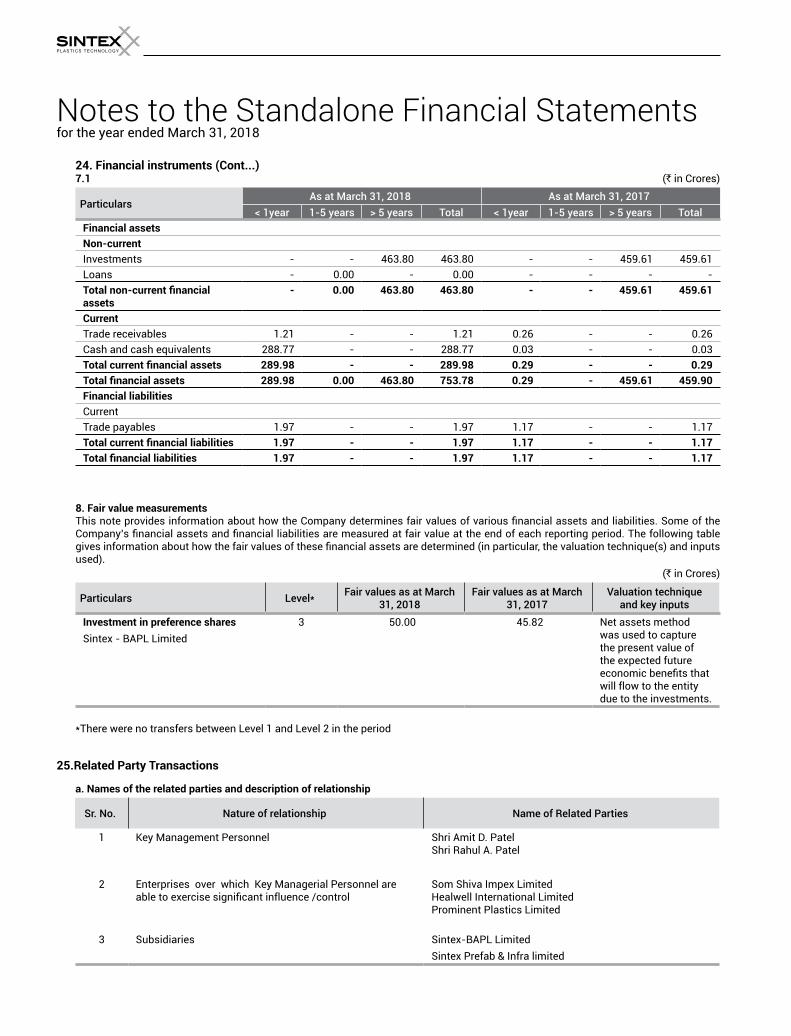
Notes to the Standalone Financial Statementsfor the year ended March 31, 2018
24. Financial instruments (Cont...) 7.1 (` in Crores)
ParticularsAs at March 31, 2018 As at March 31, 2017
< 1year 1-5 years > 5 years Total < 1year 1-5 years > 5 years Total
Financial assets
Non-current
Investments - - 463.80 463.80 - - 459.61 459.61 Loans - 0.00 - 0.00 - - - -
Total non-current financial assets
- 0.00 463.80 463.80 - - 459.61 459.61
Current
Trade receivables 1.21 - - 1.21 0.26 - - 0.26 Cash and cash equivalents 288.77 - - 288.77 0.03 - - 0.03 Total current financial assets 289.98 - - 289.98 0.29 - - 0.29
Total financial assets 289.98 0.00 463.80 753.78 0.29 - 459.61 459.90
Financial liabilities
Current
Trade payables 1.97 - - 1.97 1.17 - - 1.17 Total current financial liabilities 1.97 - - 1.97 1.17 - - 1.17
Total financial liabilities 1.97 - - 1.97 1.17 - - 1.17
8. Fair value measurements This note provides information about how the Company determines fair values of various financial assets and liabilities. Some of the
Company’s financial assets and financial liabilities are measured at fair value at the end of each reporting period. The following table gives information about how the fair values of these financial assets are determined (in particular, the valuation technique(s) and inputs used).
(` in Crores)
Particulars Level*Fair values as at March
31, 2018Fair values as at March
31, 2017Valuation technique
and key inputs
Investment in preference shares
Sintex - BAPL Limited3 50.00 45.82 Net assets method
was used to capture the present value of the expected future economic benefits that will flow to the entity due to the investments.
*There were no transfers between Level 1 and Level 2 in the period
25.Related Party Transactions
a. Names of the related parties and description of relationship
Sr. No. Nature of relationship Name of Related Parties
1 Key Management Personnel Shri Amit D. PatelShri Rahul A. Patel
2 Enterprises over which Key Managerial Personnel are able to exercise significant influence /control
Som Shiva Impex LimitedHealwell International LimitedProminent Plastics Limited
3 Subsidiaries Sintex-BAPL LimitedSintex Prefab & Infra limited
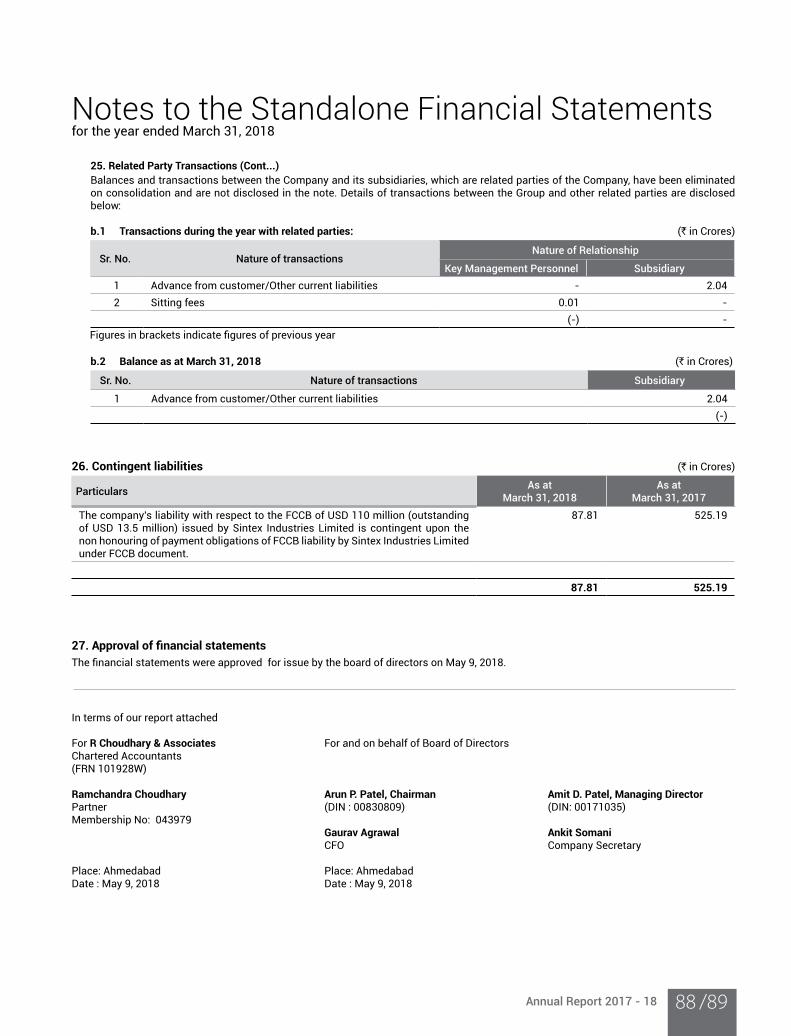
Annual Report 2017 - 18 /8988
Notes to the Standalone Financial Statementsfor the year ended March 31, 2018
25. Related Party Transactions (Cont...)
Balances and transactions between the Company and its subsidiaries, which are related parties of the Company, have been eliminated on consolidation and are not disclosed in the note. Details of transactions between the Group and other related parties are disclosed below:
b.1 Transactions during the year with related parties: (` in Crores)
Sr. No. Nature of transactionsNature of Relationship
Key Management Personnel Subsidiary
1 Advance from customer/Other current liabilities - 2.042 Sitting fees 0.01 -
(-) -
b.2 Balance as at March 31, 2018 (` in Crores)
Sr. No. Nature of transactions Subsidiary
1 Advance from customer/Other current liabilities 2.04 (-)
26. Contingent liabilities (` in Crores)
ParticularsAs at
March 31, 2018As at
March 31, 2017
The company's liability with respect to the FCCB of USD 110 million (outstanding of USD 13.5 million) issued by Sintex Industries Limited is contingent upon the non honouring of payment obligations of FCCB liability by Sintex Industries Limited under FCCB document.
87.81 525.19
87.81 525.19
27. Approval of financial statements The financial statements were approved for issue by the board of directors on May 9, 2018.
In terms of our report attached
For R Choudhary & Associates For and on behalf of Board of DirectorsChartered Accountants(FRN 101928W)
Ramchandra Choudhary Arun P. Patel, Chairman Amit D. Patel, Managing DirectorPartner (DIN : 00830809) (DIN: 00171035)Membership No: 043979 Gaurav Agrawal Ankit Somani CFO Company Secretary
Place: Ahmedabad Place: AhmedabadDate : May 9, 2018 Date : May 9, 2018
Figures in brackets indicate figures of previous year
Independent Auditor’s Report
TO THE MEMBERS OF SINTEX PLASTICS TECHNOLOGY LIMITED
Report on the Consolidated Ind AS Financial Statements
We have audited the accompanying consolidated Ind AS financial statements of SINTEX PLASTICS TECHNOLOGY LIMITED (hereinafter referred to as “the Parent”) and its subsidiaries (the Parent and its subsidiaries together referred to as “the Group”) comprising the Consolidated Balance Sheet as at March 31, 2018, the Consolidated Statement of Profit and Loss including other comprehensive income, the Consolidated Cash Flow Statement, the Consolidated Statement of Changes in Equity, for the year then ended, and a summary of the significant accounting policies and other explanatory information (hereinafter referred to as “the consolidated Ind AS financial statements”).
Management’s Responsibility for the Consolidated Ind AS Financial Statements
The Parent’s Board of Directors is responsible for the preparation of these consolidated financial statements in terms of the requirements of the Companies Act, 2013 (hereinafter referred to as “the Act”) that give a true and fair view of the consolidated financial position, consolidated financial performance including other comprehensive income, consolidated cash flows and consolidated statement of changes in equity of the Group in accordance with the Indian Accounting Standards (Ind AS) prescribed under section 133 of the Act read with the Companies (Indian Accounting Standards) Rules, 2015, as amended, and other accounting principles generally accepted in India.
The respective Board of Directors of the companies included in the Group are responsible for maintenance of adequate accounting records in accordance with the provisions of the Act for safeguarding the assets of the Group and for preventing and detecting frauds and other irregularities; the selection and application of appropriate accounting policies; making judgments and estimates that are reasonable and prudent; and the design, implementation and maintenance of adequate internal financial controls, that were operating effectively for ensuring the accuracy and completeness of the accounting records, relevant to the preparation and presentation of the consolidated financial statements that give a true and fair view and are free from material misstatement, whether due to fraud or error, which have been used for the purpose of preparation of the consolidated financial statements by the Directors of the Parent, as aforesaid.
Auditor’s Responsibility
Our responsibility is to express an opinion on these consolidated Ind AS financial statements based on our audit. In conducting our audit, we have taken into account the provisions of the Act, the accounting and auditing standards and matters which are required to be included in the audit report under the provisions of the Act and the Rules made thereunder.
We conducted our audit in accordance with the Standards on Auditing specified under Section 143(10) of the Act and other applicable authoritative pronouncement issued by the Institute of Chartered Accountants of India. Those Standards require that we comply with ethical requirements and plan and perform the audit to obtain reasonable assurance about whether the consolidated Ind AS financial statements are free from material misstatement.
An audit involves performing procedures to obtain audit evidence about the amounts and the disclosures in the consolidated Ind AS financial statements. The procedures selected depend on the auditor’s judgment, including the assessment of the risks of material misstatement of the consolidated Ind AS financial statements, whether due to fraud or error. In making those risk assessments, the auditor considers internal financial control relevant to the Parent’s preparation of the consolidated Ind AS financial statements that give a true and fair view in order to design audit procedures that are appropriate in the circumstances. An audit also includes evaluating the appropriateness of the accounting policies used and the reasonableness of the accounting estimates made by the Parent’s Board of Directors, as well as evaluating the overall presentation of the consolidated Ind AS financial statements.
We believe that the audit evidence obtained by us and other auditors in terms of their reports referred to in the Other Matters paragraph below, is sufficient and appropriate to provide a basis for our audit opinion on the consolidated Ind AS financial statements.
Opinion
In our opinion and to the best of our information and according to the explanations given to us and based on consideration of reports of other auditors on separate financial statements of the subsidiaries referred to below in the Other Matter paragraph, the aforesaid consolidated financial statements give the information required by the Act in the manner so required and give a true and fair view in conformity with the accounting principles generally accepted in India, of the consolidated state of affairs of the Group as at March 31, 2018, and their consolidated profit, consolidated total comprehensive income, their consolidated cash flows and consolidated statement of changes in equity for the year ended on that date.
Annual Report 2017 - 18 /9190
Other Matters
We did not audit the financial statements of a subsidiary Sintex-BAPL Limited and its step-down subsidiaries, whose financial statements reflect total assets of ` 6,213.99 crore as at March 31, 2018, total revenues of ` 3,818.01 crore, total net profit after tax of ` 80.36 crore, total comprehensive income of ` 80.19 crore and net cash inflows amounting to ` 265.12 crore for the year ended on that date, as considered in the consolidated Ind AS financial statements. These financial statements have been audited by other auditors whose reports have been furnished to us by the Management and our opinion on the consolidated Ind AS financial statements, in so far as it relates to the amounts and disclosures included in respect of these subsidiaries, is based solely on the reports of the other auditors.
Our opinion on the consolidated Ind AS financial statements above, and our report on Other Legal and Regulatory Requirements below, is not modified in respect of the above matters with respect to our reliance on the work done and the reports of other auditors.
Report on Other Legal and Regulatory Requirements
As required by Section 143(3) of the Act, based on our audit and on the consideration of the report of the auditors on financial statements of subsidiaries companies, referred in the Other Matters paragraph above we report, to the extent applicable, that:
(a) We have sought and obtained all the information and explanations which to the best of our knowledge and belief were necessary for the purposes of our audit of the aforesaid consolidated Ind AS financial statements.
(b) In our opinion, proper books of account as required by law relating to preparation of the aforesaid consolidated Ind AS financial statements have been kept so far as it appears from our examination of those books and the reports of the other auditors.
(c) The Consolidated Balance Sheet, the Consolidated Statement of Profit and Loss (including Other Comprehensive Income), the Consolidated Cash Flow Statement and Consolidated Statement of Changes in Equity dealt with by this Report are in agreement with the relevant books of account maintained for the purpose of preparation of the consolidated Ind AS financial statements.
(d) In our opinion, the aforesaid consolidated Ind AS financial statements comply with the Indian Accounting Standards prescribed under Section 133 of the Act.
(e) On the basis of the written representations received from the directors of the Parent as on March 31, 2018 taken on record by the Board of Directors of the Parent and the reports of the statutory auditors of its subsidiary companies incorporated in India, none of the directors of the Group companies incorporated in India is disqualified as on March 31, 2018 from being appointed as a director in terms of Section 164 (2) of the Act.
(f) With respect to the adequacy of the internal financial controls over financial reporting and the operating effectiveness of such controls, refer to our separate Report in “Annexure A”, which is based on the auditors’ reports of the Parent company and subsidiary companies incorporated in India. Our report expresses an unmodified opinion on the adequacy and operating effectiveness of the Parent’s/ subsidiary companies incorporated in India for internal financial controls over financial reporting.
(g) With respect to the other matters to be included in the Auditor’s Report in accordance with Rule 11 of the Companies (Audit and Auditor’s) Rules, 2014, as amended, in our opinion and to the best of our information and according to the explanations given to us:
i. There were no pending litigations which would impact the consolidated financial position of the Group.
ii. The Group did not have any material foreseeable losses on long-term contracts including derivative contracts.
iii. There were no amounts which were required to be transferred to the Investor Education and Protection Fund by the Parent and its subsidiary companies incorporated in India.
Place: Ahmedabad For, R Choudhary and Associates Date: May 9, 2018 Chartered Accountants (Firm Regn. No. 101928W)
Ramchandra Choudhary Partner
M. No. 043979
“Annexure-A” to the independent Auditor’s Report (Referred to in paragraph 1(f) under “Report on other legal and regulatory requirements” of our report of even date)
Report on the Internal Financial Controls under Clause (i) of Sub-section 3 of Section 143 of the Companies Act, 2013 (“the Act”)
We have audited the Internal Financial Control over financial reporting of SINTEX PLASTICS TECHNOLOGY LIMITED (“the Parent”) as of March 31, 2018 in conjunction with our audit of the consolidated financial statements of the Parent and its subsidiary companies incorporated in India as of that date.
Management Responsibility for the Internal Financial Controls
The respective Board of Directors of the Parent and its subsidiary companies which are companies incorporated in India , are responsible for establishing and maintaining internal financial controls based on the internal control over financial reporting criteria established by the Group considering the essential components of internal control stated in the Guidance Note on Audit of Internal Financial Controls over Financial Reporting issued by the Institute of Chartered Accountants of India (ICAI). These responsibilities include the design, implementation and maintenance of adequate internal financial controls that were operating effectively for ensuring the orderly and efficient conduct of its business, including adherence to the Group’s policies, the safeguarding of its assets, the prevention and detection of frauds and errors, the accuracy and completeness of the accounting records, and the timely preparation of reliable financial information, as required under the Act.
Auditor’s Responsibility
Our responsibility is to express an opinion on the Group’s internal financial controls over financial reporting based on our audit. We conducted our audit in accordance with the Guidance Note on Audit of Internal Financial Controls over Financial Reporting (the “Guidance Note”) and the Standards on Auditing, issued by ICAI and prescribed under Section 143(10) of the Act, to the extent applicable to an audit of internal financial controls, both applicable to an audit of Internal Financial Controls and, both issued by the ICAI. Those Standards and the Guidance Note require that we comply with ethical requirements and plan and perform the audit to obtain reasonable assurance about whether adequate internal financial controls over financial reporting was established and maintained and if such controls operated effectively in all material respects.
Our audit involves performing procedures to obtain audit evidence about the adequacy of the internal financial controls system over financial reporting and their operating effectiveness.
Our audit of internal financial controls over financial reporting included obtaining an understanding of internal financial controls over financial reporting, assessing the risk that a material weakness exists, and testing and evaluating the design and operating effectiveness of internal control based on the assessed risk. The procedures selected depend on the auditor’s judgment, including the assessment of the risks of material misstatement of the financial statements, whether due to fraud or error.
We believe that the audit evidence we have obtained is sufficient and appropriate to provide a basis for our audit opinion on the Group’s internal financial controls system over financial reporting.
Meaning of Internal Financial Controls over Financial Reporting
A company’s internal financial control over financial reporting is a process designed to provide reasonable assurance regarding the reliability of financial reporting and the preparation of financial statements for external purposes in accordance with generally accepted accounting principles. A company’s internal financial control over financial reporting includes those policies and procedures that (1) pertain to the maintenance of records that, in reasonable detail, accurately and fairly reflect the transactions and dispositions of the assets of the company; (2) provide reasonable assurance that transactions are recorded as necessary to permit preparation of financial statements in accordance with generally accepted accounting principles, and that receipts and expenditures of the company are being made only in accordance with authorizations of management and directors of the company; and (3) provide reasonable assurance regarding prevention or timely detection of unauthorized acquisition, use, or disposition of the company’s assets that could have a material effect on the financial statements.
Inherent Limitations of Internal Financial Controls over Financial Reporting
Because of the inherent limitations of internal financial controls over financial reporting, including the possibility of collusion or improper management override of controls, material misstatements due to error or fraud may occur and not be detected. Also, projections of any evaluation of the internal financial controls over financial reporting to future periods are subject to the risk that the internal financial control over financial reporting may become inadequate because of changes in conditions, or that the degree of compliance with the policies or procedures may deteriorate.
Opinion
In our opinion, the Parent Company and its subsidiary companies, which are incorporated in India, have in all material respects, an adequate internal financial controls system over financial reporting and such internal financial controls over financial reporting were operating effectively as at March 31, 2018, based on the internal control over financial reporting criteria established by the Group considering the essential components of internal control stated in the Guidance Note on Audit of Internal Financial Controls over Financial Reporting issued by the ICAI.
Annual Report 2017 - 18 /9392
Other Matters
Our report under Section 143(3)(i) of the Act on the adequacy and operating effectiveness of the internal financial controls over financial reporting insofar as it relates to 2 subsidiary companies, which are companies incorporated in India, is based on the corresponding reports of the other auditors of such subsidiaries.
Place: Ahmedabad For, R Choudhary and Associates Date: May 9, 2018 Chartered Accountants (Firm Regn. No. 101928W)
Ramchandra Choudhary Partner
M. No. 043979
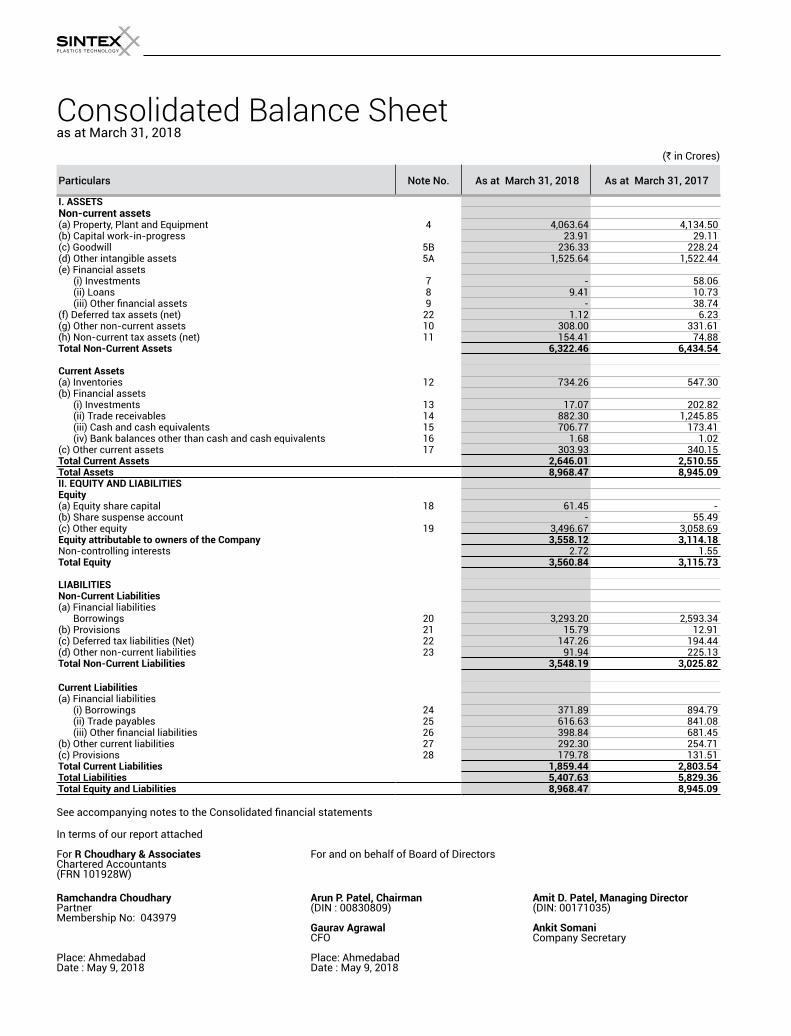
Consolidated Balance Sheet as at March 31, 2018
(` in Crores)
Particulars Note No. As at March 31, 2018 As at March 31, 2017
I. ASSETSNon-current assets(a) Property, Plant and Equipment 4 4,063.64 4,134.50 (b) Capital work-in-progress 23.91 29.11 (c) Goodwill 5B 236.33 228.24 (d) Other intangible assets 5A 1,525.64 1,522.44 (e) Financial assets (i) Investments 7 - 58.06 (ii) Loans 8 9.41 10.73 (iii) Other financial assets 9 - 38.74 (f) Deferred tax assets (net) 22 1.12 6.23 (g) Other non-current assets 10 308.00 331.61 (h) Non-current tax assets (net) 11 154.41 74.88 Total Non-Current Assets 6,322.46 6,434.54
Current Assets(a) Inventories 12 734.26 547.30 (b) Financial assets (i) Investments 13 17.07 202.82 (ii) Trade receivables 14 882.30 1,245.85 (iii) Cash and cash equivalents 15 706.77 173.41 (iv) Bank balances other than cash and cash equivalents 16 1.68 1.02 (c) Other current assets 17 303.93 340.15 Total Current Assets 2,646.01 2,510.55 Total Assets 8,968.47 8,945.09 II. EQUITY AND LIABILITIESEquity(a) Equity share capital 18 61.45 - (b) Share suspense account - 55.49 (c) Other equity 19 3,496.67 3,058.69 Equity attributable to owners of the Company 3,558.12 3,114.18 Non-controlling interests 2.72 1.55 Total Equity 3,560.84 3,115.73
LIABILITIESNon-Current Liabilities(a) Financial liabilities Borrowings 20 3,293.20 2,593.34 (b) Provisions 21 15.79 12.91 (c) Deferred tax liabilities (Net) 22 147.26 194.44 (d) Other non-current liabilities 23 91.94 225.13 Total Non-Current Liabilities 3,548.19 3,025.82
Current Liabilities(a) Financial liabilities (i) Borrowings 24 371.89 894.79 (ii) Trade payables 25 616.63 841.08 (iii) Other financial liabilities 26 398.84 681.45 (b) Other current liabilities 27 292.30 254.71 (c) Provisions 28 179.78 131.51 Total Current Liabilities 1,859.44 2,803.54 Total Liabilities 5,407.63 5,829.36 Total Equity and Liabilities 8,968.47 8,945.09
See accompanying notes to the Consolidated financial statements In terms of our report attached
For R Choudhary & Associates For and on behalf of Board of DirectorsChartered Accountants(FRN 101928W)
Ramchandra Choudhary Arun P. Patel, Chairman Amit D. Patel, Managing DirectorPartner (DIN : 00830809) (DIN: 00171035)Membership No: 043979 Gaurav Agrawal Ankit Somani CFO Company Secretary
Place: Ahmedabad Place: Ahmedabad Date : May 9, 2018 Date : May 9, 2018
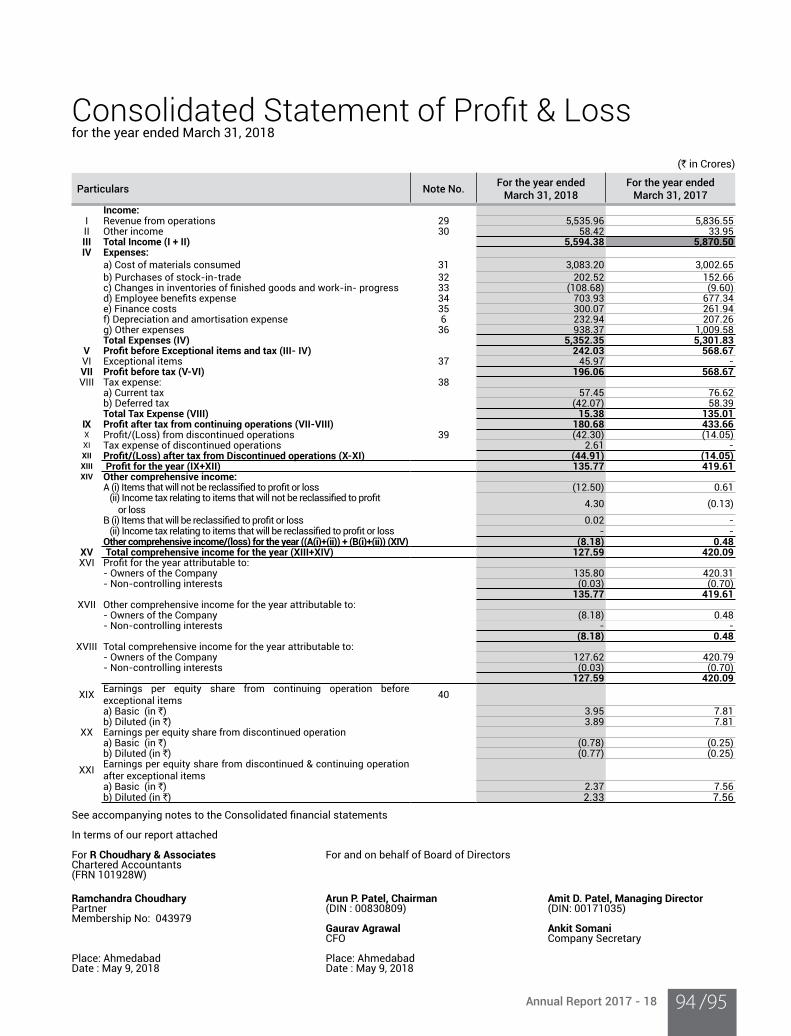
Annual Report 2017 - 18 /9594
Consolidated Statement of Profit & Loss for the year ended March 31, 2018
(` in Crores)
Particulars Note No.For the year ended
March 31, 2018For the year ended
March 31, 2017
Income:I Revenue from operations 29 5,535.96 5,836.55 II Other income 30 58.42 33.95 III Total Income (I + II) 5,594.38 5,870.50 IV Expenses:
a) Cost of materials consumed 31 3,083.20 3,002.65 b) Purchases of stock-in-trade 32 202.52 152.66 c) Changes in inventories of finished goods and work-in- progress 33 (108.68) (9.60)d) Employee benefits expense 34 703.93 677.34 e) Finance costs 35 300.07 261.94 f) Depreciation and amortisation expense 6 232.94 207.26 g) Other expenses 36 938.37 1,009.58 Total Expenses (IV) 5,352.35 5,301.83
V Profit before Exceptional items and tax (III- IV) 242.03 568.67 VI Exceptional items 37 45.97 - VII Profit before tax (V-VI) 196.06 568.67 VIII Tax expense: 38
a) Current tax 57.45 76.62 b) Deferred tax (42.07) 58.39 Total Tax Expense (VIII) 15.38 135.01
IX Profit after tax from continuing operations (VII-VIII) 180.68 433.66 X Profit/(Loss) from discontinued operations 39 (42.30) (14.05)XI Tax expense of discontinued operations 2.61 - XII Profit/(Loss) after tax from Discontinued operations (X-XI) (44.91) (14.05)XIII Profit for the year (IX+XII) 135.77 419.61 XIV Other comprehensive income:
A (i) Items that will not be reclassified to profit or loss (12.50) 0.61 (ii) Income tax relating to items that will not be reclassified to profit or loss
4.30 (0.13)B (i) Items that will be reclassified to profit or loss 0.02 - (ii) Income tax relating to items that will be reclassified to profit or loss - - Other comprehensive income/(loss) for the year ((A(i)+(ii)) + (B(i)+(ii)) (XIV) (8.18) 0.48
XV Total comprehensive income for the year (XIII+XIV) 127.59 420.09 XVI Profit for the year attributable to:
- Owners of the Company 135.80 420.31 - Non-controlling interests (0.03) (0.70)
135.77 419.61 XVII Other comprehensive income for the year attributable to:
- Owners of the Company (8.18) 0.48 - Non-controlling interests - -
(8.18) 0.48 XVIII Total comprehensive income for the year attributable to:
- Owners of the Company 127.62 420.79 - Non-controlling interests (0.03) (0.70)
127.59 420.09
XIXEarnings per equity share from continuing operation before exceptional items
40
a) Basic (in `) 3.95 7.81 b) Diluted (in `) 3.89 7.81
XX Earnings per equity share from discontinued operationa) Basic (in `) (0.78) (0.25)b) Diluted (in `) (0.77) (0.25)
XXIEarnings per equity share from discontinued & continuing operation after exceptional itemsa) Basic (in `) 2.37 7.56 b) Diluted (in `) 2.33 7.56
See accompanying notes to the Consolidated financial statements In terms of our report attached
For R Choudhary & Associates For and on behalf of Board of DirectorsChartered Accountants(FRN 101928W)
Ramchandra Choudhary Arun P. Patel, Chairman Amit D. Patel, Managing DirectorPartner (DIN : 00830809) (DIN: 00171035)Membership No: 043979 Gaurav Agrawal Ankit Somani CFO Company Secretary
Place: Ahmedabad Place: Ahmedabad Date : May 9, 2018 Date : May 9, 2018
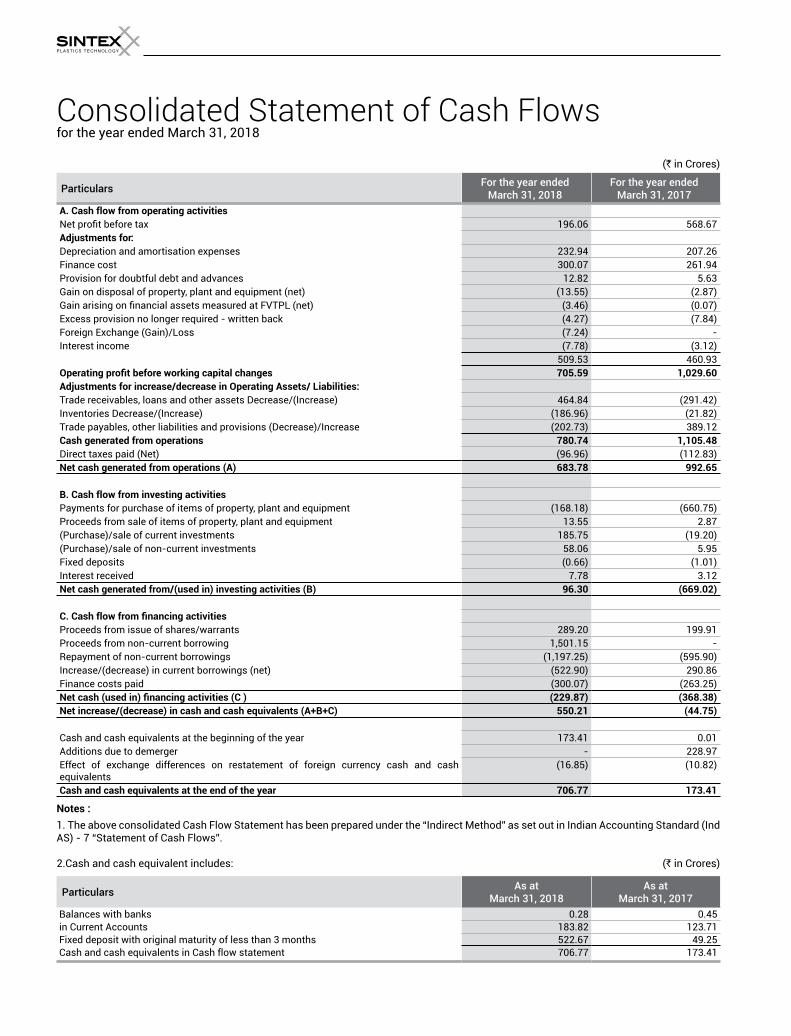
Consolidated Statement of Cash Flowsfor the year ended March 31, 2018
(` in Crores)
ParticularsFor the year ended
March 31, 2018For the year ended
March 31, 2017
A. Cash flow from operating activities
Net profit before tax 196.06 568.67 Adjustments for:
Depreciation and amortisation expenses 232.94 207.26 Finance cost 300.07 261.94 Provision for doubtful debt and advances 12.82 5.63 Gain on disposal of property, plant and equipment (net) (13.55) (2.87)Gain arising on financial assets measured at FVTPL (net) (3.46) (0.07)Excess provision no longer required - written back (4.27) (7.84)Foreign Exchange (Gain)/Loss (7.24) - Interest income (7.78) (3.12)
509.53 460.93 Operating profit before working capital changes 705.59 1,029.60
Adjustments for increase/decrease in Operating Assets/ Liabilities:Trade receivables, loans and other assets Decrease/(Increase) 464.84 (291.42)Inventories Decrease/(Increase) (186.96) (21.82)Trade payables, other liabilities and provisions (Decrease)/Increase (202.73) 389.12 Cash generated from operations 780.74 1,105.48
Direct taxes paid (Net) (96.96) (112.83)Net cash generated from operations (A) 683.78 992.65
B. Cash flow from investing activities
Payments for purchase of items of property, plant and equipment (168.18) (660.75)Proceeds from sale of items of property, plant and equipment 13.55 2.87 (Purchase)/sale of current investments 185.75 (19.20)(Purchase)/sale of non-current investments 58.06 5.95 Fixed deposits (0.66) (1.01)Interest received 7.78 3.12 Net cash generated from/(used in) investing activities (B) 96.30 (669.02)
C. Cash flow from financing activitiesProceeds from issue of shares/warrants 289.20 199.91 Proceeds from non-current borrowing 1,501.15 - Repayment of non-current borrowings (1,197.25) (595.90)Increase/(decrease) in current borrowings (net) (522.90) 290.86 Finance costs paid (300.07) (263.25)Net cash (used in) financing activities (C ) (229.87) (368.38)
Net increase/(decrease) in cash and cash equivalents (A+B+C) 550.21 (44.75)
Cash and cash equivalents at the beginning of the year 173.41 0.01 Additions due to demerger - 228.97 Effect of exchange differences on restatement of foreign currency cash and cash equivalents
(16.85) (10.82)
Cash and cash equivalents at the end of the year 706.77 173.41
Notes :
1. The above consolidated Cash Flow Statement has been prepared under the “Indirect Method” as set out in Indian Accounting Standard (Ind AS) - 7 “Statement of Cash Flows”.
2.Cash and cash equivalent includes: (` in Crores)
ParticularsAs at
March 31, 2018As at
March 31, 2017
Balances with banks 0.28 0.45 in Current Accounts 183.82 123.71 Fixed deposit with original maturity of less than 3 months 522.67 49.25 Cash and cash equivalents in Cash flow statement 706.77 173.41
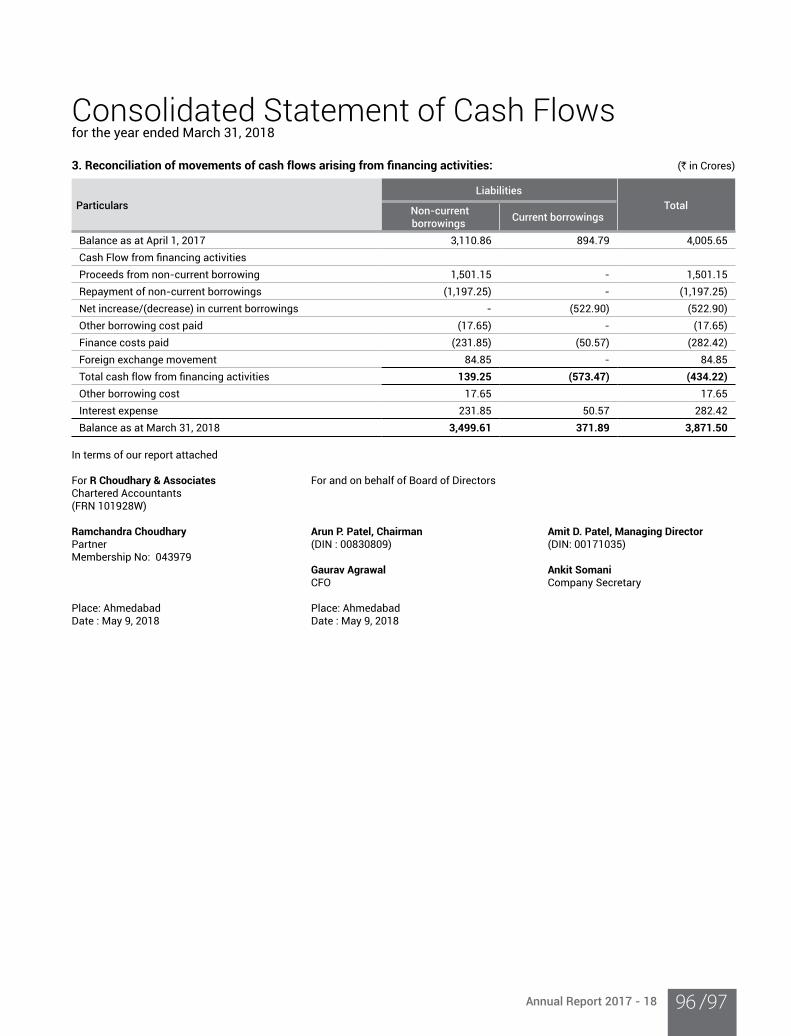
Annual Report 2017 - 18 /9796
3. Reconciliation of movements of cash flows arising from financing activities: (` in Crores)
Particulars
Liabilities
Total Non-current borrowings
Current borrowings
Balance as at April 1, 2017 3,110.86 894.79 4,005.65 Cash Flow from financing activitiesProceeds from non-current borrowing 1,501.15 - 1,501.15 Repayment of non-current borrowings (1,197.25) - (1,197.25)Net increase/(decrease) in current borrowings - (522.90) (522.90)Other borrowing cost paid (17.65) - (17.65)Finance costs paid (231.85) (50.57) (282.42)Foreign exchange movement 84.85 - 84.85 Total cash flow from financing activities 139.25 (573.47) (434.22)
Other borrowing cost 17.65 17.65 Interest expense 231.85 50.57 282.42 Balance as at March 31, 2018 3,499.61 371.89 3,871.50
In terms of our report attached
For R Choudhary & Associates For and on behalf of Board of DirectorsChartered Accountants(FRN 101928W) Ramchandra Choudhary Arun P. Patel, Chairman Amit D. Patel, Managing DirectorPartner (DIN : 00830809) (DIN: 00171035)Membership No: 043979 Gaurav Agrawal Ankit Somani CFO Company Secretary
Place: Ahmedabad Place: Ahmedabad Date : May 9, 2018 Date : May 9, 2018
Consolidated Statement of Cash Flowsfor the year ended March 31, 2018
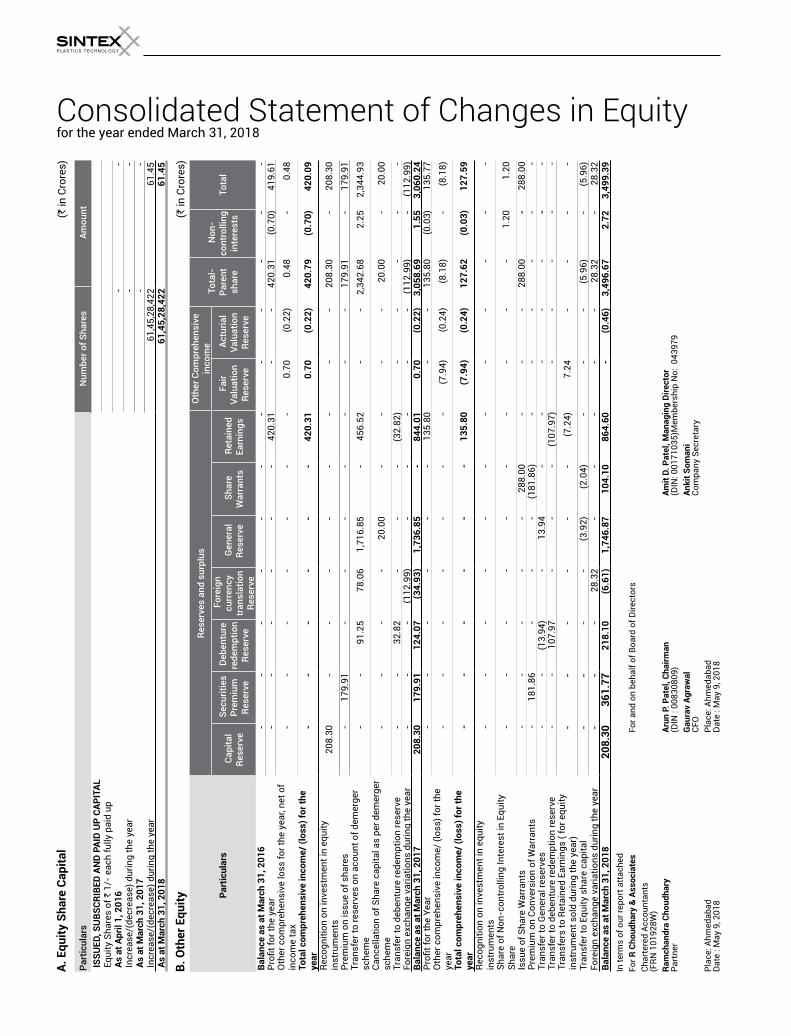
Consolidated Statement of Changes in Equityfor the year ended March 31, 2018
A.
Eq
uit
y S
ha
re C
ap
ita
l
(` in
Cro
res)
Pa
rtic
ula
rs N
um
ber
of
Sh
are
s A
mo
un
t
IS
SU
ED
, SU
BS
CR
IBE
D A
ND
PA
ID U
P C
AP
ITA
L
Equ
ity S
hare
s of
` 1
/- e
ach
fully
pai
d up
A
s a
t A
pri
l 1, 2
01
6
-
-
Incr
ease
/(de
crea
se) d
urin
g th
e ye
ar
-
-
As
at
Ma
rch
31
, 20
17
-
-
In
crea
se/(
decr
ease
) dur
ing
the
year
6
1,45
,28,
422
61.
45
As
at
Ma
rch
31
, 20
18
6
1,4
5,2
8,4
22
6
1.4
5
B.
Oth
er
Eq
uit
y (`
in C
rore
s)
Pa
rtic
ula
rs
Res
erve
s a
nd
su
rplu
sO
ther
Co
mp
reh
ensi
ve
inco
me
To
tal-
P
are
nt
sha
re
No
n-
con
tro
llin
g
inte
rest
s T
ota
l C
ap
ita
l R
eser
ve
Sec
uri
ties
P
rem
ium
R
eser
ve
Deb
entu
re
red
emp
tio
n
Res
erve
Fo
reig
n
curr
ency
tr
an
sla
tio
n
Res
erve
Gen
era
l R
eser
ve
Sh
are
W
arr
an
ts
Ret
ain
ed
Ea
rnin
gs
Fa
ir
Va
lua
tio
n
Res
erve
Act
uri
al
Va
lua
tio
n
Res
erve
Ba
lan
ce a
s a
t M
arc
h 3
1, 2
01
6 -
-
-
-
-
-
-
-
-
-
-
-
Pr
ofit f
or th
e ye
ar -
-
-
-
-
-
4
20.3
1 -
-
4
20.3
1 (0
.70)
419
.61
Oth
er c
ompr
ehen
sive
loss
for t
he y
ear,
net o
f in
com
e ta
x -
-
-
-
-
-
-
0
.70
(0.2
2) 0
.48
-
0.4
8
Tota
l com
preh
ensi
ve in
com
e/ (l
oss)
for t
he
yea
r -
-
-
-
-
-
4
20
.31
0
.70
(
0.2
2)
42
0.7
9
(0
.70
) 4
20
.09
Reco
gniti
on o
n in
vest
men
t in
equi
ty
inst
rum
ents
208
.30
-
-
-
-
-
-
-
-
208
.30
-
208
.30
Prem
ium
on
issu
e of
sha
res
-
179
.91
-
-
-
-
-
-
-
179
.91
-
179
.91
Tran
sfer
to re
serv
es o
n ac
ount
of d
emer
ger
sch
eme
-
-
91.
25
78.
06
1,7
16.8
5 -
4
56.5
2 -
-
2
,342
.68
2.2
5 2
,344
.93
Canc
ella
tion
of S
hare
cap
ital a
s pe
r dem
erge
r sc
hem
e -
-
-
-
2
0.00
-
-
-
-
2
0.00
-
2
0.00
Tran
sfer
to d
eben
ture
rede
mpt
ion
rese
rve
-
-
32.
82
-
-
-
(32.
82)
-
-
-
-
-
Fore
ign
exch
ange
var
iatio
ns d
urin
g th
e ye
ar -
-
-
(1
12.9
9) -
-
-
-
-
(1
12.9
9) -
(1
12.9
9)B
ala
nce
as
at
Ma
rch
31
, 20
17
20
8.3
0
17
9.9
1
12
4.0
7
(3
4.9
3)
1,7
36
.85
-
8
44
.01
0
.70
(
0.2
2)
3,0
58
.69
1
.55
3
,06
0.2
4
Profi
t for
the
Year
-
-
-
-
-
-
135
.80
-
-
135
.80
(0.0
3) 1
35.7
7 O
ther
com
preh
ensi
ve in
com
e/ (l
oss)
for t
he
yea
r -
-
-
-
-
-
-
(7
.94)
(0.2
4) (8
.18)
- (8
.18)
Tota
l com
preh
ensi
ve in
com
e/ (l
oss)
for t
he
yea
r -
-
-
-
-
-
1
35
.80
(
7.9
4)
(0
.24
) 1
27
.62
(
0.0
3)
12
7.5
9
Reco
gniti
on o
n in
vest
men
t in
equi
ty
inst
rum
ents
-
-
-
-
-
-
-
-
-
-
-
-
Shar
e of
Non
-con
trol
ling
Inte
rest
in E
quity
S
ha
re -
-
-
-
-
-
-
-
-
-
1
.20
1.2
0
Issu
e of
Sha
re W
arra
nts
-
-
-
-
-
288
.00
-
-
-
288
.00
- 2
88.0
0 Pr
emiu
m o
n Co
nver
sion
of W
arra
nts
-
181
.86
-
-
-
(181
.86)
-
-
-
-
-
-
Tran
sfer
to G
ener
al re
serv
es
-
-
(13.
94)
-
13.
94
-
-
-
-
-
- -
Tr
ansf
er to
deb
entu
re re
dem
ptio
n re
serv
e -
-
1
07.9
7 -
-
-
(1
07.9
7) -
-
-
-
-
Tr
ansf
ers
to R
etai
ned
Earn
ings
( fo
r equ
ity
inst
rum
ent s
old
durin
g th
e ye
ar)
-
-
-
-
-
-
(7.2
4) 7
.24
-
-
-
-
Tran
sfer
to E
quity
sha
re c
apita
l -
-
-
-
(3
.92)
(2.0
4) -
-
-
(5
.96)
-
(5.9
6)Fo
reig
n ex
chan
ge v
aria
tions
dur
ing
the
year
-
-
-
28.
32
-
-
-
-
-
28.
32
-
28.
32
Ba
lan
ce a
s a
t M
arc
h 3
1, 2
01
8 2
08
.30
3
61
.77
2
18
.10
(
6.6
1)
1,7
46
.87
1
04
.10
8
64
.60
-
(
0.4
6)
3,4
96
.67
2
.72
3
,49
9.3
9
In te
rms
of o
ur re
port
att
ache
d Fo
r R C
ho
ud
ha
ry &
Ass
oci
ate
s Fo
r and
on
beha
lf of
Boa
rd o
f Dire
ctor
sCh
arte
red
Acco
unta
nts
(FRN
101
928W
) R
am
cha
nd
ra C
ho
ud
ha
ry
Aru
n P
. P
ate
l, C
ha
irm
an
Am
it D
. P
ate
l, M
an
ag
ing
Dir
ect
or
Part
ner
(DIN
: 00
8308
09)
(D
IN: 0
0171
035)
Mem
bers
hip
No:
043
979
G
au
rav
Ag
raw
al
A
nk
it S
om
an
i
CFO
Com
pany
Sec
reta
ryPl
ace:
Ahm
edab
ad
Plac
e: A
hmed
abad
D
ate
: May
9, 2
018
Dat
e : M
ay 9
, 201
8
Annual Report 2017 - 18 /9998
Notes to the Consolidated Financial Statementsfor the year ended March 31, 2018
1. General Information Sintex Plastics Technology Limited (“the Company”) is a holding Company of entities engaged in the manufacturing of custom moulding
and prefab products in India, USA and Europe. The registered office of the Company is in the premises of Sintex-BAPL Limited, near seven garnala, Kalol (North Gujarat) and the headquarters of the Company is situated in Kalol (Gujarat).
The consolidated financial statements comprise financial statements of the company and its subsidiaries (collectively, the Group) for the year ended March 31, 2018. The consolidated financial statements were authorized for issue in accordance with a resolution of the directors on May 9, 2018.
The principal activities of the Company and its subsidiaries (hereafter referred to as “the Group”) are described in note 45.
2. Significant Accounting policies
I. Statement of compliance
The consolidated financial statements have been prepared in accordance with the Indian Accounting Standards (referred to as “Ind AS”) as prescribed under Section 133 of the Companies Act, 2013 read with Companies (Indian Accounting Standards) Rules as amended from time to time.
II. Basis of preparation and presentation
The consolidated financial statements have been prepared on the historical cost basis except for certain financial instruments that are measured at fair values at the end of each reporting period, as explained in the accounting policies below.
Historical cost is generally based on the fair value of the consideration given in exchange for goods and services.
Fair value is the price that would be received to sell an asset or paid to transfer a liability in an orderly transaction between market participants at the measurement date, regardless of whether that price is directly observable or estimated using another valuation technique. In estimating the fair value of an asset or a liability, the group takes in to account the characteristics of the asset or liability if market participants would take those characteristics into account when pricing the asset or liability at the measurement date.
In addition, for financial reporting purposes, fair value measurements are categorized into level 1, 2, or 3 based on the degree to which the inputs to the fair value measurements are observable and the significance of the inputs to the fair value measurements in its entirety, which are described as follows:
• Level 1 inputs are quoted prices (unadjusted) in active markets for identical assets or liabilities that the entity can access at the measurement date;
• Level 2 inputs are inputs, that are quoted prices included within level 1, that are observable for the asset or liability, either directly or indirectly; and
• Level 3 inputs are unobservable inputs for the asset or liability.
III. Basis of consolidation
The consolidated financial statements incorporate the financial statements of the Company and entities (including special purpose entities) controlled by the Company and its subsidiaries. Control is achieved where the Company:
• has power over the investee
• is exposed to, or has rights, to variable returns from its involvement with the investee; and
• has the ability to use its power to affect its returns
The Company reassess whether or not it controls an investee if facts and circumstances indicate that there are changes to one or more of the three elements of control listed above.
When the Company has less than majority of the voting rights of an investee, it has power over the investee when the voting rights are sufficient to give it the practical ability to direct the relevant activities of the investee unilaterally. The Company considers all relevant facts and circumstances in assessing whether or not the Company’s voting rights in an entity are sufficient to give it power.
Consolidation of a subsidiary begins when the Company obtains control over the subsidiary and ceases when the Company loses control of the subsidiary. Specifically, income and expenses of a subsidiary acquired or disposed of during the year are included in the consolidated statement of profit or loss and other comprehensive income from the date the Company gains control until the date when the Company ceases to control the subsidiary.
Notes to the Consolidated Financial Statementsfor the year ended March 31, 2018
Profit or loss and each component of other comprehensive income are attributed to the owners of the Company and to the non-controlling interests. Total comprehensive income of subsidiaries is attributed to the owners of the Company and to the non-controlling interests even if this results in the non-controlling interests having a deficit balance.
When necessary, adjustments are made to the financial statements of subsidiaries to bring their accounting policies in line with the Group’s accounting policies.
All intragroup assets and liabilities, equity, income, expenses and cash flows relating to transactions between members of the Group are eliminated in full on consolidation.
IV. Business Combinations
Acquisitions of businesses are accounted for using the acquisition method. The consideration transferred in a business combination is measured at fair value, which is calculated as the sum of the acquisition-date fair values of the assets transferred by the Group, liabilities incurred by the Group to the former owners of the acquiree and the equity interests issued by the Group in exchange for control of the acquiree. Acquisition-related costs are generally recognised in Statement of Profit and Loss as incurred.
At the acquisition date, the identifiable assets acquired and the liabilities assumed are recognised at their fair value at the acquisition date, except that:
• deferred tax assets or liabilities and liabilities or assets related to employee benefit arrangements are recognised and measured in accordance with Ind AS 12 Income Taxes and Ind AS 19 Employee Benefits respectively;
• liabilities or equity instruments related to share-based payment arrangements of the acquiree or share-based payment arrangements of the Group entered into to replace share-based payment arrangements of the acquiree are measured in accordance with Ind AS 102 Share-based Payments at the acquisition date; and
• assets (or disposal groups) that are classified as held for sale in accordance with Ind AS 105 Non-current Assets Held for Sale and Discontinued Operations are measured in accordance with that Standard.
Goodwill is measured as the excess of the sum of the consideration transferred, the amount of any non-controlling interests in the
acquiree, and the fair value of the acquirer’s previously held equity interest in the acquiree (if any) over the net of the acquisition-date amounts of the identifiable assets acquired and the liabilities assumed. If, after reassessment, the net of the acquisition-date amounts of the identifiable assets acquired and liabilities assumed exceeds the sum of the consideration transferred, the amount of any non-controlling interests in the acquiree and the fair value of the acquirer’s previously held interest in the acquiree (if any), the excess is recognised in other comprehensive income and accumulated in equity as capital reserve or recognised directly in capital reserve depending on whether there exists clear evidence of the underlying reasons for classifying the business combination as a bargain purchase.
Common control business combinations include transactions, such as transfer of subsidiaries or businesses, between entities with a Group.
Business combinations involving entities or business under common control are accounted using the pooling of interests method. In this method the assets and liabilities of combining entities are reflected at their carrying values, the only adjustment to be made is to harmonise accounting policies. The financial information in the financial statements in respect of prior periods are restated as if the business combination had occurred from the beginning of the preceding period in the financial statements, irrespective of the actual date of combination. However, if the business combination has been effected after that date, the prior period information is restated only from that date.
The difference, if any, between the amount recorded as share capital issued plus any additional consideration in the form of cash or other assets and the amount of share capital of the transferor is transferred to reserves.
V. Goodwill
Goodwill arising on an acquisition of a business is carried at cost as established at the date of acquisition of the business less accumulated impairment losses, if any.
For the purposes of impairment testing, goodwill is allocated to each of the Group’s cash-generating units (or groups of cash-generating units) that is expected to benefit from the synergies of the combination.
A cash-generating unit to which goodwill has been allocated is tested for impairment annually, or more frequently when there is indication that the unit may be impaired. If the recoverable amount of the cash-generating unit is less than its carrying amount, the impairment loss is allocated first to reduce the carrying amount of any goodwill allocated to the unit and then to the other assets of the unit pro rata based on the carrying amount of each asset in the unit. Any impairment loss for goodwill is recognised directly in profit or loss in the consolidated [Statement of comprehensive income/Statement of Profit and Loss]. An impairment loss recognised for goodwill is not reversed in subsequent periods.
Annual Report 2017 - 18 /101100
Notes to the Consolidated Financial Statementsfor the year ended March 31, 2018
On disposal of the relevant cash-generating unit, the attributable amount of goodwill is included in the determination of the profit or loss on disposal.
The Group’s policy for goodwill arising on the acquisition of an associate and a joint venture is described at note IV.
VI. Revenue recognition
Revenue is measured at the fair value of the consideration received or receivable. Revenue is reduced for the estimated customer returns, rebates and other similar allowances.
Sale of goods Revenue from the sale of goods is recognised when the goods are delivered and titles have passed, at which time all the following
conditions are satisfied:
• the Group has transferred to the buyer the significant risks and rewards of ownership of the goods;
• the Group retains neither continuing managerial involvement to the degree usually associated with ownership nor effective control over the goods sold;
• the amount of revenue can be measured reliably;
• it is probable that the economic benefits associated with the transaction will flow to the Group; and
• costs incurred or to be incurred in respect of the transaction can be measured reliably.
The Group recognizes revenues on sale of products, net of discounts, sales incentives, rebates granted, returns, sales taxes and duties when the products are delivered to customer or when delivered to a carrier for export sale, which is when title and risk and rewards of ownership pass to the customer. Sale of products is presented gross of manufacturing taxes like excise duty wherever applicable.
Export sales includes export benefits received as per the Import and Export Policy in respect of exports made under the said schemes as notified by government and recognised when there is reasonable assurance that the entity will comply with the conditions attached to them and that the benefit is received.
The Group provides warranty (refer to accounting policy on provisions) on certain products based on customer requirements for which liability is recognised at the time the product is sold.
Sale of services Income from service rendered is recognised on accrual basis based on the terms of agreements and when services are rendered.
Dividend and interest income Dividend income from investments is recognised when the shareholder’s right to receive payment has been established (provided that it
is probable that the economic benefits will flow to the Group and the amount of income can be measured reliably).
Interest income from a financial asset is recognised when it is probable that the economic benefits will flow to the Group and the amount of income can be measured reliably. Interest income is accrued on a time basis, by reference to the principal outstanding and at the effective interest rate applicable, which is the rate that exactly discounts estimated future cash receipts through the expected life of the financial asset to that asset’s net carrying amount on initial recognition.
VII. Leasing
Leases are classified as finance leases whenever the terms of the lease transfer substantially all the risks and rewards of ownership to the lessee. All other leases are classified as operating leases.
The Group as a lessor Amount due from the lessees under finance leases are recognised as receivables at the amount of the Group’s net investment in the
leases. Finance lease income is allocated to the accounting periods so as to reflect a constant periodic rate of return on the Group’s net investment outstanding in respect of the leases.
Rental income from operating leases is recognised on straight-line basis over the term of the relevant lease. Initial direct cost incurred in negotiating and arranging an operating lease are added to the carrying amount of the leased asset and recognised on straight-line basis over the lease term.
The Group as a lessee Assets held under finance leases are initially recognised as assets of the Group at their fair value at the inception of the lease or, if lower,
at the present value of the minimum lease payments. The corresponding liability to the lessor is included in the consolidated balance sheet as a finance lease obligation.
Notes to the Consolidated Financial Statementsfor the year ended March 31, 2018
Lease payments are apportioned between finance expenses and reduction of the lease obligation so as to achieve a constant rate of interest on the remaining balance of the liability. Finance expenses are recognised immediately in Statement of Profit and Loss, unless they are directly attributable to qualifying assets, in which case they are capitalised in accordance with the Group’s general policy on borrowing costs. Contingent rentals are recognised as expenses in the periods in which they are incurred.
Lease payments under an operating lease shall be recognised as an expense on a straight-line basis over the lease term unless either:
a. another systematic basis is more representative of the time pattern of the user’s benefit even if the payments to the lessors are not on that basis; or
b. the payments to the lessor are structured to increase in line with expected general inflation to compensate for the lessor’s expected inflationary cost increases. If payments to the lessor vary because of factors other than general inflation, then this condition is not met.
VIII. Foreign currency translations
The functional currency of the Company and its subsidiaries has been determined on the basis of the primary economic environment in which it operates. The functional currency of the Company is INR.
In preparing the financial statements of each individual group entity, transactions in currencies other than the entity’s functional currency (foreign currencies) are recognised at the rates of exchange prevailing at the dates of the transactions. At the end of each reporting period, monetary items denominated in foreign currencies are retranslated at the rates prevailing at that date. Non-monetary items carried at fair value that are denominated in foreign currencies are retranslated at the rates prevailing at the date when the fair value was determined. Non-monetary items that are measured in terms of historical cost in a foreign currency are not retranslated.
Exchange differences on monetary items are recognised in statement of Profit and Loss in the period in which arise except for:
• exchange differences on foreign currency borrowings relating to assets under construction for future productive use, which are included in the cost of those assets when they are regarded as an adjustment to interest costs on those foreign currency borrowings;
• exchange differences on monetary items receivable from or payable to a foreign operation for which settlement is neither planned nor likely to occur (therefore forming part of the net investment in the foreign operation), which are recognised initially in other comprehensive income and reclassified from equity to Statement of Profit and Loss on repayment of the monetary items.
For the purposes of presenting these consolidated financial statements, the assets and liabilities of the Group’s foreign operations are translated into Currency Units using exchange rates prevailing at the end of each reporting period. Income and expense items are translated at the average exchange rates for the period, unless exchange rates fluctuate significantly during that period, in which case the exchange rates at the dates of the transactions are used. Exchange differences arising, if any, are recognised in other comprehensive income and accumulated in equity (and attributed to non-controlling interests as appropriate).
On the disposal of a foreign operation (i.e. a disposal of the Group’s entire interest in a foreign operation, a disposal involving loss of control over a subsidiary that includes a foreign operation, or a partial disposal of an interest in a joint arrangement or an associate that includes a foreign operation of which the retained interest becomes a financial asset), all of the exchange differences accumulated in equity in respect of that operation attributable to the owners of the Company are reclassified to profit or loss.
In addition, in relation to a partial disposal of a subsidiary that includes a foreign operation that does not result in the Group losing control over the subsidiary, the proportionate share of accumulated exchange differences are re-attributed to non-controlling interests and are not recognised in profit or loss. For all other partial disposals (i.e. partial disposals of associates or joint arrangements that do not result in the Group losing significant influence or joint control), the proportionate share of the accumulated exchange differences is reclassified to profit or loss.
IX. Borrowing costs
Borrowing costs directly attributable to the acquisition, construction or production of qualifying assets, which are assets that necessarily take a substantial period of time to get ready for their intended use or sale, are added to the cost of those assets, until such time as the assets are substantially ready for their intended use or sale.
All other borrowing costs are recognised in the Statement of Profit and Loss in the period in which they are incurred.
X. Employee Benefits
Retirement benefit costs and termination benefits Payments to defined contribution retirement benefit plans are recognised as an expense when employees have rendered service entitling
them to the contributions. For defined benefit retirement benefit plans, the cost of providing benefits is determined using the projected unit credit method, with actuarial valuations being carried out at the end of each annual reporting period. Remeasurement, comprising
Annual Report 2017 - 18 /103102
Notes to the Consolidated Financial Statementsfor the year ended March 31, 2018
actuarial gains and losses, the effect of the changes to the asset ceiling (if applicable) and the return on plan assets (excluding interest), is reflected immediately in the statement of financial position with a charge or credit recognised in other comprehensive income in the period in which they occur. Remeasurement recognised in other comprehensive income is reflected immediately in retained earnings and will not be reclassified to profit or loss. Past service cost is recognised in profit or loss in the period of a plan amendment. Net interest is calculated by applying the discount rate at the beginning of the period to the net defined benefit liability or asset. Defined benefit costs are categorised as follows:
• service cost (including current service cost, past service cost, as well as gains and losses on curtailments and settlements);
• net interest expense or income; and
• remeasurement
The Group presents the first two components of defined benefit costs in profit or loss in the line item employee benefits expenses. Curtailment gains and losses are accounted for as past service costs. The retirement benefit obligation recognised in the consolidated statement of financial position represents the actual deficit or surplus in the Group’s defined benefit plans. Any surplus resulting from this calculation is limited to the present value of any economic benefits available in the form of refunds from the plans or reductions in future contributions to the plans. A liability for a termination benefit is recognised at the earlier of when the entity can no longer withdraw the offer of the termination benefit and when the entity recognises any related restructuring costs.
Short-term and other long-term employee benefits A liability is recognised for benefits accruing to employees in respect of wages and salaries, annual leave and sick leave in the period the
related service is rendered at the undiscounted amount of the benefits expected to be paid in exchange for that service.
Liabilities recognised in respect of short-term employee benefits are measured at the undiscounted amount of the benefits expected to be paid in exchange for the related service.
Liabilities recognised in respect of other long-term employee benefits are measured at the present value of the estimated future cash outflows expected to be made by the Group in respect of services provided by employees up to the reporting date.
XI.Taxation
Income tax expense represents the sum of the tax currently payable and deferred tax.
Current tax Current tax is the amount of tax payable on the taxable income for the year as determined in accordance with the applicable tax rates
and the provisions of the Income Tax Act, 1961 and other applicable tax laws in the countries where the Group operates and generates taxable income.
Deferred tax Deferred tax is recognised on temporary differences between the carrying amounts of assets and liabilities in the consolidated financial
statements and the corresponding tax bases used in the computation of taxable profit. Deferred tax liabilities are generally recognised for all taxable temporary differences. Deferred tax assets are generally recognised for all deductible temporary differences to the extent that it is probable that taxable profits will be available against which those deductible temporary differences can be utilised. Such deferred tax assets and liabilities are not recognised if the temporary difference arises from the initial recognition (other than in a business combination) of assets and liabilities in a transaction that affects neither the taxable profit nor the accounting profit. In addition, deferred tax liabilities are not recognised if the temporary difference arises from the initial recognition of goodwill.
Deferred tax liabilities are recognised for taxable temporary differences associated with investments in subsidiaries and associates, and interests in joint ventures, except where the Group is able to control the reversal of the temporary difference and it is probable that the temporary difference will not reverse in the foreseeable future. Deferred tax assets arising from deductible temporary differences associated with such investments and interests are only recognised to the extent that it is probable that there will be sufficient taxable profits against which to utilise the benefits of the temporary differences and they are expected to reverse in the foreseeable future.
The carrying amount of deferred tax assets is reviewed at the end of each reporting period and reduced to the extent that it is no longer probable that sufficient taxable profits will be available to allow all or part of the asset to be recovered.
Deferred tax assets and liabilities are measured at the tax rates that are expected to apply in the period in which the liability is settled or the asset realised, based on tax rates (and tax laws) that have been enacted or substantively enacted by the end of the reporting period.
The measurement of deferred tax liabilities and assets reflects the tax consequences that would follow from the manner in which the Group expects, at the end of the reporting period, to recover or settle the carrying amount of its assets and liabilities.
For the purposes of measuring deferred tax liabilities and deferred tax assets on non-depreciable assets the carrying amounts of such properties are presumed to be recovered entirely through sale.
Notes to the Consolidated Financial Statementsfor the year ended March 31, 2018
Deferred tax assets and deferred tax liabilities are offset if a legally enforceable right exists to set off current tax assets against current tax liabilities and the deferred taxes relate to the same taxable entity and the same taxation authority.
Minimum Alternate Tax (MAT) paid in accordance with the tax laws, which gives future economic benefits in the form of adjustment to future income tax liability, is considered as an asset if there is convincing evidence that the Group will pay normal income tax. Accordingly, MAT is recognised as a deferred tax asset in the Balance Sheet when it is highly probable that future economic benefit associated with it will flow to the Group.
Current and deferred tax for the year Current and deferred tax are recognised in profit or loss, except when they are relate to items that are recognised in other comprehensive
income or directly in equity, in which case, the current and deferred tax are also recognized in other comprehensive income or directly in equity respectively. Where current tax or deferred tax arises from the initial accounting for a business combination, the tax effect is included in the accounting for the business combination.
XII. Property, plant and equipment
The cost of property, plant and equipment comprises its purchase price net of any trade discounts and rebates, any import duties and other taxes (other than those subsequently recoverable from the tax authorities), any directly attributable expenditure on making the asset ready for its intended use, including relevant borrowing costs for qualifying assets. Expenditure incurred after the property, plant and equipment have been put into operation, such as repairs and maintenance, are charged to the Statement of Profit and Loss in the period in which the costs are incurred. Major shut-down and overhaul expenditure is capitalised as the activities undertaken improves the economic benefits expected to arise from the asset.
An item of property, plant and equipment is derecognised upon disposal or when no future economic benefits are expected to arise from the continued use of the asset. Any gain or loss arising on the disposal or retirement of an item of property, plant and equipment is determined as the difference between the sales proceeds and the carrying amount of the asset and is recognized in Statement of Profit and Loss.
Assets in the course of construction are capitalised in the assets under construction account. At the point when an asset is operating at management’s intended use, the cost of construction is transferred to the appropriate category of property, plant and equipment and depreciation commences. Costs associated with the commissioning of an asset and any obligatory decommissioning costs are capitalised where the asset is available for use but incapable of operating at normal levels until a period of commissioning has been completed. Revenue generated from production during the trial period is capitalised.
XIII. Depreciation and amortisation
Depreciable amount for assets is the cost of an asset, or other amount substituted for cost, less its estimated residual value. Depreciation is provided on buildings and plant & machinery on a straight-line method and in case of other tangible assets, on written-down value method over the estimated useful lives of the assets as per the useful life prescribed in Schedule II to the Companies Act, 2013 except for plant and machinery. In respect of plant and machinery, the life of the assets has been assessed as under based on technical advice, taking into account the nature of the asset, the estimated usage of the asset, the operating conditions of the asset, past history of replacement, anticipated technological changes, manufacturers warranties and maintenance support, etc. The useful lives of plant and machinery has been estimated as 22 years and 30 years for different categories as technically determined.
When significant parts of plant and equipment are required to be replaced at intervals, the Group depreciates them separately based on their specific useful lives.
Intangible assets are amortised over their estimated useful lives on straight line method. The amortization rates used for various intangible assets are as under:
Class of assets Years
Technical knowhow 5 to 20 years
Software 5 years
Freehold land is not depreciated. Leasehold land is amortized over the period of the lease, except where the lease is convertible to freehold land under lease agreements at future dates at no additional cost.
The Group reviews the residual value, useful lives and depreciation method annually and, if expectations differ from previous estimates, the change is accounted for as a change in accounting estimate on a prospective basis.
Depreciation on the tangible fixed assets of the Company’s foreign subsidiaries and jointly controlled entities has been provided on straight-line method as per the estimated useful life of such assets as follows:
Annual Report 2017 - 18 /105104
Notes to the Consolidated Financial Statementsfor the year ended March 31, 2018
Class of assets Years
Buildings 15 to 60 years
Plant and machinery 11 to 30 years
Furniture and fixtures 3 to 10 years
Vehicles and aircrafts 5 to 10 years
Office equipment 3 to 10 years
XIV. Intangible assets
Intangible assets with finite useful lives that are acquired separately are carried at cost less accumulated amortisation and accumulated impairment losses. Amortisation is recognised on a straight-line basis over their estimated useful lives. The estimated useful life and amortisation method are reviewed at the end of each reporting period, with the effect of any changes in estimate being accounted for on a prospective basis. Intangible assets with indefinite useful lives that are acquired separately are carried at cost less accumulated impairment losses.
Derecognition of intangible assets An intangible asset is derecognised on disposal, or when no future economic benefits are expected from use or disposal. Gains or losses
arising from derecognition of an intangible asset, measured as the difference between the net disposal proceeds and the carrying amount of the asset are recognised in the Statement of Profit and Loss when the asset is derecognised.
XV. Impairment of non-current assets
At the end of each reporting period, the Group reviews the carrying amounts of its tangible and intangible assets to determine whether there is any indication that those assets have suffered an impairment loss. If any such indication exists, the recoverable amount of the asset is estimated in order to determine the extent of the impairment loss (if any). Where it is not possible to estimate the recoverable amount of an individual asset, the Group estimates the recoverable amount of the cash-generating unit to which the asset belongs. Where a reasonable and consistent basis of allocation can be identified, corporate assets are also allocated to individual cash-generating units, or otherwise they are allocated to the smallest group of cash-generating units for which a reasonable and consistent allocation basis can be identified.
Intangible assets with indefinite useful lives and intangible assets not yet available for use are tested for impairment at least annually, and whenever there is an indication that the asset may be impaired.
Recoverable amount is the higher of fair value less costs to sell and value in use. In assessing value in use, the estimated future cash flows are discounted to their present value using a pre-tax discount rate that reflects current market assessments of the time value of money and the risks specific to the asset for which the estimates of future cash flows have not been adjusted.
If the recoverable amount of an asset (or cash-generating unit) is estimated to be less than its carrying amount, the carrying amount of the asset (or cash-generating unit) is reduced to its recoverable amount. An impairment loss is recognised immediately in the Statement of Profit and Loss, unless the relevant asset is carried at a revalued amount, in which case the impairment loss is treated as a revaluation decrease.
Where an impairment loss subsequently reverses, the carrying amount of the asset (or a cash-generating unit) is increased to the revised estimate of its recoverable amount, but so that the increased carrying amount does not exceed the carrying amount that would have been determined had no impairment loss been recognised for the asset (or cash-generating unit) in prior years. A reversal of an impairment loss is recognised immediately in the Statement of Profit and Loss, unless the relevant asset is carried at a revalued amount, in which case the reversal of the impairment loss is treated as a revaluation increase.
XVI. Inventories
Inventories are stated at the lower of cost and net realisable value. Costs of inventories comprises of cost of purchase, cost of conversion and other costs including manufacturing overheads incurred in bringing them to their respective present location and condition. Cost of raw materials, traded goods and stores and spares are ascertained on weighted average basis. Net realisable value represents the estimated selling price for inventories less all estimated costs of completion and costs necessary to make the sale.
XVII. Provisions
Provisions are recognised when the Group has a present obligation (legal or constructive), as a result of past events, and it is probable that an outflow of resources, that can be reliably estimated, will be required to settle such an obligation.
The amount recognised as a provision is the best estimate of the consideration required to settle the present obligation at the balance sheet date, taking into account the risks and uncertainties surrounding the obligation. When a provision is measured using the cash flows
Notes to the Consolidated Financial Statementsfor the year ended March 31, 2018
estimated to settle the present obligation, its carrying amount is the present value of those cash flows (when the effect of the time value of money is material).
When some or all of the economic benefits required to settle a provision are expected to be recovered from a third party, a receivable is recognized as an asset if it is virtually certain that reimbursement will be received and the amount of the receivable can be measured reliably.
XVIII. Investments in subsidiaries and Joint venture
Investments in subsidiaries and joint venture are carried at cost less accumulated impairment losses, if any. Cost includes the purchase price and other costs directly attributable to the acquisition of investments. Where an indication of impairment exists, the carrying amount of the investment is assessed and written down immediately to its recoverable amount. On disposal of investments in subsidiaries and joint venture, the difference between net disposal proceeds and the carrying amounts are recognized in the Standalone Statement of Profit and Loss. Further, under Ind AS 101, while transitioning to Ind AS for previous GAAP, the Company had elected to measure its existing investments in subsidiaries on the date of transition at the previous GAAP carrying value.
XIX. Cash and cash Equivalents
Cash and cash equivalents comprise cash and deposits with banks and corporations and bank overdrafts. The Company considers all highly liquid investments with a remaining maturity at the date of purchase of three months or less and that are readily convertible to known amounts of cash to be cash equivalents.
XX.Segment Reporting
The Chief Operational Decision Maker (CODM) monitors the operating results of its business segments separately for the purpose of making decisions about resource allocation and performance assessment. Operating segments are reported in a manner consistent with the internal reporting provided to the CODM.
The Group primarily operates in the two segment i.e Custom Moulding Business (CM) & Infra, prefab & other business (IPB). The Managing Director of the Group allocate resources and assess the performance of the Group; thus, he is Chief Operating Decision Maker (CODM). The CODM monitors the operating results of the Group in two business segments i.e. CM and IPB.
XXI. Financial Instruments
Financial assets and financial liabilities are recognised when a Group entity becomes a party to the contractual provisions of the instrument.
Financial assets and financial liabilities are initially measured at fair value. Transaction costs that are directly attributable to the acquisition or issue of financial assets and financial liabilities (other than financial assets and financial liabilities at fair value through Statement of Profit and Loss) are added to or deducted from the fair value of the financial assets or financial liabilities, as appropriate, on initial recognition. Transaction costs directly attributable to the acquisition of financial assets or financial liabilities at fair value through Profit and Loss are recognised immediately in Statement of Profit and Loss.
A. Financial assets
a) Recognition and initial measurement
(i) The Group initially recognises loans and advances, deposits, debt securities issues and subordinated liabilities on the date on which they originate. All other financial instruments (including regular way purchases and sales of financial assets) are recognised on the trade date, which is the date on which the Group a party to the contractual provisions of the instrument. A financial asset or liability is initially measured at fair value plus, for an item not at FVTPL, transaction costs that are directly attributable to its acquisition or issue.
(ii) In case of investments in subsidiaries, joint ventures and associates the Company has chosen to measure its investments at deemed cost.
(iii) The Company has elected to apply the requirements pertaining to Level III financial instruments of deferring the difference between
the fair value at initial recognition and the transaction price prospectively to transactions entered into on or after the date of transition to Ind AS.
b) Classification
On initial recognition, a financial asset is classified as measured at; amortised cost, FVOCI or FVTPL
A financial asset is measured at amortised cost if it meets both of the following conditions and is not designated at FVTPL:
Annual Report 2017 - 18 /107106
Notes to the Consolidated Financial Statementsfor the year ended March 31, 2018
• The asset is held within a business model whose objective is to hold assets to collect contractual cash flows; and
• The contractual terms of the financial asset give rise on specified dates to cash flows that are solely payments of principal and interest on the principal amount outstanding
This category is the most relevant to the Group. After initial measurement, such financial assets are subsequently measured at amortised cost using the effective interest rate (EIR) method. Amortised cost is calculated by taking into account any discount or premium on acquisition and fees or costs that are an integral part of the EIR. The EIR amortisation is included in finance income in the profit or loss. The losses arising from impairment are recognised in the profit or loss. This category generally applies to trade and other receivables. For more information on receivables, refer to Note 14. A debt instrument is classified as FVOCI only if it meets both the of the following conditions and is not recognised at FVTPL;
• The asset is held within a business model whose objective is achieved by both collecting contractual cash flows and selling financial assets; and
• The contractual terms of the financial asset give rise on specified dates to cash flows that are solely payments of principal and interest on the principal amount outstanding
Debt instruments included within the FVTOCI category are measured initially as well as at each reporting date at fair value. Fair value movements are recognized in the other comprehensive income (OCI). However, the group recognizes interest income, impairment losses & reversals and foreign exchange gain or loss in the P&L. On derecognition of the asset, cumulative gain or loss previously recognised in OCI is reclassified from the equity to P&L. Interest earned whilst holding FVTOCI debt instrument is reported as interest income using the EIR method.
All equity investments in scope of Ind AS 109 are measured at fair value. Equity instruments which are held for trading and contingent consideration recognised by an acquirer in a business combination to which Ind AS 103 applies are classified as at FVTPL. For all other equity instruments, the group may make an irrevocable election to present in other comprehensive income subsequent changes in the fair value. The group makes such election on an instrument-by-instrument basis. The classification is made on initial recognition and is irrevocable.
If the group decides to classify an equity instrument as at FVTOCI, then all fair value changes on the instrument, excluding dividends, are recognized in the OCI. There is no recycling of the amounts from OCI to P&L, even on sale of investment. However, the group may transfer the cumulative gain or loss within equity.
Equity instruments included within the FVTPL category are measured at fair value with all changes recognized in the P&L.
All other financial assets are classified as measured at FVTPL.
In addition, on initial recognition, the Group may irrevocably designate a financial asset that otherwise meets the requirements to be measured at amortised cost or at FVOCI as at FVTPL if doing so eliminates or significantly reduces and accounting mismatch that would otherwise arise.
c) Derecognition
A financial asset (or, where applicable, a part of a financial asset or part of a group of similar financial assets) is primarily derecognised (i.e. removed from the Group’s consolidated balance sheet) when:
• The rights to receive cash flows from the asset have expired, or
• The group has transferred its rights to receive cash flows from the asset or has assumed an obligation to pay the received cash flows in full without material delay to a third party under a ‘pass-through’ arrangement and either (a) the group has transferred substantially all the risks and rewards of the asset, or (b) the group has neither transferred nor retained substantially all the risks and rewards of the asset but has transferred control of the asset.
When the group has transferred its rights to receive cash flows from an asset or has entered into a pass-through arrangement, it evaluates if and to what extent it has retained the risks and rewards of ownership. When it has neither transferred nor retained substantially all of the risks and rewards of the asset, nor transferred control of the asset, the group continues to recognise the transferred asset to the extent of the Group’s continuing involvement. In that case, the group also recognises an associated liability. The transferred asset and the associated liability are measured on a basis that reflects the rights and obligations that the Group has retained.
Continuing involvement that takes the form of a guarantee over the transferred asset is measured at the lower of the original carrying amount of the asset and the maximum amount of consideration that the group could be required to repay.
Notes to the Consolidated Financial Statementsfor the year ended March 31, 2018
d) Impairment
Impairment of financial assets In accordance with Ind AS 109, the group applies expected credit loss (ECL) model for measurement and recognition of impairment loss
on the following financial assets and credit risk exposure:
a) Financial assets that are debt instruments, and are measured at amortised cost e.g., loans, debt securities, deposits, trade receivables and bank balance
b) Financial assets that are debt instruments and are measured as at FVTOCI
c) Lease receivables under Ind AS 17
d) Trade receivables or any contractual right to receive cash or another financial asset that result from transactions that are within the scope of Ind AS 11 and Ind AS 18 (referred to as ‘contractual revenue receivables’ in these financial statements)
e) Loan commitments which are not measured as at FVTPL
f) Financial guarantee contracts which are not measured as at FVTPL
The group follows ‘simplified approach’ for recognition of impairment loss allowance on:
I) Trade receivables or contract revenue receivables; and
II) All lease receivables resulting from transactions within the scope of Ind AS 17
The application of simplified approach does not require the group to track changes in credit risk. Rather, it recognises impairment loss allowance based on lifetime ECLs at each reporting date, right from its initial recognition.
For recognition of impairment loss on other financial assets and risk exposure, the group determines that whether there has been a significant increase in the credit risk since initial recognition. If credit risk has not increased significantly, 12-month ECL is used to provide for impairment loss. However, if credit risk has increased significantly, lifetime ECL is used. If, in a subsequent period, credit quality of the instrument improves such that there is no longer a significant increase in credit risk since initial recognition, then the entity reverts to recognising impairment loss allowance based on 12-month ECL.
Lifetime ECL are the expected credit losses resulting from all possible default events over the expected life of a financial instrument. The 12-month ECL is a portion of the lifetime ECL which results from default events that are possible within 12 months after the reporting date.
ECL is the difference between all contractual cash flows that are due to the group in accordance with the contract and all the cash flows that the entity expects to receive (i.e., all cash shortfalls), discounted at the original EIR. When estimating the cash flows, an entity is required to consider:
i) All contractual terms of the financial instrument (including prepayment, extension, call and similar options) over the expected life of
the financial instrument. However, in rare cases when the expected life of the financial instrument cannot be estimated reliably, then the entity is required to use the remaining contractual term of the financial instrument
ii) Cash flows from the sale of collateral held or other credit enhancements that are integral to the contractual terms
ECL impairment loss allowance (or reversal) recognized during the period is recognized as income/ expense in the statement of profit and loss (P&L). This amount is reflected under the head ‘other expenses’ in the P&L. The balance sheet presentation for various financial instruments is described below:
i) Financial assets measured as at amortised cost, contractual revenue receivables and lease receivables: ECL is presented as an allowance, i.e., as an integral part of the measurement of those assets in the balance sheet. The allowance reduces the net carrying amount. Until the asset meets write-off criteria, the group does not reduce impairment allowance from the gross carrying amount.
ii) Loan commitments and financial guarantee contracts: ECL is presented as a provision in the balance sheet, i.e. as a liability.
iii) Debt instruments measured at FVTOCI: Since financial assets are already reflected at fair value, impairment allowance is not further reduced from its value. Rather, ECL amount is presented as ‘accumulated impairment amount’ in the OCI.
For assessing increase in credit risk and impairment loss, the group combines financial instruments on the basis of shared credit risk characteristics with the objective of facilitating an analysis that is designed to enable significant increases in credit risk to be identified on a timely basis.
Annual Report 2017 - 18 /109108
Notes to the Consolidated Financial Statementsfor the year ended March 31, 2018
The group does not have any purchased or originated credit-impaired (POCI) financial assets, i.e., financial assets which are credit impaired on purchase/ origination.
e) Effective interest method
The effective interest method is a method of calculating the amortised cost of a debt instrument and of allocating interest income over the relevant period. The effective interest rate is the rate that exactly discounts estimated future cash receipts (including all fees and points paid or received that form an integral part of the effective interest rate, transaction costs and other premiums or discounts) through the expected life of the debt instrument, or, where appropriate, a shorter period, to the net carrying amount on initial recognition.
Income is recognised on an effective interest basis for debt instruments other than those financial assets classified as at FVTPL.
B. Financial liabilities and equity instruments
a) Classification as debt or equity
Debt and equity instruments issued by a group entity are classified as either financial liabilities or as equity in accordance with the substance of the contractual arrangements and the definitions of a financial liability and an equity instrument.
b) Equity instruments
An equity instrument is any contract that evidences a residual interest in the assets of an entity after deducting all of its liabilities. Equity instruments issued by the Group are recognised at the proceeds received, net of direct issue costs.
Repurchase of the Group’s own equity instruments is recognised and deducted directly in equity. No gain or loss is recognised in Statement of Profit and Loss on the purchase, sale, issue or cancellation of the Group’s own equity instruments.
c) Financial liabilities
Financial liabilities are classified as either financial liabilities ‘at FVTPL’ or ‘other financial liabilities’.
Financial liabilities at FVTPL:
Financial liabilities are classified as at FVTPL when the financial liability is either held for trading or it is designated as at FVTPL.
Financial liabilities at FVTPL are stated at fair value, with any gains or losses arising on remeasurement recognised in Statement of Profit and Loss. The net gain or loss recognised in Statement of Profit and Loss incorporates any interest paid on the financial liability and is included in the ‘other gains and losses’ line item in the consolidated [statement of comprehensive income/Statement of Profit and Loss].
The Group derecognises financial liabilities when, and only when, the Group’s obligations are discharged, cancelled or they expire. The difference between the carrying amount of the financial liability derecognised and the consideration paid and payable is recognised in Statement of Profit and Loss.
d) Derivative financial instruments
The Group has entered into forward exchange contracts or principal only swap which are in substance of forward exchange contracts to manage its exposure to foreign currency cash flows.
Derivatives are initially recognised at fair value at the date the derivative contracts are entered into and are subsequently remeasured to their fair value at the end of each reporting period. The resulting gain or loss is recognised in financial statements where its recognition in the Statement of Profit and Loss depends on the nature of the hedge relationship.
e) Reclassification of financial assets
The group determines classification of financial assets and liabilities on initial recognition. After initial recognition, no reclassification is made for financial assets which are equity instruments and financial liabilities. For financial assets which are debt instruments, a reclassification is made only if there is a change in the business model for managing those assets. Changes to the business model are expected to be infrequent. The group’s senior management determines change in the business model as a result of external or internal changes which are significant to the group’s operations. Such changes are evident to external parties. A change in the business model occurs when the group either begins or ceases to perform an activity that is significant to its operations. If the group reclassifies financial assets, it applies the reclassification prospectively from the reclassification date which is the first day of the immediately next reporting period following the change in business model. The group does not restate any previously recognised gains, losses (including impairment gains or losses) or interest.
Notes to the Consolidated Financial Statementsfor the year ended March 31, 2018
The following table shows various reclassification and how they are accounted for:
Original classification Revised classification Accounting treatment
Amortised cost FVTPL Fair value is measured at reclassification date. Difference between previous amortized cost and fair value is recognised in P&L.
FVTPL Amortised Cost Fair value at reclassification date becomes its new gross carrying amount. EIR is calculated based on the new gross carrying amount.
Amortised cost FVTOCIFair value is measured at reclassification date. Difference between previous amortised cost and fair value is recognised in OCI. No change in EIR due to reclassification.
FVTOCI Amortised cost
Fair value at reclassification date becomes its new amortised cost carrying amount. However, cumulative gain or loss in OCI is adjusted against fair value. Consequently, the asset is measured as if it had always been measured at amortised cost.
FVTPL FVTOCI Fair value at reclassification date becomes its new carrying amount. No other adjustment is required.
FVTOCI FVTPL Assets continue to be measured at fair value. Cumulative gain or loss previously recognized in OCI is reclassified to P&L at the reclassification date.
3. Critical Judgements in applying accounting policies and key sources of estimation uncertainty
3.1 Critical judgements in applying accounting policies
In the course of applying the policies outlined in all notes under section 2 above, the directors of the Company are required to make judgements, estimates and assumptions about the carrying amount of assets and liabilities that are not readily apparent from other sources. The estimates and associated assumptions are based on historical experience and other factors that are considered to be relevant. Actual results may differ from these estimates.
The estimates and underlying assumptions are reviewed on an ongoing basis. Revisions to accounting estimates are recognised in the period in which the estimate is revised if the revision affects only that period, or in the period of the revision and future period, if the revision affects current and future period.
3.2 Key sources of estimation uncertainty
i) Useful lives and residual value of property, plant and equipment
Group reviews the useful lives and residual values of property, plant and equipment at least once a year. Such lives are dependent upon an assessment of both the technical lives of the assets and also their likely economic lives based on various internal and external factors including relative efficiency and operating costs. Accordingly, useful lives are reviewed annually using the best information available to the Management.
ii) Fair value measurements and valuation process
Management uses its judgement in selecting an appropriate valuation technique for financial instruments not quoted in an active market. Valuation techniques commonly used by market participants are applied. Other financial instruments are valued using a discounted cash flow method based on assumptions supported, where possible, by observable market prices or rates. Information about the valuation techniques and inputs used in determining the fair value of various assets and liabilities are disclosed in note 44.
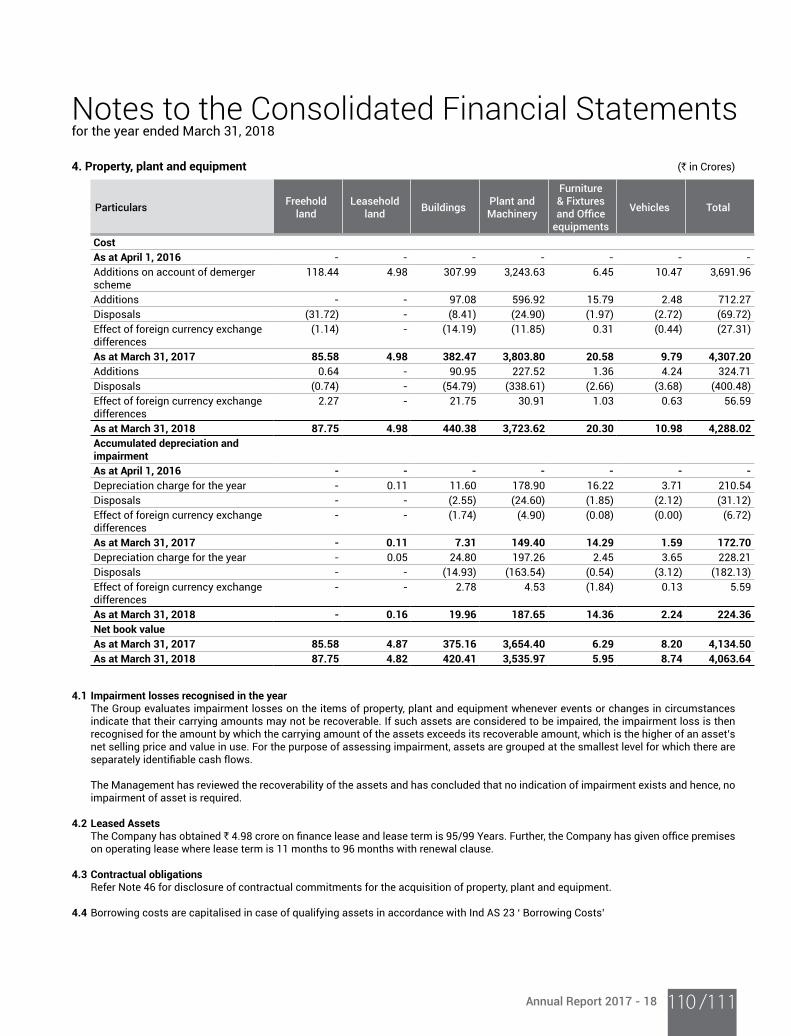
Annual Report 2017 - 18 /111110
Notes to the Consolidated Financial Statementsfor the year ended March 31, 2018
4. Property, plant and equipment (` in Crores)
ParticularsFreehold
landLeasehold
landBuildings
Plant and Machinery
Furniture & Fixtures and Office
equipments
Vehicles Total
Cost
As at April 1, 2016 - - - - - - - Additions on account of demerger scheme
118.44 4.98 307.99 3,243.63 6.45 10.47 3,691.96
Additions - - 97.08 596.92 15.79 2.48 712.27 Disposals (31.72) - (8.41) (24.90) (1.97) (2.72) (69.72)Effect of foreign currency exchange differences
(1.14) - (14.19) (11.85) 0.31 (0.44) (27.31)
As at March 31, 2017 85.58 4.98 382.47 3,803.80 20.58 9.79 4,307.20
Additions 0.64 - 90.95 227.52 1.36 4.24 324.71 Disposals (0.74) - (54.79) (338.61) (2.66) (3.68) (400.48)Effect of foreign currency exchange differences
2.27 - 21.75 30.91 1.03 0.63 56.59
As at March 31, 2018 87.75 4.98 440.38 3,723.62 20.30 10.98 4,288.02
Accumulated depreciation and impairment
As at April 1, 2016 - - - - - - -
Depreciation charge for the year - 0.11 11.60 178.90 16.22 3.71 210.54 Disposals - - (2.55) (24.60) (1.85) (2.12) (31.12)Effect of foreign currency exchange differences
- - (1.74) (4.90) (0.08) (0.00) (6.72)
As at March 31, 2017 - 0.11 7.31 149.40 14.29 1.59 172.70
Depreciation charge for the year - 0.05 24.80 197.26 2.45 3.65 228.21 Disposals - - (14.93) (163.54) (0.54) (3.12) (182.13)Effect of foreign currency exchange differences
- - 2.78 4.53 (1.84) 0.13 5.59
As at March 31, 2018 - 0.16 19.96 187.65 14.36 2.24 224.36
Net book value
As at March 31, 2017 85.58 4.87 375.16 3,654.40 6.29 8.20 4,134.50
As at March 31, 2018 87.75 4.82 420.41 3,535.97 5.95 8.74 4,063.64
4.1 Impairment losses recognised in the year The Group evaluates impairment losses on the items of property, plant and equipment whenever events or changes in circumstances
indicate that their carrying amounts may not be recoverable. If such assets are considered to be impaired, the impairment loss is then recognised for the amount by which the carrying amount of the assets exceeds its recoverable amount, which is the higher of an asset’s net selling price and value in use. For the purpose of assessing impairment, assets are grouped at the smallest level for which there are separately identifiable cash flows.
The Management has reviewed the recoverability of the assets and has concluded that no indication of impairment exists and hence, no
impairment of asset is required. 4.2 Leased Assets The Company has obtained ` 4.98 crore on finance lease and lease term is 95/99 Years. Further, the Company has given office premises
on operating lease where lease term is 11 months to 96 months with renewal clause.
4.3 Contractual obligations Refer Note 46 for disclosure of contractual commitments for the acquisition of property, plant and equipment.
4.4 Borrowing costs are capitalised in case of qualifying assets in accordance with Ind AS 23 ‘ Borrowing Costs’
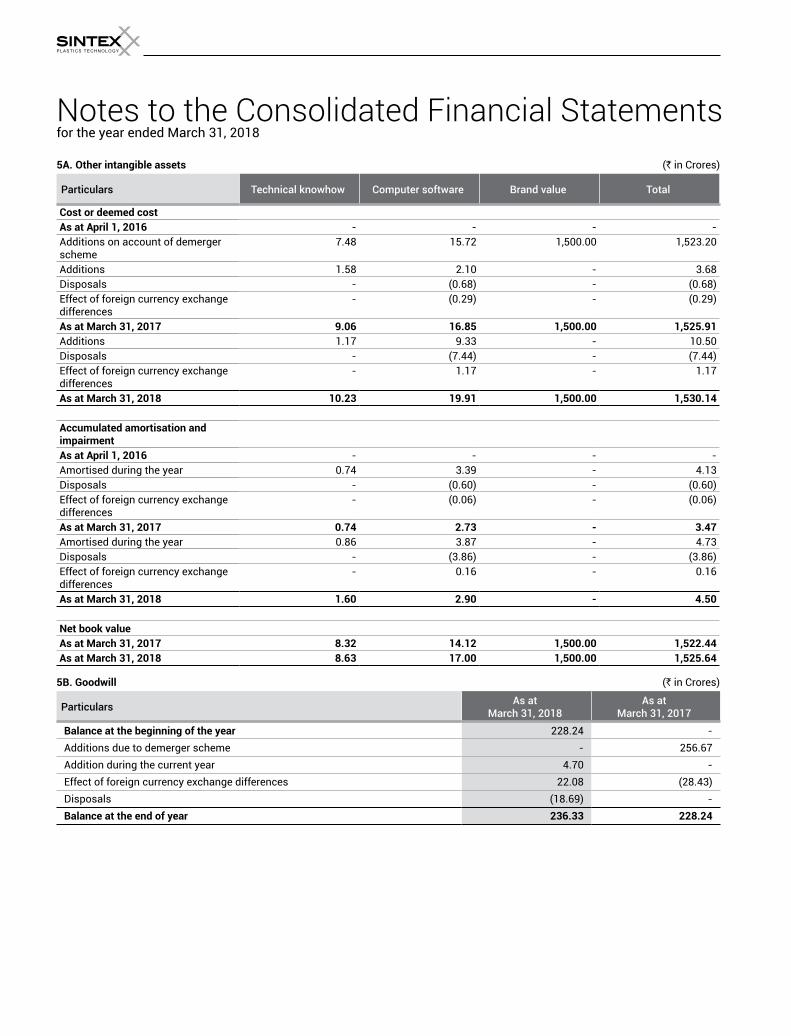
Notes to the Consolidated Financial Statementsfor the year ended March 31, 2018
5A. Other intangible assets (` in Crores)
Particulars Technical knowhow Computer software Brand value Total
Cost or deemed cost
As at April 1, 2016 - - - - Additions on account of demerger scheme
7.48 15.72 1,500.00 1,523.20
Additions 1.58 2.10 - 3.68 Disposals - (0.68) - (0.68)Effect of foreign currency exchange differences
- (0.29) - (0.29)
As at March 31, 2017 9.06 16.85 1,500.00 1,525.91
Additions 1.17 9.33 - 10.50 Disposals - (7.44) - (7.44)Effect of foreign currency exchange differences
- 1.17 - 1.17
As at March 31, 2018 10.23 19.91 1,500.00 1,530.14
Accumulated amortisation and impairment
As at April 1, 2016 - - - - Amortised during the year 0.74 3.39 - 4.13 Disposals - (0.60) - (0.60)Effect of foreign currency exchange differences
- (0.06) - (0.06)
As at March 31, 2017 0.74 2.73 - 3.47
Amortised during the year 0.86 3.87 - 4.73 Disposals - (3.86) - (3.86)Effect of foreign currency exchange differences
- 0.16 - 0.16
As at March 31, 2018 1.60 2.90 - 4.50
Net book value
As at March 31, 2017 8.32 14.12 1,500.00 1,522.44
As at March 31, 2018 8.63 17.00 1,500.00 1,525.64
5B. Goodwill (` in Crores)
ParticularsAs at
March 31, 2018As at
March 31, 2017
Balance at the beginning of the year 228.24 - Additions due to demerger scheme - 256.67 Addition during the current year 4.70 - Effect of foreign currency exchange differences 22.08 (28.43)Disposals (18.69) - Balance at the end of year 236.33 228.24
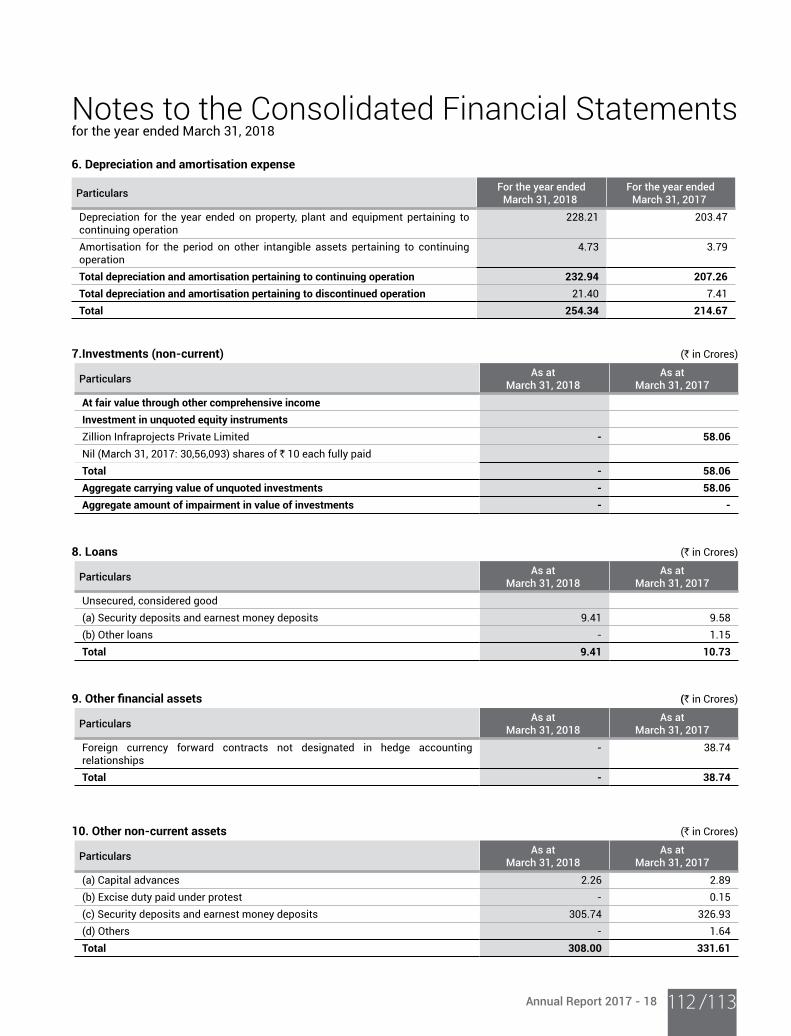
Annual Report 2017 - 18 /113112
Notes to the Consolidated Financial Statementsfor the year ended March 31, 2018
6. Depreciation and amortisation expense
Particulars For the year ended
March 31, 2018 For the year ended
March 31, 2017
Depreciation for the year ended on property, plant and equipment pertaining to continuing operation
228.21 203.47
Amortisation for the period on other intangible assets pertaining to continuing operation
4.73 3.79
Total depreciation and amortisation pertaining to continuing operation 232.94 207.26
Total depreciation and amortisation pertaining to discontinued operation 21.40 7.41 Total 254.34 214.67
7.Investments (non-current) (` in Crores)
ParticularsAs at
March 31, 2018As at
March 31, 2017
At fair value through other comprehensive income
Investment in unquoted equity instruments
Zillion Infraprojects Private Limited - 58.06
Nil (March 31, 2017: 30,56,093) shares of ` 10 each fully paid Total - 58.06
Aggregate carrying value of unquoted investments - 58.06
Aggregate amount of impairment in value of investments - -
8. Loans (` in Crores)
ParticularsAs at
March 31, 2018As at
March 31, 2017
Unsecured, considered good(a) Security deposits and earnest money deposits 9.41 9.58 (b) Other loans - 1.15 Total 9.41 10.73
9. Other financial assets (` in Crores)
ParticularsAs at
March 31, 2018As at
March 31, 2017
Foreign currency forward contracts not designated in hedge accounting relationships
- 38.74
Total - 38.74
10. Other non-current assets (` in Crores)
ParticularsAs at
March 31, 2018As at
March 31, 2017
(a) Capital advances 2.26 2.89 (b) Excise duty paid under protest - 0.15 (c) Security deposits and earnest money deposits 305.74 326.93 (d) Others - 1.64 Total 308.00 331.61
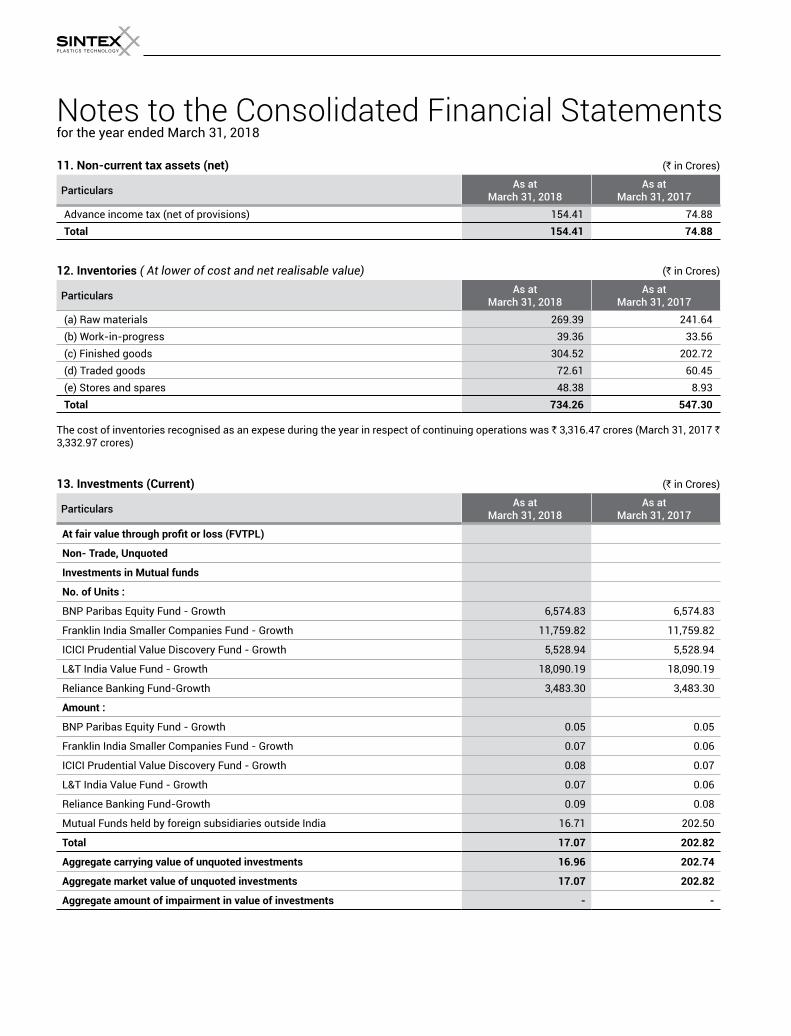
Notes to the Consolidated Financial Statementsfor the year ended March 31, 2018
11. Non-current tax assets (net) (` in Crores)
ParticularsAs at
March 31, 2018As at
March 31, 2017
Advance income tax (net of provisions) 154.41 74.88 Total 154.41 74.88
12. Inventories ( At lower of cost and net realisable value) (` in Crores)
ParticularsAs at
March 31, 2018As at
March 31, 2017
(a) Raw materials 269.39 241.64 (b) Work-in-progress 39.36 33.56 (c) Finished goods 304.52 202.72 (d) Traded goods 72.61 60.45 (e) Stores and spares 48.38 8.93 Total 734.26 547.30
The cost of inventories recognised as an expese during the year in respect of continuing operations was ` 3,316.47 crores (March 31, 2017 ` 3,332.97 crores)
13. Investments (Current) (` in Crores)
ParticularsAs at
March 31, 2018As at
March 31, 2017
At fair value through profit or loss (FVTPL)
Non- Trade, Unquoted
Investments in Mutual funds
No. of Units :
BNP Paribas Equity Fund - Growth 6,574.83 6,574.83
Franklin India Smaller Companies Fund - Growth 11,759.82 11,759.82
ICICI Prudential Value Discovery Fund - Growth 5,528.94 5,528.94
L&T India Value Fund - Growth 18,090.19 18,090.19
Reliance Banking Fund-Growth 3,483.30 3,483.30
Amount :
BNP Paribas Equity Fund - Growth 0.05 0.05
Franklin India Smaller Companies Fund - Growth 0.07 0.06
ICICI Prudential Value Discovery Fund - Growth 0.08 0.07
L&T India Value Fund - Growth 0.07 0.06
Reliance Banking Fund-Growth 0.09 0.08
Mutual Funds held by foreign subsidiaries outside India 16.71 202.50
Total 17.07 202.82
Aggregate carrying value of unquoted investments 16.96 202.74
Aggregate market value of unquoted investments 17.07 202.82
Aggregate amount of impairment in value of investments - -
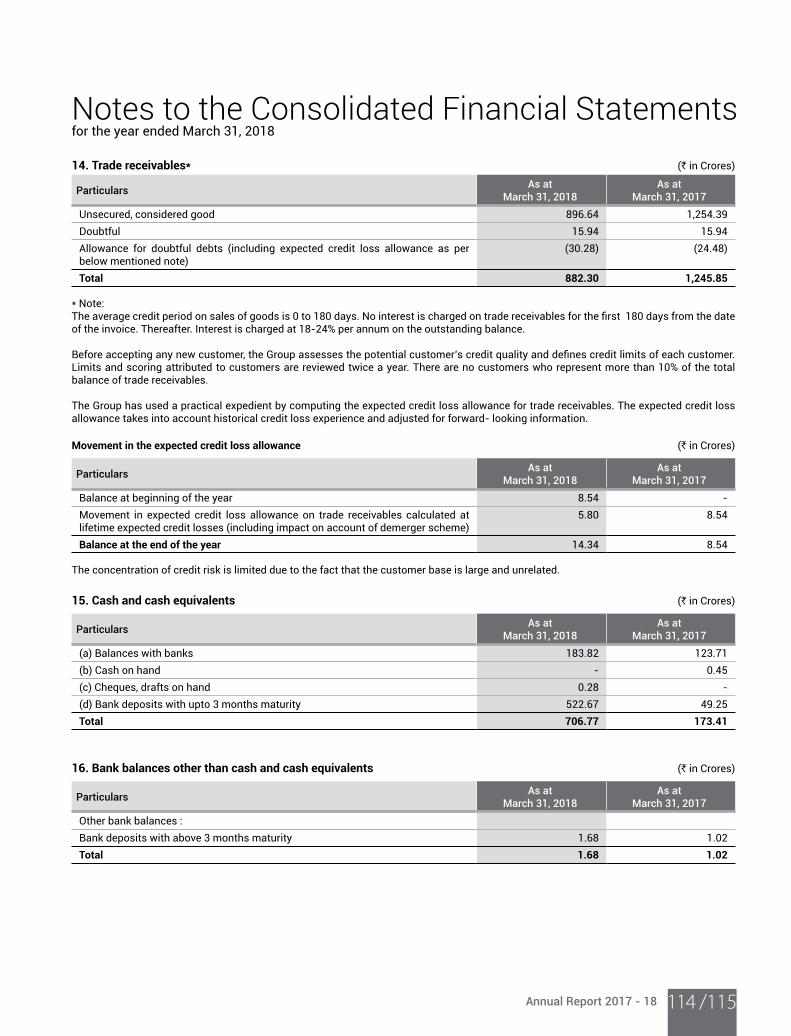
Annual Report 2017 - 18 /115114
Notes to the Consolidated Financial Statementsfor the year ended March 31, 2018
14. Trade receivables* (` in Crores)
ParticularsAs at
March 31, 2018As at
March 31, 2017
Unsecured, considered good 896.64 1,254.39 Doubtful 15.94 15.94 Allowance for doubtful debts (including expected credit loss allowance as per below mentioned note)
(30.28) (24.48)
Total 882.30 1,245.85
* Note: The average credit period on sales of goods is 0 to 180 days. No interest is charged on trade receivables for the first 180 days from the date of the invoice. Thereafter. Interest is charged at 18-24% per annum on the outstanding balance. Before accepting any new customer, the Group assesses the potential customer’s credit quality and defines credit limits of each customer. Limits and scoring attributed to customers are reviewed twice a year. There are no customers who represent more than 10% of the total balance of trade receivables. The Group has used a practical expedient by computing the expected credit loss allowance for trade receivables. The expected credit loss allowance takes into account historical credit loss experience and adjusted for forward- looking information.
Movement in the expected credit loss allowance (` in Crores)
ParticularsAs at
March 31, 2018As at
March 31, 2017
Balance at beginning of the year 8.54 - Movement in expected credit loss allowance on trade receivables calculated at lifetime expected credit losses (including impact on account of demerger scheme)
5.80 8.54
Balance at the end of the year 14.34 8.54
The concentration of credit risk is limited due to the fact that the customer base is large and unrelated.
15. Cash and cash equivalents (` in Crores)
ParticularsAs at
March 31, 2018As at
March 31, 2017
(a) Balances with banks 183.82 123.71 (b) Cash on hand - 0.45 (c) Cheques, drafts on hand 0.28 - (d) Bank deposits with upto 3 months maturity 522.67 49.25 Total 706.77 173.41
16. Bank balances other than cash and cash equivalents (` in Crores)
ParticularsAs at
March 31, 2018As at
March 31, 2017
Other bank balances :Bank deposits with above 3 months maturity 1.68 1.02 Total 1.68 1.02
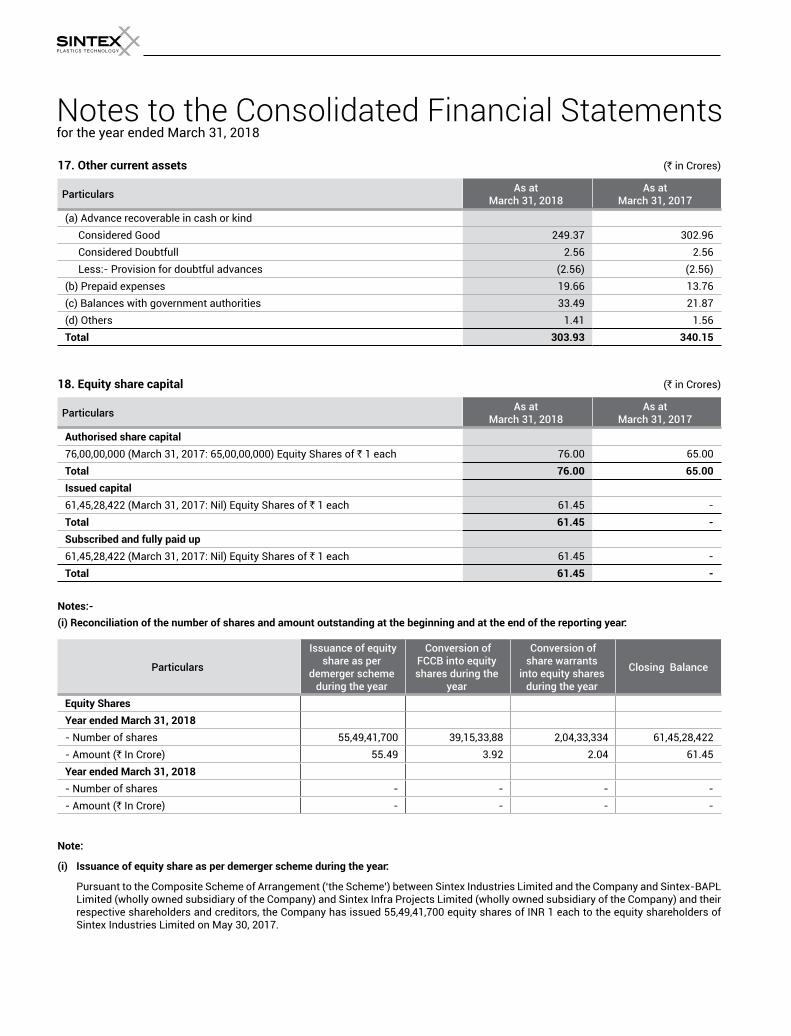
Notes to the Consolidated Financial Statementsfor the year ended March 31, 2018
17. Other current assets (` in Crores)
ParticularsAs at
March 31, 2018As at
March 31, 2017
(a) Advance recoverable in cash or kind Considered Good 249.37 302.96 Considered Doubtfull 2.56 2.56 Less:- Provision for doubtful advances (2.56) (2.56)(b) Prepaid expenses 19.66 13.76 (c) Balances with government authorities 33.49 21.87 (d) Others 1.41 1.56 Total 303.93 340.15
18. Equity share capital (` in Crores)
ParticularsAs at
March 31, 2018As at
March 31, 2017
Authorised share capital
76,00,00,000 (March 31, 2017: 65,00,00,000) Equity Shares of ` 1 each 76.00 65.00 Total 76.00 65.00
Issued capital
61,45,28,422 (March 31, 2017: Nil) Equity Shares of ` 1 each 61.45 - Total 61.45 -
Subscribed and fully paid up
61,45,28,422 (March 31, 2017: Nil) Equity Shares of ` 1 each 61.45 - Total 61.45 -
Notes:-
(i) Reconciliation of the number of shares and amount outstanding at the beginning and at the end of the reporting year:
Particulars
Issuance of equity share as per
demerger scheme during the year
Conversion of FCCB into equity shares during the
year
Conversion of share warrants
into equity shares during the year
Closing Balance
Equity Shares
Year ended March 31, 2018
- Number of shares 55,49,41,700 39,15,33,88 2,04,33,334 61,45,28,422 - Amount (` In Crore) 55.49 3.92 2.04 61.45 Year ended March 31, 2018
- Number of shares - - - - - Amount (` In Crore) - - - -
Note:
(i) Issuance of equity share as per demerger scheme during the year:
Pursuant to the Composite Scheme of Arrangement (‘the Scheme’) between Sintex Industries Limited and the Company and Sintex-BAPL Limited (wholly owned subsidiary of the Company) and Sintex Infra Projects Limited (wholly owned subsidiary of the Company) and their respective shareholders and creditors, the Company has issued 55,49,41,700 equity shares of INR 1 each to the equity shareholders of Sintex Industries Limited on May 30, 2017.
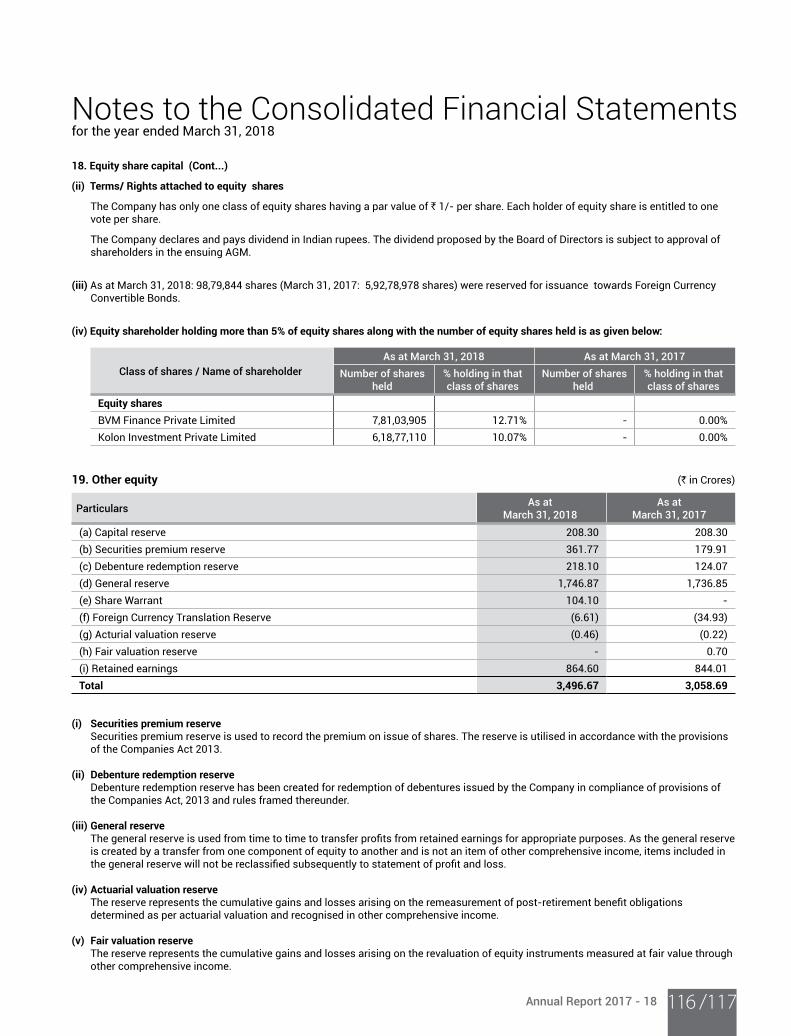
Annual Report 2017 - 18 /117116
Notes to the Consolidated Financial Statementsfor the year ended March 31, 2018
18. Equity share capital (Cont...)
(ii) Terms/ Rights attached to equity shares
The Company has only one class of equity shares having a par value of ` 1/- per share. Each holder of equity share is entitled to one vote per share.
The Company declares and pays dividend in Indian rupees. The dividend proposed by the Board of Directors is subject to approval of shareholders in the ensuing AGM.
(iii) As at March 31, 2018: 98,79,844 shares (March 31, 2017: 5,92,78,978 shares) were reserved for issuance towards Foreign Currency Convertible Bonds.
(iv) Equity shareholder holding more than 5% of equity shares along with the number of equity shares held is as given below:
Class of shares / Name of shareholder
As at March 31, 2018 As at March 31, 2017
Number of shares held
% holding in that class of shares
Number of shares held
% holding in that class of shares
Equity shares
BVM Finance Private Limited 7,81,03,905 12.71% - 0.00%Kolon Investment Private Limited 6,18,77,110 10.07% - 0.00%
19. Other equity (` in Crores)
ParticularsAs at
March 31, 2018As at
March 31, 2017
(a) Capital reserve 208.30 208.30 (b) Securities premium reserve 361.77 179.91 (c) Debenture redemption reserve 218.10 124.07 (d) General reserve 1,746.87 1,736.85 (e) Share Warrant 104.10 - (f) Foreign Currency Translation Reserve (6.61) (34.93)(g) Acturial valuation reserve (0.46) (0.22)(h) Fair valuation reserve - 0.70 (i) Retained earnings 864.60 844.01 Total 3,496.67 3,058.69
(i) Securities premium reserve Securities premium reserve is used to record the premium on issue of shares. The reserve is utilised in accordance with the provisions
of the Companies Act 2013. (ii) Debenture redemption reserve Debenture redemption reserve has been created for redemption of debentures issued by the Company in compliance of provisions of
the Companies Act, 2013 and rules framed thereunder. (iii) General reserve The general reserve is used from time to time to transfer profits from retained earnings for appropriate purposes. As the general reserve
is created by a transfer from one component of equity to another and is not an item of other comprehensive income, items included in the general reserve will not be reclassified subsequently to statement of profit and loss.
(iv) Actuarial valuation reserve The reserve represents the cumulative gains and losses arising on the remeasurement of post-retirement benefit obligations
determined as per actuarial valuation and recognised in other comprehensive income. (v) Fair valuation reserve The reserve represents the cumulative gains and losses arising on the revaluation of equity instruments measured at fair value through
other comprehensive income.
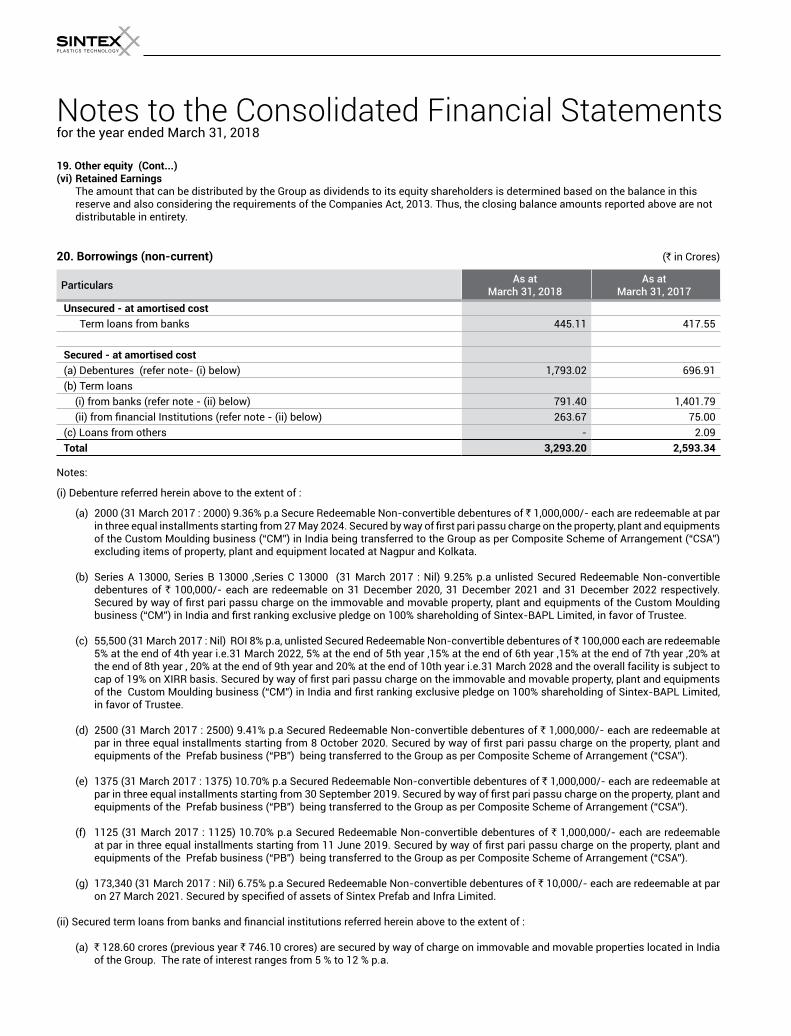
Notes to the Consolidated Financial Statementsfor the year ended March 31, 2018
19. Other equity (Cont...)(vi) Retained Earnings The amount that can be distributed by the Group as dividends to its equity shareholders is determined based on the balance in this
reserve and also considering the requirements of the Companies Act, 2013. Thus, the closing balance amounts reported above are not distributable in entirety.
20. Borrowings (non-current) (` in Crores)
ParticularsAs at
March 31, 2018As at
March 31, 2017
Unsecured - at amortised cost
Term loans from banks 445.11 417.55
Secured - at amortised cost
(a) Debentures (refer note- (i) below) 1,793.02 696.91 (b) Term loans
(i) from banks (refer note - (ii) below) 791.40 1,401.79 (ii) from financial Institutions (refer note - (ii) below) 263.67 75.00
(c) Loans from others - 2.09 Total 3,293.20 2,593.34
Notes:
(i) Debenture referred herein above to the extent of :
(a) 2000 (31 March 2017 : 2000) 9.36% p.a Secure Redeemable Non-convertible debentures of ` 1,000,000/- each are redeemable at par in three equal installments starting from 27 May 2024. Secured by way of first pari passu charge on the property, plant and equipments of the Custom Moulding business (“CM”) in India being transferred to the Group as per Composite Scheme of Arrangement (“CSA”) excluding items of property, plant and equipment located at Nagpur and Kolkata.
(b) Series A 13000, Series B 13000 ,Series C 13000 (31 March 2017 : Nil) 9.25% p.a unlisted Secured Redeemable Non-convertible
debentures of ` 100,000/- each are redeemable on 31 December 2020, 31 December 2021 and 31 December 2022 respectively. Secured by way of first pari passu charge on the immovable and movable property, plant and equipments of the Custom Moulding business (“CM”) in India and first ranking exclusive pledge on 100% shareholding of Sintex-BAPL Limited, in favor of Trustee.
(c) 55,500 (31 March 2017 : Nil) ROI 8% p.a, unlisted Secured Redeemable Non-convertible debentures of 100,000 each are redeemable 5% at the end of 4th year i.e.31 March 2022, 5% at the end of 5th year ,15% at the end of 6th year ,15% at the end of 7th year ,20% at the end of 8th year , 20% at the end of 9th year and 20% at the end of 10th year i.e.31 March 2028 and the overall facility is subject to cap of 19% on XIRR basis. Secured by way of first pari passu charge on the immovable and movable property, plant and equipments of the Custom Moulding business (“CM”) in India and first ranking exclusive pledge on 100% shareholding of Sintex-BAPL Limited, in favor of Trustee.
(d) 2500 (31 March 2017 : 2500) 9.41% p.a Secured Redeemable Non-convertible debentures of ` 1,000,000/- each are redeemable at par in three equal installments starting from 8 October 2020. Secured by way of first pari passu charge on the property, plant and equipments of the Prefab business (“PB”) being transferred to the Group as per Composite Scheme of Arrangement (“CSA”).
(e) 1375 (31 March 2017 : 1375) 10.70% p.a Secured Redeemable Non-convertible debentures of ` 1,000,000/- each are redeemable at par in three equal installments starting from 30 September 2019. Secured by way of first pari passu charge on the property, plant and equipments of the Prefab business (“PB”) being transferred to the Group as per Composite Scheme of Arrangement (“CSA”).
(f) 1125 (31 March 2017 : 1125) 10.70% p.a Secured Redeemable Non-convertible debentures of ` 1,000,000/- each are redeemable at par in three equal installments starting from 11 June 2019. Secured by way of first pari passu charge on the property, plant and equipments of the Prefab business (“PB”) being transferred to the Group as per Composite Scheme of Arrangement (“CSA”).
(g) 173,340 (31 March 2017 : Nil) 6.75% p.a Secured Redeemable Non-convertible debentures of ` 10,000/- each are redeemable at par on 27 March 2021. Secured by specified of assets of Sintex Prefab and Infra Limited.
(ii) Secured term loans from banks and financial institutions referred herein above to the extent of :
(a) ` 128.60 crores (previous year ` 746.10 crores) are secured by way of charge on immovable and movable properties located in India
of the Group. The rate of interest ranges from 5 % to 12 % p.a.
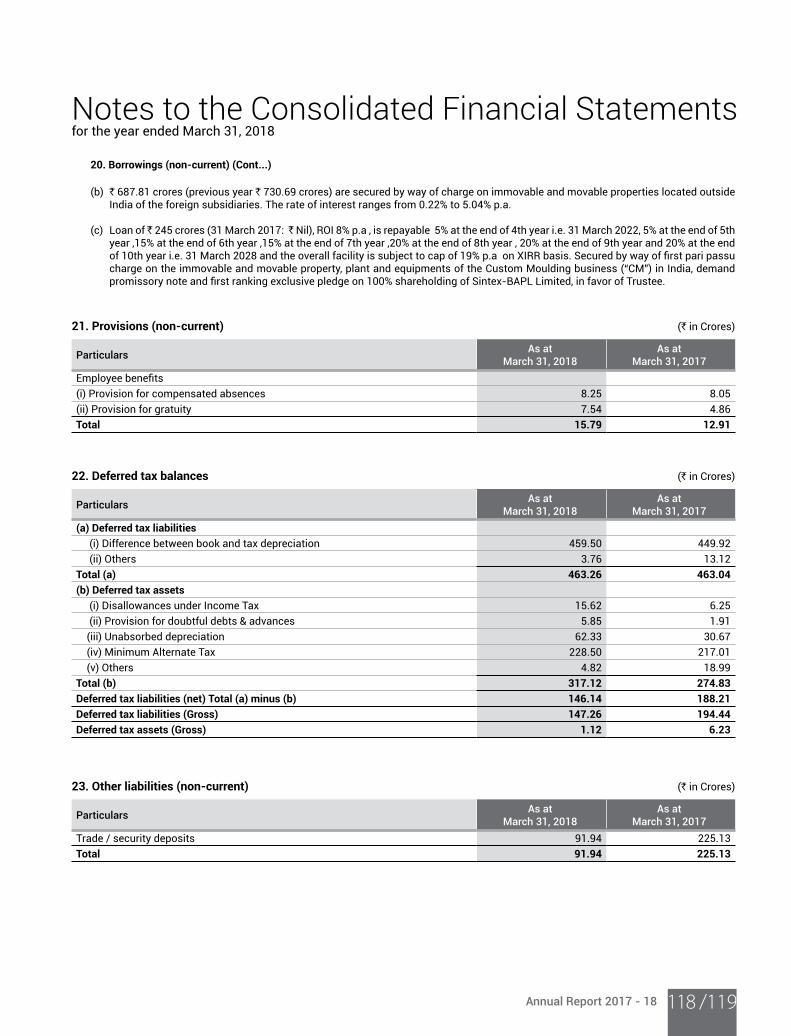
Annual Report 2017 - 18 /119118
Notes to the Consolidated Financial Statementsfor the year ended March 31, 2018
20. Borrowings (non-current) (Cont...)
(b) ` 687.81 crores (previous year ` 730.69 crores) are secured by way of charge on immovable and movable properties located outside India of the foreign subsidiaries. The rate of interest ranges from 0.22% to 5.04% p.a.
(c) Loan of 245 crores (31 March 2017: Nil), ROI 8% p.a , is repayable 5% at the end of 4th year i.e. 31 March 2022, 5% at the end of 5th
year ,15% at the end of 6th year ,15% at the end of 7th year ,20% at the end of 8th year , 20% at the end of 9th year and 20% at the end of 10th year i.e. 31 March 2028 and the overall facility is subject to cap of 19% p.a on XIRR basis. Secured by way of first pari passu charge on the immovable and movable property, plant and equipments of the Custom Moulding business (“CM”) in India, demand promissory note and first ranking exclusive pledge on 100% shareholding of Sintex-BAPL Limited, in favor of Trustee.
21. Provisions (non-current) (` in Crores)
ParticularsAs at
March 31, 2018As at
March 31, 2017
Employee benefits (i) Provision for compensated absences 8.25 8.05 (ii) Provision for gratuity 7.54 4.86 Total 15.79 12.91
22. Deferred tax balances (` in Crores)
ParticularsAs at
March 31, 2018As at
March 31, 2017
(a) Deferred tax liabilities
(i) Difference between book and tax depreciation 459.50 449.92 (ii) Others 3.76 13.12 Total (a) 463.26 463.04
(b) Deferred tax assets
(i) Disallowances under Income Tax 15.62 6.25 (ii) Provision for doubtful debts & advances 5.85 1.91 (iii) Unabsorbed depreciation 62.33 30.67 (iv) Minimum Alternate Tax 228.50 217.01 (v) Others 4.82 18.99 Total (b) 317.12 274.83
Deferred tax liabilities (net) Total (a) minus (b) 146.14 188.21
Deferred tax liabilities (Gross) 147.26 194.44
Deferred tax assets (Gross) 1.12 6.23
23. Other liabilities (non-current) (` in Crores)
ParticularsAs at
March 31, 2018As at
March 31, 2017
Trade / security deposits 91.94 225.13 Total 91.94 225.13
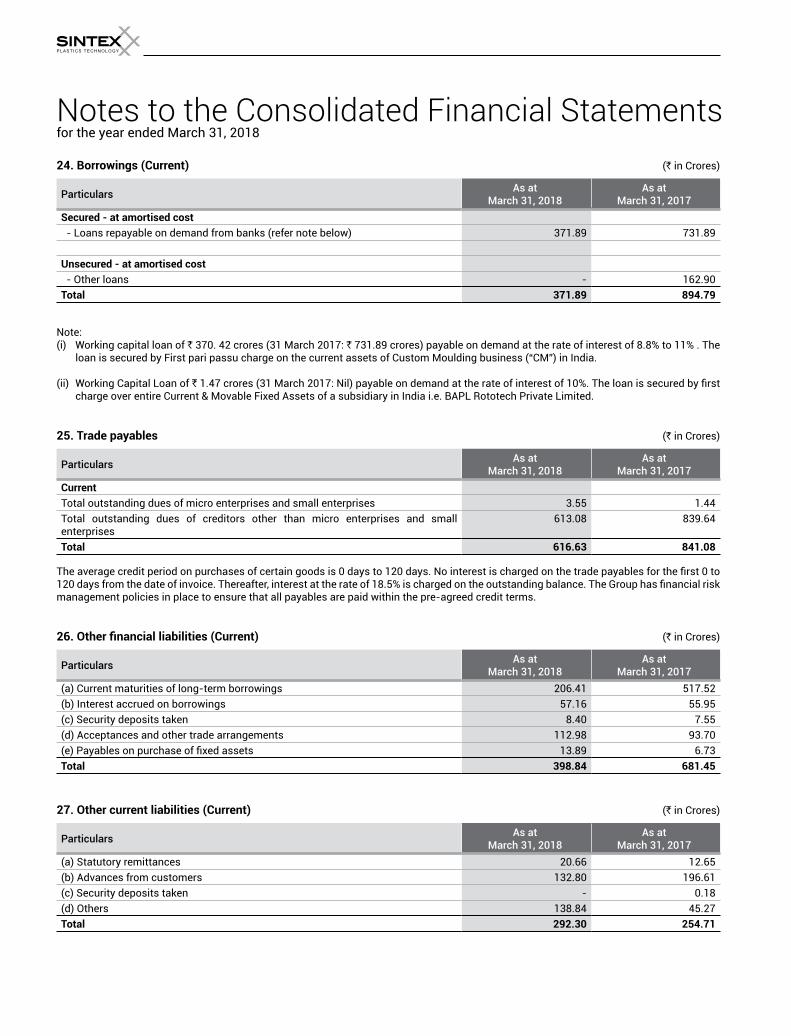
Notes to the Consolidated Financial Statementsfor the year ended March 31, 2018
24. Borrowings (Current) (` in Crores)
ParticularsAs at
March 31, 2018As at
March 31, 2017
Secured - at amortised cost
- Loans repayable on demand from banks (refer note below) 371.89 731.89
Unsecured - at amortised cost
- Other loans - 162.90 Total 371.89 894.79
Note: (i) Working capital loan of ` 370. 42 crores (31 March 2017: ` 731.89 crores) payable on demand at the rate of interest of 8.8% to 11% . The
loan is secured by First pari passu charge on the current assets of Custom Moulding business (“CM”) in India. (ii) Working Capital Loan of ` 1.47 crores (31 March 2017: Nil) payable on demand at the rate of interest of 10%. The loan is secured by first
charge over entire Current & Movable Fixed Assets of a subsidiary in India i.e. BAPL Rototech Private Limited.
25. Trade payables (` in Crores)
ParticularsAs at
March 31, 2018As at
March 31, 2017
Current
Total outstanding dues of micro enterprises and small enterprises 3.55 1.44 Total outstanding dues of creditors other than micro enterprises and small enterprises
613.08 839.64
Total 616.63 841.08
The average credit period on purchases of certain goods is 0 days to 120 days. No interest is charged on the trade payables for the first 0 to 120 days from the date of invoice. Thereafter, interest at the rate of 18.5% is charged on the outstanding balance. The Group has financial risk management policies in place to ensure that all payables are paid within the pre-agreed credit terms.
26. Other financial liabilities (Current) (` in Crores)
ParticularsAs at
March 31, 2018As at
March 31, 2017
(a) Current maturities of long-term borrowings 206.41 517.52 (b) Interest accrued on borrowings 57.16 55.95 (c) Security deposits taken 8.40 7.55 (d) Acceptances and other trade arrangements 112.98 93.70 (e) Payables on purchase of fixed assets 13.89 6.73 Total 398.84 681.45
27. Other current liabilities (Current) (` in Crores)
ParticularsAs at
March 31, 2018As at
March 31, 2017
(a) Statutory remittances 20.66 12.65 (b) Advances from customers 132.80 196.61 (c) Security deposits taken - 0.18 (d) Others 138.84 45.27 Total 292.30 254.71
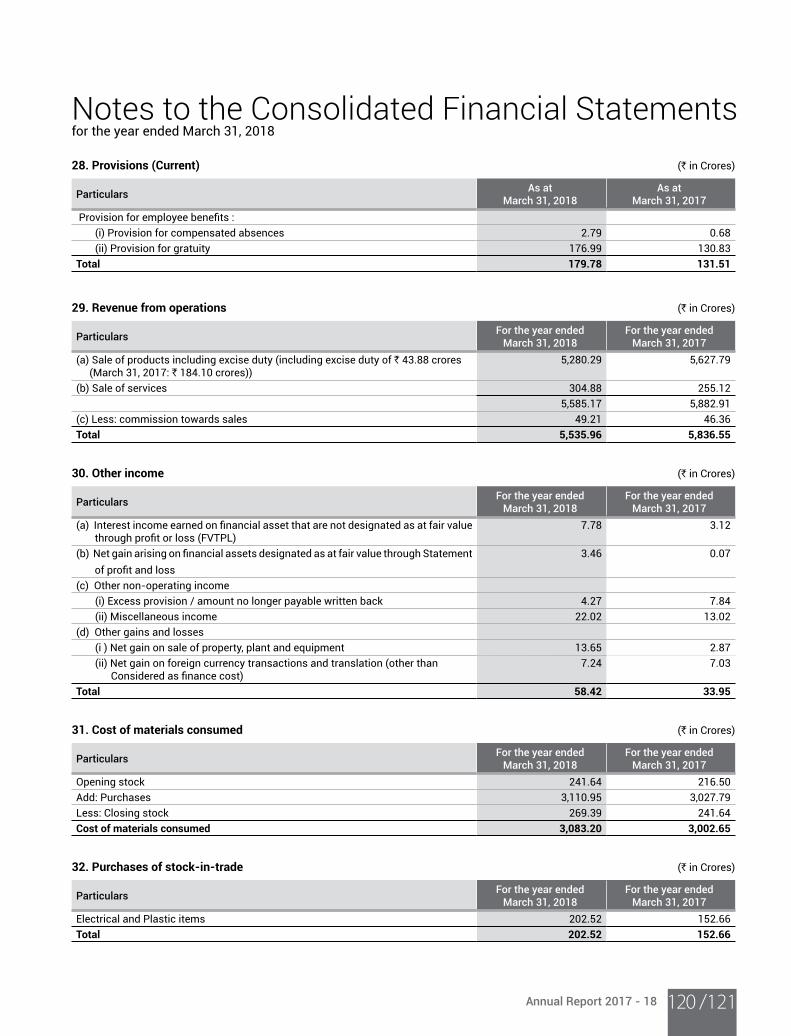
Annual Report 2017 - 18 /121120
Notes to the Consolidated Financial Statementsfor the year ended March 31, 2018
28. Provisions (Current) (` in Crores)
ParticularsAs at
March 31, 2018As at
March 31, 2017
Provision for employee benefits :(i) Provision for compensated absences 2.79 0.68 (ii) Provision for gratuity 176.99 130.83
Total 179.78 131.51
29. Revenue from operations (` in Crores)
ParticularsFor the year ended
March 31, 2018 For the year ended
March 31, 2017
(a) Sale of products including excise duty (including excise duty of ` 43.88 crores (March 31, 2017: ` 184.10 crores))
5,280.29 5,627.79
(b) Sale of services 304.88 255.12 5,585.17 5,882.91
(c) Less: commission towards sales 49.21 46.36 Total 5,535.96 5,836.55
30. Other income (` in Crores)
ParticularsFor the year ended
March 31, 2018 For the year ended
March 31, 2017
(a) Interest income earned on financial asset that are not designated as at fair value through profit or loss (FVTPL)
7.78 3.12
(b) Net gain arising on financial assets designated as at fair value through Statement of profit and loss
3.46 0.07
(c) Other non-operating income(i) Excess provision / amount no longer payable written back 4.27 7.84 (ii) Miscellaneous income 22.02 13.02
(d) Other gains and losses(i ) Net gain on sale of property, plant and equipment 13.65 2.87 (ii) Net gain on foreign currency transactions and translation (other than Considered as finance cost)
7.24 7.03
Total 58.42 33.95
31. Cost of materials consumed (` in Crores)
ParticularsFor the year ended
March 31, 2018 For the year ended
March 31, 2017
Opening stock 241.64 216.50 Add: Purchases 3,110.95 3,027.79 Less: Closing stock 269.39 241.64 Cost of materials consumed 3,083.20 3,002.65
32. Purchases of stock-in-trade (` in Crores)
ParticularsFor the year ended
March 31, 2018 For the year ended
March 31, 2017
Electrical and Plastic items 202.52 152.66 Total 202.52 152.66
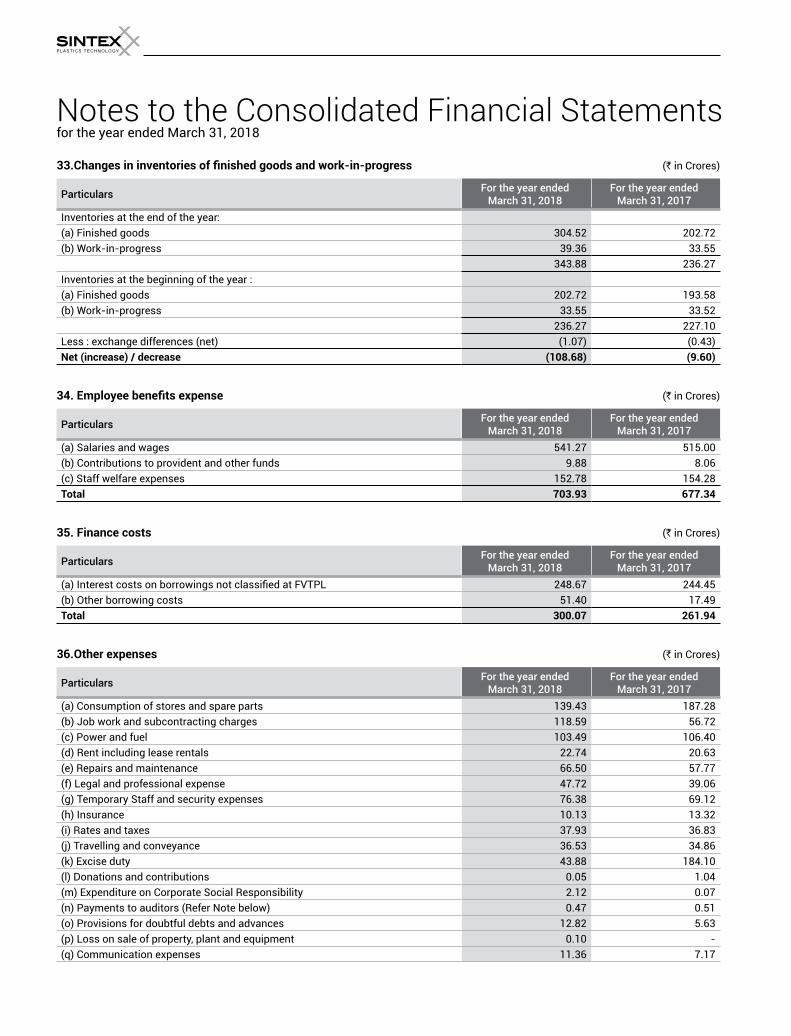
Notes to the Consolidated Financial Statementsfor the year ended March 31, 2018
33.Changes in inventories of finished goods and work-in-progress (` in Crores)
ParticularsFor the year ended
March 31, 2018 For the year ended
March 31, 2017
Inventories at the end of the year:(a) Finished goods 304.52 202.72 (b) Work-in-progress 39.36 33.55
343.88 236.27 Inventories at the beginning of the year :(a) Finished goods 202.72 193.58 (b) Work-in-progress 33.55 33.52
236.27 227.10 Less : exchange differences (net) (1.07) (0.43)Net (increase) / decrease (108.68) (9.60)
34. Employee benefits expense (` in Crores)
ParticularsFor the year ended
March 31, 2018 For the year ended
March 31, 2017
(a) Salaries and wages 541.27 515.00 (b) Contributions to provident and other funds 9.88 8.06 (c) Staff welfare expenses 152.78 154.28 Total 703.93 677.34
35. Finance costs (` in Crores)
ParticularsFor the year ended
March 31, 2018 For the year ended
March 31, 2017
(a) Interest costs on borrowings not classified at FVTPL 248.67 244.45 (b) Other borrowing costs 51.40 17.49 Total 300.07 261.94
36.Other expenses (` in Crores)
ParticularsFor the year ended
March 31, 2018 For the year ended
March 31, 2017
(a) Consumption of stores and spare parts 139.43 187.28 (b) Job work and subcontracting charges 118.59 56.72 (c) Power and fuel 103.49 106.40 (d) Rent including lease rentals 22.74 20.63 (e) Repairs and maintenance 66.50 57.77 (f) Legal and professional expense 47.72 39.06 (g) Temporary Staff and security expenses 76.38 69.12 (h) Insurance 10.13 13.32 (i) Rates and taxes 37.93 36.83 (j) Travelling and conveyance 36.53 34.86 (k) Excise duty 43.88 184.10 (l) Donations and contributions 0.05 1.04 (m) Expenditure on Corporate Social Responsibility 2.12 0.07 (n) Payments to auditors (Refer Note below) 0.47 0.51 (o) Provisions for doubtful debts and advances 12.82 5.63 (p) Loss on sale of property, plant and equipment 0.10 - (q) Communication expenses 11.36 7.17
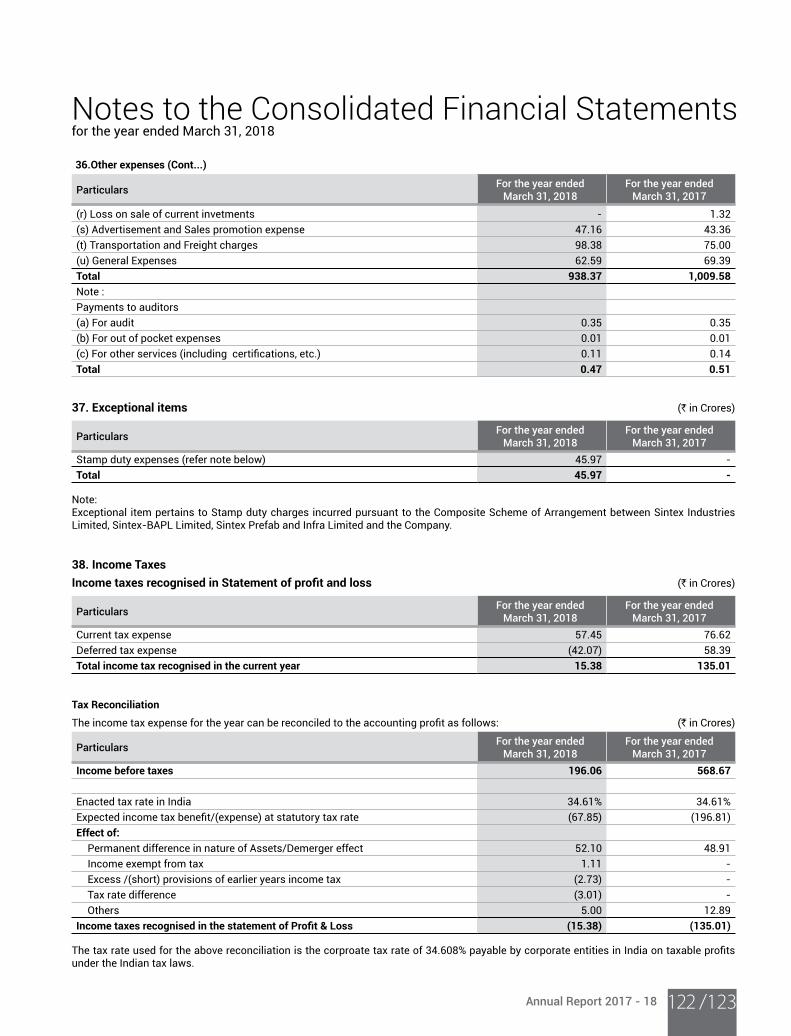
Annual Report 2017 - 18 /123122
Notes to the Consolidated Financial Statementsfor the year ended March 31, 2018
ParticularsFor the year ended
March 31, 2018 For the year ended
March 31, 2017
(r) Loss on sale of current invetments - 1.32 (s) Advertisement and Sales promotion expense 47.16 43.36 (t) Transportation and Freight charges 98.38 75.00 (u) General Expenses 62.59 69.39 Total 938.37 1,009.58
Note :Payments to auditors(a) For audit 0.35 0.35 (b) For out of pocket expenses 0.01 0.01 (c) For other services (including certifications, etc.) 0.11 0.14 Total 0.47 0.51
37. Exceptional items (` in Crores)
ParticularsFor the year ended
March 31, 2018 For the year ended
March 31, 2017
Stamp duty expenses (refer note below) 45.97 - Total 45.97 -
Note: Exceptional item pertains to Stamp duty charges incurred pursuant to the Composite Scheme of Arrangement between Sintex Industries Limited, Sintex-BAPL Limited, Sintex Prefab and Infra Limited and the Company.
38. Income Taxes
Income taxes recognised in Statement of profit and loss (` in Crores)
ParticularsFor the year ended
March 31, 2018 For the year ended
March 31, 2017
Current tax expense 57.45 76.62Deferred tax expense (42.07) 58.39Total income tax recognised in the current year 15.38 135.01
Tax Reconciliation
The income tax expense for the year can be reconciled to the accounting profit as follows: (` in Crores)
ParticularsFor the year ended
March 31, 2018 For the year ended
March 31, 2017
Income before taxes 196.06 568.67
Enacted tax rate in India 34.61% 34.61%Expected income tax benefit/(expense) at statutory tax rate (67.85) (196.81)Effect of:
Permanent difference in nature of Assets/Demerger effect 52.10 48.91 Income exempt from tax 1.11 - Excess /(short) provisions of earlier years income tax (2.73) - Tax rate difference (3.01) - Others 5.00 12.89
Income taxes recognised in the statement of Profit & Loss (15.38) (135.01)
The tax rate used for the above reconciliation is the corproate tax rate of 34.608% payable by corporate entities in India on taxable profits under the Indian tax laws.
36.Other expenses (Cont...)
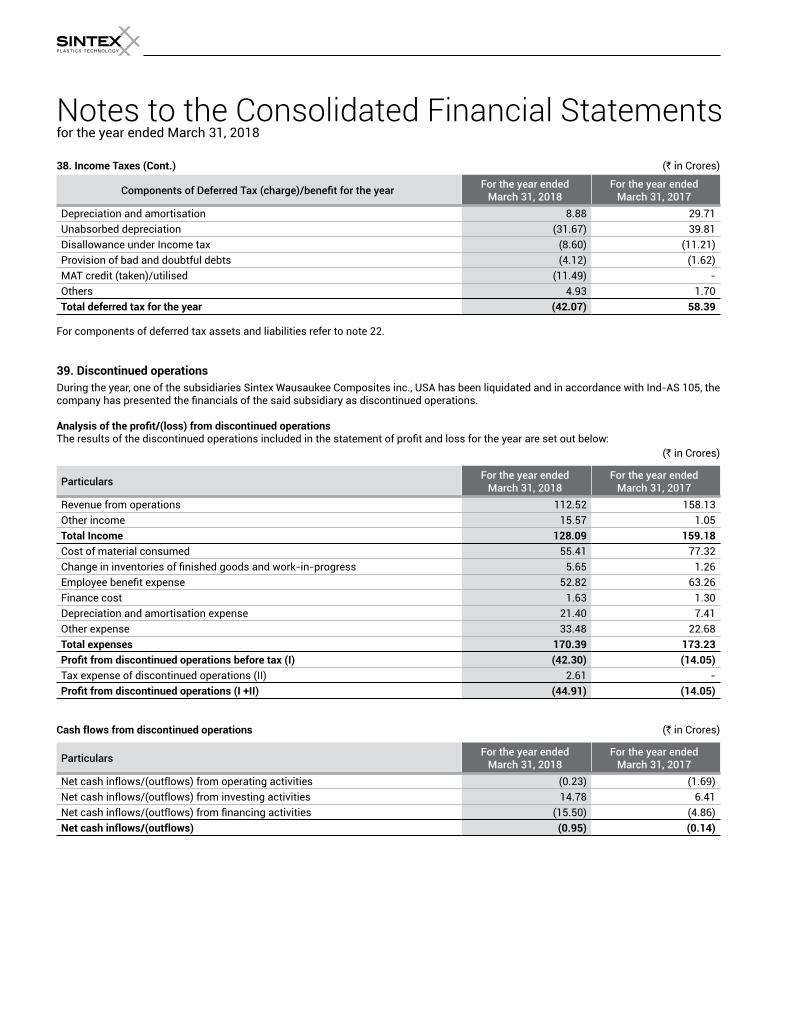
Notes to the Consolidated Financial Statementsfor the year ended March 31, 2018
38. Income Taxes (Cont.) (` in Crores)
Components of Deferred Tax (charge)/benefit for the year For the year ended March 31, 2018
For the year ended March 31, 2017
Depreciation and amortisation 8.88 29.71 Unabsorbed depreciation (31.67) 39.81 Disallowance under Income tax (8.60) (11.21)Provision of bad and doubtful debts (4.12) (1.62)MAT credit (taken)/utilised (11.49) - Others 4.93 1.70 Total deferred tax for the year (42.07) 58.39
For components of deferred tax assets and liabilities refer to note 22.
39. Discontinued operations
During the year, one of the subsidiaries Sintex Wausaukee Composites inc., USA has been liquidated and in accordance with Ind-AS 105, the company has presented the financials of the said subsidiary as discontinued operations. Analysis of the profit/(loss) from discontinued operations The results of the discontinued operations included in the statement of profit and loss for the year are set out below: (` in Crores)
ParticularsFor the year ended
March 31, 2018 For the year ended
March 31, 2017
Revenue from operations 112.52 158.13 Other income 15.57 1.05 Total Income 128.09 159.18
Cost of material consumed 55.41 77.32 Change in inventories of finished goods and work-in-progress 5.65 1.26 Employee benefit expense 52.82 63.26 Finance cost 1.63 1.30 Depreciation and amortisation expense 21.40 7.41 Other expense 33.48 22.68 Total expenses 170.39 173.23
Profit from discontinued operations before tax (I) (42.30) (14.05)
Tax expense of discontinued operations (II) 2.61 - Profit from discontinued operations (I +II) (44.91) (14.05)
Cash flows from discontinued operations (` in Crores)
ParticularsFor the year ended
March 31, 2018 For the year ended
March 31, 2017
Net cash inflows/(outflows) from operating activities (0.23) (1.69)Net cash inflows/(outflows) from investing activities 14.78 6.41Net cash inflows/(outflows) from financing activities (15.50) (4.86)Net cash inflows/(outflows) (0.95) (0.14)
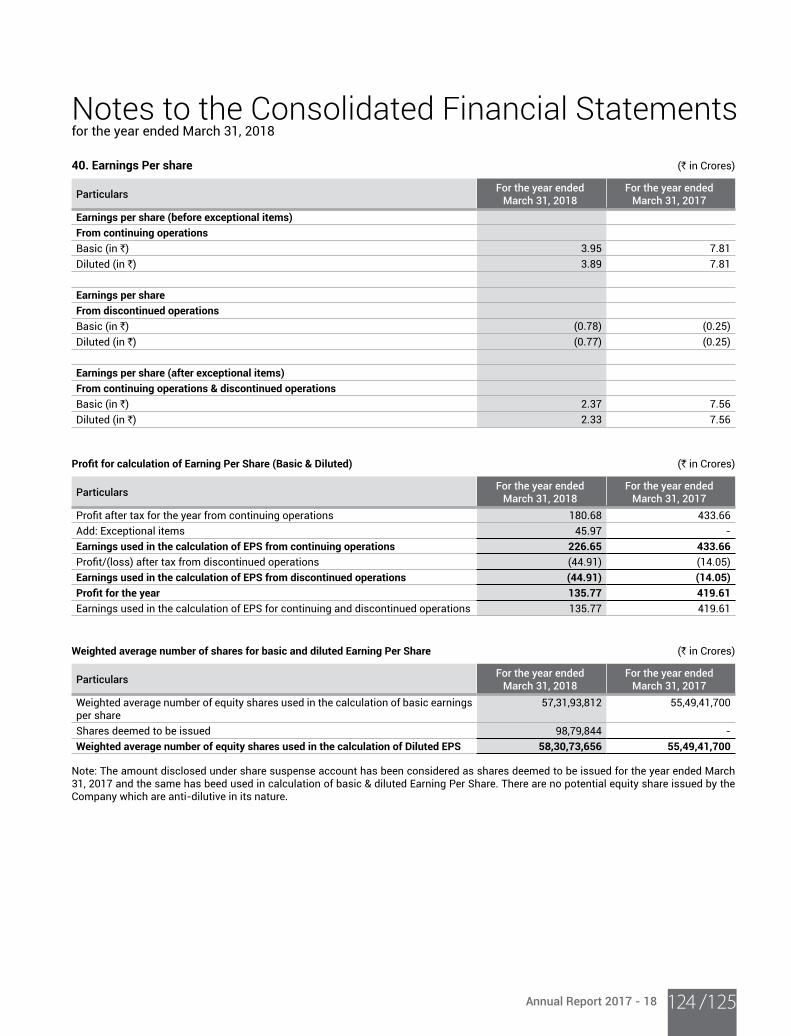
Annual Report 2017 - 18 /125124
Notes to the Consolidated Financial Statementsfor the year ended March 31, 2018
40. Earnings Per share (` in Crores)
ParticularsFor the year ended
March 31, 2018 For the year ended
March 31, 2017
Earnings per share (before exceptional items)
From continuing operations
Basic (in `) 3.95 7.81 Diluted (in `) 3.89 7.81
Earnings per share
From discontinued operations
Basic (in `) (0.78) (0.25)Diluted (in `) (0.77) (0.25)
Earnings per share (after exceptional items)
From continuing operations & discontinued operations
Basic (in `) 2.37 7.56 Diluted (in `) 2.33 7.56
Profit for calculation of Earning Per Share (Basic & Diluted) (` in Crores)
ParticularsFor the year ended
March 31, 2018 For the year ended
March 31, 2017
Profit after tax for the year from continuing operations 180.68 433.66 Add: Exceptional items 45.97 - Earnings used in the calculation of EPS from continuing operations 226.65 433.66
Profit/(loss) after tax from discontinued operations (44.91) (14.05)Earnings used in the calculation of EPS from discontinued operations (44.91) (14.05)
Profit for the year 135.77 419.61
Earnings used in the calculation of EPS for continuing and discontinued operations 135.77 419.61
Weighted average number of shares for basic and diluted Earning Per Share (` in Crores)
ParticularsFor the year ended
March 31, 2018 For the year ended
March 31, 2017
Weighted average number of equity shares used in the calculation of basic earnings per share
57,31,93,812 55,49,41,700
Shares deemed to be issued 98,79,844 - Weighted average number of equity shares used in the calculation of Diluted EPS 58,30,73,656 55,49,41,700
Note: The amount disclosed under share suspense account has been considered as shares deemed to be issued for the year ended March 31, 2017 and the same has beed used in calculation of basic & diluted Earning Per Share. There are no potential equity share issued by the Company which are anti-dilutive in its nature.
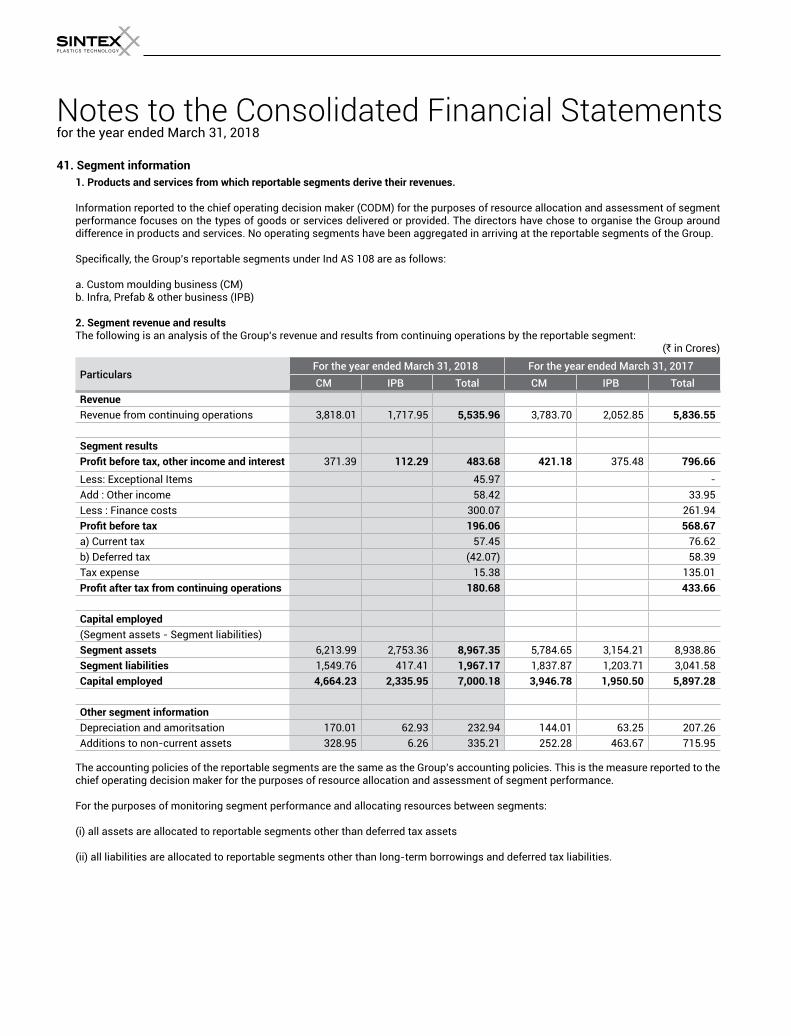
Notes to the Consolidated Financial Statementsfor the year ended March 31, 2018
41. Segment information
1. Products and services from which reportable segments derive their revenues.
Information reported to the chief operating decision maker (CODM) for the purposes of resource allocation and assessment of segment performance focuses on the types of goods or services delivered or provided. The directors have chose to organise the Group around difference in products and services. No operating segments have been aggregated in arriving at the reportable segments of the Group.
Specifically, the Group’s reportable segments under Ind AS 108 are as follows:
a. Custom moulding business (CM) b. Infra, Prefab & other business (IPB)
2. Segment revenue and results The following is an analysis of the Group’s revenue and results from continuing operations by the reportable segment:
(` in Crores)
ParticularsFor the year ended March 31, 2018 For the year ended March 31, 2017
CM IPB Total CM IPB Total
Revenue
Revenue from continuing operations 3,818.01 1,717.95 5,535.96 3,783.70 2,052.85 5,836.55
Segment results
Profit before tax, other income and interest 371.39 112.29 483.68 421.18 375.48 796.66
Less: Exceptional Items 45.97 - Add : Other income 58.42 33.95 Less : Finance costs 300.07 261.94 Profit before tax 196.06 568.67
a) Current tax 57.45 76.62 b) Deferred tax (42.07) 58.39 Tax expense 15.38 135.01 Profit after tax from continuing operations 180.68 433.66
Capital employed
(Segment assets - Segment liabilities)Segment assets 6,213.99 2,753.36 8,967.35 5,784.65 3,154.21 8,938.86 Segment liabilities 1,549.76 417.41 1,967.17 1,837.87 1,203.71 3,041.58 Capital employed 4,664.23 2,335.95 7,000.18 3,946.78 1,950.50 5,897.28
Other segment information
Depreciation and amoritsation 170.01 62.93 232.94 144.01 63.25 207.26 Additions to non-current assets 328.95 6.26 335.21 252.28 463.67 715.95
The accounting policies of the reportable segments are the same as the Group’s accounting policies. This is the measure reported to the chief operating decision maker for the purposes of resource allocation and assessment of segment performance. For the purposes of monitoring segment performance and allocating resources between segments: (i) all assets are allocated to reportable segments other than deferred tax assets (ii) all liabilities are allocated to reportable segments other than long-term borrowings and deferred tax liabilities.
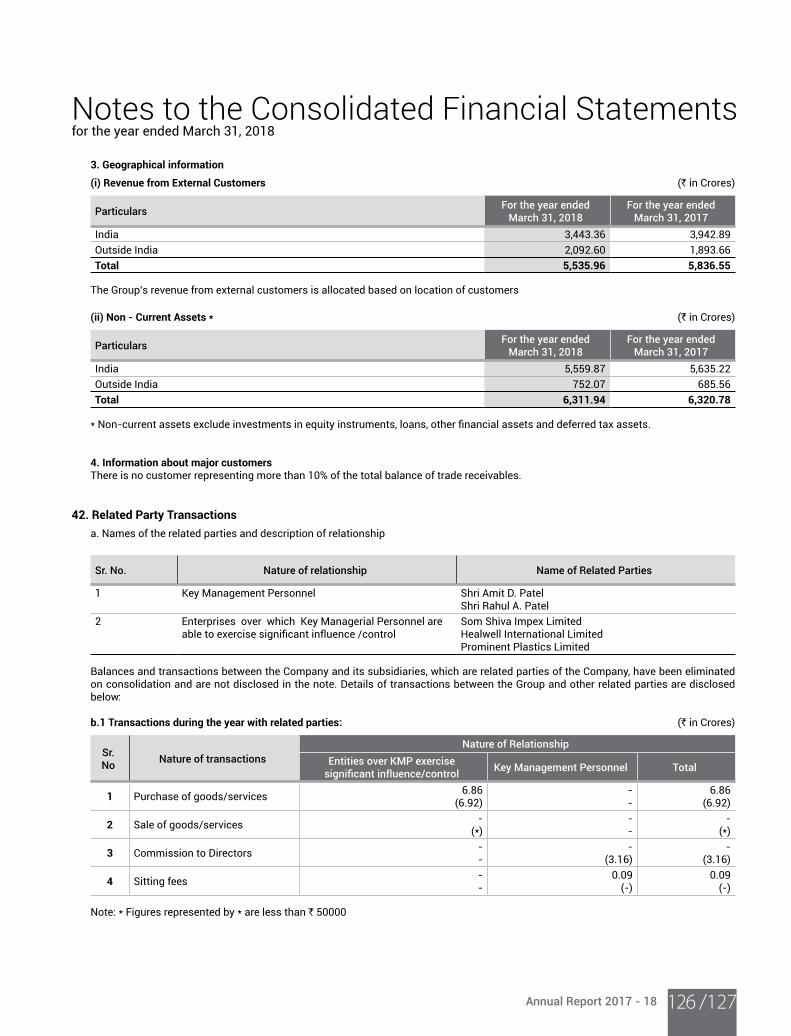
Annual Report 2017 - 18 /127126
Notes to the Consolidated Financial Statementsfor the year ended March 31, 2018
3. Geographical information
(i) Revenue from External Customers (` in Crores)
ParticularsFor the year ended
March 31, 2018 For the year ended
March 31, 2017
India 3,443.36 3,942.89 Outside India 2,092.60 1,893.66 Total 5,535.96 5,836.55
The Group’s revenue from external customers is allocated based on location of customers
(ii) Non - Current Assets * (` in Crores)
ParticularsFor the year ended
March 31, 2018 For the year ended
March 31, 2017
India 5,559.87 5,635.22 Outside India 752.07 685.56 Total 6,311.94 6,320.78
* Non-current assets exclude investments in equity instruments, loans, other financial assets and deferred tax assets.
4. Information about major customers There is no customer representing more than 10% of the total balance of trade receivables.
42. Related Party Transactions
a. Names of the related parties and description of relationship
Sr. No. Nature of relationship Name of Related Parties
1 Key Management Personnel Shri Amit D. Patel Shri Rahul A. Patel
2 Enterprises over which Key Managerial Personnel are able to exercise significant influence /control
Som Shiva Impex Limited Healwell International Limited Prominent Plastics Limited
Balances and transactions between the Company and its subsidiaries, which are related parties of the Company, have been eliminated on consolidation and are not disclosed in the note. Details of transactions between the Group and other related parties are disclosed below:
b.1 Transactions during the year with related parties: (` in Crores)
Sr. No
Nature of transactions
Nature of Relationship
Entities over KMP exercise significant influence/control Key Management Personnel Total
1 Purchase of goods/services 6.86 (6.92)
- -
6.86 (6.92)
2 Sale of goods/services - (*)
- -
- (*)
3 Commission to Directors - -
- (3.16)
- (3.16)
4 Sitting fees - -
0.09 (-)
0.09 (-)
Note: * Figures represented by * are less than ` 50000
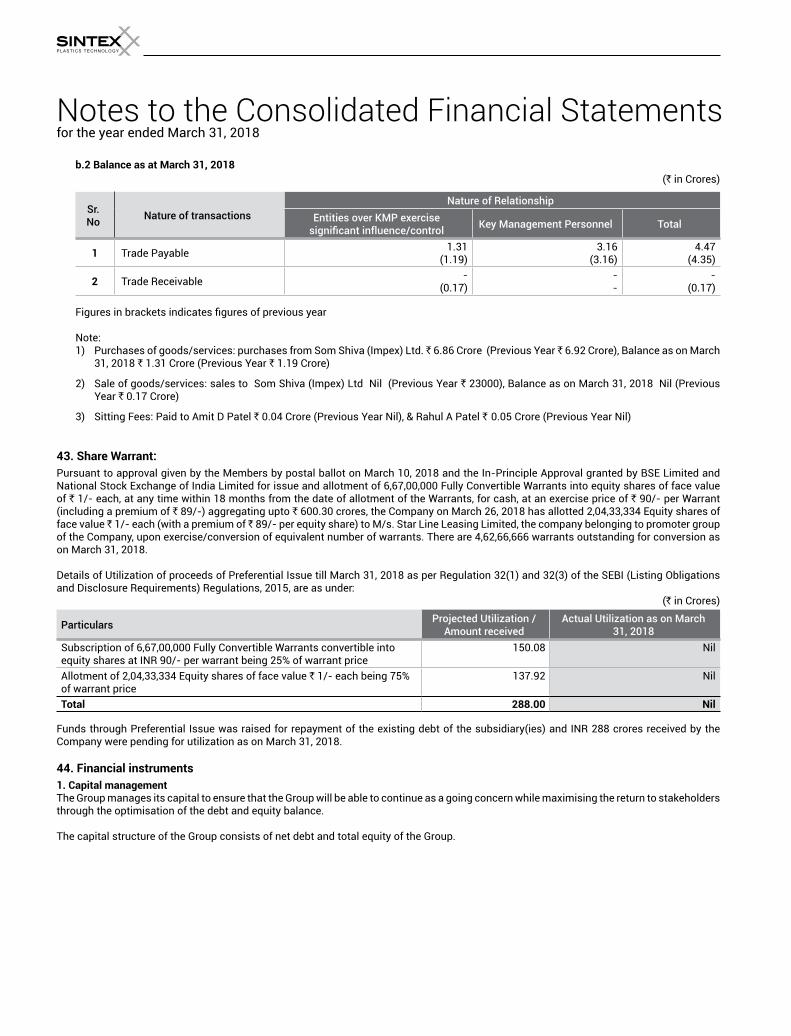
Notes to the Consolidated Financial Statementsfor the year ended March 31, 2018
b.2 Balance as at March 31, 2018
(` in Crores)
Sr. No
Nature of transactions
Nature of Relationship
Entities over KMP exercise significant influence/control Key Management Personnel Total
1 Trade Payable 1.31 (1.19)
3.16 (3.16)
4.47 (4.35)
2 Trade Receivable - (0.17)
--
- (0.17)
Figures in brackets indicates figures of previous year Note: 1) Purchases of goods/services: purchases from Som Shiva (Impex) Ltd. 6.86 Crore (Previous Year 6.92 Crore), Balance as on March
31, 2018 ` 1.31 Crore (Previous Year ` 1.19 Crore)
2) Sale of goods/services: sales to Som Shiva (Impex) Ltd Nil (Previous Year ` 23000), Balance as on March 31, 2018 Nil (Previous Year ` 0.17 Crore)
3) Sitting Fees: Paid to Amit D Patel ` 0.04 Crore (Previous Year Nil), & Rahul A Patel ` 0.05 Crore (Previous Year Nil)
43. Share Warrant:
Pursuant to approval given by the Members by postal ballot on March 10, 2018 and the In-Principle Approval granted by BSE Limited and National Stock Exchange of India Limited for issue and allotment of 6,67,00,000 Fully Convertible Warrants into equity shares of face value of ` 1/- each, at any time within 18 months from the date of allotment of the Warrants, for cash, at an exercise price of ` 90/- per Warrant (including a premium of ` 89/-) aggregating upto ` 600.30 crores, the Company on March 26, 2018 has allotted 2,04,33,334 Equity shares of face value 1/- each (with a premium of 89/- per equity share) to M/s. Star Line Leasing Limited, the company belonging to promoter group of the Company, upon exercise/conversion of equivalent number of warrants. There are 4,62,66,666 warrants outstanding for conversion as on March 31, 2018. Details of Utilization of proceeds of Preferential Issue till March 31, 2018 as per Regulation 32(1) and 32(3) of the SEBI (Listing Obligations and Disclosure Requirements) Regulations, 2015, are as under:
(` in Crores)
Particulars Projected Utilization /
Amount receivedActual Utilization as on March
31, 2018
Subscription of 6,67,00,000 Fully Convertible Warrants convertible into equity shares at INR 90/- per warrant being 25% of warrant price
150.08 Nil
Allotment of 2,04,33,334 Equity shares of face value ` 1/- each being 75% of warrant price
137.92 Nil
Total 288.00 Nil
Funds through Preferential Issue was raised for repayment of the existing debt of the subsidiary(ies) and INR 288 crores received by the Company were pending for utilization as on March 31, 2018.
44. Financial instruments
1. Capital management The Group manages its capital to ensure that the Group will be able to continue as a going concern while maximising the return to stakeholders through the optimisation of the debt and equity balance. The capital structure of the Group consists of net debt and total equity of the Group.
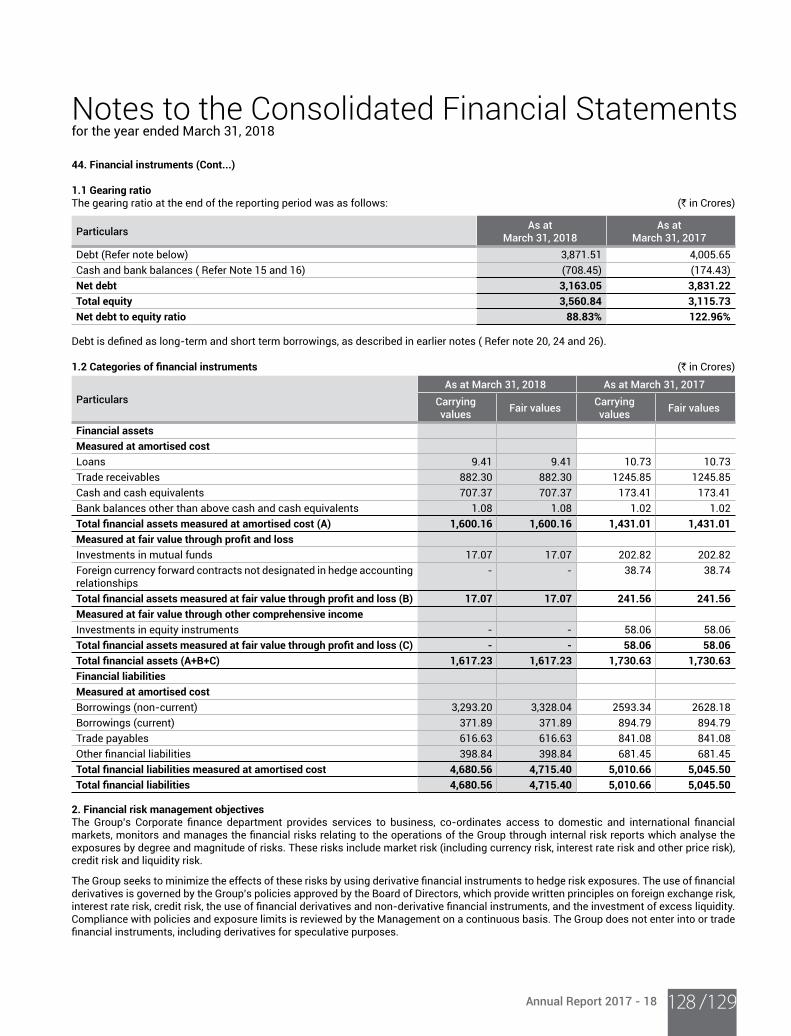
Annual Report 2017 - 18 /129128
Notes to the Consolidated Financial Statementsfor the year ended March 31, 2018
44. Financial instruments (Cont...)
1.1 Gearing ratioThe gearing ratio at the end of the reporting period was as follows: (` in Crores)
ParticularsAs at
March 31, 2018As at
March 31, 2017
Debt (Refer note below) 3,871.51 4,005.65 Cash and bank balances ( Refer Note 15 and 16) (708.45) (174.43)Net debt 3,163.05 3,831.22
Total equity 3,560.84 3,115.73
Net debt to equity ratio 88.83% 122.96% Debt is defined as long-term and short term borrowings, as described in earlier notes ( Refer note 20, 24 and 26). 1.2 Categories of financial instruments (` in Crores)
Particulars
As at March 31, 2018 As at March 31, 2017
Carrying values
Fair valuesCarrying values
Fair values
Financial assets
Measured at amortised cost
Loans 9.41 9.41 10.73 10.73Trade receivables 882.30 882.30 1245.85 1245.85Cash and cash equivalents 707.37 707.37 173.41 173.41Bank balances other than above cash and cash equivalents 1.08 1.08 1.02 1.02Total financial assets measured at amortised cost (A) 1,600.16 1,600.16 1,431.01 1,431.01
Measured at fair value through profit and lossInvestments in mutual funds 17.07 17.07 202.82 202.82 Foreign currency forward contracts not designated in hedge accounting relationships
- - 38.74 38.74
Total financial assets measured at fair value through profit and loss (B) 17.07 17.07 241.56 241.56
Measured at fair value through other comprehensive income
Investments in equity instruments - - 58.06 58.06 Total financial assets measured at fair value through profit and loss (C) - - 58.06 58.06
Total financial assets (A+B+C) 1,617.23 1,617.23 1,730.63 1,730.63
Financial liabilities
Measured at amortised cost
Borrowings (non-current) 3,293.20 3,328.04 2593.34 2628.18Borrowings (current) 371.89 371.89 894.79 894.79Trade payables 616.63 616.63 841.08 841.08 Other financial liabilities 398.84 398.84 681.45 681.45Total financial liabilities measured at amortised cost 4,680.56 4,715.40 5,010.66 5,045.50
Total financial liabilities 4,680.56 4,715.40 5,010.66 5,045.50
2. Financial risk management objectives The Group’s Corporate finance department provides services to business, co-ordinates access to domestic and international financial markets, monitors and manages the financial risks relating to the operations of the Group through internal risk reports which analyse the exposures by degree and magnitude of risks. These risks include market risk (including currency risk, interest rate risk and other price risk), credit risk and liquidity risk.
The Group seeks to minimize the effects of these risks by using derivative financial instruments to hedge risk exposures. The use of financial derivatives is governed by the Group’s policies approved by the Board of Directors, which provide written principles on foreign exchange risk, interest rate risk, credit risk, the use of financial derivatives and non-derivative financial instruments, and the investment of excess liquidity. Compliance with policies and exposure limits is reviewed by the Management on a continuous basis. The Group does not enter into or trade financial instruments, including derivatives for speculative purposes.
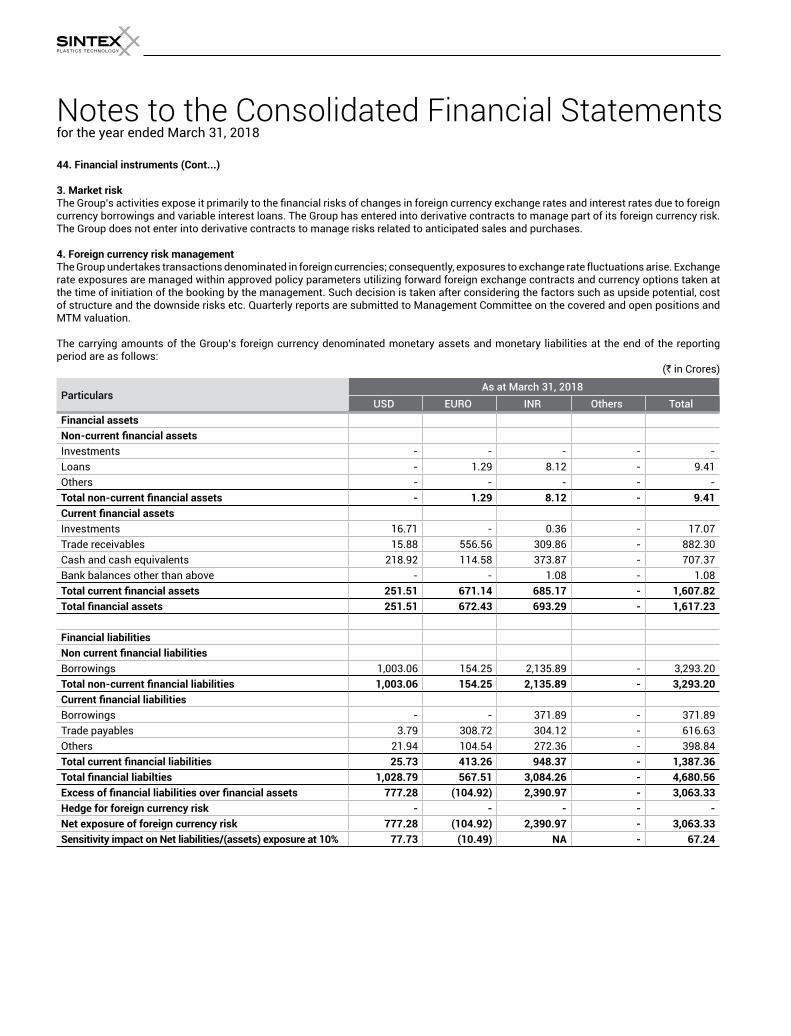
Notes to the Consolidated Financial Statementsfor the year ended March 31, 2018
44. Financial instruments (Cont...)
3. Market risk The Group’s activities expose it primarily to the financial risks of changes in foreign currency exchange rates and interest rates due to foreign currency borrowings and variable interest loans. The Group has entered into derivative contracts to manage part of its foreign currency risk. The Group does not enter into derivative contracts to manage risks related to anticipated sales and purchases. 4. Foreign currency risk management The Group undertakes transactions denominated in foreign currencies; consequently, exposures to exchange rate fluctuations arise. Exchange rate exposures are managed within approved policy parameters utilizing forward foreign exchange contracts and currency options taken at the time of initiation of the booking by the management. Such decision is taken after considering the factors such as upside potential, cost of structure and the downside risks etc. Quarterly reports are submitted to Management Committee on the covered and open positions and MTM valuation. The carrying amounts of the Group’s foreign currency denominated monetary assets and monetary liabilities at the end of the reporting period are as follows:
(` in Crores)
ParticularsAs at March 31, 2018
USD EURO INR Others Total
Financial assets
Non-current financial assetsInvestments - - - - - Loans - 1.29 8.12 - 9.41 Others - - - - - Total non-current financial assets - 1.29 8.12 - 9.41
Current financial assetsInvestments 16.71 - 0.36 - 17.07 Trade receivables 15.88 556.56 309.86 - 882.30 Cash and cash equivalents 218.92 114.58 373.87 - 707.37 Bank balances other than above - - 1.08 - 1.08 Total current financial assets 251.51 671.14 685.17 - 1,607.82
Total financial assets 251.51 672.43 693.29 - 1,617.23
Financial liabilities
Non current financial liabilitiesBorrowings 1,003.06 154.25 2,135.89 - 3,293.20 Total non-current financial liabilities 1,003.06 154.25 2,135.89 - 3,293.20
Current financial liabilitiesBorrowings - - 371.89 - 371.89 Trade payables 3.79 308.72 304.12 - 616.63 Others 21.94 104.54 272.36 - 398.84 Total current financial liabilities 25.73 413.26 948.37 - 1,387.36
Total financial liabilties 1,028.79 567.51 3,084.26 - 4,680.56
Excess of financial liabilities over financial assets 777.28 (104.92) 2,390.97 - 3,063.33
Hedge for foreign currency risk - - - - -
Net exposure of foreign currency risk 777.28 (104.92) 2,390.97 - 3,063.33
Sensitivity impact on Net liabilities/(assets) exposure at 10% 77.73 (10.49) NA - 67.24
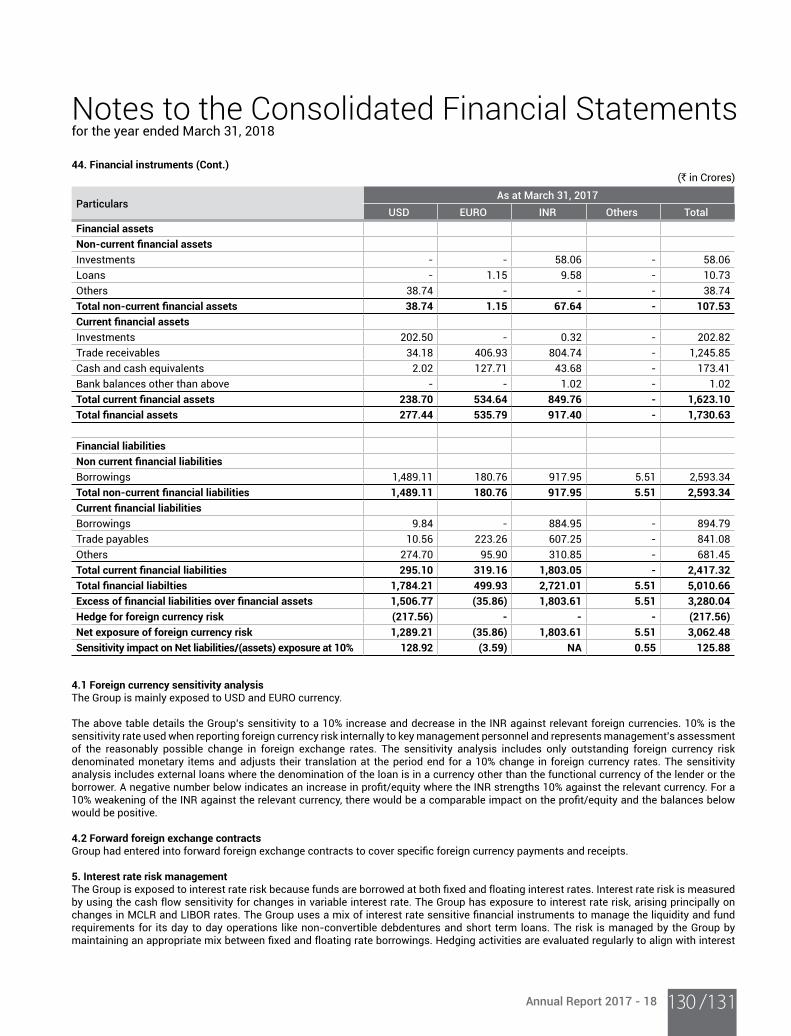
Annual Report 2017 - 18 /131130
Notes to the Consolidated Financial Statementsfor the year ended March 31, 2018
44. Financial instruments (Cont.) (` in Crores)
ParticularsAs at March 31, 2017
USD EURO INR Others Total
Financial assets
Non-current financial assetsInvestments - - 58.06 - 58.06 Loans - 1.15 9.58 - 10.73 Others 38.74 - - - 38.74 Total non-current financial assets 38.74 1.15 67.64 - 107.53
Current financial assetsInvestments 202.50 - 0.32 - 202.82 Trade receivables 34.18 406.93 804.74 - 1,245.85 Cash and cash equivalents 2.02 127.71 43.68 - 173.41 Bank balances other than above - - 1.02 - 1.02 Total current financial assets 238.70 534.64 849.76 - 1,623.10
Total financial assets 277.44 535.79 917.40 - 1,730.63
Financial liabilities
Non current financial liabilitiesBorrowings 1,489.11 180.76 917.95 5.51 2,593.34 Total non-current financial liabilities 1,489.11 180.76 917.95 5.51 2,593.34
Current financial liabilitiesBorrowings 9.84 - 884.95 - 894.79 Trade payables 10.56 223.26 607.25 - 841.08 Others 274.70 95.90 310.85 - 681.45 Total current financial liabilities 295.10 319.16 1,803.05 - 2,417.32
Total financial liabilties 1,784.21 499.93 2,721.01 5.51 5,010.66
Excess of financial liabilities over financial assets 1,506.77 (35.86) 1,803.61 5.51 3,280.04
Hedge for foreign currency risk (217.56) - - - (217.56)
Net exposure of foreign currency risk 1,289.21 (35.86) 1,803.61 5.51 3,062.48
Sensitivity impact on Net liabilities/(assets) exposure at 10% 128.92 (3.59) NA 0.55 125.88
4.1 Foreign currency sensitivity analysis The Group is mainly exposed to USD and EURO currency. The above table details the Group’s sensitivity to a 10% increase and decrease in the INR against relevant foreign currencies. 10% is the sensitivity rate used when reporting foreign currency risk internally to key management personnel and represents management’s assessment of the reasonably possible change in foreign exchange rates. The sensitivity analysis includes only outstanding foreign currency risk denominated monetary items and adjusts their translation at the period end for a 10% change in foreign currency rates. The sensitivity analysis includes external loans where the denomination of the loan is in a currency other than the functional currency of the lender or the borrower. A negative number below indicates an increase in profit/equity where the INR strengths 10% against the relevant currency. For a 10% weakening of the INR against the relevant currency, there would be a comparable impact on the profit/equity and the balances below would be positive.
4.2 Forward foreign exchange contracts Group had entered into forward foreign exchange contracts to cover specific foreign currency payments and receipts. 5. Interest rate risk management The Group is exposed to interest rate risk because funds are borrowed at both fixed and floating interest rates. Interest rate risk is measured by using the cash flow sensitivity for changes in variable interest rate. The Group has exposure to interest rate risk, arising principally on changes in MCLR and LIBOR rates. The Group uses a mix of interest rate sensitive financial instruments to manage the liquidity and fund requirements for its day to day operations like non-convertible debdentures and short term loans. The risk is managed by the Group by maintaining an appropriate mix between fixed and floating rate borrowings. Hedging activities are evaluated regularly to align with interest
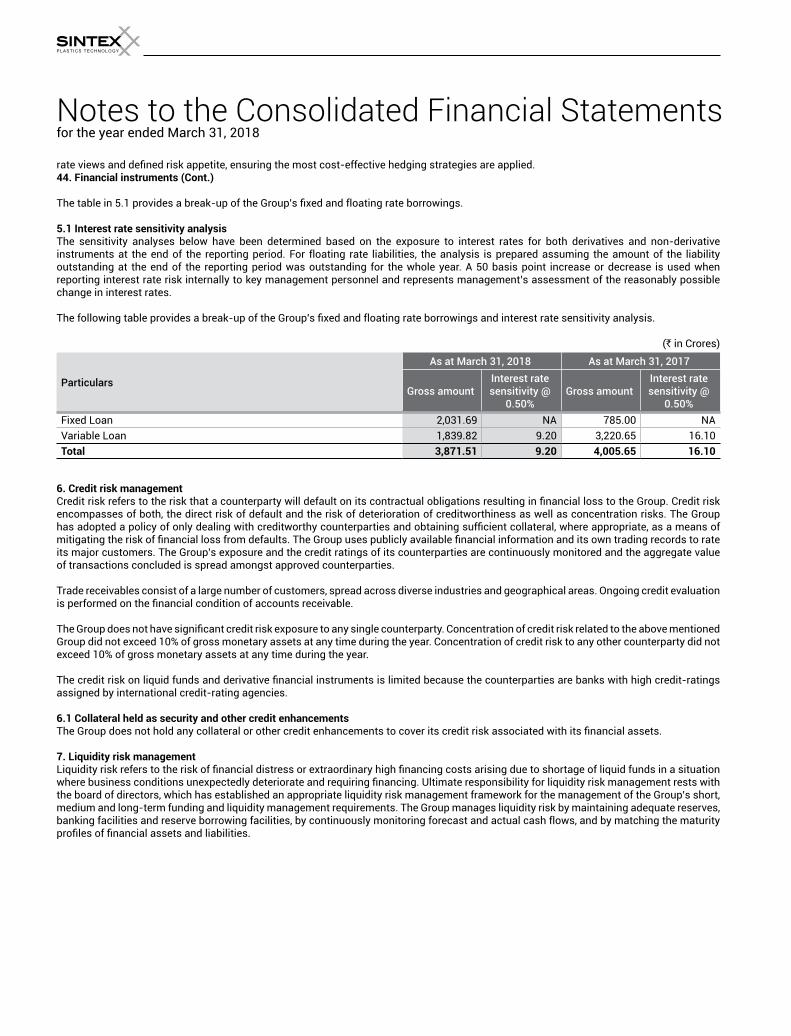
Notes to the Consolidated Financial Statementsfor the year ended March 31, 2018
rate views and defined risk appetite, ensuring the most cost-effective hedging strategies are applied. 44. Financial instruments (Cont.)
The table in 5.1 provides a break-up of the Group’s fixed and floating rate borrowings. 5.1 Interest rate sensitivity analysis The sensitivity analyses below have been determined based on the exposure to interest rates for both derivatives and non-derivative instruments at the end of the reporting period. For floating rate liabilities, the analysis is prepared assuming the amount of the liability outstanding at the end of the reporting period was outstanding for the whole year. A 50 basis point increase or decrease is used when reporting interest rate risk internally to key management personnel and represents management’s assessment of the reasonably possible change in interest rates.
The following table provides a break-up of the Group’s fixed and floating rate borrowings and interest rate sensitivity analysis.
(` in Crores)
Particulars
As at March 31, 2018 As at March 31, 2017
Gross amountInterest rate sensitivity @
0.50%Gross amount
Interest rate sensitivity @
0.50%
Fixed Loan 2,031.69 NA 785.00 NA Variable Loan 1,839.82 9.20 3,220.65 16.10 Total 3,871.51 9.20 4,005.65 16.10
6. Credit risk management Credit risk refers to the risk that a counterparty will default on its contractual obligations resulting in financial loss to the Group. Credit risk encompasses of both, the direct risk of default and the risk of deterioration of creditworthiness as well as concentration risks. The Group has adopted a policy of only dealing with creditworthy counterparties and obtaining sufficient collateral, where appropriate, as a means of mitigating the risk of financial loss from defaults. The Group uses publicly available financial information and its own trading records to rate its major customers. The Group’s exposure and the credit ratings of its counterparties are continuously monitored and the aggregate value of transactions concluded is spread amongst approved counterparties. Trade receivables consist of a large number of customers, spread across diverse industries and geographical areas. Ongoing credit evaluation is performed on the financial condition of accounts receivable. The Group does not have significant credit risk exposure to any single counterparty. Concentration of credit risk related to the above mentioned Group did not exceed 10% of gross monetary assets at any time during the year. Concentration of credit risk to any other counterparty did not exceed 10% of gross monetary assets at any time during the year. The credit risk on liquid funds and derivative financial instruments is limited because the counterparties are banks with high credit-ratings assigned by international credit-rating agencies. 6.1 Collateral held as security and other credit enhancements The Group does not hold any collateral or other credit enhancements to cover its credit risk associated with its financial assets. 7. Liquidity risk management Liquidity risk refers to the risk of financial distress or extraordinary high financing costs arising due to shortage of liquid funds in a situation where business conditions unexpectedly deteriorate and requiring financing. Ultimate responsibility for liquidity risk management rests with the board of directors, which has established an appropriate liquidity risk management framework for the management of the Group’s short, medium and long-term funding and liquidity management requirements. The Group manages liquidity risk by maintaining adequate reserves, banking facilities and reserve borrowing facilities, by continuously monitoring forecast and actual cash flows, and by matching the maturity profiles of financial assets and liabilities.
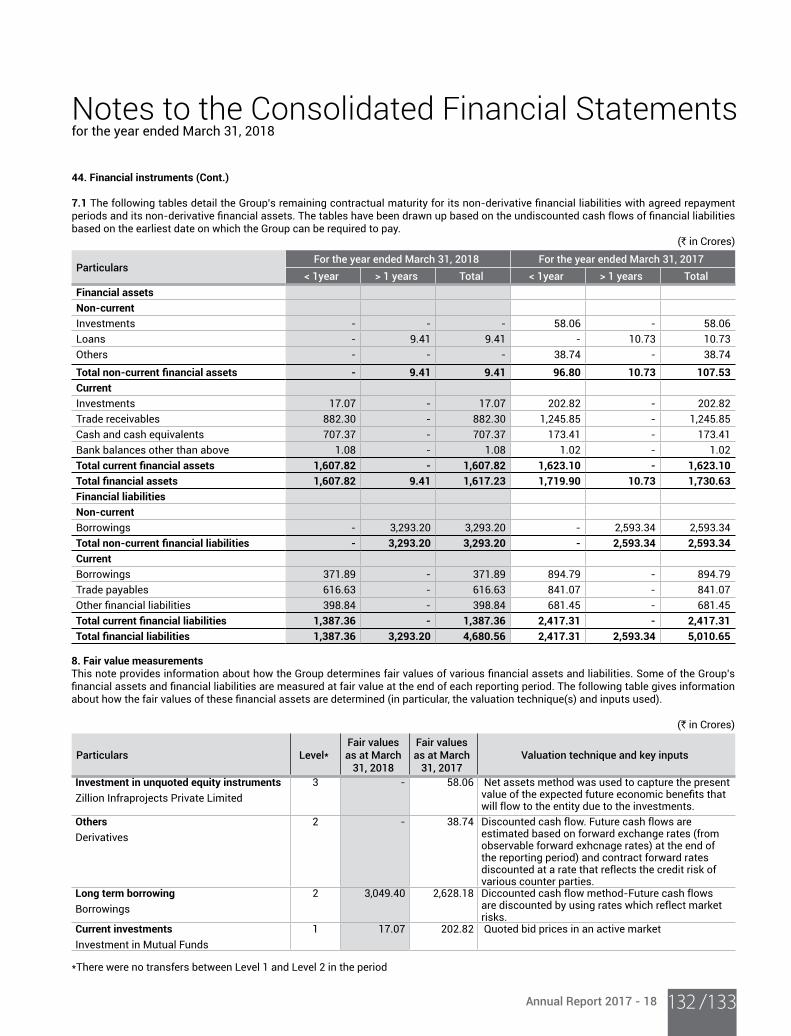
Annual Report 2017 - 18 /133132
Notes to the Consolidated Financial Statementsfor the year ended March 31, 2018
44. Financial instruments (Cont.) 7.1 The following tables detail the Group’s remaining contractual maturity for its non-derivative financial liabilities with agreed repayment periods and its non-derivative financial assets. The tables have been drawn up based on the undiscounted cash flows of financial liabilities based on the earliest date on which the Group can be required to pay.
(` in Crores)
ParticularsFor the year ended March 31, 2018 For the year ended March 31, 2017
< 1year > 1 years Total < 1year > 1 years Total
Financial assets
Non-current
Investments - - - 58.06 - 58.06 Loans - 9.41 9.41 - 10.73 10.73 Others - - - 38.74 - 38.74
Total non-current financial assets - 9.41 9.41 96.80 10.73 107.53
Current
Investments 17.07 - 17.07 202.82 - 202.82 Trade receivables 882.30 - 882.30 1,245.85 - 1,245.85 Cash and cash equivalents 707.37 - 707.37 173.41 - 173.41 Bank balances other than above 1.08 - 1.08 1.02 - 1.02 Total current financial assets 1,607.82 - 1,607.82 1,623.10 - 1,623.10
Total financial assets 1,607.82 9.41 1,617.23 1,719.90 10.73 1,730.63
Financial liabilities
Non-current
Borrowings - 3,293.20 3,293.20 - 2,593.34 2,593.34 Total non-current financial liabilities - 3,293.20 3,293.20 - 2,593.34 2,593.34
Current
Borrowings 371.89 - 371.89 894.79 - 894.79 Trade payables 616.63 - 616.63 841.07 - 841.07 Other financial liabilities 398.84 - 398.84 681.45 - 681.45 Total current financial liabilities 1,387.36 - 1,387.36 2,417.31 - 2,417.31
Total financial liabilities 1,387.36 3,293.20 4,680.56 2,417.31 2,593.34 5,010.65
8. Fair value measurements This note provides information about how the Group determines fair values of various financial assets and liabilities. Some of the Group’s financial assets and financial liabilities are measured at fair value at the end of each reporting period. The following table gives information about how the fair values of these financial assets are determined (in particular, the valuation technique(s) and inputs used).
(` in Crores)
Particulars Level*Fair values as at March
31, 2018
Fair values as at March
31, 2017Valuation technique and key inputs
Investment in unquoted equity instruments
Zillion Infraprojects Private Limited3 - 58.06 Net assets method was used to capture the present
value of the expected future economic benefits that will flow to the entity due to the investments.
Others
Derivatives2 - 38.74 Discounted cash flow. Future cash flows are
estimated based on forward exchange rates (from observable forward exhcnage rates) at the end of the reporting period) and contract forward rates discounted at a rate that reflects the credit risk of various counter parties.
Long term borrowing
Borrowings2 3,049.40 2,628.18 Diccounted cash flow method-Future cash flows
are discounted by using rates which reflect market risks.
Current investments
Investment in Mutual Funds1 17.07 202.82 Quoted bid prices in an active market
*There were no transfers between Level 1 and Level 2 in the period
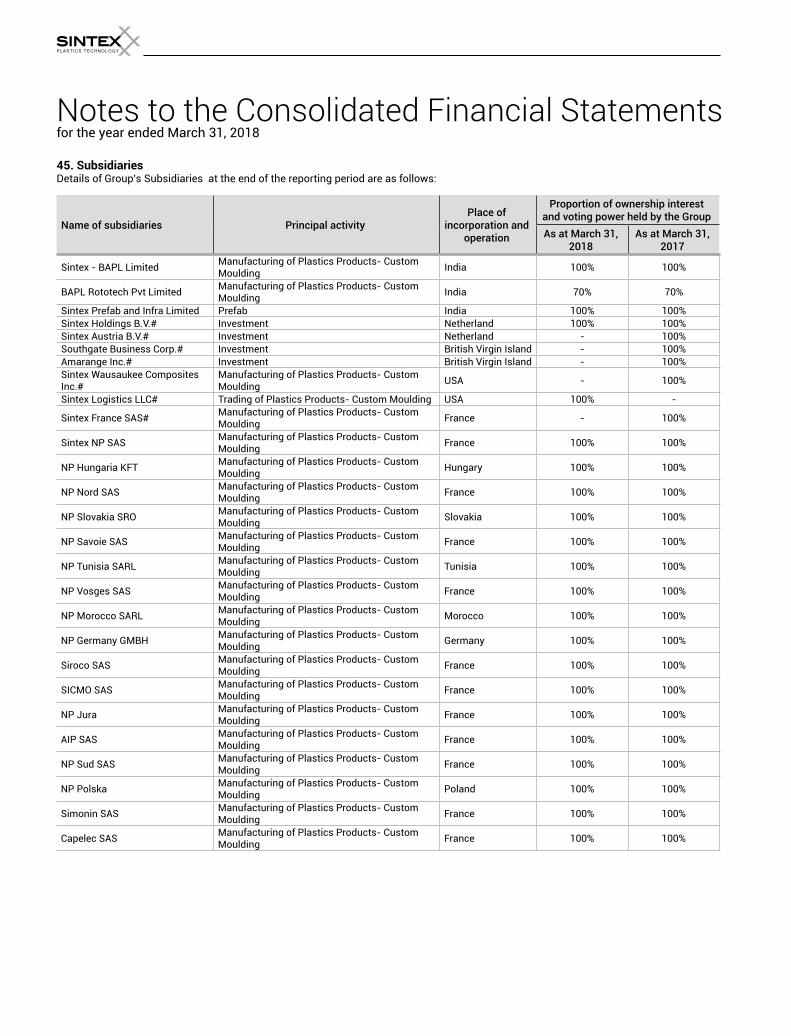
Notes to the Consolidated Financial Statementsfor the year ended March 31, 2018
45. SubsidiariesDetails of Group’s Subsidiaries at the end of the reporting period are as follows:
Name of subsidiaries Principal activityPlace of
incorporation and operation
Proportion of ownership interest and voting power held by the Group
As at March 31, 2018
As at March 31, 2017
Sintex - BAPL Limited Manufacturing of Plastics Products- Custom Moulding
India 100% 100%
BAPL Rototech Pvt Limited Manufacturing of Plastics Products- Custom Moulding
India 70% 70%
Sintex Prefab and Infra Limited Prefab India 100% 100%Sintex Holdings B.V.# Investment Netherland 100% 100%Sintex Austria B.V.# Investment Netherland - 100%Southgate Business Corp.# Investment British Virgin Island - 100%Amarange Inc.# Investment British Virgin Island - 100%Sintex Wausaukee Composites Inc.#
Manufacturing of Plastics Products- Custom Moulding
USA - 100%
Sintex Logistics LLC# Trading of Plastics Products- Custom Moulding USA 100% -
Sintex France SAS# Manufacturing of Plastics Products- Custom Moulding
France - 100%
Sintex NP SAS Manufacturing of Plastics Products- Custom Moulding
France 100% 100%
NP Hungaria KFT Manufacturing of Plastics Products- Custom Moulding
Hungary 100% 100%
NP Nord SAS Manufacturing of Plastics Products- Custom Moulding
France 100% 100%
NP Slovakia SRO Manufacturing of Plastics Products- Custom Moulding
Slovakia 100% 100%
NP Savoie SAS Manufacturing of Plastics Products- Custom Moulding
France 100% 100%
NP Tunisia SARL Manufacturing of Plastics Products- Custom Moulding
Tunisia 100% 100%
NP Vosges SAS Manufacturing of Plastics Products- Custom Moulding
France 100% 100%
NP Morocco SARL Manufacturing of Plastics Products- Custom Moulding
Morocco 100% 100%
NP Germany GMBH Manufacturing of Plastics Products- Custom Moulding
Germany 100% 100%
Siroco SASManufacturing of Plastics Products- Custom Moulding
France 100% 100%
SICMO SAS Manufacturing of Plastics Products- Custom Moulding
France 100% 100%
NP Jura Manufacturing of Plastics Products- Custom Moulding
France 100% 100%
AIP SAS Manufacturing of Plastics Products- Custom Moulding
France 100% 100%
NP Sud SAS Manufacturing of Plastics Products- Custom Moulding
France 100% 100%
NP Polska Manufacturing of Plastics Products- Custom Moulding
Poland 100% 100%
Simonin SASManufacturing of Plastics Products- Custom Moulding
France 100% 100%
Capelec SAS Manufacturing of Plastics Products- Custom Moulding
France 100% 100%
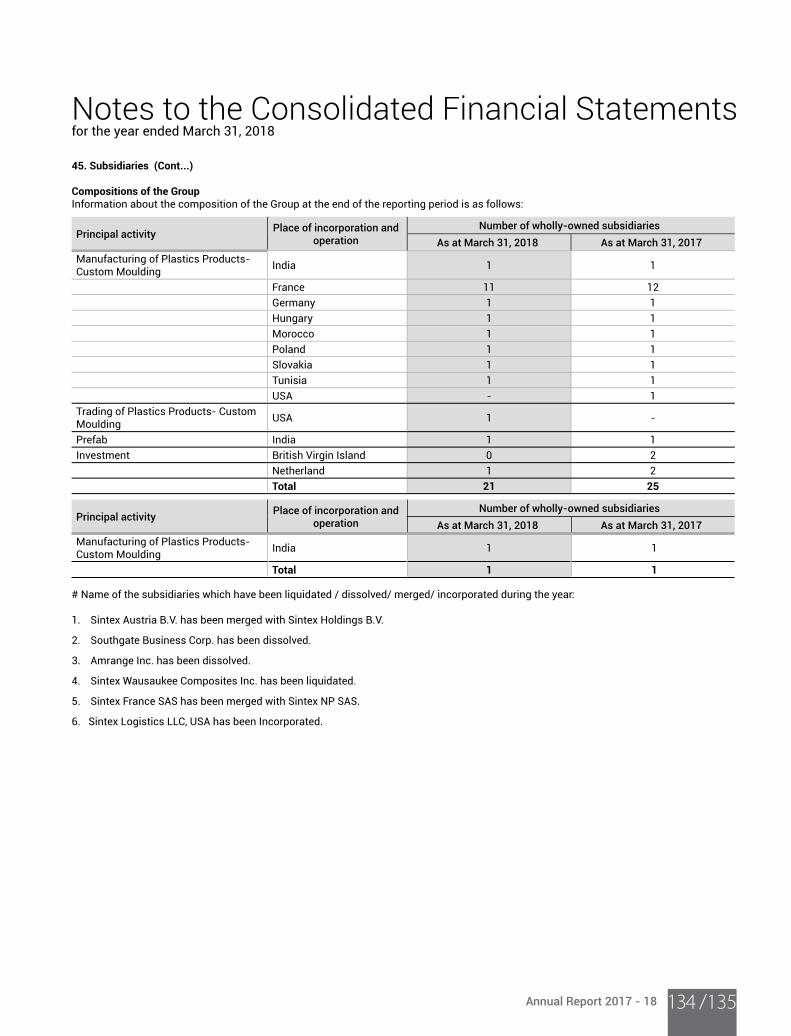
Annual Report 2017 - 18 /135134
Notes to the Consolidated Financial Statementsfor the year ended March 31, 2018
45. Subsidiaries (Cont...)
Compositions of the Group Information about the composition of the Group at the end of the reporting period is as follows:
Principal activityPlace of incorporation and
operation
Number of wholly-owned subsidiaries
As at March 31, 2018 As at March 31, 2017
Manufacturing of Plastics Products- Custom Moulding India 1 1
France 11 12
Germany 1 1
Hungary 1 1
Morocco 1 1
Poland 1 1
Slovakia 1 1
Tunisia 1 1
USA - 1
Trading of Plastics Products- Custom Moulding
USA 1 -
Prefab India 1 1
Investment British Virgin Island 0 2
Netherland 1 2
Total 21 25
Principal activityPlace of incorporation and
operation
Number of wholly-owned subsidiaries
As at March 31, 2018 As at March 31, 2017
Manufacturing of Plastics Products- Custom Moulding India 1 1
Total 1 1
# Name of the subsidiaries which have been liquidated / dissolved/ merged/ incorporated during the year: 1. Sintex Austria B.V. has been merged with Sintex Holdings B.V.
2. Southgate Business Corp. has been dissolved.
3. Amrange Inc. has been dissolved.
4. Sintex Wausaukee Composites Inc. has been liquidated.
5. Sintex France SAS has been merged with Sintex NP SAS.
6. Sintex Logistics LLC, USA has been Incorporated.
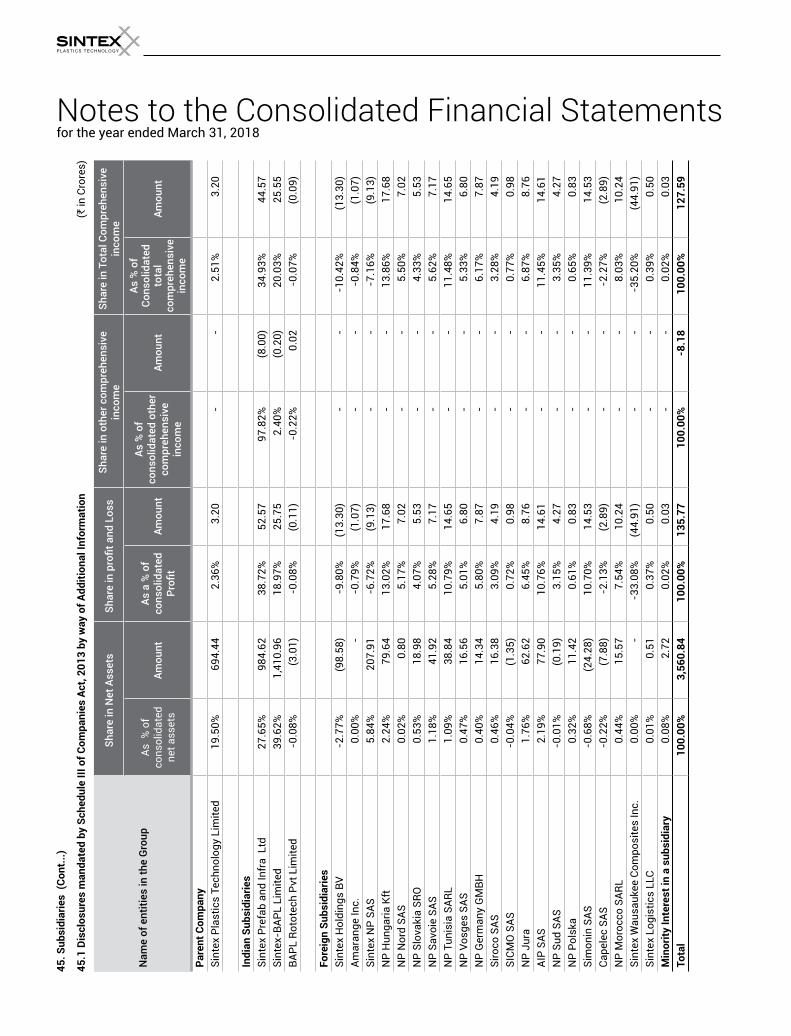
Notes to the Consolidated Financial Statementsfor the year ended March 31, 2018
45
. S
ub
sid
iari
es
(C
on
t...
)
45
.1 D
iscl
osu
res
ma
nd
ate
d b
y S
che
du
le I
II o
f C
om
pa
nie
s A
ct, 2
01
3 b
y w
ay
of
Ad
dit
ion
al I
nfo
rma
tio
n
(` in
Cro
res)
Na
me
of
enti
ties
in t
he
Gro
up
Sh
are
in N
et A
sset
sSh
are
in p
rofit
and
Los
sS
ha
re in
oth
er c
om
pre
hen
sive
in
com
eS
ha
re in
To
tal C
om
pre
hen
sive
in
com
e
As %
of
con
solid
ate
d
net
ass
ets
Am
ou
nt
As
a %
of
con
solid
ate
d
Profi
tA
mo
un
t
As
% o
f co
nso
lida
ted
oth
er
com
pre
hen
sive
in
com
e
Am
ou
nt
As
% o
f C
on
solid
ate
d
tota
l co
mp
reh
ensi
ve
inco
me
Am
ou
nt
Pa
ren
t C
om
pa
ny
Sint
ex P
last
ics
Tech
nolo
gy L
imite
d19
.50%
694
.44
2.36
% 3
.20
- -
2.
51%
3.2
0
Ind
ian
Su
bsi
dia
rie
s
Sint
ex P
refa
b an
d In
fra
Ltd
27.6
5% 9
84.6
2 38
.72%
52.
57
97.8
2% (8
.00)
34.9
3% 4
4.57
Si
ntex
-BAP
L Li
mite
d39
.62%
1,4
10.9
6 18
.97%
25.
75
2.40
% (0
.20)
20.0
3% 2
5.55
BA
PL R
otot
ech
Pvt L
imite
d-0
.08%
(3.0
1)-0
.08%
(0.1
1)-0
.22%
0.0
2 -0
.07%
(0.0
9)
Fo
reig
n S
ub
sid
iari
es
Sin
tex
Ho
ldin
gs
BV
-2.7
7% (9
8.58
)-9
.80%
(13.
30)
-
-
-10.
42%
(13.
30)
Amar
ange
Inc.
0.00
% -
-0
.79%
(1.0
7) -
-
-0
.84%
(1.0
7)Si
ntex
NP
SAS
5.84
% 2
07.9
1 -6
.72%
(9.1
3) -
-
-7
.16%
(9.1
3)N
P H
unga
ria K
ft
2.24
% 7
9.64
13
.02%
17.
68
-
-
13.8
6% 1
7.68
N
P N
ord
SAS
0.02
% 0
.80
5.17
% 7
.02
-
-
5.50
% 7
.02
NP
Slov
akia
SRO
0.
53%
18.
98
4.07
% 5
.53
-
-
4.33
% 5
.53
NP
Savo
ie S
AS
1.18
% 4
1.92
5.
28%
7.1
7 -
-
5.
62%
7.1
7 N
P Tu
nisi
a SA
RL
1.09
% 3
8.84
10
.79%
14.
65
-
-
11.4
8% 1
4.65
N
P Vo
sges
SAS
0.
47%
16.
56
5.01
% 6
.80
-
-
5.33
% 6
.80
NP
Ger
man
y G
MBH
0.
40%
14.
34
5.80
% 7
.87
-
-
6.17
% 7
.87
Sir
oco
SA
S
0.46
% 1
6.38
3.
09%
4.1
9 -
-
3.
28%
4.1
9 SI
CMO
SAS
-0
.04%
(1.3
5)0.
72%
0.9
8 -
-
0.
77%
0.9
8 N
P Ju
ra1.
76%
62.
62
6.45
% 8
.76
-
-
6.87
% 8
.76
AIP
SAS
2.19
% 7
7.90
10
.76%
14.
61
-
-
11.4
5% 1
4.61
N
P Su
d SA
S-0
.01%
(0.1
9)3.
15%
4.2
7 -
-
3.
35%
4.2
7 N
P Po
lska
0.32
% 1
1.42
0.
61%
0.8
3 -
-
0.
65%
0.8
3 S
imo
nin
SA
S-0
.68%
(24.
28)
10.7
0% 1
4.53
-
-
11
.39%
14.
53
Cape
lec
SAS
-0.2
2% (7
.88)
-2.1
3% (2
.89)
-
-
-2.2
7% (2
.89)
NP
Mor
occo
SAR
L0.
44%
15.
57
7.54
% 1
0.24
-
-
8.
03%
10.
24
Sint
ex W
ausa
ukee
Com
posi
tes
Inc.
0.00
% -
-3
3.08
% (4
4.91
) -
-
-3
5.20
% (4
4.91
)Si
ntex
Log
istic
s LL
C0.
01%
0.5
1 0.
37%
0.5
0 -
-
0.
39%
0.5
0 M
ino
rity
In
tere
st in
a s
ub
sid
iary
0.08
% 2
.72
0.02
% 0
.03
-
-
0.02
% 0
.03
To
tal
10
0.0
0%
3,5
60
.84
1
00
.00
% 1
35
.77
1
00
.00
%-8
.18
10
0.0
0%
12
7.5
9
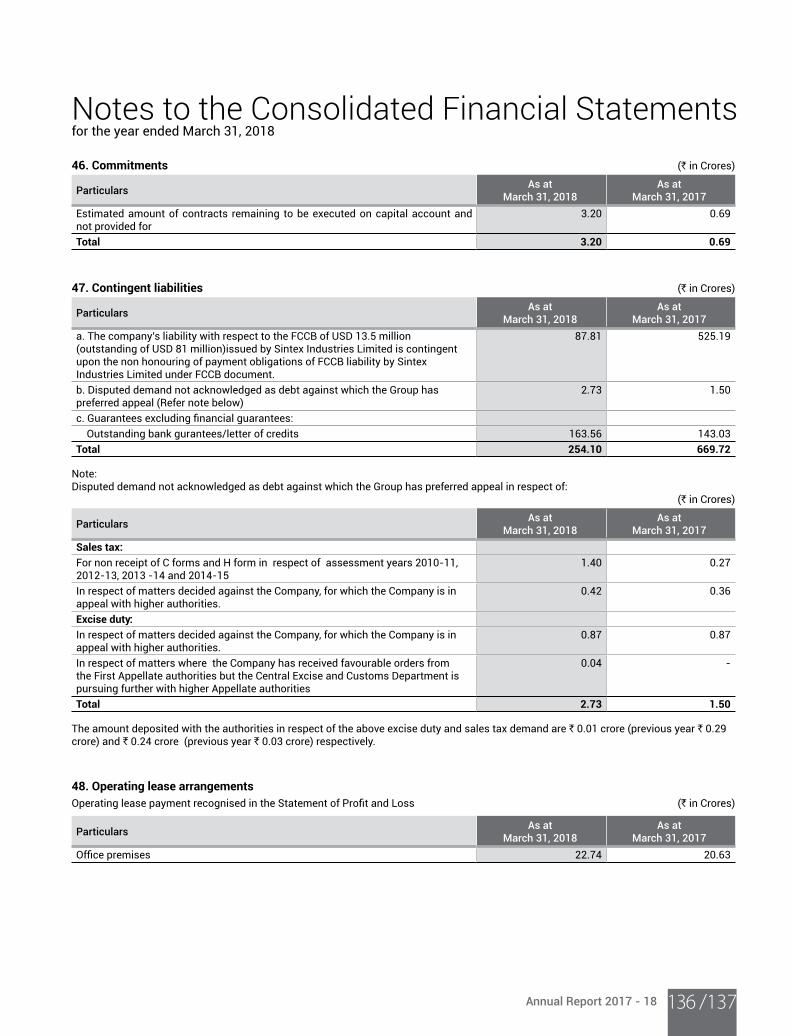
Annual Report 2017 - 18 /137136
Notes to the Consolidated Financial Statementsfor the year ended March 31, 2018
46. Commitments (` in Crores)
ParticularsAs at
March 31, 2018As at
March 31, 2017
Estimated amount of contracts remaining to be executed on capital account and not provided for
3.20 0.69
Total 3.20 0.69
47. Contingent liabilities (` in Crores)
ParticularsAs at
March 31, 2018As at
March 31, 2017
a. The company's liability with respect to the FCCB of USD 13.5 million (outstanding of USD 81 million)issued by Sintex Industries Limited is contingent upon the non honouring of payment obligations of FCCB liability by Sintex Industries Limited under FCCB document.
87.81 525.19
b. Disputed demand not acknowledged as debt against which the Group has preferred appeal (Refer note below)
2.73 1.50
c. Guarantees excluding financial guarantees: Outstanding bank gurantees/letter of credits 163.56 143.03 Total 254.10 669.72
Note: Disputed demand not acknowledged as debt against which the Group has preferred appeal in respect of:
(` in Crores)
ParticularsAs at
March 31, 2018As at
March 31, 2017
Sales tax:
For non receipt of C forms and H form in respect of assessment years 2010-11, 2012-13, 2013 -14 and 2014-15
1.40 0.27
In respect of matters decided against the Company, for which the Company is in appeal with higher authorities.
0.42 0.36
Excise duty:
In respect of matters decided against the Company, for which the Company is in appeal with higher authorities.
0.87 0.87
In respect of matters where the Company has received favourable orders from the First Appellate authorities but the Central Excise and Customs Department is pursuing further with higher Appellate authorities
0.04 -
Total 2.73 1.50
The amount deposited with the authorities in respect of the above excise duty and sales tax demand are ` 0.01 crore (previous year ` 0.29 crore) and ` 0.24 crore (previous year ` 0.03 crore) respectively.
48. Operating lease arrangements
Operating lease payment recognised in the Statement of Profit and Loss (` in Crores)
ParticularsAs at
March 31, 2018As at
March 31, 2017
Office premises 22.74 20.63
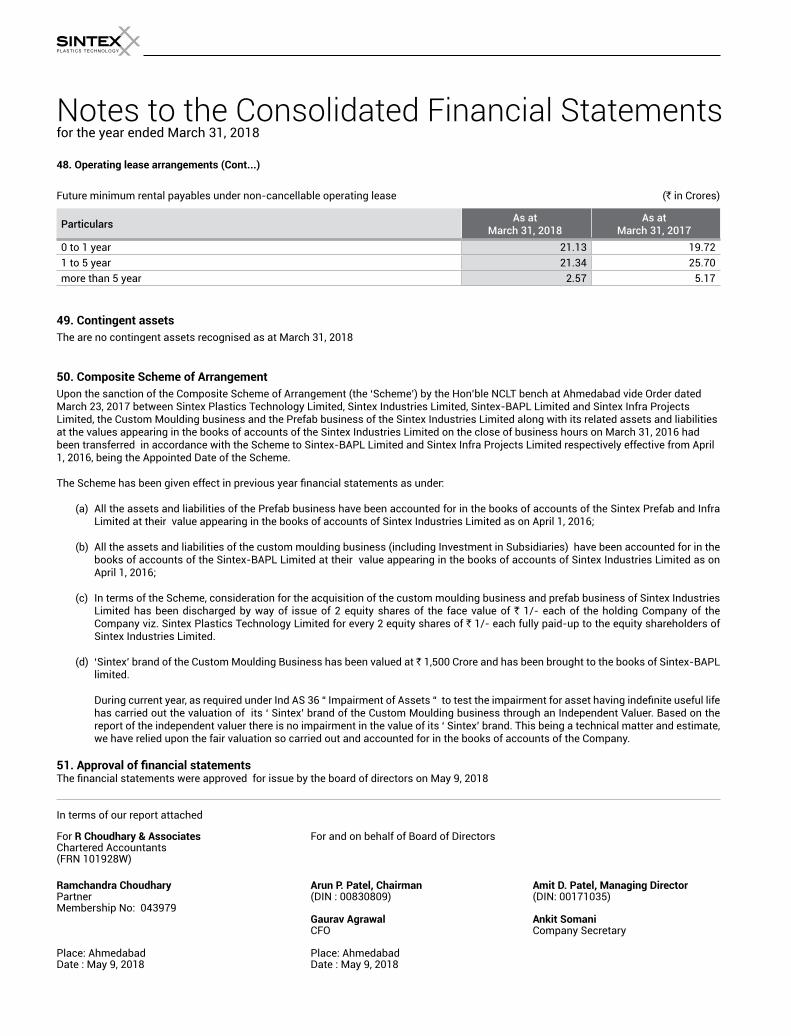
Notes to the Consolidated Financial Statementsfor the year ended March 31, 2018
48. Operating lease arrangements (Cont...)
Future minimum rental payables under non-cancellable operating lease (` in Crores)
ParticularsAs at
March 31, 2018As at
March 31, 2017
0 to 1 year 21.13 19.72 1 to 5 year 21.34 25.70 more than 5 year 2.57 5.17
49. Contingent assets
The are no contingent assets recognised as at March 31, 2018
50. Composite Scheme of Arrangement
Upon the sanction of the Composite Scheme of Arrangement (the ‘Scheme’) by the Hon’ble NCLT bench at Ahmedabad vide Order dated March 23, 2017 between Sintex Plastics Technology Limited, Sintex Industries Limited, Sintex-BAPL Limited and Sintex Infra Projects Limited, the Custom Moulding business and the Prefab business of the Sintex Industries Limited along with its related assets and liabilities at the values appearing in the books of accounts of the Sintex Industries Limited on the close of business hours on March 31, 2016 had been transferred in accordance with the Scheme to Sintex-BAPL Limited and Sintex Infra Projects Limited respectively effective from April 1, 2016, being the Appointed Date of the Scheme. The Scheme has been given effect in previous year financial statements as under:
(a) All the assets and liabilities of the Prefab business have been accounted for in the books of accounts of the Sintex Prefab and Infra Limited at their value appearing in the books of accounts of Sintex Industries Limited as on April 1, 2016;
(b) All the assets and liabilities of the custom moulding business (including Investment in Subsidiaries) have been accounted for in the books of accounts of the Sintex-BAPL Limited at their value appearing in the books of accounts of Sintex Industries Limited as on April 1, 2016;
(c) In terms of the Scheme, consideration for the acquisition of the custom moulding business and prefab business of Sintex Industries
Limited has been discharged by way of issue of 2 equity shares of the face value of ` 1/- each of the holding Company of the Company viz. Sintex Plastics Technology Limited for every 2 equity shares of ` 1/- each fully paid-up to the equity shareholders of Sintex Industries Limited.
(d) ‘Sintex’ brand of the Custom Moulding Business has been valued at ` 1,500 Crore and has been brought to the books of Sintex-BAPL
limited.
During current year, as required under Ind AS 36 “ Impairment of Assets “ to test the impairment for asset having indefinite useful life has carried out the valuation of its ‘ Sintex’ brand of the Custom Moulding business through an Independent Valuer. Based on the report of the independent valuer there is no impairment in the value of its ‘ Sintex’ brand. This being a technical matter and estimate, we have relied upon the fair valuation so carried out and accounted for in the books of accounts of the Company.
51. Approval of financial statements The financial statements were approved for issue by the board of directors on May 9, 2018
In terms of our report attached
For R Choudhary & Associates For and on behalf of Board of DirectorsChartered Accountants(FRN 101928W)
Ramchandra Choudhary Arun P. Patel, Chairman Amit D. Patel, Managing DirectorPartner (DIN : 00830809) (DIN: 00171035)Membership No: 043979 Gaurav Agrawal Ankit Somani CFO Company Secretary
Place: Ahmedabad Place: Ahmedabad Date : May 9, 2018 Date : May 9, 2018
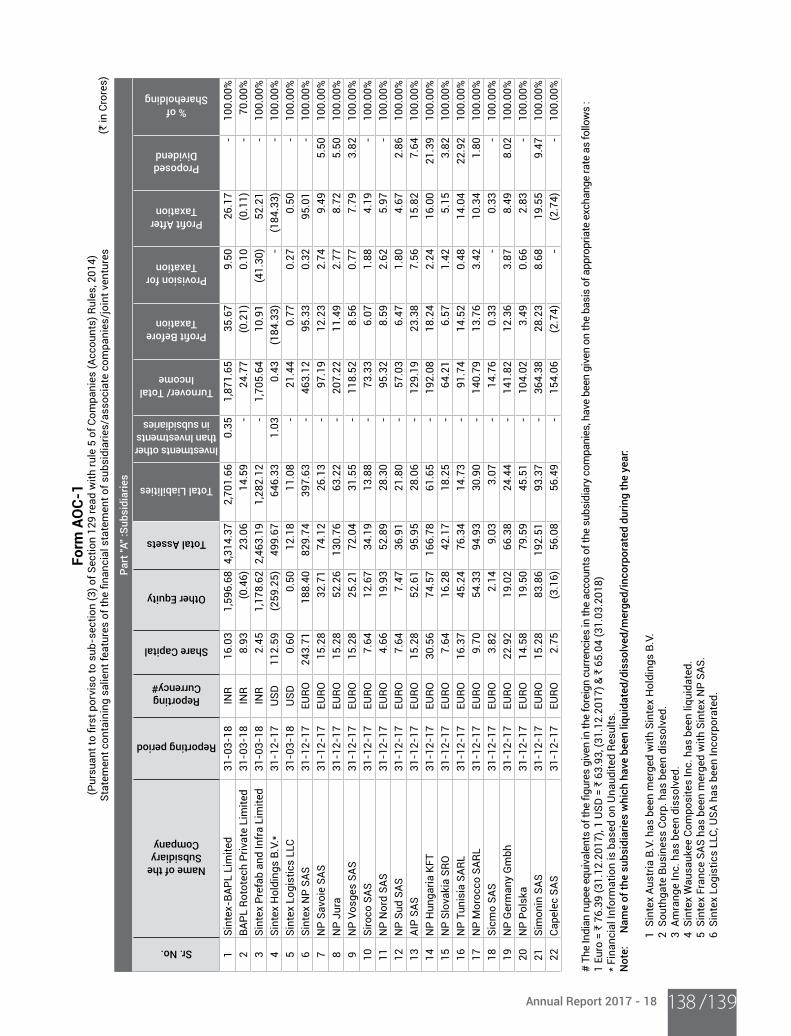
Annual Report 2017 - 18 /139138
Fo
rm A
OC
-1(P
ursu
ant t
o fir
st p
orvi
so to
sub
-sec
tion
(3) o
f Sec
tion
129
read
with
rule
5 o
f Com
pani
es (A
ccou
nts)
Rul
es, 2
014)
Stat
emen
t con
tain
ing
salie
nt fe
atur
es o
f the
fina
ncia
l sta
tem
ent o
f sub
sidi
arie
s/as
soci
ate
com
pani
es/j
oint
ven
ture
s
Pa
rt "
A"
:Su
bsi
dia
ries
Sr. No.
Name of the Subsidiary Company
Reporting period
Reporting Currency#
Share Capital
Other Equity
Total Assets
Total Liabilities
Investments other than Investments
in subsidiaries
Turnover/ Total Income
Profit Before Taxation
Provision for Taxation
Profit After Taxation
Proposed Dividend
% of Shareholding
1Si
ntex
-BAP
L Li
mite
d31
-03-
18IN
R 1
6.03
1
,596
.68
4,3
14.3
7 2
,701
.66
0.3
5 1
,871
.65
35.
67
9.5
0 2
6.17
-
10
0.00
%2
BAPL
Rot
otec
h Pr
ivat
e Li
mite
d31
-03-
18IN
R 8
.93
(0.4
6) 2
3.06
1
4.59
-
2
4.77
(0
.21)
0.1
0 (0
.11)
-
70.0
0%3
Sint
ex P
refa
b an
d In
fra
Lim
ited
31-0
3-18
INR
2.4
5 1
,178
.62
2,4
63.1
9 1
,282
.12
-
1,7
05.6
4 1
0.91
(4
1.30
) 5
2.21
-
10
0.00
%4
Sint
ex H
oldi
ngs
B.V.
*31
-12-
17U
SD11
2.59
(259
.25)
499.
6764
6.33
1.0
3 0.
43 (1
84.3
3) -
(1
84.3
3) -
10
0.00
%5
Sint
ex L
ogis
tics
LLC
31-0
3-18
USD
0.6
0 0
.50
12.
18
11.
08
-
21.
44
0.7
7 0
.27
0.5
0 -
10
0.00
%6
Sint
ex N
P SA
S31
-12-
17EU
RO 2
43.7
1 1
88.4
0 8
29.7
4 3
97.6
3 -
4
63.1
2 9
5.33
0
.32
95.
01
-
100.
00%
7N
P Sa
voie
SAS
31-1
2-17
EURO
15.
28
32.
71
74.
12
26.
13
-
97.
19
12.
23
2.7
4 9
.49
5.5
0 10
0.00
%8
NP
Jura
31
-12-
17EU
RO 1
5.28
5
2.26
1
30.7
6 6
3.22
-
2
07.2
2 1
1.49
2
.77
8.7
2 5
.50
100.
00%
9N
P Vo
sges
SAS
31-1
2-17
EURO
15.
28
25.
21
72.
04
31.
55
-
118
.52
8.5
6 0
.77
7.7
9 3
.82
100.
00%
10
Sir
oco
SA
S31
-12-
17EU
RO 7
.64
12.
67
34.
19
13.
88
-
73.
33
6.0
7 1
.88
4.1
9 -
10
0.00
%1
1N
P N
ord
SAS
31-1
2-17
EURO
4.6
6 1
9.93
5
2.89
2
8.30
-
9
5.32
8
.59
2.6
2 5
.97
-
100.
00%
12
NP
Sud
SAS
31-1
2-17
EURO
7.6
4 7
.47
36.
91
21.
80
-
57.
03
6.4
7 1
.80
4.6
7 2
.86
100.
00%
13
AIP
SAS
31-1
2-17
EURO
15.
28
52.
61
95.
95
28.
06
-
129
.19
23.
38
7.5
6 1
5.82
7
.64
100.
00%
14N
P H
unga
ria K
FT31
-12-
17EU
RO 3
0.56
7
4.57
1
66.7
8 6
1.65
-
1
92.0
8 1
8.24
2
.24
16.
00
21.
39
100.
00%
15N
P Sl
ovak
ia S
RO31
-12-
17EU
RO 7
.64
16.
28
42.
17
18.
25
-
64.
21
6.5
7 1
.42
5.1
5 3
.82
100.
00%
16
NP
Tuni
sia
SARL
31-1
2-17
EURO
16.
37
45.
24
76.
34
14.
73
-
91.
74
14.
52
0.4
8 1
4.04
2
2.92
10
0.00
%17
NP
Mor
occo
SAR
L31
-12-
17EU
RO 9
.70
54.
33
94.
93
30.
90
-
140
.79
13.
76
3.4
2 1
0.34
1
.80
100.
00%
18
Sic
mo
SA
S31
-12-
17EU
RO 3
.82
2.1
4 9
.03
3.0
7 -
1
4.76
0
.33
-
0.3
3 -
10
0.00
%19
NP
Ger
man
y G
mbh
31-1
2-17
EURO
22.
92
19.
02
66.
38
24.
44
-
141
.82
12.
36
3.8
7 8
.49
8.0
2 10
0.00
%2
0N
P Po
lska
31-1
2-17
EURO
14.
58
19.
50
79.
59
45.
51
-
104
.02
3.4
9 0
.66
2.8
3 -
10
0.00
%2
1S
imo
nin
SA
S31
-12-
17EU
RO 1
5.28
8
3.86
1
92.5
1 9
3.37
-
3
64.3
8 2
8.23
8
.68
19.
55
9.4
7 10
0.00
%2
2Ca
pele
c SA
S31
-12-
17EU
RO 2
.75
(3.1
6) 5
6.08
5
6.49
-
1
54.0
6 (2
.74)
-
(2.7
4) -
10
0.00
%
# Th
e In
dian
rupe
e eq
uiva
lent
s of
the
figur
es g
iven
in th
e fo
reig
n cu
rrenc
ies
in th
e ac
coun
ts o
f the
sub
sidi
ary
com
pani
es, h
ave
been
giv
en o
n th
e ba
sis
of a
ppro
pria
te e
xcha
nge
rate
as
follo
ws
: 1
Euro
= `
76.
39 (3
1.12
.201
7), 1
USD
= `
63.
93, (
31.1
2.20
17) &
` 6
5.04
(31.
03.2
018)
*
Fina
ncia
l Inf
orm
atio
n is
bas
ed o
n U
naud
ited
Resu
lts.
No
te:
N
am
e o
f th
e su
bsi
dia
ries
wh
ich
ha
ve b
een
liq
uid
ate
d/d
isso
lved
/mer
ged
/in
corp
ora
ted
du
rin
g t
he
yea
r:
1
Sin
tex
Aust
ria B
.V. h
as b
een
mer
ged
with
Sin
tex
Hol
ding
s B.
V.
2
Sou
thga
te B
usin
ess
Corp
. has
bee
n di
ssol
ved.
3 A
mra
nge
Inc.
has
bee
n di
ssol
ved.
4 S
inte
x W
ausa
ukee
Com
posi
tes
Inc.
has
bee
n liq
uida
ted.
5 S
inte
x Fr
ance
SAS
has
bee
n m
erge
d w
ith S
inte
x N
P SA
S.
6
Sin
tex
Logi
stic
s LL
C, U
SA h
as b
een
Inco
rpor
ated
.
(` in
Cro
res)
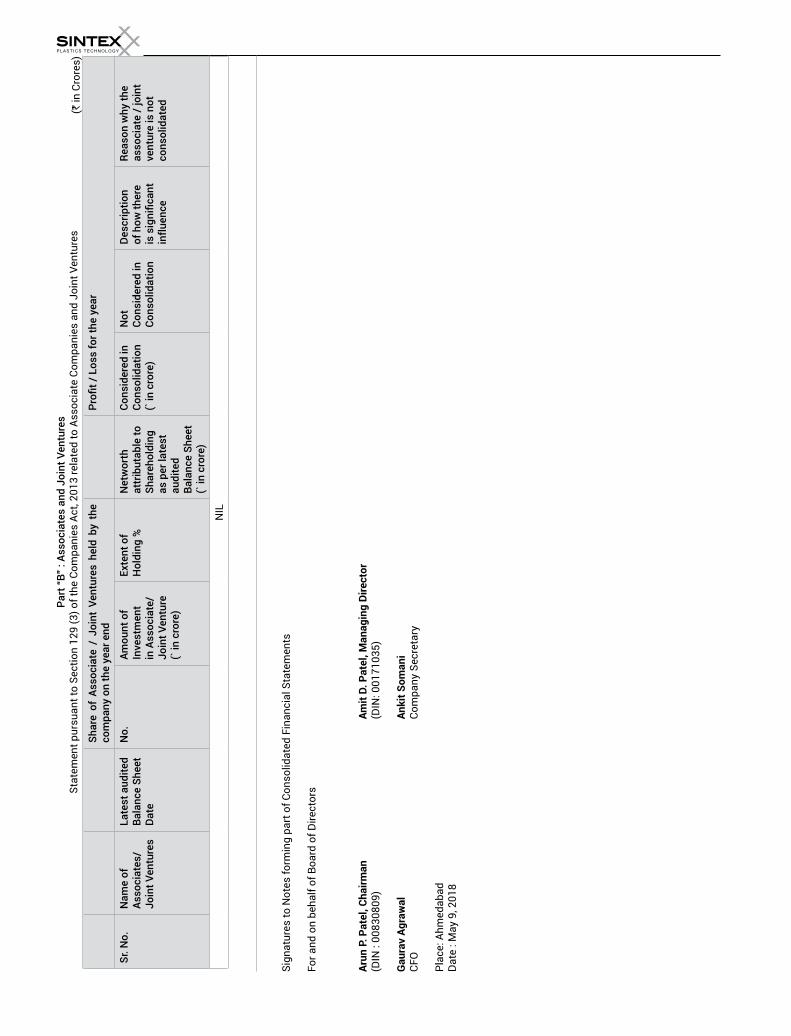
Pa
rt “
B”
: Ass
oci
ate
s a
nd
Jo
int
Ven
ture
s St
atem
ent p
ursu
ant t
o Se
ctio
n 12
9 (3
) of t
he C
ompa
nies
Act
, 201
3 re
late
d to
Ass
ocia
te C
ompa
nies
and
Joi
nt V
entu
res
Sh
are
of
Ass
oci
ate
/ J
oin
t V
entu
res
hel
d b
y th
e co
mp
an
y o
n t
he
yea
r en
dPr
ofit /
Los
s fo
r the
yea
r
Sr.
No
.N
am
e o
f A
sso
cia
tes/
Jo
int
Ven
ture
s
La
test
au
dit
ed
Ba
lan
ce S
hee
t D
ate
No
.A
mo
un
t o
f In
vest
men
t in
Ass
oci
ate
/J
oin
t V
entu
re
(` in
cro
re)
Ext
ent
of
Ho
ldin
g %
Net
wo
rth
a
ttri
bu
tab
le t
o
Sh
are
ho
ldin
g
as
per
late
st
au
dit
ed
Ba
lan
ce S
hee
t (`
in c
rore
)
Co
nsi
der
ed in
C
on
solid
ati
on
(`
in c
rore
)
No
t C
on
sid
ered
in
Co
nso
lida
tio
n
Des
crip
tio
n
of
ho
w t
her
e is
sig
nific
ant
infl
uen
ce
Rea
son
wh
y th
e a
sso
cia
te /
join
t ve
ntu
re is
no
t co
nso
lida
ted
NIL
Sign
atur
es to
Not
es fo
rmin
g pa
rt o
f Con
solid
ated
Fin
anci
al S
tate
men
ts
For a
nd o
n be
half
of B
oard
of D
irect
ors
Aru
n P
. P
ate
l, C
ha
irm
an
Am
it D
. P
ate
l, M
an
ag
ing
Dir
ect
or
(DIN
: 00
8308
09)
(D
IN: 0
0171
035)
Ga
ura
v A
gra
wa
l
An
kit
So
ma
ni
CFO
Com
pany
Sec
reta
ry
Plac
e: A
hmed
abad
D
ate
: May
9, 2
018
(` in
Cro
res)


Sintex Plastics Technology LimitedIn the premises of Sintex - BAPL Ltd.,
Near Seven Garnala, Kalol (N.G.) - 382721, Gujarat, India.