zurich open repository and archive year: 2013...zurich open repository and archive university of...
TRANSCRIPT
Zurich Open Repository andArchiveUniversity of ZurichMain LibraryStrickhofstrasse 39CH-8057 Zurichwww.zora.uzh.ch
Year: 2013
Airborne prism experiment calibration information system
Hueni, Andreas ; Lenhard, Karim ; Baumgartner, Andreas ; Schaepman, Michael E
Abstract: The calibration of remote sensing instruments is a crucial step in the generation of productstied to international reference standards. Calibrating imaging spectrometers is particularly demandingdue to the high number of spatiospectral pixels and, consequently, the large amount of data acquiredduring calibration sequences. Storage of these data and associated meta-data in an organized manner, aswell as the provision of efficient tools for the data analysis and fast and repeatable calibration coefficientgeneration with provenance information, is key to the provision of traceable measurements. The airborneprism experiment (APEX) calibration information system is a multilayered information technology solu-tion comprising a database based on the entity–attribute–value (EAV) paradigm and software written inJava and MATLAB, providing data access, visualization and processing, and handling the data volumesover the expected lifetime of the system. Although developed in the context of APEX, the system israther generic and may be adapted to other pushbroom-based imagers with little effort.
DOI: https://doi.org/10.1109/TGRS.2013.2246575
Posted at the Zurich Open Repository and Archive, University of ZurichZORA URL: https://doi.org/10.5167/uzh-77303Journal ArticlePublished Version
Originally published at:Hueni, Andreas; Lenhard, Karim; Baumgartner, Andreas; Schaepman, Michael E (2013). Airborneprism experiment calibration information system. IEEE Transactions on Geoscience and Remote Sensing,51(11):5169-5180.DOI: https://doi.org/10.1109/TGRS.2013.2246575

This article has been accepted for inclusion in a future issue of this journal. Content is final as presented, with the exception of pagination.
IEEE TRANSACTIONS ON GEOSCIENCE AND REMOTE SENSING 1
Airborne Prism Experiment CalibrationInformation System
Andreas Hueni, Member, IEEE, Karim Lenhard, Andreas Baumgartner,and Michael E. Schaepman, Senior Member, IEEE
Abstract— The calibration of remote sensing instruments is acrucial step in the generation of products tied to internationalreference standards. Calibrating imaging spectrometers is par-ticularly demanding due to the high number of spatiospectralpixels and, consequently, the large amount of data acquiredduring calibration sequences. Storage of these data and associatedmeta-data in an organized manner, as well as the provisionof efficient tools for the data analysis and fast and repeatablecalibration coefficient generation with provenance information,is key to the provision of traceable measurements. The airborneprism experiment (APEX) calibration information system isa multilayered information technology solution comprising adatabase based on the entity–attribute–value (EAV) paradigmand software written in Java and MATLAB, providing data access,visualization and processing, and handling the data volumesover the expected lifetime of the system. Although developedin the context of APEX, the system is rather generic and maybe adapted to other pushbroom-based imagers with little effort.
Index Terms— Imaging spectroscopy, relational database, sen-sor calibration.
I. INTRODUCTION
REMOTE sensing technologies have the potential ofacquiring data with a spatial coverage, temporal resolu-
tion, and continuity, which allow the parameterization of earthsystem science models at regional and global scales. Suchremotely sensed data are referred to as fundamental climatedata records (FCDRs). These basic data are subsequently trans-formed into end-user products describing essential climatevariables (ECVs) by data assimilation [1]. Of the 44 ECVsidentified in the Global Climate Observing System SecondAdequacy Report [2], a total of 25 are largely dependenton satellite observations, effectively rendering remote sensinginstruments one of the most important means of data collectionfor earth system sciences.
Of the multitude of available sensor systems, the fam-ily of imaging spectrometers exhibits a high potential forthe retrieval of ECVs from all spheres of the climate sys-tem [3], [4]. While some spaceborne imaging spectrometersdo exist [5], [6] or are planned, [4], [7]–[9], most instru-
Manuscript received September 29, 2012; revised December 2, 2012;accepted January 22, 2013.
A. Hueni and M. E. Schaepman are with the Remote Sensing Laboratories,University of Zurich, Zurich 8057, Switzerland (e-mail: [email protected];[email protected]).
K. Lenhard and A. Baumgartner are with the Remote Sensing TechnologyInstitute, Oberpfaffenhofen 15236, Germany (e-mail: [email protected];[email protected]).
Color versions of one or more of the figures in this paper are availableonline at http://ieeexplore.ieee.org.
Digital Object Identifier 10.1109/TGRS.2013.2246575
Fig. 1. DIKW applied to remote sensing system calibration and productgeneration.
ments [10]–[13] are currently deployed on airborne plat-forms [3].
The calibration of imaging spectroradiometers and theirdata is technically demanding due to the high number ofspatial/spectral pixels, and also hampered by the notion thatspectroradiometer measurements are still considered as oneof the least reliable of all physical measurements [14], [15].Calibration is an essential and critical step before higher prod-uct generation can be achieved with the accuracies required forthe successful parameterization of climate models in order toreduce the uncertainties of predictions [16].
Imaging spectrometers generally measure at-sensor radi-ances by reference to Internation System of Units (SI) througheither laboratory or vicarious calibration. System calibrationallows defining the traceability of measurements to the SIstandard and hence enables the comparison of data stemmingfrom different sensor systems. Such traceable calibration formsthe basis for the generation of consistent geophysical andbiophysical products [17].
These dependencies may be conceptualized using anadapted data–information–knowledge–wisdom (DIKW) [18],[19] representation (Fig. 1). DIKW is a model describing thebuilding of knowledge from information based on facts or dataand hence has found use in multidisciplinary research, rang-ing from philosophy to systems analysis [20], [21]. Variousflavours of the DIKW do exist [22], and for the purpose ofthis research, we add the notion of signals [23] while omittingthe rather elusive tier of wisdom [24].
0196-2892/$31.00 © 2013 IEEE
This article has been accepted for inclusion in a future issue of this journal. Content is final as presented, with the exception of pagination.
2 IEEE TRANSACTIONS ON GEOSCIENCE AND REMOTE SENSING
The lowest tier is formed by the physical standards,i.e., SI units, as provided by national metrology institutes.Here, instrumentation used in calibration laboratories may becalibrated and thus made traceable; these are the secondarystandards, equivalent to tier 2. This second tier producesoptical stimuli leading to calibration sensor responses andinformation derived thereof. These data and information con-stitute the third tier and are held by a component we referto as the calibration information system (CAL IS). Calibratedflight data (tier 4) are based on calibration information and aregenerated by processing and archiving facilities (PAFs) [25].Products are the output of higher level algorithms and formthe top of the pyramid, being equivalent to knowledge as itadds actionability to information [22].
We define a CAL IS as a system layer that stores rawsensor calibration and characterization data and generatesinformation describing the instrument’s electrooptical chainthat converts signals from a continuous electromagnetic spaceinto digital numbers within a discrete space. The CAL ISproduces calibration coefficients used by the PAF to calibrateflight data and by this establishes the traceability link betweenairborne data and physical standards. The CAL IS holdsinformation that leads to an enhanced understanding of thesensor properties and characteristics and as such supports thecalibration scientists in developing their system knowledge.
This paper defines the data sources generating raw calibra-tion and characterization data, lists the requirements for a CALIS, and documents the chosen implementation. The systemis targeted at the airborne prism experiment (APEX) system,but the general concept essentially applies to any frame basedimaging system.
II. DATA SOURCES
A. APEX
The European Agency’s (ESA) airborne imaging spec-trometer APEX was developed under the PROgramme deDéveloppement d’EXpériences scientifiques (PRODEX) pro-gram by a Swiss–Belgian consortium with the concept phasestarting in 1998 and leading to a first test flight in 2008.APEX was formally accepted by ESA at the end of 2010and entered the exploitation phase in 2011. It features upto 532 spectral bands in full spectral mode, ranging from375 to 2500 nm. Spectral programmability of the VNIRsensor enables achieving higher signal-to-noise ratios (SNRs)by reducing the number of bands in a binned configuration.Data are acquired in 1000 pixels across track with a fieldof view (FOV) of 28°, resulting in ground pixel sizes of1.5–2.5 m at typical flight levels of 3000–5000 m aboveground.
The main components of the APEX system are: 1) an opticalsubunit (OSU) containing the optoelectronics; 2) a controland storage unit (CSU) comprising the instrument controlcomputer, solid state devices for the storage of the data stream,and a positioning system; and 3) a temperature control unit(TCU) responsible for the regulation of the OSU optical baseplate temperature to a stabilized 20 °C.
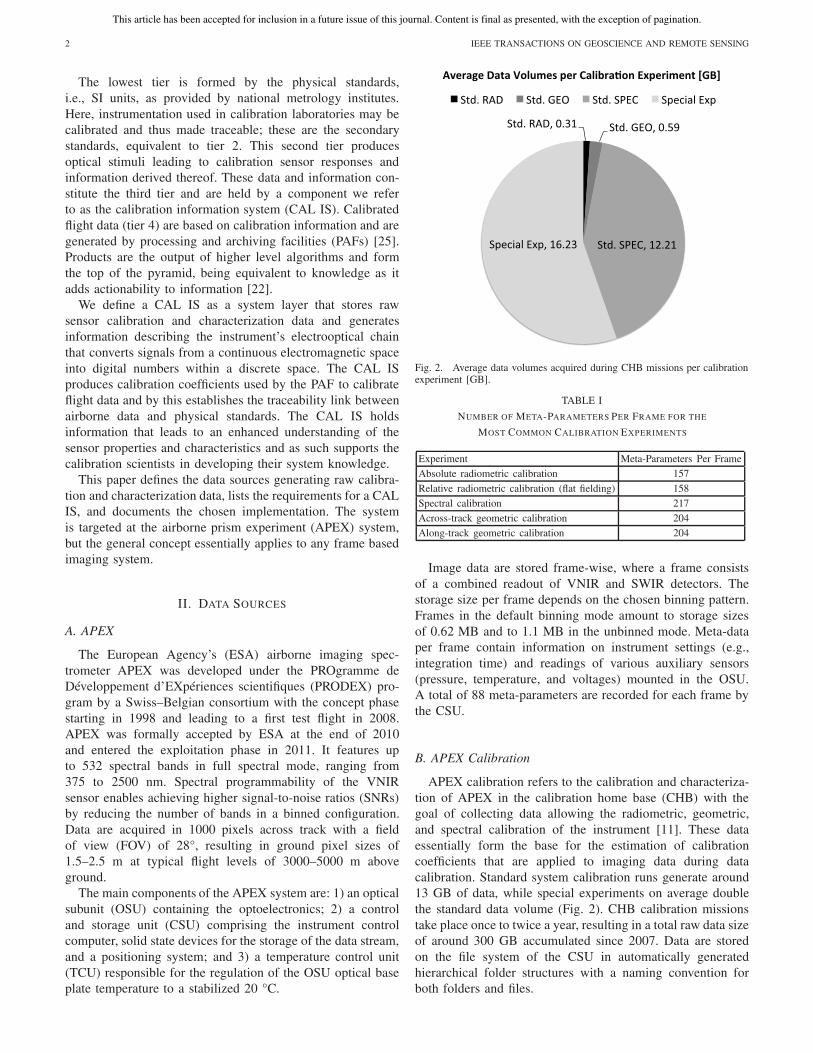
Fig. 2. Average data volumes acquired during CHB missions per calibrationexperiment [GB].
TABLE I
NUMBER OF META-PARAMETERS PER FRAME FOR THE
MOST COMMON CALIBRATION EXPERIMENTS
Experiment Meta-Parameters Per FrameAbsolute radiometric calibration 157Relative radiometric calibration (flat fielding) 158Spectral calibration 217Across-track geometric calibration 204Along-track geometric calibration 204
Image data are stored frame-wise, where a frame consistsof a combined readout of VNIR and SWIR detectors. Thestorage size per frame depends on the chosen binning pattern.Frames in the default binning mode amount to storage sizesof 0.62 MB and to 1.1 MB in the unbinned mode. Meta-dataper frame contain information on instrument settings (e.g.,integration time) and readings of various auxiliary sensors(pressure, temperature, and voltages) mounted in the OSU.A total of 88 meta-parameters are recorded for each frame bythe CSU.
B. APEX Calibration
APEX calibration refers to the calibration and characteriza-tion of APEX in the calibration home base (CHB) with thegoal of collecting data allowing the radiometric, geometric,and spectral calibration of the instrument [11]. These dataessentially form the base for the estimation of calibrationcoefficients that are applied to imaging data during datacalibration. Standard system calibration runs generate around13 GB of data, while special experiments on average doublethe standard data volume (Fig. 2). CHB calibration missionstake place once to twice a year, resulting in a total raw data sizeof around 300 GB accumulated since 2007. Data are storedon the file system of the CSU in automatically generatedhierarchical folder structures with a naming convention forboth folders and files.

This article has been accepted for inclusion in a future issue of this journal. Content is final as presented, with the exception of pagination.
HUENI et al.: APEX CALIBRATION INFORMATION SYSTEM 3
Calibration settings are sent to the CHB equipment andthese parameters are also added to the meta-data file associatedwith each frame. The total number of meta-parameters perframe generated during calibration depends on the calibrationexperiment, comprising APEX system parameters and CHBsettings as provided by the CHB interface (Table I).
C. Calibration Home Base
The CHB was commissioned by ESA for the calibration ofAPEX [26]. However, the laboratory can also be used for othersensors since imaging spectrometers used in optical remotesensing often display similar properties. The CHB providesdefined light sources in the typical wavelength range of theseinstruments: integrating spheres for the radiometric calibration,and a monochromator assembly and a slit-collimator assemblyin combination with a rotating mirror on a translation stageto generate optical stimuli for the spectral and geometriccalibration, respectively.
Since the spectral and geometric calibration procedures canconsist of several hundreds or thousands of short measure-ments with different settings of the involved light source, theCHB was set up with automation kept in mind. The softwarecontrolling the calibration procedures was designed based onthe master/slave pattern. The slave controls the CHBs devicesand light sources, while the master runs calibration proceduresby requesting CHB settings from the slave and managingthe data acquisition of APEX. Generally speaking, the masterprovides an interface to define measurement sequences, withspecific routines being written for each specific calibrationexperiment.
The communication between master and slave follows asynchronous client/server model, in which the slave takes therole of the server and receives requests by the master [27].Each request for CHB settings generates exactly one reply,which indicates that the CHB has assumed the requestedstate and is ready for measurements. This reply contains allthe meta-data generated by the CHB. These meta-data stemfrom the laboratory devices, e.g., specifying the wavelength towhich the monochromator is set, and from an environmentalsensor that supplies room temperature, atmospheric pressure,and humidity.
The communication between master and slave takes placeover a TCP/IP connection, allowing operating master andslave on separate computers. The data are exchanged in theform of eXtensible Markup Language (XML) files, which arehuman-readable and well suited for the small amount of dataexchanged, which is on the order of 1 kB per request/reply. Anadditional advantage of using XML files is that their contentcan be checked for consistency against an XML schema def-inition (XSD) file. This includes checks for the completenessof the parameters, their data type, and their valid ranges.
III. REQUIREMENTS
APEX CAL IS requirements are mainly based on the goalsof generating system calibration information and enhancingthe knowledge about the system in general, as well as on theexpected data volumes over the nominal lifetime of the system.
Fig. 3. Estimated RAW data volumes for two scenarios over the expectedsystem lifetime.
A. Data Volumes
The CAL IS must be able to handle the estimated totaldata volume over the expected lifetime of the system. Thedata volume includes calibration data acquired during theoperational stage, currently set at 10 years, plus data acquiredduring the system acceptance test phase. Raw data volumesrange between 290 and 410 GB under two different scenarios(Fig. 3): 1) per-annum volumes remain identical to the currentaverage, i.e., special experiments constitute half of the volumeand 2) special experiment volumes diminish exponentially overtime, leading to per-annum volumes mainly governed by thestandard data calibration runs.
These estimated volumes will roughly double when data areprocessed to level-1 in the CAL IS, i.e., leading to total sizesin the order of 0.6–0.8 TB.
B. Generic Frame Support
The number of spectral pixels of an APEX frame dependson the binning patterns applied to the VNIR detector. TheCAL IS must be able to seamlessly handle frames of differingbinning patterns, including the frame-size-independent stor-age and the generation of calibration coefficients for variousbinning patterns.
C. Flexible Meta-Parameters
A flexible handling of the number of meta-parameters perframes is required because: 1) the number of meta-parametersis dependent on the particular calibration experiment; 2) theCAL IS can add new meta-parameters generated from bothmeta-data and frame data during the forming of information;and 3) upgrades in the CHB may lead to different or additionalmeta-parameters over time.
D. Data Ingestion, Data Structuring, and Quality Control
Data ingestion must be an automated process, retrievingframe and meta-data from the files generated during calibra-tion. Near-real-time data control during calibration missionsrequires loading data into the CAL IS at various points intime, i.e., allowing data ingestion with a delta data loadingcapability.

This article has been accepted for inclusion in a future issue of this journal. Content is final as presented, with the exception of pagination.
4 IEEE TRANSACTIONS ON GEOSCIENCE AND REMOTE SENSING
The data hierarchy generated during the calibration cam-paign on the CSU reflects the experimental structure andprovides an easy way for the users to interactively navigatethrough the wealth of calibration data. The CAL IS must retainsuch structures and replicate them within the database.
Automated generation of quality flags is important for tworeasons: 1) detection of problems in near-real time duringcalibration runs and 2) exclusion of unsuitable data fromcalibration coefficient generation processes. Examples includesaturation detection or thresholds for system temperatures andpressures.
E. Support for Processing Levels
The concept of processing levels is identical to the onecommonly implemented in airborne and space-based instru-ment PAFs. The levels reflect various stages of processingin the system and allow the efficient generation of higherlevel products without a complete reprocessing starting fromraw sensor data. Storage of several processing levels allowsthe easy study of effects caused by transforming processes,helping the debugging of according algorithms. Table II liststhe required processing levels of the APEX CAL IS.
F. Interactive Data Exploration
Developing a sound knowledge about the sensor system andcontrolling the generation of calibration coefficients require theability to graphically explore data in an interactive fashion.The dimensions to be explored are: 1) the spatiospectral pixelvalues of a frame 2) the time domain as the system responsechanges due to modification of or noises in the external stimulior due to system-inherent drifts or noises 3) the meta-dataspace [28] and 4) combined meta-data–spatiospectral domainswhere the spectral response at any pixel may be mapped versusparameters of the meta-data space.
G. Provenance
Provenance describes the origin and evolution of data [29].This information is important for the APEX CAL IS, as itallows tracing effects found at any processing stage to itsoriginal cause. Provenance data forms a graph consisting ofdata sources, data sinks, and processes. Such a topology isalso highly useful when the definition of uncertainty budgets isrequired, as all the contributing sources of noise are essentiallygiven by the provenance graph.
An example is the level-0 to level-1 processing, i.e., the darkcurrent correction: each level-1 frame must have an associatedcreating process description and links to both level-0 frameand dark current frame used for the correction.
IV. CONCEPTS
A. Overall Architecture
The APEX CAL IS is designed as a multilayered system(Fig. 4). A relational database management system (RDBMS)serves as storage solution, implemented by a MySQL server(Version 5.5). Data are stored in physical database tableswithin the RDBMS, using a mixture of traditional relational
Fig. 4. APEX CAL IS layers.
Fig. 5. APEX CAL IS system architecture and dataflow.
database model and of a meta-system architecture known asthe EAV paradigm [30]. The EAV meta-layer is the representa-tion of the meta-data known to the APEX CAL IS by accord-ing entries in physical database tables. The database connec-tion and representation layer is written in Java and handlesall communications with the database, offering functionalityfor data insert, querying, and deletion, essentially mappingthe EAV information to an object-oriented representation andrepresenting frame data as matrices. The application layerholds routines for the analysis and processing of data, includ-ing the graphical representation. This layer is implementedin MATLAB (Release 2010a) using Java components for thecommunication with the database and for some graphical datarepresentations.
Fig. 5 illustrates the dataflow and the overall system archi-tecture. Frame and meta-data files are transferred from theAPEX CSU to a workstation by FTP. A pure Java-basedapplication is used to ingest these files into the APEX CALIS database, which is hosted by a database server. Higherlevel processing, visualization, and analysis are carried outin a MATLAB environment, relying on Java components fordatabase communication, i.e., on lower level data services asimplemented in the EAV database connection and representa-tion layer. The illustrated setup reflects the most common one,but installations where a laptop takes the role of a databaseserver and processing computer at the same time are alsofeasible, e.g., within the CHB where a direct feed into a remotedatabase server may not be as performant as a locally hosteddatabase instance. The centrally hosted database allows thesimultaneous data access by several researchers.
This article has been accepted for inclusion in a future issue of this journal. Content is final as presented, with the exception of pagination.
HUENI et al.: APEX CALIBRATION INFORMATION SYSTEM 5
TABLE II
APEX CAL IS PROCESSING LEVELS
Designator Name Description
Level-0 RAW Raw frame data as generated by APEX
Level-1 DC Corrected Frame data corrected for the dark current, taken from the closest dark-current frame in the acquisition time line
Level-2 Desmeared Frame data corrected for image smear caused by the readout mechanism(applies only to the VNIR part of the frame)
Level-3 Intermediate system coefficients Coefficients describing the electrooptical chain, but not yet integratedfor all spatiospectral pixels, e.g., gains/offsets for the nadir pixels
Level-4 System calibration layers Coefficients for each spatiospectral pixel, i.e., a matrix of the samedimension as the imaging frame and directly applicable in the datacalibration process within the APEX PAF
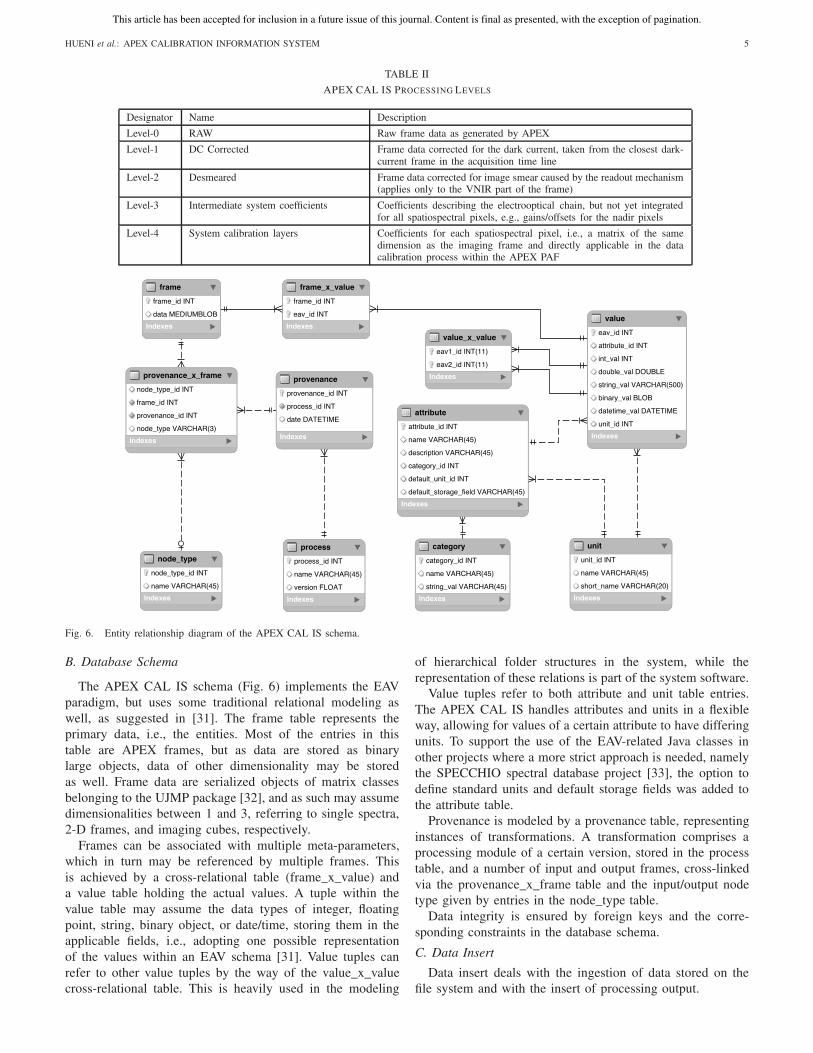
Fig. 6. Entity relationship diagram of the APEX CAL IS schema.
B. Database Schema
The APEX CAL IS schema (Fig. 6) implements the EAVparadigm, but uses some traditional relational modeling aswell, as suggested in [31]. The frame table represents theprimary data, i.e., the entities. Most of the entries in thistable are APEX frames, but as data are stored as binarylarge objects, data of other dimensionality may be storedas well. Frame data are serialized objects of matrix classesbelonging to the UJMP package [32], and as such may assumedimensionalities between 1 and 3, referring to single spectra,2-D frames, and imaging cubes, respectively.
Frames can be associated with multiple meta-parameters,which in turn may be referenced by multiple frames. Thisis achieved by a cross-relational table (frame_x_value) anda value table holding the actual values. A tuple within thevalue table may assume the data types of integer, floatingpoint, string, binary object, or date/time, storing them in theapplicable fields, i.e., adopting one possible representationof the values within an EAV schema [31]. Value tuples canrefer to other value tuples by the way of the value_x_valuecross-relational table. This is heavily used in the modeling
of hierarchical folder structures in the system, while therepresentation of these relations is part of the system software.
Value tuples refer to both attribute and unit table entries.The APEX CAL IS handles attributes and units in a flexibleway, allowing for values of a certain attribute to have differingunits. To support the use of the EAV-related Java classes inother projects where a more strict approach is needed, namelythe SPECCHIO spectral database project [33], the option todefine standard units and default storage fields was added tothe attribute table.
Provenance is modeled by a provenance table, representinginstances of transformations. A transformation comprises aprocessing module of a certain version, stored in the processtable, and a number of input and output frames, cross-linkedvia the provenance_x_frame table and the input/output nodetype given by entries in the node_type table.
Data integrity is ensured by foreign keys and the corre-sponding constraints in the database schema.
C. Data Insert
Data insert deals with the ingestion of data stored on thefile system and with the insert of processing output.
This article has been accepted for inclusion in a future issue of this journal. Content is final as presented, with the exception of pagination.
6 IEEE TRANSACTIONS ON GEOSCIENCE AND REMOTE SENSING
Data loading from the file system uses concepts developedin the SPECCHIO project [33]. It is based on the assumptionthat data are organized by campaign on the file system, eachcampaign folder forming the top of a hierarchical file/folderstructure. Data are ingested into the database campaign byloader processes that parse the campaign folder structure,replicate the hierarchy in the database, and insert all spectralfiles. Data loaders are aware of the existing content of thedatabase and thus will only insert new data found during theparsing. This functionality allows the continuous update of acampaign while data are being collected in the CHB and isreferred to as the “delta loading capability.”
Meta-data are highly redundant between frames, especiallywithin the same calibration experiments, and a redundancyminimization is required to reduce the number of insertedmeta-data parameters per frame and improve the query respon-siveness of the system. This is accomplished by retaining adynamic list of already inserted meta-parameters in the loaderprocesses. In case a meta-parameter matches an existing entryin the list, only a reference is inserted into the frame_x_valuetable.
Meta-data inserts are carried out as bulk inserts, i.e., allrows that are inserted for a frame into the values table andframe_x_values table, respectively, are combined into one SQLstatement, thus minimizing the database statement overheadand leading to an optimized loading speed.
Attributes and units defined in the EAV meta-layer areautomatically updated when new entities are encounteredduring insert procedures, i.e., the EAV layer is built on the flywhile files are ingested or higher level processing generatesnew attributes.
Frames generated by processing existing frames in thedatabase, e.g., dark current correction, are inserted into thedatabase by adding a new row in the frames table and linkingwith existing meta-data of the input frames, thus avoiding dataredundancy. Meta-parameters not applying to the higher levelframes are removed or updated, thus either omitting a linkbetween new frames and original meta-parameters, or addingnew meta-parameters with updated values.
D. Data Retrieval
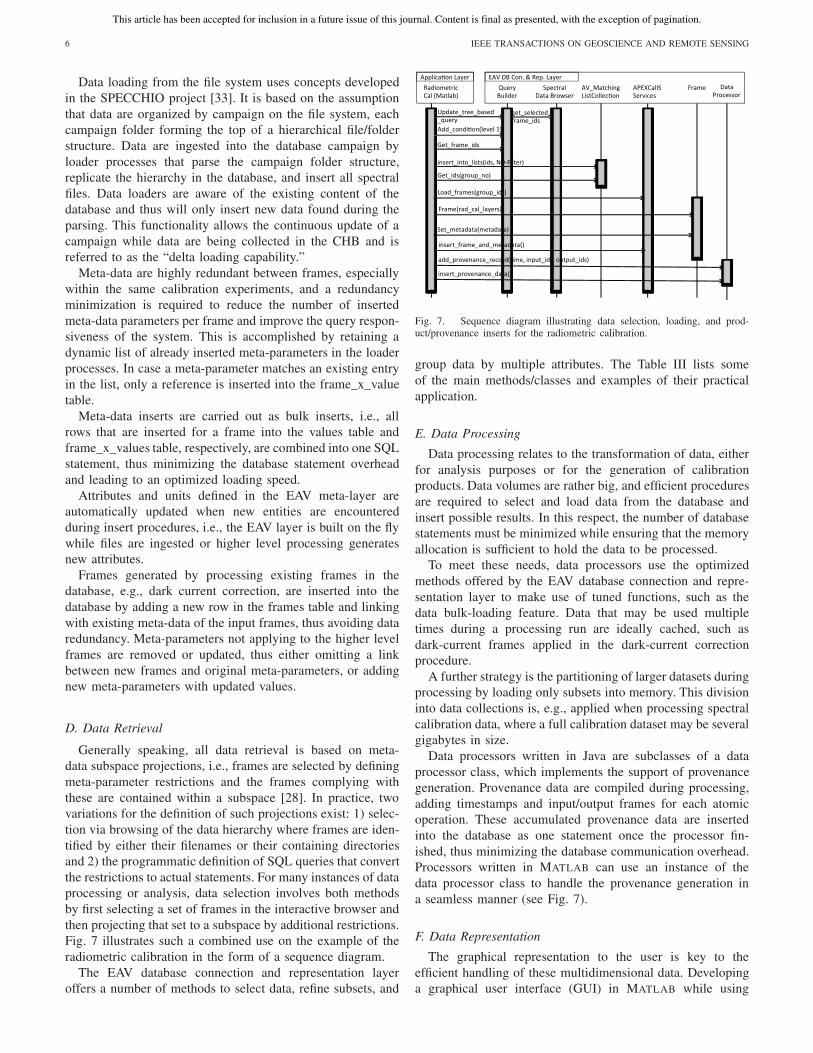
Generally speaking, all data retrieval is based on meta-data subspace projections, i.e., frames are selected by definingmeta-parameter restrictions and the frames complying withthese are contained within a subspace [28]. In practice, twovariations for the definition of such projections exist: 1) selec-tion via browsing of the data hierarchy where frames are iden-tified by either their filenames or their containing directoriesand 2) the programmatic definition of SQL queries that convertthe restrictions to actual statements. For many instances of dataprocessing or analysis, data selection involves both methodsby first selecting a set of frames in the interactive browser andthen projecting that set to a subspace by additional restrictions.Fig. 7 illustrates such a combined use on the example of theradiometric calibration in the form of a sequence diagram.
The EAV database connection and representation layeroffers a number of methods to select data, refine subsets, and
Fig. 7. Sequence diagram illustrating data selection, loading, and prod-uct/provenance inserts for the radiometric calibration.
group data by multiple attributes. The Table III lists someof the main methods/classes and examples of their practicalapplication.
E. Data Processing
Data processing relates to the transformation of data, eitherfor analysis purposes or for the generation of calibrationproducts. Data volumes are rather big, and efficient proceduresare required to select and load data from the database andinsert possible results. In this respect, the number of databasestatements must be minimized while ensuring that the memoryallocation is sufficient to hold the data to be processed.
To meet these needs, data processors use the optimizedmethods offered by the EAV database connection and repre-sentation layer to make use of tuned functions, such as thedata bulk-loading feature. Data that may be used multipletimes during a processing run are ideally cached, such asdark-current frames applied in the dark-current correctionprocedure.
A further strategy is the partitioning of larger datasets duringprocessing by loading only subsets into memory. This divisioninto data collections is, e.g., applied when processing spectralcalibration data, where a full calibration dataset may be severalgigabytes in size.
Data processors written in Java are subclasses of a dataprocessor class, which implements the support of provenancegeneration. Provenance data are compiled during processing,adding timestamps and input/output frames for each atomicoperation. These accumulated provenance data are insertedinto the database as one statement once the processor fin-ished, thus minimizing the database communication overhead.Processors written in MATLAB can use an instance of thedata processor class to handle the provenance generation ina seamless manner (see Fig. 7).
F. Data Representation
The graphical representation to the user is key to theefficient handling of these multidimensional data. Developinga graphical user interface (GUI) in MATLAB while using

This article has been accepted for inclusion in a future issue of this journal. Content is final as presented, with the exception of pagination.
HUENI et al.: APEX CALIBRATION INFORMATION SYSTEM 7
TABLE III
MAIN METHODS/CLASSES FOR DATA RETRIEVAL, LOADING, AND GROUPING
Method/Class Use/Exampleget_list_of_metaparameter_vals (frames,attribute)
Return a list of values for a certain attribute for a set of frames, e.g.,list of integration times per frame
get_eav_ids (frame, attributes) Return all eav_ids of a frame, optionally restricted to an attribute set.Used to retrieve a complete metadata set or a metadata subset of aframe
get_eav_ids (frames, attribute) Generic function to return all eav_ids of a set of frames for anattribute, optionally distinct: e.g., get eav_ids holding the neutraldensity filter value used in absolute calibration
get_closest_product_frames (frame, product) Returns frames that are products (level-3 and level-4) and areclosest on a time line to the supplied frame: e.g., used to identifyspectral calibrations to apply in convolution operations required forradiometric calibration
get_frames_by_attribute (frames, attribute,value)
Returns the frames of a set of frames that have an attribute with avalue matching the supplied one: e.g., select frames out of a subsetthat have a certain neutral density filter value
frame_bulk_reading (frames) Read frames into memory using one database statement for speedreasons. Used to build spectral cubes on the fly
AV_MatchingListCollection Class to group a set of frames by multiple attribute values: e.g., usedto group dark current frames by integration time to build a darkcurrent system model or grouping of absolute calibration frames byneutral density filter as required for radiometric calibration
Java Swing components allows for the seamless integrationof the functionality offered by the EAV database connectionand representation layer with the advanced plotting toolsof MATLAB. A Java key component is the hierarchicaldata browser that graphically represents the structure of thedata as stored in the database as recursive attribute–valueentries. The integration of Swing components in the MATLAB
GUI is accomplished by the JControl package [34].Frame data within the MATLAB environment are represented
as matrices. These are populated by first loading the framesfrom the database into Java where they are deserialized andexist as UJMP instances. In a second step, data are transferredinto MATLAB matrices by using a UJMP to standard Javadouble-array conversion.
V. RESULTS
This section demonstrates the capabilities of the systemby documenting the loading speed for data retrievals andthe graphical data representation on the example of the mainapplication user interface. A detailed description of the indi-vidual calibration and analysis modules is beyond the scopeof this paper and will be treated in dedicated future publica-tions. Readers interested in a practical usage example of theAPEX CAL IS are referred to the case study presented inSection VI.
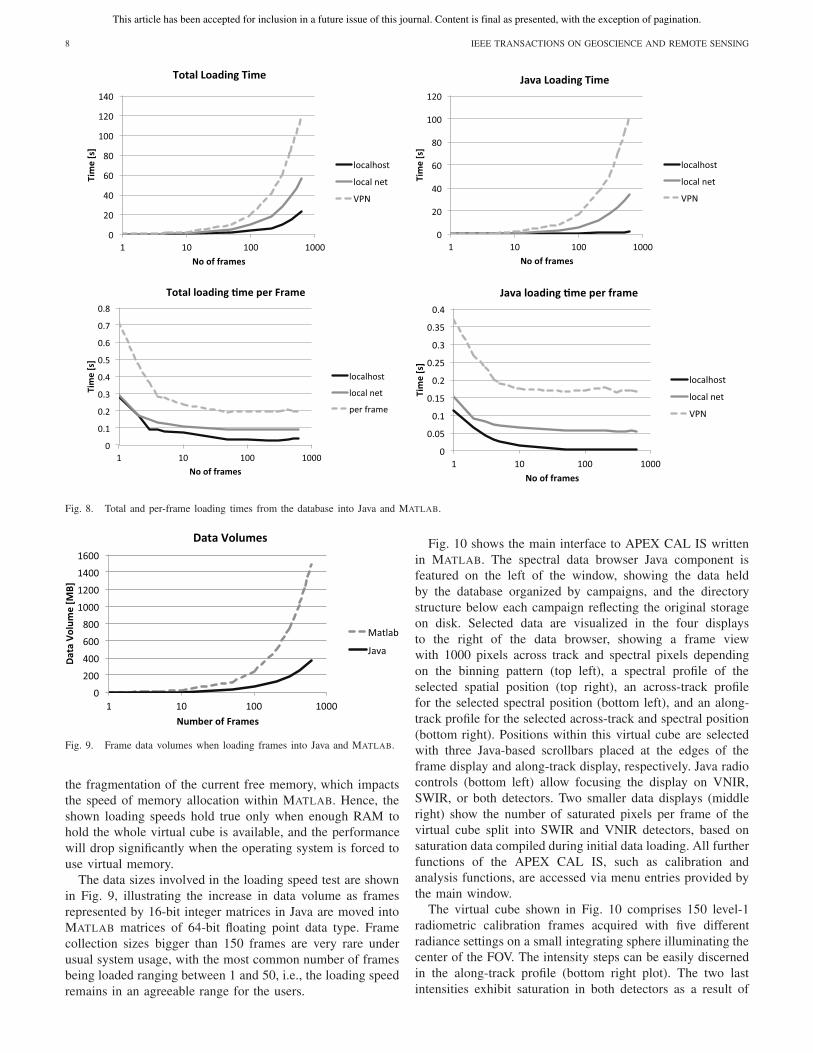
Data loading speed was tested by loading frame collectionsselected in the spectral data browser and ranging between1 and 600 items into MATLAB, using three different setupsto give indicative speeds for the most likely configurations:1) database server and application running on the samemachine, i.e., localhost; 2) database server hosted by amachine in the same Ethernet network as the workstationrunning the application; and 3) database hosted by a serverat our APEX partner institution VITO and the applicationrunning on a workstation at the University of Zurich, witha network connection established using VPN tunneling. The
latter setup being the one used for shared database access forboth the operations and science teams of the APEX project.At the time of the testing, calibration data for the years2010–2012 was loaded into the system, consisting of 190 000frames and 10.2 million meta-parameter entries.
Fig. 8 shows the resulting loading speeds for the threesetups: the total loading time refers to the time needed toload frames from the database into MATLAB (top left); theJava loading time is equivalent to the time spent in the EAVdatabase connection and representation layer to load the framedata from the database into the memory of the workstation (topright); the total loading time per frame is the amount of timerequired to load one frame into MATLAB under the scenarioof different collection sizes (bottom left); and the Java loadingtime per frame is the time spent within Java per frame for thedifferent collection sizes (bottom right).
The results show clearly that the loading speed is a functionof the number frames and largely governed by the time spent inthe EAV database connection and representation layer, loadingthe frame data from the database into Java allocated memory.The loading times are also governed by the type of databaseconnection, with the localhost being fastest as it uses a Unixsocket file, while the most overhead and delays occur for thetunneled connection to a server in a different physical network.
The loading times per frame are a function of both thenumber of frames and the database server hosting location.Data loading involves a certain overhead such as the send-ing of statements and the compilation of meta-data on theframe sizes. Hence smaller frame collections show a notableoverhead per frame, which gets minimized as collection sizesincrease.
Actual speeds of the system can vary, as they are influ-enced by the database server configurations such as thememory allocated for the caching of query results, the overallnetwork traffic, the number of other processes running on theapplication workstation, the amount of RAM available, and
This article has been accepted for inclusion in a future issue of this journal. Content is final as presented, with the exception of pagination.
8 IEEE TRANSACTIONS ON GEOSCIENCE AND REMOTE SENSING
Fig. 8. Total and per-frame loading times from the database into Java and MATLAB.
Fig. 9. Frame data volumes when loading frames into Java and MATLAB.
the fragmentation of the current free memory, which impactsthe speed of memory allocation within MATLAB. Hence, theshown loading speeds hold true only when enough RAM tohold the whole virtual cube is available, and the performancewill drop significantly when the operating system is forced touse virtual memory.
The data sizes involved in the loading speed test are shownin Fig. 9, illustrating the increase in data volume as framesrepresented by 16-bit integer matrices in Java are moved intoMATLAB matrices of 64-bit floating point data type. Framecollection sizes bigger than 150 frames are very rare underusual system usage, with the most common number of framesbeing loaded ranging between 1 and 50, i.e., the loading speedremains in an agreeable range for the users.
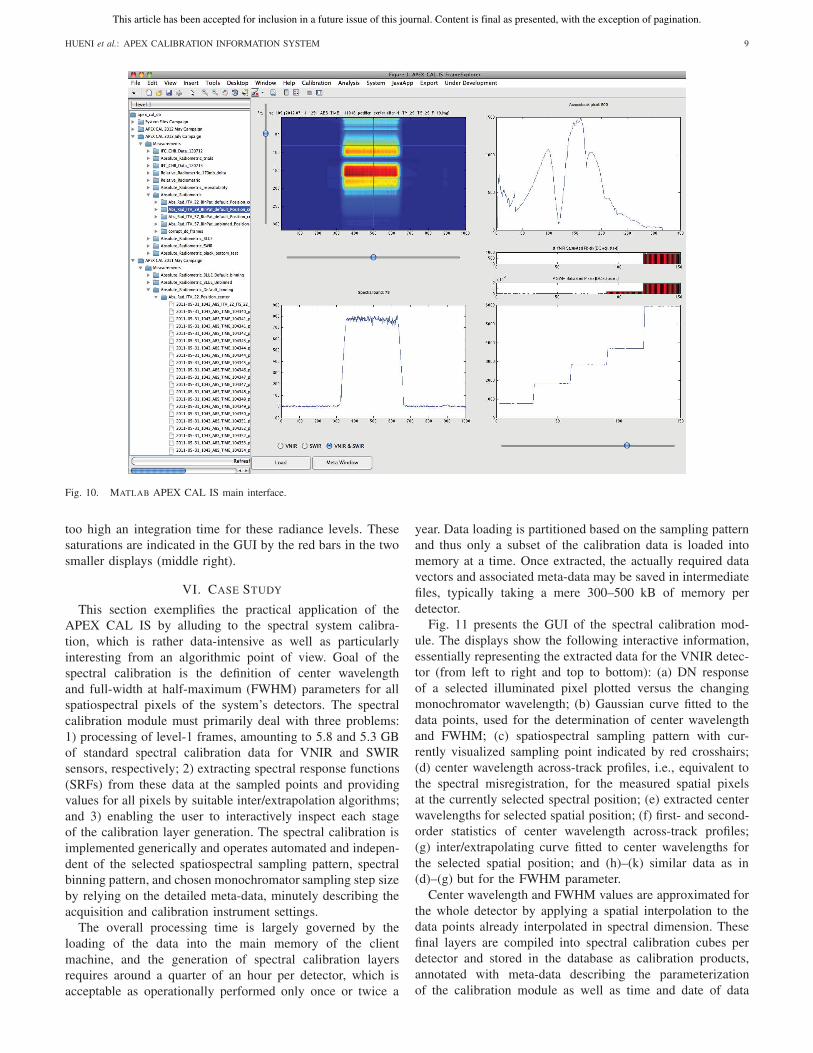
Fig. 10 shows the main interface to APEX CAL IS writtenin MATLAB. The spectral data browser Java component isfeatured on the left of the window, showing the data heldby the database organized by campaigns, and the directorystructure below each campaign reflecting the original storageon disk. Selected data are visualized in the four displaysto the right of the data browser, showing a frame viewwith 1000 pixels across track and spectral pixels dependingon the binning pattern (top left), a spectral profile of theselected spatial position (top right), an across-track profilefor the selected spectral position (bottom left), and an along-track profile for the selected across-track and spectral position(bottom right). Positions within this virtual cube are selectedwith three Java-based scrollbars placed at the edges of theframe display and along-track display, respectively. Java radiocontrols (bottom left) allow focusing the display on VNIR,SWIR, or both detectors. Two smaller data displays (middleright) show the number of saturated pixels per frame of thevirtual cube split into SWIR and VNIR detectors, based onsaturation data compiled during initial data loading. All furtherfunctions of the APEX CAL IS, such as calibration andanalysis functions, are accessed via menu entries provided bythe main window.
The virtual cube shown in Fig. 10 comprises 150 level-1radiometric calibration frames acquired with five differentradiance settings on a small integrating sphere illuminating thecenter of the FOV. The intensity steps can be easily discernedin the along-track profile (bottom right plot). The two lastintensities exhibit saturation in both detectors as a result of
This article has been accepted for inclusion in a future issue of this journal. Content is final as presented, with the exception of pagination.
HUENI et al.: APEX CALIBRATION INFORMATION SYSTEM 9
Fig. 10. MATLAB APEX CAL IS main interface.
too high an integration time for these radiance levels. Thesesaturations are indicated in the GUI by the red bars in the twosmaller displays (middle right).
VI. CASE STUDY
This section exemplifies the practical application of theAPEX CAL IS by alluding to the spectral system calibra-tion, which is rather data-intensive as well as particularlyinteresting from an algorithmic point of view. Goal of thespectral calibration is the definition of center wavelengthand full-width at half-maximum (FWHM) parameters for allspatiospectral pixels of the system’s detectors. The spectralcalibration module must primarily deal with three problems:1) processing of level-1 frames, amounting to 5.8 and 5.3 GBof standard spectral calibration data for VNIR and SWIRsensors, respectively; 2) extracting spectral response functions(SRFs) from these data at the sampled points and providingvalues for all pixels by suitable inter/extrapolation algorithms;and 3) enabling the user to interactively inspect each stageof the calibration layer generation. The spectral calibration isimplemented generically and operates automated and indepen-dent of the selected spatiospectral sampling pattern, spectralbinning pattern, and chosen monochromator sampling step sizeby relying on the detailed meta-data, minutely describing theacquisition and calibration instrument settings.
The overall processing time is largely governed by theloading of the data into the main memory of the clientmachine, and the generation of spectral calibration layersrequires around a quarter of an hour per detector, which isacceptable as operationally performed only once or twice a
year. Data loading is partitioned based on the sampling patternand thus only a subset of the calibration data is loaded intomemory at a time. Once extracted, the actually required datavectors and associated meta-data may be saved in intermediatefiles, typically taking a mere 300–500 kB of memory perdetector.
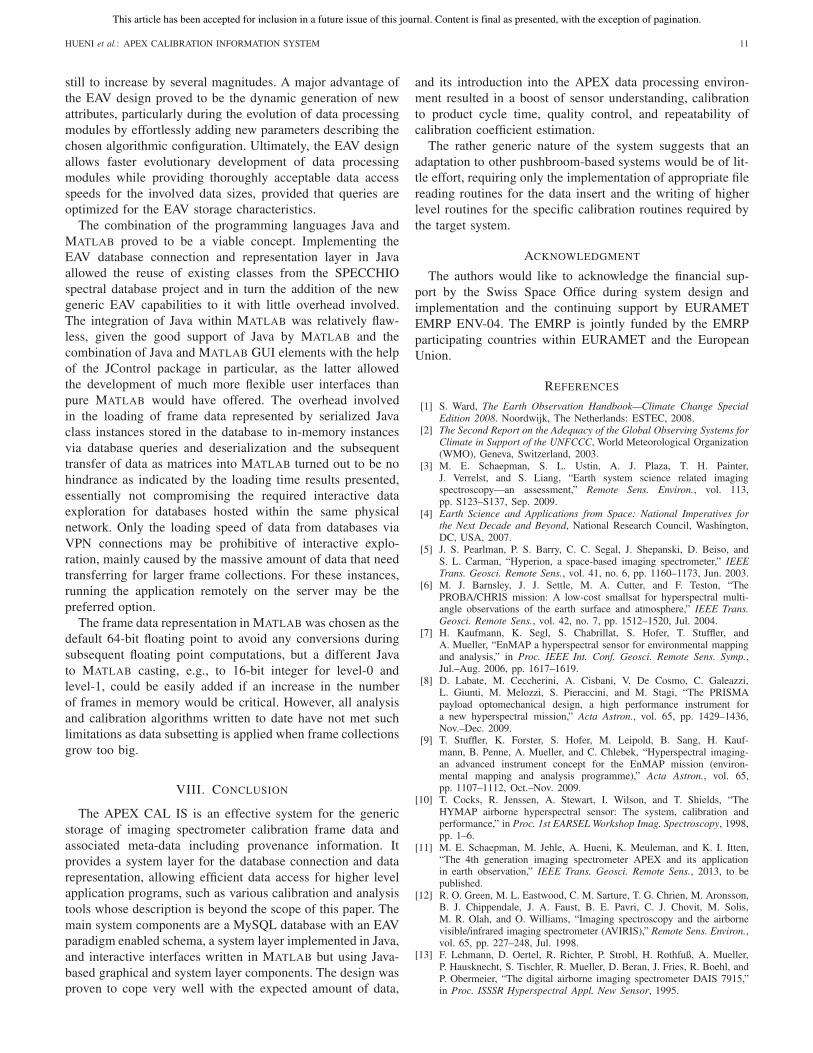
Fig. 11 presents the GUI of the spectral calibration mod-ule. The displays show the following interactive information,essentially representing the extracted data for the VNIR detec-tor (from left to right and top to bottom): (a) DN responseof a selected illuminated pixel plotted versus the changingmonochromator wavelength; (b) Gaussian curve fitted to thedata points, used for the determination of center wavelengthand FWHM; (c) spatiospectral sampling pattern with cur-rently visualized sampling point indicated by red crosshairs;(d) center wavelength across-track profiles, i.e., equivalent tothe spectral misregistration, for the measured spatial pixelsat the currently selected spectral position; (e) extracted centerwavelengths for selected spatial position; (f) first- and second-order statistics of center wavelength across-track profiles;(g) inter/extrapolating curve fitted to center wavelengths forthe selected spatial position; and (h)–(k) similar data as in(d)–(g) but for the FWHM parameter.
Center wavelength and FWHM values are approximated forthe whole detector by applying a spatial interpolation to thedata points already interpolated in spectral dimension. Thesefinal layers are compiled into spectral calibration cubes perdetector and stored in the database as calibration products,annotated with meta-data describing the parameterizationof the calibration module as well as time and date of data

This article has been accepted for inclusion in a future issue of this journal. Content is final as presented, with the exception of pagination.
10 IEEE TRANSACTIONS ON GEOSCIENCE AND REMOTE SENSING
Fig. 11. Interface of the APEX CAL IS spectral calibration module, showing VNIR data.
acquisition and layer generation. At this point, it is readilyavailable to the CAL IS to parameterize operations, suchas spectral convolution, required during the radiometriccalibration of the system.
VII. DISCUSSION
In the following, we will discuss the selected architectures,namely the database schema and the interface software orga-nized as layers using two programming languages, as theseinitial choices during system design have an impact on thescalability, flexibility, and speed of the final system, as wellas on the implementation effort.
The choice of a flexible data schema, mainly based on theEAV paradigm, over a traditional database schema is a criticalone, as it allows a very flexible approach to the handling ofmeta-data but, on the other hand, database performance maydrop considerably as data sizes increase, the latter being oneof the main criticisms of the EAV scheme. The flexibilityof the system regarding frame-related meta-data could beproven, but careful analysis was needed when consideringthe modeling of the provenance. Including the provenanceinformation into the EAV concept was initially considered,but the graph structure with processor and specific processinginformation would not easily fit into the EAV without amassive overhead of logic implemented in the data repre-sentation layer. Hence it was decided to add provenance astraditional relational structure, keeping the EAV representationas simple as possible. Data retrieval speed is a matter ofthe origin of data selection queries. Meta-data are queriedextremely fast when starting from the primary datasets (entity-centric operation), while selecting frames based on their meta-data (attribute-centric operation) is more time consuming; thiseffect is in fact a well known property of EAV databases [31].
For the attribute-centric operation, a careful consideration ofthe SQL statements is required. Rewriting of queries duringimplementation to optimize them for the EAV case proved tobe essential, sometimes improving the speed by a factor of 10or more. It was also found that overly complex queries werebetter split into several consecutive queries, with intermediateresults being cached in the EAV database connection andrepresentation layer. An additional concept that proved usefulin improving the speed while keeping database statementssimple was the sorting or filtering by attributes or attributevalues within the application code. The forming of queries aswell as the post-query sorting/filtering in the application wasimplemented as generic as possible within the EAV databaseconnection and representation layer, thus easing and abstract-ing the data access for the application layer. This strategyresulted in a massive implementation effort in the beginningof the project to code the generic database interface butmade consecutive development of calibration specific moduleswithin the application layer extremely efficient.
In hindsight, choosing the EAV paradigm over a tradi-tional relational data model appears to have been the rightchoice. Data query speeds are time efficient and permit afluent interaction between user and system, with a scenariodependant 19%–27% of the expected overall data volumealready being loaded into the database. This performance is notexpected to drop significantly and is in all cases not requiredto be near real time. Key to the system’s performance duringattribute-centric queries is the index definition on the valuestable with indices for eav_id, attribute_id, unit_id, as well asfor the actual values. Besides that, most system queries areentity-centric operations with queries being applied to a framesubset and hence not prone to performance deficiencies. Themain caveat is the implementation of efficient queries, whichmay require several iterations, especially while data sizes are
This article has been accepted for inclusion in a future issue of this journal. Content is final as presented, with the exception of pagination.
HUENI et al.: APEX CALIBRATION INFORMATION SYSTEM 11
still to increase by several magnitudes. A major advantage ofthe EAV design proved to be the dynamic generation of newattributes, particularly during the evolution of data processingmodules by effortlessly adding new parameters describing thechosen algorithmic configuration. Ultimately, the EAV designallows faster evolutionary development of data processingmodules while providing thoroughly acceptable data accessspeeds for the involved data sizes, provided that queries areoptimized for the EAV storage characteristics.
The combination of the programming languages Java andMATLAB proved to be a viable concept. Implementing theEAV database connection and representation layer in Javaallowed the reuse of existing classes from the SPECCHIOspectral database project and in turn the addition of the newgeneric EAV capabilities to it with little overhead involved.The integration of Java within MATLAB was relatively flaw-less, given the good support of Java by MATLAB and thecombination of Java and MATLAB GUI elements with the helpof the JControl package in particular, as the latter allowedthe development of much more flexible user interfaces thanpure MATLAB would have offered. The overhead involvedin the loading of frame data represented by serialized Javaclass instances stored in the database to in-memory instancesvia database queries and deserialization and the subsequenttransfer of data as matrices into MATLAB turned out to be nohindrance as indicated by the loading time results presented,essentially not compromising the required interactive dataexploration for databases hosted within the same physicalnetwork. Only the loading speed of data from databases viaVPN connections may be prohibitive of interactive explo-ration, mainly caused by the massive amount of data that needtransferring for larger frame collections. For these instances,running the application remotely on the server may be thepreferred option.
The frame data representation in MATLAB was chosen as thedefault 64-bit floating point to avoid any conversions duringsubsequent floating point computations, but a different Javato MATLAB casting, e.g., to 16-bit integer for level-0 andlevel-1, could be easily added if an increase in the numberof frames in memory would be critical. However, all analysisand calibration algorithms written to date have not met suchlimitations as data subsetting is applied when frame collectionsgrow too big.
VIII. CONCLUSION
The APEX CAL IS is an effective system for the genericstorage of imaging spectrometer calibration frame data andassociated meta-data including provenance information. Itprovides a system layer for the database connection and datarepresentation, allowing efficient data access for higher levelapplication programs, such as various calibration and analysistools whose description is beyond the scope of this paper. Themain system components are a MySQL database with an EAVparadigm enabled schema, a system layer implemented in Java,and interactive interfaces written in MATLAB but using Java-based graphical and system layer components. The design wasproven to cope very well with the expected amount of data,
and its introduction into the APEX data processing environ-ment resulted in a boost of sensor understanding, calibrationto product cycle time, quality control, and repeatability ofcalibration coefficient estimation.
The rather generic nature of the system suggests that anadaptation to other pushbroom-based systems would be of lit-tle effort, requiring only the implementation of appropriate filereading routines for the data insert and the writing of higherlevel routines for the specific calibration routines required bythe target system.
ACKNOWLEDGMENT
The authors would like to acknowledge the financial sup-port by the Swiss Space Office during system design andimplementation and the continuing support by EURAMETEMRP ENV-04. The EMRP is jointly funded by the EMRPparticipating countries within EURAMET and the EuropeanUnion.
REFERENCES
[1] S. Ward, The Earth Observation Handbook—Climate Change SpecialEdition 2008. Noordwijk, The Netherlands: ESTEC, 2008.
[2] The Second Report on the Adequacy of the Global Observing Systems forClimate in Support of the UNFCCC, World Meteorological Organization(WMO), Geneva, Switzerland, 2003.
[3] M. E. Schaepman, S. L. Ustin, A. J. Plaza, T. H. Painter,J. Verrelst, and S. Liang, “Earth system science related imagingspectroscopy—an assessment,” Remote Sens. Environ., vol. 113,pp. S123–S137, Sep. 2009.
[4] Earth Science and Applications from Space: National Imperatives forthe Next Decade and Beyond, National Research Council, Washington,DC, USA, 2007.
[5] J. S. Pearlman, P. S. Barry, C. C. Segal, J. Shepanski, D. Beiso, andS. L. Carman, “Hyperion, a space-based imaging spectrometer,” IEEETrans. Geosci. Remote Sens., vol. 41, no. 6, pp. 1160–1173, Jun. 2003.
[6] M. J. Barnsley, J. J. Settle, M. A. Cutter, and F. Teston, “ThePROBA/CHRIS mission: A low-cost smallsat for hyperspectral multi-angle observations of the earth surface and atmosphere,” IEEE Trans.Geosci. Remote Sens., vol. 42, no. 7, pp. 1512–1520, Jul. 2004.
[7] H. Kaufmann, K. Segl, S. Chabrillat, S. Hofer, T. Stuffler, andA. Mueller, “EnMAP a hyperspectral sensor for environmental mappingand analysis,” in Proc. IEEE Int. Conf. Geosci. Remote Sens. Symp.,Jul.–Aug. 2006, pp. 1617–1619.
[8] D. Labate, M. Ceccherini, A. Cisbani, V. De Cosmo, C. Galeazzi,L. Giunti, M. Melozzi, S. Pieraccini, and M. Stagi, “The PRISMApayload optomechanical design, a high performance instrument fora new hyperspectral mission,” Acta Astron., vol. 65, pp. 1429–1436,Nov.–Dec. 2009.
[9] T. Stuffler, K. Forster, S. Hofer, M. Leipold, B. Sang, H. Kauf-mann, B. Penne, A. Mueller, and C. Chlebek, “Hyperspectral imaging-an advanced instrument concept for the EnMAP mission (environ-mental mapping and analysis programme),” Acta Astron., vol. 65,pp. 1107–1112, Oct.–Nov. 2009.
[10] T. Cocks, R. Jenssen, A. Stewart, I. Wilson, and T. Shields, “TheHYMAP airborne hyperspectral sensor: The system, calibration andperformance,” in Proc. 1st EARSEL Workshop Imag. Spectroscopy, 1998,pp. 1–6.
[11] M. E. Schaepman, M. Jehle, A. Hueni, K. Meuleman, and K. I. Itten,“The 4th generation imaging spectrometer APEX and its applicationin earth observation,” IEEE Trans. Geosci. Remote Sens., 2013, to bepublished.
[12] R. O. Green, M. L. Eastwood, C. M. Sarture, T. G. Chrien, M. Aronsson,B. J. Chippendale, J. A. Faust, B. E. Pavri, C. J. Chovit, M. Solis,M. R. Olah, and O. Williams, “Imaging spectroscopy and the airbornevisible/infrared imaging spectrometer (AVIRIS),” Remote Sens. Environ.,vol. 65, pp. 227–248, Jul. 1998.
[13] F. Lehmann, D. Oertel, R. Richter, P. Strobl, H. Rothfuß, A. Mueller,P. Hausknecht, S. Tischler, R. Mueller, D. Beran, J. Fries, R. Boehl, andP. Obermeier, “The digital airborne imaging spectrometer DAIS 7915,”in Proc. ISSSR Hyperspectral Appl. New Sensor, 1995.

This article has been accepted for inclusion in a future issue of this journal. Content is final as presented, with the exception of pagination.
12 IEEE TRANSACTIONS ON GEOSCIENCE AND REMOTE SENSING
[14] H. Kostkowski, Reliable Spectroradiometry. La Plata, MA, USA: Spec-troradiometry Consulting, 1997.
[15] E. J. Milton, M. E. Schaepman, K. Anderson, M. Kneubühler, andN. Fox, “Progress in field spectroscopy,” Remote Sens. Environ.,vol. 113, pp. 92–109, Sep. 2009.
[16] P. Cox and D. Stephenson, “A changing climate for prediction,” Science,vol. 317, no. 5835, pp. 207–208, 2007.
[17] N. Fox, J. Aiken, J. J. Barnett, X. Briottet, R. Carvell, C. Frohlich,S. B. Groom, O. Hagolle, J. D. Haigh, H. H. Kieffer, J. Lean,D. B. Pollock, T. Quinn, M. C. W. Sandford, M. Schaepman, K. P. Shine,W. K. Schmutz, P. M. Teillet, K. J. Thome, M. M. Verstraete, andE. Zalewski, “Traceable radiometry underpinning terrestrial- and helio-studies (TRUTHS),” Adv. Space Res., vol. 32, no. 11, pp. 2253–2261,2003.
[18] R. L. Ackoff, “From data to wisdom,” J. Appl. Syst. Anal., vol. 16, no. 1,pp. 3–9, 1989.
[19] S. Kempler, C. Lynnes, B. Vollmer, G. Alcott, and S. Berrick, “Evolutionof information management at the GSFC earth sciences (GES) data andinformation services center (DISC): 2006–2007,” IEEE Trans. Geosci.Remote Sens., vol. 47, no. 1, pp. 21–28, Jan. 2009.
[20] L. Floridi, “On defining library and information science as appliedphilosophy of information,” Soc. Epistemol., vol. 16, no. 1, pp. 37–49,2002.
[21] L. Floridi, “Understanding epistemic relevance,” Erkenntnis, vol. 69,no. 1, pp. 69–92, 2008.
[22] J. Rowley, “The wisdom hierarchy: Representations of the DIKWhierarchy,” J. Inf. Sci., vol. 33, no. 2, pp. 163–180, 2007.
[23] C. W. Choo, “The knowing organization: How organizations use infor-mation to construct meaning, create knowledge and make decisions,”Int. J. Inf. Manage., vol. 16, no. 5, pp. 329–340, 1996.
[24] D. Chaffey and S. Wood, Business Information Management: ImprovingPerformance Using Information Systems. Englewood Cliffs, NJ, USA:Prentice-Hall, 2005.
[25] A. Hueni, J. Biesemans, K. Meuleman, F. Dell’endice, D. Schläpfer,S. Adriaensen, S. Kempenaers, D. Odermatt, M. Kneubuehler, J. Nieke,and K. Itten, “Structure, components and interfaces of the airborne prismexperiment (APEX) processing and archiving facility,” IEEE Trans.Geosci. Remote Sens., vol. 47, no. 1, pp. 29–43, Jan. 2009.
[26] P. Gege, J. Fries, P. Haschberger, P. Schötz, H. Schwarzer, P. Strobl,B. Suhr, G. Ulbrich, and W. J. Vreeling, “Calibration facility for airborneimaging spectrometers,” ISPRS J. Photogram. Remote Sens., vol. 64,pp. 387–397, 2009.
[27] M. Ecker, “Automatisierung einer optoelektronischen kalibriereinrich-tung,” M.S. thesis, Dept. Appl. Sci., Landshut Univ., Landshut, Germany,2007.
[28] T. D. Wason and D. Wiley, “Structured metadata spaces,” J. InternetCatalog., vol. 3, nos. 2–3, pp. 263–277, 2000.
[29] D. Bernholdt, S. Bharathi, D. Brown, K. Chanchio, M. Chen, A. Cher-venak, L. Cinquini, B. Drach, I. Foster, P. Fox, J. Garcia, C. Kesselman,R. Markel, V. Nefedova, L. Pouchard, A. Shoshani, A. Sim, G. Strand,and D. Williams, “The earth system grid: Supporting the next generationof climate modeling research,” Proc. IEEE, vol. 93, no. 3, pp. 485–495,Mar. 2005.
[30] P. Nadkarni, L. Marenco, R. Chen, E. Skoufos, G. Shepherd, andP. Miller, “Organization of heterogeneous scientific data using theEAV/CR representation,” J. Amer. Med. Informat. Assoc., vol. 6, no. 6,pp. 478–493, 1999.
[31] V. Dinu and P. Nadkarni, “Guidelines for the effective use of entity-attribute-value modeling for biomedical databases,” Int. J. Med. Infor-mat., vol. 76, nos. 11–12, pp. 769–779, 2007.
[32] H. Arndt, M. Bundschus, and A. Naegele, “Toward a next-generationmatrix library for java,” in Proc. 33rd Annu. IEEE Int. Computer Softw.Appl. Conf., Jul. 2009, pp. 460–467.
[33] A. Hueni, J. Nieke, J. Schopfer, M. Kneubühler, and K. Itten, “Thespectral database SPECCHIO for improved long term usability and datasharing,” Comput. Geosci., vol. 35, no. 3, pp. 557–565, 2009.
[34] M. Lidierth, “sigTOOL: A MATLAB-based environment for sharinglaboratory-developed software to analyze biological signals,” J. Neu-rosci. Methods, vol. 178, no. 1, pp. 188–196, 2009.
Andreas Hueni (M’12) received the B.Sc. degreein computer science from the University of AppliedScience Brugg-Windisch, Brugg-Windisch, Switzer-land, in 1997, the PG Diploma degree in geographicinformation systems, and the M.Phil.(Sc) degree inearth science from Massey University, PalmerstonNorth, New Zealand, in 2005 and 2006 respec-tively, and the Ph.D. degree in geography fromthe University of Zurich, Zurich, Switzerland, in2011.
He is currently a Post-Doctoral Researcher withthe Remote Sensing Laboratories, University of Zurich, where he is involvedin research on APEX sensor and data calibration. He was involved in researchfor the APEX project in 2007. His current research interests include calibrationof spectrometers and design of combined databases and software systems suchas spectral database SPECCHIO.
Karim Lenhard received the Diploma degree inphysics from the University of Bonn, Bonn, Ger-many, in 2008, where he is currently pursuing thePh.D. degree with the German Aerospace Center(DLR).
He is currently a Researcher with DLR where heis engaged in operating and improving the APEXcalibration home base, an optical laboratory for cal-ibration, and characterization of airborne hyperspec-tral imagers. His current research interests includespectral and radiometric calibration of hyperspectral
instruments.
Andreas Baumgartner received the B.Eng. degreein mechatronics specialized in optical engineeringand the M.Eng. degree in electrical engineeringand information technology from the Universityof Applied Sciences Deggendorf, Deggendorf, Ger-many, in 2008 and 2010, respectively.
He is currently with the German Aerospace Cen-ter where he is engaged in calibration home baseof APEX. His current research interests includeimproving setup, methods, and software for spectral,geometric, and radiometric calibration of imaging
spectrometers.
Michael E. Schaepman (M’05–SM’07) receivedthe M.Sc. and Ph.D. degrees in geography from theUniversity of Zürich (UZH), Zürich, Switzerland, in1993 and 1998, respectively.
He is currently the Head of the Remote Sens-ing Laboratories, Department of Geography, UZH,where he joined as a Full Chair of remote sensingin 2009. In 1999, he was a Post-Doctoral Researcherwith the Optical Sciences Center, The University ofArizona, Tucson, USA. In 2000, he was a ProjectManager with the European Space Agency Airborne
Prism Experiment spectrometer. In 2003, he was a Full Chair of geoinfor-mation science and remote sensing with Wageningen University, Wagenin-gen, The Netherlands. His current research interests include computationalEarth sciences using remote sensing and physical models, particularly land-atmosphere interface using imaging spectroscopy.