zucker stärke starch frucht fruit - · pdf filezucker stärke frucht der...
TRANSCRIPT

ZUCKERSTÄRKEFRUCHTDer natürliche Mehrwert
SUGARSTARCHFRUIT
The natural upgrade
AGRANA Beteiligungs-AGInstitutional Investors Conference|ZuersRaiffeisen Centrobank
CFO Stephan Büttner | 28 March 2017
Acting together.

2
AGRANA today is…
the leading manufacturer of sugar in CEE and SEE a world market leader in the production of fruit
preparations (in terms of multinational presence) one of the largest producers of fruit juice concentrates in
Europe (in terms of capacity) one of the biggest global sellers of fruit juice concentrates
(in terms of multinational presence) a major manufacturer of custom starch products in Europe the largest producer of bioethanol in Austria (in terms of
capacity and revenue)
Three business segments
In its three business segments, Sugar, Starch and Fruit, AGRANA supplies local producers and major international groups, particularly those in the food processing industry
Leading in refinement of agricultural raw materials AGRANA Products in DAILY Life
AT A GLANCEAGRANA PRODUCTS IN DAILY LIFE
~8,600Employees
(FTEs)
€ 2.5 billion Group revenue (FY 15|16)
Presence in 24 countries & on 6 continents
Global production & global customers
54Production
sites
AGRANA processes
agricultural raw materials
turning them into a range of
industrial products
AGRANA products have
become an integral element of modern life
2.494 2.478
1.968
122129
138
2014|15 2015|16 Q1-3 2016|17
Steady improvement in operating profit (EBIT)
Revenue 2016|17
EBIT 2016|17
Outlook 2016|17
EBIT (€ m)Revenues (€ m)
Investors Conference Zuers | 28 March 2017

SEGMENT OVERVIEWAGRANA PRODUCTS IN DAILY LIFE
Processing and refining raw materials such as potatoes, corn and wheat into premium starch products
Bioethanol is part of our starch business
5 production sites, including 2 bioethanol facilities, in Austria, Hungary and Romania with an annual average of 870 FTEs
Fruit preparations and fruit juice concentrates
Fruit preparations are special customised products for the dairy industry, the baked products industry, the ice-cream & soft drinks industries.
25 fruit preparations production sites in 19 countries and 14 fruit concentrate plants in seven countries, with an annual average of 5,455 FTEs
Processing sugar beet and refining raw sugar
Manufacturing a variety of different sugar and specialty sugar products
10 production sites (incl. INSTANTINA plant) in Austria, Czech Republic, Hungary, Slovakia, Romania and Bosnia-Herzegovina with an annual average of 2,185 FTEs
3
STARCH FRUITSUGAR
Sugar27.2%
Starch29.1%
Fruit43.7%
Revenue s
plit
(FY 2
015|1
6)
Investors Conference Zuers | 28 March 2017

87%
3%
10%
Sugar
By-products (molasses, beet pulp, etc.)
Other (products of INSTANTINA, seeds, services, etc.)
4
SEGMENT OVERVIEWAGRANA PRODUCTS IN DAILY LIFE
ProductsSugars and sugar specialty products, by-products (feedstuffs and fertilisers)
Raw materials processedSugar beet, and raw sugar from sugar cane
CustomersFood industry, particularly confectionery, beverage and fermentation industries; food retailers (for consumer products)
Key marketsAustria, Hungary, Romania, Czech Republic, Slovakia, Bosnia-Herzegovina (Western Balkans region), Bulgaria
ProductsNative and modified starches, saccharificationproducts, alcohols/bioethanol, by-products (feedstuffs and fertilisers)
Raw materials processedCorn (maize), wheat, potato
CustomersFood industry; non-food industry: paper, textile, construction chemicals, pharmaceutical, cosmetics and petroleum industries; feed sector: feed industry
Key marketsCEE, principally Austria and Germany; also specialty markets, e. g., in USA and UAE
ProductsFruit preparations, fruit juice concentrates, not from concentrates juices, fruit wines, natural flavors and beverage bases
Raw materials processedFruits (leading raw material for fruit preparations: strawberry; raw materials for fruit juice concentrates: apples and berries)
CustomersFood industry: dairy, ice-cream, bakery, food service and beverage industries
Key marketsMarketed worldwide
Revenue s
plit
(FY 2
015|1
6)
STARCH FRUITSUGAR
73%
16%
3%
8%
Fruit preparations (dairy and non-dairy)
Fruit juice concentrates
Other juice main products (NFC, fruit wine, etc.)
Others (fruit trade, frozen fruits, etc.)
24%
15%
23%
5%
15%
18%
Native and modified starchesSaccharification productsAlcohol and ethanolOther main products (milk and instant products, etc.)By-products (protein, DDGS, etc.)Others (soja, dried beet pulp, etc.)
Investors Conference Zuers | 28 March 2017

SUSTAINABLE SUPPLY CHAIN…INVESTMENT HIGHLIGHTS
…AND WELL-INVESTED PRODUCTION NETWORK
Well invested production network
c. 1,200 contract farmers (potatoes) or via open market (corn, wheat)
Fragmented supplier base
1.8m tonnes of corn, 0.2m tonnes of potatoes and 0.5m tonnes of wheat processed in FY 2015/16
Over 500 suppliers worldwide largely from primary processors
Frozen or aseptic form
Global sourcing strategy and variety of fruits
0.8m tonnes of fruits processed in FY 2015/16
5
7 sugar beet plants2 raw sugar refineries and 1 Instantina plant2,185 FTEs
5 starch plants (incl. 2 bioethanol plants)
870 FTEs
25 fruit preparation plants14 fruit concentrate plants
5,455 FTEs
Austria
Czech Rep.
Hungary*Romania
Slovakia
Bosnia-Herzegovina Bulgaria
Beet sugar plantsRaw sugar refineryDistribution centre
Starch plantsStarch/bioethanol plants
Austria Hungary Romania
Countries with production sites
€46.1 capex in FY 2015/16
€28.2 capex in FY 2015/16
€41.7 capex in FY 2015/16
Sourcing / Supply chain
c. 7,700 contract growers/ farmers (sugar beet) or via open market
c. 94,000 hectares of sugar beet fields (2016 harvest)
Fragmented supplier base
5.4m tonnes of beet and 0.4m tonnes of raw sugar processed in FY 2015/16
SUGAR STARCH FRUIT
Investors Conference Zuers | 28 March 2017

87%
3%
10%
Sugar
By-products (molasses, beet pulp, etc.)
Other (products of INSTANTINA, seeds, services, etc.)
6
COMPREHENSIVE PRODUCT PORTFOLIO…INVESTMENT HIGHLIGHTS
…WITH FOCUS ON HIGH QUALITY AND ADDING VALUE
Revenue split by product (FY 2015/16)
Special strengths
Focus on high product quality standards with tailored offering to customer needs
Wide range of refined sugars and sugar specialty products
Significant share in B2C business
Variety of different, highly refined starch products to serve numerous industrial sectors
Focus on creation of value-added GM-free and strong organic focus
Focus on custom-designed and innovative product offering both in fruit preparations and fruit juice concentrates
73%
16%
3%
8%
Fruit preparations (dairy and non-dairy)
Fruit juice concentrates
Other juice main products (NFC, fruit wine, etc.)
Others (fruit trade, frozen fruits, etc.)
24%
15%
23%
5%
15%
18%
Native and modified starchesSaccharification productsAlcohol and ethanolOther main products (milk and instant products, etc.)By-products (protein, DDGS, etc.)Others (soja, dried beet pulp, etc.)
SUGAR STARCH FRUIT
Investors Conference Zuers | 28 March 2017

Investors Conference Zuers | 28 March 2017 7
Q1-3 2016|17 VS PRIOR YEAR
REVENUE BY SEGMENT
GROUP
540.5 532.5
544.0 551.9
823.5 883.1
Q1-3 2015|16 Q1-3 2016|17
Fruit
Starch
Sugar
27.1%
28.0%
44.9%
Q1-3 2016|17
€m
1,967.5
28.3%
28.5%
43.2%
Q1-3 2015|16
1,908.0

10.423.1
52.9
58.0
45.5
56.6
Q1-3 2015|16 Q1-3 2016|17
Fruit
Starch
Sugar
108.8
Investors Conference Zuers | 28 March 2017 8
Q1-3 2016|17 VS PRIOR YEAR
EBIT BY SEGMENT
GROUP
16.8%
42.1%
41.1%
Q1-3 2016|17
€m
137.7
9.6%
48.6%
41.8%
Q1-3 2015|16
5.5%
EBIT margin
1.9%
9.7%
6.4%
4.3%
10.5%

Investors Conference Zuers | 28 March 2017
RAW SUGAR & WHITE SUGAR
SUGAR QUOTATION
1 January 2006 – 27 March 2017 (USD)
27 March 2017:501.4 USD/t
= 464.2 EUR/t
27 March 2017:391.3 USD/t
= 362.2 EUR/t
White sugar (LIFFE)
Raw sugar (ICE)
7-years-low:Raw sugar, 24/8/15: 229.1 USD/t
White sugar, 24/8/15: 333.6 USD/t
1/1/2009
9
4-years-high:Raw sugar, 5/10/16: 524.9 USD/t
White sugar, 28/9/16: 612.0 USD/t
2016|17 FY

Investors Conference Zuers | 28 March 2017
SUGAR
MONTHLY AVERAGE PRICES(FEBRUARY 2008 TO FEBRUARY 2017; € PER TONNE)
QS - Min: 414 € per tonne (February, June and July 2015)QS - Max: 738 € per tonne (January 2013)
Source: European Commission: Sugar Price Reporting (version February 2017) and SugarOnline (as of 2 March 2017)
10
Dec '16:
480 €/t
404 €/t
541 €/t

0
100
200
300
400
500
600
700
800
900
1/1/2008 1/1/2009 1/1/2010 1/1/2011 1/1/2012 1/1/2013 1/1/2014 1/1/2015 1/1/2016 1/1/2017
Average daily ethanol price in EUR/m³ (Ethanol T2 FOB Rdam EUR/cm Platts)
Average daily petrol price in EUR/m³ (PREM UNL-10ppm/FOB RDAM BARG Platts)
Investors Conference Zuers | 28 March 2017
1 JANUARY 2008 – 20 MARCH 2017 (EUR)
DEVELOPMENT OF ETHANOL PRICES
500 EUR
11
20 March 2017:
Ethanol: 586.0 EUR/m3
Petrol: 351.3 EUR/m3

CONSOLIDATED INCOME STATEMENT
Investors Conference Zuers | 28 March 2017 12
€m (condensed)Q1-3
2016|17Q1-3
2015|16Q3
2016|17Q3
2015|16
Revenue 1,967.5 1,908.0 647.2 644.5
EBITDA1 183.9 154.1 69.7 61.0
Operating profit before except. items and results of equity-accounted JV 121.6 90.8 43.3 32.8
Share of results of equity-accounted JV 23.7 19.7 8.7 7.7
Exceptional items (7.6) (1.7) (4.7) (0.4)
EBIT 137.7 108.8 47.3 40.1
EBIT margin 7.0% 5.7% 7.3% 6.2%
Net financial items (13.3) (16.3) (3.0) (5.1)
Profit before tax 124.4 92.5 44.3 35.0
Income tax expense (29.2) (21.6) (11.7) (8.0)
Profit for the period 95.2 70.8 32.6 26.9
Attributable to shareholders of the parent 89.3 70.6 29.5 26.9
Earnings per share € 6.29 € 4.97 € 2.08 € 1.89
1 EBITDA represents operating profit before exceptional items, results of equity-accounted joint ventures, and operating depreciation and amortisation.

CONSOLIDATED CASH FLOW STATEMENT
Investors Conference Zuers | 28 March 2017
€m (condensed)
Q1-3 2016|17
Q1-3 2015|16* Change
Operating cash flow before changes in working capital 186.8 160.1 +16.7%
Changes in working capital (7.9) (106.8) +92.6%
Total of interest paid/received and tax paid (25.8) (40.7) +36.6%
Net cash from operating activities 153.1 12.6 +1,115.1%
Net cash (used in) investing activities (72.4) (78.7) +8.0%
Net cash (used in) financing activities (101.8) (59.0) -72.5%
Net (decrease) in cash and cash equivalents (21.1) (125.1) +83.1%
13
* The prior-year data were restated.

CONSOLIDATED BALANCE SHEET
Investors Conference Zuers | 28 March 2017
€m (condensed) 30 Nov. 2016 29 Feb. 2016 Change
Non-current assets 1,063.3 1,027.7 +3.5%
Current assets 1,299.2 1,213.9 +7.0%
Non-current assets held for sale 1.6 1.6 0.0%
Total assets 2,364.1 2,243.2 +5.4%
Equity 1,240.8 1,200.1 +3.4%
Non-current liabilities 260.8 378.7 -31.1%
Current liabilities 862.5 664.4 +29.8%
Total equity and liabilities 2,364.1 2,243.2 +5.4%
Equity ratio 52.5% 53.5% -1.0pp
Net debt 382.0 405.8 -5.9%
Gearing 30.8% 33.8% -3.0pp
14

15
AFTER VS BEFORE CAPITAL INCREASECAPITAL INCREASE 2017
Before the transaction After the transaction
Free float 7.3% 18.9%
Average trading volumesingle counting
862 shares / € 82.7 thousand(CY 2016)
733 shares / € 58.4 thousand(CY 2015)
56,874 shares / € 5.9 million(average after first 5 trading days, after ABB)In the long run a volume of ~ 10,000 shares /
~ € 1 million expected
FF market capitalisation € 123.5 million(at share price as of 31 Jan 2017)
€ 321.1 million(at share price as of 17 Feb 2017; after rump
placement)
Ranking within “ATXwatching list”
Position 35 (of 39)(position 20 necessary to be included in ATX)
Significant increase within positions25 to 30 expected
“Identified” institutional investors
~ 20 ~ 90
Cash-in for projects € 142 million(gross proceeds)
“market view" “Investment not possible due to very low liquidity of the stock”
“AGRANA share is now again very interesting, beside the good positioning of the company”
Investors Conference Zuers | 28 March 2017

16
CHANGE IN SHAREHOLDER STRUCTURECAPITAL INCREASE 2017
12,238,772; 86.18%
1,034,839; 7.29%
928,429; 6.54%
Shareholders BEFORE14,202,040 shares
Z&S Free float SZ (directly)
12,238,772; 78.34%
2,955,043; 18.92%
428,429; 2.74%
Shareholders AFTER15,622,244 shares
Z&S Free float SZ (directly)
Investors Conference Zuers | 28 March 2017
Market capitalisation as of 28 Feb 2017:€ 1,656.0 million (29 Feb 2016: € 1,143.3 million)

Investors Conference Zuers | 28 March 2017 17
Q1-3 2016|17
“OTHER NEWS”
Sunoko acquisition project
• In June 2016 AGRANA signed a term sheet with the intent of acquiring a majority stake in Sunoko and later initiated the process of approval by the competition authorities
• Serbian company Sunoko d.o.o., Novi Sad, Serbia, is one of the largest beet sugar producers in the Balkans region
Fruit expansion in Argentina
• On 1 December 2016 AGRANA expanded its market presence in South America through the acquisition of 100% of the share capital of Main Process S.A., Buenos Aires, Argentina, a manufacturer of fruit preparations with 175 employees and most recent annual revenue of € 19 million
• Purchase price consists of a fixed base component and an earn-out component
Long-term financing
• In December 2016 AGRANA signed a development loan agreement for € 41.5 million to finance the expansion of the starch activities in Aschach, Austria, and increased the Group's long-term financing through the Südzucker group by € 85 million

Investors Conference Zuers | 28 March 2017 18
AGRANA GROUP
OUTLOOK FOR 2016|17
AGRANA expects Group revenue to increase moderately and operating profit (EBIT) to increase significantly for the 2016|17 financial year
Total investment in the three business segments, expected at about € 126 million (2015|16: € 116 million), will significantly exceed depreciation of about € 85 million
Revenue 2016|17
EBIT 2016|17
AGRANA Group

Investors Conference Zuers | 28 March 2017 19
2016|17 AND 2017|18
FINANCIAL CALENDAR
12 May 2017
Results for full year 2016|17 (annual results press conference)
27 June 2017
Record date for Annual General Meeting participation
7 July 2017
Annual General Meeting in respect of 2016|17
12 July 2017
Ex-dividend date
13 July 2017
Results for first quarter of 2017|18
13 July 2017
Record date for dividend
14 July 2017
Dividend payment date
12 October 2017
Results for first half of 2017|18
11 January 2018
Results for first three quarters of 2017|18
20
DISCLAIMER
Investors Conference Zuers | 28 March 2017
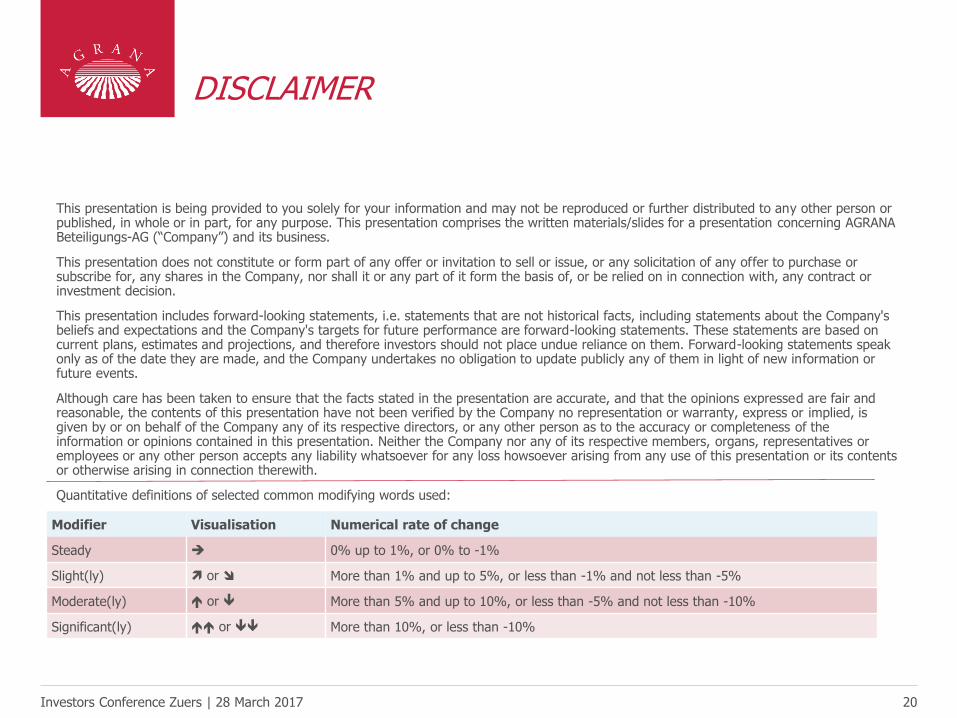
This presentation is being provided to you solely for your information and may not be reproduced or further distributed to any other person or published, in whole or in part, for any purpose. This presentation comprises the written materials/slides for a presentation concerning AGRANA Beteiligungs-AG (“Company”) and its business.
This presentation does not constitute or form part of any offer or invitation to sell or issue, or any solicitation of any offer to purchase or subscribe for, any shares in the Company, nor shall it or any part of it form the basis of, or be relied on in connection with, any contract or investment decision.
This presentation includes forward-looking statements, i.e. statements that are not historical facts, including statements about the Company's beliefs and expectations and the Company's targets for future performance are forward-looking statements. These statements are based on current plans, estimates and projections, and therefore investors should not place undue reliance on them. Forward-looking statements speak only as of the date they are made, and the Company undertakes no obligation to update publicly any of them in light of new information or future events.
Although care has been taken to ensure that the facts stated in the presentation are accurate, and that the opinions expressed are fair and reasonable, the contents of this presentation have not been verified by the Company no representation or warranty, express or implied, is given by or on behalf of the Company any of its respective directors, or any other person as to the accuracy or completeness of the information or opinions contained in this presentation. Neither the Company nor any of its respective members, organs, representatives or employees or any other person accepts any liability whatsoever for any loss howsoever arising from any use of this presentation or its contents or otherwise arising in connection therewith.
Quantitative definitions of selected common modifying words used:
Modifier Visualisation Numerical rate of change
Steady 0% up to 1%, or 0% to -1%
Slight(ly) or More than 1% and up to 5%, or less than -1% and not less than -5%
Moderate(ly) or More than 5% and up to 10%, or less than -5% and not less than -10%
Significant(ly) or More than 10%, or less than -10%