zooplankton as dietary component of selected freshwater ... · zooplankton as dietary component of...
TRANSCRIPT

AACL Bioflux, 2018, Volume 11, Issue 1. http://www.bioflux.com.ro/aacl 232
Zooplankton as dietary component of selected freshwater fish: network analysis based on gut content 1Papia Das, 2Swarnali Mukherjee, 1Sulata Kar, 1Uma Das, 1Devashish Kar, 2Gautam Aditya
1 Department of Life Science and Bioinformatics, Assam University, Silchar 788011, India; 2 Department of Zoology, University of Calcutta, 35 Ballygunge Circular Road,
Kolkata 700019, India. Corresponding author: G. Aditya, [email protected]
Abstract. The presence of the zooplankton as the dietary component of the freshwater fish species occurring in the wetlands of India was justified through the gut content analysis. Using the fish Channa punctata, Channa striata, Glossogobius giuris, Mystus tengara and Notopterus notopterus as model species of the freshwater wetlands, the gut contents were assessed. With regard to the dietary items, considerable extent of similarity was observed for the fish species, reflected through the niche overlap indices. Irrespective of the fish species, in all instances, cladocerans, copepods and rotifers were found to be common dietary elements in the fish gut analysis, along with plant parts, detritus and insects, in different proportions. Significant variations among the fish species were observed with respect to the proportion of cladocerans and copepods found in the gut content. The network analysis revealed the extent of the generality of the fish species, in terms of their consumption pattern as revealed through the gut content analysis. The links with the different zooplankton in the gut content of the fish species reflect the significance as live food and prospective use in the aquaculture. However, the quality of the zooplankton requires further assessment in terms of the nutritive content. Further studies may be initiated to substantiate the specific link of the fish species and the zooplankton in the wetlands of Assam, India. Key Words: Rotifera, Cladocera, Copepoda, freshwater wetlands, fish, network analysis.
Introduction. The zooplankton constitutes staple food for a wide range of fish species in tropical and subtropical freshwater habitats (Bogard et al 2015). Among other dietary items, the zooplankton like copepods, cladocerans, and rotifers are consumed in varied proportions by almost all the fish species particularly during the juvenile stage. In juvenile and fingerlings, the dependence on the zooplankton is considerably high and the growth of certain species is inevitably determined by the extent of the zooplankton in the diet (Guo et al 2009). Thus many studies have emphasized the significance of the zooplankton in the culture of the fish species of freshwater origin (Ahmad et al 2012). Variation in the species composition and the abundance is a redundant component of the zooplankton species assemblage in freshwaters. On a broader scale the proportional abundance of the zooplankton varies with the water quality parameters, physical features and the seasons, evident from several studies worldwide and from India (Gupta & Devi 2014). Irrespective of the variations in the abundance, the dependence on the zooplankton by the fish is an invariant property. This proposition is being tested in the present instance, where the gut content analysis of five different fish species was accomplished highlighting the differences in the proportional presence of three major groups of zooplankton, namely, Cladocera, Copepoda and Rotifera, along with other components like plant parts, detritus and insects remains (Chakrabarti et al 1995; Datta et al 2013; Singh et al 2013; Ahmed et al 2016).
The fish Channa punctata (Bloch, 1793) (Perciformes: Channidae), Channa striata (Bloch, 1793) (Perciformes: Channidae), Glossogobius giuris (Hamilton, 1822) (Perciformes: Gobiidae), Mystus tengara (Hamilton, 1822) (Siluriformes: Bagridae) and
AACL Bioflux, 2018, Volume 11, Issue 1. http://www.bioflux.com.ro/aacl 233
Notopterus notopterus (Pallas, 1769) (Osteoglossiformes: Notopteridae) are common in the wetlands of Assam and West Bengal, India, including the rice fields and allied trap ponds (Aditya et al 2010; Sonawane et al 2012; Saha et al 2017a, b; Zehra & Khan 2018). All these species of fish are consumed as a cheap protein source and bear significance in traditional aquaculture as well as harvest fisheries. The economical and the nutritional value of these fish species are high in Bangladesh, Cambodia, Vietnam and several Asian countries where the consumption of these fish species ensures dietary supplement of the protein (Sagada et al 2017; Hossain et al 2016). In many instances, these species are promoted for the rice fish culture (Rao & Rao 2002) while species like N. notopterus is of high demand as a preferred fish for consumption (Kiran & Waghray 1998) in Indian context. Keeping in view the significance of the wetlands of Assam, West Bengal and other states of India the assessment on the gut content of the fish would substantiate the relevance of the zooplankton as a dietary constituent of the five fish species. Application of the network model to the data would also elaborate the links among the different dietary items and the fish species that occupy the same habitat conditions. While most of the studies on the gut content of the fish have aptly provided the dietary requirements of the concerned species, in the present instance an elaborated network would illustrate the extent of complexity observed in the constituent members of the freshwater communities. Material and Method. The fish species were collected from the oxbow lakes and flood plain lakes in and around Silchar, Assam, India on different dates in a year (between 2015 and 2016). The fish species were collected at different time interval from the different oxbow lakes and the beels in different phases between August and September of 2015 and 2016. Owing to the consideration of multiple individuals of the fish species originating from different space and time, the fish individuals considered for analysis qualified as a true replicate (Hurlbert 1984). Following the capture using the traditional fishing gears, the fish species were placed in plastic bags and brought to the laboratory for identification and segregation to the species levels. Subsequent to the segregation, the fish specimen was considered for the assessment of the gut content (Baker et al 2014). In the present instance five fish species namely C. punctata, C. striata, G. giuris, M. tengara and N. notopterus were considered. For each fish species, 20 individuals were analyzed and thus a total of 100 individuals were analyzed during the whole study. After noting the total length to the nearest millimeter and weight to the nearest 0.01 g, the abdomen was cut open and stomach removed. The gut content analysis (Hyslop 1980; Winemiller 1990; Tobler 2008) was accomplished employing the standard protocols (Scharnweber et al 2013; Baker et al 2014) with certain modifications as applicable for these fish species. For each of the dietary items retrieved through from the dissected gut, a percent frequency of encounter was recorded and interpreted as a measure of diet composition (Baker et al 2014). The %F technique is dependent on the number of encounter of the specific form of the hard tissue remains of the dietary items and the following diet categories were recognized for this study (Winemiller 1990): detritus (DET), scales of other fish (SCA), rotifers (ROT), cladocerans (CLA), copepods (COP), insects (INS) and algal and plant remains (PHY). Although, the contents characterized as insects varied considerably, including the mosquito larvae, chironomid larvae as well as water striders. However, to avoid the confusion in identification, these were considered as insects. Identification of the above dietary items was made on the basis of the shape of the body parts and confirmed comparing the morphological and anatomical descriptions stated in general fresh water biology identification keys (Edmondson 1959; Battish 1992). For macroinvertebrates, owing to lack of complete body parts of the prey, identification could not be made up to appropriate genus and species level, though the field sampling data provided substantial clue for the taxonomic resolutions of the prey items. Since the algae were inseparable as complete entity, identification of the alga separated from gut was not carried out further. Primary emphasis was given to identify the different groups of the zooplankton to highlight the relevance of the zooplankton in the freshwater food web of the concerned habitats from where the fish species were

AACL Bioflux, 2018, Volume 11, Issue 1. http://www.bioflux.com.ro/aacl 234
collected for the study. A single fish individual was considered only once for the purpose of the gut content analysis.
The data on the gut content of the fish species were used for the Discriminant function analysis (DA), as a part of the exploratory data analysis and highlight the differences among the fish species, if any, with reference to the food types (Manly 1994; Legendre & Legendre 1998). A factorial ANOVA was applied to justify the differences among the fish species with reference to a particular group of the zooplankton, as well as detritus, plant parts and the insect remains. The purpose was to substantiate the differences if any among the fish species concerned. The data obtained on the gut content of the fish species were subjected to the niche breadth and niche overlap analyses using the formulae stated below (Ludwig & Reynolds 1988; Krebs 1999): 1. Levene’s niche breadth B = 1/∑pi
2 and the standardized form of niche breadth is BA =B-1/(n-1), where pi is the proportion of ith food item in diet, BA is standardized niche breadth; 2. Pianka’s niche overlap: Oij = ∑pijpik /√(∑ pij
2 ∑pik2)
Where, Oij is the overlap index between i and j species in terms of k resources; a value of 1 indicates maximum overlap while a value of 0 indicates no overlap.
Differences in the proportion of diet of animal origin and plant origin were analyzed for each species, using a two tailed t-test (Zar 1999). In addition to the niche overlap a network of the fish and the dietary items was constructed to highlight the complexity of the network and the relative significance of one or the other groups of the zooplankton in the sustenance of the fish populations (Hannon 1973; Fath & Patten 1999; Fath et al 2007; Ings et al 2009).
In addition to the niche overlap a network of the fish and the dietary items was constructed to highlight the complexity of the network and the relative significance of one or the other groups of the zooplankton in the sustenance of the fish populations. The bipartite network of the fishes and dietary constituents were constructed using a data matrix (Warren & Lawton 1987; Blüthgen et al 2006, 2008), where the row elements being the food types (j), and the column elements were fishes (i). To identify the network connectivity between fishes and food items in the weighed or quantitative matrix was constructed considering frequency of interactions of each fish species on zooplankton and other food items. The different indices like connectance, asymmetry, and weighted nestedness and degree of complementary specialization (H2) were measured using quantitative matrixes. R software version 3.4.0 (2017-04-21) (freeware) and bipartite package was used to calculate different indices and to create the bipartite graph (Table 1). In all other instances of the statistical analysis, XLSTAT (Addinsoft 2010) was used with the models being chosen appropriate references.
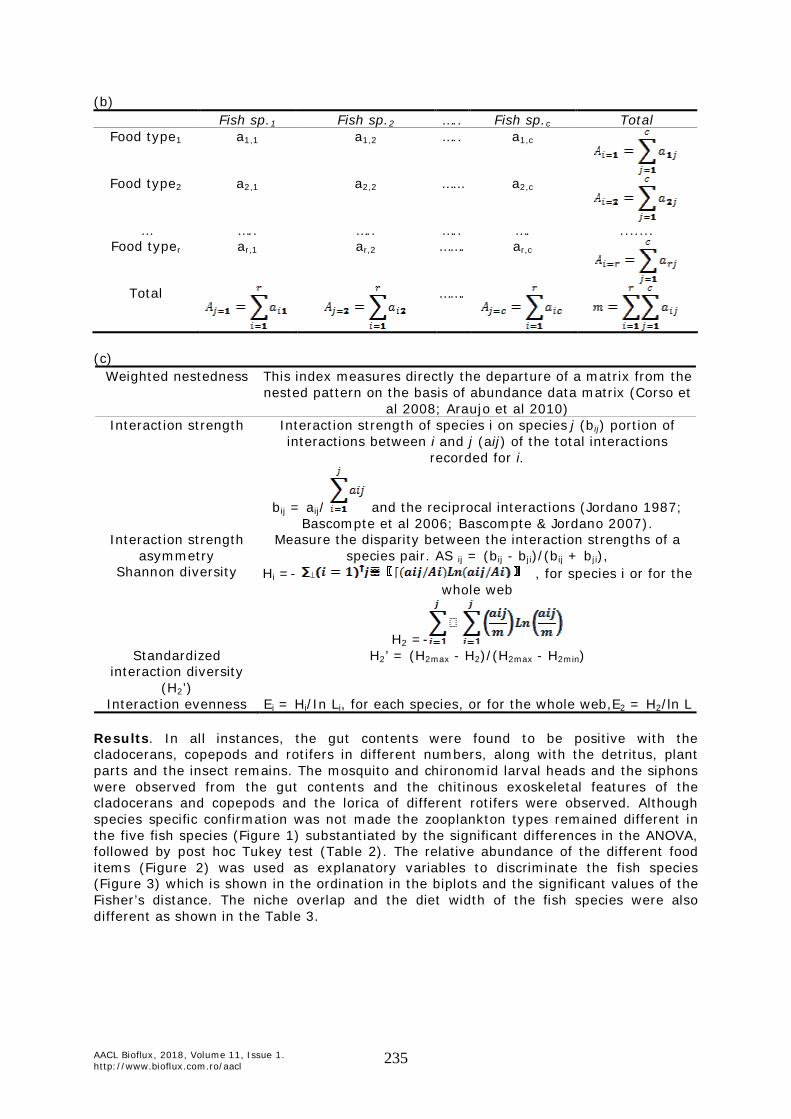
Table 1 Elaboration of the terms used for describing a network: (a) the symbols with the corresponding meaning; (b) matrix of a fish and food type association matrix based on weighted links with c
numbers of fish species and r numbers of food types; (c) indices based on weighted links (quantitative webs) (E) (McCoy & Heck 1987; Blüthgen et al 2006; Dormann et al 2008, 2009)
(a) Symbol Meaning
L Number of actual links in a network I Number of lower trophic level (seven feed types) J Number of higher trophic level (fishes) M Total number of interactions for all species aij Number of interactions between species i from the lower and species j from the higher
trophic level Ai
Total number of interactions of species i from the lower trophic level, Ai = Aj
Total number of interactions of species j from the higher trophic level, Aj =
AACL Bioflux, 2018, Volume 11, Issue 1. http://www.bioflux.com.ro/aacl 235
(b) Fish sp.1 Fish sp.2 ….. Fish sp.c Total
Food type1 a1,1 a1,2 ….. a1,c
Food type2 a2,1 a2,2 …… a2,c
… ….. ….. ….. …. .......
Food typer ar,1 ar,2 ……. ar,c
Total
…….
(c)
Weighted nestedness This index measures directly the departure of a matrix from the nested pattern on the basis of abundance data matrix (Corso et
al 2008; Araujo et al 2010) Interaction strength Interaction strength of species i on species j (bij) portion of
interactions between i and j (aij) of the total interactions recorded for i.
bij = aij/ and the reciprocal interactions (Jordano 1987; Bascompte et al 2006; Bascompte & Jordano 2007).
Interaction strength asymmetry
Measure the disparity between the interaction strengths of a species pair. AS ij = (bij - bji)/(bij + bji),
Shannon diversity Hi =- , for species i or for the whole web
H2 =- Standardized
interaction diversity (H2’)
H2’ = (H2max - H2)/(H2max - H2min)
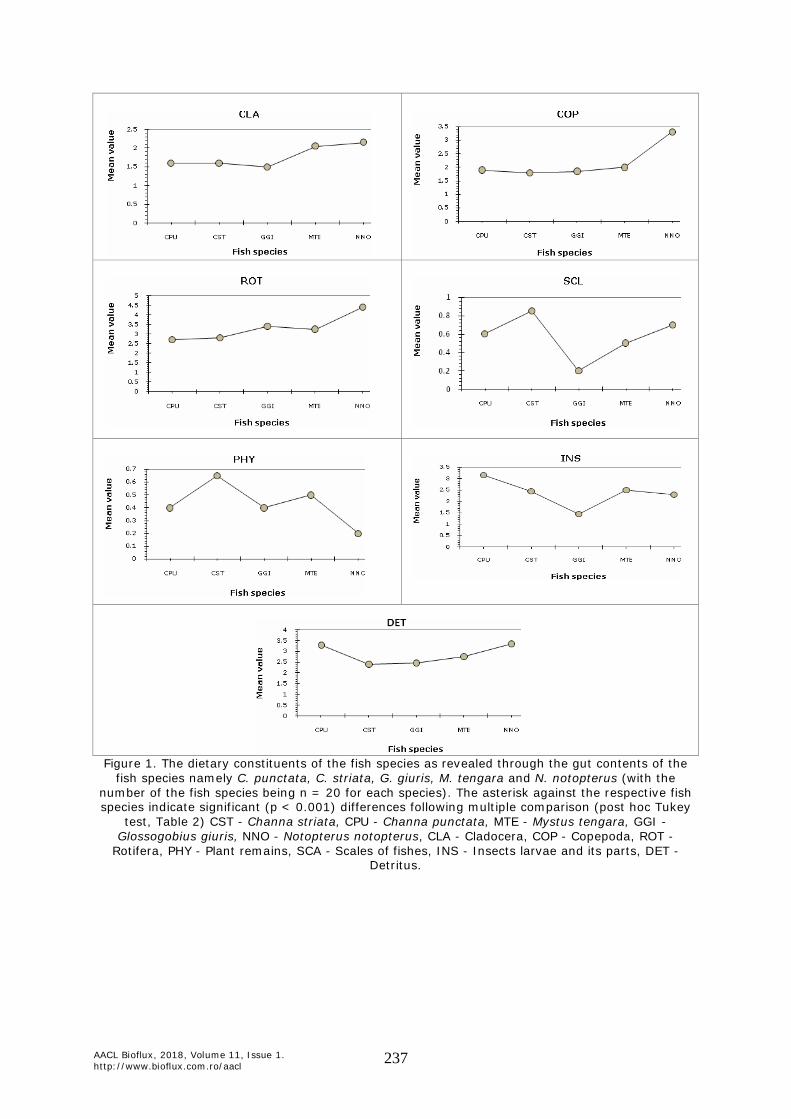
Interaction evenness Ei = Hi/In Li, for each species, or for the whole web,E2 = H2/ln L Results. In all instances, the gut contents were found to be positive with the cladocerans, copepods and rotifers in different numbers, along with the detritus, plant parts and the insect remains. The mosquito and chironomid larval heads and the siphons were observed from the gut contents and the chitinous exoskeletal features of the cladocerans and copepods and the lorica of different rotifers were observed. Although species specific confirmation was not made the zooplankton types remained different in the five fish species (Figure 1) substantiated by the significant differences in the ANOVA, followed by post hoc Tukey test (Table 2). The relative abundance of the different food items (Figure 2) was used as explanatory variables to discriminate the fish species (Figure 3) which is shown in the ordination in the biplots and the significant values of the Fisher’s distance. The niche overlap and the diet width of the fish species were also different as shown in the Table 3.

AACL Bioflux, 2018, Volume 11, Issue 1. http://www.bioflux.com.ro/aacl 236
Table 2 The results of the ANOVA highlighting the differences among the fish species in terms of
the specific food items Source of variation DF Sum of
squares F Source of variation DF Sum of
squares F
CLA 4 7.060 1.373 SCL 4 4.760 1.831 Error 95 122.100 Error 95 61.750 Total 99 129.160 Total 99 66.510 COP 4 32.360 6.756 INS 4 29.660 3.150 Error 95 113.750 Error 95 223.650 Total 99 146.110 Total 99 253.310 ROT 4 36.640 3.872 DET 4 16.500 1.687 Error 95 224.750 Error 95 232.250 Total 99 261.390 Total 99 248.750 PHY 4 2.160 0.980 Error 95 52.350 Total 99 54.510
The values in bold indicate significance at p < 0.001; CLA - Cladocera, COP - Copepoda, ROT - Rotifera, PHY - Plant remains, SCA - Scales of fishes, INS - Insects larvae and its parts, DET - Detritus.
Table 3 The niche overlaps (Mean±SE) among the fish species along with individual Levene’s
niche breadth, based on the data on relative number of prey type available
Levene’s niche breadth Fish pair CST CPU MTE GGI
4.7 CPU 0.984±0.001 5.2 MTE 0.991±0.003 0.981±0.004 5.3 GGI 0.971±0.001 0.947±0.007 0.98±0.004
5.526 NNO 0.975±0.005 0.956±0.007 0.984±0.0001 0.992±0.003 5.2 CST
CST - Channa striata, CPU - Channa punctata, MTE - Mystus tengara, GGI - Glossogobius giuris, NNO - Notopterus notopterus.
AACL Bioflux, 2018, Volume 11, Issue 1. http://www.bioflux.com.ro/aacl 237
Figure 1. The dietary constituents of the fish species as revealed through the gut contents of the
fish species namely C. punctata, C. striata, G. giuris, M. tengara and N. notopterus (with the number of the fish species being n = 20 for each species). The asterisk against the respective fish species indicate significant (p < 0.001) differences following multiple comparison (post hoc Tukey
test, Table 2) CST - Channa striata, CPU - Channa punctata, MTE - Mystus tengara, GGI - Glossogobius giuris, NNO - Notopterus notopterus, CLA - Cladocera, COP - Copepoda, ROT -
Rotifera, PHY - Plant remains, SCA - Scales of fishes, INS - Insects larvae and its parts, DET - Detritus.

AACL Bioflux, 2018, Volume 11, Issue 1. http://www.bioflux.com.ro/aacl 238
(a)
(b)
(c) (d)
(e)
Figure 2. The abundance (Mean±SE) of the different prey type observed during the gut content analysis of six different fish species [(a): CST, (b): CPU, (c): MTE, (d): GGI, (e): NNO]. CST -
Channa striata, CPU - Channa punctata, MTE - Mystus tengara, GGI - Glossogobius giuris, NNO - Notopterus notopterus, CLA - Cladocera, COP - Copepoda, ROT - Rotifera, PHY - Plant remains, SCA
- Scales of fishes, INS - Insects larvae and its parts, DET - Detritus.

AACL Bioflux, 2018, Volume 11, Issue 1. http://www.bioflux.com.ro/aacl 239
(a) (b) Fisher’s distance
CPU CST GGI MTE CST 0.704 GGI 4.903 2.078 MTE 1.193 0.479 1.584 NNO 13.66 12.30 9.065 8.250
(c)
(d)
Figure 3. The discriminatory function analysis (DA) of the fish species based on the dietary items observed through gut content analysis. The results include the Eigen values (a), Fisher’s distance (b), ordination of the explanatory variables (c), and ordination of the response variables (d). The
values in bold indicate significance at p < 0.05 level. The Wilks’ lambda value was 0.563; F12, 246 = 4.984 significant at p< 0.001 level. CST - Channa striata, CPU - Channa punctata, MTE - Mystus
tengara, GGI - Glossogobius giuris, NNO - Notopterus notopterus, CLA - Cladocera, COP - Copepoda, ROT - Rotifera, PHY - Plant remains, SCA - Scales of fishes, INS - Insects larvae and its
parts, DET - Detritus. Network. The network of present study represented 12 nodes (species) and 35 links among species. During this study period there were five fish species (j) and seven prey species (i) found (Figure 4) and their interacting matrix were presented in Figure 4a and each filled cell (link weights) showed the interaction frequencies between two species, i.e. how many individuals of a particular snail were observed on a particular food type. The maximally packed matrix indicated the highly nested pattern of fish-prey interacting
F1 F2 F3 Eigenvalue 0.563 0.135 0.002
Discriminatio (%) 80.475 19.253 0.271 Cumulative % 80.475 99.729 100.0
Canonical correlations 0.600 0.345 0.044
AACL Bioflux, 2018, Volume 11, Issue 1. http://www.bioflux.com.ro/aacl 240
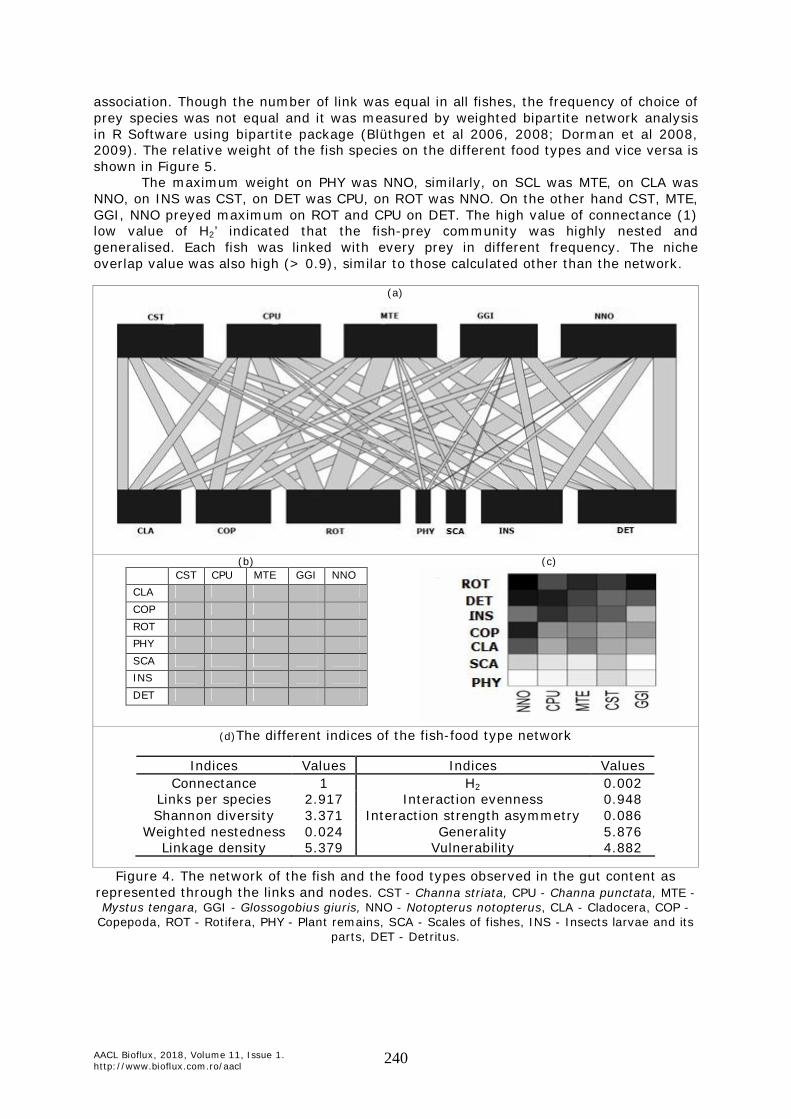
association. Though the number of link was equal in all fishes, the frequency of choice of prey species was not equal and it was measured by weighted bipartite network analysis in R Software using bipartite package (Blüthgen et al 2006, 2008; Dorman et al 2008, 2009). The relative weight of the fish species on the different food types and vice versa is shown in Figure 5.
The maximum weight on PHY was NNO, similarly, on SCL was MTE, on CLA was NNO, on INS was CST, on DET was CPU, on ROT was NNO. On the other hand CST, MTE, GGI, NNO preyed maximum on ROT and CPU on DET. The high value of connectance (1) low value of H2’ indicated that the fish-prey community was highly nested and generalised. Each fish was linked with every prey in different frequency. The niche overlap value was also high (> 0.9), similar to those calculated other than the network.
(a)
(b) CST CPU MTE GGI NNO CLA COP ROT PHY SCA INS DET
(c)
(d)The different indices of the fish-food type network
Indices Values Indices Values
Connectance 1 H2 0.002 Links per species 2.917 Interaction evenness 0.948 Shannon diversity 3.371 Interaction strength asymmetry 0.086
Weighted nestedness 0.024 Generality 5.876 Linkage density 5.379 Vulnerability 4.882
Figure 4. The network of the fish and the food types observed in the gut content as represented through the links and nodes. CST - Channa striata, CPU - Channa punctata, MTE - Mystus tengara, GGI - Glossogobius giuris, NNO - Notopterus notopterus, CLA - Cladocera, COP -
Copepoda, ROT - Rotifera, PHY - Plant remains, SCA - Scales of fishes, INS - Insects larvae and its parts, DET - Detritus.

AACL Bioflux, 2018, Volume 11, Issue 1. http://www.bioflux.com.ro/aacl 241
Figure 5. The pattern of interaction between individuals or proportion of preferences of prey by fish species. a. proportion of fish occurrence on each prey, b. proportion of prey species preference for each fish. CST - Channa striata, CPU - Channa punctata, MTE - Mystus tengara, GGI - Glossogobius giuris, NNO - Notopterus notopterus, CLA - Cladocera, COP - Copepoda, ROT - Rotifera, PHY - Plant
remains, SCA - Scales of fishes, INS - Insects larvae and its parts, DET - Detritus. Discussion. The gut contents of the fish species namely C. punctata, C. striata, G. giuris, M. tengara and N. notopterus, revealed the presence of the zooplankton consistently along with the detritus, plant parts and the insect remains. Although less specific in terms of predicting the predatory impact of these fish on the entire freshwater community, the gut contents confirm the presence of the zooplankton and thus the significance in sustenance of population of the respective fish species. Earlier studies on the gut content analysis and the feeding pattern of the five species indicate high dependency on the macroinvertebrates and the detritus as dietary items. Of particular relevance are the fish species C. punctata and C. striata, which consume high amount of animal prey and detritus (Sonawane et al 2012; Singh et al 2013). Plant parts are least preferred among dietary items of the fish N. notopterus (Kiran & Waghray 1998), which is also true for the fish G. giuris (Hossain et al 2016). In parity with these observations, in the present instance, the plant remains/algae were observed in least amount. In the present instance also, the insect remains and the detritus were observed in high quantity, though variations among the five fish species was prominent (for insects, cladocerans and copepods). Perhaps the differences in the habitat preferences and the resource choice by the five species are reflected through the variations in the proportional presence of the different food types. The morphological and anatomical peculiarities and the physiological features including the enzymes are also significant contributors to the differences in the food preferences. The variations among the fish species are elaborated in the network analysis, which is an important tool in projecting the resource partitioning mechanism and the robustness of the freshwater community. As shown through the analysis, the degree of specialization was too low, in parity with the propositions of Woodward & Hildrew (2002). At the other end the niche overlap among the five species can be considered as an indication of the niche segregation in situations where these species are common (Herder & Freyhof 2006). However, further studies are required to understand the variations in the food choice and feeding pattern of the concerned fish species, including the shifts, if any in the dietary choices.
Irrespective of the dietary requirements and the consumption of the five fish species, including size and ontongenic features and variations in the habitat elements, zooplankton forms a redundant component included in the diet of almost all the fish species (Guo et al 2009). The presence of the cladocerans in the gut content was not significantly different for the five species, though the rotifers and the copepods were found in different proportions. Perhaps, this was correlated with the habitat preferences and the exploitation of the specific zooplankton in the habitats (de Senerpont Domis et al 2013). Although the gut content of the fish species were not assessed in accordance with the species specific presence of different zooplankton, the bipartite network indicated consistent linkage among the two groups. However, the strength and interactions can be further explored using the species specific information of both the groups including

AACL Bioflux, 2018, Volume 11, Issue 1. http://www.bioflux.com.ro/aacl 242
temporal scale exploration. Nonetheless, the gut content analysis confirms the presence of the zooplankton as a prominent dietary item suggesting the significance of zooplankton in pisciculture particularly in the wetlands of Assam, West Bengal and similar regions of India and neighbouring countries. Conclusions. The dietary items of the fish species namely C. punctata, C. striata, G. giuris, M. tengara and N. notopterus revealed through the gut content analysis included zooplankton as a redundant item. The relative abundance of the cladocerans, the copepods and the rotifers different among the fish species considerably reflected through the statistical analysis. As reflected through the bipartite network, the dietary patterns of the fish species were generalized with consistent links to the zooplankton. An extension of this observation is to enhance the zooplankton of different groups as a food item for all the five fish species considered here, in the intensive aquaculture using the concerned fish species. However, further studies are required to identify the preferences for the specific species of the zooplankton by the fish species. Such studies may enable utilizing the zooplankton species with higher precision and enhancing the productivity of the fish species. Acknowledgements. The authors are grateful to the respective Heads, Department of Life Science and Bio informatics, Assam University, Silchar, Assam, and Department of Zoology, University of Calcutta, Kolkata, India for the facilities provided, including DST-FIST and UGC UPE-II (University of Calcutta). The authors, namely, Papia Das, Sulata Kar and Uma Das, acknowledge the financial assistance provided by UGC in carrying out the work. References Addinsoft SARL, 2010 XLSTAT software, version 9.0. Addinsoft, Paris, France. Aditya G., Pal S., Saha G. K., 2010 An assessment of fish species assemblages in rice
fields in West Bengal, India: implications for management. Journal of Applied Ichthyology 26:535-539.
Ahmad U., Parveen S., Abdel Mola H. R., Kabir H. A., Ganai A. H., 2012 Zooplankton population in relation to physico-chemical parameters of Lal Diggi pond in Aligarh, India. Journal of Environmental Biology 33:1015-1019.
Ahmed M. K., Baki M. A., Kundu G. K., Islam M. S., Islam M. M., Hossain M. M., 2016 Human health risks from heavy metals in fish of Buriganga river, Bangladesh. Springer Plus 5(1):1697.
Araujo A. I. L., Corso G., Almeida A. M., Lewinsohn T. M., 2010 An analytic approach to the nestedness index of bipartite networks. Physica A: Statistical Mechanics and its Applications 389(7):1405-1411.
Baker R., Buckland A., Sheaves M., 2014 Fish gut content analysis: robust measures of diet composition. Fish and Fisheries 15:170-177.
Bascompte J., Jordano P., 2007 Plant-animal mutualistic networks: the architecture of biodiversity. Annual Review of Ecology, Evolution and Systematics 38:567-593.
Bascompte J., Jordano P., Olesen J. M., 2006 Asymmetric coevolutionary networks facilitate biodiversity maintenance. Science 312:431-433.
Battish S. K., 1992 Freshwater zooplankton of India. Oxford and IBH Publishing Co. Pvt. Ltd., New Delhi, India, 232 pp.
Blüthgen N., Menzel F., Blüthgen N., 2006 Measuring specialization in species interaction networks. BMC Ecology 6:9.
Blüthgen N., Fründ J., Vazquez D. P., Menzel F., 2008 What do interaction network metrics tell us about specialization and biological traits? Ecology 89:3387-3399.
Bogard J. R., Thilsted S. H., Marks G. C., Wahab M. A., Hossain M. A. R., Jakobsen J., Stangoulis J., 2015 Nutrient composition of important fish species in Bangladesh and potential contribution to recommended nutrient intakes. Journal of Food Composition and Analysis 42:120-133.
AACL Bioflux, 2018, Volume 11, Issue 1. http://www.bioflux.com.ro/aacl 243
Chakrabarti I., Gani M. A., Chaki K. K., Sur R., Mishra K. K., 1995 Digestive enzymes in 11 freshwater teleost fish species in relation to food habitat and niche segregation. Comparative Biochemistry and Physiology Part A: Physiology 112(1):167-177.
Corso G., Araujo A. I. L., Almeida A. M., 2008 A new nestedness estimator in community networks. arXiv: 0803.0007 [physics.bio-ph].
Datta S. N., Kaur V. I., Dhawan A., Jassal G., 2013 Estimation of length-weight relationship and condition factor of spotted snakehead Channa punctata (Bloch) under different feeding regimes. Springerplus 2:436.
de Senerpont Domis I. N., Elser J. J., Gsell A. S., Huszar V. L. M., Ibelings B. W., Jeppesen E., Kosten S., Mooji W. M., Roland F., Sommer U., Van Donk E., Winder M., Lurling M., 2013 Plankton dynamics under different climatic conditions in space and time. Freshwater Biology 58:463-482.
Dormann C. F., Gruber B., Fründ J., 2008 Introducing the bipartite package: analysing ecological networks. R News 8:8-11.
Dormann C. F., Fründ J., Blüthgen N., Gruber B., 2009 Indices, graphs and null models: analyzing bipartite ecological networks. The Open Ecology Journal 2:7-24.
Edmondson W. T., 1959 Fresh-water biology. 2nd edition, John Wiley & Sons, INC, New York, xx+1248 pp.
Fath B. D., Patten B. C., 1999 Review of the foundations of network environ analysis. Ecosystems 2(2):167-179.
Fath B. D., Scharler U. M., Ulanowicz R. E., Hannon B., 2007 Ecological network analysis: network construction. Ecological Modelling 208:49-55.
Guo N., Zhang M., Yu Y., Qian S., Li D., Kong F., 2009 Crustacean zooplankton communities in 13 lakes of Yunnan-Guizhon plateau: relationship between crustacean zooplankton biomass or size structure and trophic indicators after invasion by exotic fish. International Journal of Limnology 45:279-288.
Gupta S., Devi S. S., 2014 Ecology of Baskandi Anua, an oxbow lake of south Assam, north east India. Journal of Environmental Biology 35:1101-1105.
Hannon B., 1973 The structure of ecosystems. Journal of Theoretical Biology 41:535-546. Herder F., Freyhof J., 2006 Resource partitioning in a tropical stream fish assemblage.
Journal of Fish Biology 69:571-589. Hossain M. S., Roy A., Rahman M. L., 2016 Food and feeding habit of Bele Glossogobius
giuris (Hamilton and Buchanan, 1822) collected from Mithamain Haor of Kishoreganj districts, north-eastern Bangladesh. International Journal of Fisheries and Aquatic Studies 4(5):84-88.
Hurlbert S. H., 1984 Pseudoreplication and the design of ecological field experiments. Ecological Monographs 54(2):187-211.
Hyslop E. J., 1980 Stomach contents analysis: a review of methods and their application. Journal of Fish Biology 17:411-429.
Ings T. C., Montoya J. M., Bascompte J. , Blüthgen N., et al., 2009 Ecological networks - beyond food webs. Journal of Animal Ecology 78:253-269.
Jordano P., 1987 Patterns of mutualistic interactions in pollination and seed dispersal: connectance, dependence asymmetries and coevolution. American Naturalist 129: 657-677.
Kiran V. U. G., Waghray S., 1998 Food and feeding habits of Notopterus notopterus (Pallas) of Saroornagar Lake, Hyderabad (A.P.). Indian Journal of Fisheries 45(3):355-359.
Krebs C. J., 1999 Ecological methodology. Benjamin Cummings, Menlo Park CA, 620 pp. Legendre P., Legendre L., 1998 Numerical ecology. 2nd English edition, Elsevier,
Amsterdam, 852 pp. Ludwig J. A., Reynolds J. F., 1988 Statistical ecology: a primer in methods and
computing. John Wiley and Sons, New York, 337 pp. Manly B. F. J., 1994 Multivariate statistical methods: a primer. Chapman and Hall,
London, 224 pp. McCoy E. D., Heck K. L., 1987 Some observations on the use of taxonomic similarity in
large-scale biogeography. Journal of Biogeography 14(1):79-87.

AACL Bioflux, 2018, Volume 11, Issue 1. http://www.bioflux.com.ro/aacl 244
Rao L. M., Rao P. S., 2002 Food and feeding habits of Glossogobius giuris from Gosthani estuary. Indian Journal of Fisheries 49(1):35-40.
Sagada G., Chen J., Shen B., Huang A., Sun L., Jiang J., Jin C., 2017 Optimizing protein and lipid levels in practical diet for juvenile northern snakehead fish (Channa argus). Animal Nutrition 3:156-163.
Saha D., Pal S., Rahaman S. H., Nandy G., Chakraborty A., Aditya G., 2017 Exploitation pattern of small indigenous fish species: observations from fish markets of rural West Bengal, India. AACL Bioflux 10(2):381-390.
Saha D., Pal S., Nandy G., Rahaman S. H., Chakraborty A., Aditya G., 2017 Exploitation pattern of mola carplet, Amblypharyngodon mola (Hamilton, 1822), a small indigenous fish: observations from fish markets of rural West Bengal, India. AACL Bioflux 10(4):779-786.
Scharnweber K., Watanabe K., Syväranta J., Wanke T., Monaghan M. T., Mehner T., 2013 Effects of predation pressure and resource use on morphological divergence in omnivorous prey fish. BMC Evolutionary Biology 13:132.
Singh C. P., Ram R. N., Singh R. N., 2013 Food and feeding habits of Channa punctatus in two different habitats at Tarai region of Uttarakhand. Journal of Environmental Biology 34:789-792.
Sonawane S., Gedam A., Anand S., Pawar S., 2012 Food and feeding habits of Channa punctatus from Kaigaon Toka Dist. Aurangabad (M.S.) in relation to biochemical studies. Journal of Experimental Sciences 3(8):7-13.
Tobler M., 2008 Divergence in trophic ecology characterizes colonization of extreme habitats. Biological Journal of the Linnean Society 95:517-528.
Warren P. H., Lawton J. H., 1987 Invertebrate predator-prey body size relationships: an explanation for upper triangular food webs and patterns in food web structure? Oecologia 74(2):231-235.
Winemiller K. O., 1990 Spatial and temporal variation in tropical fish trophic networks. Ecological Monographs 60:331-367.
Woodward G., Hildrew A. G., 2002 Food web structure in riverine landscapes. Freshwater Biology 47(4):777-798.
Zar J. H., 1999 Biostatistical analysis. Vth edition, Pearson Education Singapore, Pvt. Ltd., Indian Branch, New Delhi, India, 663 pp.
Zehra S., Khan M. A., 2018 Dietary riboflavin requirement of fingerling Channa punctatus (Bloch) based on growth, conversion efficiencies, protein retention, liver riboflavin storage, RNA/DNA ratio and carcass composition. Aquaculture Nutrition 24:269-276.
Received: 27 December 2017. Accepted: 31 January 2018. Published online: 25 February 2018. Authors: Papia Das, Department of Life Science and Bioinformatics, Assam University, Silchar 788011, India, e-mail: [email protected] Swarnali Mukherjee, Department of Zoology, University of Calcutta, 35 Ballygunge Circular Road, Kolkata 700019, India, e-mail: [email protected] Sulata Kar, Department of Life Science and Bioinformatics, Assam University, Silchar 788011, India, e-mail: [email protected] Uma Das, Department of Life Science and Bioinformatics, Assam University, Silchar 788011, India, e-mail: [email protected] Devashish Kar, Department of Life Science and Bioinformatics, Assam University, Silchar 788011, India, e-mail: [email protected] Gautam Aditya, Department of Zoology, University of Calcutta, 35 Ballygunge Circular Road, Kolkata 700019, India, e-mail: [email protected] This is an open-access article distributed under the terms of the Creative Commons Attribution License, which permits unrestricted use, distribution and reproduction in any medium, provided the original author and source are credited. How to cite this article: Das P., Mukherjee S., Kar S., Das U., Kar D., Aditya G., 2018 Zooplankton as dietary component of selected freshwater fish: network analysis based on gut content. AACL Bioflux 11(1):232-244.