zoom series rigexpert antenna and cable analyzer · time domain reflectometer (tdr) mode ......
TRANSCRIPT

RigExpert®
Software manual
Antenna and cable analyzer
ZOOM series

.

1. Connecting RigExpert Antenna Analyzer to your computer ......................................................................................................4
2. Updating the firmware ....................................................................................5
3. AntScope2 program .........................................................................................63.1. Quick start...........................................................................................63.3. Saving/loading data ...........................................................................83.4. Saving images ....................................................................................93.5. Analyzer screen shots ........................................................................93.6. Analyzer memory ............................................................................ 103.7. Markers ............................................................................................ 103.8. Time domain reflectometer (TDR) mode ........................................ 113.9. Calibration mode ............................................................................. 123.10. Presets ........................................................................................... 13
4. Bluetooth option ...............................................................................................144.1 Bluetooth on Windows PC ................................................................ 144.2 Bluetooth on Android ....................................................................... 15
Table of contents

Software manual
RigExpert Antenna Analyzer can be connected to a computer running Windows 2000/2003/XP/Vista/7/8/10, as well as Mac OS (version 10.6 or higher) operating systems.
The latest version of the software may be found at the Downloads section of the rigexpert.com website. Windows and Mac OS are available as separate downloads.
Important:
To avoid damage caused by possible electrostatic discharge,
always follow this sequence:
1. Connect the coaxial cable to the antenna connector of your analyzer.
2. Connect the analyzer to the USB port of your computer.
4
1. Connecting RigExpert Antenna Analyzer to your computer

RigExpert Antenna Analyzer
A Firmware update tool available at the Downloads section of our website will automatically download latest versions of the firmware. Just run the program and follow on-screen instructions.
You may also download binary files of the firmware for the off-line updating, if necessary.
The LCD of the analyzer will flash during the firmware update process.
Notice:
It is safe for the analyzer to cancel the firmware update process
at any time, and then start it over.
5
2. Updating the firmware

Software manual
3.1. Quick start1. Connect your analyzer to the PC as described in section 1 of this manual. Make sure
the analyzer is turned on.
2. Run AntScope2. Under Windows, the program will automatically detect the analyzer type. The analyzer name will be dispayed at the window’s title bar near the version of the AntScope2.
3. Enter start and stop frequencies in the Frequency window. You can click Center,Range button and enter center frequency and measurement range instead of limits.Next click Single to perform scan.Any further scans will be added to the Measurements list and stay on display to perform comparison easily. They can be saved or removed any time later.
4. After the scan is complete, use F1 to F7 keys to switch between charts displaying various parameters (or click appropriate tab): SWR, phase angle, complex impedance (parallel and serial models), return loss, impulse and step responses, and reflection coefficient at Smith chart.
5. You can freely zoom the chart by pressing + and - keys or scrolling the mouse wheel. To change vertical zoom just hold the Ctrl key and press + and - keys or scroll the mouse wheel. You can pan/zoom chart using the cursor moving keys.
The main function of the AntScope2 program is to show measurement results on the “big screen”. The AntScope2 is a great companion to your RigExpert analyzer which adds functions previously available in expensive, professional grade equipment only.
6
3. AntScope2 program
RigExpert Antenna Analyzer
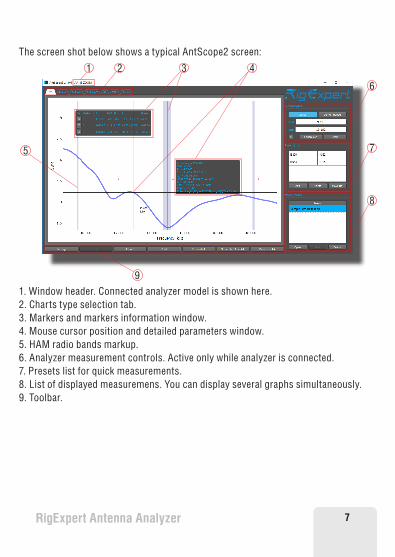
The screen shot below shows a typical AntScope2 screen:
1 2 3 4
6
7
8
9
1. Window header. Connected analyzer model is shown here.2. Charts type selection tab.3. Markers and markers information window.4. Mouse cursor position and detailed parameters window.5. HAM radio bands markup.6. Analyzer measurement controls. Active only while analyzer is connected.7. Presets list for quick measurements.8. List of displayed measuremens. You can display several graphs simultaneously.9. Toolbar.
5
7

Software manual
3.2. Data windowThere is a pop-up data window when the cursor is moved over the graph, displaying various parameters of a load:
3.3. Saving/loading dataClick Save button in Measurements section to save current measurement to a file, then click Open button to retrieve the saved data. You can load multiple measurements to perform on-screen comparison. Selected measurement will be displayed as a bold line.
Please notice that data is saved in native AntScope2 format (.asd files), which cannot be open in other programs. Use Export button to export data in various formats.
For instance, CSV data can be easily exported into a Microsoft Excel sheet. R and X (active and reactive parts of impedance) values are saved into the CSV file for each point on the graph. To calculate SWR or other parameters, use corresponding formulas.
8

RigExpert Antenna Analyzer
3.4. Saving images
To paste the graph to other software (such as Microsoft Word, a graphical editor, or an e-mail message editor), just use Screenshot button, it will save exact screenshot of the AntScope2 window.
You may use te Print button to save or print only graph data.
3.5. Analyzer screen shots
To take a screen shot of the analyzer, click the Screenshot from AA button. The screen shot is placed to the clipboard automatically and may be saved to file.
9

Software manual
3.6. Analyzer memoryYou may download a previously save graph from one of memory slots of your analyzer. Make sure the analyzer is connected to your computer, then click Data from AA button.
Press Read all button or select a memory slot from the list then press OK to download the data.
3.7. MarkersClick the chart window to create a new marker then click to select the marker position. Markers is enumerated sequentally from one (1,2,3, ... etc.).
There is floating window showing marker’s data:
To remove marker just click X button in the markers window.
Markers data is also present in the images, produced by the Print function (see p.3.4 for more data).
10

RigExpert Antenna Analyzer
3.8. Time domain reflectometer (TDR) modeThis mode (press F6) displays impulse response and step response graphs which show how electromagnetic wave reflects from discontinuities in a cable. Additionally, a tool tip near the cursor shows estimated value of the impedance of a cable at the corresponding distance. This will let you know if your cable is in a good or a bad condition.
For best results, perform a scan over the full frequency range with 1000 or more points. Make sure the characteristic impedance and the velocity factor of the cable are set in the Settings – Cable window. This will let you see the exact distance to the discontinuity. For TDR measurements, it is not important if the cable ends with antenna, open circuit or short circuit.
The following screen shot was taken in the real measurement. It shows 16 meters of 75 Ohm coaxial cable, antenna switching relay, and additional 37 meters of cable ending with an HF antenna.
11
Software manual
If the discontinuity is found, impulse response and step response graphs will not let you know the exact reason of the problem, but will help in finding its location. You could see how discontinuities of different nature affect impulse response and step response graphs by experimenting with various cables, connectors and loads.
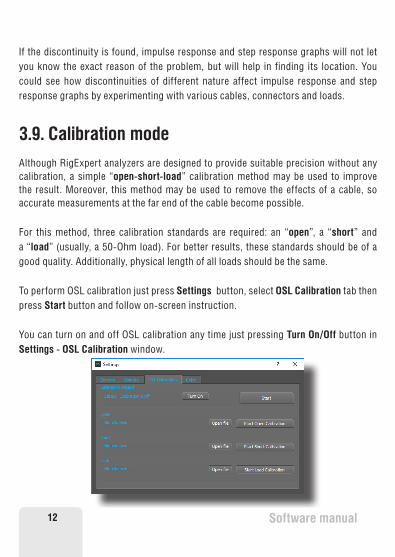
3.9. Calibration modeAlthough RigExpert analyzers are designed to provide suitable precision without any calibration, a simple “open-short-load” calibration method may be used to improve the result. Moreover, this method may be used to remove the effects of a cable, so accurate measurements at the far end of the cable become possible.
For this method, three calibration standards are required: an “open”, a “short” and a “load” (usually, a 50-Ohm load). For better results, these standards should be of a good quality. Additionally, physical length of all loads should be the same.
To perform OSL calibration just press Settings button, select OSL Calibration tab then press Start button and follow on-screen instruction.
You can turn on and off OSL calibration any time just pressing Turn On/Off button in Settings - OSL Calibration window.
12

RigExpert Antenna Analyzer
3.10. PresetsYou can save frequently used bands to quickly pick them later. Just enter band as usual typing start and stop frequencies or zooming the graph then press Add button in Presets window.
To retreive saved preset just double click on it in the Presets list. The graph will be zoomed to selected band automatically.
13

Software manual14
4. Bluetooth option
AA-55 ZOOM analyzer has Bluetooth option. Turn on Bluetooth connection in the Setup menu of the analyzer.
4.1 Bluetooth on Windows PC
Once paired AA-55 ZOOM option Bluetooth analyzer detects by Windows as usual COM-port.
You can discover this port number in the Services tab of AA-55 ZOOM device properties window in Device and printers explorer:
Important:
The pairing PIN-code is 1234

RigExpert Antenna Analyzer 15
In the Antscope2 Setup window select the Manual analyzer detection checkbox and choose this port number.
Work with analyzer as it is connected directly to PC by cable.
4.2 Bluetooth on AndroidDowload and install Antscope for Android from Google Play Maket
Software manualRigExpert Antenna Analyzer16
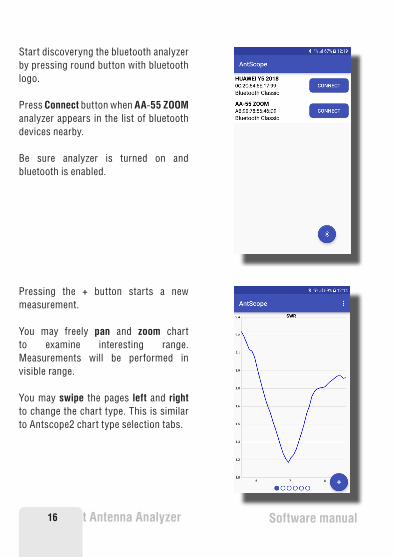
Start discoveryng the bluetooth analyzer by pressing round button with bluetooth logo.
Press Connect button when AA-55 ZOOM analyzer appears in the list of bluetooth devices nearby.
Be sure analyzer is turned on and bluetooth is enabled.
Pressing the + button starts a new measurement.
You may freely pan and zoom chart to examine interesting range. Measurements will be performed in visible range.
You may swipe the pages left and right to change the chart type. This is similar to Antscope2 chart type selection tabs.

RigExpert Antenna Analyzer 17
You may share the chart by choosing the Share item in the drop-down menu.
Then the chart picture will be sent to the selected channel (email, messenger, etc.).
For the access to the Setup screen coose Setup item in drop=down menu.
• Center - sets the center frequency.• Range - sets the measurement range.• Points - sets the number of points in
one scan.

Software manual18

RigExpert Antenna Analyzer 19

Copyright © 2016-2018 Rig Expert Ukraine Ltd.
“RigExpert” is a registered trademark of Rig Expert Ukraine Ltd.
Made in Ukraine
Doc. date: 03-Sep-2018
http://www.rigexpert.com