zinc and cobalt nano ferrites and their potential
TRANSCRIPT
Zinc and cobalt nano ferrites and their potentialapplications in environmental sustainabilityLeena V. Hublikar
KLE Technological UniversitySharanabasava V Ganachari ( [email protected] )
KLE Technological University https://orcid.org/0000-0002-9895-1829Jayachandra S. Yaradoddi
KLE Technological UniversityAasim U. Mokashi
KLE Technological University
Research Article
Keywords: Nano ferrites, co-precipitation method, Fourier-transform spectroscopy (FTIR), X-ray powderdiffraction (XRD), Field Emission Scanning Electron Microscope (FESEM), chemical vapor sensing study,water analysis, absorption and Adsorption studies
Posted Date: March 25th, 2020
DOI: https://doi.org/10.21203/rs.3.rs-18423/v1
License: This work is licensed under a Creative Commons Attribution 4.0 International License. Read Full License

Zinc and cobalt nano ferrites and their potential applications in environmental
sustainability
Leena V. Hublikar b, c, Sharanabasava V. Ganachari* a,b, Jayachandra S. Yaradoddi a, Aasim U. Mokashi
a Centre for Material Science, School of Mechanical Engineering, KLE Technological
University, BVB campus, Vidyanagar Hubbalii-580031, Karnataka, INDIA
b Department of Chemistry, KLE Technological University, BVB campus, Vidyanagar Hubbalii-580031, Karnataka, INDIA
c Department of Chemistry, KLE’s P. C. Jabin Science College, Vidyanagar, Hubballi-
580031, Karnataka, India
Abstract:
Fundamental research and industrially applied research, currently depend on magnetic
oxide nanoparticles and ferromagnetic oxides due to their extensive applications for electronic,
magnetic, optical sensor and absorptive activities. ferromagnetic substances mainly contain a
different type of Ferrite. Ferrite material constitutes, Iron oxide (Fe2O3) and divalent metal
oxides of Transition metals like cobalt, nickel etc. The key objective of this paper is to study
the impending applications of nano - ferrites doped with bivalent transition metals with their
properties. Low-Temperature Self-Propagating combustion method was used to synthesize the
particles. Synthesized Zinc and Cobalt Nano ferrites from the chemical co-precipitation method
were found to be of 20 to 90 nm in average size, and comparative study of their properties
using the results of Fourier-transform spectroscopy (FTIR) and X-ray powder diffraction
(XRD). The Field Emission Scanning Electron Microscope (FESEM) confirms the conception
of ferrite nanoparticles with a structure type cubic spinel. Further comparative Sensing studies
showed that the sample displays variation in resistance when gases are passed over the surface,
and the change in resistance is observed.
Keywords: Nano ferrites, co-precipitation method, Fourier-transform spectroscopy (FTIR),
X-ray powder diffraction (XRD), Field Emission Scanning Electron Microscope (FESEM),
chemical vapor sensing study, water analysis, absorption and Adsorption studies.
*corresponding author
INTRODUCTION
In an era where compactness of various devices is of prime importance, nanomaterials
can play a central role[1]. Science is built on a large number of very small nanoparticles. Which
are acting as powerhouses of materials[2]. Materials gain a verity of Chemical & physical
properties depending on the size and shapes of these nanoparticles[1,3]. Properties, such as
electrical and optical, display unique significant differences from the bulk properties[1].
The small material properties change considerably when they are brought to nano
magnitude, of the order of 100 nm or less[4]. Being a particular type of such nanoparticles, the
ceramic nanomaterials, had a wide variety of applications[4,5]. They are known for their
stability, availability of information on relatively cheaper synthesis techniques[6,7]. Typically,
MeFe2O4 is common formula for spinel ferrite (SF). Where Me indicates one or different types
of a bivalent transition metal like Mn, Zn, Co, Ni, Cu, etc.[8] [9] ferrite fabrication procedures,
Traditionally involve the grinding and calcination of binary metal oxide mixtures repeatedly to
obtain pure ferrite phase [10]. These methods often follow the solid-state transformation, which
involves high-temperature annealing, ball milling, and other complex sintering protocols
leading to the anticipated microstructure and engineered shapes[5]. This also improves
homogeneity and particle size distribution, other significant properties of the final product[11].
Many works are going on metal ions substitution in nano- ferrites. Researchers, getting
Interested nowadays in ferrites Substituted with rare-earth ions[12–16], which have changed the
physical as well as chemical (magnetic and electrical) properties of nanoparticles[17] and that
intern depends upon nature and ionic radii of element substituted and its particle size[4]. Further
applications in magnetism is tailored by decreasing particle size, altering the cation
distributions with different ions at the lattice (tetrahedral and octahedral) sites[18]. Specific
applications of nano ferrites require prominent properties in nanomaterials[10]. In the case of
Ceramics, parameters of Nanostructured ferrites initially decrease to some extent with grinding,

and with further milling, it increases[19]. A decrease in the grain size increases magnetization
and also found that cation inversion is attributed to change in the lattice and its values [19,20].
Amongst the category of SF’s, CoFe2O4 and ZnFe2O4 have expanded more attention of
researchers owing to numerous valuable properties. More chemical stability, extraordinary
mechanical hardness, and good coercivity[21]. The properties of CoFe2O4 and ZnFe2O4 can be
enhanced by adding metal ions with different valency, coordinating to requirements[22]. The
substitution of rare-earth ions in cobalt and Zinc ferrites made the study more interesting[23].
This is due to their vast applications in many devices such as electromagnetic wave absorbers,
inductor cores, converters and many more[24]. By following disciplined fabrication processes,
divalent Co2+ resides at tetrahedral lattice and trivalent Fe3+ ions at octahedral sites can be
tailored.[25],[26] and we also emphasized from the previous research that, part of Co2+ ions
present at the octahedral sites are responsible for the physical properties of CoFe2O4.That is
the preference of accumulation of Co2+ ions will be influencing the magnetic property,
improving the resistive properties and reduces dielectric loss[25,27].
By combining different types of reactions, extremely controlled shapes (spherical or
cubic) can be achieved. Fine quality spinel cobalt ferrite (CoFe2O4) and monodisperse
nanocrystals can be synthesized[28]. Owing to controlling nanocrystal, growth shape, can be can
also be oscillated between spherical and cubic. Not only this, but also blocking temperature
and magnetization of nanoparticles resolute by the size, irrespective of their structure. The
nanoparticles structure is a leading factor aimed at the coercivity Factor for nanocrystals due
to their superficial anisotropy[29]. And these magnetic nanoparticles due to their high capacity
to store information got tremendous technological applications [25,30] The typical spinel
structure represented as (M1−xFex) [MxFe2−x]O4 (M is the metal ion) has a 32 O2− anions, in
between these at a particular interstitial sites metal ion are distributed and ideally termed as the
face-centered cubic unit cell[31]. In that coordination compounds, round brackets indicate

tetrahedral (X site) and square brackets designate the and octahedral (Y site), and x implies the
inversion parameter[32]. Based on the composition of divalent metal ions in tetrahedral and
octahedral sites, spinel structures are categorized as normal, inverse and partially inverse.
Quantity of these divalent metal ions decided by the synthesis, annealing processes and also on
particle size[29]. CoFe2O4 and ZnFe2O4 are spinels, but the arrangement of the ions among the
lattice sites I unique.
Another burning issue for social awareness is to control water pollution[33,34]. Our
environment is commonly distributed with Heavy metals around[31]. All types of ecological
pyramids are affected by these. many industrial effluents and everyday human activities due to
the increased technology are the causes[30]. With the knowledge of the literature survey in
wastewater treatment attempted to control the toxicity by adsorbing with cobalt and zinc nano
ferrites synthesized in our laboratory.
Bivalent transition metals like cobalt and zinc are with doped with nano - ferrites
they’re by following Low-Temperature Self-Propagating combustion method[8,16,35,36].
Synthesized Zinc and Cobalt Nano ferrites from the chemical co-precipitation method were
confirmed with standard data of literature, found to be of 20 to 90 nm in average size, and
comparative study of their properties using the results of FTIR and XRD. The SEM confirms
the cubic spinel structure formation of ferrite particles. Absorption[37] and adsorption
[38,39]studies are done with laboratory wastewater and conventional laboratory dyes.
Comparative Sensing studies showed that the sample displays variation in resistance when
gases are passed over the surface and the change in resistance is observed.
MATERIALS AND METHODS
The present context is to design the synthesis Cobalt and Zinc ferrite and compare its
properties by different characterization methods.

Low-Temperature Self-Propagating combustion method was used to synthesize the
nanoparticles[40–42]. Simple precursors employed were Ammonium Iron (II) Sulfate
((NH4)2Fe(SO4)2·6H2O SDFine-Chem ltd., AR grade), oxalic acid (AR grade)and respective
salts of ZnCl2,CoCl2( SDFine-Chem ltd., AR grade), which were weighed for the desired
stoichiometric ratio and dissolved in double-distilled water[43]. The mixture, using a magnetic
stirrer was stirred for 1 h, a precipitate of constant metal oxalate was obtained at room
temperature. The precipitate was heated with the fuel polyvinyl alcohol ([CH2CH(OH)]n) in
hot air oven to obtain a colored powdered sample of the nano- ferrites of Zinc and cobalt.
CHARACTERIZATIONS
To analyze the structure of nanoparticles, XRD Diffractometer (Xpert MPD, Make:
Philips, Holland) was employed. The XRD patterns were recorded on the X-ray diffractometer
at the range of 2θ from 3º to 136º, using Cu target X-Ray tube, Cu Kα (λ = 1.5406 A) radiation
with an accelerating voltage of 40 kV. FT-IR study was accomplished in order to confirm the
formation of nano particle in the range of 4500-400 cm-1by instrumentation, Using NICOLET
6700, USA instruments. To analyze morphological features of nanoparticles, field emission
scanning electron microscope was used at an accelerating voltage With LaB6 filament -2nm
30 KV With W filament 3.5nm at 30 kv by Emission current of 0 to 200 μA and accelerating
Voltage: 0.2 to 30 kv.
RESULTS AND DISCUSSION:
1. X-ray diffraction analysis (XRD):
The XRD peaks, structural analysis of CoFe2O4 and ZnFe2O4 nanosamples, were
studied with Sherrer’s equation, the average particle size obtained varied between 18.54-18.90
nm based on the 2θ value which was found to be 35.64,40.58.70 and 62.60 respectively. sample

possessed a cubic spinel structure[44]. Size and shapes define the XRD peak position and
intensity defines the atomic position of the unit cell.
The micro strains by definition, root mean square of the variations in the lattice
parameters across the sample is calculated and were found to be 66.14, 71.27, and 81.54, for
cobalt ferrites. This implies the decrease of the lattice parameters when the more prominent ion
is partially substituted by the smaller one. The XRD patterns are perfectly matched with the
standard XRD pattern with reference code ICSD 00-001-1121, indicating purity of the
synthesized material.
20 40 60 80
500
600
700
(a)
Cou
nts
per
sec
on
d
2 Theta
(3,1,1)
(4,4,0)(4,0,0)(5,1,1)
20 40 60 80
300
400
500
600
700
(2,2,0)
(b)
Cou
nts
per
sec
ond
2 theta
(3,1,1)
(4,0,0) (4,4,0)(3,3,3)
Figure 1 (a) & 1 (b): XRD peaks of spinel nano ferrites
Similarly, for zinc ferrite, the average particle size obtained varied between 18.63-20.45
nm based on the 2θ value, which was found to be 30.30, 35.45,43.05, and 56.85,
respectively[40]. The micro strains were calculated and were found to be 48.28, 77.86, and
37.39. Cubic phase structure of the zinc ferrite rendered by the JCPDS 22-1012 card.
Nano Cobalt ferrite
2θ ƛ particle size (nm) dislocation density micro strain
27.6962 545 18.54 0.539 66.14
33.2055 595 18.78 0.532 71.27
35.539 685 18.9 0.53 81.54
Nano zinc ferrite

2θ ƛ particle size dislocation density micro strain
30.1008 400 18.63 0.536 48.28
35.4579 654 18.89 0.529 77.86
56.7441 340 20.45 0.49 37.39
Table. 1.XRD values of metal nano ferrite
2. Fourier-Transform -Infrared Spectroscopy (FTIR)
An important tool, Infrared spectroscopy which made an investigation of the spinel
structural formation of ferrite nanoparticles. This provides information about positions of the
metal cation in the spinel structure and their vibrational modes. In the case of ferrites, the
oxygen ions vibrate with cations of the unit cell in the octahedral and tetrahedral sites are
responsible for absorptions bands. For spinel ferrites, a specific region of absorption is in the
range of 400–600 cm. Cobalt nano-ferrite exhibits two absorption bands in this region. High
vibration band at 557.22cm and others were at 446.6cm. Absorption bands detected within this
edge disclose the creation single-phase spinel structure having two sub-lattices, octahedral and
tetrahedral. CoFe2O4 is exhibiting an inverse spinel where Fe3+ ions and Co2+ ions present at
the tetrahedral and octahedral lattice sites respectively[38]. The vibration observed due to
bending was very broad. The reason could be attributed to the distribution of Fe3+ ions leading
to vibrations due to the stretching mode of the (Fe3+)–oxygen bond at tetrahedral, and other
caused due to (Co2+) – oxygen vibrations in octahedral sites.
4000 3000 2000 1000
80
100
(a)
Tra
nsm
itta
nce
in
%
Wavenumber cm-1 3000 1500
80
100
(b)
Tra
nsm
itta
nce
%
Wavenumber cm-1

Figure. 2 (a) & 2 (b): FTIR bands of spinal nano ferrites
3.Scanning electron microscopy (SEM):
Images of SEM reveal surface topography and composition of the sample. The surface
morphological images and Microscopic structure shows a good agreement with XRD results
of ferrite nanoparticles. Images suggest that morphology at the surface is porous in nature, it is
happening because of the significant degree of agglomeration of ferrite particles.
SEM Image Nano Cobalt ferrites show a zoomed view of the powdered sample,
illustrated with both large and small grains. The nanoparticles size was found to be 50 nm. The
surface is wavy, with an average surface roughness value of about 12.34 nm. From the images
shown above, we can infer that the particles are of irregular shape and are agglomerated
together to form a bigger particle. There was a considerable trace of carbon seen[45]. The
agglomeration of the particles may be due to the hydrophilic nature of the extract added. The
traces of carbon observed may be due to the usage of the mica sheet as a substrate for the
sample.
(a) SEM image and surface texture patterns
of Cobalt nanoferrites
(b) SEM image and surface texture patterns of
Zinc nanoferrites
Figure. 3 (a) & 3(b). SEM images of spinal nano ferrites
SEM Image Nano Zinc ferrites show the size of the particle is around 90 nm. The
average roughness value is 7.35 nm. From the images shown above, we can infer that the
particles are of irregular shape and agglomerated together. There was a significant trace of
carbon seen. The agglomeration of the particles may be due to the hydrophilic nature of the
extract added. The traces of carbon observed may be due to the usage of the mica sheet as a
substrate for the sample.
APPLICATIONS STUDIES
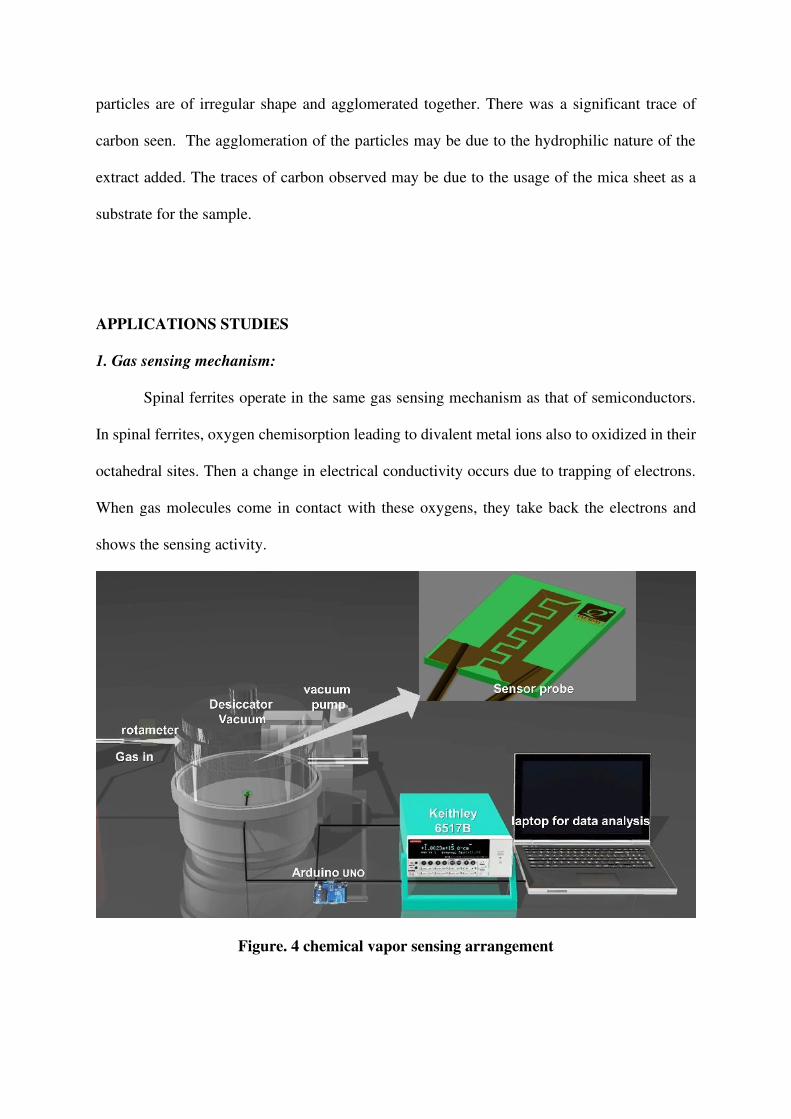
1. Gas sensing mechanism:
Spinal ferrites operate in the same gas sensing mechanism as that of semiconductors.
In spinal ferrites, oxygen chemisorption leading to divalent metal ions also to oxidized in their
octahedral sites. Then a change in electrical conductivity occurs due to trapping of electrons.
When gas molecules come in contact with these oxygens, they take back the electrons and
shows the sensing activity.
Figure. 4 chemical vapor sensing arrangement

By generating a vacuum in a closed chamber (shown in above figure 4), a setup was
made where the probe which was coated with the sample was placed. Gases from various
chemicals were made to pass through the chamber with the help of a nozzle from another
container. An Arduino UNO was used which was connected to the probe to detect the change
in voltages. A program to detect these changes was uploaded to the Arduino UNO. Now, as
the probe senses the gas, there is a variation in the voltage, which indicates that gas has been
sensed. This variable voltage gives rise to a variable resistance. [19] The sensing was taken at
room temperature. The gases that were used are acetone, ethyl alcohol, methanol, and
ammonia. Using a Keithley meter, the value of change in resistance (shown in figure 5) was
found which can also be calculated using the formula,
𝑅𝑠 = 𝑉𝑆 − 𝑉𝑟𝑉𝑟 𝑅𝑟
Where Rs = required a change in resistance
Rr = resistance across reference
Vs = supply voltage
Vr = drop in voltage
Thus, for cobalt nano ferrite, resistance values of these gases are in order methanol > acetone
> ethanol > ammonia. Then sensitivity of these gases is in reverse order that is methanol <
acetone < ethanol < ammonia for cobalt nano ferrite.
(a) Nano cobalt ferrite (b) zinc nano ferrites

Figure 5: (a) & (b) Bar graph of relative sensing properties with different gases
Thus, for zinc nano ferrite, resistance values of these gases are in order, methanol> acetone >
ethanol > ammonia. Then sensitivity of these gases is in reverse order that is methanol <
acetone < ethanol < ammonia.
2. Wastewater analysis:
SEM results show the porous nature of nano ferrites synthesized. In accordance with
this wastewater analysis and adsorption studies are made. Sample X, is wastewater it is
collected by the chemistry laboratory of P C Jabin science college Hubballi. Then 10 mg Cobalt
nano ferrites (B2) and Zinc nano ferrites (B4) are added to 20ml of Waste sample shaken well
and given for water analysis at ESSAR laboratories and Research Centre at approved by
AGEMARK grading Keshwapur Hubballi.
Parameters Sample-X Sample – B2
(Co-nanoferrite)
Sample – B4
(Zn-nanoferrite)
Turbidity (NTU) 250 220 180
Hydrogen ion concentration (pH) 11.5 11.4 10.4
Electric conductivity (µS) 3140 4600 2280
Total dissolved solids-TDS (Mg/L) 1880 2760 1370
Chloride (Mg/L) 467 666 368
Fluoride (Mg/L) 0.8 0.6 0.5
Sulphates (Mg/L) 40 56 36
Nitrates (Mg/L) 10 15 10
40
29
38
46
0
10
20
30
40
50
acetone ammonia ethanol methanol
resistance change in K ohms
39
24
34
42
0
10
20
30
40
50
acetone ammonia ethanol methanol
resistance change in K ohms

Iron (Mg/L) 0.6 0.6 0.6
Alkalinity (Mg/L) 1100 1600 700
COD(Mg/L) 60.4 68.8 52.4
BOD(Mg/L) 7.4 8.4 5.6
Table.2. Water analysis reports with nanoferrites
Turbidity: Turbidity indicates the number of suspended sediment solids in water. Higher is
the turbidity, and more are the suspended sediments in it. Reports show that turbidity values
decrease from waste sample to B4 sample. This nature of synthesized nano ferrites metal
absorption, from sample X. Absorption capacity, is more in sample B4.
Hydrogen ion concentration (pH): As in report pH value decreases from the waste sample,
shows acidity of water decreases. The decrease is sharply noted at B4sample. The concentration
of hydrogen ions in water determines the pH value. Alkalinity is the capacity of water to
neutralize acids. That is it is the measure of the struggle of water to the lowering of pH when
acids are added to the water [46].
Electrical conductivity (EC): EC, of the water, specifies the purity of water. And the number
of total dissolved salts (TDS) in water measures the conductivity of water. It is a measure of
the capability of water to carriage the electricity. It increases as salinity increases. Fewer ions
in the water, less is the EC, purer is the water sample. B4 sample adsorbed the number of ions,
appears to be pure.
Electrical conductivity increases with an increase of Chloride, sulphates and Nitrate content.
Chloride, sulphate and nitrate content from wastewater are absorbed by the sample B4, remains
with 368mg /l.0.5mg/li and 10mg/l, respectively. It shows that Zn nano ferrite can be used in
waste treatment[46].
Chemical Oxygen Demand the measurement of total oxidizable chemicals in the water. It
quantifies the amount of oxidizable pollutants found in wastewater.
The complete discussion reveals that synthesized nano ferrites shows the absorptive capacity.
Which favors that these can be used in wastewater analysis.
3. Absorption:
The existence of a heavy concentration of constituent at the surface of a solid or liquid
a phase is called Adsorption. The reason behind this is the existence of residual forces at the
surface of the liquid or solid phase. The constituent on the surface of which adsorption occurs
is denoted as Adsorbent. And Adsorbate is which is being adsorbed on substrate[47].
In this phenomenon, when a gas is adsorbed on a solid surface, ΔS is appears to be
negative, as its movement is restricted leading to a decrease in the entropy. Now, this process
is natural (spontaneous), that is ΔG is to be negative. But ΔS is becoming negative when
adsorption takes place. Thus, according to the thermodynamic relationship of Gibbs free
energy, ΔG=ΔH–TΔS adsorption is always exothermic. Van der Waals forces (London
Dispersion Forces), a type of weak forces of attraction is responsible for the Adsorption
process[48]. The phenomena depend on both the nature of adsorbate and adsorbent along with
pH, pressure, and surface area also.
In the case of adsorbents, the size of the pores at the surface and the functional groups
are responsible for effective adsorption. Similarly, molecular states, solubility, and functional
groups significantly express the nature of adsorbate.
In the current work, we deliberate the adsorption behavior of different concentrations
of acetic acid, a weak acid on Synthesized nano ferrites. Different Isotherms are studied for
this system and Langmuir model holds good for Zn nano ferrites. Langmuir isotherm explains
the adsorption situation where the number of sorption sites available is limited. Because of
which adsorption sites become saturated, to maximum capacity.
As acetic acid is a weak acid, it forms OH-groups when it reacts with water and which
forms bonds with metal-nanoparticles at the surface. Such reactions act under particular pH of

the solutions, further OH group can be acting as a proton donor or acceptor of a proton, and
balances the pH of the solution[49]. And according to the references, we found that more
alcoholic groups present at adsorption interphase more is the adsorption. FTIR studies have
given proof of this phenomenon.
Cobalt and Zinc nano ferrites hold good for the study of adsorption due to porosity.
Absorption of acetic acid at room temperature is studied by absorption isotherm. Acetic acid
of different concentrations is prepared by mixing the required amount of distilled water in glass
wash bottles. Adsorbents cobalt and zinc nano ferrites are activated by heating them in ovens.
When they become activated with open pores, weighed 1gm, and added to each bottle
separately. Now all the four bottles were shaken well in electrical shakers for half an hour [50]
and then kept in a water bath for separation for 2hours. After separation, 5ml of each sample is
pipetted out carefully and titrated against the standard solution of sodium hydroxide.
Readings Sample B2 (Cobalt nanoferrite) Sample B4(Zinc nanoferrite)
B.R(before
A) ml
Co
(mg/L)
B.R (after
A) ml
Ce(mg/L) 1/Ce Qe(mg/g) 1/Qe Ce(mg/L) 1/Ce Qe(mg/g) 1/Qe
23.3 0.499 21.9 0.468 2.1362 0.031 32.25 0.447 2.232 0.051 19.60
17.4 0.372 16.0 0.342 2.9154 0.030 33.33 0.325 3.086 0.049 20.36
11.4 0.244 10.2 0.218 4.0983 0.025 40.0 0.201 5.0 0.044 22.27
5.3 0.113 4.3 0.092 8.9285 0.020 50.0 0.079 12.82 0.034 29.41
Table 3 -Adsorption Details
Langmuir absorption isotherm:
The Langmuir isotherm is an actual isotherm for an explanation of monolayer formation
on a surface containing a finite number of active adsorptive sites. And further, no more
adsorption occurs.
Thus, Langmuir isotherm epitomizes metal ion, distribution between the liquid and
solid phases[51]. For n-number of identical sites at the surface, Langmuir isotherm is valid up
to monolayer adsorption.

Langmuir model assumes that vacant available sites are of equal size and shape on the
surface of the adsorbent and uniform energies of adsorption. Based on assumptions, its equation
is given as
RL= 11+(1+𝐾𝐿𝐶0) Ref [52]
C0 = initial concentration
KL= Langmuir Constant
RL = separation factor
R2 = equilibrium sorption
Zinc ferrite nanoparticle is showing optimum results for Langmuir isotherm, with
equilibrium sorption value very much near to 1.and separation factor which shows the
absorptive nature is advantageous that is greater than 0 and less than 1.
2 3 4 5 6 7 8 9
30
32
34
36
38
40
42
44
46
48
50
52
(a)
1/q
e
1/Ce
Langmuier isotherm
2 4 6 8 10 12 14
18
20
22
24
26
28
30
(b)
1/q
e
1/Ce
Langmuir isothem
Figure 6 (a) & 4 (b): adsorption isotherms
4. Adsorption of Dyes:
The dye industry is one of the most water-consuming industries. Effluents of these
industries contain many hazardous chemicals, including dyes. Proper advanced techniques are
incorporated to remove these dyes and discharge into water bodies[53,54]. To do so synthesized

nano ferrites are examined with some laboratory dyes adsorption study, which may further
minimize the risk of industrial effluents.
Different dyes and their Absorption spectrum are obtained by using the photo
colorimeter of ELICO make. The optical density (O.D) readings of the dyes are obtained by
taking water as standard, at their respective wavelengths, where color content an index of OD.
Now different dyes are added with required (0.1mg) of cobalt ferrite nanoparticles. Then each
test tubes are shaken well, and color change after adsorption are observed in figure 6. Similarly
zinc ferrite nanoparticles are to be carried out. After dye adsorption studies, using the cobalt
and zinc ferrite nanoparticles, and the O.D of the dyes was re-recorded at their respective nm,
as in table 4, with different filters (wavelength). Color change is confirmed by optical density
values, are tabulated in table 5.
Sl.No Dyes name Chemical
formula
Chemical structure
1 Phenolphthalein C20H14O4
2 Aluminon C22H23N3O9
3 Methyl orange C15H15N3O2
4 Phenol red C19H14O5S
5 Methyl red C14H14N3NaO3S

6 Methylene blue C16H18ClN3S
Table 4. Dyes and their Molecular formula
By using the formula given below the % dye adsorption was calculated
% of dye adsorption = Initial O.D – final O.D x 100 Final O.D
Synthesized nanoparticles are showing active absorption active owing to the functional
amino acid group, which is responded with dyes and removed from their aqueous solutions. It
is evident that Cobalt ferrite NPs and Zinc ferrite NPs can be used as absorbents for different
environmental dye pollutants. Further percentage of adsorption in comparison with cobalt and
zinc shows that zinc nano ferrites are effective in dye adsorption for given dyes.
Dyes samples without nanoferrites
Filter numbers
Optical Density
61 0.66 49 0.89 49 0.56 49 0.88 49 0.97 43 0.86
Dyes samples with Cobalt - nanoferrites
Filter numbers
Optical Density
%
61 0.57 13.6 49 0.56 37.0 49 0.29 48.2 49 0.58 34.0 49 0.55 43.2 43 0.30 65.1
Dyes samples with Zinc - nanoferrites
Filter numbers
Optical Density
%
61 0.51 22.7 49 0.17 80.8 49 0.20 64.2 49 0.32 63.6 49 0.42 56.7 43 0.14 83.7
Table 5. Optical Density values of before and after adsorption

% of adsorption of dyes
Synthesised nanoparticles % of adsorption
1. Cobalt ferrite nanoparticle 40.1
2. Zinc ferrite nanoparticle 61.9
Table 6. Percentage of adsorption
The mechanism of color change by nano ferrites can be predicted. For example, in
phenol red, negatively charged ion denoted as HPS−, the proton from the ketone group of nano
ferrites is lost, resulting in the yellow. And at the same time towards higher pH (pKa = 7.7),
resulting in the red ion denoted as PS2−,as the phenol's hydroxy group loses its proton.
Conclusions:
Single-phase cobalt ferrite nanoparticles and Zinc ferrite nanoparticles are synthesized
by the chemical wet method. The observed transmittance bands in the range 400–600 cm-1 in
FTIR spectra approve the establishment of spinel ferrites. SEM images reveal the formation of
fine particles within the nanometric range. Nano ferrite of cobalt was synthesized with a
particle size of around 50 nm. Sensing studies showed that the sample displays variation in
resistance when gases are passed over the surface, and the change in resistance is highest for
acetone. Nano ferrite of zinc was synthesized with the particle size of around 90 nm. Sensing
studies showed that the sample displays variation in resistance when gases are passed over the
surface and the gases sensed in decreasing order of the value of change in resistance obtained
are methanol, acetone, ethanol, and ammonia, respectively. The motto of this article is to
research and development of ferrite structures, cation distributions, and their impact upon the
applications of ferrite components in the adsorption also. Sample B4 holds good for wastewater
analysis results and follows the Langmuir isotherm forming the single layer adsorption of acetic

acid on it. Further dye adsorption studies reveal that zinc nano ferrites hold good results of dye
adsorption.
Acknowledgements:
The authors acknowledge to the KLE Society Belagavi, and KLE Technological University
(formerly known as B. V. Bhoomaraddi College of Engineering & Technology), for supporting
research. This research work is partially supported by B.V. Bhoomaraddi College of
Engineering and Technology under “Capacity Building Projects” grant reference 2014-15
serial number 14.
References:
[1] C. N. R. Rao, J. Mater. Chem. 2004, 14, DOI 10.1039/b400318g.
[2] C. N. R. Rao, Nat. Nanotechnol. 2014, 9, 564.
[3] S. Ayyappan, G. Diaz De Delgado, A. K. Cheetham, G. Férey, C. N. R. Rao, J. Chem.
Soc. - Dalton Trans. 1999, 2905–2907.
[4] C. N. R. Rao, J. Mater. Chem. 1999, 9, 1–4.
[5] C. N. R. Rao, J. Gopalakrishnan, Acc. Chem. Res. 1987, 20, 228–235.
[6] G. Cadafalch Gazquez, S. Lei, A. George, H. Gullapalli, B. A. Boukamp, P. M. Ajayan,
J. E. Ten Elshof, ACS Appl. Mater. Interfaces 2016, 8, 13466–13471.
[7] U. Mogera, N. Kurra, D. Radhakrishnan, C. Narayana, G. U. Kulkarni, Carbon 2014,
78, 384–391.
[8] S. V. Ganachari, R. Bhat, R. Deshpande, V. A, Recent Res. Sci. Technol. 2012.
[9] S. V. Ganachari, L. Hublikar, J. S. Yaradoddi, S. S. Math, Metal Oxide Nanomaterials
for Environmental Applications, Springer International Publishing, 2019.
[10] V. G. Harris, IEEE Trans. Magn. 2012, 48, 1075–1104.
[11] V. V. Boldyrev, Solid State Ion. 1993, 63–65, 537–543.

[12] R. T. Olsson, G. Salazar-Alvarez, M. S. Hedenqvist, U. W. Gedde, F. Lindberg, S. J.
Savage, Chem. Mater. 2005, 17, 5109–5118.
[13] E. Manova, B. Kunev, D. Paneva, I. Mitov, L. Petrov, C. Estournès, C. D’Orléan, J.-L.
Rehspringer, M. Kurmoo, Chem. Mater. 2004, 16, 5689–5696.
[14] E. H. Walker, M. L. Breen, A. W. Apblett, Chem. Mater. 1998, 10, 1265–1269.
[15] A. Venkataraman, M. C. Patel, Thermochim. Acta 1994, 242, 249–251.
[16] N. N. Mallikarjuna, B. Govindaraj, A. Lagashetty, A. Venkataraman, J. Therm. Anal.
Calorim. 2003, 71, 915–925.
[17] J. N. Behera, C. N. R. Rao, Inorg. Chem. 2006, 45, 9475–9479.
[18] R. Valdez, A. Olivas, D. B. Grotjahn, E. Barrios, N. Arjona, R. Antaño, M. T. Oropeza-
Guzman, Appl. Surf. Sci. 2017, 426, 980–986.
[19] I. C. Nlebedim, Y. Melikhov, D. C. Jiles, J. Appl. Phys. 2014, 115, 043903.
[20] S. Gyergyek, D. Makovec, M. Drofenik, J. Colloid Interface Sci. 2011, 354, 498–505.
[21] B. D. Beake, G. A. Bell, S. R. Goodes, N. J. Pickford, J. F. Smith, Surf. Eng. 2010, 26,
37–49.
[22] C. Zhou, A. Zhang, T. Chang, Y. Chen, Y. Zhang, F. Tian, W. Zuo, Y. Ren, X. Song, S.
Yang, Materials 2019, 12, 1685.
[23] S. Angappane, N. S. John, G. U. Kulkarni, J. Nanosci. Nanotechnol. 2006, 6, 101–104.
[24] N. Kurra, R. G. Reifenberger, G. U. Kulkarni, ACS Appl. Mater. Interfaces 2014, 6,
6147–6163.
[25] “Improvement of the Magnetic Properties of Mn-Ni-Zn Ferrite by the Non-magnetic
Al3+-Ion Substitution,” DOI 10.3923/jas.2005.162.168can be found under
https://scialert.net/abstract/?doi=jas.2005.162.168, n.d.
[26] N. S. S. Murthy, M. G. Natera, S. I. Youssef, R. J. Begum, C. M. Srivastava, Phys. Rev.
1969, 181, 969–977.

[27] G. Zhang, B. Evans, Adv. Mater. Phys. Chem. 2012, 02, 169–172.
[28] M. Aghazadeh, M. R. Ganjali, M. G. Maragheh, Int. J. Electrochem. Sci. 2017, 12,
5792–5803.
[29] K. Biswas, C. N. R. Rao, J. Nanosci. Nanotechnol. 2007, 7, 1969–1974.
[30] M. M. Eltabey, W. R. Agami, H. T. Mohsen, J. Adv. Res. 2014, 5, 601–605.
[31] Q. Chen, K. Su, M. Zhang, Q. Ma, J. Non-Cryst. Solids 2019, 509, 10–22.
[32] P. Ganguly, C. N. R. Rao, J. Solid State Chem. 1984, 53, 193–216.
[33] G. Vilardi, T. Mpouras, D. Dermatas, N. Verdone, A. Polydera, L. Di Palma,
Chemosphere 2018, 201, 716–729.
[34] M. R. Awual, Chem. Eng. J. 2017, 307, 85–94.
[35] S. V. Ganachari, V. K. Joshi, R. Bhat, R. Deshpande, B. Salimath, N. V. S. Rao, V. A,
Int. J. Sci. Res. 2012, 1, 77-79–79.
[36] N. N. Mallikarjuna, A. Venkataraman, Indian J. Eng. Mater. Sci. 2003, 10, 50–58.
[37] S. V. Bhat, A. Rastogi, N. Kumar, R. Nagarajan, C. N. R. Rao, Phys. C Supercond. Its
Appl. 1994, 219, 87–92.
[38] A. Dąbrowski, Adv. Colloid Interface Sci. 2001, 93, 135–224.
[39] F. R. Bagsican, A. Winchester, S. Ghosh, X. Zhang, L. Ma, M. Wang, H. Murakami, S.
Talapatra, R. Vajtai, P. M. Ajayan, et al., Sci. Rep. 2017, 7, DOI 10.1038/s41598-017-
01883-1.
[40] P. M. Prithviraj Swamy, S. Basavaraja, A. Lagashetty, N. V. Srinivas Rao, R.
Nijagunappa, A. Venkataraman, Bull. Mater. Sci. 2011, 34, 1325–1330.
[41] P. M. Prithviraj Swamy, S. Basavaraja, V. Havanoor, N. V. Srinivas Rao, R.
Nijagunappa, A. Venkataraman, Bull. Mater. Sci. 2011, 34, 1319–1323.
[42] A. Venkataraman, V. A. Hiremath, S. K. Date, S. D. Kulkarni, Bull. Mater. Sci. 2001,
24, 617–621.
[43] A. Venkataraman, N. V. Sastry, A. Ray, J. Phys. Chem. Solids 1992, 53, 681–685.
[44] “Microstructure and Superparamagnetic Properties of Mg-Ni-Cd Ferrites
Nanoparticles,” can be found under
https://www.hindawi.com/journals/jnm/2014/492832/, n.d.
[45] “The Potential Theory of Adsorption of Gases and Vapors for Adsorbents with
Energetically Nonuniform Surfaces. | Chemical Reviews,” can be found under
https://pubs.acs.org/doi/10.1021/cr60204a006, n.d.
[46] “Physical adsorption isotherms extending from ultrahigh vacuum to vapor pressure | The
Journal of Physical Chemistry,” can be found under
https://pubs.acs.org/doi/abs/10.1021/j100842a045, n.d.
[47] G. Sankar, P. R. Sarode, A. Srinivasan, C. N. R. Rao, S. Vasudevan, J. M. Thomas,
Proc. Indian Acad. Sci. - Chem. Sci. 1984, 93, 321–334.
[48] D. Jacques, J. Šimůnek, D. Mallants, M. T. van Genuchten, Vadose Zone J. 2008, 7,
698–711.
[49] G. Liu, X. Li, L. C. Campos, J. Water Supply Res. Technol.-Aqua 2017, 66, 105–115.
[50] “Removal of Dyes from Wastewater using Adsorption -A Review,” can be found under
https://www.researchgate.net/publication/255966641_Removal_of_Dyes_from_Wastew
ater_using_Adsorption_-A_Review, n.d.
[51] S. V. Mohan, J. Karthikeyan, Environ. Pollut. 1997, 97, 183–187.
[52] D. A.O, IOSR J. Appl. Chem. 2012, 3, 38–45.
[53] “Theory for Irreversible and Constant-Pattern Solid Diffusion | Industrial & Engineering
Chemistry,” can be found under https://pubs.acs.org/doi/abs/10.1021/ie50524a025, n.d.
[54] P. T. Lekkas, “Sorption-desorption isotherms of dyes from aqueous solutions and
wastewaters with different sorbent meterials,” can be found under
https://journal.gnest.org/publication/233, 2013.
