zhonghua qu and ovidiu daescu december 24, 2009 university of texas at dallas
TRANSCRIPT

Assisting Visualization System
Zhonghua Qu and Ovidiu Daescu
December 24, 2009
University of Texas at Dallas

IntroductionAssisting Visualization System Implementation Examples Conclusion
Outline

Introduction• Visualization and Application• Implementing Visualization• Integration Challenges• Our Goal
Assisting Visualization SystemThe Implementation Experiment Result Conclusion
Outline

Computer Aided Design◦ IKEA Home Planner
Introduction: Visualization and Applications

Computer Games◦ First Person Shooting Games
Introduction: Visualization and Applications

Three layers of visualization programs◦Program Model◦Visualization Layer◦Graphics Engine
Introduction: Implementing Visualization
Graphics Engine
Visualization Layer
Logic Code
Program Model◦ Logic of Programs
For example, in car simulation: when a driver turns the wheel, the orientation of the car should change correspondingly.
◦ Numerical DataFor example, the width and height of a piece of furniture, or the coordinate of a vehicle. They are abstract and only different by the definition given.
Introduction: Implementing Visualization
Visualization and Graphics Engine◦ 3D Graphics Rendering
Includes the detailed implementation of how the object inside the program model should be rendered on the screen. For example, a chair object is rendered based on its size, type, material etc.
◦ Graphics EngineImplementation of rendering algorithms. Provides more abstract control over the object rendered.
Introduction: Implementing Visualization

Steep Learning CurveTo use the graphics engine for visualization requires significant 3D graphics knowledge including matrix transformation, lighting etc.
Graphics Engine
Introduction:Concerns about Visualization Layer
Visualization Code
Matrix TransformationLighting ModelTexture Format….….
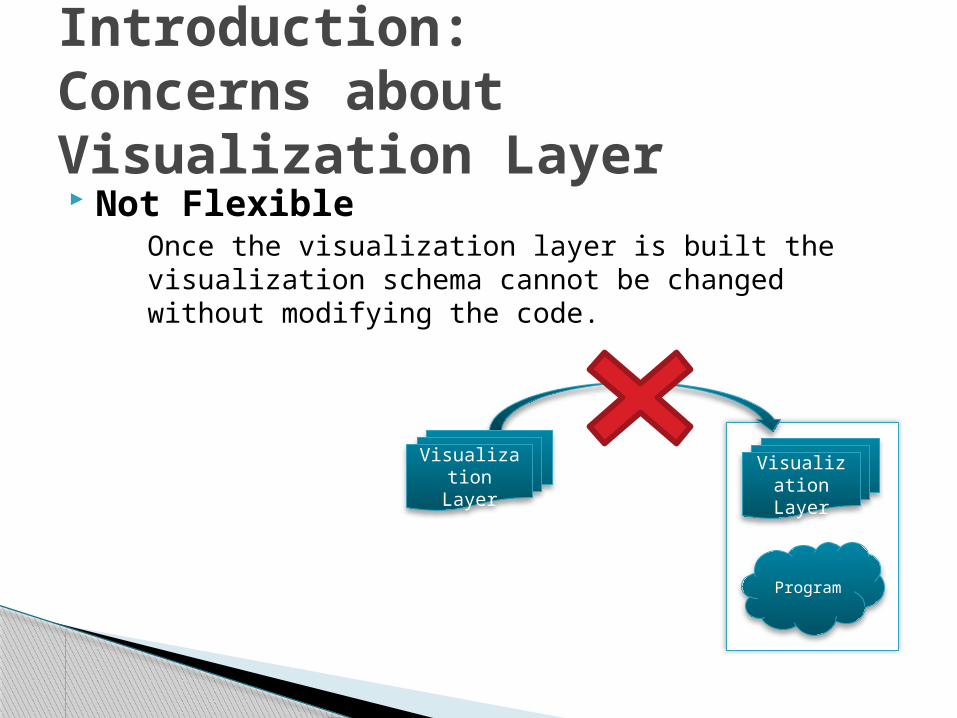
Not FlexibleOnce the visualization layer is built the visualization schema cannot be changed without modifying the code.
Introduction: Concerns about Visualization Layer
Program
Visualization Layer
Visualization Layer

Not reusableChanging the underlying program forces changes in the definition of the visualization. This implies rewriting most of the code.
Introduction: Concerns about Visualization Layer
Program Program
Visualization Layer

Provide a visualization system◦Doesn’t require Graphics Knowledge◦Flexible to change the visualization schema◦Reusable between applications
Introduction: Our Goal

Introduction Assisting Visualization System• Overview• Visual Component• Binding with Program
Implementation Examples Conclusion
Outline

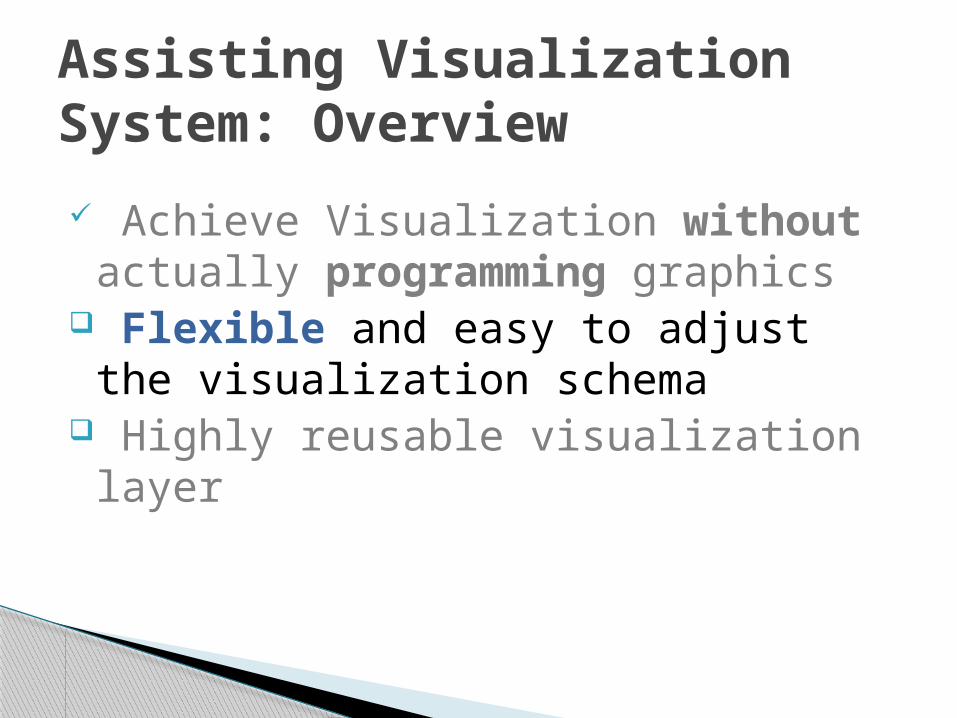
Achieve Visualization without actually programming graphics
Flexible and easy to adjust the visualization schema
Highly reusable visualization layer
Assisting Visualization System: Overview

Achieve Visualization Without Programming Use an approach called Binding
◦Treat visualizations as components◦ No visualization Code in program◦ Bind visualization at runtime◦Binding Defined Through XML
Assisting Visualization System: Overview
Achieve Visualization without actually programming graphics
Flexible and easy to adjust the visualization schema
Highly reusable visualization layer
Assisting Visualization System: Overview

No hard coded visualization layer Define Visualization Through XML
◦No source code modification required◦ Doesn’t need recompilation◦ Easy to check the visualization definition
Assisting Visualization System: Overview

Achieve Visualization without actually programming graphics
Flexible and easy to adjust the visualization schema
Highly reusable visualization layer
Assisting Visualization System: Overview

Reuse visualization across programs Reusable Visual Component
◦Integrated through XML binding◦No data structure dependency◦Reusable through changing the binding
Assisting Visualization System: Overview
Achieve Visualization without actually programming graphics
Flexible and easy to adjust the visualization schema
Highly reusable visualization code
Assisting Visualization System: Overview

Aggregation of Visualization Code◦Interacts with Graphics Engine◦Not tied to any application◦Reusable across applications◦Ready to use component developed by third party
Assisting Visualization System: Visual Component
What is the basis for binding?◦ Object Oriented Programming Language◦ One visual component per class
Each class can bind to one visual component. During the execution of the program, this class will be visualized by the visual component.
◦ One visualized entity per object instanceWhenever a new instance of the class is created, an instance of the visual component which is tied to the program instance is created and rendered on the screen.
Assisting Visualization System: Binding with Program
IntroductionAssisting Visualization SystemImplementation• Overview• Program Loader• Code Execution Monitor• Rendering System• Binding Definition Format
Examples Conclusion
Outline

Implementation Language: Java◦ Cross Platform◦ Applets run in browser on Internet◦ Low development cost
Third party graphics engine: Jmonkey Engine◦ Written in Java◦ Using OpenGL for rendering◦ Open source project◦ Used in many commercial software
Implementation: Overview

Major Components◦ Program Loader
Loads and modifies the target java program to integrate it with the visualization framework.
◦ Code Execution Monitor Monitors the execution of the target program and realizes
the visualization binding.◦ Rendering System
Manages the life cycle of visual component instances that tie with underlying target program.
Renders the visual components using Jmonkey Graphics Engine.
Implementation: Overview

Customized Java Class Loader◦ Loads class binary from file into memory for Java virtual
machine Code injection at load time
◦ Inject binary code at runtime before the class is used by Java virtual machine
Interact with Code Execution Monitor◦ Register target class information and call handler function
inside execution monitor
Implementation: Program Loader

Monitors the target program execution◦ New instance creation
Call Render System to create visual component instance and tie to the underlying object
◦ Object garbage collectionRemove the object entry from the monitor
◦ Object value changedUpdate the binding property in its tied visual component correspondingly
Implementation: Code Execution Monitor

Visual Component Management◦ Load visual component
Search for visual component java class file for the visual component
◦ Create, remove visual componentManage the visual component based on outside system call
◦ Render visual componentsUse Graphics Engine to finally render the visual component
Implementation: Rendering System
• Jmonkey Graphics Engine Functions
◦ Create User InterfaceCreate visualization window in which all visual components are rendered
◦ Model LoadingLoad 3D models from files on disk and store in memory as an object
◦ Scene graph ManagementObject oriented way of accessing the 3D objects in the rendered environment
Implementation: Rendering System

Graphics Engine: Jmonkey Engine◦Rendering Output
Implementation: Overview

Graphics Engine: Jmonkey Engine◦Rendering Output
Implementation: Overview

XML Format◦Simplicity, easily accessible to developers◦Open format, many tools available
Binding XML Schema◦Define the format of binding xml◦Document for people writing the binding XML◦Automated parsing inside visualization system
Implementation: Binding Definition File

XML Parsing◦ Apache XMLBeans library
Open source XML parsing library under Apache foundation.
◦ Automatic java parsing code generation base on Schema File
Generate source code for parser based on the schema file. Visit the content of the XML file using an object oriented approach.
Implementation: Binding Definition File

Introduction Binding Approach Assisting Visualization System Implementation Examples
QuickSort Growing Tree
Conclusion
Outline

Visualization of QuickSort on 80 elements
Experimental Results: QuickSort

Visual Component Binding with Java Program◦Java Class: SortElement◦Visual Component: BarVO◦Bindings 1 ClassBind 3 PropertyBind
Examples: QuickSort

Visual Component Binding with Java Program◦ ClassBind – Bind SortElement with BarVO
◦Binding XML
<ClassBind> <TargetClass name=“SortElement”> <Constructor signature="()V" /> </TargetClass> <VisualObject name=“BarVO” > <Parameter key="scaleX" value="10" /> <Parameter key="scaleZ" value="50" /> </VisualObject> </ ClassBind >
Examples: QuickSort

Visual Component Binding with Java Program◦ PropertyBind – SortElement.value to BarVO.scaleY Binding XML
<PropertyMap className="SortElement" toName="scaleY">
<Field name="value*500" /> </PropertyMap>
Examples: QuickSort
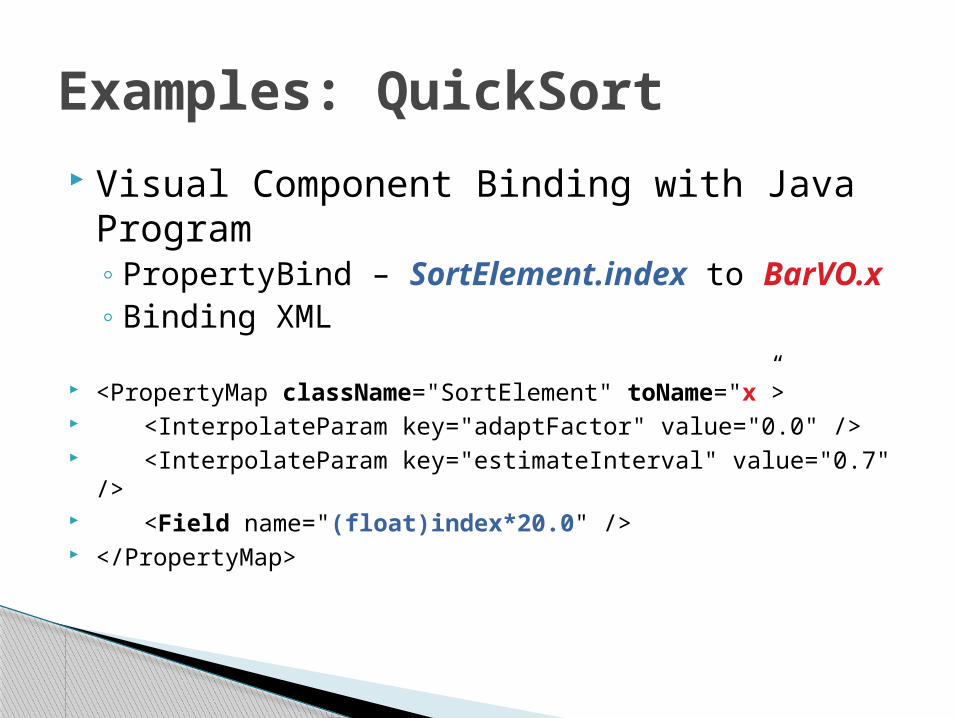
Visual Component Binding with Java Program◦ PropertyBind – SortElement.index to BarVO.x◦ Binding XML
<PropertyMap className="SortElement" toName="x”> <InterpolateParam key="adaptFactor" value="0.0" /> <InterpolateParam key="estimateInterval" value="0.7" /> <Field name="(float)index*20.0" /> </PropertyMap>
Examples: QuickSort

Visual Component Binding with Java Program◦ PropertyBind – to BarVO.z◦ Binding XML
<PropertyMap className="demo.sort.SortElement" toName="z“>
<InterpolateParam key="adaptFactor" value="0.0" /> <InterpolateParam key="estimateInterval" value="0.1" /> <Code outVar="offset"> float offset=0.0f; if(pivot) offset=100f; else offset=0f; </Code> </PropertyMap>
Examples: QuickSort

Visual Component Binding with Java Program◦ Resulting Visualization:
Examples: QuickSort
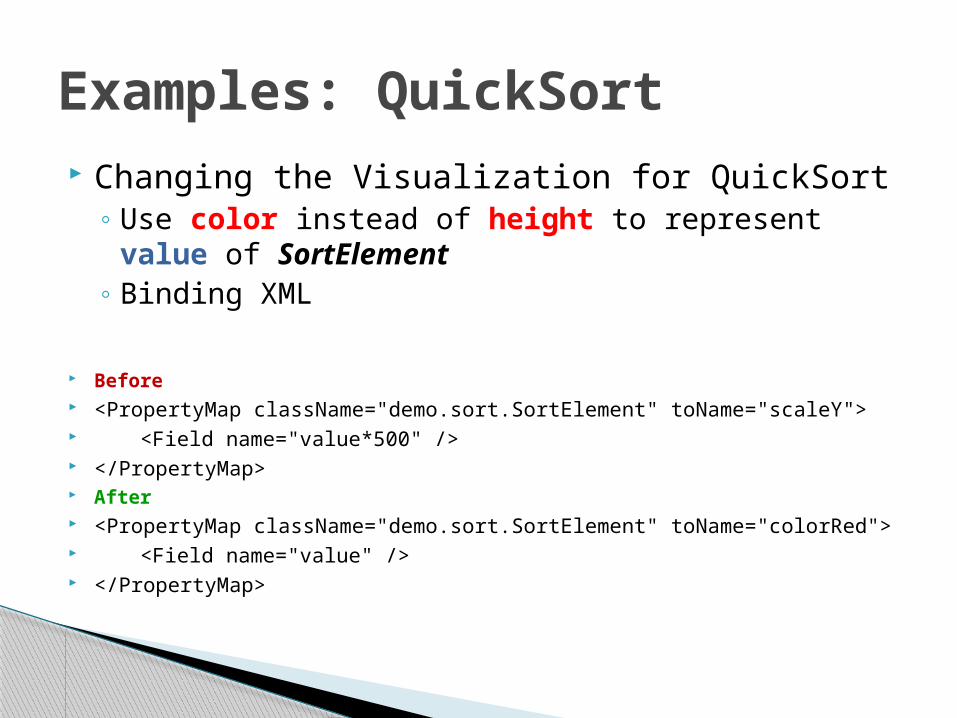
Changing the Visualization for QuickSort◦ Use color instead of height to represent value of SortElement◦ Binding XML
Before <PropertyMap className="demo.sort.SortElement" toName="scaleY"> <Field name="value*500" /> </PropertyMap> After <PropertyMap className="demo.sort.SortElement" toName="colorRed"> <Field name="value" /> </PropertyMap>
Examples: QuickSort

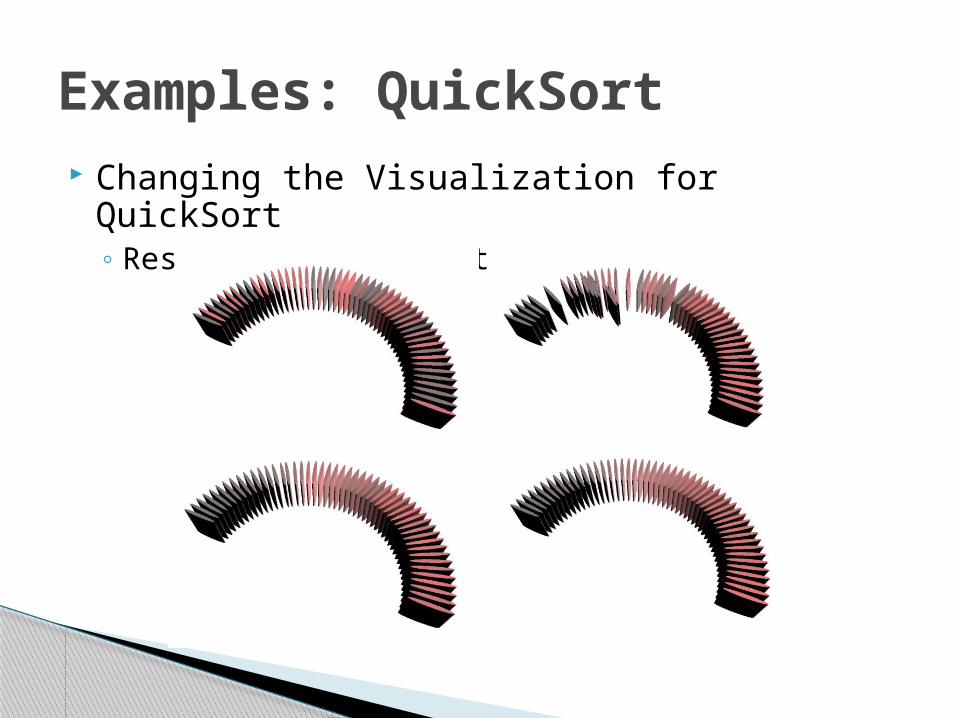
Changing the Visualization for QuickSort◦ Resulting Visualization:
Examples: QuickSort

Changing the Visualization for QuickSort◦ Display index of SortElement on a curve◦ Binding XML
Before <PropertyMap className="demo.sort.SortElement" toName="x“> <Field name="(float)index*20.0" /> </PropertyMap>
After <PropertyMap className="demo.sort.SortElement" toName="rotateW“> <Field name="Math.cos(-((float)index/(float)maxIndex*Math.PI- Math.PI/2f)*0.5f)" /> </PropertyMap> <PropertyMap className="demo.sort.SortElement" toName="rotateY"> <Field name="Math.sin(-((float)index/(float)maxIndex*Math.PI- Math.PI/2f)*0.5f)" /> </PropertyMap>
Examples: QuickSort
Changing the Visualization for QuickSort◦ Resulting Visualization:
Examples: QuickSort

Visualization of a growing Tree◦ Growing Tree with branch factor 3
Examples: Growing Tree

Visualizatoin for trajectory simulation◦ Simulation of the movment of 80 elements with gravity
influence on each other
Examples: Orbiting Mass
IntroductionBinding ApproachAssisting Visualization SystemImplementationExamplesConclusion
Outline

Introduced visualization through binding approach. Implemented Assisting Visualization System
◦ Decoupled from underlying program◦ Flexible to change visualization schema◦ Reusable visual component
Created a prototype system that can be adopted in languages other than Java.
Conclusion: