zevenhoven & kilpinen particulates 12.6.2001 5-1 chapter...
TRANSCRIPT

Zevenhoven & Kilpinen PARTICULATES 12.6.2001 5-1
Chapter 5 Particulates5.1 Introduction
Emissions of ash and other solid particles from power plants and other industrialactivities were the first that called for action. There are several reasons for that. First,since down to a size of a few micron particles (or droplets) can be seen by the nakedeye, the problems could not have remained unnoticed. Secondly, the emissionsproduce a hazard much closer to the source than gaseous pollutants do: material isdeposited within a shorter range. As a first response to this, high stacks have beenerected worldwide. A third reason is that the amount of dust that may be emittedfrom, for example, a coal-fired power plant, per unit output power is much higherthan for other pollutants. This is simply because the amount of ash-forming materialin coals is much larger than the amount of sulphur, nitrogen etc., being typically 10-20%-wt (dry). This, in combination with the fact that large-scale use of coal as an energysource was about fifty years ahead of oil and gas explains why dust emissions fromcoal-fired power plants have been controlled since the 1920s (7 chapter 2).Electrostatic precipitators or ESPs (L section 5.7), still a leading technology in thisfield, were applied for this purpose almost exclusively in these days: efficiencies haveincreased from ~ 90% to ~ 99% since then (Klingspor and Vernon, 1988).
During the last decades the maximum allowable emissions of particulates havedecreased, for coal firing in western Europe, from 150 - 200 mg/m³STP in the 1980sto typically 50 mg/m³STP in the 1990s, with 20 mg/m³STP as the limit for the nearfuture for units larger than 300 - 500 MWthermal. Although the environment and health-related issues are the most important motivations for the control of particulateemissions several other factors contribute to the picture. As the other chaptersdemonstrate, other pollutants have to be controlled as well and the technologiesapplied for that do not allow for high loads of fly ash or other condensed matter inthe gas to be treated. More recently, the coming-of-age of integrated processes basedon pressurised fluidised bed combustion and coal gasification with combined cyclepower generation (PFBC-CC and IGCC) presented the problem of hot (andpressurised) gas clean-up for dust. Modern expansion turbines applied there do notallow for turbine inlet dust concentrations higher than a few ppmw, with additionalrequirements for particles larger than 10 µm and 2 µm. This maximum dust load isless than 1/10th of a typical allowable emission to the environment (Stringer and
Zevenhoven & Kilpinen PARTICULATES 12.6.2001 5-2
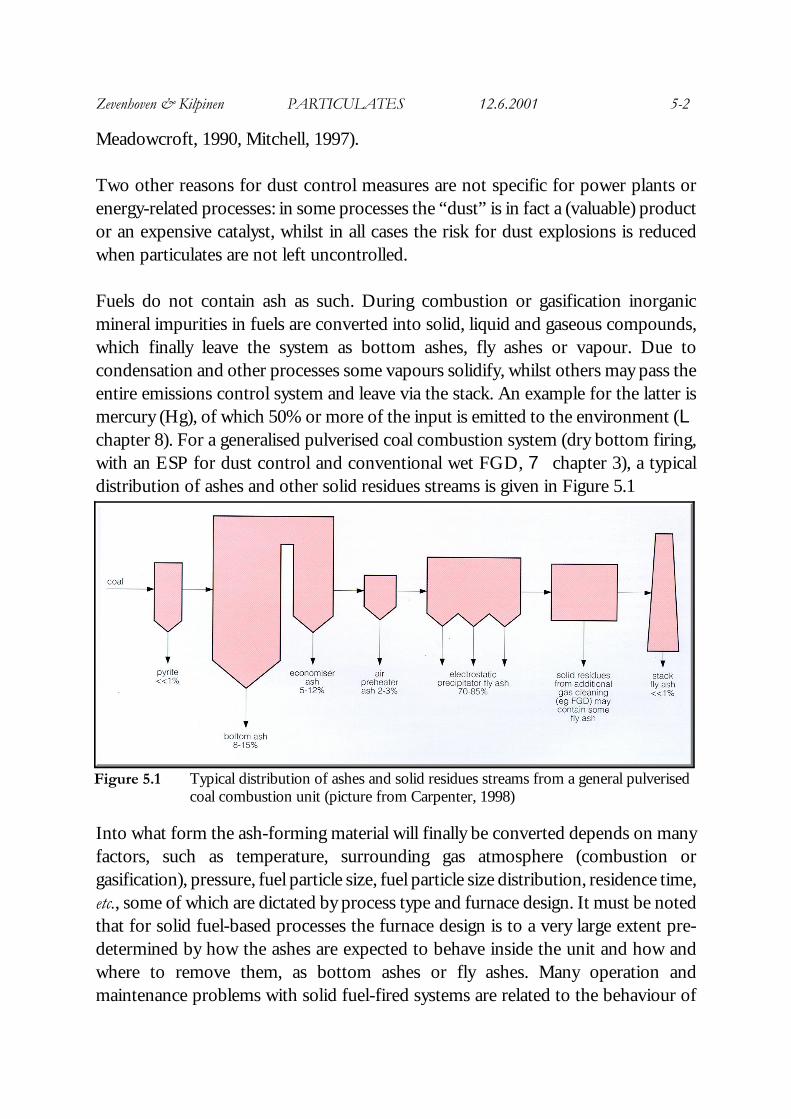
Figure 5.1 Typical distribution of ashes and solid residues streams from a general pulverisedcoal combustion unit (picture from Carpenter, 1998)
Meadowcroft, 1990, Mitchell, 1997).
Two other reasons for dust control measures are not specific for power plants orenergy-related processes: in some processes the “dust” is in fact a (valuable) productor an expensive catalyst, whilst in all cases the risk for dust explosions is reducedwhen particulates are not left uncontrolled.
Fuels do not contain ash as such. During combustion or gasification inorganicmineral impurities in fuels are converted into solid, liquid and gaseous compounds,which finally leave the system as bottom ashes, fly ashes or vapour. Due tocondensation and other processes some vapours solidify, whilst others may pass theentire emissions control system and leave via the stack. An example for the latter ismercury (Hg), of which 50% or more of the input is emitted to the environment (Lchapter 8). For a generalised pulverised coal combustion system (dry bottom firing,with an ESP for dust control and conventional wet FGD, 7 chapter 3), a typicaldistribution of ashes and other solid residues streams is given in Figure 5.1
Into what form the ash-forming material will finally be converted depends on manyfactors, such as temperature, surrounding gas atmosphere (combustion orgasification), pressure, fuel particle size, fuel particle size distribution, residence time,etc., some of which are dictated by process type and furnace design. It must be notedthat for solid fuel-based processes the furnace design is to a very large extent pre-determined by how the ashes are expected to behave inside the unit and how andwhere to remove them, as bottom ashes or fly ashes. Many operation andmaintenance problems with solid fuel-fired systems are related to the behaviour of
Zevenhoven & Kilpinen PARTICULATES 12.6.2001 5-3
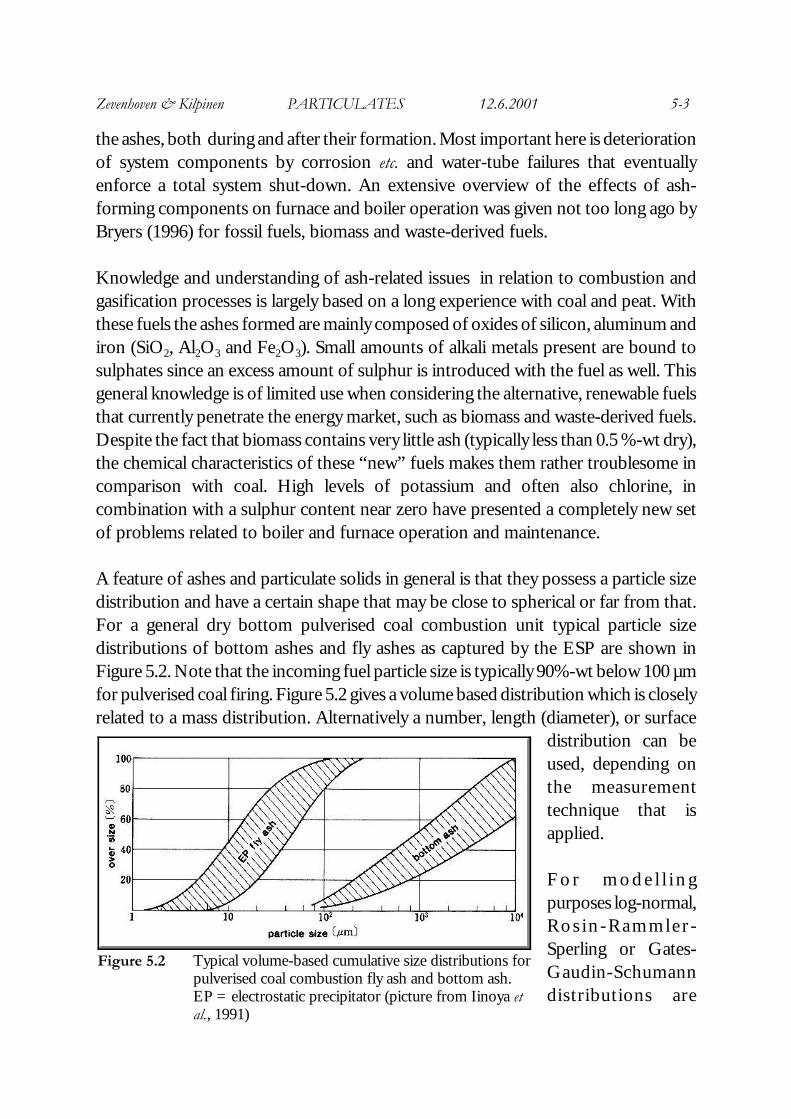
Figure 5.2 Typical volume-based cumulative size distributions forpulverised coal combustion fly ash and bottom ash.EP = electrostatic precipitator (picture from Iinoya etal., 1991)
the ashes, both during and after their formation. Most important here is deteriorationof system components by corrosion etc. and water-tube failures that eventuallyenforce a total system shut-down. An extensive overview of the effects of ash-forming components on furnace and boiler operation was given not too long ago byBryers (1996) for fossil fuels, biomass and waste-derived fuels.
Knowledge and understanding of ash-related issues in relation to combustion andgasification processes is largely based on a long experience with coal and peat. Withthese fuels the ashes formed are mainly composed of oxides of silicon, aluminum andiron (SiO2, Al2O3 and Fe2O3). Small amounts of alkali metals present are bound tosulphates since an excess amount of sulphur is introduced with the fuel as well. Thisgeneral knowledge is of limited use when considering the alternative, renewable fuelsthat currently penetrate the energy market, such as biomass and waste-derived fuels.Despite the fact that biomass contains very little ash (typically less than 0.5 %-wt dry),the chemical characteristics of these “new” fuels makes them rather troublesome incomparison with coal. High levels of potassium and often also chlorine, incombination with a sulphur content near zero have presented a completely new setof problems related to boiler and furnace operation and maintenance.
A feature of ashes and particulate solids in general is that they possess a particle sizedistribution and have a certain shape that may be close to spherical or far from that.For a general dry bottom pulverised coal combustion unit typical particle sizedistributions of bottom ashes and fly ashes as captured by the ESP are shown inFigure 5.2. Note that the incoming fuel particle size is typically 90%-wt below 100 µmfor pulverised coal firing. Figure 5.2 gives a volume based distribution which is closelyrelated to a mass distribution. Alternatively a number, length (diameter), or surface
distribution can beused, depending onthe measurementtechnique that isapplied.
F o r m o d e l l i n gpurposes log-normal,Ros in -Rammle r -Sperling or Gates-Gaudin-Schumanndistributions are

Zevenhoven & Kilpinen PARTICULATES 12.6.2001 5-4
generally used, all three based on two statistical parameters. The non-spherical shapeof a particle can be quantified by a single quantity such as the (Wadell) sphericity, ψ,using a perfect sphere as a reference:
(5-1)
For a spherical particle, ψ = 1, for a cube ψ = 0.81, for coal powder ψ = 0.65-0.75(Kunii and Levenspiel, 1991).
It is obvious that the removal of particles or droplets from a gas requires someunderstanding of what is generally known as Aaerosol technology@. Some of that willbe mixed into this chapter. An aerosol is a suspension of solid or liquid particles in agas, with particle sizes ranging from 0.001 to over 100 µm (Hinds, 1982). More detailson solids handling, aerosols and particle technology in general can be found elsewhere(Iinoya et al., 1991, Hinds, 1982, Zevenhoven and Heiskanen, 2000).
Considering the health risks presented by dust emissions from power plants theclassifications PM10 (particulate matter finer than 10 µm) and PM2.5 (particulate matterfiner than 2.5 µm) are widely used. The PM2.5 standard for ambient air quality waspresented in 1997 by the US EPA as an addition to the PM10 standard, recognising thatthe differences in chemical composition and physical behaviour make the two sizeclasses very different from an environmental impact and health hazard point of view.For Europe, a standard for PM2.5 has been proposed for 2005 (Sloss and Smith, 1998).PM2.5 class particles are a problem for the human respiratory system. Thenose/mouth/throat system can=t prevent the particles from entering the lungs; theycan=t be removed from lung tissue by the blood circulation either.
PM10 and PM2.5 particulate matter as generated by human activities may be of the sameorder as what is produced by natural processes (sand and soil dispersion, sea salt,volcanoes). It is estimated that a of the PM10 comes from coal combustion, roadtransport is considered to be a more serious pollutant (diesel engines, leaded gasoline).In the US, 45% of PM2.5 is connected to fossil fuel combustion. For a coal fired unitwith ESP or baghouse filter the emissions will be in the finer PM10 range, being of theorder PM3.5 when a wet FGD scrubber is present, approaching PM1.0 for the mostefficient plant (Sloss and Smith 1998). One feature of PM2.5 is that significant amountsof it are formed as so-called secondary particles. Sulphate and nitrate aerosols areproduced by processes taking place in the atmosphere, whilst fragmentation of PM10
particle of surfacevolume same with sphereof surface
= particle of surface
) particle of volume (4.836 =
32
ψ
Zevenhoven & Kilpinen PARTICULATES 12.6.2001 5-5
particles adds to the PM2.5 fraction as well. Clearly the problem goes far beyondcontrolling PM10 and PM2.5 emissions from combustion and gasification facilities.
In this chapter the various methods to remove particulate matter, mainly fly ash, fromcombustion flue gases and gasification product gases will be dealt with. Following ashort analysis of how ashes are generated and how they are correlated with ash-forming matter in the fuel, some emission standards for fly ash emissions are given.Starting with the largest particle size fraction, gravity settling and gas cyclones arediscussed first. This is followed by the two most important technologies, beingelectrostatic precipitation (ESP), and baghouse/barrier filters, respectively. Then ashort discussion on wet scrubbing is presented. After that the special problem of hightemperature, higher pressure (HTHP) gas clean-up for particles is addressed. Thechapter ends with a few words on particulate emissions from vehicles.
It is noted that organic particulate emissions such as tar and soot are not included inthis chapter (L chapter 6).
5.2 Ash-forming elements in fuels
As stated above, fuels do not contain ash as such. Apart from the combustiblehydrocarbon part many inorganic mineral impurities are integrated within or mixedwith the fuel: upon combustion or gasification this material will be oxidised to by-products of the process. Often this material can be put to further use, as is the casewith fly ashes collected from the flue gas of a pulverised coal combustion facility(Sloss and Smith, 1996).
Geologically old fossil fuels contain highly integrated ash-forming matter. For low-grade coals and lignites a significant amount of that can be removed before furtherprocessing. Especially for steel processing application it is necessary to reduce theamount of ash-forming material (“coal washing”), or when the amount of thatmaterial is excessive, such as 50%-wt or more in lignites from India or Greece. InGermany, almost all (brown) coals are washed before firing. Waste-derived fuels andbiomass fuels contain associated material that is only loosely bound to thecombustible part of the fuel. Significant amounts of KCl (potassium chloride) can beremoved from straw, for example, by simply washing with water. Pieces of metalssuch as iron and aluminum are easily removed from waste-derived fuels by magneticand eddy current-based methods.
Zevenhoven & Kilpinen PARTICULATES 12.6.2001 5-6
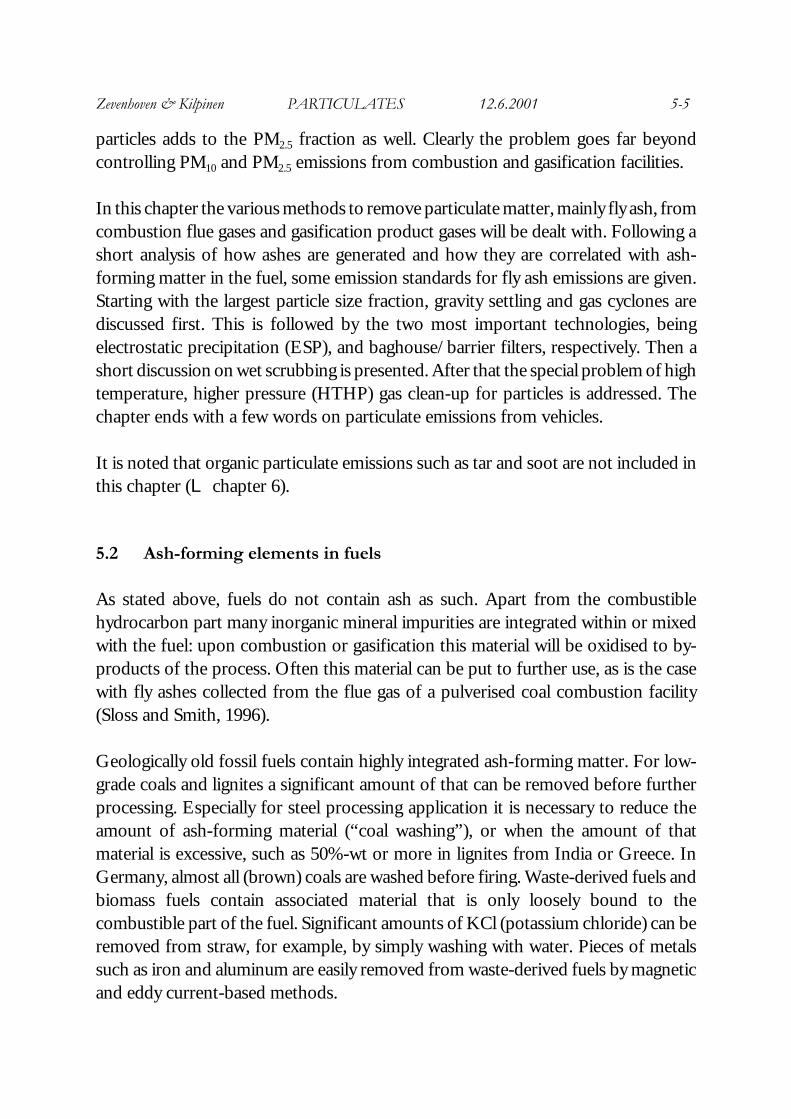
Figure 5.3 Transformation of mineral matter duringcoalification (picture from Bryers, 1996).
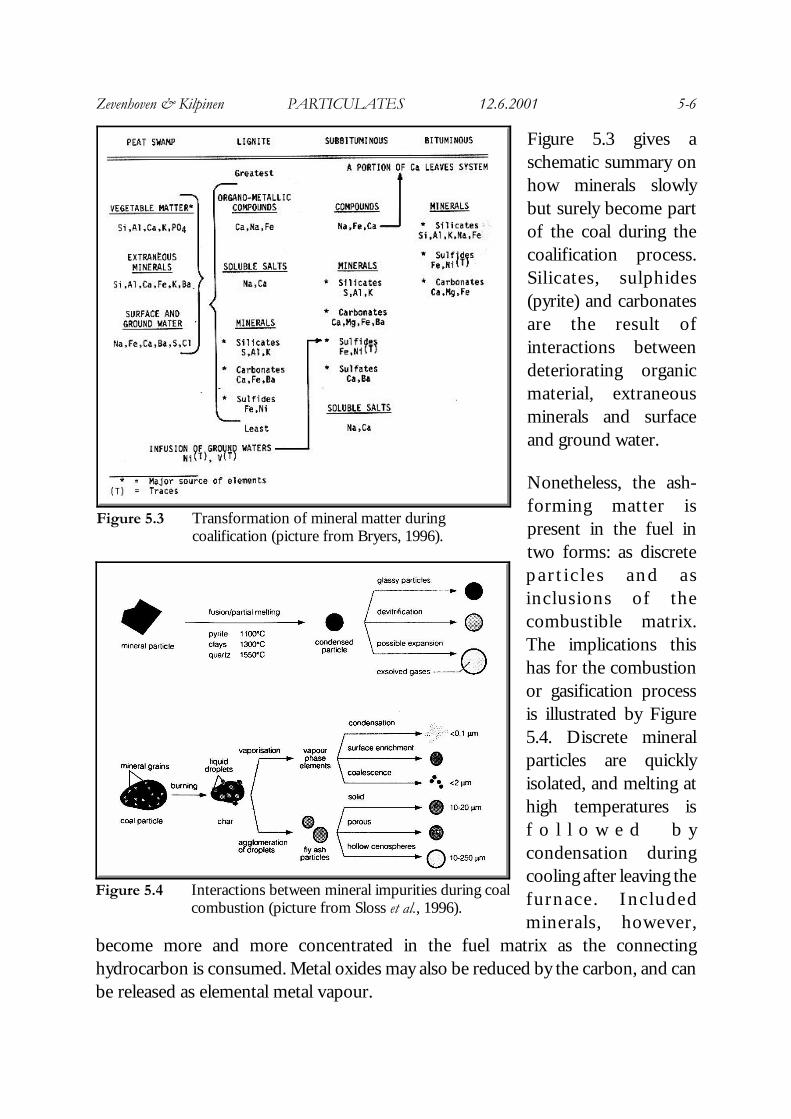
Figure 5.4 Interactions between mineral impurities during coalcombustion (picture from Sloss et al., 1996).
Figure 5.3 gives aschematic summary onhow minerals slowlybut surely become partof the coal during thecoalification process.Silicates, sulphides(pyrite) and carbonatesare the result ofinteractions betweendeteriorating organicmaterial, extraneousminerals and surfaceand ground water.
Nonetheless, the ash-forming matter ispresent in the fuel intwo forms: as discretepa r t i c l e s and a sinclusions of thecombustible matrix.The implications thishas for the combustionor gasification processis illustrated by Figure5.4. Discrete mineralparticles are quicklyisolated, and melting athigh temperatures isf o l l o w e d b ycondensation duringcooling after leaving thefurnace . Inc ludedminerals, however,
become more and more concentrated in the fuel matrix as the connectinghydrocarbon is consumed. Metal oxides may also be reduced by the carbon, and canbe released as elemental metal vapour.
Zevenhoven & Kilpinen PARTICULATES 12.6.2001 5-7
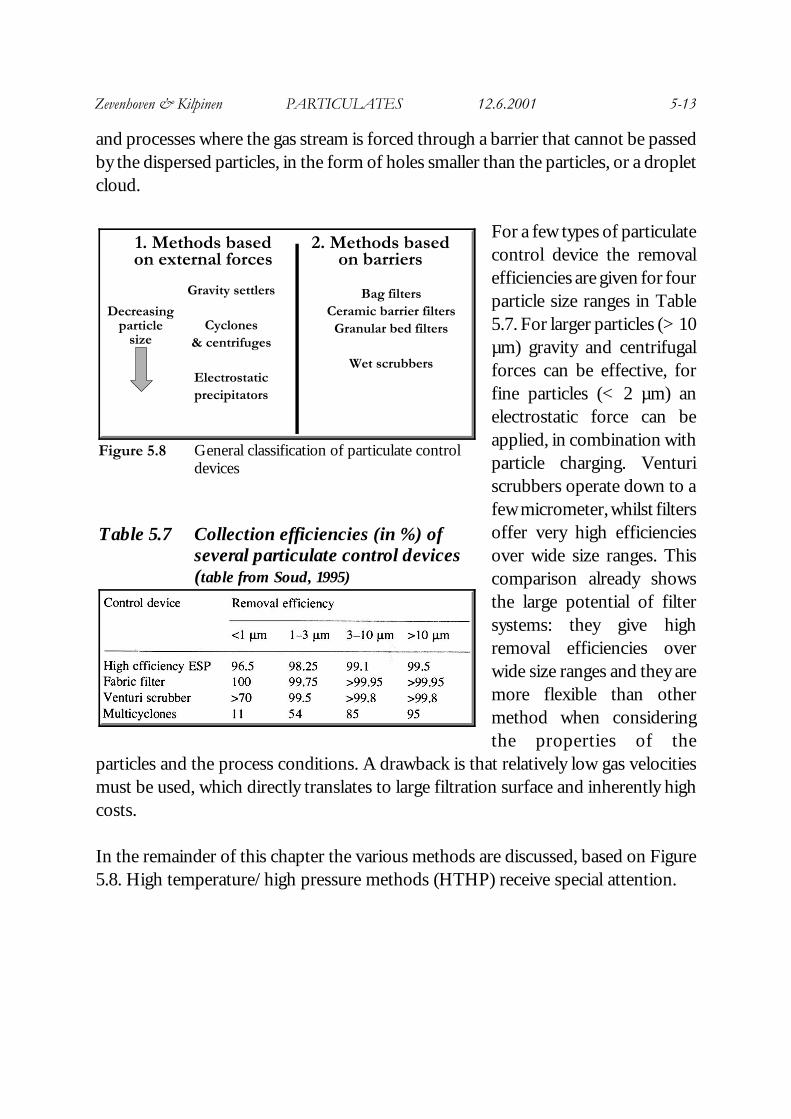
Figure 5.6 Ash formation during bubbling fluidised bedcombustion (picture from Couch, 1995)
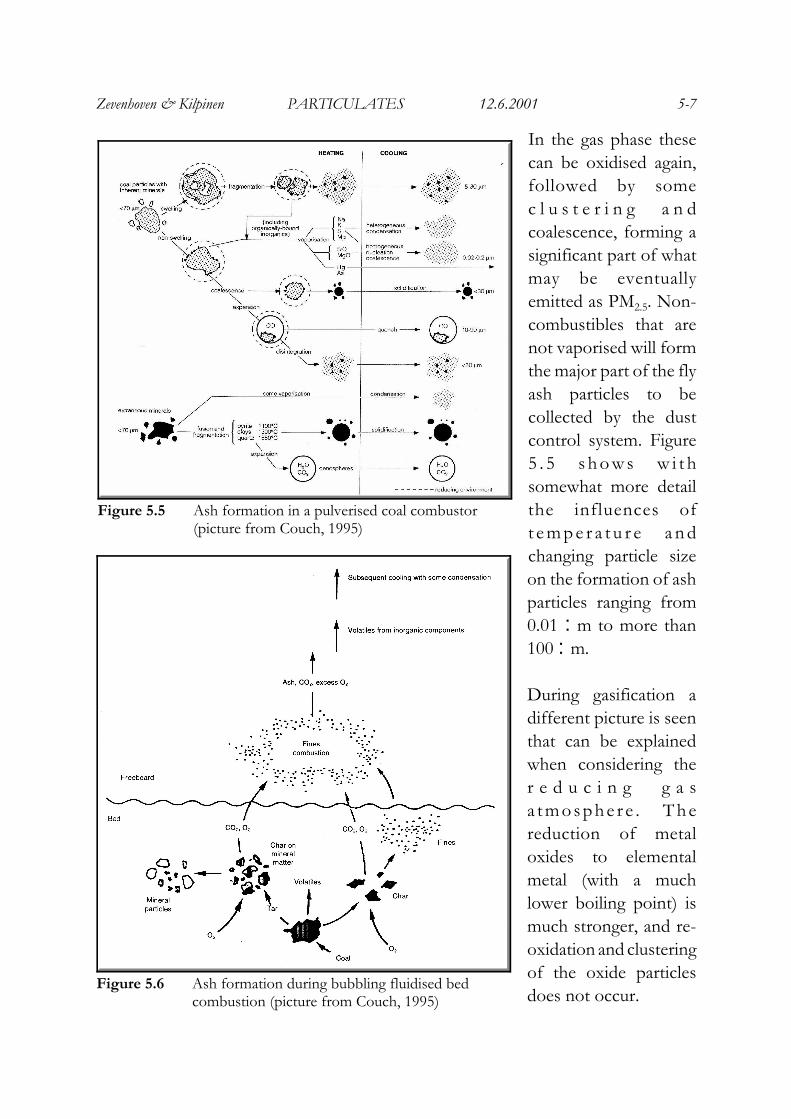
Figure 5.5 Ash formation in a pulverised coal combustor(picture from Couch, 1995)
In the gas phase thesecan be oxidised again,followed by somec l u s t e r i n g a n dcoalescence, forming asignificant part of whatmay be eventuallyemitted as PM2.5. Non-combustibles that arenot vaporised will formthe major part of the flyash particles to becollected by the dustcontrol system. Figure5 . 5 s h o w s w i t hsomewhat more detailthe influences oft e m p e r a t u r e a n dchanging particle sizeon the formation of ashparticles ranging from0.01 :m to more than100 :m.
During gasification adifferent picture is seenthat can be explainedwhen considering ther e d u c i n g g a sa t m o s p h e r e . T h ereduction of metaloxides to elementalmetal (with a muchlower boiling point) ismuch stronger, and re-oxidation and clusteringof the oxide particlesdoes not occur.

Zevenhoven & Kilpinen PARTICULATES 12.6.2001 5-8
Something similar is seen when the chlorine content of the fuel is high (i.e. > 0.1 %-wtdry). In that case the metal oxides are transformed to chlorides with a much lowerboiling point, followed by vaporisation. At lower temperatures these chlorides mayreact with water to metal oxides and HCl.
During fluidised bed combustion the fate of ash-forming material is very muchdifferent from what happens during pulverised fuel firing. Temperatures are muchlower and particles are larger, but mechanical stresses are stronger due to strongturbulence and many impacts between particles. Fines are produced due to attritionand abrasion but much ash-forming material remains in the bed. This is illustrated inFigure 5.6. For a circulating fluidised somewhat more fly ash is formed due to thehigher velocities and smaller fuel particle size.
Biomass fuels typicallyproduce ashes that contain5-10 %-wt potassium, 20%-wt or more calcium (ashfrom wood, though, maycontain 70 %-wtCaO+CaCO3) and notmuch more than 10%-wtsilica. The ash chemistry isin this case determined byspecies such as KOH,NaOH, KCl, NaCl, K2SO4,Na2SO4 and SiO2, asillustrated by Figure
5.7.The ashes and deposits formed may have first melting points lower than 600EC,giving sticky deposits and/or defluidisation when biomass is fired in a fluidised bed.Also with these fuels the volatility of the ash-forming elements is higher withgasification than during combustion.
For the inorganic particles that are produced by coal combustion Sarofim and Helble(1993) give a rough procedure for calculating ash particle size. The largest fraction liesin the size range 1 - 30 µm, and is formed by coalescence of included minerals asdescribed above. Assuming that one ash particle is formed per fuel particle, given thatthe average fuel particle size is df (m), the ash content is fa (kg/kg dry fuel) and thedensities of the fuel and ash particles are ρf and ρa (kg/m;), respectively, average flyash particle size is approximately da ~ (faρf/ρa)
1/3df. (For df = 50 µm, ρf/ρa = 0.5 and
Figure 5.7 Behaviour of ash-forming matter in biomassfuels (picture from Bryers, 1996)

Zevenhoven & Kilpinen PARTICULATES 12.6.2001 5-9
fa = 0.1 kg/kg, it is found that da ~ 18.4 µm). In addition submicron fume is formeddue to vaporisation and condensation of mineral constituents, typically up to 6% ofthe total ash stream that leaves the furnace with the flue gas (Sarofim and Helble,1993).
It is clear that a concept such as the Aash content@ of a fuel is not easily related to theformation of bottom ashes and fly ashes during combustion or gasification as apulverised fuel, or in a fluidised bed. Nevertheless, standard tests do exist, such asDIN and ASTM procedures (DIN, 1978), where a fuel is heated up in air under certainspecific conditions. For biomass fuels, maximum test temperatures are typically a fewhundred degrees lower than for coal in order to avoid loss of alkali by vaporisation.Typical values for ash contents obtained by these procedures are given in Table 5.1.
Table 5.1 Typical values for the ash content of fuels (dry %-wt)
Fossil fuels Biomasses & waste derived fuels
Coal, lignite 5 - 40 Wood 0.1 - 0.5
Bark 2 - 8
Oil < 0.1 Straw 4 - 8
Natural gas -
Light fuel oil < 0.01 Sewage sludge 15 - 20
Heavy fuel oil ~ 0.04 Car tyre scrap 5 - 8
Munical solid waste (MSW) 5 - 25
Refuse derived fuel (RDF) 10 - 25
Peat 4 - 10 Packaging derived fuel (PDF) 5 - 15
Auto shredder residue (ASR) ~ 25
Petroleum coke, Apetcoke@ ~1 Leather waste ~ 5
Estonian oil shale ~ 40
OrimulsionJ ~ 1.5 Black liquor solids 30 - 40
The composition of these ashes varies strongly between the fuels, although SiO2,Al2O3, Fe2O3 and CaO are usually the primary components. Ash from fuel oilscontains vanadium (V) and nickel (Ni), plus magnesium (Mg) which is added to the fuel as a corrosion inhibitor. Biomass ashes contain typically 5-10 % potassium (K) (Bryers, 1996). Ash from petcoke contains significant amounts of iron, vanadium andnickel (Anthony, 1995). Special ashes such as ash from leather waste combustion maycontain close to 90 %-wt Cr2O3 (Cabanillas et al., 1999).

Zevenhoven & Kilpinen PARTICULATES 12.6.2001 5-10
The content of ash-forming matter in a solid fuel may easily be of the order of 10-20%-wt (dry). The amounts of material that have to be handled for a typical power plantwill therefore be significant and require a transport system by road, rail or water. Thisis illustrated by some numbers from a US power plant in Table 5.2.
Table 5.2 Production of ashes from western US coal combustion in a 500MWelec pulverised coal power plant (taken from Carpenter, 1998)
Bituminous Wyoming PowderRiver Basin
Montana PowderRiver Basin
Coal ash content, %-wt 9.5 4.8 3.7
Bottom ash, ton/year 24560 17280 8600
Fly ash, ton/year 98260 69100 34390
Total ash, ton/year 122820 86380 42990
5.3 Particulate emission standards
For coal (and peat) combustion, SO2 emission standards for Finland (1997) and theEuropean Community (1988) are given in Tables 5.3 and 5.4.
Table 5.3 Particulate emission standards for Finland (1997)
Type of plant New /Existing
Plant size (MWth)
Emission standard(mg/m3
STP dry 6% O2)Comments
Combustion plantlignite, peat,wood, straw
New 1-5 540 Guideline
Combustion plantlignite, peat,wood, straw
New 5-50 (248-11*P)/3 Guideline, P=plant size in MWth
Utility, hard coal New 1-5 405 Guideline
Utility, hard coal New 5-50 172-2.1*P Guideline, P=plant size in MWth
Utility, hard coal New 50-300 50 Guideline
Utility, hard coal New > 300 30 Guideline
Utility, hard coal Existing all see comments Guideline for new plantused as target for
existing plants

Zevenhoven & Kilpinen PARTICULATES 12.6.2001 5-11
Table 5.4 Particulate emission standards for the European Community(1988)
Type of plant New /Existing
Plant size (MWth)
Emission standard(mg/m3
STP dry 6% O2)Comments
Combustion, coal New * 50-500 100
Combustion, coal New * > 500 50* construction licence after July 1 1988
The World Bank suggests a worldwide emission limit for all new coal-fired units of50 mg/m³STP (dry) @ 6 % O2, or, if that is impossible, 99.9% removal efficiency(Soud and Mitchell, 1997, McConville, 1997).
For waste firing, the particulate emission standard for Finland (as of 1.8.1994) is 10mg/m³STP (dry) @ 10 % O2 (Finland, 1994). This value is also the current daily-meanemission standard for the EU15 countries. For cement plants the Finnish emissionstandard as of 1.1.2001 is 50 mg/m³STP (dry) @ 10 % O2, the European Commissionhas proposed a future standard of 30 mg/m³STP (dry) @ 10 % O2.
5.4 Options for particulate emissions control
Selecting the most suitable device for the removal of particles from a gas streamdepends on many things, partly determined by the process i.e. gas stream, partlydetermined by the particles that are to be removed. A summary of the most importantfactors that are to be considered is given in Table 5.5. When high temperature, highpressure (HTHP) gas clean-up is required (L section 5.11) the range of possibleoptions is more narrow than when an atmospheric process is needed that operatesbelow 200EC. Another important factor is size: filters are available from very smallsizes (consider a sigarette filter) to large baghouse units with hundreds of separatefilter bags. Electrostatic precipitators (ESPs), on the other hand, cannot be operatedeconomically in flue gases of power units smaller than a few MWthermal.
Size and size distribution are the most important particle-related factors, followed bytheir physical and chemical properties: the particles should not destroy the controldevice, but they should not be “invisible” to the control device either. Low sulphurcoal, for example, can produce ashes that do not allow for sufficient electrostaticcharging, making these particles hard to handle by an ESP.

Zevenhoven & Kilpinen PARTICULATES 12.6.2001 5-12
Table 5.5 Process- and particle-dependent factors for selecting a particulatecontrol device
Process-dependent factors Particle-dependent factors
Gas flow volume Particle size and size distribution
Temperature Shape of the particles
Pressure Surface properties
Composition of the gas Chemical stability
Concentration of particles in the gas Mechanical strength etc., physicalproperties
Chemical composition: carbon, alkali, tar,sulphur content
(First) melting point, softening point
All this has to be related to the final objective, which is reducing the particleconcentration to a certain level, with additional specifications for the outlet particlesize distribution. For coal combustion by different methods the typical uncontrolledemissions and the required control efficiencies for obtaining a certain maximumoutlet concentration are given in Table 5.6. Cyclone firing gives relatively low fly ashemissions, with a relative small size, though, while stoker (i.e. grate) firing givessomewhat higher emissions, at a relatively wide particle size distribution. The highestemissions are generated by pulverised coal units. Altogether, for a typical emissionstandard of 50 mg/m³STP the efficiency of the control system has to be of the order95 - 99%.
Table 5.6 Particulate control efficiencies required for a certain controlledemission (in %) for various coal-fired boilers (taken from Klingsporand Vernon, 1988)
Finally, it is noted that different devices operate in different particle size ranges. Thisis a result of the physics that lies behind the method by which the particles aremanipulated and eventually removed from the gas stream. As illustrated by Figure 5.8,these can be separated in processes where an external force is applied to the particle
Zevenhoven & Kilpinen PARTICULATES 12.6.2001 5-13
1. Methods basedon external forces
Decreasingparticle
size
Gravity settlers
Cyclones& centrifuges
Electrostaticprecipitators
2. Methods basedon barriers
Bag filtersCeramic barrier filters
Granular bed filters
Wet scrubbers
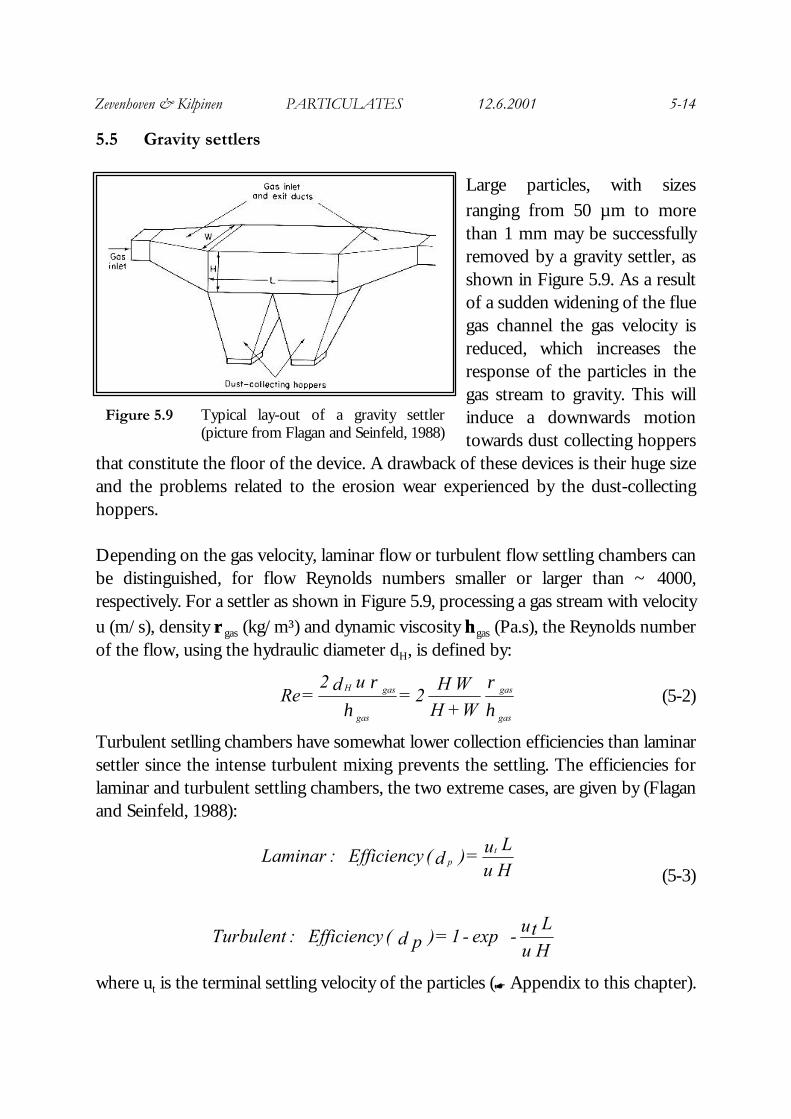
Figure 5.8 General classification of particulate controldevices
Table 5.7 Collection efficiencies (in %) ofseveral particulate control devices(table from Soud, 1995)
and processes where the gas stream is forced through a barrier that cannot be passedby the dispersed particles, in the form of holes smaller than the particles, or a dropletcloud.
For a few types of particulatecontrol device the removalefficiencies are given for fourparticle size ranges in Table5.7. For larger particles (> 10µm) gravity and centrifugalforces can be effective, forfine particles (< 2 µm) anelectrostatic force can beapplied, in combination withparticle charging. Venturiscrubbers operate down to afew micrometer, whilst filtersoffer very high efficienciesover wide size ranges. Thiscomparison already showsthe large potential of filtersystems: they give highremoval efficiencies overwide size ranges and they aremore flexible than othermethod when consideringthe properties of the
particles and the process conditions. A drawback is that relatively low gas velocitiesmust be used, which directly translates to large filtration surface and inherently highcosts.
In the remainder of this chapter the various methods are discussed, based on Figure5.8. High temperature/high pressure methods (HTHP) receive special attention.
Zevenhoven & Kilpinen PARTICULATES 12.6.2001 5-14
5.5 Gravity settlers
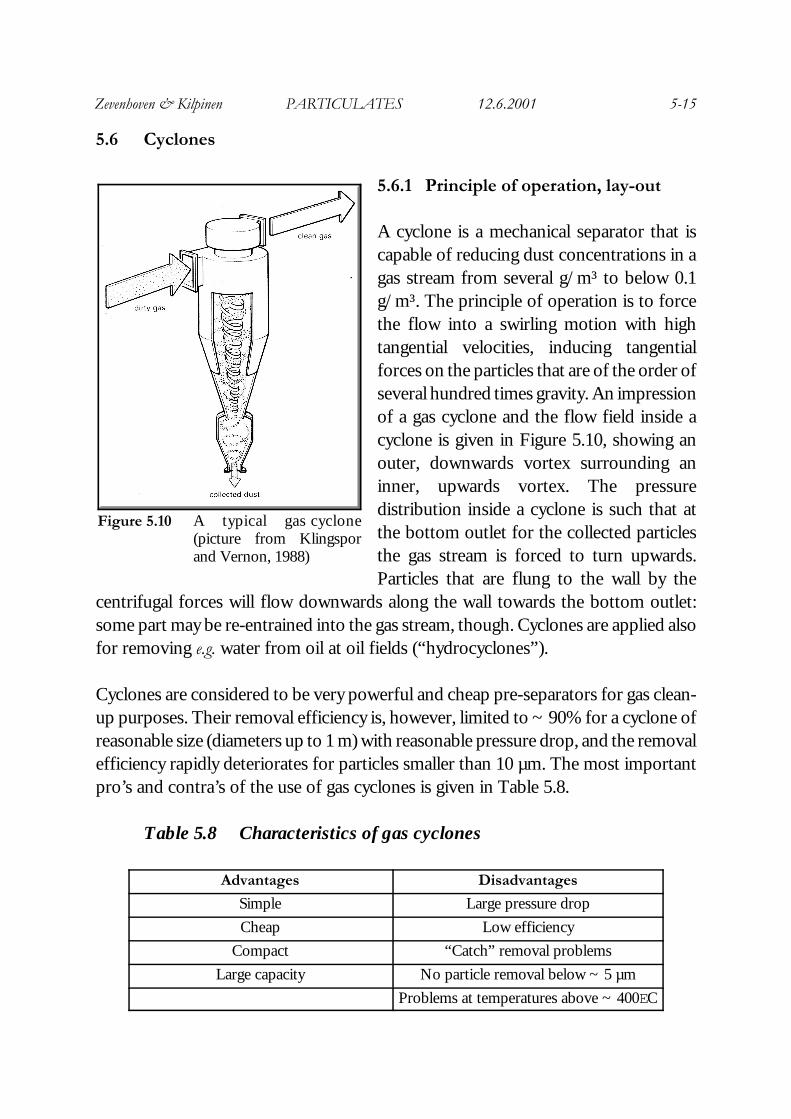
Large particles, with sizesranging from 50 µm to morethan 1 mm may be successfullyremoved by a gravity settler, asshown in Figure 5.9. As a resultof a sudden widening of the fluegas channel the gas velocity isreduced, which increases theresponse of the particles in thegas stream to gravity. This willinduce a downwards motiontowards dust collecting hoppers
that constitute the floor of the device. A drawback of these devices is their huge sizeand the problems related to the erosion wear experienced by the dust-collectinghoppers.
Depending on the gas velocity, laminar flow or turbulent flow settling chambers canbe distinguished, for flow Reynolds numbers smaller or larger than ~ 4000,respectively. For a settler as shown in Figure 5.9, processing a gas stream with velocityu (m/s), density ρρgas (kg/m³) and dynamic viscosity ηηgas (Pa.s), the Reynolds numberof the flow, using the hydraulic diameter dH, is defined by:
(5-2)
Turbulent setlling chambers have somewhat lower collection efficiencies than laminarsettler since the intense turbulent mixing prevents the settling. The efficiencies forlaminar and turbulent settling chambers, the two extreme cases, are given by (Flaganand Seinfeld, 1988):
(5-3)
where ut is the terminal settling velocity of the particles (Z Appendix to this chapter).
Figure 5.9 Typical lay-out of a gravity settler(picture from Flagan and Seinfeld, 1988)
ηρ
ηρ
gas
gas
gas
gasH W + H
W H 2 =
u d 2 = Re
Hu
L ut - exp - 1 = ) d p ( Efficiency : Turbulent
Hu L u = ) d( Efficiency : Laminar t
p
Zevenhoven & Kilpinen PARTICULATES 12.6.2001 5-15
Figure 5.10 A typical gas cyclone(picture from Klingsporand Vernon, 1988)
5.6 Cyclones
5.6.1 Principle of operation, lay-out
A cyclone is a mechanical separator that iscapable of reducing dust concentrations in agas stream from several g/m³ to below 0.1g/m³. The principle of operation is to forcethe flow into a swirling motion with hightangential velocities, inducing tangentialforces on the particles that are of the order ofseveral hundred times gravity. An impressionof a gas cyclone and the flow field inside acyclone is given in Figure 5.10, showing anouter, downwards vortex surrounding aninner, upwards vortex. The pressuredistribution inside a cyclone is such that atthe bottom outlet for the collected particlesthe gas stream is forced to turn upwards.Particles that are flung to the wall by the
centrifugal forces will flow downwards along the wall towards the bottom outlet:some part may be re-entrained into the gas stream, though. Cyclones are applied alsofor removing e.g. water from oil at oil fields (“hydrocyclones”).
Cyclones are considered to be very powerful and cheap pre-separators for gas clean-up purposes. Their removal efficiency is, however, limited to ~ 90% for a cyclone ofreasonable size (diameters up to 1 m) with reasonable pressure drop, and the removalefficiency rapidly deteriorates for particles smaller than 10 µm. The most importantpro’s and contra’s of the use of gas cyclones is given in Table 5.8.
Table 5.8 Characteristics of gas cyclones
Advantages Disadvantages
Simple Large pressure drop
Cheap Low efficiency
Compact “Catch” removal problems
Large capacity No particle removal below ~ 5 µm
Problems at temperatures above ~ 400EC
Zevenhoven & Kilpinen PARTICULATES 12.6.2001 5-16
Lb
Lc
De
Dd
W
H
D
S
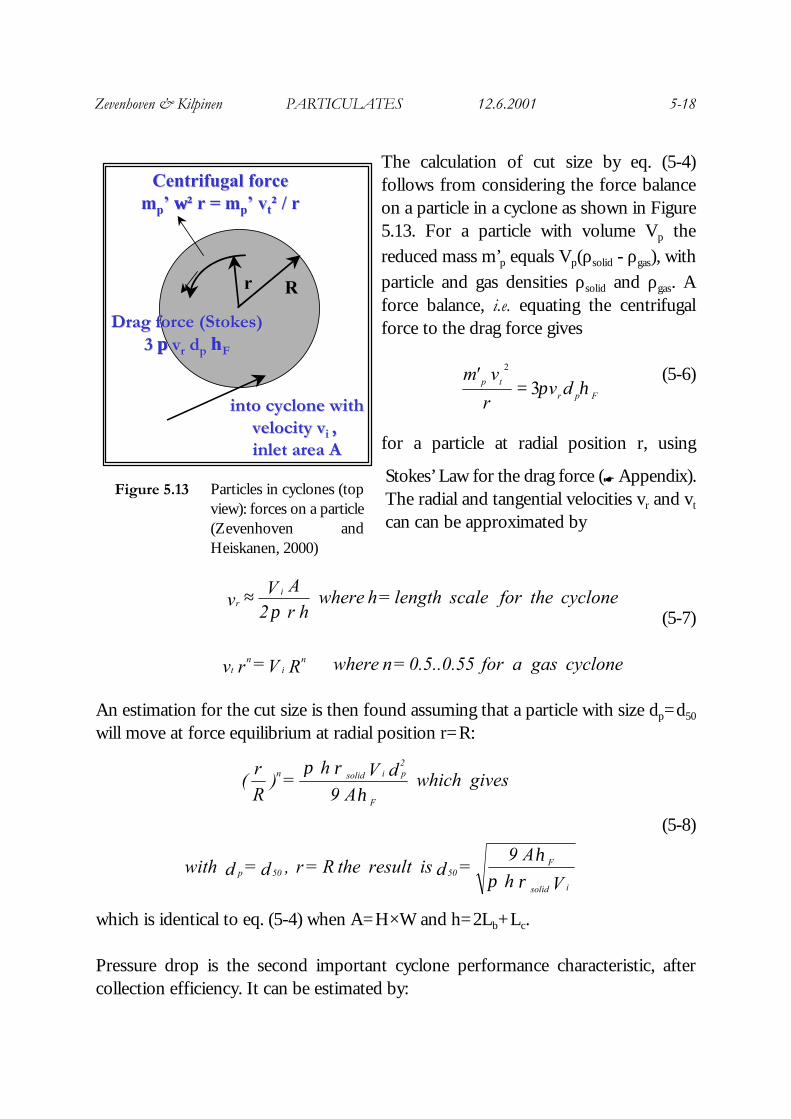
Figure 5.12 Lapple cyclone design lengths(after Cooperand Alley, 1994)
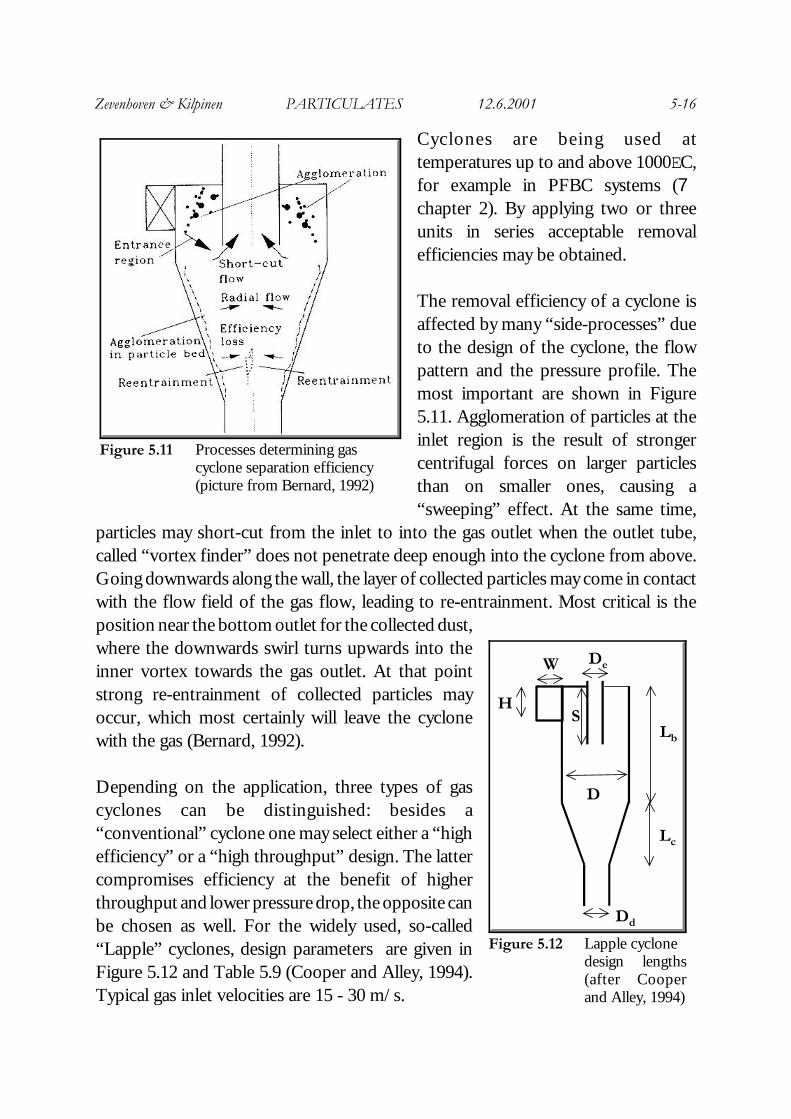
Figure 5.11 Processes determining gascyclone separation efficiency(picture from Bernard, 1992)
Cyclones are being used attemperatures up to and above 1000EC,for example in PFBC systems (7chapter 2). By applying two or threeunits in series acceptable removalefficiencies may be obtained.
The removal efficiency of a cyclone isaffected by many “side-processes” dueto the design of the cyclone, the flowpattern and the pressure profile. Themost important are shown in Figure5.11. Agglomeration of particles at theinlet region is the result of strongercentrifugal forces on larger particlesthan on smaller ones, causing a“sweeping” effect. At the same time,
particles may short-cut from the inlet to into the gas outlet when the outlet tube,called “vortex finder” does not penetrate deep enough into the cyclone from above.Going downwards along the wall, the layer of collected particles may come in contactwith the flow field of the gas flow, leading to re-entrainment. Most critical is theposition near the bottom outlet for the collected dust,where the downwards swirl turns upwards into theinner vortex towards the gas outlet. At that pointstrong re-entrainment of collected particles mayoccur, which most certainly will leave the cyclonewith the gas (Bernard, 1992).
Depending on the application, three types of gascyclones can be distinguished: besides a“conventional” cyclone one may select either a “highefficiency” or a “high throughput” design. The lattercompromises efficiency at the benefit of higherthroughput and lower pressure drop, the opposite canbe chosen as well. For the widely used, so-called“Lapple” cyclones, design parameters are given inFigure 5.12 and Table 5.9 (Cooper and Alley, 1994).Typical gas inlet velocities are 15 - 30 m/s.

Zevenhoven & Kilpinen PARTICULATES 12.6.2001 5-17
Table 5.9 Design parameters for a Lapple cyclone (see Figure 5.12)
5.6.2 Removal efficiency, pressure drop
The efficiency of a cyclone can be described (as for any particulate control devicediscussed in this chapter) by a so-called “grade efficiency curve”, which gives theremoval efficiency as function of particle size. An important number is the so-called“cut-size”, d50, which is the particle size for which the removal efficiency is 50%. Forparticles larger than the cut size more than 50% is removed, for particles smaller thanthe cut size removal efficiency is less than 50%. For cyclones such as the Lapplecyclones the “cut size” can be calculated as:
(5-4)
where W is the width of the gas inlet (m), Vi the inlet gas velocity (m/s), ρsolid and ρgas
the densities of solid particles and gas, respectively, (kg/m;), ηgas is the dynamicviscosity of the gas (Pa.s) and N is the number of rotations (#) the gas flow makesbefore turning upwards to the vortex finder. For a Lapple cyclone, N is apparentlydefined given by the dimensions of the cyclone (see Figure 5.12).
The “grade efficiency” of the cyclone can be described as a relation between particlesize, dp , and cut size d50:
(5-5)
High Conventional Highefficiency throughput
Height of inletH/D 0.5 ~0.44 0.5 0.75 ~ 0.8
Width of inletW/D 0.2 ~ 0.21 0.25 0.375 ~ 0.35
Diameter of gas exitDe/D 0.4 ~0.5 0.5 0.75
Length of vortex finderS/D 0.5 0.625 ~ 0.6 0.875 ~0.85
Length of bodyLb/D 1.5 ~1.4 2.0 ~1.75 1.5 ~1.7
Length of coneLc/D 2.5 2 2.5 ~2.0
Diameter of dust outletDd/D 0.375 ~ 0.4 0.25 ~ 0.4 0.375 ~ 0.4
HL ½ + L = N with
) - ( V 2
W 9 = d
cb
gassolidi
gas50
ρρπη
) dd ( + 1
1 = ) d ( Eff
2
p
50p
Zevenhoven & Kilpinen PARTICULATES 12.6.2001 5-18
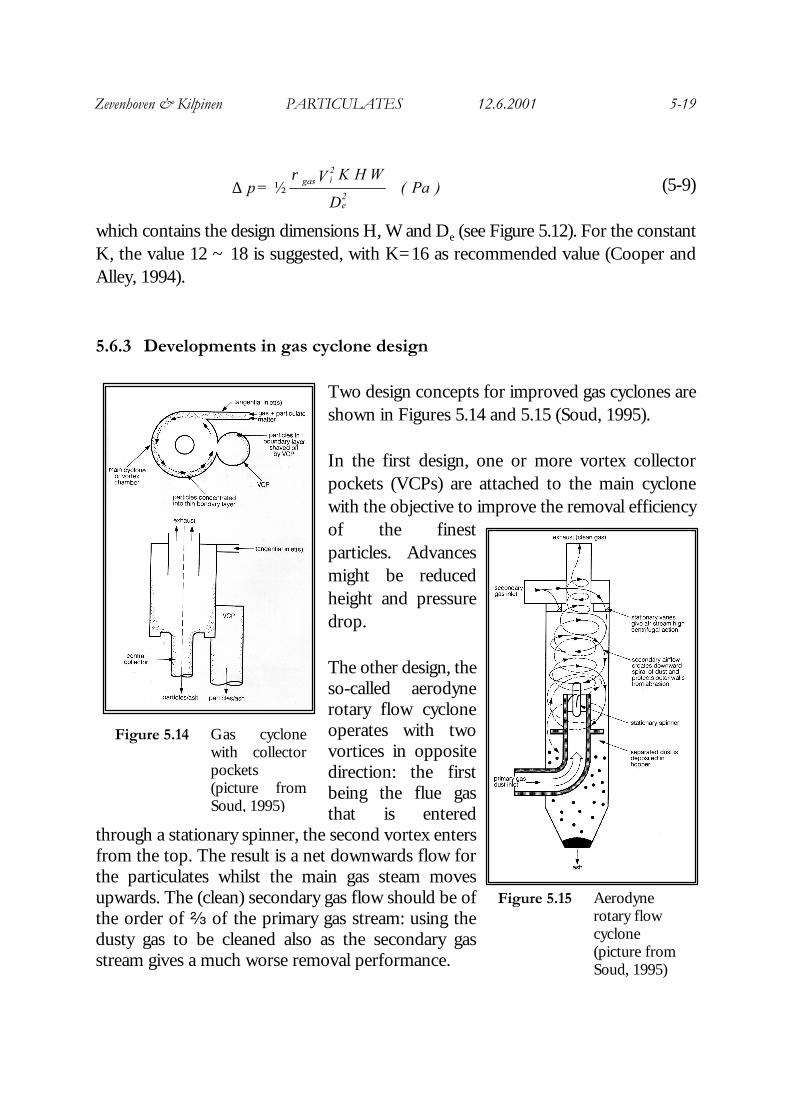
The calculation of cut size by eq. (5-4)follows from considering the force balanceon a particle in a cyclone as shown in Figure5.13. For a particle with volume Vp thereduced mass m’p equals Vp(ρsolid - ρgas), withparticle and gas densities ρsolid and ρgas. Aforce balance, i.e. equating the centrifugalforce to the drag force gives
(5-6)
for a particle at radial position r, using
Stokes’ Law for the drag force (Z Appendix).The radial and tangential velocities vr and vt
can can be approximated by
(5-7)
An estimation for the cut size is then found assuming that a particle with size dp=d50
will move at force equilibrium at radial position r=R:
(5-8)
which is identical to eq. (5-4) when A=H×W and h=2Lb+Lc.
Pressure drop is the second important cyclone performance characteristic, aftercollection efficiency. It can be estimated by:
Centrifugal forceCentrifugal forcemmpp’ ’ ωωωω²² r = r = mmpp’’ vvtt²² / r/ r
r
Drag force (Stokes)Drag force (Stokes)3 3 ππππ vvrr d dpp ηηηηFF
into cyclone withinto cyclone withvelocity vvelocity vi i , , inlet area Ainlet area A
R
Fpr
tp dvr
v'mηπ3
2
=
Figure 5.13 Particles in cyclones (topview): forces on a particle(Zevenhoven andHeiskanen, 2000)
cyclone gas a for 0.5..0.55 = n e wherR V = r v
cyclone the for scalelength = h whereh r 2
A V v
ni
nt
ir π≈
V h
A 9 = d is result the R = r ,d = d with
gives which A 9
d V h = )
Rr
(
isolid
F5050p
F
2pisolidn
ρπη
ηρπ
Zevenhoven & Kilpinen PARTICULATES 12.6.2001 5-19
(5-9)
which contains the design dimensions H, W and De (see Figure 5.12). For the constantK, the value 12 ~ 18 is suggested, with K=16 as recommended value (Cooper andAlley, 1994).
5.6.3 Developments in gas cyclone design
Two design concepts for improved gas cyclones areshown in Figures 5.14 and 5.15 (Soud, 1995).
In the first design, one or more vortex collectorpockets (VCPs) are attached to the main cyclonewith the objective to improve the removal efficiencyof the finestparticles. Advancesmight be reducedheight and pressuredrop.
The other design, theso-called aerodynerotary flow cycloneoperates with twovortices in oppositedirection: the firstbeing the flue gasthat is entered
through a stationary spinner, the second vortex entersfrom the top. The result is a net downwards flow forthe particulates whilst the main gas steam movesupwards. The (clean) secondary gas flow should be ofthe order of b of the primary gas stream: using thedusty gas to be cleaned also as the secondary gasstream gives a much worse removal performance.
) Pa ( D
W H K V = p
2e
2igasρ
½∆
Figure 5.14 Gas cyclonewith collectorpockets(picture fromSoud, 1995)
Figure 5.15 Aerodynerotary flowcyclone(picture fromSoud, 1995)
Zevenhoven & Kilpinen PARTICULATES 12.6.2001 5-20
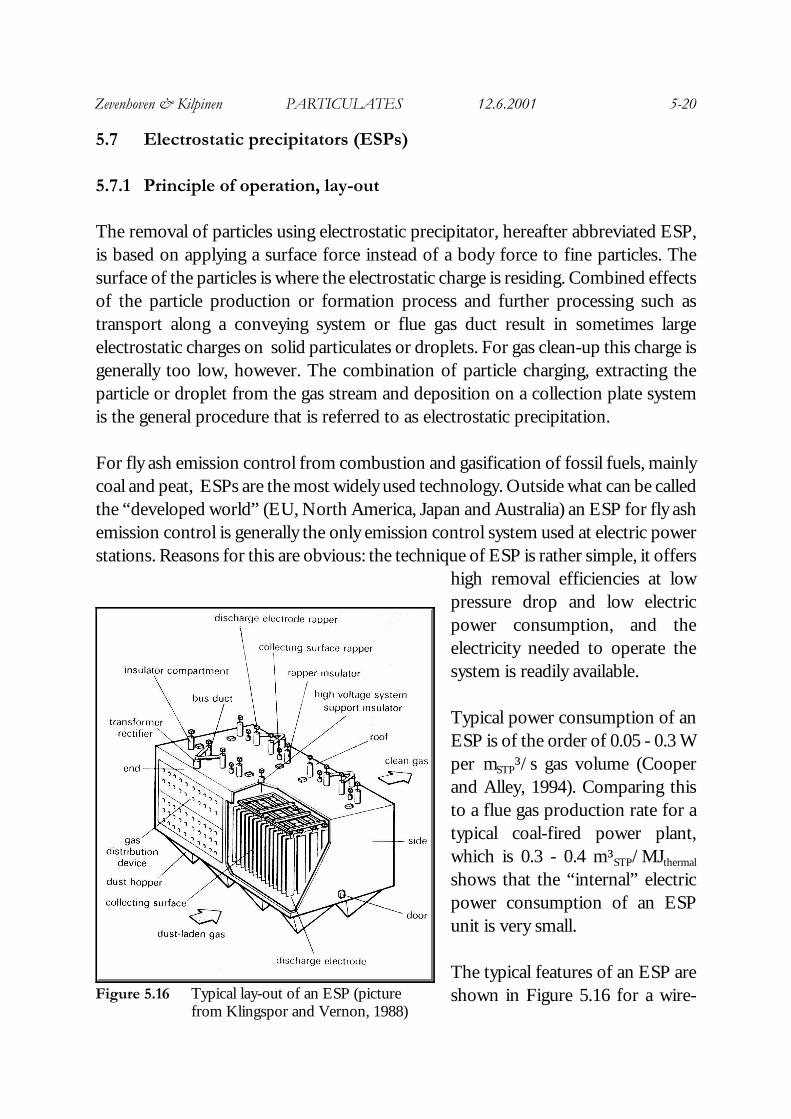
Figure 5.16 Typical lay-out of an ESP (picturefrom Klingspor and Vernon, 1988)
5.7 Electrostatic precipitators (ESPs)
5.7.1 Principle of operation, lay-out
The removal of particles using electrostatic precipitator, hereafter abbreviated ESP,is based on applying a surface force instead of a body force to fine particles. Thesurface of the particles is where the electrostatic charge is residing. Combined effectsof the particle production or formation process and further processing such astransport along a conveying system or flue gas duct result in sometimes largeelectrostatic charges on solid particulates or droplets. For gas clean-up this charge isgenerally too low, however. The combination of particle charging, extracting theparticle or droplet from the gas stream and deposition on a collection plate systemis the general procedure that is referred to as electrostatic precipitation.
For fly ash emission control from combustion and gasification of fossil fuels, mainlycoal and peat, ESPs are the most widely used technology. Outside what can be calledthe “developed world” (EU, North America, Japan and Australia) an ESP for fly ashemission control is generally the only emission control system used at electric powerstations. Reasons for this are obvious: the technique of ESP is rather simple, it offers
high removal efficiencies at lowpressure drop and low electricpower consumption, and theelectricity needed to operate thesystem is readily available.
Typical power consumption of anESP is of the order of 0.05 - 0.3 Wper mSTP³/s gas volume (Cooperand Alley, 1994). Comparing thisto a flue gas production rate for atypical coal-fired power plant,which is 0.3 - 0.4 m³STP/MJthermal
shows that the “internal” electricpower consumption of an ESPunit is very small.
The typical features of an ESP areshown in Figure 5.16 for a wire-
Zevenhoven & Kilpinen PARTICULATES 12.6.2001 5-21
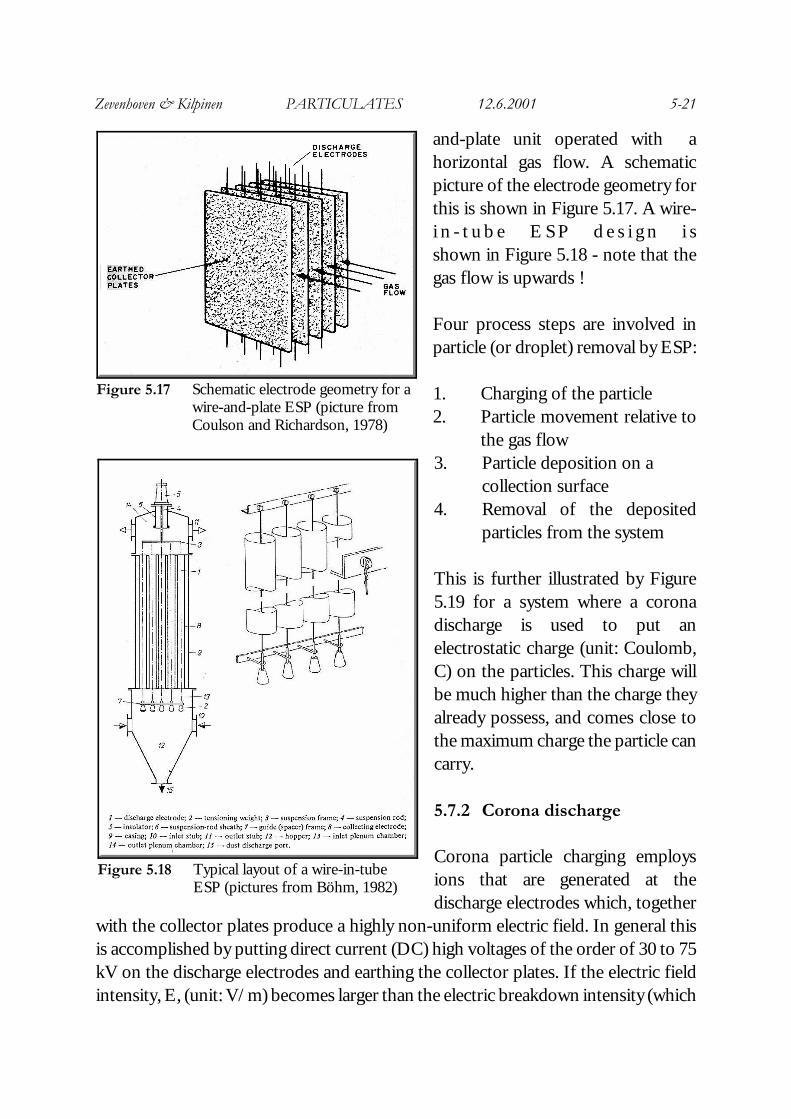
Figure 5.17 Schematic electrode geometry for awire-and-plate ESP (picture fromCoulson and Richardson, 1978)
Figure 5.18 Typical layout of a wire-in-tubeESP (pictures from Böhm, 1982)
and-plate unit operated with ahorizontal gas flow. A schematicpicture of the electrode geometry forthis is shown in Figure 5.17. A wire-i n - t u b e E S P d e s i g n i sshown in Figure 5.18 - note that thegas flow is upwards !
Four process steps are involved inparticle (or droplet) removal by ESP:
1. Charging of the particle2. Particle movement relative to
the gas flow3. Particle deposition on a
collection surface4. Removal of the deposited
particles from the system
This is further illustrated by Figure5.19 for a system where a coronadischarge is used to put anelectrostatic charge (unit: Coulomb,C) on the particles. This charge willbe much higher than the charge theyalready possess, and comes close tothe maximum charge the particle cancarry.
5.7.2 Corona discharge
Corona particle charging employsions that are generated at thedischarge electrodes which, together
with the collector plates produce a highly non-uniform electric field. In general thisis accomplished by putting direct current (DC) high voltages of the order of 30 to 75kV on the discharge electrodes and earthing the collector plates. If the electric fieldintensity, E, (unit: V/m) becomes larger than the electric breakdown intensity (which

Zevenhoven & Kilpinen PARTICULATES 12.6.2001 5-22
is ~30 kV/cm for ambient air), ionssuch as N2
+ and O2+and electrons,
e-, are produced at the electrode.When operating at negativepotential the electrons will traveltowards the other electrode, whilstthe positive ions will move to andcollide with the electrode andbecome neutralised. Under positivecorona operation the positive ionswill move across the space betweenthe electrodes after the dischargeelectrode has taken up the
electrons. More detail on electric breakdown and corona discharge processes is givenelsewhere (Böhm, 1982, Kuffel and Zaengl, 1984).
5.7.3 The electric field
The electric field strength (or intensity) E is defined by the electrode geometry and thevoltage difference ∆φ (unit: Volt, V) that is applied between them:
(5-10)
In ESPs the electric field is basically 2-dimensional, without significant electric fieldsin the gas flow direction. For practical reasons, the electric field strength is related tothe distance, x (m) from the centre of the discharge electrode and a “configurationfactor for the electrode geometry”, F (-), resulting in a one-dimensional description ofthe electric field:
(5-11)
For a wire and plate geometry asshown in Figures 5.16 an 5.17, thevalues for F are calculated as shownin Figure 5.20 for one wire betweenplates (b), for multiple wiresbetween plates (c) and for a
Figure 5.19 Particle charging and collection inESP (picture from Soud, 1995)
s)coordinate Cartesian (in )z / y, / x, / ( = with - = E ∂∂∂∂∂∂∇∇φ
x F
= ) x ( Eφ∆
Figure 5.20 Electrode system configurationfactors, F. δ = d/r, d = distancebetween wires, r = wire radius(picture from Böhm, 1982)
Zevenhoven & Kilpinen PARTICULATES 12.6.2001 5-23
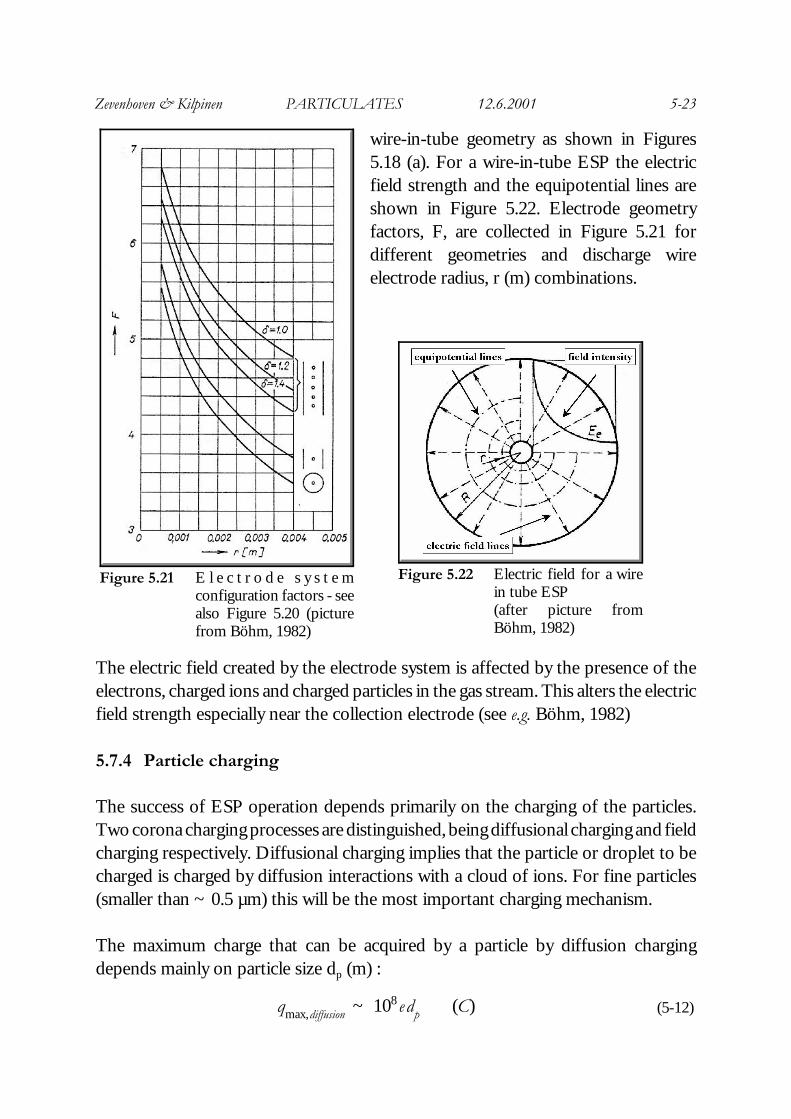
Figure 5.21 E l e c t r o d e s y s t e mconfiguration factors - seealso Figure 5.20 (picturefrom Böhm, 1982)
Figure 5.22 Electric field for a wirein tube ESP (after picture fromBöhm, 1982)
qmax,diffusion ~ 108 edp (C) (5-12)
wire-in-tube geometry as shown in Figures5.18 (a). For a wire-in-tube ESP the electricfield strength and the equipotential lines areshown in Figure 5.22. Electrode geometryfactors, F, are collected in Figure 5.21 fordifferent geometries and discharge wireelectrode radius, r (m) combinations.
The electric field created by the electrode system is affected by the presence of theelectrons, charged ions and charged particles in the gas stream. This alters the electricfield strength especially near the collection electrode (see e.g. Böhm, 1982)
5.7.4 Particle charging
The success of ESP operation depends primarily on the charging of the particles.Two corona charging processes are distinguished, being diffusional charging and fieldcharging respectively. Diffusional charging implies that the particle or droplet to becharged is charged by diffusion interactions with a cloud of ions. For fine particles(smaller than ~ 0.5 µm) this will be the most important charging mechanism.
The maximum charge that can be acquired by a particle by diffusion chargingdepends mainly on particle size dp (m) :

Zevenhoven & Kilpinen PARTICULATES 12.6.2001 5-24
where e is the unit charge, i.e. the charge of an electron: e = 1.6H10-19 C.
Larger particles cannot be charged to a sufficiently high level by diffusion chargingalone and are charged by the field charging mechanism. As a result of the electric fieldin the ESP the motion of the ions and electrons is ordered along the direction of the electric field. This leads to high rates of collisions between ions or electrons and theparticles, resulting in high charge levels. The maximum particle charge depends on theproperties of the particle, its size, dp, and the intensity of the external electric field, E0:
(5-13)
Here, ε0 is the dielectric constant of vacuum (ε0 = 8.854H10-12 C/Vm) and εr (-) is therelative dielectric constant of the particulate matter or droplet (relative to vacuum) thatis charged. (The dielectric constant ε = ε0 εr determines whether or not the field linesof the electric field can go through the particle (εr ~1) or are deflected around theparticle (εr 6 4), and is related to the optical refractive index). The definition ofmaximum charge eq. (5-13) shows that a particle with a high εr can be charged to threetimes the level of a particle with low εr.
The charge that a particle or droplet eventually acquires depends on three additionalfactors, being time, the concentration of ions in the charging zone N0 (#/m;) and theelectric mobility of these ions, Zi (m/s) /(V/m)), which determines the velocity of theions, vi (m/s) in response to the electric field E0. Typical values for E0 in the chargingzone are 106 V/m. A theoretical description of the field charging process was given byPauthenier and Moreau-Hanot (1932), see also Böhm (1982), or Zevenhoven (1999).
A comparison betweenparticle chargingaccording to thediffusion mechanismand the field chargingmechanism for low andhigh values for εr and E0
is given in Figure (5.23)for particle size 0.01 - 10µm, at 300 K.
(C) 2 +
3 d E 4 = q
r
r2p00field ,maxε
εεπ
Figure 5.23 Field charging and diffusion charging of particles(picture from Zevenhoven, 1992)

Zevenhoven & Kilpinen PARTICULATES 12.6.2001 5-25
Figure 5.23 shows that for particles smaller than 0.2 µm diffusion charging is the mostimportant mechanism, for particles larger than 2 µm field charging dominates.
Corona charging with ions of one polarity (+ or -) that travel in one direction may bethe most important charging method, but alternative techniques are being used as well.Charging by impaction with other surfaces, refered to as contact charging or tribo-charging is also possible. Other methods use bi-polar ions (+ and -), and/or ions orelectrons that travel through the charging space in alternating directions. A widelyused method is the pulsed corona technique, which implies that the voltage at thecharging electrode is increased to values that could cause spark-over, during a shortpulse time that is too short for actual spark-over to occur though (CIEMAT, 1998,Scott, 1997).
5.7.5 Electrical drift velocity of charged particles
The result of the charging efforts is that the particle or droplet is accelerated in thedirection of the electric field, i.e. will get a drift velocity in a direction other than thatof the gas flow. Typically the electric fields are of the order 10 kV/m, which is one ortwo orders of magnitude lower than in the field charging zone. The electrical driftvelocity, ve, (m/s) of the particles can be evaluated by equating the electrostatic forceon a particle with charge qp to the viscous drag force, which can be estimated byStokes’ Law, if necessary with a Cunningham correction factor for very fine particles(Z Appendix):
(5-14)
Combining this with the maximum charge the particles can acquire by the diffusioncharging and field charging mechanisms, eqs. (5-12) and (5-13) gives the followingestimates for the electrical mobility:
(5-15)
where E0 and E are the electric field strength in the corona discharge zone and in thecharging zone, respectively.
ηπ gaspep d v 3 = E q
) m/s ( 1 ... 0.1~ ) 2 + (
d E E~ v : charging field ,particle large
) m/s ( 0.01~ 3
E e 10~ v : charging diffusion ,particles fine
rgas
rp00e
gas
8
e
εηεε
ηπ

Zevenhoven & Kilpinen PARTICULATES 12.6.2001 5-26
x
cx
cx+ ∆x
ugas
D
∆x ve
L
H
Figure 5.24 ESP geometry used forefficiency analysis(Zevenhoven andHeiskanen, 2000)
½ugas HLD (cat x - cat x%ªx ) = ve HLªx ½(cat x + cat x%ªx )
Taylor series , small ªx6dx : ½ugas Ddcdx
= ve c
integrate from c = cin at x= 0 : c (x ) = cinexp(&2 ve x
ugas D)
(5-16)
Efficiency 'cin - cout
cin
= 1- exp - (ve A
Qgas
)
with Matts -Öhnfeldt correction :
Efficiency ' 1- exp - (ve A
Qgas
)k k = 0.4 ... 0.6
(5-17)
5.7.6 Removal efficiency, Deutsch equation
The removal efficiency of an ESP is directlyrelated to the electrical drift velocity of theparticle. Based on the geometry given inFigure 5.24 an efficiency can be derived,following the approach by Deutsch from1922 for an ESP with plate height H (m),plate distance D (m), depth L (m), gasvelocity ugas (m/s). The electrical drift velocityof the particle is ve (m/s), particleconcentration is referred to as c (kg/m³).
A mass balance for a small section withthickness ªx gives in-out=removed, gives:
Integrating this over the height H, from gas inlet to gas outlet, noting that the flowthrough the section is Q (m³/s) = ugas×D×L, noting that the collector surface (2sides!) is equal to A (m²) = 2×H×L, gives the famous Deutsch equation for particleremoval efficiency:
The correction factor by Matts-Öhnfeldt was presented in the 1970s, based on

Zevenhoven & Kilpinen PARTICULATES 12.6.2001 5-27
Figure 5.25 A typical grade efficiency curve for anESP (picture from Soud, 1995)
Figure 5.26 Influence of temperature and coal sulphurcontent on fly ash resistivity (pictures fromCooper and Alley, 1994) Note: 200EF ~ 95EC,300EF ~ 150EC, 450EF ~ 220EC
particle size distribution andother dust-related properties,and allows for a betterdescription of ESP performance(Klingspor and Vernon, 1988).Typically, k=0.5.
A general grade efficiency curvefor an ESP is shown in Figure5.25.
5.7.7 Effects of particle and gas properties, and temperature
It was already mentioned above that the properties of the particles or droplets to beremoved, besides their size, have an effect on the particle charging behaviour andhence the removal from a gas stream by an ESP. This is made more complicated byinteractions between the particle or droplet and the gas, plus the effect oftemperature. Some implications this has are illustrated by Figure 5.26, which gives theeffect of temperature and coal sulphur content on coal fly ash resistivity.
The temperature curves shown in Figure 5.26 (right) are the result of increasingsurface resistivity combined with decreasing volume resistivity with increasingtemperature. Depending on the chemical composition of the fly particles considered
here this gives a maximumresistivity at between 140and 170EC. From an ESPpoint of view, theresistivity of the particlesis preferably in the range105 - 1010 ohm.cm. Whenthe resistivity is very high(> 1011 ohm.cm) it will bedifficult to charge theparticles and back-coronaproblems may arise, i.e. aspark from the collectionplate to the discharge
Zevenhoven & Kilpinen PARTICULATES 12.6.2001 5-28
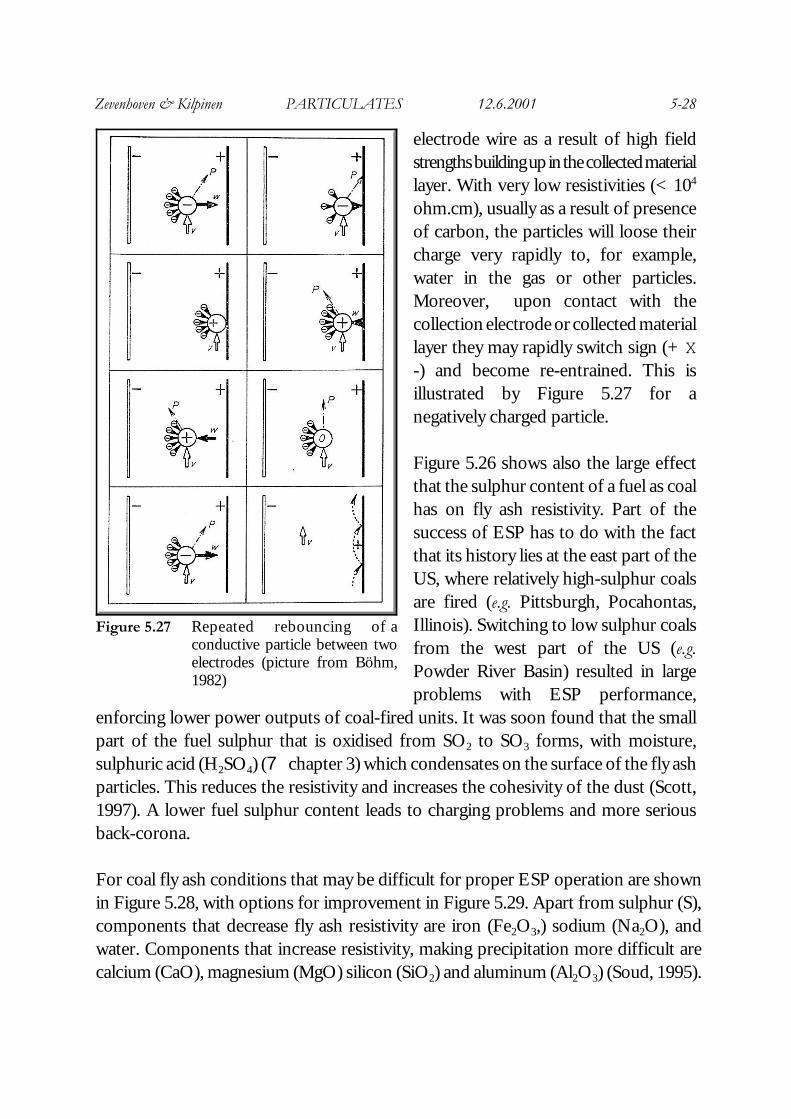
Figure 5.27 Repeated rebouncing of aconductive particle between twoelectrodes (picture from Böhm,1982)
electrode wire as a result of high fieldstrengths building up in the collected materiallayer. With very low resistivities (< 104
ohm.cm), usually as a result of presenceof carbon, the particles will loose theircharge very rapidly to, for example,water in the gas or other particles.Moreover, upon contact with thecollection electrode or collected materiallayer they may rapidly switch sign (+ X-) and become re-entrained. This isillustrated by Figure 5.27 for anegatively charged particle.
Figure 5.26 shows also the large effectthat the sulphur content of a fuel as coalhas on fly ash resistivity. Part of thesuccess of ESP has to do with the factthat its history lies at the east part of theUS, where relatively high-sulphur coalsare fired (e.g. Pittsburgh, Pocahontas,Illinois). Switching to low sulphur coalsfrom the west part of the US (e.g.Powder River Basin) resulted in largeproblems with ESP performance,
enforcing lower power outputs of coal-fired units. It was soon found that the smallpart of the fuel sulphur that is oxidised from SO2 to SO3 forms, with moisture,sulphuric acid (H2SO4) (7 chapter 3) which condensates on the surface of the fly ashparticles. This reduces the resistivity and increases the cohesivity of the dust (Scott,1997). A lower fuel sulphur content leads to charging problems and more seriousback-corona.
For coal fly ash conditions that may be difficult for proper ESP operation are shownin Figure 5.28, with options for improvement in Figure 5.29. Apart from sulphur (S),components that decrease fly ash resistivity are iron (Fe2O3,) sodium (Na2O), andwater. Components that increase resistivity, making precipitation more difficult arecalcium (CaO), magnesium (MgO) silicon (SiO2) and aluminum (Al2O3) (Soud, 1995).
Zevenhoven & Kilpinen PARTICULATES 12.6.2001 5-29
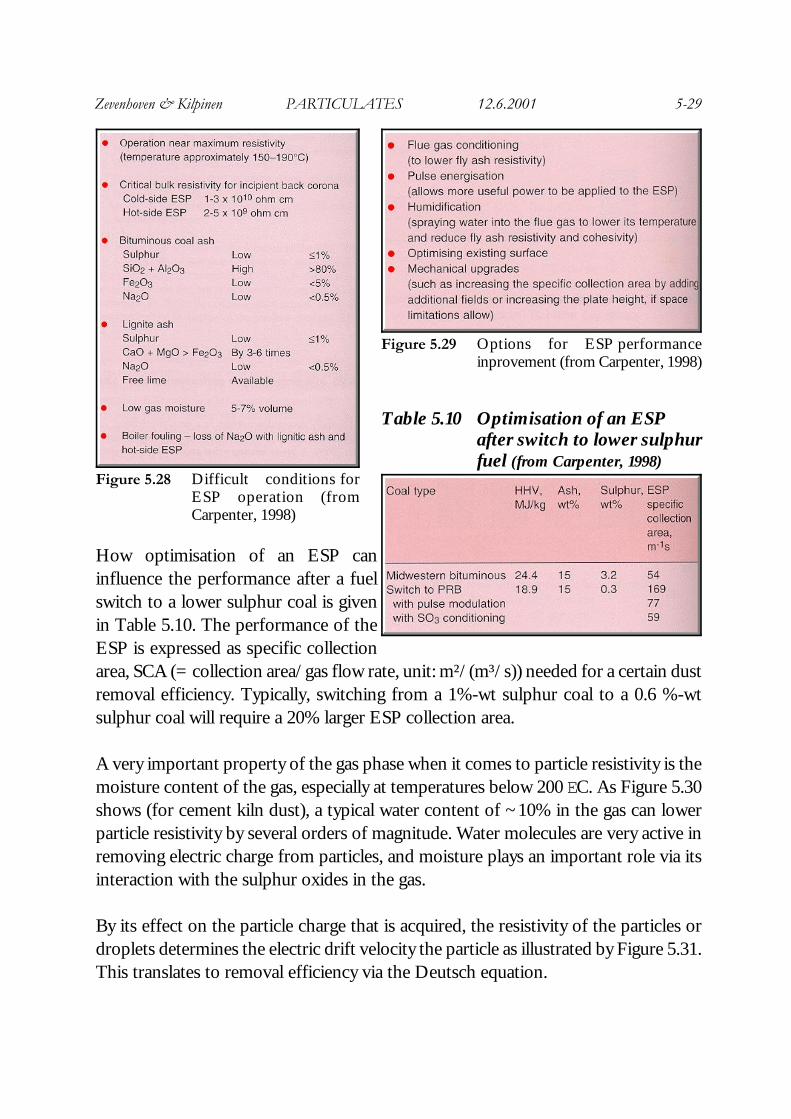
Figure 5.28 Difficult conditions forESP operation (fromCarpenter, 1998)
Figure 5.29 Options for ESP performanceinprovement (from Carpenter, 1998)
Table 5.10 Optimisation of an ESPafter switch to lower sulphurfuel (from Carpenter, 1998)
How optimisation of an ESP caninfluence the performance after a fuelswitch to a lower sulphur coal is givenin Table 5.10. The performance of theESP is expressed as specific collectionarea, SCA (= collection area/gas flow rate, unit: m²/(m³/s)) needed for a certain dustremoval efficiency. Typically, switching from a 1%-wt sulphur coal to a 0.6 %-wtsulphur coal will require a 20% larger ESP collection area.
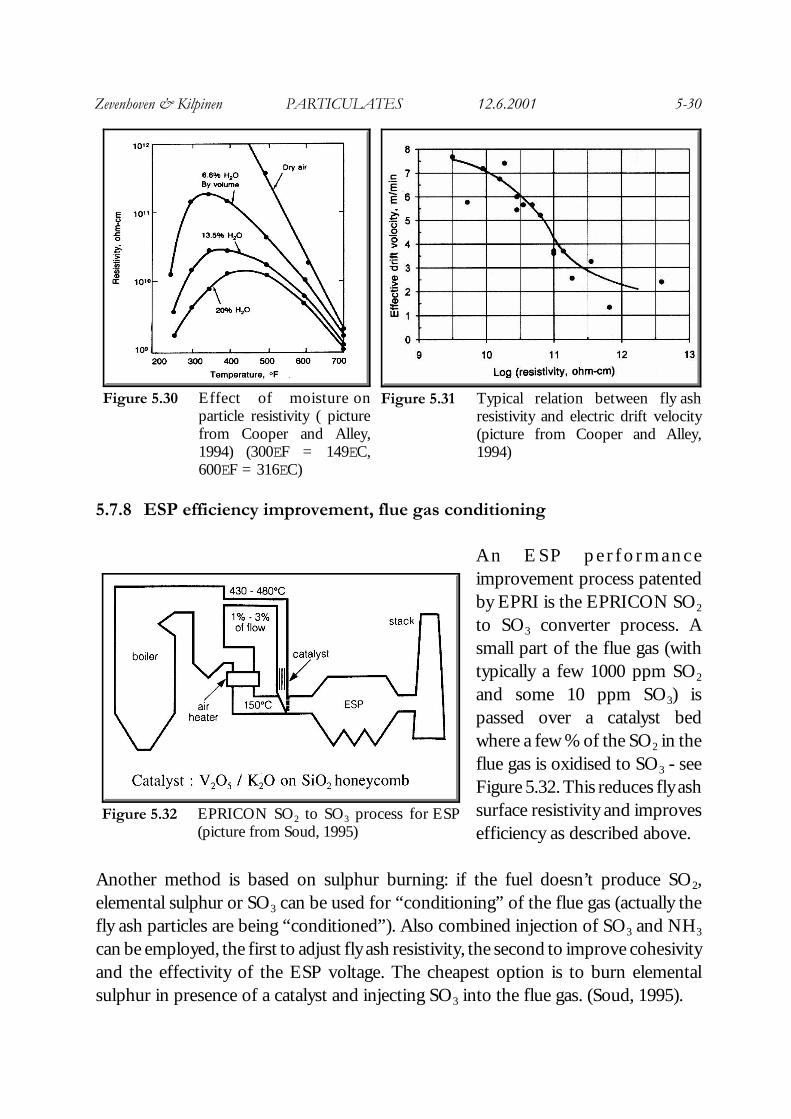
A very important property of the gas phase when it comes to particle resistivity is themoisture content of the gas, especially at temperatures below 200 EC. As Figure 5.30shows (for cement kiln dust), a typical water content of ~10% in the gas can lowerparticle resistivity by several orders of magnitude. Water molecules are very active inremoving electric charge from particles, and moisture plays an important role via itsinteraction with the sulphur oxides in the gas.
By its effect on the particle charge that is acquired, the resistivity of the particles ordroplets determines the electric drift velocity the particle as illustrated by Figure 5.31.This translates to removal efficiency via the Deutsch equation.
Zevenhoven & Kilpinen PARTICULATES 12.6.2001 5-30
Figure 5.31 Typical relation between fly ashresistivity and electric drift velocity(picture from Cooper and Alley,1994)
Figure 5.30 Effect of moisture onparticle resistivity ( picturefrom Cooper and Alley,1994) (300EF = 149EC,600EF = 316EC)
Figure 5.32 EPRICON SO2 to SO3 process for ESP(picture from Soud, 1995)
5.7.8 ESP efficiency improvement, flue gas conditioning
A n E S P p e r f o r m a n c eimprovement process patentedby EPRI is the EPRICON SO2
to SO3 converter process. Asmall part of the flue gas (withtypically a few 1000 ppm SO2
and some 10 ppm SO3) ispassed over a catalyst bedwhere a few % of the SO2 in theflue gas is oxidised to SO3 - seeFigure 5.32. This reduces fly ashsurface resistivity and improvesefficiency as described above.
Another method is based on sulphur burning: if the fuel doesn’t produce SO2,elemental sulphur or SO3 can be used for “conditioning” of the flue gas (actually thefly ash particles are being “conditioned”). Also combined injection of SO3 and NH3
can be employed, the first to adjust fly ash resistivity, the second to improve cohesivityand the effectivity of the ESP voltage. The cheapest option is to burn elementalsulphur in presence of a catalyst and injecting SO3 into the flue gas. (Soud, 1995).

Zevenhoven & Kilpinen PARTICULATES 12.6.2001 5-31
Temperature 120 - 200°C Power / collector area
Gas flow velocity 1 - 3 m/s ash resistivity 104-107 ohm.cm ~ 43 W/m2
Gas flow / collector area 15 - 125 s/m ash resistivity 107 - 108 ohm.cm ~ 32 W/m2
Plate-to-plate distance 0.15 - 0.4 m ash resistivity 109-1010 ohm.cm ~ 27 W/m2
Electric drift velocity 0.02 - 2 m/s ash resistivity ~1011 ohm.cm ~ 22 W/m2
Corona current / collector area 50 - 750µA/m2 ash resistivity ~1012 ohm.cm ~ 16 W/m2
Corona current / gas flow 0.05 - 0.3 J/m3 ash resistivity ~1013 ohm.cm ~ 11 W/m2
Table 5.11 Typical design characteristics for cold-side ESPs (data from Cooper and Alley, 1994)
5.7.9 ESP design characteristics, hot/cold - side ESP, wet ESP.
Typical design data for ESPs are given in Table 5.11. Most ESPs are operated as so-called “cold-side” ESPs, located between air pre-heater and FGD system (if that ispresent) at 120-200EC. This is not optimal when considering fly ash resistivity (seeFigure 5.26). Alternatively, so-called “hot-side” ESPs are operated at 300-450EC,upstream of the air pre-heater. Since particle resistivity is determined by volumeconductivity under these conditions, there is less sensitivity to gas composition. Adisadvantage is that heat losses from hot ESPs can be significant, and they are moresensitive to temperature changes when operating the furnace or boiler at partial load.
When an SCR unit for NOx control (7 chapter 4) is part of the flue gas clean-upsystem (which operates at 350-400EC) it is beneficial to have the ESP upstream of theSCR. This “hot side, low dust” operation will improve SCR catalyst lifetime andreduce SCR operation and maintenance problems. Especially for flue gas from wasteincineration furnaces this arrangement is preferable.
An interesting option that gives very high ESP efficiencies is to operate in a “wet”mode, i.e. with a stream of water that continuously removes the dust from the collectorsurfaces as a slurry. This finds application especially in Japan where ESPs located nearcities are forced to control particulate emissions to 10 mg/m³STP or below. Advantagesare high efficiency (less re-entrainment) and less sensitivity to particle resistivity, highergas velocities (giving smaller devices) and that sub-micron particles can be collectedas well. A major advantage is the absence of the rapping devices that are required toremove the particles from cold-side ESP collector surface. Disadvantages are that thegas temperature has to be reduced significantly, that corrosion problems can arise andthat high dust and high SO3 concentrations cause problems. Besides that, a wastewater stream is generated that needs handling (Scott, 1997).
High temperature ESPs will be discussed further in section 5.11, below.