zeolite supported metal sulfides as catalysts for hydrocracking · zeolite supported metal sulfides...
TRANSCRIPT

Zeolite supported metal sulfides as catalysts forhydrocrackingWelters, W.J.J.
DOI:10.6100/IR416846
Published: 01/01/1994
Document VersionPublisher’s PDF, also known as Version of Record (includes final page, issue and volume numbers)
Please check the document version of this publication:
• A submitted manuscript is the author's version of the article upon submission and before peer-review. There can be important differencesbetween the submitted version and the official published version of record. People interested in the research are advised to contact theauthor for the final version of the publication, or visit the DOI to the publisher's website.• The final author version and the galley proof are versions of the publication after peer review.• The final published version features the final layout of the paper including the volume, issue and page numbers.
Link to publication
Citation for published version (APA):Welters, W. J. J. (1994). Zeolite supported metal sulfides as catalysts for hydrocracking Eindhoven: TechnischeUniversiteit Eindhoven DOI: 10.6100/IR416846
General rightsCopyright and moral rights for the publications made accessible in the public portal are retained by the authors and/or other copyright ownersand it is a condition of accessing publications that users recognise and abide by the legal requirements associated with these rights.
• Users may download and print one copy of any publication from the public portal for the purpose of private study or research. • You may not further distribute the material or use it for any profit-making activity or commercial gain • You may freely distribute the URL identifying the publication in the public portal ?
Take down policyIf you believe that this document breaches copyright please contact us providing details, and we will remove access to the work immediatelyand investigate your claim.
Download date: 19. Jun. 2018
Zeolite supported metal sulfides as catalysts
for hydrocracking
· W. J. J. Welters
ZEOLITE SUPPORTED
METAL SULFIDES AS CATALYSTS
FOR HYDROCRACKING
PROEFSCHRJFT
ter verkrijging van de graad van doctor aan de
Technische Universiteit Eindhoven, op gezag van
de Rector Magnificus, prof.dr. J.H. van Lint,
voor een commissie aangewezen door het College
van Dekanen in het openbaar te verdedigen op
donderdag 19 mei 1994 om 16.00 uur
door
WILHELMUS JACOBUS JOHANNES WELTERS
Geboren te Roermond
Dit proefschrift is goedgekeurd door de promotoren:
prof.dr. R.A. van Santen
en
prof.dr. J.A.R. van Veen
copromoter: dr.ir. V.H.J. de Beer
~
NU'O The work described in this thesis was carried out at the Schuit Institute of Catalysis,
Laboratory oflnorganic Chemistry and Catalysis, Eindhoven University ofTechnology
(P.O. Box 513, 5600 MB Eindhoven, The Netherlands) with financial support of the
Dutch Organization for Scientific Research (NWO).
Contents
I . Introduction
2.
3.
4.
5.
HDS activity and characterization of zeolite supported nickel sulfide
catalysts
The influence of zeolite acidity on the thiophene HDS activity
Hydrocracking of n-decane over zeolite supported metal sulfide
catalysts: (I) CaY supported transition metal sulfides
Hydrocracking of n-decane over zeolite supported metal sulfide
catalysts: (II) Zeolite Y supported Ni and Ni-Mo sulfides
6. NaY supported molybdenum sulfide catalysts prepared via impregnation
with ammonium heptamolybdate
7. NaY supported molybdenum sulfide catalysts prepared via adsorption
of molybdenum hexacarbonyl
8. A new assignment of the signals in 23Na DOR NMR to sodium sites in
15
41
59
87
101
123
dehydrated NaY zeolite 147
9. Summary and concluding remarks 169
Samenvatting
Dankwoord
Curriculum Vitae
173
177
179
1 INTRODUCTION
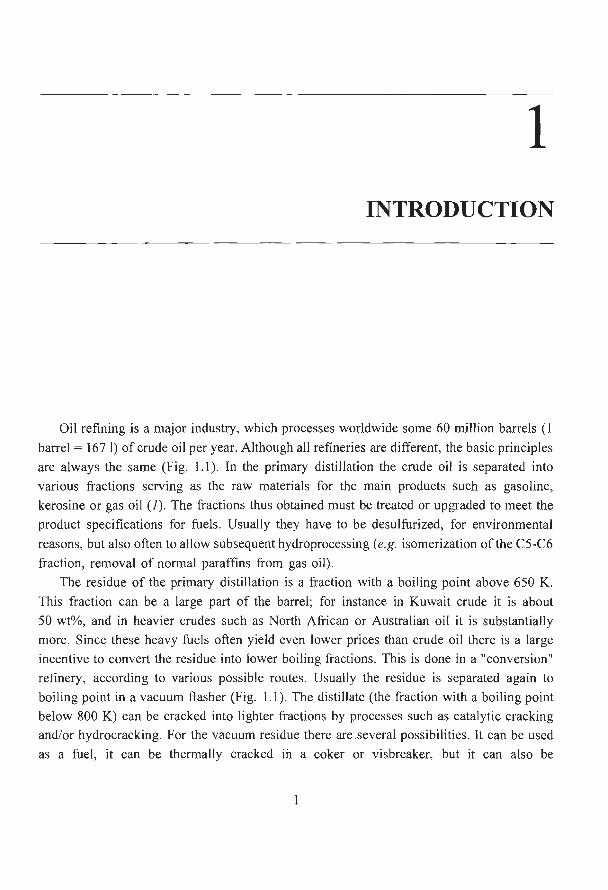
Oil refining is a major industry, which processes worldwide some 60 million barrels (1
barrel = 167 I) of crude oil per year. Although all refineries are different, the basic principles
are always the same (Fig. 1.1). In the primary distillation the crude oil is separated into
various fractions serving as the raw materials for the main products such as gasoline,
kerosine or gas oil (1) . The fractions thus obtained must be treated or upgraded to meet the
product specifications for fuels . Usually they have to be desulfurized, for environmental
reasons, but also often to allow subsequent hydroprocessing (e.g. isomerization of the C5-C6
fraction, removal of normal paraffins from gas oil).
The residue of the primary distillation is a fraction with a boiling point above 650 K.
This fraction can be a large part of the barrel; for instance in Kuwait crude it is about
50 wt%, and in heavier crudes such as North African or Australian oil it is substantially
more. Since these heavy fuels often yield even lower prices than crude oil there is a large
incentive to convert the residue into lower boiling fractions . This is done in a "conversion"
refinery, according to various possible routes. Usually the residue is separated again to
boiling point in a vacuum flasher (Fig. 1.1 ). The distillate (the fraction with a boiling point
below 800 K) can be cracked into lighter fractions by processes such as catalytic cracking
and/or hydrocracking. For the vacuum residue there are several possibilities. It can be used
as a fuel, it can be thermally cracked in a coker or visbreaker, but it can also be
2
CRUDE OIL
NAPHTA
LIGHT ENDS (LPG, FUEL GAS, ETC.
NAPHTA HYDROTREATER
MIDDLE DISTILLATE DISTILLATES HYDROTREATER
GAS OIL HYDROTREATER
RESIDUE HYDROTREATER
CATALYTIC REFORMER
HEAVY FUEL OIL
Figure 1.1: Process configuration of a 'conversion' refinery.
Chapter 1
HIGH OCTANE GASOLINE
hydroconverted, which is basically a more severe form of hydrodesulfurization, producing
apart from a low-sulfur residue significant amounts of distillates.
These conversion refineries are more profitable than the simple ones, and the conversion
processes, mainly catalytic cracking and hydrocracking, are operated on a large scale. Both
cracking processes differ fundamentally in the way they achieve the necessary increase in
hydrogen to carbon ratio of the products. While catalytic cracking functions basically by
rejecting carbon from the feed molecules (i.e. as coke), the hydrocracking process converts
large high boiling point molecules into desired lower boiling products by hydrogenating and
breaking carbon - carbon bonds (i.e. by adding hydrogen to the feed). Whereas catalytic
cracking mainly yields olefinic gases and high octane gasoline as products, the hydrocracking
process can be designed to produce high yields of middle distillate products (i.e. kerosine,
gas oil). Due to the growing demailds for these products the hydrocracking process has
Introduction 3
received increasing attention from both the oil refining and catalyst manufacturing industries
in recent years (2).
HYDROCRACKING CATALYSIS
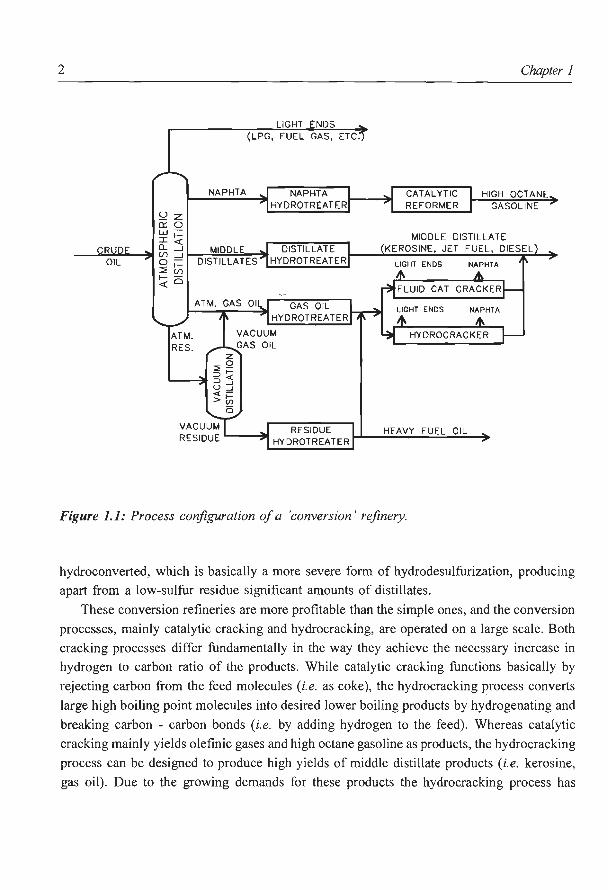
The hydrocracking process is quite complex in terms of catalytic chemistry involved.
Generally, the process consists of two separate stages (Fig. 1.2). The first stage is primarily
a hydrotreatment step, involving hetero atom removal (i.e. hydrodesulfurization (HDS) and
hydrodenitrogenation (HDN)) and hydrogenation of aromatic structures together with a
relatively minor contribution of hydrocracking reactions as such. Typical hydrotreating
catalysts based on mixed metal sulfide systems (e.g. Ni-Mo/AlP3) are most suitable for this
first process step. The reactions are performed at relatively high pressures (1 0-18 MPa) and
temperatures (625-725 K) (3). The actual hydrocracking reaction occurs mainly in the second
step, which makes use of a bifunctional catalyst combining both hydrogenation and acidic
compounds (e.g. Ni-W/HY).
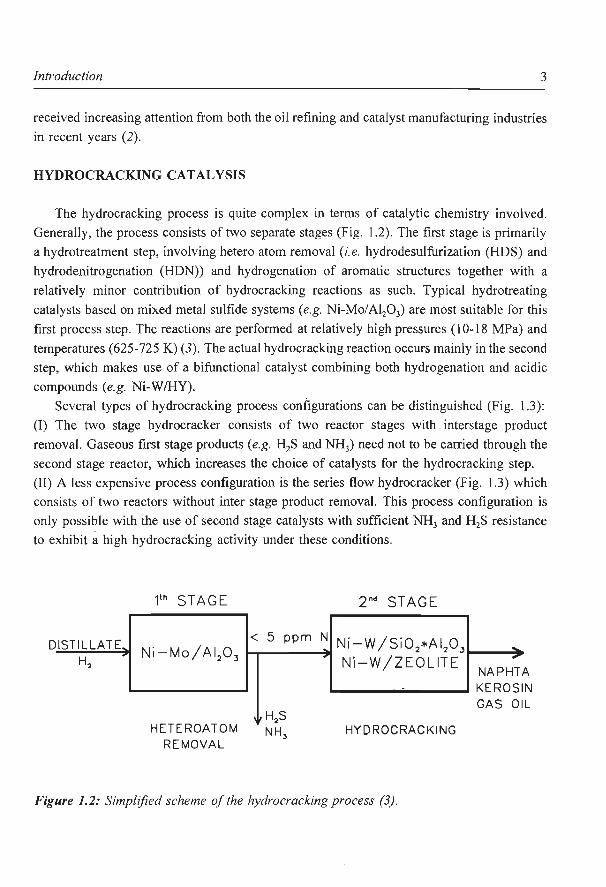
Several types of hydrocracking process configurations can be distinguished (Fig. 1.3):
(I) The two stage hydrocracker consists of two reactor stages with interstage product
removal. Gaseous first stage products (e.g. H2S and NH3) need not to be carried through the
second stage reactor, which increases the choice of catalysts for the hydrocracking step.
(II) A less expensive process configuration is the series flow hydrocracker (Fig. 1.3) which
consists of two reactors without inter stage product removal. This process configuration is
only possible with the use of second stage catalysts with sufficient NH3 and H2S resistance
to exhibit a high hydrocracking activity under these conditions.
D ISTILLATE
H2 ,
11h STAGE
Ni-Mo/AI20 3
HETEROATOM REMOVAL
2"d STAGE
< 5 ppm N Ni -W /Si0 2 *Al2 0 3
Ni-W /ZEOLITE
- -
H2 S HYDROCRACKING
Figure 1.2: Simplified scheme of the hydrocracking process (3).
... ,. NAPHT A
N L
KEROSI
GAS 01
4 Chapter 1
TW 0 STAGE ~ .. PRODUCT
n::: 0 f-<(
F EED z .... HT .... 0
r HC , 1[\ ,. f- t-
u <( n::: u..
L._
SERIES FLOW
FEED HT HC
SINGLE STAGE
FEED ----r-~ HT I HC
Figure 1.3: Different hydrocracking process configurations (1,2).
Introduction 5
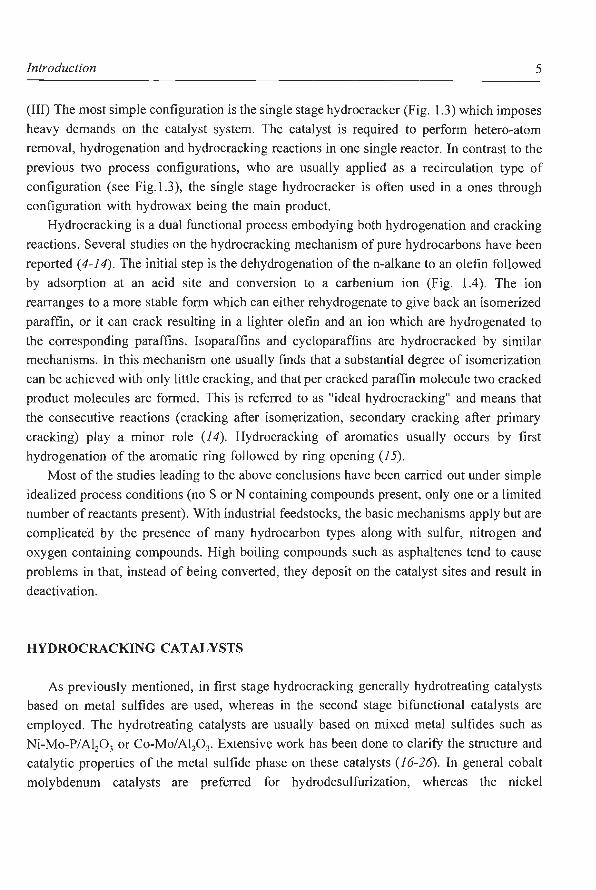
(III) The most simple configuration is the single stage hydrocracker (Fig. 1.3) which imposes
heavy demands on the catalyst system. The catalyst is required to perform hetero-atom
removal, hydrogenation and hydrocracking reactions in one single reactor. In contrast to the
previous two process configurations, who are usually applied as a recirculation type of
configuration (see Fig.1.3), the single stage hydrocracker is often used in a ones through
configuration with hydrowax being the main product.
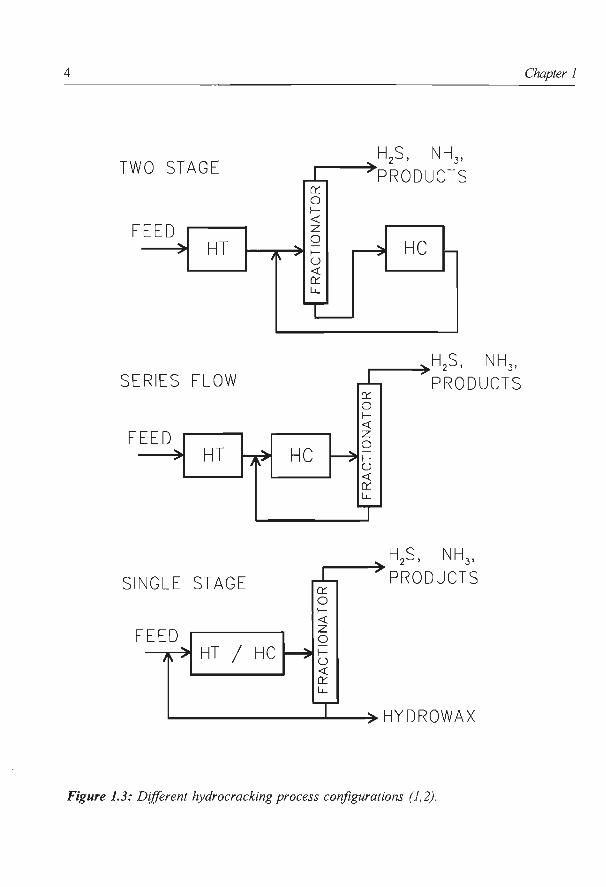
Hydrocracking is a dual functional process embodying both hydrogenation and cracking
reactions. Several studies on the hydrocracking mechanism of pure hydrocarbons have been
reported ( 4-14). The initial step is the dehydrogenation of the n-alkane to an olefin followed
by adsorption at an acid site and conversion to a carbenium ion (Fig. 1.4). The ion
rearranges to a more stable form which can either rehydrogenate to give back an isomerized
paraffin, or it can crack resulting in a lighter olefin and an ion which are hydrogenated to
the corresponding paraffins. Isoparaffins and cycloparaffins are hydrocracked by similar
mechanisms. In this mechanism one usually finds that a substantial degree of isomerization
can be achieved with only little cracking, and that per cracked paraffin molecule two cracked
product molecules are formed. This is referred to as "ideal hydrocracking" and means that
the consecutive reactions (cracking after isomerization, secondary cracking after primary
cracking) play a minor role (1 4). Hydrocracking of aromatics usually occurs by first
hydrogenation of the aromatic ring followed by ring opening (1 5).
Most of the studies leading to the above conclusions have been carried out under simple
idealized process conditions (no S or N containing compounds present, only one or a limited
number of reactants present). With industrial feedstocks, the basic mechanisms apply but are
complicated by the presence of many hydrocarbon types along with sulfur, nitrogen and
oxygen containing compounds. High boiling compounds such as asphaltenes tend to cause
problems in that, instead of being converted, they deposit on the catalyst sites and result in
deactivation.
HYDROCRACKING CATALYSTS
As previously mentioned, in first stage hydrocracking generally hydrotreating catalysts
based on metal sulfides are used, whereas in the second stage bifunctional catalysts are
employed. The hydrotreating catalysts are usually based on mixed metal sulfides such as
Ni-Mo-P/Alz03 or Co-Mo/Alz03• Extensive work has been done to clarify the structure and
catalytic properties of the metal sulfide phase on these catalysts (1 6-26). In general cobalt
molybdenum catalysts are preferred for hydrodesulfurization, whereas the nickel
6 Chapter 1
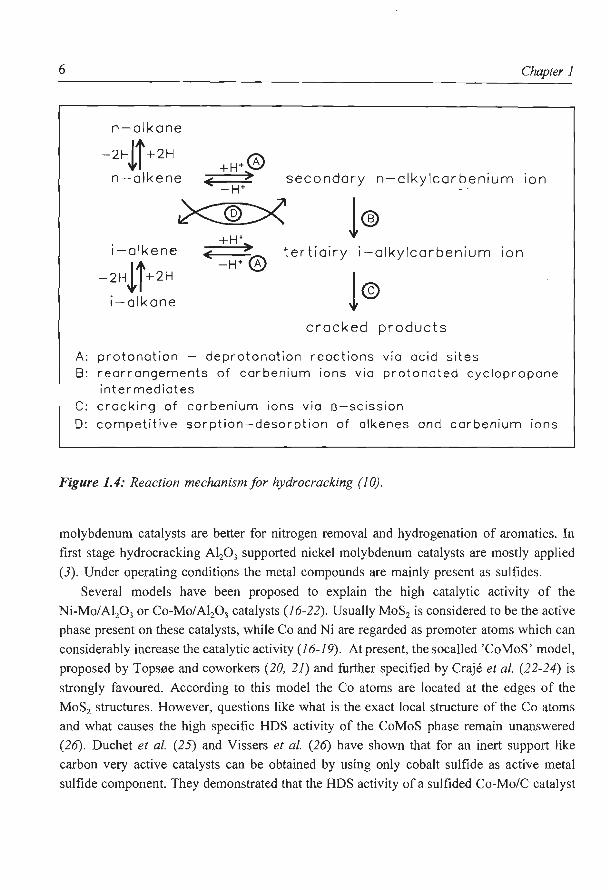
n-alkane
-2H.!.i +2H n-alkene secondary n-alkylcarb_enium ion
i-alkene
-2H!i+2H
i-alkane
tertiairy i-alkylcarbenium
cracked products
A: protonation - deprotonation reactions via acid sites
iOn
8: rearrangements of carbenium ions via protonated cyclopropane intermediates
C: cracking of corbenium ions via o-scission
D: competitive sorption-desorption of olkenes and carbenium ions
Figure 1.4: Reaction mechanism for hydrocracking (1 0).
molybdenum catalysts are better for nitrogen removal and hydrogenation of aromatics. In
first stage hydrocracking Al20 3 supported nickel molybdenum catalysts are mostly applied
(3). Under operating conditions the metal compounds are mainly present as sulfides.
Several models have been proposed to explain the high catalytic activity of the
Ni-Mo/Al20 3 or Co-Mo/AlP3 catalysts (16-22). Usually MoS2 is considered to be the active
phase present on these catalysts, while Co and Ni are regarded as promoter atoms which can
considerably increase the catalytic activity (1 6-19). At present, the socalled 'CoMaS' model,
proposed by Tops0e and coworkers (20, 21) and further specified by Craje et a!. (22-24) is
strongly favoured_ According to this model the Co atoms are located at the edges of the
MoS2 structures. However, questions like what is the exact local structure of the Co atoms
and what causes the high specific HDS activity of the CoMaS phase remain unanswered
(26). Duchet et al. (25) and Vissers et al. (26) have shown that for an inert support like
carbon very active catalysts can be obtained by using only cobalt sulfide as active metal
sulfide component. They demonstrated that the HDS activity of a sulfided Co-Mo/C catalyst
Introduction 7
can be explained by the very high activity of the cobalt sulfide without having to invoke a
contribution of the molybdenum sulfide. Also for zeolite supported cobalt and nickel sulfide
catalysts high HDS activities are obtained without the presence of Mo and W (30).
The second stage hydrocracking catalyst is a carefully formulated combination of a
hydrogenation component and a cracking component. The cracking component provides
generally two basic functions: I) the acidic function and 2) the high surface area porous
support. Typical support materials are amorphous metal oxides having surface areas greater
than about 150m2 g-1• Amorphous silica-alumina is a well known support material since the
early days of catalytic cracking. In these materials the acid function is provided by protons
which are attached to the negatively charged framework (the negative charge is caused by
aluminum atoms tetrahedrally surrounded by oxygen atoms). Amorphous silica-alumina can
be prepared in many ways and over a range of alumina contents; they usually have a rather
high surface area. Although originally used exclusively (31), amorphous oxide supports are
now only used in special applications, namely when maximum middle distillate product is
desired (32). For comparison, catalysts containing zeolites are substantially more active and
more stable. Thus the operation time for the catalyst can be considerably longer, or the
throughput can be substantially increased. Additionally zeolite catalysts are less sensitive to
organa-nitrogen compounds and ammonia derived from them (32).
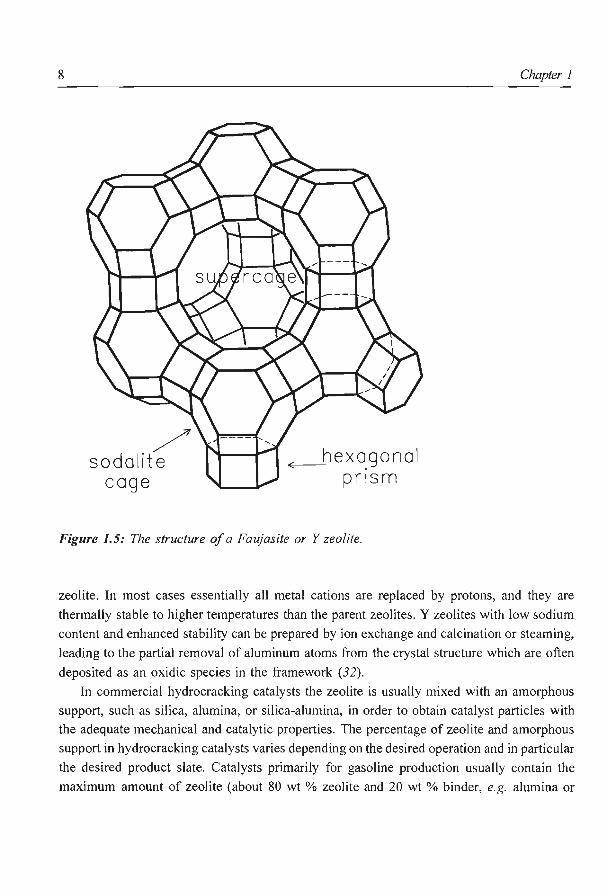
Zeolites are crystalline alumino-silicates with a three dimensional structure formed by
connecting silicon and aluminum atoms (these metal atoms are called the T atoms) with each
other through oxygen atoms (33). A large variety in zeolite structures is possible (34). In Fig.
1.5 the structure of a faujasite or Y zeolite is given. In this structure the T atoms are
connected by four rings (a ring containing four oxygen atoms) or six rings. These rings
compose three different cages. The large supercages or a-cages have diameter of 11.8 A and
are connected with each other via twelve ring windows of 7.4 A diameter, resulting in a
three dimensional pore system. The supercages are surrounded by smaller sodalite or {3-cages.
Each sodalite cage is surrounded by four hexagonal prisms or -y-cages (see Fig. 1.5). Since
the threevalent aluminum atoms are tetrahedrally surrounded by oxygen atoms, the
framework ofT atoms and oxygen atoms is negatively charged. Charge balance is achieved
by cations (usually Na+) which can be found in the different cages. Acidic zeolites can be
obtained by exchange of these cations against protons.
Of the large number of zeolites and molecular sieves available, only a small number have
been reported as useful for hydrocracking and of these only a few have found commercial
use. Y zeolite dominates the commercial use for hydrocracking, while ZSM-5 and related
materials are preferred sources for hydrodewaxing or shape selective cracking. Zeolites of
use in hydrocracking are usually highly modified materials compared to the basic synthesized
8
/ sodalite
cage ~hexa.gonal
pr 1sm
Figure 1.5: The structure of a Faujasite or Y zeolite.
Chapter I
zeolite. In most cases essentially all metal cations are replaced by protons, and they are
thermally stable to higher temperatures than the parent zeolites. Y zeolites with low sodium
content and enhanced stability can be prepared by ion exchange and calcination or steaming,
leading to the partial removal of aluminum atoms from the crystal structure which are often
deposited as an oxidic species in the framework (32).
In commercial hydrocracking catalysts the zeolite is usually mixed with an amorphous
support, such as silica, alumina, or silica-alumina, in order to obtain catalyst particles with
the adequate mechanical and catalytic properties. The percentage of zeolite and amorphous
support in hydrocracking catalysts varies depending on the desired operation and in particular
the desired product slate. Catalysts primarily for gasoline production usually contain the
maximum amount of zeolite (about 80 wt% zeolite and 20 wt % binder, e.g. alumina or
Introduction 9
silica). For a more mixed product slate an intermediate quantity of zeolite can be used.
Many hydrogenation components have been evaluated for hydrocracking. These have
generally been those well known for hydrocarbon hydrogenation and constitute the noble
metals, particularly Pt and Pd, and the non-noble metals of Group VIb and VIII (Ni, Co ,
Mo and W). Noble metals are used in amounts less than I wt % whereas non-noble metals
are used in levels similar to those in hydrotreating catalysts (i.e. 2-8 wt% Ni or Co and 12
-30 wt % Mo or W as oxides (35)) . In the presence of only low concentrations of sulfur Pt
and Pd are very powerful hydrogenation catalysts and therefore provide an excellent
hydrogenation function for second stage hydrocracking catalysts in a two stage hydrocracking
configuration (Fig. 1.3). Noble metal catalysts give generally a higher activity compared with
mixed metal sulfides. However, these differences are enormously reduced if the hydrogen
sulfide concentration increases. The effect of H2S on decane hydrocracking over Pd/Y
catalysts was studied by Weitkamp et at. (36). In the presence of H2S the activity of the
sulfided Pd is quite insufficient to achieve "ideal" hydrocracking. The desirability of low H2S
pressures obviously adds to the operational costs when such catalysts are used.
In a sulfur rich environment as the one that exists at the first stage of the hydrocracking
unit or at a single stage hydrocracking unit, mixed sulfide hydrogenation functions (e.g.
Ni-Mo or Ni-W) are generally more effective. Alumina is the most suitable support for these
systems, but it offers of course only a moderate cracking activity, and the activity of mixed
sulfides dispersed on more acidic materials such as amorphous silica-alumina and zeolites
is of interest. Zeolites are often particularly poor dispersing agents for mixed sulfides since
the large anionic precursor species (e.g. Mo70 246') do not enter the zeolite crystals during
preparation. In commercial hydrocracking catalysts the extrudates often contain a binder such
as alumina, apart from the zeolite, and the mixed sulfides are primarily located on the
alumina.
OUTLINE OF THIS THESIS
As described above, hydrocracking catalysts often consist of a zeolite (acidic function)
and non noble metal sulfides ((de)hydrogenation function). Despite several studies (37-50)
have been performed on zeolite supported metal sulfide catalysts, there are several aspects
which are still not clear, for instance the influence of preparation parameters on the metal
sulfide location (inside- or outside the zeolite pore system), the zeolite - metal sulfide
interaction, and of higher interest, the difference in specific catalytic behaviour of the sulfide
particles inside- or outside the zeolite pores. The research in this thesis is mainly focused on
the catalytic and structural characterization of zeolite supported metal sulfide catalysts. The
10 Chapter 1
larger part of this thesis deals with zeolite Y supported nickel or molybdenum sulfide
catalysts, but occasionally also other types of zeolites or metal sulfides are used.
Catalysts prepared by various methods (impregnation, ion exchange, gas phase adsorption
ofMo(C0)6) are sulfided and characterized. For the characterization of the catalytic activity
two model reactions are used: thiophene hydrodesulfurization (HDS) and n-decane
hydrocracking. Thiophene HDS does not provide direct information about the hydrocracking
properties of the catalysts, but it is a useful test reaction for a first comparison of the
catalytic activity of the metal sulfide catalysts. It will mainly provide information about the
catalytic activity of the metal sulfide phase, although the zeolite support may have a strong
influence on the thiophene HDS conversion. Due to the presence of acid sites on the zeolite
supports considerable coke formation will occur and the catalysts will deactivate rapidly.
This coke formation can severely hamper the evaluation of the catalytic properties.
Therefore, we compared the catalysts, besides on their steady state activity, also on the basis
of their activity at very short run ' time. The hydrocracking properties of the catalysts are
tested by the hydrocracking of n-decane at moderate pressure (3.0 MPa). The product
selectivities for isomerization and the degree of secondary cracking provide information
about the (de )hydrogenation strength of the metal sulfide phase and the balance between the
hydrogenation and the acidic function (6-13).
For the structural characterization of the catalysts several techniques are used, such as
Temperature Programmed Desorption (TPD) of ethylamine, Temperature Programmed
Sulfidation (TPS), total overall sulfur analysis, Dynamic Oxygen Chemisorption (DOC), N2
adsorption, Xe adsorption and 129Xe-NMR, and High Resolution Electron Microscopy
(HREM) combined with Energy Dispersive X-ray Analysis (EDX).
Ethylamine TPD is used for the determination of the number of Bmnsted acid sites on
the zeolite catalysts. In contrast to the physisorbed ethylamine (which desorbs at relatively
low temperatures) the ethylamine adsorbed on acid sites only desorbs after decomposition
to NH3 and C2H4 at high temperatures. From the amount of dissociated ethylamine the
amount of acid sites can be calculated.
The sulfidation behaviour and the metal sulfide phase present on the catalysts are studied
by TPS and analysis of the total amount of sulfur present on the catalysts. DOC is used to
measure the relative dispersion of the metal sulfide phase. The distribution of the metal
sulfide phase is characterized by N2 adsorption, 129Xe-NMR and HREM. N2 adsorption is
used to determine the micro pore volume of the catalysts in their precursor and sulfided state.
From the decrease in micro pore volume the presence of metal oxide or sulfide species in
the zeolite pores can be deduced. Also from the Xe adsorption isotherms and the NMR
spectra of the adsorbed 129Xe information can be obtained about the presence of metal oxides
Introduction II
or sulfides in the zeolite pores. Due to the poor packing of N2 or Xe in the zeolite pores,
both the N2 and the Xe adsorption capacity do not provide exact information about the
amount of metal oxide or sulfide located in the zeolite pores,
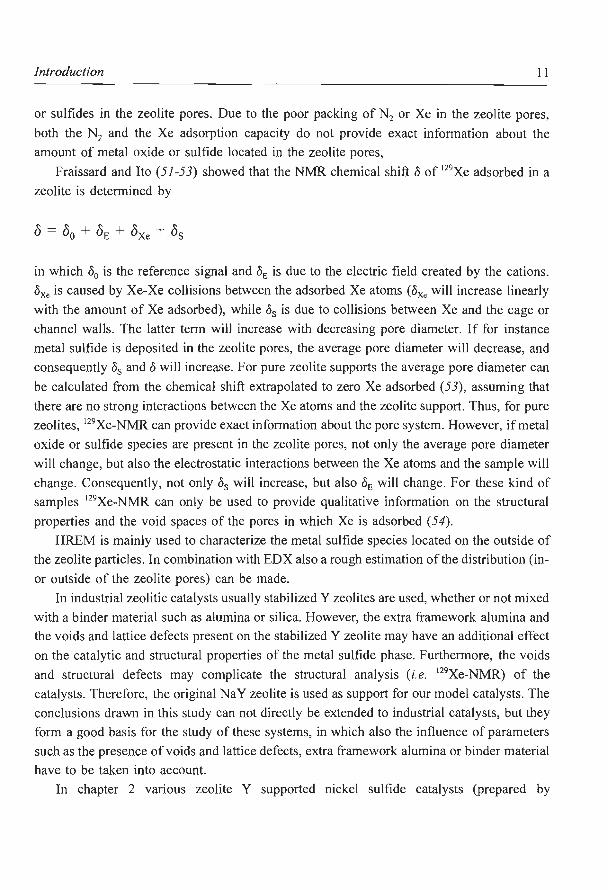
Fraissard and Ito (51-53) showed that the NMR chemical shift o of 129Xe adsorbed in a
zeolite is determined by
in which o0 is the reference signal and oE is due to the electric field created by the cations.
ox. is caused by Xe-Xe collisions between the adsorbed Xe atoms (ox. will increase linearly
with the amount of Xe adsorbed), while Os is due to collisions between Xe and the cage or
channel walls. The latter term will increase with decreasing pore diameter. If for instance
metal sulfide is deposited in the zeolite pores, the average pore diameter will decrease, and
consequently Os and o will increase. For pure zeolite supports the average pore diameter can
be calculated from the chemical shift extrapolated to zero Xe adsorbed (53), assuming that
there are no strong interactions between the Xe atoms and the zeolite support. Thus, for pure
zeolites, 129Xe-NMR can provide exact information about the pore system. However, if metal
oxide or sulfide species are present in the zeolite pores, not only the average pore diameter
will change, but also the electrostatic interactions between the Xe atoms and the sample will
change. Consequently, not only os will increase, but also oE will change. For these kind of
samples 129Xe-NMR can only be used to provide qualitative information on the structural
properties and the void spaces of the pores in which Xe is adsorbed (54).
HREM is mainly used to characterize the metal sulfide species located on the outside of
the zeolite particles. In combination with EDX also a rough estimation of the distribution (in
or outside of the zeolite pores) can be made.
In industrial zeolitic catalysts usually stabilized Y zeolites are used, whether or not mixed
with a binder material such as alumina or silica. However, the extra framework alumina and
the voids and lattice defects present on the stabilized Y zeolite may have an additional effect
on the catalytic and structural properties of the metal sulfide phase. Furthermore, the voids
and structural defects may complicate the structural analysis (i.e. 129Xe-NMR) of the
catalysts. Therefore, the original NaY zeolite is used as support for our model catalysts. The
conclusions drawn in this study can not directly be extended to industrial catalysts, but they
form a good basis for the study of these systems, in which also the influence of parameters
such as the presence of voids and lattice defects, extra framework alumina or binder material
have to be taken into account.
In chapter 2 various zeolite Y supported nickel sulfide catalysts (prepared by
12 Chapter I
impregnation or ion exchange) are characterized on their catalytic (thiophene HDS) and
structural properties. The differences in catalytic activity are explained by differences in
nickel sulfide dispersion and distribution. In chapter 3 the influence of the zeolite acidity on
the HDS activities is examined. The hydrocracking properties of several CaY supported
transition metal sulfides are compared in chapter 4, while chapter 5 deals with the influence
of the metal sulfide dispersion and distribution on the hydrocracking properties. In chapter
6 and 7 the sulfidation behaviour and the distribution of the molybdenum sulfide phase are
characterized for NaY supported Mo catalysts prepared in different ways (impregnation with
(NH4) 6MoP24 solutions and gas phase adsorption of Mo(C0)6).
Chapter 8 reports about the characterization of the Na+ cations in NaY zeolite by 23Na
Double Rotation NMR measurements. This technique may be used to study the interactions
between the metal sulfide phase located in the zeolite pores and the Na+ ions present in the
zeolite support. However, the interpretation of these 23Na Double Rotation NMR spectra is
not fully clear yet. Therefore, at first the assignment of the different signals to the Na+ sites
in the dehydrated NaY zeolite has to be improved. The revised and extended assignment is
presented in this chapter. Unfortunately, the application of this technique to NaY supported
metal sulfide catalysts could not be included in this thesis.
References
1. Maxwell, I.E. and Stork, W.H.J., Stud. Surf Sci. & Catal. 58 (1991) 571.
2. Minderhoud, J.K. and van Veen, J.A.R., Fuel Proc. Techn. 35 (1993) 87.
3. Maxwell, I.E., Catal. Today 1 (1987) 385.
4. Chiapetta, F.G. and Hunter, J.B., Ind. Eng. Chern. 45 (1953) 147.
5. Coonradt, H.L. and Garwood, W.E., Ind. Eng. Chern. Process Des. Dev. 3 (1964) 38.
6. Schulz, H.F. and Weitkamp, J., Ind. Eng. Chern. Prod. Res. Dev. 11 (1972) 46.
7. Jacobs, P.A., Uytterhoeven, J.B., Steyns, M., Froment, G. and Weitkamp, J., Proc. of the 5'h
Int. Conf. on Zeolites, Rees, L.V.C. Ed., p. 607. Heyden, London, 1980.
8. Steyns, M., Froment, G., Jacobs, P.A., Uytterhoeven, J.B. and Weitkamp, J., Ind. Eng. Chern.
Prod. Res. Dev. 20 (1981) 654.
9. Weitkamp, J., Jacobs, P.A. and Martens, J.A., Appl. Catal. 8 (1983) 123.
10. Martens, J.A., Jacobs, P.A. and Weitkamp, J., Appl. Catal. 20 (1986) 239.
11. Martens, J.A., Jacobs, P.A. and Weitkamp, J., Appl. Catal. 20 (1986) 283.
12. Martens, J.A., Thielen, M. and Jacobs, P.A., Catal. Today 1 (1987) 435.
13. Froment, G.F., Catal. Today 1 (1987) 455.
14. Sie, S.T., Ind. Eng. Chern. Res. 32 (1993) 403.
Introduction 13
15. Beecher, R., Voorhies, A. and Eberly, P., Am. Chern. Soc. Div. Petrol. Chern. Preprints 1967,
B5.
16. Voorhoeve, R.J.H. and Stuiver, J.C.M., J. Catal. 23 (1971) 228.
17. Farragher, A.L. and Cossee, P., in 'Proc. 5'h Int. Congr . on Catal. 1972, Palm Beach',
Hightower, J.W., Ed., p. 1301. Elsevier, Amsterdam, 1973.
18. Hagenbach, G., Courty, P. and Delmon, B., J. Catal. 23 (1971) 295.
19. Schuit, C.G.A., and Gates, B.C. , A I C hE J. 19 (1973) 417.
20. Tops0e, H., Clausen, B.S., Candia, R., Wive!, C. and M0rup, S., J. Catal. 68 (1981) 433.
21. Wive!, C., Candia, R., Clausen, B.S., Mmup, S. and Tops0e, H., J. Catal. 68 (1981) 453.
22. Craje, M.W.J., de Beer, V.H.J. and van der Kraan, A.M. , Appl. Catal. 70 (1991) L7.
23. Craje, M.W.J., Louwers, S.P.A., de Beer, V.H.J., Prins, R. and van der Kraan, A.M., J. Phys.
Chern. 96 (1992) 5445.
24. Craje, M.W.J., Ph. D. Thesis, Technical University of Delft, 1993.
25. Duchet, J.C., van Oers, E.M., de Beer, V.H.J. and Prins, R., J. Catal. 80 (1983) 386.
26. Vissers, J.P.R., de Beer, V.H.J. and Prins, R., J. Chern. Soc., Farad. Trans. /83 (1987) 2145.
27. Harris, S. and Chianelli, R.R., J. Catal. 98 (1986) 17.
28. Zdrazil, M., Catal. Today 3 (1988) 269.
29. Prins, R., de Beer, V.H.J. and Somorjai, G.A., Catal. Rev. -Sci. Eng. 31 (1989) l.
30. Welters, W.J.J., Koninyi, T.I., de Beer, V.H.J. and van Santen, R.A. , in 'New Frontiers in
Catalysis', Guczi, L. et a!. Eds., p. 1931. Elsevier, Amsterdam, 1993.
31. Sullivan, R.F. and Scott, J.W. , ACS Syrnp. Ser. 222 (1983) 293.
32. Ward, J.W., Fuel Proc. Techn. 35 (1993) 55.
33. 'Introduction into zeolite science and practice', van Bekkum, H. , Flanigen, E.M. and Jansen,
J.C., Eds. Elsevier, Amsterdam, 1991 .
34. Smith, J.V., Chern. Rev. 88 (1988) 149.
35. Ward, J.W., Stud. Surf Sci. & Catal. 16 (1983) 587.
36. Dauns, H. , Ernst, S. and Weitkamp, J. , Stud. Surf Sci. Catal. 28 (1986) 787.
37. Cid. R., Villasenor, J., Orellana, F., Fierro, J.L.G. and Lopez Agudo, A., Appl. Catal. 18
(1985) 357.
38. Cid, R., Orellana, F. and Lopez Agudo, A., Appl. Catal. 32 (1987) 327.
39. Fierro, J.L.G., Conesa, J.C. and Lopez Agudo, A., J. Catal. 108 (1987) 334.
40. Cid, R. , Fierro, J.L.G. and Lopez Agudo, A., Zeolites 10 (1990) 95.
41. Cid, R. , Neira, J., Godoy, J. , Palacios, J.M., Mendioroz, S. and Lopez Agudo, A., J. Catal.
141 (1993) 206.
42. Davidova, N., Kovacheva, P. and Shopov, P., Zeolites 6 (1986) 304.
43. Kovacheva, P., Davidova, N. and Novakova, J. , Zeolites 11 (1991) 54.
44. Laniecki, M. and Zmierczak, W. , Zeolites 11 (1991) 18.
45. Laniecki, M. and Zmierczak, W., in 'Zeolite chemistry an catalysis', Jacobs, P.A. et al. Eds.,
p. 331. Elsevier, Amsterdam, 1991.
14 Chapter I
46. Leglise, J., Janin, A., Lavalley, J.C., and Cornet, D., J Catal. 114 (1988) 388.
47. Ezzamarty, A., Catherine, E., Cornet, D., Hemidy, J.F., Janin, A., Lavalley, J.C. and Leglise,
J. , in 'Zeolites: Facts, Figures, Future', Jacobs, P.A. and van Santen, R.A., Eds., p. 1025.
Elsevier, Amsterdam, 1989.
48. Anderson, J.A., Pawelelec, B., Fierro, J.L.G., Arias, P.L., Duque, F., and Cambra, J.F., App.
Catal. 99 (1993) 55.
49. Corma, A., Vazquez, M.I., Bianconi, A., Clozza, A., Garcia, J., Pallota, 0., and Cruz, J.M.,
Zeolites 8 ( 1988) 464.
50. Okamoto, Y., Maezawa, A., Kane, H. and Imanaka, T., J Mol. Catal. 52 (1989) 337.
51. Ito, T. and Fraissard, J. , J Chern. Phys. 76 ( 1982) 5225.
52. Ito, T. and Fraissard, J. , J Chern. Soc., Farad. Trans. I 83 ( 1987) 451 .
53. Fraissard, J. and Ito, T., Zeolites 8 (1988) 350.
54. Koranyi, T.I., van de Yen, L.J.M., Welters, W.J.J., de Haan, J.W., de Beer, V.H.J. and van
Santen, R.A., Coli. and Surf A: Physicochern. Eng. Aspects 72 (1993) 143.
2 HDS ACTIVITY AND CHARACTERIZATION
OF ZEOLITE SUPPORTED NICKEL SULFIDE CATALYSTS
ABSTRACT Various zeolite Y supported nickel sulfide catalysts are prepared (by impregnation or ion
exchange) and characterized by means of thiophene HDS, sulfur analysis, TPS, 129Xe-NMR,
HREM and DOC. The catalysts show large differences in catalytic behaviour depending on
the preparation method (impregnation vs. ion exchange) and the pretreatment conditions
(method of sulfidation). Especially the ion exchanged catalysts show a high initial activity,
but due to the presence of acid sites deactivation is very strong. The initial activity of the
ion exchanged catalysts can be improved significantly by drying prior to sulfidation. In all
cases sulfidation results in quantitative nickel sulfide formation, with Ni3S2 being the main
product. Occasionally, also some NiS appears to be present. The major part of the nickel
sulfide phase is invariably located on the outside of the zeolite particles. The fraction of
nickel sulfide in the zeolite pores depends on the preparation method and the pretreatment
conditions. The differences in catalytic activity can not only be ascribed to variations in
overall nickel sulfide dispersion, but also the acidity of the support and the presence of very
active small nickel sulfide clusters in the pores of the zeolite can have a strong influence on
the thiophene HDS activity.
15

16 Chapter 2
INTRODUCTION
Hydrocracking is one of the major catalytic processes to convert residual feedstocks into
distillate products. A Hydrocracking catalyst needs both an acid and a hydrogenation
function. In industrial hydrocracking processes combinations of zeolites and transition metal
sulfides are often used. These catalysts are more active than metal sulfides on silica-alumina,
yield more desired products (light hydrocarbons and gasolines) and are more resistant to
poisoning by sulfur and nitrogen containing compounds present in the feed (1, 2). For
process economics the availability of catalysts having an activity and selectivity adapted to
the feed requirements is of crucial importance. However, the selection of these tailor made
catalysts is still difficult because of the limited knowledge about the influence of parameters
such as the location of the sulfide species (in- or outside of the zeolite pore system), the
interaction between sulfide species and the zeolite and their effect on the catalytic activity.
Several studies about zeolite supported transition metal sulfides have been reported in
recent years (3-11). Cid et al. (3, 4) found zeolite supported cobalt sulfide catalysts prepared
by ion exchange to be more active for thiophene hydrodesulfurization (HDS) than those
prepared by impregnation. Sulfided ion exchanged NiNaY zeolites showed an increase in
steady state thiophene HDS activity with increasing Ni loading. Sulfidation led to the
formation of nickel sulfide (probably Ni3S2), accompanied by an increase in Brons ted acidity
(6). Leglise et al. (10) and Ezzamarty et al. (11) studied sulfided Ni and Ni-Mo catalysts
supported on dealuminated Y zeolites. They found incomplete sulfidation for all the Ni-Mo
catalysts, but the Ni catalysts sulfided well. From XPS analysis they concluded that in the
oxidized state Ni concentrated near the zeolite surface (ion exchange) and that it became
better dispersed upon sulfidation. Welters et al. (12) compared zeolite Y supported Ni and
Co sulfide catalysts with the corresponding Alz03 and carbon supported ones. Both metal
sulfides had similar activities which were considerably higher than those of their alumina
supported counterparts, and comparable to that of carbon supported catalysts.
In the present study zeolite Y supported nickel sulfide catalysts are prepared by
impregnation and ion exchange. In spite of the fact that stabilized Y zeolites are the most
commonly used zeolites for industrial hydrocracking (1), the original Y zeolite is used as
support for our model catalysts in order to avoid activity changes arising from the extra
framework alumina or from the voids or lattice defects present on the stabilized Y zeolite.
Atmospheric thiophene HDS is used as test reaction. Although this reaction does not provide
direct information about the hydrocracking properties of the catalysts, it is a relatively short
and useful test for first stage comparison of the catalytic activities of catalysts series. Several
other techniques are used to characterize for instance the acidity of the zeolite (ethylamine

Zeolite supported nickel sulfide catalysts 17
TPD), the nickel sulfide phase (sulfur analysis, TPS) and the distribution of the sulfide
species throughout the zeolite particles (129Xe-NMR, HREM, 0 2-chemisorption).
EXPERIMENTAL
Catalyst Preparation A series ofNiNaY catalysts with varying degrees of ion exchange are prepared at room
temperature from a NaY zeolite (PQ CBV-100, Na5iAI02) 5iSi02) 138 * x H20) using
aqueous solutions of NiCl2 of appropriate concentration. After exchange the samples are
washed until cr free, and dried in air at 3 83 K for 16 h.
A CaY zeolite (C~5NaiA102)5iSi02) 138 * x H20) is prepared from the NaY zeolite by
repeated ion exchange with CaC12 aqueous solutions. The metal contents of the exchanged
zeolites are determined using atomic adsorption spectroscopy (AAS).
Two series of catalysts are prepared by pore volume impregnation of NaY and CaY
zeolites with aqueous solutions ofNi(N03) 2. After impregnation the samples are dried in air
overnight at 383 K, and subsequently calcined at 673 K for 2 h. All samples are stored in
a desiccator over a saturated CaC12 solution. Before use, the samples are pressed, grinded and
sieved to obtain a particle size fraction of 0.125-0.425 mm.
The catalysts are designated Ni(x)NaY (ionex), Ni(x)/NaY (imp) or Ni(x)/CaY (imp),
with x representing the weight percentage Ni (determined by AAS and calculated on the
basis of the water free zeolite).
Catalytic Activity Thiophene hydrodesulfurization (HDS) activity measurements are carried out in a micro
flow reactor under standard conditions (673 K, I atm, 4.0 % thiophene in H2, 50 std cm3
min·'). Catalyst samples of 0.25 g (particle size 0.125-0.425 mm) are sulfided in situ using
a mixture 10% H2S in H2 (60 std cm3 min·' , 6 K min·' from 293 to 673 K, 2 hat 673 K).
In some cases sulfidation is preceded by in situ drying at 673 K (heating rate 6 K min·') in
a He flow. These catalysts will be referred to as Ni(x)NaY (ionex, dry suit). After sulfidation
the flow is switched to the thiophene/H2 flow. Reaction products are analyzed by on line
G.C. analysis. The first sample is taken after 2 minutes reaction time and the following ones
at intervals of 35 minutes.
Due to the presence of acid sites considerable polymerization (unsaturated products) and
cracking (butenes and polymerized products) takes place resulting in a large variety of
products and coke formation. Therefore, thiophene converted to any of the reaction products
including coke is taken into account for the calculation of the reaction rate constant (kHos)
18 Chapter 2
assuming the reaction to be first order in thiophene (I 3). Coke formation which often causes
strong deactivation due to shielding of the metal sulfide phase can severely hamper the
evaluation of the intrinsic catalytic properties. Therefore, we compared the catalysts also on
the basis of their activity at very short run time (2 min).
Structure and composition The coke content of deactivated catalyst samples is analyzed via oxidation in a 0/He
flow (20 % 0 2), and measuring the weight loss by thermogravimetric analysis (TGA) using
a Seteram TG 85-16-18 balance. The products are qualitatively analyzed by in situ mass
spectrometry (Leybold Quadruvac PGAlOO). Because the oxidation of the coke deposits and
the metal sulfide can not be separated, the measured weight loss is corrected for the weight
loss due to oxidation of the nickel sulfide, assuming a composition as determined by the
sulfur analysis.
The number of acid sites present after sulfidation is determined by Temperature
Programmed Desorption (TPD) of ethylamine (14, 15). Ethylamine is adsorbed on the in situ
dried sample (673 K in He flow) until full saturation. After adsorption, first an isothermal
desorption of ethylamine is carried out at 323 K, and then the TPD procedure is started.
During TPD the weight loss is again measured by TGA, while the desorbed products are
identified by mass spectrometry. The physisorbed ethylamine will desorb in the temperature
range between 323 and 600 K, while the ethylamine adsorbed on Bmnsted acid sites only
desorbs after decomposition to NH3 and C2H4 between 650 K and 750 K (14, 15). From the
weight loss at high temperature the amount of ethylamine adsorbed on Bmnsted acid sites
can be calculated. This amount is a good indication for the number ofBmnsted acid sites.
The total sulfur uptake during sulfidation is determined as follows. A sample is dissolved
in aqua regia while carefully heating the mixture. During this process the nickel sulfide is
completely converted to nickel sulphate. Subsequently, the amount of sulphate is determined
by titration with barium perchlorate. Ca2+ ions disturb the titration and must be removed
from the solution by an ion exchanger. Before analysis the catalyst is sulfided using the
same procedures as for the catalytic activity measurements. After sulfidation the sample is
flushed with He at 673 K for 1 h to remove adsorbed H2S and subsequently cooled down
under He. At room temperature the sample is exposed to air and the analysis procedure is
started.
The sulfidation behaviour of the catalysts is studied in more detail by Temperature
Programmed Sulfidation (TPS). A detailed description of this technique has been given
elsewhere (16, 17). A H2SIH/ Ar flow is passed over a catalyst sample loaded in a quartz
tube which is placed in an oven. The H2S concentration in the reactor outlet is measured by
Zeolite supported nickel sulfide catalysts I9
an UV spectrophotometer (at 195 nm). After Hp and H2S are trapped using molsieves and
ZnO respectively the gases are led through a thermal conductivity detector where changes
in the H2 concentration are monitored. A sulfiding mixture of 3.3 % H2S, 28.1 % H2 and
68.6 % Ar with a flow of 40 std cm3 min·1 is used. The measurements are carried out
according to the following procedure: the reactor is flushed with argon in order to remove
air, followed by sulfidation at room temperature for 10 min. Then the reactor temperature
is raised with 6 K min·1 up to 673 K. Here the temperature is kept stable for I hour,
followed by further heating with IO K min· 1 up to 1273 K. 129Xe-NMR is used to study the amount of nickel sulfide located inside the zeolite pore
system. The principle and experimental details of this technique are reported elsewhere (18-
20). To avoid contact with 0 2 and Hp the presulfided samples are transferred into the NMR
tubes using a recirculation type glove box (02 and Hp content lower than 2 ppm). The
samples are evacuated at room temperature to a pressure below 10·4 mbar and stored in a
volumetric adsorption apparatus. Xe is adsorbed on these samples at different Xe pressures
at 303 K. The NMR spectra of the adsorbed Xe are recorded at the same temperature on a
Bruker MSL 400 Fourier transform instrument at 110.7 MHz with pulse excitation (0.5 s
pulse delay) on stationary samples. The number of scans varies between 102 and 105.
To study the amount of nickel phase formed at the exterior of the zeolite particles High
Resolution Electron Microscopy (HREM) is performed on both oxidic and sulfided samples,
using a Philips CM 30 ST electron microscope. The samples are prepared as follows. After
grinding, the Ni containing zeolite particles are suspended in alcohol. A copper grid coated
with a micro grid carbon polymer is loaded with a few droplets of this suspension. Together
with HREM, the transition metal distribution throughout the catalyst particles can be studied
(integrally or segment wise) by means of Energy Dispersive X-ray (EDX) analysis.
Dynamic Oxygen Chemisorption (DOC) measurements are used to determine the relative
nickel sulfide dispersions (21-24). For this purpose catalysts are sulfided in situ following
the same procedures as for the activity measurements. After sulfidation, the catalysts (about
100 mg) are flushed for one hour at 673 Kin He (02 and H20 levels lower than 1 ppm), and
then cooled to 333 K, at which temperature the oxygen chemisorption is performed. At this
temperature the support has no effect on the oxygen chemisorption. According to Bachelier
et al. (21 -23), side reactions (S02 and COS formation) are avoided, and the oxygen is
chemisorbed irreversibly on the sulfide catalyst. Pulses of a 5 % 0 2 in He are injected in the
He carrier gas flow and passed over the catalyst and a TCD. When effluent peaks are
increased to constant size (less than I %difference between two successive peaks) the total
0 2 uptake is calculated.
20 Chapter 2
RESULTS
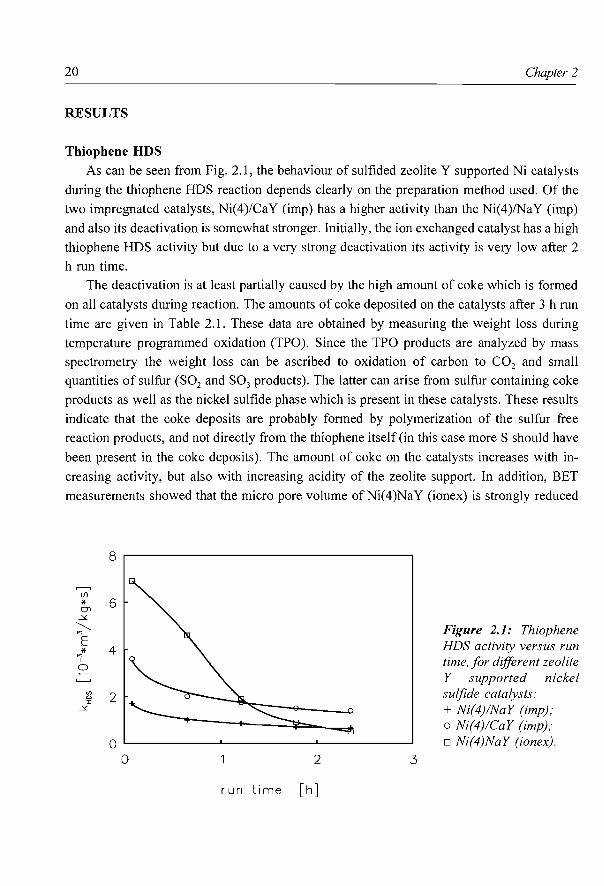
Thiophene HDS As can be seen from Fig. 2.1, the behaviour of sulfided zeolite Y supported Ni catalysts
during the thiophene HDS reaction depends clearly on the preparation method used. Of the
two impregnated catalysts, Ni(4)/CaY (imp) has a higher activity than the Ni(4)/NaY (imp)
and also its deactivation is somewhat stronger. Initially, the ion exchanged catalyst has a high
thiophene HDS activity but due to a very strong deactivation its activity is very low after 2
h run time.
The deactivation is at least partially caused by the high amount of coke which is formed
on all catalysts during reaction. The amounts of coke deposited on the catalysts after 3 h run
time are given in Table 2.1. These data are obtained by measuring the weight loss during
temperature programmed oxidation (TPO). Since the TPO products are analyzed by mass
spectrometry the weight loss can be ascribed to oxidation of carbon to C02 and small
quantities of sulfur (S02 and S03 products). The latter can arise from sulfur containing coke
products as well as the nickel sulfide phase which is present in these catalysts. These results
indicate that the coke deposits are probably formed by polymerization of the sulfur free
reaction products, and not directly from the thiophene itself (in this case more S should have
been present in the coke deposits). The amount of coke on the catalysts increases with in
creasing activity, but also with increasing acidity of the zeolite support. In addition, BET
measurements showed that the micro pore volume ofNi(4)NaY (ionex) is strongly reduced
,........, (f)
* 01 ~
'-----.., E * .., I
0
Vl 0 :I: ~
8
6
4
2
0 0 2
run time [h]
3
Figure 2.1: Thiophene HDS activity versus run time, for different zeolite Y supported nickel sulfide catalysts: + Ni(4)/NaY (imp); o Ni(4)/CaY (imp); o Ni(4)NaY (ionex).
Zeolite supported nickel sulfide catalysts
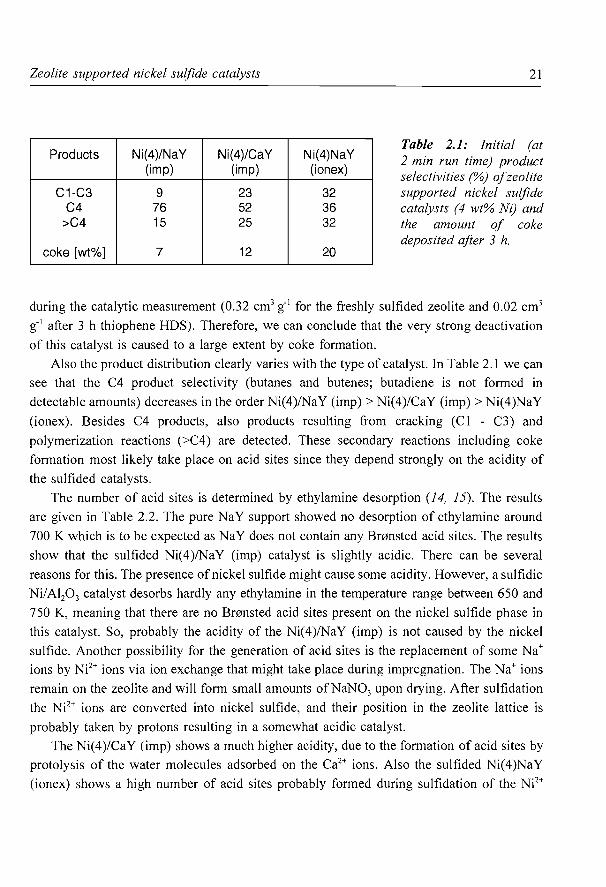
Products Ni(4)/NaY Ni(4)/CaY (imp) (imp)
C1-C3 9 23 C4 76 52
>C4 15 25
coke [wt%] 7 12
Ni(4)1\laY (ionex)
32 36 32
20
21
Table 2.1: Initial (at 2 min run time) product selectivities (%) of zeolite supported nickel sulfide catalysts (4 wt% Ni) and the amount of coke deposited after 3 h.
during the catalytic measurement (0.32 cm3 g·' for the freshly sulfided zeolite and 0.02 cm3
g·' after 3 h thiophene HDS). Therefore, we can conclude that the very strong deactivation
of this catalyst is caused to a large extent by coke formation.
Also the product distribution clearly varies with the type of catalyst. In Table 2.1 we can
see that the C4 product selectivity (butanes and butenes; butadiene is not formed in
detectable amounts) decreases in the order Ni(4)/NaY (imp)> Ni(4)/CaY (imp)> Ni(4)NaY
(ionex). Besides C4 products, also products resulting from cracking (C 1 - C3) and
polymerization reactions (>C4) are detected. These secondary reactions including coke
formation most likely take place on acid sites since they depend strongly on the acidity of
the sulfided catalysts.
The number of acid sites is determined by ethylamine desorption (14, 15). The results
are given in Table 2.2. The pure NaY support showed no desorption of ethylamine around
700 K which is to be expected as NaY does not contain any Br0nsted acid sites. The results
show that the sulfided Ni(4)/NaY (imp) catalyst is slightly acidic. There can be several
reasons for this. The presence of nickel sulfide might cause some acidity. However, a sulfidic
Nil Al20 3 catalyst desorbs hardly any ethyl amine in the temperature range between 650 and
750 K, meaning that there are no Bronsted acid sites present on the nickel sulfide phase in
this catalyst. So, probably the acidity of the Ni(4)/NaY (imp) is not caused by the nickel
sulfide. Another possibility for the generation of acid sites is the replacement of some Na+
ions by N?+ ions via ion exchange that might take place during impregnation. The Na+ ions
remain on the zeolite and will form small amounts ofNaN03 upon drying. After sulfidation
the N?+ ions are converted into nickel sulfide, and their position in the zeolite lattice is
probably taken by protons resulting in a somewhat acidic catalyst.
The Ni( 4 )/CaY (imp) shows a much higher acidity, due to the formation of acid sites by
protolysis of the water molecules adsorbed on the Ca2+ ions. Also the sulfided Ni(4)NaY
(ionex) shows a high number of acid sites probably formed during sulfidation of the N?+
22
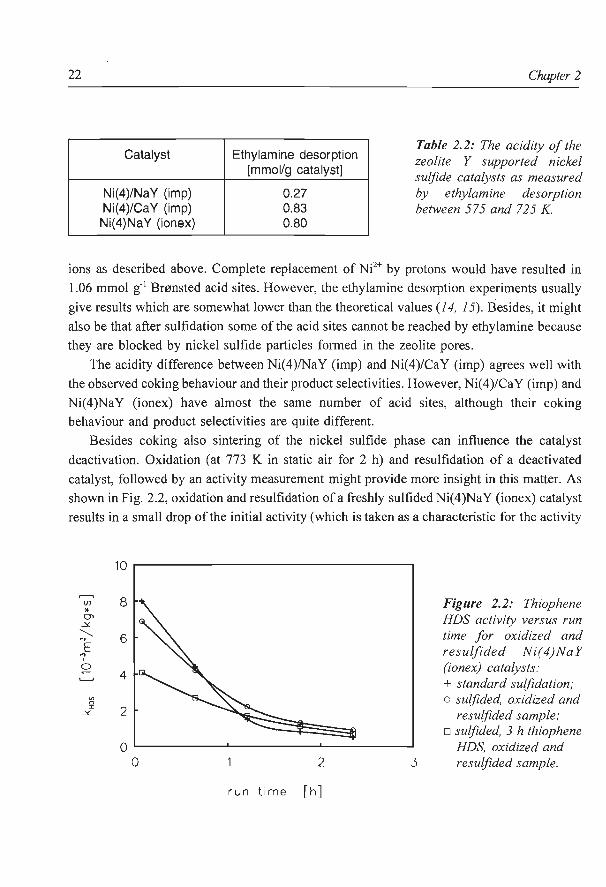
Catalyst
Ni(4)/NaY (imp) Ni(4)/CaY (imp) Ni(4)NaY (ionex)
Ethylamine desorption [mmol/g catalyst]
0.27 0.83 0.80
Chapter 2
Table 2.2: The acidity of the zeolite Y supported nickel sulfide catalysts as measured by ethylamine desorption between 575 and 725 K.
ions as described above. Complete replacement of Ni2+ by protons would have resulted in
1.06 mmol g·' Bmnsted acid sites. However, the ethylamine desorption experiments usually
give results which are somewhat lower than the theoretical values (14, 15). Besides, it might
also be that after sulfidation some of the acid sites cannot be reached by ethylamine because
they are blocked by nickel sulfide particles formed in the zeolite pores.
The acidity difference between Ni(4)/NaY (imp) and Ni(4)/CaY (imp) agrees well with
the observed coking behaviour and their product selectivities. However, Ni( 4 )/CaY (imp) and
Ni(4)NaY (ionex) have almost the same number of acid sites, although their coking
behaviour and product selectivities are quite different.
Besides coking also sintering of the nickel sulfide phase can influence the catalyst
deactivation. Oxidation (at 773 K in static air for 2 h) and resulfidation of a deactivated
catalyst, followed by an activity measurement might provide more insight in this matter. As
shown in Fig. 2.2, oxidation and resulfidation of a freshly sulfided Ni(4)NaY (ionex) catalyst
results in a small drop of the initial activity (which is taken as a characteristic for the activity
8
6
4
2
0 ~--------~----------~--------~ 0 2 3
run time [h]
Figure 2.2: Thiophene HDS activity versus run time for oxidized and resulfided Ni(4)NaY (ionex) catalysts: + standard sulfldation; o sulflded, oxidized and
resulflded sample; o sulflded, 3 h thiophene
HDS, oxidized and resulflded sample.
Zeolite supported nickel sulfide catalysts
.----, (/)
* Q"l ~
> E * .., ' 0
"' 0 :1:
~
20
15
10
5
D D
nickel loading [ wt%]
10 12
23
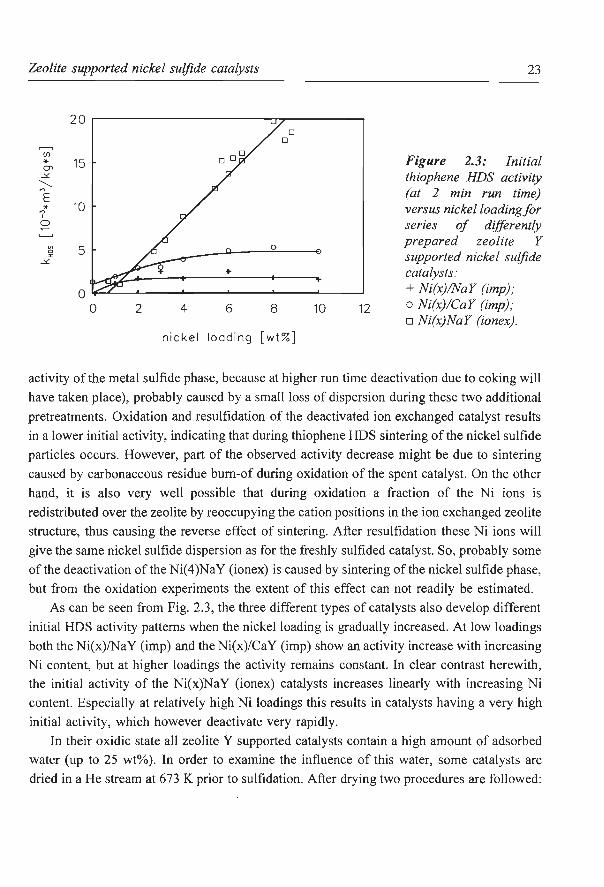
Figure 2.3: Initial thiophene HDS activity (at 2 min run time) versus nickelloadingfor series of differently prepared zeolite Y supported nickel sulfide catalysts: + Ni(x)/NaY (imp); o Ni(x)/CaY (imp); o Ni(x)NaY (ionex).
activity of the metal sulfide phase, because at higher run time deactivation due to coking will
have taken place), probably caused by a small loss of dispersion during these two additional
pretreatments. Oxidation and resulfidation of the deactivated ion exchanged catalyst results
in a lower initial activity, indicating that during thiophene HDS sintering of the nickel sulfide
particles occurs. However, part of the observed activity decrease might be due to sintering
caused by carbonaceous residue bum-of during oxidation of the spent catalyst. On the other
hand, it is also very well possible that during oxidation a fraction of the Ni ions is
redistributed over the zeolite by reoccupying the cation positions in the ion exchanged zeolite
structure, thus causing the reverse effect of sintering. After resulfidation these Ni ions will
give the same nickel sulfide dispersion as for the freshly sulfided catalyst. So, probably some
of the deactivation of the Ni(4)NaY (ionex) is caused by sintering of the nickel sulfide phase,
but from the oxidation experiments the extent of this effect can not readily be estimated.
As can be seen from Fig. 2.3, the three different types of catalysts also develop different
initial HDS activity patterns when the nickel loading is gradually increased. At low loadings
both the Ni(x)/NaY (imp) and the Ni(x)/CaY (imp) show an activity increase with increasing
Ni content, but at higher loadings the activity remains constant. In clear contrast herewith,
the initial activity of the Ni(x)NaY (ionex) catalysts increases linearly with increasing Ni
content. Especially at relatively high Ni loadings this results in catalysts having a very high
initial activity, which however deactivate very rapidly.
In their oxidic state all zeolite Y supported catalysts contain a high amount of adsorbed
water (up to 25 wt%). In order to examine the influence of this water, some catalysts are
dried in a He stream at 673 K prior to sulfidation. After drying two procedures are followed:
24 Chapter 2
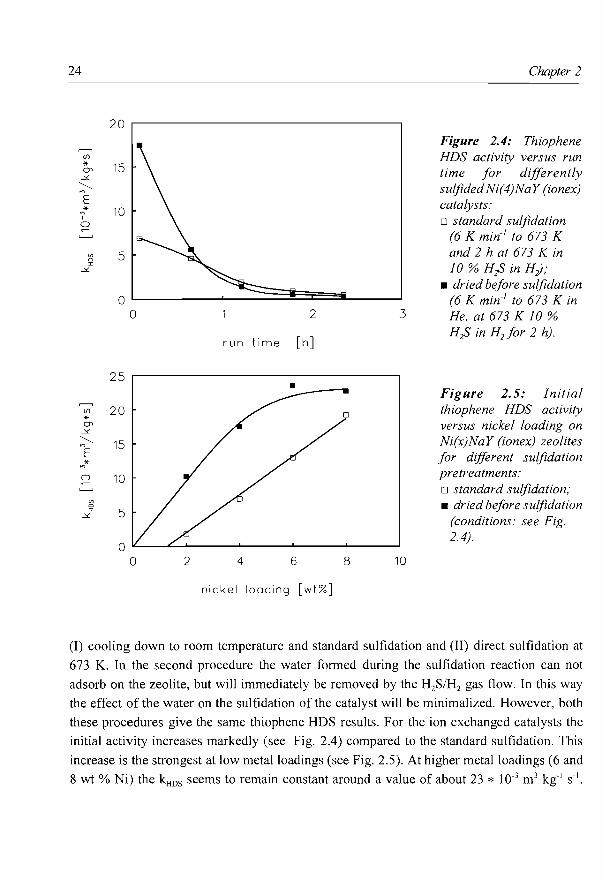
20 Figure 2.4: Thiophene
~
HDS activity versus run (f)
* 15 a> time for differently _;,:_
> sulfided Ni(4)NaY (ionex) E catalysts: * 10 "' I o standard sulfidation 0
(6 K min-' to 673 K V> 5 and 2 h at 67 3 K in 0 r
10% H:zS in H:J; _;,:_
• dried before sulfidation (6 K min-' to 673 Kin
2 3 He, at 673 K 10%
time [h] H:zS in H2 for 2 h).
run
25 Figure 2.5: Initial
~
20 thiophene HDS activity (f)
* a> versus nickel loading on .Y
~ 15 Ni(x)NaY (ionex) zeolites 1 for different sulfidation '7* 0 10 pretreatments:
o standard sulfidation; V> • dried before sulfidation 0 I 5 .Y
(conditions: see Fig. 2.4).
2 4 6 8 10
nickel loading [ wt%]
(I) cooling down to room temperature and standard sulfidation and (II) direct sulfidation at
673 K. In the second procedure the water formed during the sulfidation reaction can not
adsorb on the zeolite, but will immediately be removed by the H2S/H2 gas flow. In this way
the effect of the water on the sulfidation of the catalyst will be minimalized. However, both
these procedures give the same thiophene HDS results. For the ion exchanged catalysts the
initial activity increases markedly (see Fig. 2.4) compared to the standard sulfidation. This
increase is the strongest at low metal loadings (see Fig. 2.5). At higher metal loadings (6 and
8 wt% Ni) the kHos seems to remain constant around a value of about 23 * JQ-3 m3 kg- 1 s- 1•
Zeolite supported nickel sulfide catalysts
Catalyst Ni: S ratio
Ni(4)/NaY (imp) 3: 2.2 Ni(4)/CaY (imp) 3: 2.1 Ni(4)NaY (ionex) 3: 2.1
Ni(4)NaY (ionex, dry sulf) 3: 2.0
25
Table 2.3: Overall sulfur analysis of the zeolite Y supported nickel sulfide catalysts.
Possibly, for these catalysts the reaction rate is influenced by pore diffusion limitations, but
it might also be that the nickel sulfide surface has reached a maximum at these metal
loadings. In the case of the impregnated catalysts the influence of these pretreatments on the
initial activity is far less strong, for Ni(x)/NaY (imp) it is even negligible.
Overall sulfur analysis and TPS
The sulfidation behaviour of the catalysts is analyzed with TPS and overall sulfur
analysis . The results of the latter method are given in Table 2.3. From this we can conclude
that all catalysts sulfide well with Ni3S2 being the most probable nickel sulfide phase. XRD
experiments revealed that the crystallinity of the zeolite support is not changed during
preparation nor during sulfidation.
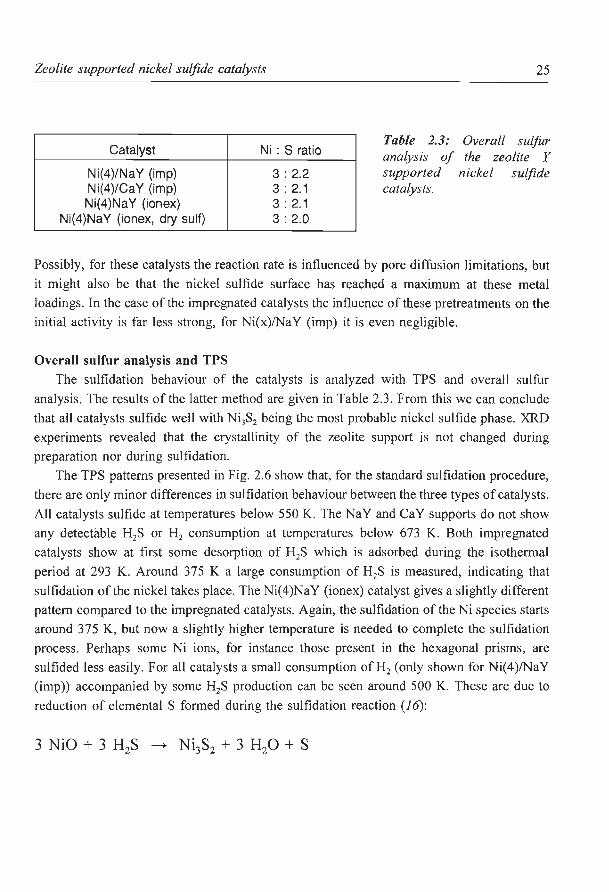
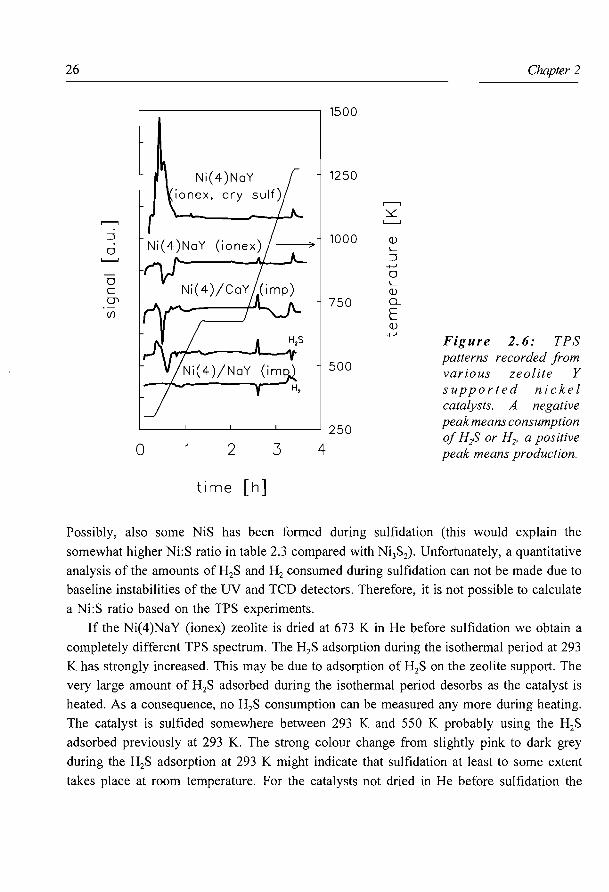
The TPS patterns presented in Fig. 2.6 show that, for the standard sulfidation procedure,
there are only minor differences in sulfidation behaviour between the three types of catalysts.
All catalysts sulfide at temperatures below 550 K. The NaY and CaY supports do not show
any detectable H2S or H2 consumption at temperatures below 673 K. Both impregnated
catalysts show at first some desorption of H2S which is adsorbed during the isothermal
period at 293 K. Around 375 K a large consumption of H2S is measured, indicating that
sulfidation of the nickel takes place. The Ni(4)NaY (ionex) catalyst gives a slightly different
pattern compared to the impregnated catalysts. Again, the sulfidation of the Ni species starts
around 375 K, but now a slightly higher temperature is needed to complete the sulfidation
process . Perhaps some Ni ions, for instance those present in the hexagonal prisms, are
sulfided less easily. For all catalysts a small consumption ofH2 (only shown for Ni(4)/NaY
(imp)) accompanied by some H2S production can be seen around 500 K. These are due to
reduction of elemental S formed during the sulfidation reaction (16):
26
,----.,
::J
0 L-...J
0 c (J"l
(/)
0 2 3
time [h]
1500
1250
750
500
250
4
,----.,
~ L-...J
Q) '--::J
-+--' 0 '--Q) Q_
E Q)
-+--'
Chapter 2
Figure 2. 6: TPS patterns recorded from various zeolite Y supported nickel catalysts. A negative peak means consumption of H;S or H2, a positive peak means production.
Possibly, also some NiS has been formed during sulfidation (this would explain the
somewhat higher Ni:S ratio in table 2.3 compared with Ni3S2). Unfortunately, a quantitative
analysis of the amounts of H2S and H2 consumed during sulfidation can not be made due to
baseline instabilities of the UV and TCD detectors. Therefore, it is not possible to calculate
a Ni:S ratio based on the TPS experiments.
If the Ni(4)NaY (ionex) zeolite is dried at 673 Kin He before sulfidation we obtain a
completely different TPS spectrum. The H2S adsorption during the isothermal period at 293
K has strongly increased. This may be due to adsorption of H2S on the zeolite support. The
very large amount of H2S adsorbed during the isothermal period desorbs as the catalyst is
heated. As a consequence, no H2S consumption can be measured any more during heating.
The catalyst is sulfided somewhere between 293 K and 550 K probably using the H2S
adsorbed previously at 293 K. The strong colour change from slightly pink to dark grey
during the H2S adsorption at 293 K might indicate that sulfidation at least to some extent
takes place at room temperature. For the catalysts not dried in He before sulfidation the
Zeolite supported nickel sulfide catalysts 27
colour change at room temperature is far less strong (both the impregnated catalysts become
slightly more grey than they are in the oxidic phase, while the Ni(4)NaY (ionex) changed
from light green into light grey). The fact that for all catalysts sulfidation is already complete
at 550 K (above this temperature no significant H2S consumption is observed) indicates that
unlike in the case of Ni/ Alp3 there is no strong interaction between the support and the
nickel phase which could hamper sulfidation of nickel species (I 7).
All catalysts except the Ni( 4 )NaY (ion ex, dry sulf) show a H2S production at 810 K,
accompanied by a H2 consumption. The amounts of H2S produced are rather small, about
10 % of all the H2S consumed during sulfidation for the impregnated catalysts, and clearly
less for the ion exchanged catalyst. According to Scheffer et a/. (I 7) this peak is caused by
the NiS to Ni3S2 phase transition. Overall sulfur analysis of the catalysts showed that after
standard sulfidation at 673 K the amount of sulfur present is somewhat larger than required
for quantitative Ni3S2 formation. This points to the presence of both Ni3S2 and NiS.
Around 1250 K all catalysts show small H2S and H2 desorption peaks. At this
temperature the zeolite framework collapses, during which some small amounts of adsorbed
H2S and H2 are released. The Ni(4)/CaY (imp) shows a H2S adsorption between 1000 and
1250 K, caused by the sulfidation of the CaY zeolite.
129Xe-NMR
One of the main questions in the preparation of zeolite supported nickel sulfide catalysts
is whether the sulfide species are located inside or outside the zeolite pores. One possibility
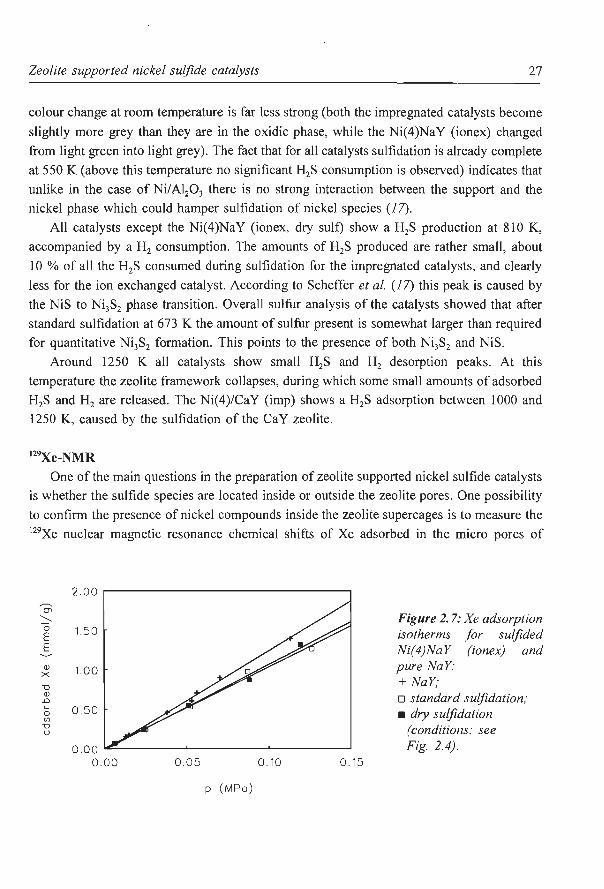
to confirm the presence of nickel compounds inside the zeolite supercages is to measure the 129Xe nuclear magnetic resonance chemical shifts of Xe adsorbed in the micro pores of
2.00 ~
Cf'
........ 0 150 t: t: Q) 1.00 X
"0 Q)
.D '- 0 50 0 rJ)
"0 0
0.00 0.00 0.05 0.10
p (MPa)
0.15
Figure 2. 7: Xe adsorption isotherms for sulfided Ni(4)NaY (ionex) and pure NaY: +NaY; o standard sulfidation; • dry sulfidation
(conditions: see Fig. 2.4).
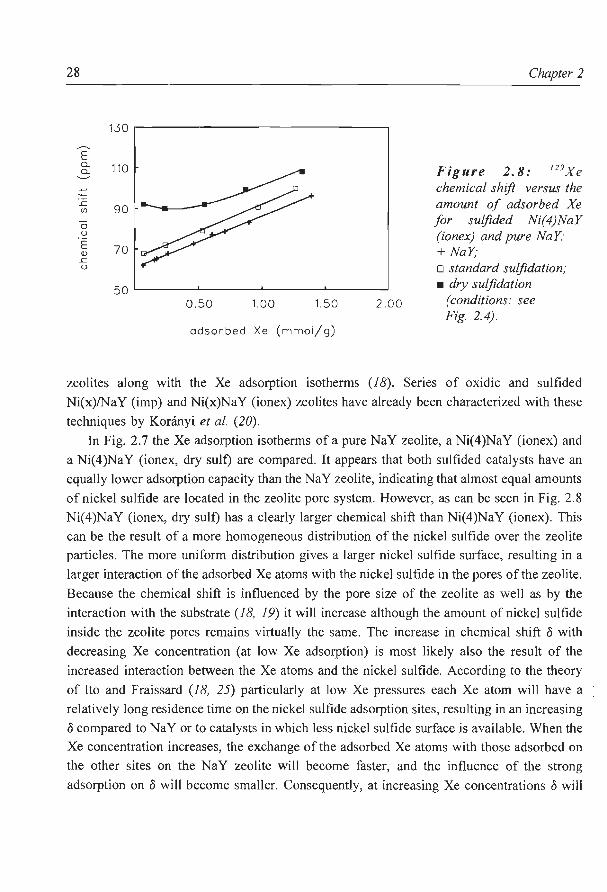
28
130
E Q_
110 Q_
_c 90 (f)
0 u
E 7 0 Q) _c u
50 0.50 1.00 1.50
adsorbed Xe (mmol/g)
2 .00
Chapter 2
Figure 2.8: 129Xe chemical shift versus the amount of adsorbed Xe for sulfided Ni(4)NaY (ionex) and pure NaY· +NaY; o standard sulfidation; • dry sulfidation
(conditions: see Fig 2.4).
zeolites along with the Xe adsorption isotherms (1 8). Series of oxidic and sulfided
Ni(x)/NaY (imp) and Ni(x)NaY (ionex) zeolites have already been characterized with these
techniques by Koninyi et al (20).
In Fig. 2.7 the Xe adsorption isotherms of a pure NaY zeolite, a Ni(4)NaY (ionex) and
a Ni(4)NaY (ionex, dry suit) are compared. It appears that both sulfided catalysts have an
equally lower adsorption capacity than the NaY zeolite, indicating that almost equal amounts
of nickel sulfide are located in the zeolite pore system. However, as can be seen in Fig. 2.8
Ni(4)NaY (ionex, dry suit) has a clearly larger chemical shift than Ni(4)NaY (ionex). This
can be the result of a more homogeneous distribution of the nickel sulfide over the zeolite
particles. The more uniform distribution gives a larger nickel sulfide surface, resulting in a
larger interaction of the adsorbed Xe atoms with the nickel sulfide in the pores of the zeolite.
Because the chemical shift is influenced by the pore size of the zeolite as well as by the
interaction with the substrate (1 8, 1 9) it will increase although the amount of nickel sulfide
inside the zeolite pores remains virtually the same. The increase in chemical shift o with
decreasing Xe concentration (at low Xe adsorption) is most likely also the result of the
increased interaction between the Xe atoms and the nickel sulfide. According to the theory
of Ito and Fraissard (18, 25) particularly at low Xe pressures each Xe atom will have a
relatively long residence time on the nickel sulfide adsorption sites, resulting in an increasing
o compared to NaY or to catalysts in which less nickel sulfide surface is available. When the
Xe concentration increases, the exchange of the adsorbed Xe atoms with those adsorbed on
the other sites on the NaY zeolite will become faster, and the influence of the strong
adsorption on o will become smaller. Consequently, at increasing Xe concentrations o will
Zeolite supported nickel sulfide catalysts 29
at first decrease if there is exchange of strongly adsorbed Xe atoms, and then increase with
the number ofXe-Xe collisions, as can be seen in Fig 2.8 for the Ni(4)NaY (ionex, dry sulf)
sample.
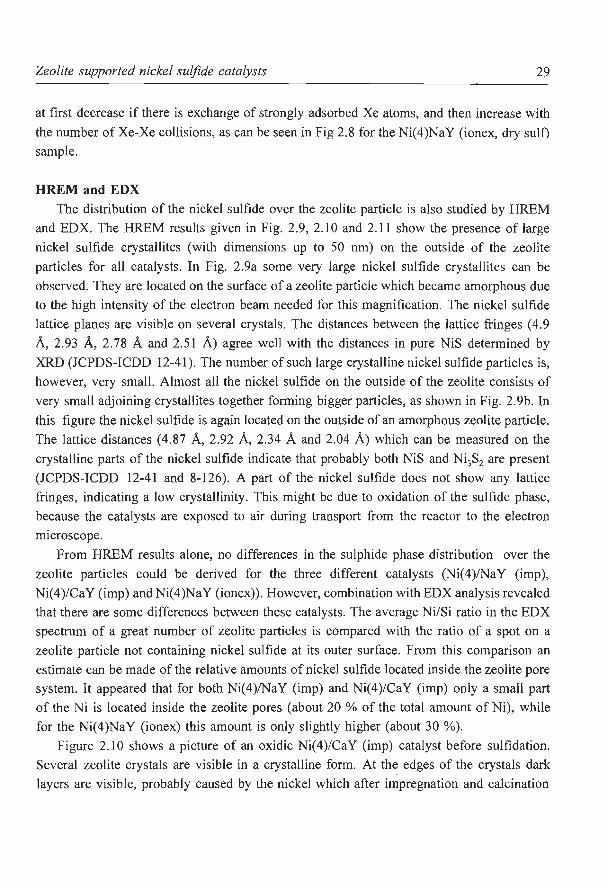
HREM and EDX
The distribution of the nickel sulfide over the zeolite particle is also studied by HREM
and EDX. The HREM results given in Fig. 2.9, 2.10 and 2.11 show the presence of large
nickel sulfide crystallites (with dimensions up to 50 nm) on the outside of the zeolite
particles for all catalysts. In Fig. 2.9a some very large nickel sulfide crystallites can be
observed. They are located on the surface of a zeolite particle which became amorphous due
to the high intensity of the electron beam needed for this magnification. The nickel sulfide
lattice planes are visible on several crystals. The distances between the lattice fringes (4.9
A, 2.93 A, 2.78 A and 2.51 A) agree well with the distances in pure NiS determined by
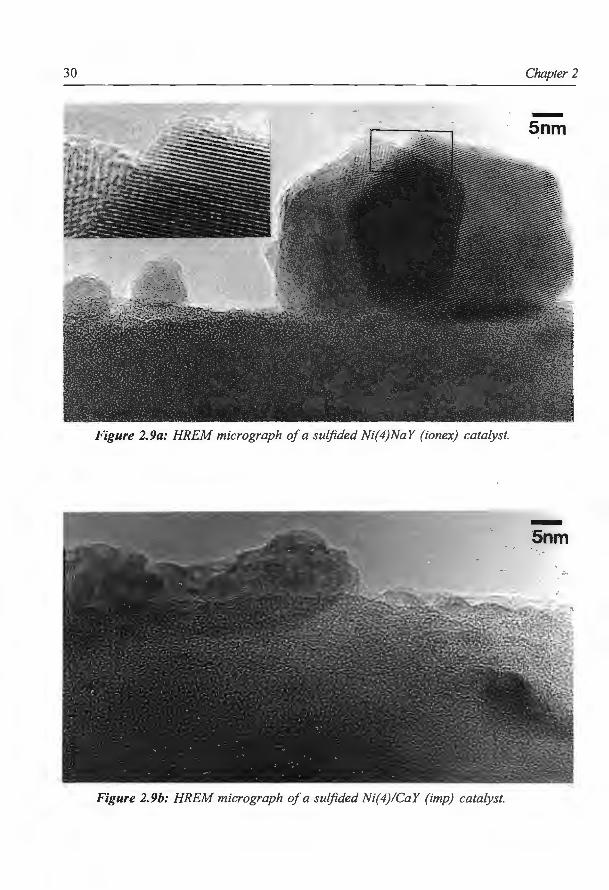
XRD (JCPDS-ICDD 12-41). The number of such large crystalline nickel sulfide particles is,
however, very small. Almost all the nickel sulfide on the outside of the zeolite consists of
very small adjoining crystallites together forming bigger particles, as shown in Fig. 2.9b. In
this figure the nickel sulfide is again located on the outside of an amorphous zeolite particle.
The lattice distances (4.87 A, 2.92 A, 2.34 A and 2.04 A) which can be measured on the
crystalline parts of the nickel sulfide indicate that probably both NiS and Ni3S2 are present
(JCPDS-ICDD 12-41 and 8-126). A part of the nickel sulfide does not show any lattice
fringes, indicating a low crystallinity. This might be due to oxidation of the sulfide phase,
because the catalysts are exposed to air during transport from the reactor to the electron
microscope.
From HREM results alone, no differences in the sulphide phase distribution over the
zeolite particles could be derived for the three different catalysts (Ni(4)/NaY (imp),
Ni(4)/CaY (imp) and Ni(4)NaY (ionex)). However, combination with EDX analysis revealed
that there are some differences between these catalysts. The average Ni/Si ratio in the EDX
spectrum of a great number of zeolite particles is compared with the ratio of a spot on a
zeolite particle not containing nickel sulfide at its outer surface. From this comparison an
estimate can be made of the relative amounts of nickel sulfide located inside the zeolite pore
system. It appeared that for both Ni(4)/NaY (imp) and Ni(4)/CaY (imp) only a small part
of the Ni is located inside the zeolite pores (about 20 % of the total amount of Ni), while
for the Ni(4)NaY (ionex) this amount is only slightly higher (about 30 %).
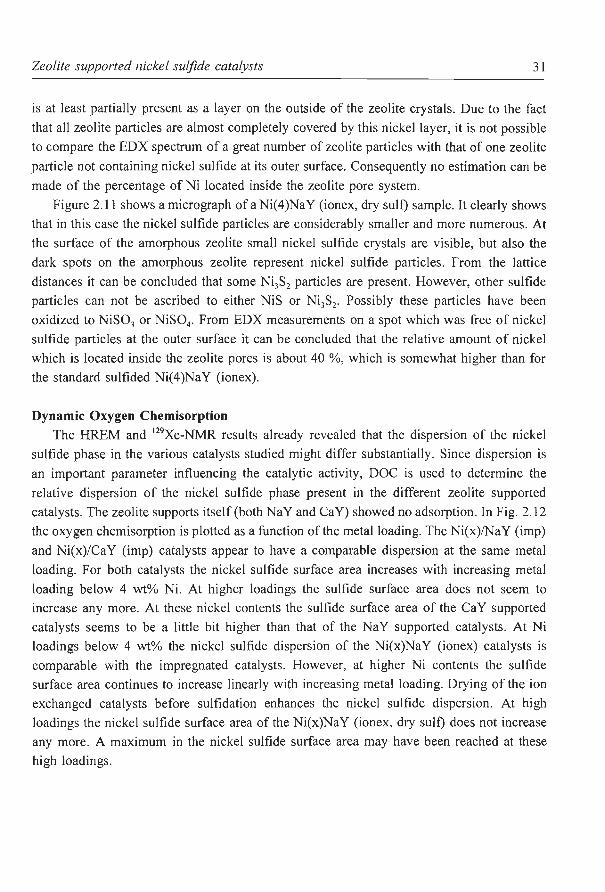
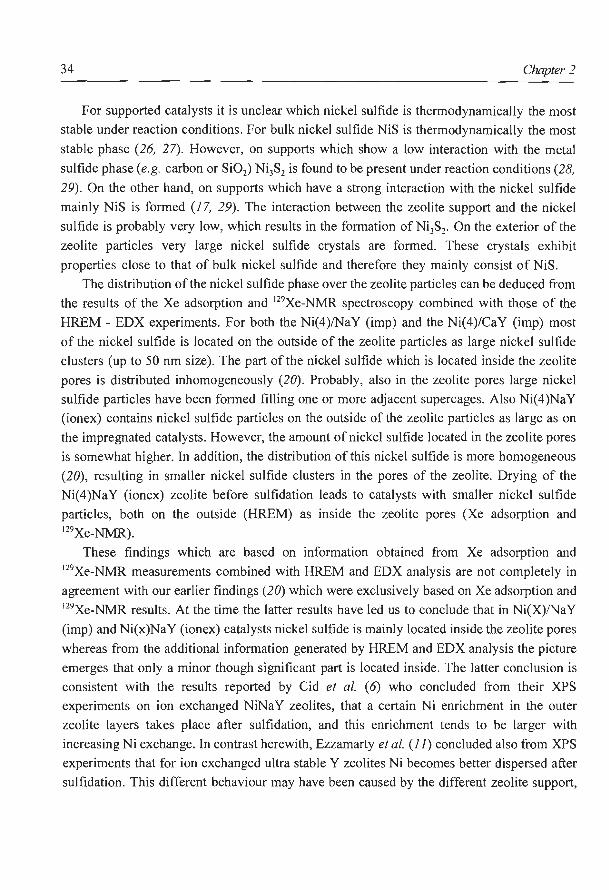
Figure 2.10 shows a picture of an oxidic Ni( 4 )/CaY (imp) catalyst before sulfidation.
Several zeolite crystals are visible in a crystalline form . At the edges of the crystals dark
layers are visible, probably caused by the nickel which after impregnation and calcination
30 Chapter 2
-Snm
Figure 2.9a: HREM micrograph of a sulfided Ni(4)NaY (ionex) catalyst.
·--Snm
Figure 2.9b: HREM micrograph of a sulfided Ni(4)/CaY (imp) catalyst.
Zeolite supported nickel sulfide catalysts 31
is at least partially present as a layer on the outside of the zeolite crystals. Due to the fact
that all zeolite particles are almost completely covered by this nickel layer, it is not possible
to compare the EDX spectrum of a great number of zeolite particles with that of one zeolite
particle not containing nickel sulfide at its outer surface. Consequently no estimation can be
made of the percentage of Ni located inside the zeolite pore system.
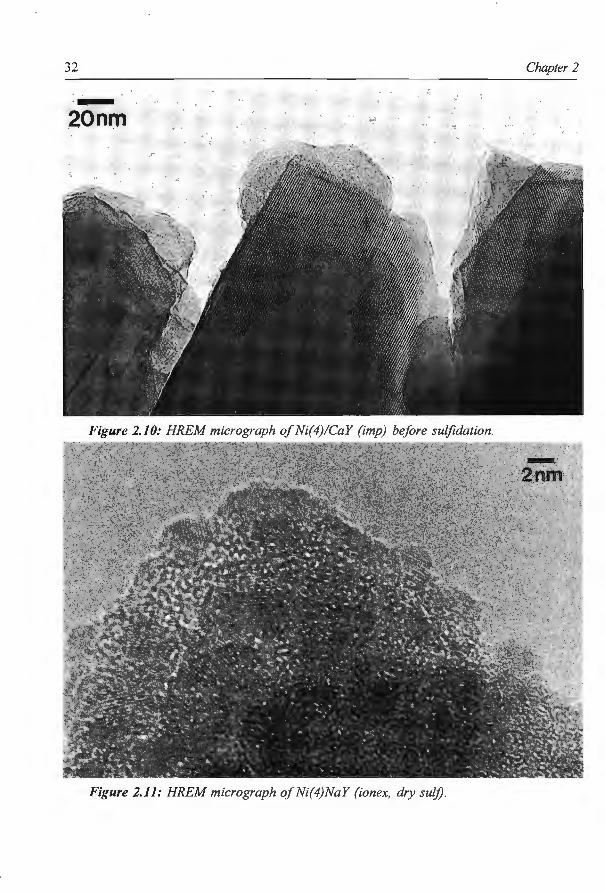
Figure 2.11 shows a micrograph of aNi( 4)Na Y (ion ex, dry suit) sample. It clearly shows
that in this case the nickel sulfide particles are considerably smaller and more numerous. At
the surface of the amorphous zeolite small nickel sulfide crystals are visible, but also the
dark spots on the amorphous zeolite represent nickel sulfide particles. From the lattice
distances it can be concluded that some Ni3S2 particles are present. However, other sulfide
particles can not be ascribed to either NiS or Ni3S2. Possibly these particles have been
oxidized to NiS03 or NiS04 • From EDX measurements on a spot which was free of nickel
sulfide particles at the outer surface it can be concluded that the relative amount of nickel
which is located inside the zeolite pores is about 40 %, which is somewhat higher than for
the standard sulfided Ni(4)NaY (ionex).
Dynamic Oxygen Chemisorption The HREM and 129Xe-NMR results already revealed that the dispersion of the nickel
sulfide phase in the various catalysts studied might differ substantially. Since dispersion is
an important parameter influencing the catalytic activity, DOC is used to determine the
relative dispersion of the nickel sulfide phase present in the different zeolite supported
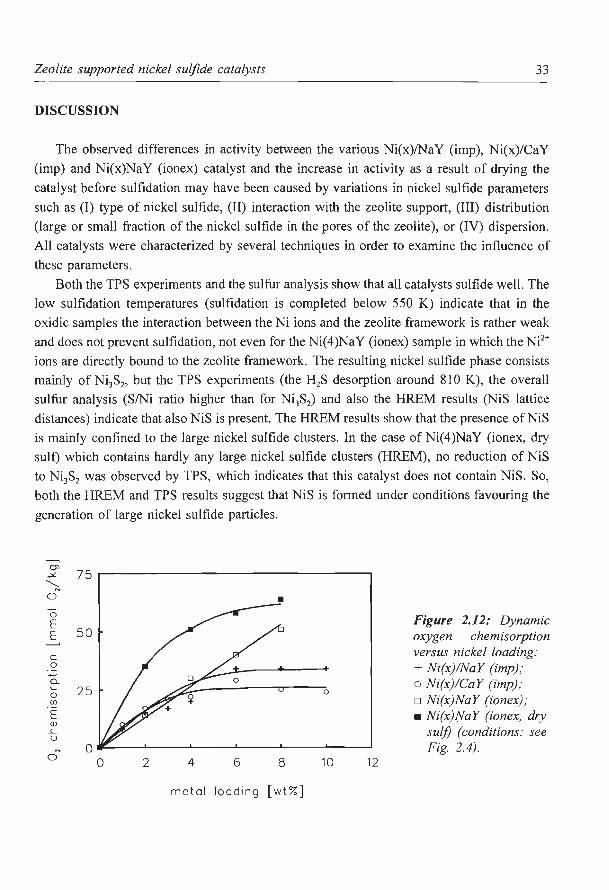
catalysts. The zeolite supports itself (both NaY and CaY) showed no adsorption. In Fig. 2.12
the oxygen chemisorption is plotted as a function of the metal loading. The Ni(x)/Na Y (imp)
and Ni(x)/CaY (imp) catalysts appear to have a comparable dispersion at the same metal
loading. For both catalysts the nickel sulfide surface area increases with increasing metal
loading below 4 wt% Ni. At higher loadings the sulfide surface area does not seem to
increase any more. At these nickel contents the sulfide surface area of the CaY supported
catalysts seems to be a little bit higher than that of the NaY supported catalysts. At Ni
loadings below 4 wt% the nickel sulfide dispersion of the Ni(x)Na Y (ionex) catalysts is
comparable with the impregnated catalysts. However, at higher Ni contents the sulfide
surface area continues to increase linearly with increasing metal loading. Drying of the ion
exchanged catalysts before sulfidation enhances the nickel sulfide dispersion. At high
loadings the nickel sulfide surface area of the Ni(x)Na Y (ion ex, dry suit) does not increase
any more. A maximum in the nickel sulfide surface area may have been reached at these
high loadings .
32 Chapter 2
---20om .. . . . ~ . .. . -
Figure 2.10: HREM micrograph of Ni(4)/CaY (imp) before sulfidation.
Figure 2.11: HREM micrograph of Ni(4)NaY (ionex, dry sulj).
Zeolite supported nickel sulfide catalysts 33
DISCUSSION
The observed differences in activity between the various Ni(x)/NaY (imp), Ni(x)/CaY
(imp) and Ni(x)NaY (ionex) catalyst and the increase in activity as a result of drying the
catalyst before sulfidation may have been caused by variations in nickel sulfide parameters
such as (I) type of nickel sulfide, (II) interaction with the zeolite support, (III) distribution
(large or small fraction of the nickel sulfide in the pores of the zeolite), or (IV) dispersion.
All catalysts were characterized by several techniques in order to examine the influence of
these parameters.
Both the TPS experiments and the sulfur analysis show that all catalysts sulfide well. The
low sulfidation temperatures (sulfidation is completed below 550 K) indicate that in the
oxidic samples the interaction between the Ni ions and the zeolite framework is rather weak
and does not prevent sulfidation, not even for the Ni(4)NaY (ionex) sample in which theN?+
ions are directly bound to the zeolite framework. The resulting nickel sulfide phase consists
mainly of Ni3S2, but the TPS experiments (the H2S desorption around 810 K), the overall
sulfur analysis (S/Ni ratio higher than for Ni3S2) and also the HREM results (NiS lattice
distances) indicate that also NiS is present. The HREM results show that the presence ofNiS
is mainly confined to the large nickel sulfide clusters. In the case of Ni( 4 )NaY (ionex, dry
suit) which contains hardly any large nickel sulfide clusters (HREM), no reduction of NiS
to Ni3S2 was observed by TPS, which indicates that this catalyst does not contain NiS. So,
both the HREM and TPS results suggest that NiS is formed under conditions favouring the
generation of large nickel sulfide particles .
.....--, 0'
75 -"' ~ 0 • 0 Figure 2.12: Dynamic E E 50 oxygen chemisorption
c versus nickel loading: 0 + Ni(x)!NaY (imp); a. o Ni(x)!CaY (imp); '- 25 0 0 o Ni(x)NaY (ionex) ; (/)
E • Ni(x)NaY (ionex, dry Q)
..<:: sulj) (conditions: see <.J
N Fig. 2.4). 0 2 4 6 8 10 12
m etal load ing [ wt %]
34 Chapter 2
For supported catalysts it is unclear which nickel sulfide is thermodynamically the most
stable under reaction conditions. For bulk nickel sulfide NiS is thermodynamically the most
stable phase (26, 27). However, on supports which show a low interaction with the metal
sulfide phase (e.g. carbon or Si02) Ni3S2 is found to be present under reaction conditions (28,
29). On the other hand, on supports which have a strong interaction with the nickel sulfide
mainly NiS is formed (17, 29). The interaction between the zeolite support and the nickel
sulfide is probably very low, which results in the formation of Ni3S2. On the exterior of the
zeolite particles very large nickel sulfide crystals are formed. These crystals exhibit
properties close to that of bulk nickel sulfide and therefore they mainly consist of NiS.
The distribution of the nickel sulfide phase over the zeolite particles can be deduced from
the results of the Xe adsorption and 129Xe-NMR spectroscopy combined with those of the
HREM- EDX experiments. For both the Ni(4)/NaY (imp) and the Ni(4)/CaY (imp) most
of the nickel sulfide is located on the outside of the zeolite particles as large nickel sulfide
clusters (up to 50 nm size). The part of the nickel sulfide which is located inside the zeolite
pores is distributed inhomogeneously (20). Probably, also in the zeolite pores large nickel
sulfide particles have been formed filling one or more adjacent supercages. Also Ni( 4 )NaY
(ionex) contains nickel sulfide particles on the outside of the zeolite particles as large as on
the impregnated catalysts. However, the amount of nickel sulfide located in the zeolite pores
is somewhat higher. In addition, the distribution of this nickel sulfide is more homogeneous
(20), resulting in smaller nickel sulfide clusters in the pores of the zeolite. Drying of the
Ni(4)NaY (ionex) zeolite before sulfidation leads to catalysts with smaller nickel sulfide
particles, both on the outside (HREM) as inside the zeolite pores (Xe adsorption and 129Xe-NMR).
These findings which are based on information obtained from Xe adsorption and 129Xe-NMR measurements combined with HREM and EDX analysis are not completely in
agreement with our earlier findings (20) which were exclusively based on Xe adsorption and 129Xe-NMR results. At the time the latter results have led us to conclude that in N i(X)/NaY
(imp) and Ni(x)NaY (ionex) catalysts nickel sulfide is mainly located inside the zeolite pores
whereas from the additional information generated by HREM and EDX analysis the picture
emerges that only a minor though significant part is located inside. The latter conclusion is
consistent with the results reported by Cid et al. ( 6) who concluded from their XPS
experiments on ion exchanged NiNaY zeolites, that a certain Ni enrichment in the outer
zeolite layers takes place after sulfidation, and this enrichment tends to be larger with
increasing Ni exchange. In contrast herewith, Ezzamarty et al. (11) concluded also from XPS
experiments that for ion exchanged ultra stable Y zeolites Ni becomes better dispersed after
sulfidation. This different behaviour may have been caused by the different zeolite support,
Zeolite supported nickel sulfide catalysts 35
but it is also very well possible that the XPS results are misleading. Formation of large
nickel sulfide particles at the outer surface of the zeolite particles can lead to lower Ni/Si
ratios as measured by XPS, suggesting that the sulfide becomes better dispersed throughout
the zeolite particle.
The reason for the differences in nickel sulfide distribution can be the preparation method
itself. In the non sulfided impregnated catalysts a large fraction of the nickel oxide is already
located on the outside of the zeolite particles (HREM and EDX), although 129Xe-NMR results
suggests that also a fraction of the nickel phase is located inside the zeolite pores (20). Upon
sulfidation this distribution will probably not change considerably, at the most even more
nickel will move to the exterior of the zeolite particles. In the oxidic Ni(x)NaY (ionex) all
nickel will be located inside the zeolite pores. It appears that upon sulfidation at 673 K a
large part of the nickel migrates to the outside. Apparently, the location of the Ni in the
zeolite pores before sulfidation is not decisive for the position of the nickel sulfide after
sulfidation at these conditions. The migration of the nickel upon sulfidation in 10 % H2S/H2
resembles the behaviour observed for reduction under H2 ofNjl+ ions in NiNaY zeolites (30-
32). In this case sintering of the nickel metal on the exterior of the zeolite particles is found
to take place. The physical cause for this phenomenon is the absence of nucleation sites in
the supercages: upon reduction the Ni atoms leave their sodalite cages and traverse the
supercages without encountering any nucleation site until they reach the outer surface (32).
During sulfidation the nickel ions do not react with H2, but with H2S. However, the reason
for the migration of the nickel species to the exterior surface may be the same.
On Ni(4)NaY (ionex, dry sulf) somewhat more nickel sulfide remained in the zeolite
pores, and the sulfide particles are smaller compared to Ni(4)NaY (ionex). Apparently, the
presence of water during the sulfidation process (sulfidation takes place between 350 and 475
K, at which temperatures not ali of the adsorbed water has been removed) improves the
mobility and the sintering of the nickel sulfide. The fact that for the impregnated catalysts
removal of the water does not lead to an increase in activity nor to an increase in dispersion
of the nickel sulfide phase, indicates that for these catalysts the distribution and dispersion
of the sulfide phase is to a large extent determined by the distribution of the oxidic precursor
species, and that the presence of water during the sulfidation process will have not more than
a minor effect.
From the HREM-EDX and the Xe adsorption and 129Xe-NMR results we can conclude
that the distribution of the nickel sulfide phase in Ni(4)/NaY (imp), Ni(4)/CaY (imp) and
Ni(4)NaY (ionex) is almost the same. The 0 2 chemisorption measurements show that also
the nickel sulfide dispersions on these catalysts are comparable. In the ion exchanged zeolites
somewhat more nickel sulfide is present in the zeolite pores and it is possibly more
36 Chapter 2
uniformly distributed. But apparently this difference is too small to manifest itself in the
DOC results.
The nickel sulfide dispersion in Ni(x)NaY (ionex, dry sulf) is clearly higher than in the
other catalysts. This is in good agreement with the HREM results which show smaller nickel
sulfide particles on the exterior of the zeolite particles, and with the 129Xe-NMR results,
which indicate a more uniform distribution of the nickel sulfide particles inside the zeolite
pores. This more homogeneous distribution will probably lead to more and smaller nickel
sulfide particles, and consequently, to a somewhat higher nickel sulfide surface area.
Using 0/Ni ratios calculated from the DOC results, the dispersion of the zeolite
supported nickel sulfide can be compared with the nickel sulfide dispersion in Alz03, Si02
or carbon supported catalysts. However, this should be done with the necessary caution since
0 2 chemisorption is found to be corrosive i.e. not limited to the outer surface (24, 33, 34).
The 0/Ni ratios for the zeolite supported catalysts are low (Ni(4)/NaY (imp), 0.051 ;
Ni(4)/CaY (imp), 0.053; Ni(4)NaY (ionex), 0.081 ; and Ni(4)NaY (ionex, dry sulf), 0.141)
The highest 0/Ni ratio observed is 0.193 for the Ni(2)Na Y (ion ex, dry sui f). This could
indicate that the nickel sulfide dispersion is low compared with their Al20 3 and carbon
supported counterparts for which 0/Ni ratios as high as 0.40 and 0.37 respectively are found
(23, 24). When supported on zeolite Y nickel sulfide is most likely less well dispersed than
when it is supported on Al20 3 and Si02. It is interesting to note that in spite of the lower
nickel sulfide dispersion all zeolite supported catalysts show thiophene HDS activities which
are comparable or higher than those of their carbon of alumina supported counterparts (I 2,
23, 24). This strongly suggests that the nickel sulfide present in the zeolite supported
catalysts has a higher specific activity. The thiophene HDS activity per unit nickel sulfide
surface area seems to be higher for the zeolite supported catalysts than for the Alz03, Si02
or carbon supported catalysts. However, based on the DOC results, a quantitative comparison
of dispersions and specific activities of the various supported nickel sulfide catalysts is not
possible. Gosselink and Stork (35, 36) showed that such a comparison is only allowed within
a narrowly defined group of catalysts, that is catalysts with the same metal sulfide phase and
the same support.
In Fig. 2.13 the initial HDS activity of the zeolite Y supported catalysts is plotted as a
function of the amount of 0 2 chemisorbed, in order to see whether the differences in
catalytic activities can be explained by the differences in dispersion. All catalysts show a
linear increase in activity with increasing nickel sulfide surface. But the slope of the line is
different for the three types of catalysts and increases in the order Ni(x)/NaY (imp) < Ni(x)/Ca Y (imp) << Ni(x)Na Y (ionex). Although the nickel sulfide distribution and
dispersion on both impregnated catalysts are nearly the same, the Ni(x)/Ca Y (imp) are more
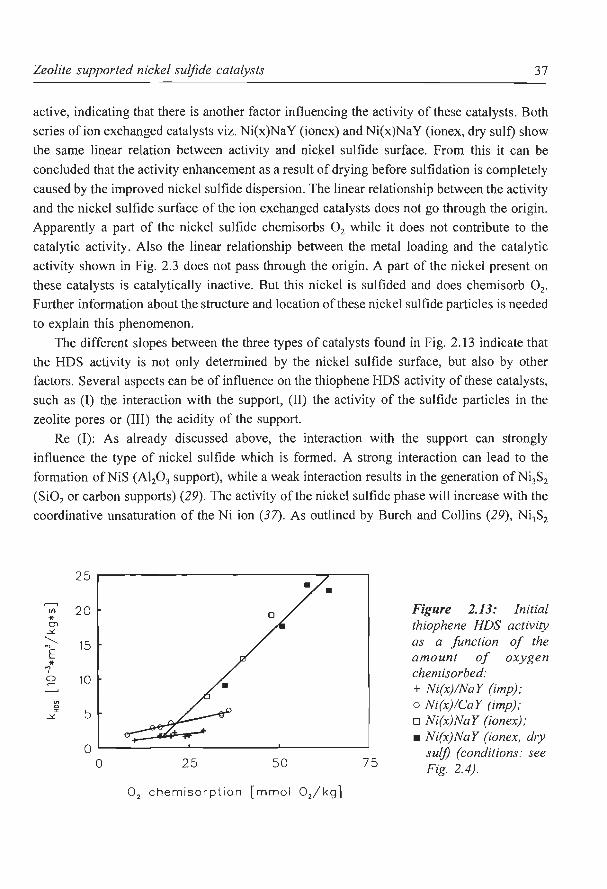
Zeolite supported nickel sulfide catalysts 37
active, indicating that there is another factor influencing the activity of these catalysts. Both
series of ion exchanged catalysts viz. Ni(x)Na Y (ionex) and Ni(x)Na Y (ion ex, dry sulf) show
the same linear relation between activity and nickel sulfide surface. From this it can be
concluded that the activity enhancement as a result of drying before sulfidation is completely
caused by the improved nickel sulfide dispersion. The linear relationship between the activity
and the nickel sulfide surface of the ion exchanged catalysts does not go through the origin.
Apparently a part of the nickel sulfide chemisorbs 0 2 while it does not contribute to the
catalytic activity. Also the linear relationship between the metal loading and the catalytic
activity shown in Fig. 2.3 does not pass through the origin. A part of the nickel present on
these catalysts is catalytically inactive. But this nickel is sulfided and does chemisorb 0 2•
Further information about the structure and location of these nickel sulfide particles is needed
to explain this phenomenon.
The different slopes between the three types of catalysts found in Fig. 2.13 indicate that
the HDS activity is not only determined by the nickel sulfide surface, but also by other
factors . Several aspects can be of influence on the thiophene HDS activity of these catalysts,
such as (I) the interaction with the support, (II) the activity of the sulfide particles in the
zeolite pores or (III) the acidity of the support.
Re (1): As already discussed above, the interaction with the support can strongly
influence the type of nickel sulfide which is formed. A strong interaction can lead to the
formation ofNiS (AIP3 support), while a weak interaction results in the generation ofNi3S2
(Si02 or carbon supports) (29). The activity of the nickel sulfide phase will increase with the
coordinative unsaturation of the Ni ion (37). As outlined by Burch and Collins (29), Ni3S2
~
(/)
* 01 ~
...._____
1 * "' ' 0
"' " "' ~
25
2 0
15
10
5
0 0 25 5 0
0 2 chemisorp ti o n [mmol 0 2 / k g ]
7 5
Figure 2.13: Initial thiophene HDS activity as a function of the amount of oxygen chemisorbed: + Ni(x)/NaY (imp); o Ni(x)/CaY (imp); o Ni(x)NaY (ionex); • Ni(x)NaY (ionex, dry
sulj) (conditions.· see Fig 2.4).
38 Chapter 2
will probably be more active than NiS. Hence, sulfided Nil Al20 3 catalysts show a
significantly lower specific activity than sulfided Ni/Si02 or Ni/C catalysts. Zeolite Y will
probably have a low interaction with the nickel sulfide phase. The nickel sulfide phase
formed consist mainly of Ni3S2, and will therefore show specific thiophene HDS activities
comparable with those of carbon or Si02 supported catalysts.
Re (II): The nickel sulfide particles located in the zeolite pores may have a different
activity than those located on the exterior of the zeolite particles, for instance because of the
increased thiophene concentration in the micro pores. Alternatively, the activity of the nickel
sulfide clusters formed in the zeolite pores is higher due to their very small size. The nickel
sulfide particles in the small zeolite pores will necessarily be very small and therefore highly
disordered. This results in many coordinatively unsaturated sites, which can give a high
specific HDS activity for the nickel sulfide particles located in the zeolite pores.
Re (III): Also the acidity of the zeolite support may influence the thiophene HDS activity
of the nickel sulfide catalysts. Catalysts with Bn:msted acid sites show a higher specific
thiophene HDS activity than their NaY supported counterparts. For a series of sulfided
NiNaY (ionex) catalysts, Cid et al. (6) found the thiophene HDS activity to increase with
increasing Ni loading and acidity. For other zeolite supports (ZSM-5, HNaY, HUSY) an
increase in activity with growing acidity of the zeolite support is found, too (38). The way
in which these acid sites influence the HDS activity is not clear yet. Possibly, the acid sites
improve the adsorption of thiophene on the zeolite, thus increasing the local thiophene
concentration in the vicinity of the nickel sulfide active sites in the zeolite pores, which in
turn results in an increased conversion. It is also possible that the acid sites have a direct
effect on the thiophene HDS reaction itself. In both cases the effect will most likely be
stronger if more nickel sulfide is located in the zeolite pores, because this would facilitate
the combined action of the sulfide and the acid sites. This point will be more extensively
discussed elsewhere (38).
The observation that the catalysts with the highest amount of nickel sulfide in the zeolite
pores (both the Ni(x)NaY (ionex) and the Ni(x)NaY (ionex, dry sulf) series) have very high
initial activities, supports the idea that especially nickel sulfide particles embedded in the
zeolite pores are very active for thiophene HDS. Also the deactivation of these catalysts
indicates that the nickel sulfide in the zeolite pores contributes significantly to the initial
activity. Upon deactivation the pore system is almost completely blocked with coke (as
shown with the BET measurements), while HREM revealed that most of the large nickel
sulfide particles on the exterior can still be reached by thiophene. The low activity of the
deactivated catalysts (see Fig. 2.1 and 2.4) indicates that the contribution ofthe nickel sulfide
on the outside of the zeolite particles is relatively small compared to the contribution of the
Zeolite supported nickel sulfide catalysts 39
nickel sulfide located in the zeolite channels. Thirdly, also the influence of the acid sites
(which are mainly located in the zeolite pores) on the HDS activity and product selectivities
suggests that the nickel sulfide particles in the zeolite pores contribute significantly to the
thiophene HDS activity. However, to distinguish accurately between the activity ofthe nickel
sulfide in the pores or on the exterior, model catalysts with nickel sulfide exclusively in the
zeolite pores or on the outside should be developed.
CONCLUSIONS
Zeolite Y supported nickel sulfide catalysts prepared by impregnation or by ion exchange
show different catalytic behaviour. The catalysts prepared by ion exchange are much more
active for thiophene HDS than those prepared by impregnation, but they also show a
considerably stronger deactivation.
All catalysts can be easily sulfided. Ni3S2 is preferentially formed, but also the formation
of NiS is observed. On both impregnation and ion exchange type of catalysts a large part of
the nickel sulfide phase is located on the outside of the zeolite particles. A smaller part is
distributed through the pores of the zeolite. On the Ni(x)NaY (ionex) catalysts a higher and
more homogeneously distributed amount of nickel sulfide is present in the zeolite pores.
Drying of the Ni(x)NaY (ionex) samples before sulfidation leads to smaller nickel sulfide
particles, both in the zeolite pores and on the outside, resulting in a higher dispersion and
consequently in a higher activity.
The differences in activity between Ni(x)/NaY (imp), Ni(x)/CaY (imp) and Ni(x)NaY
(ionex) are not only caused by differences in nickel sulfide dispersion and distribution. Also
the differences in acidity may have a some influence. A higher acidity might improve the
thiophene HDS activity of the catalysts significantly. Besides, also the very small nickel
sulfide clusters located in the zeolite pores can have a high activity for thiophene HDS.
References
I. Ward, J.W., Stud. surf Sci. Catal. 16 (1983) 587.
2. Marcilly, C., and Frank, J.P., Stud. Surf Sci. Catal. 5 (1980) 93.
3. Cid, R., Villasenor, J. , Orellana, F., Fierro, J.L.G., and Lopez Agudo, A. , Appl. Catal. 18
(1985) 357. 4. Cid, R., Orellana, F., and Lopez Agudo, A., Appl. Catal. 32 (1987) 327. 5. Fierro, J.L.G., Conesa, J.C., and Lopez Agudo, A., J. Catal. 108 (1987) 334.
6. Cid, R. , Fierro, J.L.G., and Lopez Agudo, A., Zeolites 10 (1990) 95.
40 Chapter 2
7. Davidova, N., Kovacheva, P., and Shopov, P., Zeolites 6 (1986) 304.
8. Kovacheva, P., Davidova, N. , and Novakova, J., Zeolites 11 (1991) 54.
9. Laniecki, M., and Zmierczak, W., in 'Zeolite chemistry and catalysis', Jacobs, P.A. et al.
Eds., p. 331. Elsevier, Amsterdam, 1991.
10. Leg1ise, J., Janin, A., Lavalley, J.C., and Cornet, D. , J. Catal. 114 (1988) 388.
11. Ezzamarty, A., Catherine, E., Cornet, D., Hemidy, J.F., Janin, A., Lavalley, J.C., and Leglise,
J., Stud. Surf Sci. Catal. 49 (1989) 1025.
12. Welters, W.J.J., Koninyi, T.l., de Beer, V.H.J., and van Santen, R.A. , in 'New Frontiers in
Catalysis', Guczi, L. eta!. Eds., p. 1931. Elsevier, Amsterdam, 1992.
13. Duchet, J.C., van Oers, E.M., de Beer, V.H.J., and Prins, R., J. Catal. 80 (1983) 386.
14. Parrillo, D.J., Adamo, A.T., Kokotailo, G.T. and Gorte, R.J., Appl. Catal. 67 (1990) 107.
15. Pereira, C., and Gorte, R.J., Appl. Catal. 90 (1992) 145.
16. Scheffer, B., Dekker, N.J.J., Mangnus, P.J., and Moulijn, J.A., J. Catal. 121 (1990) 31.
17. Scheffer, B., Mangnus, P.J., and Moulijn, J.A., J. Catal. 121 (1990) 18.
18. Fraissard, J., and Ito, T., Zeolites 8 (1988) 350.
19. Ito, T., and Fraissard, J., J. Chern. Phys. 76 (1982) 5225.
20. Koninyi, T.l., van de Yen, L.J.M., Welters, W.J.J. , de Haan, J.W., de Beer, V.H.J., and van
Santen, R.A., Cat a!. Lei/. 17 (1993) 105.
21. Bachelier, J., Duchet, J.C., and Cornet, D., J. Phys. Chern. 84 ( 1980) 1925.
22. Bachelier, J., Tilliette, M.J., Duchet, J.C., and Cornet, D., J. Catal. 76 (1982) 300.
23. Bachelier, J., Duchet, J.C. , and Cornet, D., J. Catal. 87 (1984) 283.
24. Bouwens, S.M.A.M., Barthe-Zah.ir, N., de Beer, V.H.J., and Prins, R., J. Catal. 131 (1991)
326.
25. Ito, T., and Fraissard, J., J. Chern. Soc., Farad. Trans. I, 83 ( 1987) 451.
26. Rosenquist, T., J. Iron. Steel. Inst. 176 (1954) 37.
27. Mangnus, P.J., Ph. D. Thesis, University of Amsterdam, The Netherlands, 1989.
28. Louwers, S.P.A., and Prins, R., J. Cat a!. 133 ( 1992) 94.
29. Burch, R., and Collins, A. , J. Catal. 97 (1986) 385.
30. Jacobs, P.A., Linart, J.P., Nijs, H., Uytterhoeven, J.B. and Beyer, H.K., J. Chern. Soc., Farad.
Trans. I, 73, (1977) 1745.
31. Schmidt, F. W., Bein, T., Ohlerich, U., and Jacobs, P.A. , in 'Proc. 6'h Int. Zeolite Con f., 1983' ,
Olson, D. and Bisio, A., Eds., p. 151. Butterworths, Guildford, UK, 1984.
32. Sachtler, W.M.H., Tzou., M.S., and Jiang, H.J., Solid State Ionics 26 ( 1988) 71.
33. Zmierczak, W., MuraliDhar, G., and F.E. Massoth, J. Catal. 77 (1982) 432.
34. Prins, R., de Beer, V.H.J., and Somorjai, G.A., Catal. Rev. -Sci. Eng. 31 (1989) I.
35. Gosselink, J.W. , and Stork, W.H.J. , Bull. Soc. Chirn. Be/g. 96 (1987) 901.
36. Gosselink, J.W., and Stork, W.H.J., Appl. Catal. 32 (1987) 337.
37. Tanaka, K., and Okuhara, T., Catal. Rev. -Sci. Eng. 15 (1977) 249.
38. Chapter 3 of this Thesis.
3 THE INFLUENCE OF ZEOLITE ACIDITY
ON THE THIOPHENE HDS ACTIVITY
ABSTRACT For H(x)NaY supported metal sulfide catalysts the intrinsic catalytic activity (thio
phene hydrodesulfurization (HDS)) and the metal sulfide dispersion (dynamic oxygen
chemisorption) are measured as a function of the acidity of the zeolite support. The
results show that the acidity can have a strong influence on both the conversion and the
product selectivities. An increasing acidity results in an increase of the initial thiophene
HDS activity. The increased activity is not caused by an increase in the metal sulfide
dispersion, but, probably by a synergetic effect occurs the metal sulfide particles and the
acidic zeolite support. The increase in initial thiophene HDS activity with increasing
support acidity is also observed for Co, Ni and Mo sulfide catalysts prepared by impreg
nation using various zeolite supports (ZSM-5, Y, USY). The higher activity may be
caused by an increase in thiophene adsorption in the zeolite pores, or by a direct effect
of H. on the thiophene HDS reaction. Additionally, the acidic supports themselves also
show a considerable initial HDS activity, indicating that the acid sites are able to
desulfurize thiophene at reaction conditions.
41
42 Chapter 3
INTRODUCTION
Hydrocracking is one of the major catalytic processes to convert residual feedstocks
into distillate products. Modem hydrocracking catalysts often consist of a combination of
a sulfidic Ni-Mo or Ni-W phase and an acidic zeolite (1, 2). Therefore zeolite supported
metal sulfide catalysts have been the subject of increasing research in recent years (3-14) .
Fierro et al. (3-7) used several methods to prepare zeolite supported transition metal
sulfide catalysts. Catalysts prepared via impregnation with ammonium heptamolybdate
(AHM) on Y zeolites showed loss of crystallinity and catalytic activity for the
hydrodesulfurization (HDS) of thiophene with increasing calcination temperature.
Addition of Co (via ion exchange or impregnation) to zeolite supported Mo catalysts
resulted in a higher stability of the zeolite structure. For these Co-Mo catalysts a small
synergetic effect was observed (3). Ion exchanged NiNaY catalysts showed an increase
in thiophene HDS and cracking activity with increasing nickel loading (5). Kovacheva et
al. (8) investigated zeolite Y supported Co, Ni and Mo sulfide catalysts. They found that
efficient thiophene HDS catalysts could not only be obtained by adding a combination of
sulfides (e.g. Co and Mo sulfide) to the zeolite support, but also via addition of a single
sulfide (e.g. Co or Ni sulfide). Laniecki and Zmierczak (9, 10) prepared catalysts via gas
phase deposition of Mo(C0)6 on Y type zeolites. These catalysts appeared to be more
active for thiophene HDS than those prepared via impregnation with AHM. Protonated
supports, due to the presence of strong Br0nsted acid sites, cause fast deactivation and
coking of the catalysts during the hydrodesulfurization of thiophene.
In the above studies several zeolite supported metal sulfide catalysts (various
preparation methods, metal sulfides and zeolite supports) are characterized and tested on
their catalytic properties. For the latter usually the thiophene HDS reaction is used . Often
Br0nsted acid sites are present on the zeolite supports. On these acid sites high amounts
of coke can be formed, resulting in a strong deactivation due to shielding of the metal
sulfide phase by coke. Especially if the catalytic activities are compared at longer run
time (steady state activity), it is concluded that Bmnsted acidity has a negative effect on
the thiophene HDS activity (3, 9). Also on silica-alumina supports the presence of acid
sites was found to have a negative influence on the thiophene HDS activity (15). This
negative influence is mainly caused by the coke formation. If we want to compare the
intrinsic catalytic properties of the metal sulfide phase activities measured at very short
run time have to be used, at which moment the influence of coke formation is still very
small. Thus, in earlier work (1 4) it was concluded, based on measurements of the initial
thiophene HDS activity (after 2 min run time), that a higher acidity of the support might
The influence of zeolite acidity on the HDS activity 43
just as well improve the HDS activity of zeolite Y supported nickel sulfide catalysts.
In the present study the question whether or not the acid sites can improve the HDS
activity is examined further. Therefore, for HNaY supported nickel sulfide catalysts the
intrinsic catalytic activity and the nickel sulfide dispersion (as characterized by Dynamic
Oxygen Chemisorption (DOC)) are measured as a function of the acidity of the zeolite
support. Additionally, Co, Ni and Mo sulfide catalysts prepared by impregnation using
various zeolite supports with different acidities are tested on their thiophene HDS activity.
EXPERIMENTAL
Catalyst preparation
A CaY zeolite (C~5Na4(Al02)54(Si02) 138) is prepared from NaY (PQ, CBV -100,
Na5iA102) 5iSi02) 138) by repeated ion exchange with CaC12 aqueous solutions.
NHix)Na Y zeolites (x is the percentage of Na exchanged by NH4 +) are prepared via ion
exchange of the NaY zeolite with aqueous solutions of NH4N03 of appropriate concentra
tion. A NaZSM-5 zeolite is prepared from a HZSM-5 zeolite (Exxon Chemical AT281-C,
Si/Al = 40) by repeated ion exchange with NaCl aqueous solutions. The metal contents
of these zeolites after ion exchange are determined using atomic adsorption spectroscopy
(AAS).
Ni, Co and Mo catalysts supported on NaY, CaY, NaZSM-5, HZSM-5 and also
stabilized Y (USY, Katalistics, Si/Al = 5.6) are prepared by pore volume impregnation
with aqueous solutions ofNiC12, CoC12 and AHM, respectively. All catalysts contain 0.75
mmol metal per gram of catalyst (4.0, 4.0 and 6.5 wt % of Ni, Co and Mo resp.),
calculated on the basis of the water-free zeolite. A series of Ni/H(x)NaY catalysts
(Ni/H(O)NaY is the same catalyst as Ni/NaY) is prepared by impregnation of the
NHix)Na Y supports with a NiC12 solution of appropriate concentration. After impregna
tion, the samples are dried in air overnight at 383 K, and subsequently calcined at 673 K
for 2 h. During this treatment the NH4(x)NaY zeolites are converted into H(x)NaY. All
the Ni/H(x)NaY catalysts contain 4 wt % Ni (calculated on the basis of the water-free
zeolite).
A series of Mo/H(x)NaY catalysts is prepared by gas phase adsorption of Mo(C0)6
on the zeolite supports. Prior to the adsorption the NHix)NaY zeolite is activated for 2
h at 673 K in a He flow, during which the zeolite is converted into H(x)NaY. After
cooling to 333 K the zeolites are saturated with molybdenum hexacarbonyl vapour
passing through the support in a He stream. This procedure provided full saturation of the
zeolite with Mo(C0)6, leading to a concentration of about 2 Mo(C0)6 per supercage
44 Chapter 3
(about 11 wt% Mo). After saturation the samples are cooled to room temperature, and
subsequently exposed to air. All samples are stored in a desiccator over a saturated CaCI2
solution.
Catalytic activity Thiophene HDS activity measurements are carried out in a micro flow reactor under
standard conditions (673 K, 1 atm pressure, 4.0 vol% thiophene in H2, 50 std cm3 min.1) .
Catalyst samples of 0.25 g (particle size 0.125-0.425 mm) are sulfided in situ using a gas
mixture of 10 % H2S in H2 (60 std cm3 min·' , 6 K min·' from 293 to 673 K, 2 h at
673 K). After sulfidation the flow is switched to the thiophene/H2 flow. Reaction products
are analyzed by on line G.C. analysis (HP 5890, Chrompack CP Sil 5 CB Capillary
Column). The first sample is taken after 2 min reaction time and the following ones at
intervals of 35 minutes.
Due to the presence of acid sites considerable polymerization (of unsaturated
products) and cracking (of butenes and polymerized products) takes place resulting in a
large variety of products and coke formation. Therefore, thiophene converted to any of
the reaction products including coke is included in the calculation of the reaction rate
constant (kHos) assuming the reaction to be first order in thiophene (1 6).
Coke formation which often causes strong deactivation due to shielding of the metal
sulfide phase can severely hamper the evaluation of the intrinsic catalytic properties.
Therefore, the catalysts are mainly compared on the basis of their activity at very short
run time (2 min). This initial thiophene HDS activity is assumed to be representative for
the intrinsic catalytic properties of the catalysts. Due to the sometimes very strong
deactivation at short run times, the reproducibility of the initial thiophene HDS activity
is less than for steady state activities, but still quite sufficient to compare the intrinsic
activities of catalysts with each other (the initial HDS activity is reproducible within
10 %).
Dynamic Oxygen Chemisorption
DOC measurements (17-20) are used to determine the relative nickel sulfide
dispersions for a series of Ni/H(x)Na Y catalysts. For this purpose catalysts are sulfided
in situ following the same procedure as for the activity measurements. After sulfidation,
the catalysts are flushed for one hour at 673 K in He (02 and H20 free to levels lower
than 1 ppm), and then cooled to 333 K, at which temperature the oxygen chemisorption
is performed. At this temperature the support does not adsorb oxygen. According to
Bachelier eta!. (17-19), side reactions (S02 and COS formation) are avoided, and the
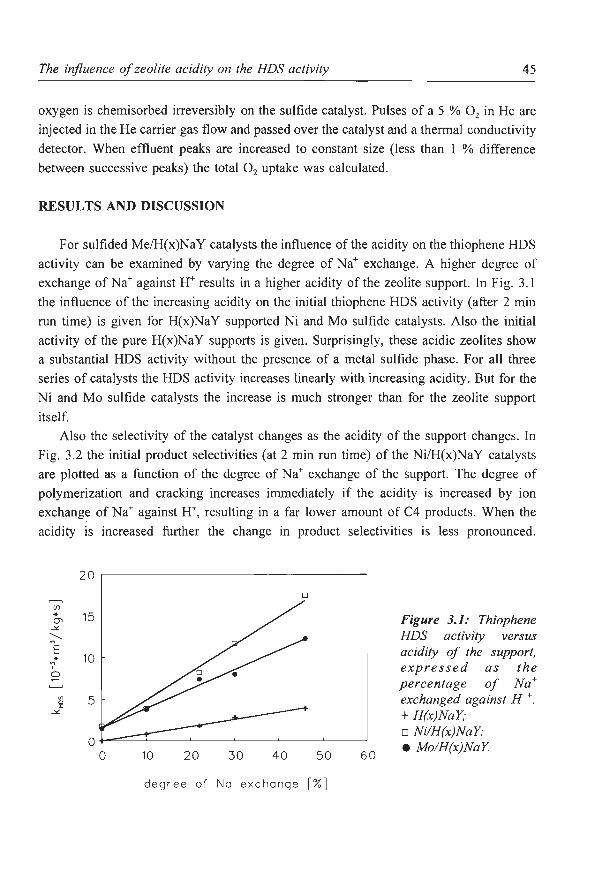
The influence of zeolite acidity on the HDS activity 45
oxygen is chemisorbed irreversibly on the sulfide catalyst. Pulses of a 5 % 0 2 in He are
injected in the He carrier gas flow and passed over the catalyst and a thermal conductivity
detector. When effluent peaks are increased to constant size (less than 1 % difference
between successive peaks) the total 0 2 uptake was calculated.
RESULTS AND DISCUSSION
For sulfided Me/H(x)NaY catalysts the influence of the acidity on the thiophene HDS
activity can be examined by varying the degree of Na+ exchange. A higher degree of
exchange of Na+ against H+ results in a higher acidity of the zeolite support. In Fig. 3.1
the influence of the increasing acidity on the initial thiophene HDS activity (after 2 min
run time) is given for H(x)NaY supported Ni and Mo sulfide catalysts. Also the initial
activity of the pure H(x)Na Y supports is given. Surprisingly, these acidic zeolites show
a substantial HDS activity without the presence of a metal sulfide phase. For all three
series of catalysts the HDS activity increases linearly with increasing acidity . But for the
Ni and Mo sulfide catalysts the increase is much stronger than for the zeolite support
itself. Also the selectivity of the catalyst changes as the acidity of the support changes. In
Fig. 3.2 the initial product selectivities (at 2 min run time) of the Ni/H(x)NaY catalysts
are plotted as a function of the degree of Na+ exchange of the support. The degree of
polymerization and cracking increases immediately if the acidity is increased by ion
exchange of Na+ against H+, resulting in a far lower amount of C4 products. When the
acidity is increased further the change in product selectivities is less pronounced.
,........, (f)
* 01 ~
'---"' E * ..., I
0
"' 0 J: ~
2 0
D
15
10
5
50
degree of No exchange [%]
6 0
Figure 3.1: Thiophene HDS activity versus acidity of the support, expressed as the percentage of Na+ exchanged against H +: + H(x)NaY; o Ni!H(x)NaY; • Mo!H(x)NaY.
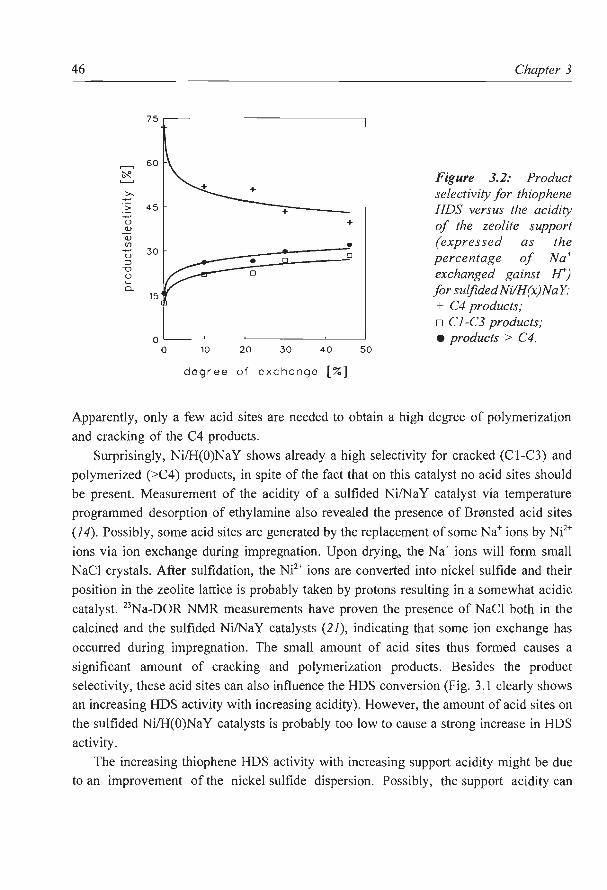
46
75
..--.. 60 ~
>. ·-.::: 45
u ~ Cl) (/) ~ 30 u ::l
-o 0 '-0..
15
0 0 10
degr e e
+
20 30
of exchange
+
• 0
40 50
[%]
Chapter 3
Figure 3.2: Product selectivity for thiophene HDS versus the acidity of the zeolite support (expressed as the percentage of Na+ exchanged gains! F) for sulfided Ni/H (x)Na Y: + C4 products; o CJ-C3 products; • products > C4.
Apparently, only a few acid sites are needed to obtain a high degree of polymerization
and cracking of the C4 products.
Surprisingly, Ni/H(O)NaY shows already a high selectivity for cracked (Cl-C3) and
polymerized (>C4) products, in spite of the fact that on this catalyst no acid sites should
be present. Measurement of the acidity of a sulfided Ni/Na Y catalyst via temperature
programmed desorption of ethylamine also revealed the presence of Bmnsted acid sites
(14). Possibly, some acid sites are generated by the replacement of some Na+ ions by N?+
ions via ion exchange during impregnation. Upon drying, the Na+ ions will form small
NaCI crystals. After sulfidation, the Ni2+ ions are converted into nickel sulfide and their
position in the zeolite lattice is probably taken by protons resulting in a somewhat acidic
catalyst. 23Na-DOR NMR measurements have proven the presence of NaCl both in the
calcined and the sulfided Ni/NaY catalysts (21), indicating that some ion exchange has
occurred during impregnation. The small amount of acid sites thus formed causes a
significant amount of cracking and polymerization products. Besides the product
selectivity, these acid sites can also influence the HDS conversion (Fig. 3.1 clearly shows
an increasing HDS activity with increasing acidity). However, the amount of acid sites on
the sulfided Ni/H(O)Na Y catalysts is probably too low to cause a strong increase in HDS
activity.
The increasing thiophene HDS activity with increasing support acidity might be due
to an improvement of the nickel sulfide dispersion. Possibly, the support acidity can
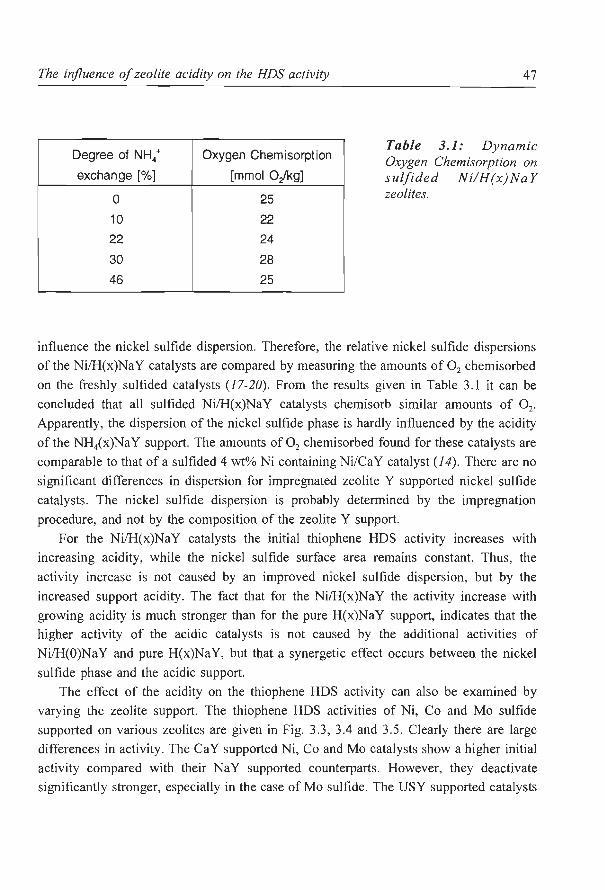
The irifluence of zeolite acidity on the HDS activity
Degree of NH4+ Oxygen Chemisorption
exchange [%) [mmol O)kg]
0 25
10 22
22 24
30 28
46 25
47
Table 3.1: Dynamic Oxygen Chemisorption on sulfided Ni/H(x)Na Y zeolites.
influence the nickel sulfide dispersion. Therefore, the relative nickel sulfide dispersions
of the Ni/H(x)Na Y catalysts are compared by measuring the amounts of 0 2 chemisorbed
on the freshly sulfided catalysts (1 7-20). From the results given in Table 3.1 it can be
concluded that all sulfided Ni/H(x)NaY catalysts chemisorb similar amounts of 0 2 .
Apparently, the dispersion of the nickel sulfide phase is hardly influenced by the acidity
of the NHix)Na Y support. The amounts of 0 2 chemisorbed found for these catalysts are
comparable to that of a sulfided 4 wt% Ni containing Ni/Ca Y catalyst (14). There are no
significant differences in dispersion for impregnated zeolite Y supported nickel sulfide
catalysts. The nickel sulfide dispersion is probably determined by the impregnation
procedure, and not by the composition of the zeolite Y support.
For the Ni/H(x)Na Y catalysts the initial thiophene HDS activity increases with
increasing acidity, while the nickel sulfide surface area remains constant. Thus, the
activity increase is not caused by an improved nickel sulfide dispersion, but by the
increased support acidity. The fact that for the Ni/H(x)NaY the activity increase with
growing acidity is much stronger than for the pure H(x)NaY support, indicates that the
higher activity of the acidic catalysts is not caused by the additional activities of
Ni/H(O)NaY and pure H(x)NaY, but that a synergetic effect occurs between the nickel
sulfide phase and the acidic support.
The effect of the acidity on the thiophene HDS activity can also be examined by
varying the zeolite support. The thiophene HDS activities of Ni, Co and Mo sulfide
supported on various zeolites are given in Fig. 3.3, 3.4 and 3.5. Clearly there are large
differences in activity. The CaY supported Ni, Co and Mo catalysts show a higher initial
activity compared with their NaY supported counterparts. However, they deactivate
significantly stronger, especially in the case of Mo sulfide. The USY supported catalysts
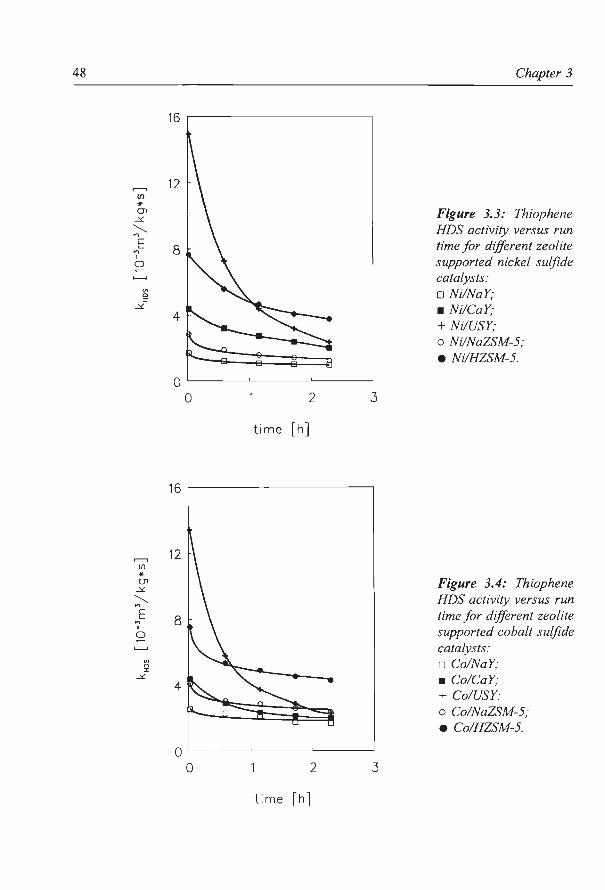
48
V1 0 I
_::f.
.----, (/)
* en _::f.
.......... .... E .... I
0
V1 0 I
_::f.
12
8
4
0 ~----~------~------~ 0 2
time [h]
12
8
4
0 ~----~------~------~ 0 2 3
time [h]
Chapter 3
Figure 3.3: Thiophene HDS activity versus run time for different zeolite supported nickel sulfide catalysts: o Ni/NaY; • Ni/CaY; + Nt!USY; o Ni/NaZSM-5; e Ni/HZSM-5.
Figure 3.4: Thiophene HDS activity versus run time for different zeolite supported cobalt sulfide catalysts: o Co/NaY; • Co/CaY; + Co/ USY; o Co/NaZSM-5; e Co/HZSM-5.
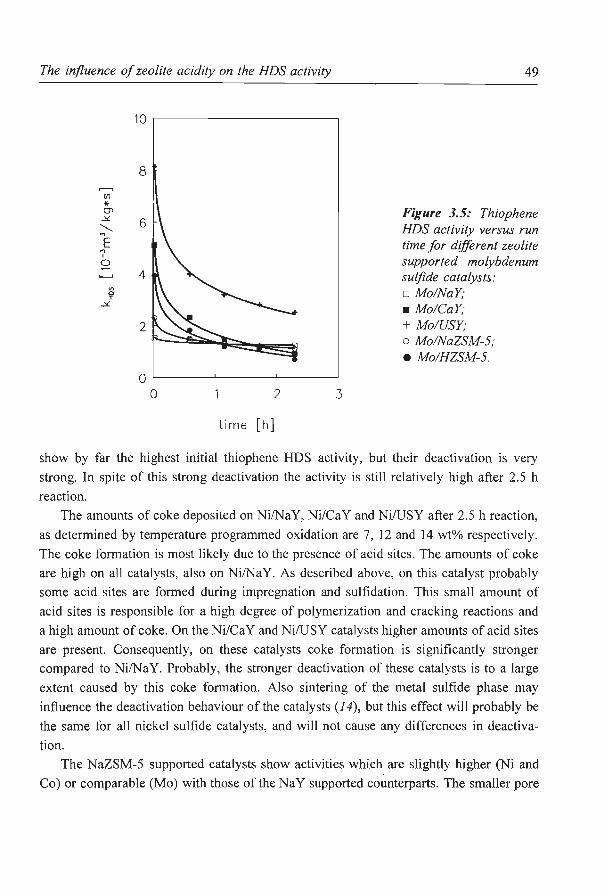
The influence of zeolite acidity on the HDS activity
"' 0 I
.;.:.
8
6
4
2
0'--------'-------'-----____.J
0 2 3
time [h]
49
Figure 3.5: Thiophene HDS activity versus run time for different zeolite supported molybdenum sulfide catalysts: o Mo/NaY; • Mo/CaY; + Mo!USY; o Mo/NaZSM-5; e Mo/HZSM-5.
show by far the highest initial thiophene HDS activity, but their deactivation is very
strong. In spite of this strong deactivation the activity is still relatively high after 2.5 h
reaction.
The amounts of coke deposited on Ni/NaY, Ni/CaY and Ni/USY after 2.5 h reaction,
as determined by temperature programmed oxidation are 7, 12 and 14 wt% respectively.
The coke formation is most likely due to the presence of acid sites. The amounts of coke
are high on all catalysts, also on Ni/NaY. As described above, on this catalyst probably
some acid sites are formed during impregnation and sulfidation. This small amount of
acid sites is responsible for a high degree of polymerization and cracking reactions and
a high amount of coke. On the Ni/Ca Y and Ni/USY catalysts higher amounts of acid sites
are present. Consequently, on these catalysts coke formation is significantly stronger
compared toNi/NaY. Probably, the stronger deactivation of these catalysts is to a large
extent caused by this coke formation. Also sintering of the metal sulfide phase may
influence the deactivation behaviour of the catalysts (1 4), but this effect will probably be
the same for all nickel sulfide catalysts, and will not cause any differences in deactiva
tion.
The NaZSM-5 supported catalysts show activities which are slightly higher (Ni and
Co) or comparable (Mo) with those of the NaY supported counterparts. The smaller pore
50 Chapter 3
size of the ZSM-5 zeolite compared to the NaY zeolite (5.6 vs. 7.4 A) apparently has no
negative effect on the thiophene HDS activity. The higher activity of the NaZSM-5
supported catalysts may be the result of a somewhat higher metal sulfide dispersion on
these catalysts. When HZSM-5 is used as a support the initial activity increases signifi
cantly. Also these catalysts show a considerable deactivation, which again may have been
caused by coke formation. For ZSM-5 zeolites, studies have shown that due to steric
constrains coke formation is relatively low compared to Y zeolites (22-24). This is
probably the reason why the deactivation on the HZSM-5 supported Ni and Co sulfide
catalysts is relatively low compared to for instance the USY type catalysts. The overall
picture emerging from Fig. 3.3, 3.4 and 3.5 is that the highest initial activities are
obtained by combining the metal sulfides with acidic zeolites. This supports the conclu
sion, that besides a negative effect (coking), the zeolite acidity also has a significant
positive effect on the thiophene HDS activity.
Although the activity trends described above are generally the same for all three metal
sulfide catalysts, there are also some small differences in catalytic behaviour between the
different metal sulfide catalysts. The activities of the Ni and Co catalysts are similar
except when NaY and NaZSM-5 are used as support in which case the Co catalysts are
slightly but significantly more active than the Ni catalysts. The Mo catalysts show
somewhat lower activities than the Ni and Co catalysts, especially the acidic ones. The
deactivation of the CaY and HZSM-5 supported Mo catalysts is relatively strong
compared to that of the corresponding Co and Ni sulfide catalysts.
The fact that the activity differences between the three metal sulfides (compared per
zeolite) are not very large is in contrast with AlP3 supported catalysts, viz. sulfided
Co/Al20 3 or Ni/Al20 3 are far less active than sulfided Mo/Al20 3 (25, 26). As in the case
of carbon supported catalysts (27, 28), the sulfided zeolite supported Co and Ni catalysts
show a considerable thiophene HDS activity. The interaction between Co or Ni and the
zeolite support is not as strong as on the Al20 3 support, in which case sulfidation of Co
or Ni is partly prevented (25, 26). The zeolite support behaves more like an inert support,
like for instance carbon or Si02•
The relative activities of the zeolite supported Co, Ni and Mo catalysts are somewhat
different from those measured for carbon or unsupported catalysts. The almost equal
activities of Co and Ni sulfide and the lower activity of Mo sulfide for the zeolite
supported catalysts is in contrast with the relatively high activity of Co/C compared to
Ni/C or Mo/C (27), while for unsupported catalysts Mo sulfide is usually slightly more
active than Co or Ni sulfide (29, 30). The differences in relative activities are probably
caused by differences in dispersion of the metal sulfide phase. For instance, the relatively
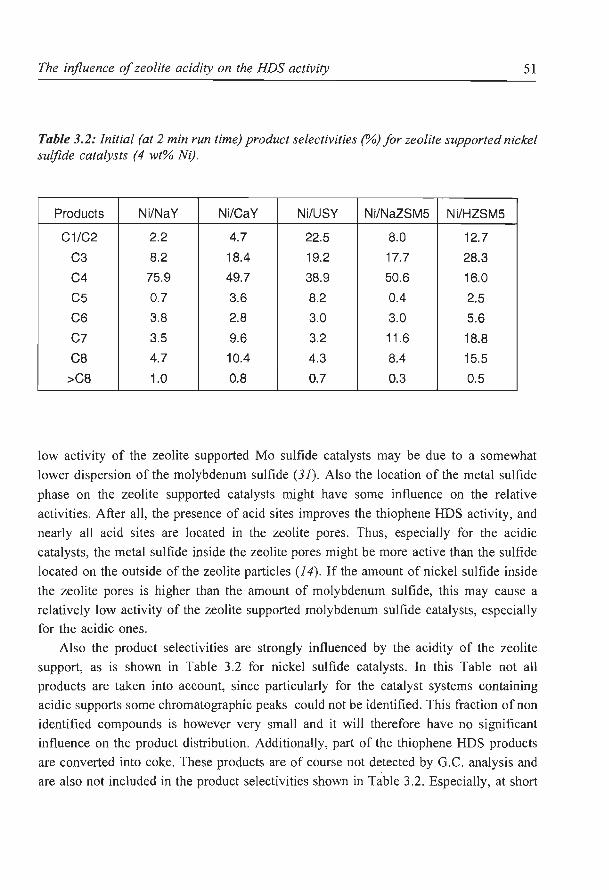
The influence of zeolite acidity on the HDS activity 51
Table 3.2: Initial (at 2 min run time) product selectivities (%)for zeolite supported nickel sulfide catalysts (4 wt% Ni}.
Products Ni/NaY Ni/CaY Ni/USY Ni/NaZSM5 Ni/HZSM5
C1/C2 2.2 4.7 22.5 8.0 12.7
C3 8.2 18.4 19.2 17.7 28.3
C4 75.9 49.7 38.9 50.6 16.0
C5 0.7 3.6 8.2 0.4 2.5
C6 3.8 2.8 3.0 3.0 5.6
C7 3.5 9.6 3.2 11.6 18.8
C8 4.7 10.4 4.3 8.4 15.5
>C8 1.0 0.8 0.7 0.3 0.5
low activity of the zeolite supported Mo sulfide catalysts may be due to a somewhat
lower dispersion of the molybdenum sulfide (31). Also the location of the metal sulfide
phase on the zeolite supported catalysts might have some influence on the relative
activities. After all, the presence of acid sites improves the thiophene HDS activity, and
nearly all acid sites are located in the zeolite pores. Thus, especially for the acidic
catalysts, the metal sulfide inside the zeolite pores might be more active than the sulfide
located on the outside of the zeolite particles (I 4). If the amount of nickel sulfide inside
the zeolite pores is higher than the amount of molybdenum sulfide, this may cause a
relatively low activity of the zeolite supported molybdenum sulfide catalysts, especially for the acidic ones.
Also the product selectivities are strongly influenced by the acidity of the zeolite
support, as is shown in Table 3.2 for nickel sulfide catalysts. In this Table not all
products are taken into account, since particularly for the catalyst systems containing
acidic supports some chromatographic peaks could not be identified. This fraction of non
identified compounds is however very small and it will therefore have no significant
influence on the product distribution. Additionally, part of the thiophene HDS products
are converted into coke. These products are of course not detected by G.C. analysis and
are also not included in the product selectivities shown in Table 3.2. Especially, at short
52 Chapter 3
run time a large part (up to 50 %) of the converted thiophene is not detected by G.C.
analysis, and will probably be converted into coke. None of the identified products
contained sulfur. Compounds such as tetrahydrothiophene or n-, sec-, or tert-butylmer
captane are not present. Although there may be some sulfur containing molecules among
the non identified products, apparently most of the products are desulfurized before they
are polymerized and cracked. For Ni/NaY a large fraction of C4 products is observed
mainly existing of butenes with only small amounts of n-butane and i-butane. Similar to
carbon supported catalysts (27) also NaY supported nickel sulfide show poor hydrogenat
ing properties for butenes formed during thiophene HDS. Besides C4 molecules some
polymerized and cracked products are formed, again indicating that also on this catalyst
acid sites are present in spite of the supposedly non acidic character of the NaY support.
For Ni/CaY and Ni!USY the C4 fraction decreases as, due to the higher acidity of these
catalysts, more polymerization and cracking occurs. The Ni/NaZSM-5 shows a high
degree of polymerization and cracking, in spite of the fact that the zeolite support itself
is not acidic. Probably, also on this catalyst some exchange of Na+ ions against N?+ ions
has occurred during impregnation, resulting in a acidic catalyst after sulfidation. For the
Ni/HZSM-5 the degree of polymerization and cracking has increased strongly.
Ni/CaY and both the ZSM-5 supported catalysts produce large amounts ofC7 (mainly
toluene) and C8 products (mainly ethyl benzene and p-xyleen). The C8 products are
probably the result of polymerization of butenes. Also larger polymerization products are
formed, but most of these products will not be able to leave the zeolite pore system, and
will finally be converted into coke. Due to cracking of these large molecules C7 or
smaller products are formed. For Ni!USY the amount of polymerized products (>C4) is
relatively small. Probably, most of the polymerized products formed are either immedi
ately cracked into very small molecules, or converted into coke. This results in a
relatively low product selectivity for C7 and C8 products, and a high selectivity for
C l/C2 and C3. The zeolite supported Co catalysts show product selectivities similar to
those of the Ni catalysts. The Mo catalysts, especially those supported on NaY and
NaZSM-5, show a higher C4 product selectivity (95 and 90 % respectively). In contrast
to the Ni and Co catalysts, hardly any ion exchange has occurred during impregnation
with AHM, and thus only a very few acid sites have been formed after impregnation and
sulfidation, resulting in very low amounts of cracking and polymerization products on the
NaY and NaZSM-5 supported Mo catalysts.
The acidic zeolite supports also show a thiophene HDS activity in the absence of a
metal sulfide phase, as can be observed for instance on the H(x)Na Y supports (Fig. 3.1 ).
With increasing acidity an increasing initial thiophene HDS activity is measured . The non
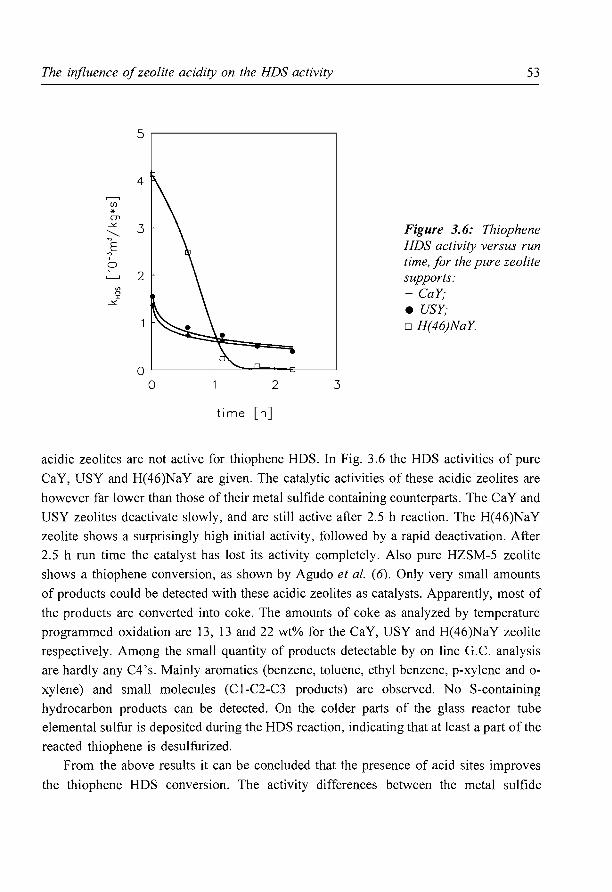
The influence of zeolite acidity on the HDS activity
4
3
2
2 3
time [h]
53
Figure 3.6: Thiophene HDS activity versus run time, for the pure zeolite supports: +CaY; e USY; o H(46)NaY
acidic zeolites are not active for thiophene HDS. In Fig. 3.6 the HDS activities of pure
CaY, USY and H(46)NaY are given. The catalytic activities of these acidic zeolites are
however far lower than those of their metal sulfide containing counterparts. The CaY and
USY zeolites deactivate slowly, and are still active after 2.5 h reaction. The H( 46)Na Y
zeolite shows a surprisingly high initial activity, followed by a rapid deactivation. After
2.5 h run time the catalyst has lost its activity completely. Also pure HZSM-5 zeolite
shows a thiophene conversion, as shown by Agudo et a!. ( 6). Only very small amounts
of products could be detected with these acidic zeolites as catalysts. Apparently, most of
the products are converted into coke. The amounts of coke as analyzed by temperature
programmed oxidation are 13, 13 and 22 wt% for the CaY, USY and H(46)NaY zeolite
respectively. Among the small quantity of products detectable by on line G.C. analysis
are hardly any C4's. Mainly aromatics (benzene, toluene, ethyl benzene, p-xylene and o
xylene) and small molecules (Cl-C2-C3 products) are observed. No S-containing
hydrocarbon products can be detected. On the colder parts of the glass reactor tube
elemental sulfur is deposited during the HDS reaction, indicating that at least a part of the
reacted thiophene is desulfurized.
From the above results it can be concluded that the presence of acid sites improves
the thiophene HDS conversion. The activity differences between the metal sulfide
54 Chapter 3
catalysts supported by different zeolites (Fig. 3.3, 3.4 and 3.5), or between series of
Ni/NaY, Ni/CaY (both prepared by impregnation) and NiNaY (prepared by ion exchange)
catalysts (14) indicate that higher initial thiophene HDS conversions can be obtained on
acidic zeolite supports. Also for sulfided Me/H(x)NaY catalysts the initial HDS activity
increases with increasing acidity, suggesting that a synergetic effect occurs between the
metal sulfide phase and the acidic zeolite. There are several ways in which this synergetic
effect can be explained: (I) a higher concentration of thiophene in the pores of the zeolite,
(II) acceleration of the rate determining step in the thiophene HDS reaction, or (III)
changes in the catalytic properties of the metal sulfide phase.
(I) The presence of acid sites may result in an increased adsorption of thiophene in
the pores of the zeolite. Consequently, the local thiophene concentration around the metal
sulfide particles in the zeolite pores will be higher which, assuming that the reaction is
first order in thiophene, will result in an enhanced reaction rate. Most likely, only the
sulfide particles located inside the zeolite pores will participate in this synergetic effect.
(II) There are many possibilities for W ions to interfere with the thiophene HDS
reaction. For instance, it is possible to describe the desulfurization of thiophene on a
metal sulfide particle as a four electron reduction process (26, 32, 33) leading to the
fonnation of H2S and butadiene:
+ 2 H+ + 4 e· --+
2 H 2 --+ 4 H+ + S2- + 2 H+ --+
The electrons in the first reaction may be provided by the metal sulfide. Protons are
always available at the surface of the metal sulfide in the fonn of SH groups, but
possibly the high concentration of protons in the close vicinity of the metal sulfide
particles can lead to an acceleration of the first reaction, leading to a higher overall
reaction rate. The protons may also directly accelerate the C-S bond scission, for instance
by destabilization of the aromatic structure of the thiophene ring.
(III) The protons of the zeolite support may be able to change the catalytic properties
of the metal sulfide clusters located in the zeolite pores. For instance, the interaction
between the metal sulfide particles and the acid sites may lead to the formation of more
acidic SH groups on the sulfide surface. As these SH groups are probably involved in the
thiophene HDS reaction (see for instance II), a higher concentration of SH groups can
result in a higher activity.
None of the above mentioned explanations for the synergetic effect can explain the
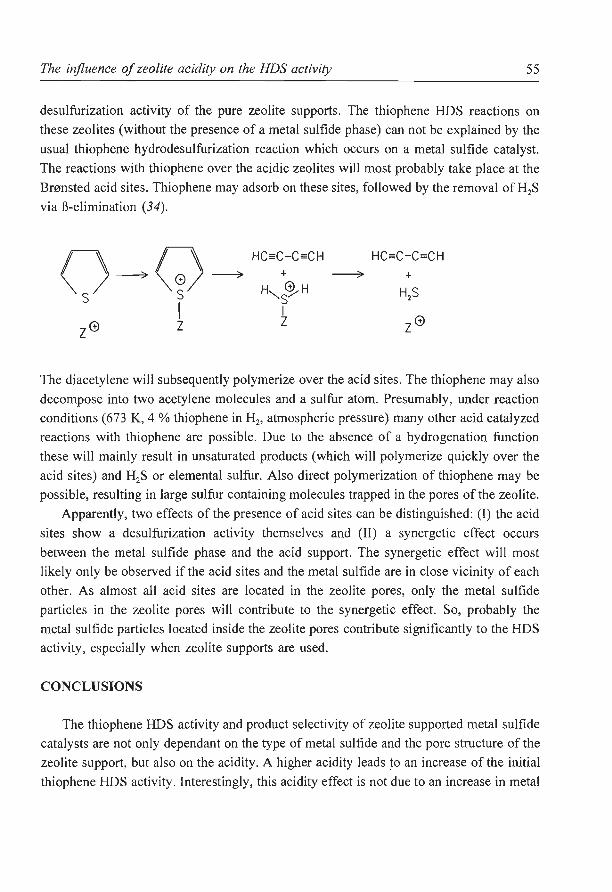
The influence of zeolite acidity on the HDS activity 55
desulfurization activity of the pure zeolite supports. The thiophene HDS reactions on
these zeolites (without the presence of a metal sulfide phase) can not be explained by the
usual thiophene hydrodesulfurization reaction which occurs on a metal sulfide catalyst.
The reactions with thiophene over the acidic zeolites will most probably take place at the
Bmnsted acid sites. Thiophene may adsorb on these sites, followed by the removal of H2S
via B-elimination (34).
0-7Q HC=C-C=CH HC=C-C=CH ------;. + ------;. +
H"- ~H H2S s s s I I
zG z z zG
The diacetylene will subsequently polymerize over the acid sites. The thiophene may also
decompose into two acetylene molecules and a sulfur atom. Presumably, under reaction
conditions (673 K, 4% thiophene in H2, atmospheric pressure) many other acid catalyzed
reactions with thiophene are possible. Due to the absence of a hydrogenation function
these will mainly result in unsaturated products (which will polymerize quickly over the
acid sites) and H2S or elemental sulfur. Also direct polymerization of thiophene may be
possible, resulting in large sulfur containing molecules trapped in the pores of the zeolite.
Apparently, two effects of the presence of acid sites can be distinguished: (I) the acid
sites show a desulfurization activity themselves and (II) a synergetic effect occurs
between the metal sulfide phase and the acid support. The synergetic effect will most
likely only be observed if the acid sites and the metal sulfide are in close vicinity of each
other. As almost all acid sites are located in the zeolite pores, only the metal sulfide
particles in the zeolite pores will contribute to the synergetic effect. So, probably the
metal sulfide particles located inside the zeolite pores contribute significantly to the HDS
activity, especially when zeolite supports are used.
CONCLUSIONS
The thiophene HDS activity and product selectivity of zeolite supported metal sulfide
catalysts are not only dependant on the type of metal sulfide and the pore structure of the
zeolite support, but also on the acidity. A higher acidity leads to an increase of the initial
thiophene HDS activity. Interestingly, this acidity effect is not due to an increase in metal
56 Chapter 3
sulfide dispersion but most likely results from a synergy between the small metal sulfide
particles and the acidic support. Only the metal sulfide particles located inside the zeolite
pores will contribute to this effect. Further improvement of these catalysts may thus be
obtained by developing preparation methods which result in higher amounts of metal
sulfide particles inside the zeolite pores . Studies specifically aiming at the intrinsic
catalytic properties of small metal sulfide particles in zeolite pores are only meaningful
in the absence of acid sites, or after inactivation of acid sites by selective poisoning or
application of sufficiently low reaction temperatures .
References
1. Ward, J.W., Stud. Surf Sci. Catal. 16 (1983) 587.
2. Maxwell, I.E., Catal. Today 1 (1987) 385.
3. Cid, R. , Orellana, F. and Lopez Agudo, A., Appl. Catal. 32 (1987) 327.
4. Fierro, J.L.G., Conesa, J.C., and Lopez Agudo, A. , J Catal. 108 ( 1987) 334.
5. Cid, R., Fierro, J.L.G. and Lopez Agudo, A., Zeolites 10 (1990) 95.
6. Lopez Agudo, A., Benitez, A. , Fierro, J.L.G., Palacios, J.M., Neira, J. and Cid, R., J Chern. Soc., Faraday Trans. 88 (1992) 385.
7. Anderson, J.A., Pawelec, B., Fierro, J.L.G., Arias, P.L., Duque, F. and Cambra, J.F ., Appl.
Catal. 99 (1993) 55.
8. Kovacheva, P., Davidova, N. and Novakova, J. , Zeolites 11 (1991) 54.
9. Laniecki, M. and Zmierczak, W., Zeolites 11 (1991) 18.
10. Laniecki, M. and Zmierczak, W., in 'Zeolite chemistry and catalysis', Jacobs, P.A. et al.
Eds., p. 331 . Elsevier, Amsterdam, 1991.
II. Leglise, J., Janin, A., Lavalley, J.C. and Cornet, D., J Catal. 114 ( 1988) 388. 12. Ezzamarty, A., Catherine, E., Cornet, D., Hemidy, J.F., Janin, A. , Lavalley, J.C. and
Leglise, J. , in 'Zeolites, Facts, Figures, Future', Jacobs, P.A. and van Santen, R.A. Eds.,
p. 1025. Elsevier, Amsterdam, 1989.
13. Welters, W.J.J. , Koranyi , T.I. , de Beer, V.H.J, and van Santen, R.A. , in 'New Frontiers
in Catalysis', Guczi, L. , et al. Eds., p. 1931. Elsevier, Amsterdam, 1993.
14. Chapter 2 of this Thesis.
15. MuraliDhar, G., Massoth, F.E. and Shabtai, J., J Catal. 85 (1984) 44.
16. Duchet, J.C., van Oers, E.M., de Beer, V .H.J. and Prins, R., J Cat a!. 80 ( 1983) 386.
17. Bachelier, J., Duchet, J.C., and Cornet, D., J Phys. Chern. 84 ( 1980) 1925.
18. Bachelier, J., Tilliette, M.J., Duchet, J. C. and Cornet, D., J Catal. 16 (1982) 300.
19. Bachelier, J. , Duchet, J.C. and Cornet, D., J Catal. 81 (1984) 283.
The influence of zeolite acidity on the HDS activity 57
20. Bouwens, S.M.A.M., Barthe-Zahir, N. , de Beer, V.H.J. and Prins, R., J Cat a!. 131 (1991)
326.
21. Verhulst, H.A.M., Welters, W.J.J., van de Yen, L., de Haan, J.W. and Verbeck, G.,
unpublished results.
22. Chen, N.Y. and Garwood, W.E., J Catal. 52 (1978) 453.
23. Dejaifve, P. , Auroux, A., Gravelle, P.C., Vedrine, J.C., Gabelica, Z. and Derouane, E.G.,
J Catal. 70 (1981) 123.
24. Guisnet, M., Magnoux, P. and Canaff, C., Stud. Surf Sci. Cat a!. 28 (1986) 701.
25. de Beer, V.H.J., van Sint Fiet, T.H.M., van der Steen, G.H.A.M., Zwaga, A.C. and
Schuit, G.C.A., J Catal. 35 (1974) 297.
26. Prins, R. , de Beer, V.H.J. and Somorjai, G.A., Catal. Rev. -Sci. Eng. 31 (1989) 1.
27. Vissers, J.P.R., Groot, C.K., van Oers, E.M., de Beer, V.H.J. and Prins, R., Bull. Soc.
Chern. Belg. 93 (1984) 813 .
28 . Ledoux, M.L., Michaux, 0., Agostini, G. and Panissod, P., J Catal. 102 (1986) 275.
29. Lacroix , M., Boutarfa, N., Guillard, C., Vrinat, M. and Breysse, M., J Catal. 120 (1989)
473 .
30. Pecoraro, T.A. and Chianelli, R.R., J Catal. 67 (1981) 430.
31 . Chapter 6 of this Thesis.
32. de Beer, V.H.J. and Schuit, G.C.A., in 'Preparation of Catalysts', Delman, B., Jacobs,
P.A. and Poncelet, G., Eds., p. 343. Elsevier, Amsterdam, 1976.
33 . Gates, B.C. , Katzer, J.R. and Schuit, G.C.A., in 'Chemistry of catalytic processes', p. 423.
Me. Graw - Hill, New York, 1978.
34. Kolboe, S., Can. J Chern. 47 (1969) 352.
4 HYDROCRACKING OF N-DECANE OVER ZEOLITE SUPPORTED METAL SULFIDE
CATALYSTS: (I) CaY SUPPORTED TRANSITION METAL SULFIDES
ABSTRACT The hydrocracking properties ofvarious CaY supported metal (Fe, Co, Ni, Mo, Ru, Rh,
Pd, W, Re, Ir and Pt) sulfide catalysts (prepared by impregnation) are examined by studying
the hydroconversion of n-decane. All catalysts show cracking conversions which are
significantly higher than that of the CaY support. There are large differences in catalytic
behaviour dependent on the metal sulfide present on the zeolite support. The amounts of S
present on the catalyst are analyzed to determine the degree of sulfidation of the metal
sulfide, while High Resolution Electron Microscopy is used to characterize the distribution
of the metal sulfide phase over the zeolite support. The observed differences in activity can
be explained by the differences in intrinsic activity of the metal sulfide phase and the
differences in distribution of this phase over the zeolite particle (internal or external sulfide
deposition).
59

60 Chapter 4
INTRODUCTION
Hydrocracking is a typical example of bifunctional catalysis, in which both the
hydrogenation/dehydrogenation and the cracking function play a crucial role. Weitkamp et
al. (1, 2) and Jacobs et al. (3, 4) have extensively studied the hydrocracking reaction to
unravel the mechanism, in particular for the hydrocracking of higher paraffins over noble
metal on zeolite catalysts. The reaction starts with the dehydrogenation of the paraffins over
the metallic (or metal sulfide) function producing olefins. These form carbenium ions at the
acid sites and then undergo the usual acid catalyzed reactions. At first they are isomerized,
which is, if the reaction conditions are severe enough (at prolonged reaction times or higher
temperatures), followed by cracking. The products can desorb from the acid sites and be
hydrogenated to the corresponding paraffins. If the hydrogenation function is really strong,
one usually finds that a substantial degree of isomerization can be achieved with only little
cracking, and that per cracked parent paraffin two product molecules are formed . This is
referred to as 'ideal hydrocracking' which means that the consecutive reactions (cracking
after isomerization, secondary cracking after primary cracking) play a minor role (5).
Nowadays, hydrocracking catalysts are requited to have a flexible product selectivity
combined with a high activity. Additionally, they have to be resistant towards poisoning by
S and N containing compounds which are present in feedstocks treated in modem
hydrocracking units. This can be achieved by combining a zeolite with a sulfidic
hydrogenation function. Transition metal sulfides are effective hydrogenation catalysts and
meet the requirements for a high resistance towards poisoning by S and N containing
compounds.
Industrial catalysts mostly use combinations of Mo or W with Ni or Co as the active
metal sulfide component ( 6), and, consequently most of the papers dealing with zeolite
supported transition metal sulfides are focused on these metals (7-12). However, only a few
of them include testing of the hydrocracking properties (13-17). Leglise et al. (I 3, 14)
measured the hydrogenation of benzene and the hydrocracking of n-heptane over a series of
stabilized HY supported Ni, Mo and NiMo sulfide catalysts. They found for all these
catalysts the hydrogenation function to be considerably weaker than the one found for
example in Pt/HY hydroisomerization catalysts (18), thus causing a hydrocracking behaviour
which is far from ideal. Other studies (15-17) are much more focused on the optimization
of the industrial hydrocracking catalyst and the process conditions than on the fundamental
aspects of preparation, structure and catalytic properties of zeolite supported transition metal
sulfide catalysts.
Besides Co, Ni, Mo and W there are however many other transition metal sulfides which
Hydrocracking of n-decane over CaY supported transition metal sulfides 61
are comparably or even more active for a range of catalytic reactions, such as thiophene or
dibenzothiophene hydrodesulfurization (HDS) (19-22), hydrodenitrogenation (HDN) (23-25)
or hydrogenation of biphenyl (22). Combination of an acidic zeolite with these metal sulfides
may result in highly active hydrocracking catalysts.
In the present study the hydrocracking properties of several CaY supported transition
metal sulfides are examined by studying the hydroconversion of n-decane at moderate
pressure (3 MPa). The differences in catalytic activity measured for the various metal
sulfides are compared with the trends in activity observed for the above mentioned test
reactions (19-25). In order to allow an meaningful comparison of the catalytic properties
between the different metal sulfides, the composition of the metal sulfide phase present on
the catalysts is examined by overall sulfur analysis, while the distribution of the sulfide phase
over the zeolite particles on some of the catalysts is characterized by high resolution electron
microscopy (HREM). In spite of the fact that stabilized Y zeolites are most commonly used
for industrial hydrocracking (16), the original Y zeolite is used as support for our model
catalysts in order to avoid changes in catalytic properties or degree of sulfidation of the
metal sulfide phase caused by the extra framework alumina or by the presence of mesopores
on the stabilized Y zeolite (13).
EXPERIMENTAL
Catalyst preparation
The CaY support (C~4Na6(Al02)54(Si02) 138 * x H20) is prepared from a NaY
(Na5iA102) 54(Si0)138 * x H20, PQ CBV-100) zeolite by ion exchange with aqueous CaC12
solutions followed by washing until c1· free. All CaY supported catalysts are prepared by
pore volume impregnation. The concentration of the metal salt is adjusted in order to obtain
equal metal loading on a molar basis for all catalysts (0.75 mmol metal per gram of catalyst).
After impregnation, the catalyst is dried in static air at 393 K for 16 h, followed by
calcination at 673 K for 2 hours. The salts used for impregnation and the metal loading in
weight percentage are given in Table 4.1 for each catalyst. All catalysts are stored above
saturated CaC12 solutions. Prior to catalytic testing the powders are pressed, grinded and
sieved to obtain a particle size fraction between 125 and 425 ,urn.
Hydrocracking of n-decane All hydrocracking experiments are performed in a micro flow reactor containing 0.8 g
of dry catalyst mixed with 5 g of SiC (particle size 0.5 mm) at a total pressure of 3.0 MPa.
Prior to reaction the catalysts are sulfided in situ (6 K min·' from room temperature to
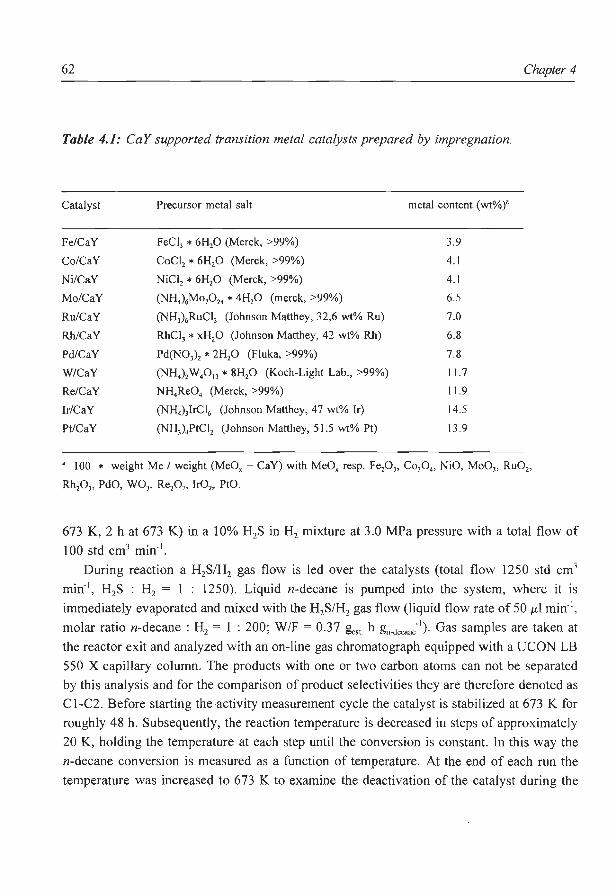
62
Table 4.1: CaY supported transition metal catalysts prepared by impregnation.
Catalyst
Fe/CaY
Co/CaY
Ni/CaY
Mo/CaY
Ru/CaY
Rh/CaY
Pd/CaY
W/CaY
Re/CaY
Ir/CaY
Pt/CaY
Precursor metal salt metal content (wt%)'
FeCI3 * 6Hp (Merck, >99%) 3.9
CoCI2 * 6H20 (Merck, >99%) 4.1
NiCI2 * 6H20 (Merck, >99%) 4. I
(NH,)6MoP2, * 4Hp (merck, >99%) 6.5
(NH3) 6RuCI3 (Johnson Matthey, 32,6 wt% Ru) 7.0
RhCI3 * x.Hp (Johnson Matthey, 42 wt% Rh) 6.8
Pd(N03) 2 * 2H20 (Fiuka, >99%) 7 8
(NH,)2W,0, 3 * 8Hp (Koch-Light Lab., >99%) 11.7
NH,ReO, (Merck, >99%) 11.9
(NH4) 3lrCI6 (Johnson Matthey, 47 wt% lr) 14.5
(NH3) 4PtCI2 (Johnson Matthey, 51.5 wt% Pt) 13.9
Chapter 4
' 100 * weight Me I weight (MeOx +CaY) with MeOx resp. Fep3, Cop,, NiO, Mo03, Ru02,
Rhp,, PdO, W03, Rep7, lr02, PtO.
673 K, 2 hat 673 K) in a 10% H2S in H2 mixture at 3.0 MPa pressure with a total flow of
100 std cm3 min·'.
During reaction a H2SIH2 gas flow is led over the catalysts (total flow 1250 std cm3
min·', H2S : H2 = 1 : 1250). Liquid n-decane is pumped into the system, where it is
immediately evaporated and mixed with the H2S/H2 gas flow (liquid flow rate of 50 J.d min· ',
molar ratio n-decane : H2 = 1 : 200; W/F = 0.37 &:., h gn-decan;'). Gas samples are taken at
the reactor exit and analyzed with an on-line gas chromatograph equipped with a UCON LB
550 X capillary column. The products with one or two carbon atoms can not be separated
by this analysis and for the comparison of product selectivities they are therefore denoted as
C1-C2. Before starting the activity measurement cycle the catalyst is stabilized at 673 K for
roughly 48 h. Subsequently, the reaction temperature is decreased in steps of approximately
20 K, holding the temperature at each step until the conversion is constant. In this way the
n-decane conversion is measured as a function of temperature. At the end of each run the
temperature was increased to 673 K to examine the deactivation of the catalyst during the
Hydrocracking of n-decane over CaY supported transition metal sulfides 63
entire activity test.
Catalyst characterization
Thermogravimetric analysis (TGA) is used to determine the coke content of the
deactivated catalysts (oxidation in a 20 % 0/He, Seteram TG 85 balance). Because the
oxidation of the coke deposits and the metal sulfide phase can not be separated, the measured
weight loss is corrected for the weight loss due to the oxidation of the metal sulfides to the
corresponding metal oxides, assuming the composition of the metal sulfides as determined
by overall sulfur analysis.
For the determination of the amount of sulfur present on the catalysts, sulfided samples
are dissolved in aqua regia while carefully heating the mixture. It is experimentally verified
that during dissolution no H2S is formed. During this process the sulfide is converted into
sulphate. The amount of sulphate is determined by titration with barium perchlorate. As Ca2+
ions disturb the titration they are removed from the solution by an ion exchanger before
titration. The sulfide phases of W, Ru, Rh and Ir do not dissolve in aqua regia, so another
dissolution method had to be used. The tungsten sulfide is fused with NaOH at 725 K, the
other sulfides are fused with excess N~02 at 775 K. The resulting melt is dissolved in water
to determine the sulphate content. Before sulfur analysis, the catalysts are sulfided under
conditions comparable to reaction conditions: (I) heated in a 10% H2S in H2 flow (100 std
cm3 min- 1) at 673 K (6 K min-1 to 673 K, 2 h at 673 K) and 3.0 MPa, (II) kept under a
H2S/H2 flow with a ratio of I: 1250 at 673 K and 30 bar for 24 h, (III) flushed with He at
673 K and atmospheric pressure for 1 h, and (IV) cooled to room temperature in a He flow.
At room temperature the samples are exposed to air and the analysis procedure is started.
In order to study the distribution of the metal sulfide phase over the zeolite support High
Resolution Electron Microscopy (HREM) experiments are carried out on several sulfided
catalysts (sulfidation conditions are the same as for the overall sulfur analysis), using a
Philips CM 30 ST electron microscope. The samples are prepared as follows : after grinding,
the zeolite particles are suspended in alcohol and a few droplets of the suspension are placed
on a copper grid coated with a micro grid carbon polymer. Together with the HREM
analysis the transition metal distribution throughout the catalyst particles is determined
(integrally or segment wise) by means of energy dispersive X-ray (EDX) analysis.
RESULTS
n-Decane hydrocracking The hydrocracking activity of several CaY supported transition metal sulfides is
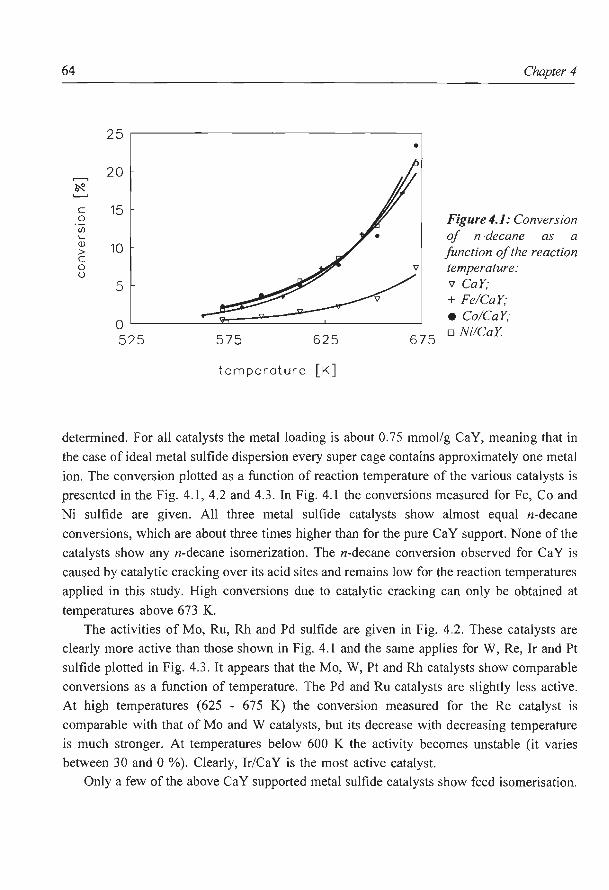
64 Chapter 4
25 •
20 ....--. ~
c 15 0 Figure 4.1: Conversion (f)
of n-decane '- as a (J) 10 function of the reaction > c 0 temperature: ()
5 v CaY,· + Fe/CaY; e Co/CaY;
0 o Ni!CaY 525 575 625 675
temperature [K]
determined. For all catalysts the metal loading is about 0.75 mmol/g CaY, meaning that in
the case of ideal metal sulfide dispersion every super cage contains approximately one metal
ion. The conversion plotted as a function of reaction temperature of the various catalysts is
presented in the Fig. 4.1, 4.2 and 4.3. In Fig. 4.1 the conversions measured for Fe, Co and
Ni sulfide are given. All three metal sulfide catalysts show almost equal n-decane
conversions, which are about three times higher than for the pure CaY support. None of the
catalysts show any n-decane isomerization. The n-decane conversion observed for CaY is
caused by catalytic cracking over its acid sites and remains low for the reaction temperatures
applied in this study. High conversions due to catalytic cracking can only be obtained at
temperatures above 673 K.
The activities of Mo, Ru, Rh and Pd sulfide are given in Fig. 4.2. These catalysts are
clearly more active than those shown in Fig. 4.1 and the same applies for W, Re, Ir and Pt
sulfide plotted in Fig. 4.3 . It appears that the Mo, W, Pt and Rh catalysts show comparable
conversions as a function of temperature. The Pd and Ru catalysts are slightly less active.
At high temperatures (625 - 675 K) the conversion measured for the Re catalyst is
comparable with that of Mo and W catalysts, but its decrease with decreasing temperature
is much stronger. At temperatures below 600 K the activity becomes unstable (it varies
between 30 and 0 %). Clearly, Ir/CaY is the most active catalyst.
Only a few of the above CaY supported metal sulfide catalysts show feed isomerisation.
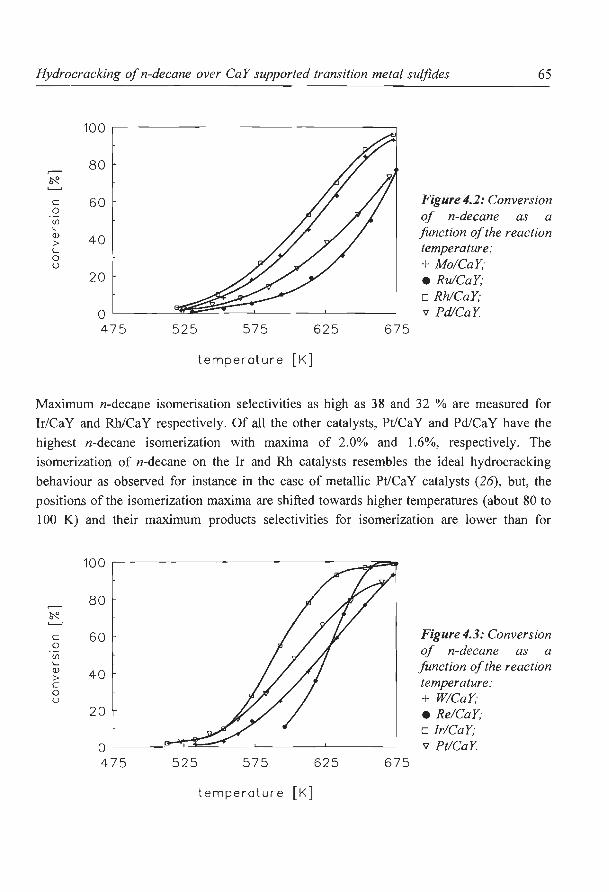
Hydrocracking of n-decane over CaY supported transition metal sulfides 65
100
80 ~
c 0
60 Ul '--(!) 40 > c 0 u
20
0 475 525 575 625 675
temperature [K]
Figure 4.2: Conversion of n-decane as a function of the reaction temperature: + Mo/CaY; e Ru!CaY; o Rh/CaY; v Pd!CaY
Maximum n-decane isomerisation selectivities as high as 38 and 32 % are measured for
lr/Ca Y and Rh/Ca Y respectively. Of all the other catalysts, Pt/Ca Y and Pd/Ca Y have the
highest n-decane isomerization with maxima of 2.0% and 1.6%, respectively. The
isomerization of n-decane on the Ir and Rh catalysts resembles the ideal hydrocracking
behaviour as observed for instance in the case of metallic Pt/CaY catalysts (26), but, the
positions of the isomerization maxima are shifted towards higher temperatures (about 80 to
100 K) and their maximum products selectivities for isomerization are lower than for
100
80 ,....-,
~
c 60 0 Ul \....
(!) 40 > c 0 u
20
0 475 525 575 625 675
temp era ture [K]
Figure4.3: Conversion of n-decane as a function of the reaction temperature: + W/CaY; eRe/CaY; o Jr!CaY; v Pt!CaY
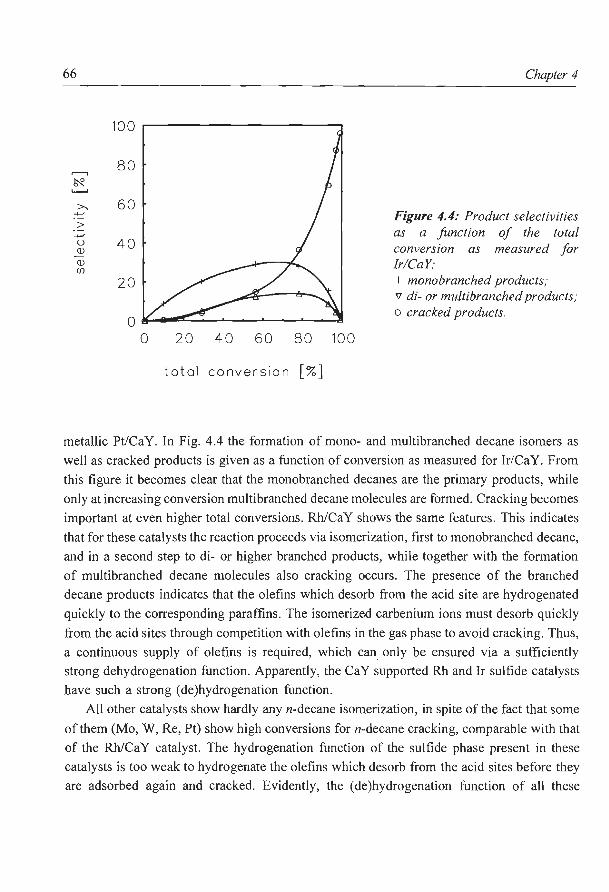
66
100
80 ,..-,
~
>-.. 60 >
-+-' u 40 (J)
(J) (f)
20
0 0 20
total
40 60 80
convers1on [%]
10 0
Chapter 4
Figure 4.4: Product selectivities as a function of the total conversion as measured for lr/CaY. + monobranched products; " di- or multibranched products; o cracked products.
metallic Pt/CaY. In Fig. 4.4 the formation of mono- and multibranched decane isomers as
well as cracked products is given as a function of conversion as measured for Ir/CaY. From
this figure it becomes clear that the monobranched decanes are the primary products, while
only at increasing conversion multibranched decane molecules are formed. Cracking becomes
important at even higher total conversions. Rh/CaY shows the same features . This indicates
that for these catalysts the reaction proceeds via isomerization, first to monobranched decane,
and in a second step to di- or higher branched products, while together with the formation
of multibranched decane molecules also cracking occurs. The presence of the branched
decane products indicates that the olefins which desorb from the acid site are hydrogenated
quickly to the corresponding paraffins. The isomerized carbenium ions must desorb quickly
from the acid sites through competition with olefins in the gas phase to avoid cracking. Thus,
a continuous supply of olefins is required, which can only be ensured via a sufficiently
strong dehydrogenation function. Apparently, theCa Y supported Rh and Ir sulfide catalysts
have such a strong (de)hydrogenation function.
All other catalysts show hardly any n-decane isomerization, in spite of the fact that some
of them (Mo, W, Re, Pt) show high conversions for n-decane cracking, comparable with that
of the Rh/CaY catalyst. The hydrogenation function of the sulfide phase present in these
catalysts is too weak to hydrogenate the olefins which desorb from the acid sites before they
are adsorbed again and cracked. Evidently, the (de)hydrogenation function of all these
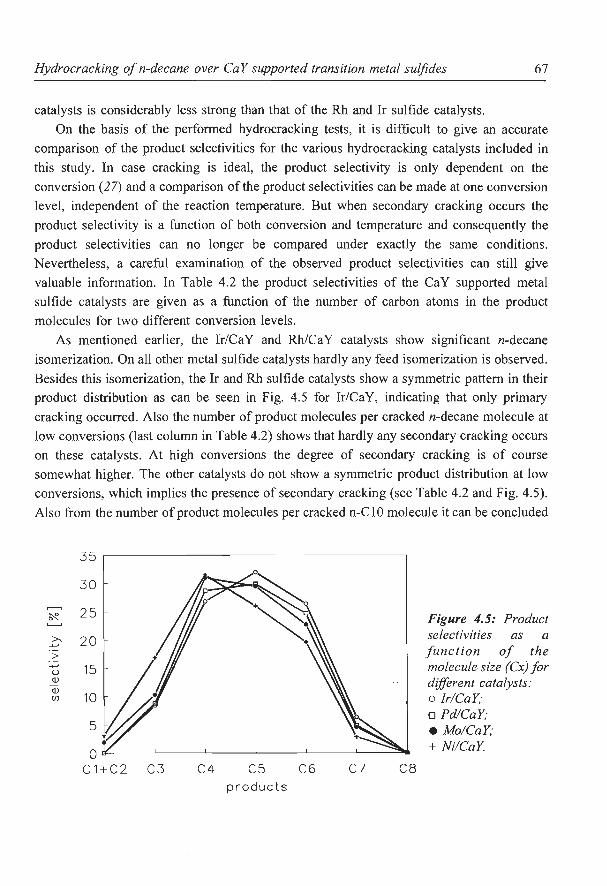
Hydrocracking of n-decane over CaY supported transition metal sulfides 67
catalysts is considerably less strong than that of the Rh and Ir sulfide catalysts.
On the basis of the performed hydrocracking tests, it is difficult to give an accurate
comparison of the product selectivities for the various hydrocracking catalysts included in
this study. In case cracking is ideal, the product selectivity is only dependent on the
conversion (27) and a comparison of the product selectivities can be made at one conversion
level, independent of the reaction temperature. But when secondary cracking occurs the
product selectivity is a function of both conversion and temperature and consequently the
product selectivities can no longer be compared under exactly the same conditions.
Nevertheless, a careful examination of the observed product selectivities can still give
valuable information. In Table 4.2 the product selectivities of the CaY supported metal
sulfide catalysts are given as a function of the number of carbon atoms in the product
molecules for two different conversion levels.
As mentioned earlier, the Ir/Ca Y and Rh/Ca Y catalysts show significant n-decane
isomerization. On all other metal sulfide catalysts hardly any feed isomerization is observed.
Besides this isomerization, the Ir and Rh sulfide catalysts show a symmetric pattern in their product distribution as can be seen in Fig. 4.5 for Ir/CaY, indicating that only primary
cracking occurred. Also the number of product molecules per cracked n-decane molecule at
low conversions (last column in Table 4.2) shows that hardly any secondary cracking occurs
on these catalysts. At high conversions the degree of secondary cracking is of course
somewhat higher. The other catalysts do not show a symmetric product distribution at low
conversions, which implies the presence of secondary cracking (see Table 4.2 and Fig. 4.5).
Also from the number of product molecules per cracked n-C 10 molecule it can be concluded
35
30
~ 25
>- 20 _._,
> _._,
15 u Q)
Q)
10 U1
5
0 C1+C2 C3 C4
0~0 ·~.
+
C5 produ c ts
C6 C7 C8
Figure 4.5: Product selectivities as a function of the molecule size (Cx) for different catalysts: o Jr/CaY; o Pd!CaY; e Mo!CaY; + Ni/CaY.
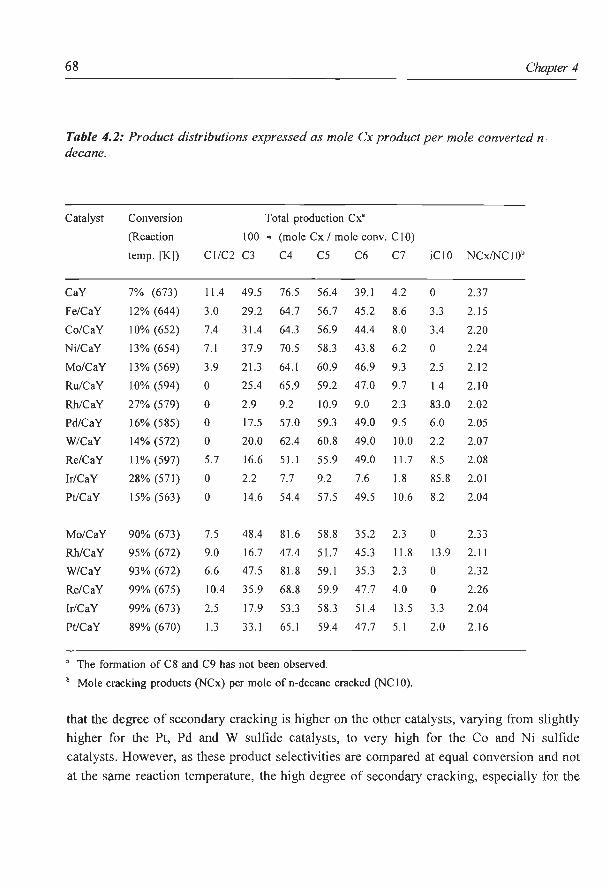
68 Chapter 4
Table 4.2: Product distributions expressed as mole Cx product per mole converted ndecane.
Catalyst Conversion Total production Cx'
(Reaction I 00 * (mole Cx I mole conv. C I 0)
temp. [K]) Cl/C2 C3 C4 C5 C6 C7 iC10 NCx!NC10b
CaY 7% (673) 11.4 49.5 76.5 56.4 39.1 4.2 0 2.37
Fe/CaY 12% (644) 3.0 29.2 64 .7 56.7 45.2 8.6 3.3 2.15
Co/CaY 10% (652) 7.4 31.4 64.3 56.9 44.4 8.0 3.4 2.20
Ni/CaY 13% (654) 7.1 37.9 70.5 58.3 43.8 6.2 0 2.24
Mo/CaY 13% (569) 3.9 21.3 64 .1 60.9 46 .9 9.3 2.5 2.12
Ru/CaY 10% (594) 0 25.4 65 .9 59.2 47.0 9.7 1.4 2.10
Rh/CaY 27% (579) 0 2.9 9.2 10.9 9.0 2.3 83 .0 2.02
Pd/CaY 16% (585) 0 17.5 57.0 59.3 49.0 9.5 6.0 2.05
W/CaY 14% (572) 0 20.0 62.4 60.8 49.0 10.0 2.2 2.07
Re/CaY II% (597) 5.7 16.6 51.1 55 .9 49.0 11.7 8.5 2.08
lr/CaY 28% (571) 0 2.2 7.7 9.2 7.6 1.8 85.8 2.01
Pt/CaY 15% (563) 0 14.6 54.4 57.5 49.5 10.6 8.2 2.04
Mo/CaY 90% (673) 7.5 48.4 81.6 58.8 35.2 2.3 0 2.33
Rh/CaY 95% (672) 9.0 16.7 47.4 51.7 45 .3 11.8 13.9 2.11
W/CaY 93% (672) 6.6 47.5 81.8 59.1 35 .3 2.3 0 2.32
Re/CaY 99% (675) 10.4 35.9 68.8 59.9 47 .7 4.0 0 2.26
Ir/CaY 99% (673) 2.5 17.9 53.3 58.3 51.4 \3 .5 3.3 2.04
Pt/CaY 89% (670) 1.3 33.1 65 .1 59.4 47 .7 5.1 2.0 2. 16
' The formation of C8 and C9 has not been observed.
b Mole cracking products (NCx) per mole of n-decane cracked (NC l 0).
that the degree of secondary cracking is higher on the other catalysts, varying from slightly
higher for the Pt, Pd and W sulfide catalysts, to very high for the Co and Ni sulfide
catalysts. However, as these product selectivities are compared at equal conversion and not
at the same reaction temperature, the high degree of secondary cracking, especially for the
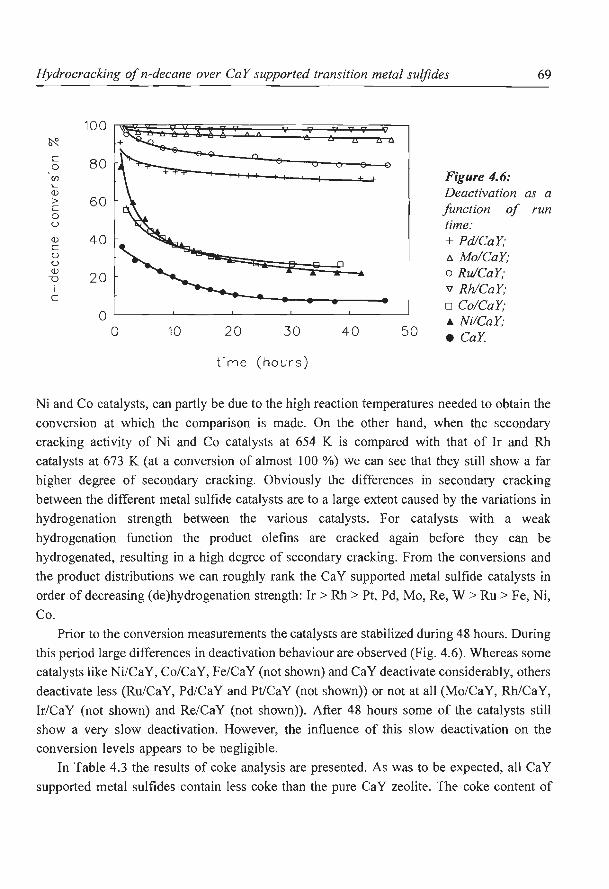
Hydrocracking ofn-decane over CaY supported transition metal sulfides 69
100 ~
c 80 I I 1: e 0 0 0 ±: (f) I I Figure 4.6: "--(j) Deactivation as a > 60 function c of run 0 u time: (j)
c 40 + Pd/CaY; 0 "" Mo/CaY; u (j)
20 o Ru!CaY; -o I v Rh/CaY; c
o Co/CaY; 0 .._ Ni/CaY;
0 10 20 30 40 50 e CaY
time (hours)
Ni and Co catalysts, can partly be due to the high reaction temperatures needed to obtain the
conversion at which the comparison is made. On the other hand, when the secondary
cracking activity of Ni and Co catalysts at 654 K is compared with that of Ir and Rh
catalysts at 673 K (at a conversion of almost 100 %) we can see that they still show a far
higher degree of secondary cracking. Obviously the differences in secondary cracking
between the different metal sulfide catalysts are to a large extent caused by the variations in
hydrogenation strength between the various catalysts. For catalysts with a weak
hydrogenation function the product olefins are cracked again before they can be
hydrogenated, resulting in a high degree of secondary cracking. From the conversions and
the product distributions we can roughly rank the CaY supported metal sulfide catalysts in
order of decreasing (de)hydrogenation strength: Ir > Rh > Pt, Pd, Mo, Re, W > Ru > Fe, Ni,
Co.
Prior to the conversion measurements the catalysts are stabilized during 48 hours. During
this period large differences in deactivation behaviour are observed (Fig. 4.6). Whereas some
catalysts like Ni/CaY, Co/CaY, Fe/CaY (not shown) and CaY deactivate considerably, others
deactivate less (Ru/CaY, Pd/CaY and Pt/CaY (not shown)) or not at all (Mo/CaY, Rh/CaY,
Ir/CaY (not shown) and Re/CaY (not shown)). After 48 hours some of the catalysts still
show a very slow deactivation. However, the influence of this slow deactiv~tion on the
conversion levels appears to be negligible.
In Table 4.3 the results of coke analysis are presented. As was to be expected, all CaY
supported metal sulfides contain less coke than the pure CaY zeolite. The coke content of
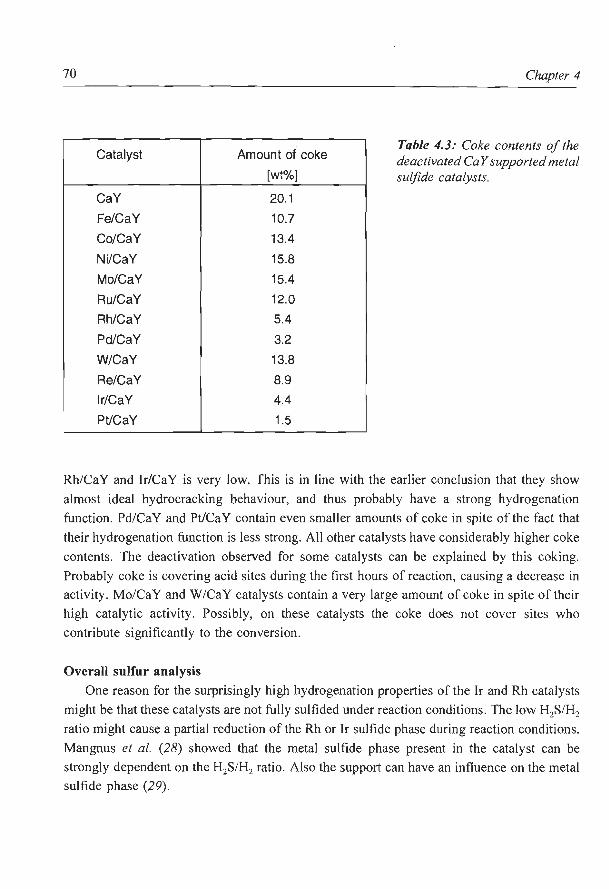
70
Catalyst
CaY
Fe/CaY
Co/CaY
Ni/CaY
Mo/CaY
Ru/CaY
Rh/CaY
Pd/CaY
W/CaY
Re/CaY
lr/CaY
Pt!CaY
Amount of coke
[wt%]
20.1
10.7
13.4
15.8
15.4
12.0
5.4
3.2
13.8
8.9
4.4
1.5
Chapter 4
Table 4.3: Coke contents of the deactivated CaY supported metal sulfide catalysts.
Rh/CaY and Ir/CaY is very low. This is in line with the earlier conclusion that they show
almost ideal hydrocracking behaviour, and thus probably have a strong hydrogenation
function. Pd/Ca Y and Pt/Ca Y contain even smaller amounts of coke in spite of the fact that
their hydrogenation function is less strong. All other catalysts have considerably higher coke
contents. The deactivation observed for some catalysts can be explained by this coking.
Probably coke is covering acid sites during the first hours of reaction, causing a decrease in
activity. Mo/CaY and W/CaY catalysts contain a very large amount of coke in spite of their
high catalytic activity. Possibly, on these catalysts the coke does not cover sites who
contribute significantly to the conversion.
Overall sulfur analysis
One reason for the surprisingly high hydrogenation properties of the Ir and Rh catalysts
might be that these catalysts are not fully sulfided under reaction conditions. The low H2SIH2
ratio might cause a partial reduction of the Rh or Ir sulfide phase during reaction conditions.
Mangnus et a!. (28) showed that the metal sulfide phase present in the catalyst can be
strongly dependent on the H2SIH2 ratio. Also the support can have an influence on the metal
sulfide phase (29).
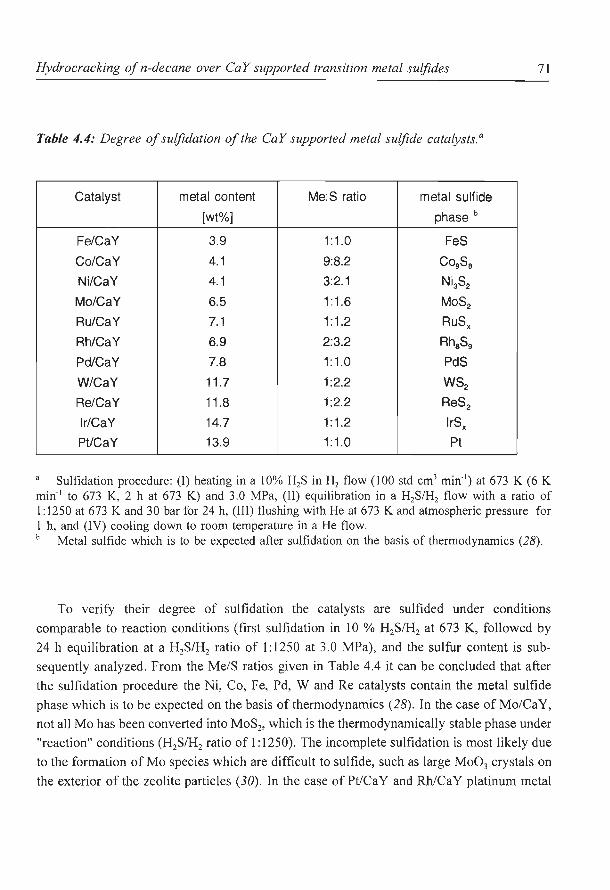
Hydrocracking of n-decane over CaY supported transition metal sulfides 71
Table 4.4: Degree of sulfidation of the CaY supported metal sulfide catalysts. a
Catalyst metal content Me:S ratio metal sulfide
[wt%] phase b
Fe/CaY 3.9 1:1.0 FeS
Co/CaY 4.1 9:8.2 Co9S8
Ni/CaY 4.1 3:2.1 Ni3S2
Mo/CaY 6.5 1:1.6 MoS2
Au/CaY 7.1 1:1 .2 RuSx
Rh/CaY 6.9 2:3.2 Rh8S9
Pd!CaY 7.8 1:1.0 PdS
W/CaY 11 .7 1:2.2 WS2
Re/CaY 11.8 1:2.2 ReS 2
lr/CaY 14.7 1:1 .2 lrSx
Pt/CaY 13.9 1:1.0 Pt
Sulfidation procedure: (I) heating in a 10% H2S in H2 flow (100 std cm3 min. 1) at 673 K (6 K
min-1 to 673 K, 2 h at 673 K) and 3.0 MPa, (II) equilibration in a H2S/H2 flow with a ratio of I: 1250 at 673 K and 30 bar for 24 h, (III) flushing with He at 673 K and atmospheric pressure for 1 h, and (IV) cooling down to room temperature in a He flow. b Metal sulfide which is to be expected after sulfidation on the basis of thermodynamics (28) .
To verifY their degree of sulfidation the catalysts are sulfided under conditions
comparable to reaction conditions (first sulfidation in I 0 % H2SIH2 at 673 K, followed by
24 h equilibration at a H2S/H2 ratio of 1:1250 at 3.0 MPa), and the sulfur content is sub
sequently analyzed. From the Me/S ratios given in Table 4.4 it can be concluded that after
the sulfidation procedure the Ni, Co, Fe, Pd, W and Re catalysts contain the metal sulfide
phase which is to be expected on the basis of thermodynamics (28) . In the case of Mo/Ca Y,
not all Mo has been converted into MoS2, which is the thermodynamically stable phase under
"reaction" conditions (H2SIH2 ratio of I: 1250). The incomplete sulfidation is most likely due
to the formation of Mo species which are difficult to sulfide, such as large Mo03 crystals on
the exterior of the zeolite particles (30). In the case of Pt/Ca Y and Rh/Ca Y platinum metal
72 Chapter 4
and Rh9S8 are the most stable phases under "reaction" conditions. However, during
sulfidation prior to equilibration at "reaction" conditions the H2S/H2 ratio is far higher (1 : 10
vs. 1: 1250). At these high H2SIH2 ratio PtS and Rh2S3 are the thermodynamically stable
phases (28). Possibly, the PtS and Rh2S3 present on the Pt/CaY and Rh/CaY catalysts are
formed during the sulfidation pretreatment, and are not converted into Pt metal and Rh9S8
anymore during the following 24 h. equilibration period. However, Temperature Programmed
Reduction experiments (26) showed that both Rh2S3 and PtS are easily reduced at
temperatures around 673 K. Also the size of the metal sulfide particles may have some
influence on the metal sulfide phase present on the catalysts. Possibly, for very small metal
sulfide particles PtS and Rh2S3 are more stable than Pt metal and Rh9S8 under the applied
"reaction" conditions. This can only account for the observed metal sulfur ratios if all metal
sulfide is present as small particles. But, from the HREM-EDX results (vide infra) it can be
concluded that a substantial part of the metal sulfide is present in large particles, and should
therefore be converted into Pt metal and Rh9S8•
For both Ru/CaY and Ir/CaY the Me:S ratios do not correspond to a known metal sulfide
phase (20, 22, 26). Initially RuS2 (20) and Ir2S3 (26) may have been formed. From the
available thermodynamic data it is not possible to decide which sulfide will be present at the
low H2S/H2 ratio (1:1250) used for equilibration and activity test, although it has to be
expected that at least partial reduction has taken place during these operations.
The Re/Ca Y catalyst appears to give a different metal sulfide phase when it is kept under
reaction conditions (3.0 MPa, H2SIH2 = I : 1250) at a temperature of 553 K instead of 673
K. Overall sulfur analysis revealed that the rhenium sulfide phase of a Re/Ca Y catalyst kept
at 553 K for 24 h has a Re:S ratio of I :2.9. This can be explained by assuming that ReS2
formed during the in situ sulfidation pretreatment (10 % H2S/H2, 673 K) is slowly converted
into Re2S7• Due to the low temperature the conversion will be very slow and still not
completed after 24 h, resulting in a sulfur content in between that of ReS2 and Re2S7 . Also
Ledoux et al. (21) found a phase transition for the rhenium sulfide catalyst at almost the
same temperature.
Generally, the metal sulfide phases (except for Mo/CaY) correspond well with those
found by XPS in carbon supported metal sulfide catalysts as reported by Vissers eta!. (20).
Also for the unsupported metal sulfide catalysts the same sulfides are found at similar
conditions (first presulfidation at 673 K in a 15 % H2S/H2 flow, followed by reaction under
3 .I MPa H2 pressure) ( 19), except for Ir/Ca Y .
Possibly on some catalysts elemental sulfur is present, which would complicate an exact
determination of the metal sulfide phase and the degree of sulfidation. However, in the
presence of a metal sulfide phase all elemental sulfur should easily be reduced at the
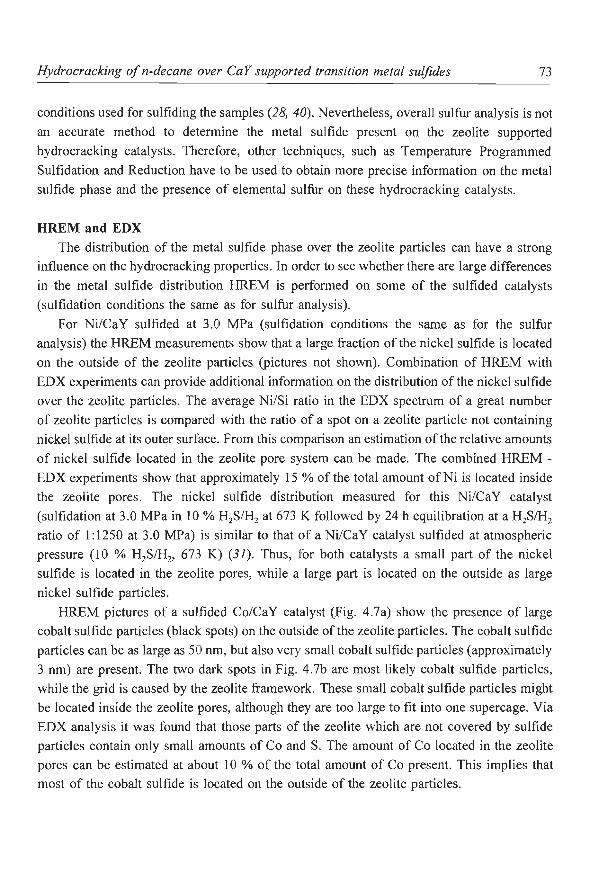
Hydrocracking ofn-decane over CaY supported transition metal sulfides 73
conditions used for sulfiding the samples (28, 40). Nevertheless, overall sulfur analysis is not
an accurate method to determine the metal sulfide present on the zeolite supported
hydrocracking catalysts. Therefore, other techniques, such as Temperature Programmed
Sulfidation and Reduction have to be used to obtain more precise information on the metal
sulfide phase and the presence of elemental sulfur on these hydrocracking catalysts.
HREM and EDX
The distribution of the metal sulfide phase over the zeolite particles can have a strong
influence on the hydrocracking properties. In order to see whether there are large differences
in the metal sulfide distribution HREM is performed on some of the sulfided catalysts
(sulfidation conditions the same as for sulfur analysis).
For Ni/Ca Y sulfided at 3.0 MPa (sulfidation conditions the same as for the sulfur
analysis) the HREM measurements show that a large fraction of the nickel sulfide is located
on the outside of the zeolite particles (pictures not shown). Combination of HREM with
EDX experiments can provide additional information on the distribution of the nickel sulfide
over the zeolite particles. The average Ni/Si ratio in the EDX spectrum of a great number
of zeolite particles is compared with the ratio of a spot on a zeolite particle not containing
nickel sulfide at its outer surface. From this comparison an estimation of the relative amounts
of nickel sulfide located in the zeolite pore system can be made. The combined HREM -
EDX experiments show that approximately 15 % of the total amount of Ni is located inside
the zeolite pores. The nickel sulfide distribution measured for this Ni/Ca Y catalyst
(sulfidation at 3.0 MPa in 10% H2S/H2 at 673 K followed by 24 h equilibration at a H2S/H2
ratio of 1:1250 at 3.0 MPa) is similar to that of aNi/CaY catalyst sulfided at atmospheric
pressure (I 0 % H2S/H2, 673 K) (3 1). Thus, for both catalysts a small part of the nickel
sulfide is located in the zeolite pores, while a large part is located on the outside as large
nickel sulfide particles.
HREM pictures of a sulfided Co/CaY catalyst (Fig. 4.7a) show the presence of large
cobalt sulfide particles (black spots) on the outside of the zeolite particles. The cobalt sulfide
particles can be as large as 50 nm, but also very small cobalt sulfide particles (approximately
3 nm) are present. The two dark spots in Fig. 4.7b are most likely cobalt sulfide particles,
while the grid is caused by the zeolite framework. These small cobalt sulfide particles might
be located inside the zeolite pores, although they are too large to fit into one supercage. Via
EDX analysis it was found that those parts of the zeolite which are not covered by sulfide
particles contain only small amounts of Co and S. The amount of Co located in the zeolite
pores can be estimated at about 10 % of the total amount of Co present. This implies that
most of the cobalt sulfide is located on the outside of the zeolite particles.
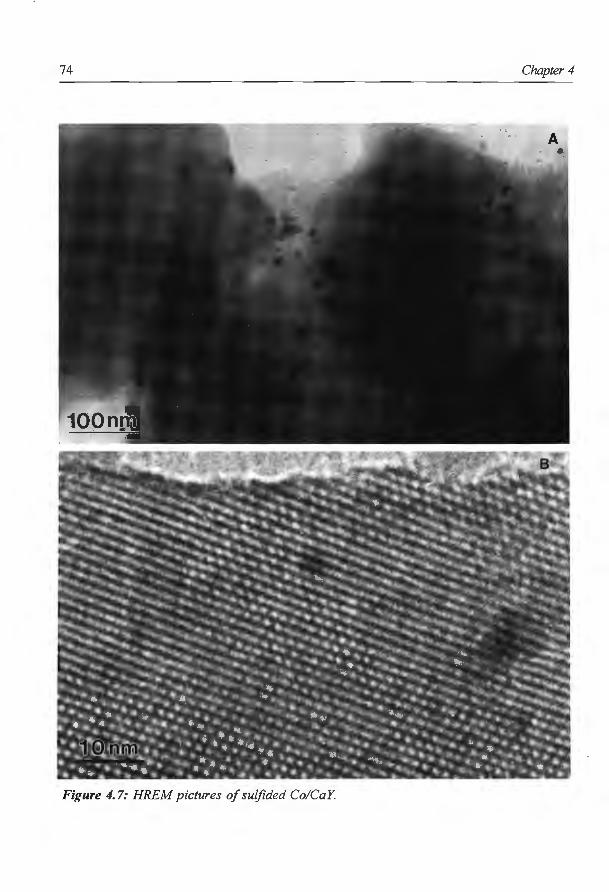
74 Chapter 4
Figure 4. 7: HREM pictures of sulfided Co/CaY
Hydrocracking of n-decane over CaY supported transition metal sulfides 75
Figure 4.8a shows a HREM picture of a sulfided Mo/CaY catalyst. The large MoS2
slabson the outside of the zeolite particles are clearly visible. The zeolite particles are to a
large extent covered by the MoS2 slabs which are sometimes stacked up to ten or more
layers. Clearly, a large fraction of the molybdenum sulfide is located on the outer zeolite
surface. From HREM - EDX measurements it is inferred that a relatively small fraction of
the molybdenum is located inside the zeolite pores (30). The latter fraction is estimated to
correspond to about 15 % of the total molybdenum content. Besides the large MoS2 slabs
also some large particles (up to 100 nm) consisting of MoS2 and some amorphous material
can be observed on the outside of the zeolite (Fig. 4.8b). The EDX results show that these
particles contain Ca atoms. Also on the oxidic samples (before sulfidation) some particles
are observed which contain, besides 0, mainly Ca and Mo, and hardly any AI or Si. This
suggests that a calcium molybdenum oxide (probably CaMo04) has been formed after
impregnation and calcination. Possibly, some of the Ca2+ ions of the CaY support are leached
out during impregnation (they might have been replaced by the NH/ ions of the
(NH4) 6MoP24)), leading to the formation of CaMo04 on the surface of the zeolite
framework. Upon sulfidation the particles containing CaMo04 are partly converted into
MoS2• But, as CaMo04 is probably difficult to sulfide, some CaMo04 will remain after
sulfidation resulting in the presence of large particles consisting of MoS2 and some
amorphous material (Fig. 4.8b).
The distribution of the RuSx over the zeolite particles is again very inhomogeneous (Fig.
4.9a). Some zeolite particles contain almost exclusively very large ruthenium sulfide particles
at their outer surface, whereas others contain both large and small particles (small dark
spots). The concentration of ruthenium particles increases with increasing thickness of the
zeolite crystal (Fig. 4.9a; the more thick the zeolite crystal, the darker its image in the
micrograph, and the darker zeolite particles contain a higher density of small ruthenium
particles). This suggests that these ruthenium particles are located inside the zeolite pores,
since otherwise their concentration should be independent of the thickness of the zeolite
crystal. EDX experiments revealed that even for those zeolite particles on which a large
number of small sulfide particles are visible only relatively little ruthenium is actually
present (approximately 15 %). Apparently, the larger part of the ruthenium is located on the
exterior of the zeolite particles as large sulfide crystals.
Similar to the Ru/Ca Y, the Rh/Ca Y catalyst contains large sulfide particles (Rh2S3) at the
outer zeolite surface (pictures not shown), albeit that they are less abundant and that there
are more small particles present which are probably located inside the zeolite pores. This is
corroborated by EDX results on zeolite particles which contain no large rhodium
agglomerates on the exterior showing that approximately 40 % of the total Rh content is

76 Chapter 4
Figure 4.8: HREM pictures of sulfided Mo/CaY
Hydrocracking of n-decane over CaY supported transition metal sulfides 77
present in the zeolite pores. Probably, the Rh3S2 phase is distributed more homogeneously
throughout the zeolite particles than for instance the metal sulfide phase on the Mo/CaY,
Ni/Ca Y or Ru/Ca Y catalysts.
As can be seen from Fig. 4.1 0, a sulfided lr/Ca Y again contains quite a number of large
sulfide particles (IrSx) inhomogeneously distributed over the outside of the zeolite particles,
but it can clearly be seen that in addition to this there are many small dark spots which are
homogeneously distributed over the zeolite particle. These dark spots represent small IrS,
particles probably located inside the zeolite pores, because like for the sulfided Ru/Ca Y
sample, the concentration of spots (metal sulfide papticles) increases with increasing zeolite
crystal thickness. The metal sulfide fraction located inside the zeolite pores is comparable
to the Rh/Ca Y catalysts. In Fig. 4.1 Ob a large number (compared to for instance Co/CaY or
Ru/Ca Y) of small metal sulfide particles present inside the zeolite pores can be seen. The
black dots represent the iridium particles, while the grid is caused by the zeolite framework.
The size of the iridium particles varies between 1 and 4 nm. As for the Co/CaY and Ru/CaY
catalysts, the small IrSx particles which are probably located inside the zeolite pores are
larger than the supercage dimensions, a phenomenon which has also been observed for
metallic Pt/CaY zeolites (32). The explanation can be that the IrSx cluster occupies several
neighbouring supercages, or that it is located in voids and defects in the zeolite crystal.
These voids may have been formed during the formation of the metal sulfide particles.
A general conclusion which can be drawn from the above results is that on those
catalysts which are examined by HREM a large fraction of the metal sulfide phase is located
at the outside of the zeolite particles. Still there are some differences between the various
metal sulfide catalysts. Compared with the Ni, Co, Mo or Ru catalysts, on Rh/Ca Y and
Ir/CaY a relatively large part of the sulfide phase inside the zeolite pores as very small
particles. For Co/CaY, Ni/CaY, Mo/CaY or Ru/CaY the amount of metal sulfide inside the
zeolite pores is very small.
DISCUSSION Most of the CaY supported metal sulfide catalysts show high conversions for cracking
of n-decane compared with the pure CaY support, but their catalytic properties are
nevertheless far from ideal hydrocracking behaviour, as observed for instance on metallic
Pt/CaY catalysts (1, 2, 5). There are large differences in hydrocracking properties between
the various metal sulfide catalysts, which correlate roughly with the activity trends observed
for other sulfide catalyzed reactions like thiophene HDS (20, 21), HDS of dibenzothiophene
at low (22) or high (19) pressure, HDN of quinoline (23-25) and the hydrogenation (HYD)
of biphenyl (22). For the hydrocracking reaction the (de)hydrogenation function of the metal
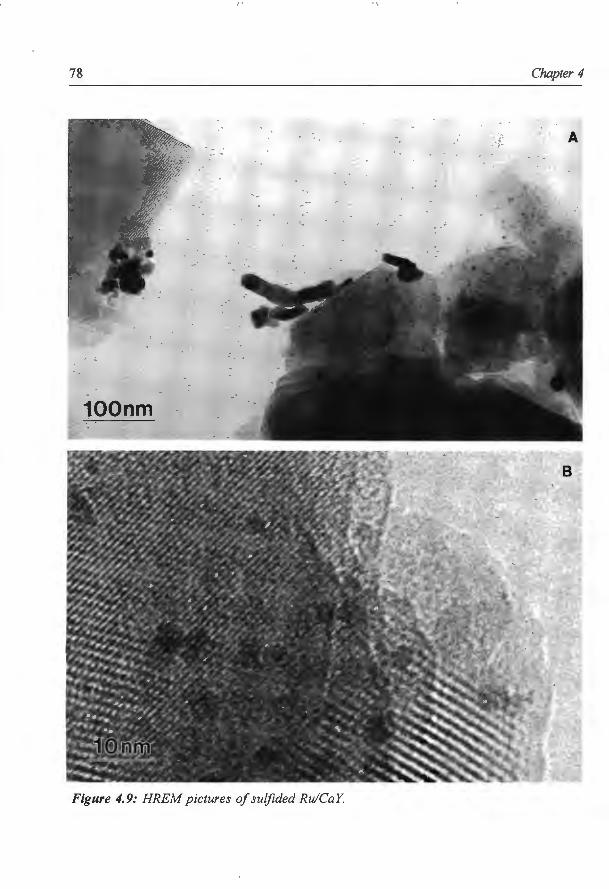
78 Chapter 4
A, ...
' ~· ~ :~ .
. --· ~.
100nm
Figure 4.9: HREM pictures of suljided Ru/CaY

Hydrocracking of n-decane over CaY supported transition metal sulfides 79
Figure 4.10: HREM pictures of suljided Ir/CaY
80 Chapter 4
sulfide is the most important catalytic property. Therefore, the hydrogenation of biphenyl
seems to be the best catalytic reaction for activity trend comparison. But also for HDS and
especially HDN reactions the hydrogenating properties of the metal sulfide are of great
importance for the catalytic activity.
Compared with the activity trends for typical HDS, HDN and HYD reactions the trend
measured for hydrocracking of n-decane shows some striking differences. Re and especially
Mo and W sulfide catalysts show a surprisingly high hydrocracking activity in comparison
with the other metal sulfides like Pd, Pt, Rh and Ir. The Ru catalyst shows a relatively low
n-decane conversion, while for all other test reactions the Ru sulfide is one of the most
active catalysts. Similar to the trends measured for the other test reactions the Fe, Co and
Ni sulfide are the least active hydrocracking catalysts, although the difference in activity
between these catalysts and the other metal sulfides seems to be large compared to the
picture that emerges from relative activities for HDS, HDN and HYD reactions. A more
detailed comparison of the activity trends for distinct test reactions is not possible due to the
differences between the test reactions, the reaction conditions, and the various preparation
methods used for the metal sulfide catalysts. Especially for the zeolite supported metal
sulfide catalysts both the position of the metal sulfide (in the zeolite pores or on the exterior)
and the dispersion may have a strong influence on the catalytic activity , as will be discussed
below.
From the product distributions shown in Table 4.2 some conclusions can be drawn
concerning the cracking mechanisms taking place on the various catalysts. Several catalysts
show a considerable production ofC1-C2 molecules especially at high reaction temperatures.
Since products containing only one or two carbon atoms could not be separately analyzed
by the G.C. system used they will be treated as a lumped fraction referred to as C1-C2. Their
formation can not be the result of {1-scission as, according to the stability rules of the
carbenium ion the formation of C 1 and C2 products during this cracking reaction is not
favoured (3, 4, 18). The C1-C2 production may be caused by hydrogenolysis (33) or by
cracking via a non-classical penta coordinated carbonium ion (PCI) as intermediate (34, 35) .
If hydrogenolysis occurs on these catalysts it should take place on the metal sulfide phase.
The fact that NaY supported Mo and Ni sulfide catalysts (which show hardly any activity
in the hydrocracking reaction due to the absence of acid sites) do not produce C 1-C2 is a
strong indication that also the corresponding CaY supported metal sulfide catalysts do not
produce C 1 and C2 via hydrogenolysis (assuming that the same metal sulfide phase is present
on both the NaY and CaY type catalysts). In addition, the fact that the pure CaY zeolite
yields a considerable amount of C 1-C2 strongly indicates that C 1-C2 formation is not due
to hydrogenolysis, but to cracking via the PCI intermediate. For almost all catalysts,
Hydrocracking of n-decane over CaY supported transition metal sulfides 81
including Rh/Ca Y and Ir/Ca Y, C l-C2 products are only observed at higher reaction
temperatures. Apparently cracking via the PCI intermediate is mainly dependent on the
reaction temperature. Besides, also the conversion and the hydrogenating properties of the
metal sulfide have some influence on the degree of cracking via the PCI intermediate.
Also secondary cracking does not proceed exclusively via f)-scission. If we assume {3-
scission to be the only secondary cracking reaction, each twofold splitted decane molecule
is converted into two C3 and one C4 molecules. From Table 4.2 we can calculate the
amounts of secondary cracking products by subtracting the primary cracking products (this
means subtracting equal amounts of C3 and C4 as there are C7 and C6 products). These
amounts are given in Table 4.5. For almost all catalysts the C4/C3 ratio is far higher than
expected if only secondary cracking is taking place. So, the {3-scission mechanism alone can
not explain this product distribution. Also abstraction of C 1 or C2 molecules via the PCI
cracking mechanism, followed by further cracking via {3-scission can not explain the high
C4 production (the C l-C2 production is too low to explain the excess formation of C4
products) . A possible explanation can be the occurrence of bimolecular reactions between
for instance alkenes and carbenium ions resulting in the formation of heavier carbenium ions:
Leglise et al. (36) proposed this formation of large carbenium ions in the cracking of n
nonane over poorly dispersed Pd/HY catalysts. These carbenium ions will probably almost
immediately be cracked into small molecules. As a consequence of this side reaction the
product distribution will be changed. The high reactivity of these large carbenium ions (37,
38) is probably the reason why large product molecules are never detected (only occasionally
traces of C8 products are found) . They are also very likely coke precursors. Also Vasquez
et al. (39) observed (C6+C5+C4)/(Cl+C2+C3) ratios higher than one in cracking of n
heptane over oxidic Ni-Mo!HY zeolites and concluded that consecutive alkylation-cracking
reactions occurred.
The almost ideal hydrocracking behaviour of the Rh and Ir sulfide catalysts contrasts
sharply with the total absence of ideal hydrocracking features on all the other catalysts. The
reason for the relatively good hydrocracking properties of these two catalysts is probably not
the presence of a metal instead of a sulfide phase (as overall sulfur analysis showed that
there are large amounts of sulfur present on these catalysts), but a combination of a relatively
good distribution of the metal sulfide phase throughout the pores of the zeolite particle
combined with a high intrinsic hydrogenation activity of these metal sulfides, as has already
been reported by others (19, 22). This is probably also the reason for the low degree of coke
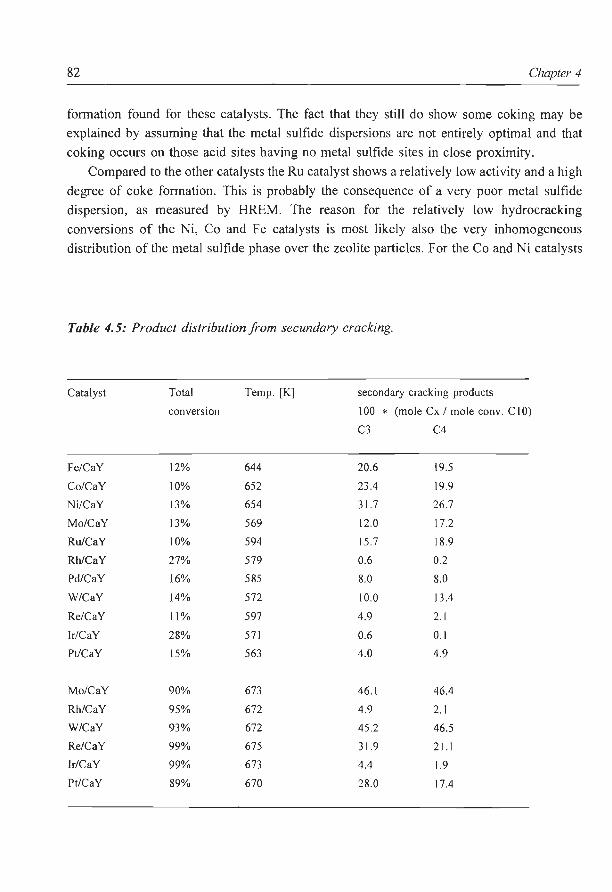
82 Chapter 4
formation found for these catalysts. The fact that they still do show some coking may be
explained by assuming that the metal sulfide dispersions are not entirely optimal and that
coking occurs on those acid sites having no metal sulfide sites in close proximity.
Compared to the other catalysts the Ru catalyst shows a relatively low activity and a high
degree of coke formation. This is probably the consequence of a very poor metal sulfide
dispersion, as measured by HREM. The reason for the relatively low hydrocracking
conversions of the Ni, Co and Fe catalysts is most likely also the very inhomogeneous
distribution of the metal sulfide phase over the zeolite particles. For the Co and Ni catalysts
Table 4. 5: Product distribution from secundary cracking.
Catalyst Total Temp. [K] secondary cracking products
conversion 100 * (mole Cx I mole conv. C I 0)
C3 C4
Fe/CaY 12% 644 20.6 19.5
Co/CaY 10% 652 23.4 19.9
Ni/CaY 13% 654 31.7 26.7
Mo/CaY 13% 569 12.0 17.2
Ru/CaY 10% 594 15.7 18.9
Rh/CaY 27% 579 0.6 0.2
Pd/CaY 16% 585 8.0 8.0
W/CaY 14% 572 10.0 13.4
Re/CaY II% 597 4.9 2.1
lr/CaY 28% 571 0.6 0.1
Pt/CaY 15% 563 4.0 4.9
Mo/CaY 90% 673 46.1 46.4
Rh/CaY 95% 672 4.9 2.1
W/CaY 93% 672 45.2 46.5
Re/CaY 99% 675 31.9 21.1
lr/CaY 99% 673 4.4 1.9
Pt/CaY 89% 670 28.0 17.4
Hydrocracking of n-decane over CaY supported transition metal sulfides 83
it was shown by HREM that a large part of the sulfide phase is located on the outside of the
zeolite crystals as large metal sulfide particles. The relatively small amounts of metal sulfide
present in the pores of the zeolite for Ni/Ca Y and Co/CaY (as observed with the combined
HREM - EDX measurements) agree well with the large coke contents found after reaction.
Because there are only small amounts of hydrogenating sulfide species present in the pores,
coke formation can not be prevented and is therefore high.
Also for Mo/Ca Y and W /CaY much coke is found to be present after reaction. But in
spite of the large coke contents and the most probably low dispersion of the metal sulfide,
these catalysts show surprisingly high hydrocracking conversions. The product selectivities
of these catalysts however show that there is a strong unbalance between the hydrogenation
function and the acidic function, resulting in a high degree of secondary cracking.
For the Mo/Ca Y catalyst it is shown that probably some of the Ca2+ ions are leached out
of the zeolite support during impregnation (HREM - EDX results). Also for the W/CaY
catalysts some removal of Ca2+ from the zeolite support may have occurred. This may lead
to a stronger acidity of the zeolite support after sulfidation, and consequently to a higher
hydrocracking activity. For hydrocracking both the (de)hydrogenation reaction as the acid
catalyzed cracking reaction will influence the conversion. A stronger (de )hydrogenation
function will lead to a higher alkene concentration, and consequently to a higher cracking
rate. But, a higher amount of acid sites will also result in a higher cracking rate.
Consequently the stronger acidity of the Mo/Ca Y catalysts can result in a higher
hydrocracking conversion as well as a higher degree of secondary cracking. The amount of
Ca containing Mo particles as observed by HREM is low, indicating that theCa removal will
cause only a rather small :ncrease of the acidity of the zeolite support. It is not clear whether
this effect is strong enough to explain the relatively high hydrocracking activities of the Mo
and W catalysts. It may explain however the very high degree of coking observed on these
catalysts.
In agreement with the results reported by Leglise et al. (13) the Mo/Ca Y is not fully
sulfided. The incomplete sulfidation may have been caused by the presence of large
molybdenum oxide particles on the exterior of the zeolite particles (30). Furthermore, the
CaMo04 formed after impregnation may be difficult to convert into MoS2. The HREM
results however suggest that the CaMo04 particles are partially converted into MoS2. The
presence of incompletely sulfided molybdenum oxide or CaMo04 particles may have some
influence on the hydrocracking properties of the Mo/Ca Y catalyst. But, as most of these
particles will be partially or completely covered by MoS2 layers (the surface of the
molybdenum oxide particles is usually more easily sulfided than the core ( 40)), their
influence on the catalytic properties will not be very strong.
84 Chapter 4
In view of the incomplete sulfidation of the Mo/Ca Y catalyst the full sulfidation of the
W/CaY catalyst (measured by overall sulfur analysis) is somewhat surprising. Scheffer eta!.
( 41) showed that both W03 and WI AlP3 catalysts are difficult to sulfide. Additionally
W/CaY may also contain large bulk like W03 particles and/or CaW04, which, comparable
with the Mo/Ca Y catalyst, should hamper the sulfidation.
Re/Ca Y also shows a high hydrocracking conversion at high reaction temperatures, but
the degree of secondary cracking and the coke formation on this catalyst are lower than on
Mo/CaY and W/CaY, indicating a better balance between the hydrogenation and the acidic
function on this catalyst. The unstable conversions measured at temperatures below 600 K
are most likely caused by the phase transition of the ReS2 to Re2S7 (21). Because of the low
temperatures and the low H2S/H2 ratio the phase transition will be very slow (overall sulfur
analysis showed that after 24 h at 550 K this transition is still not completed) which explains
why the conversion remains unstable for a long period of time.
Summarizing, it can be concluded that the activity trend for hydrocracking measured for
CaY supported metal sulfides is determined by both the hydrogenation properties of the
metal sulfide and its distribution over the zeolite particle. The ideal hydrocracking behaviour
oflr/CaY and Rh/CaY can be explained by the strong hydrogenation properties (19-25) of
these metal sulfides in combination with their relatively good distribution throughout the
zeolite particle. Also for the Pd/Ca Y and Pt/Ca Y the metal sulfide distribution will probably
be relatively homogeneous, but as the hydrogenation properties of these metal sulfides are
less strong compared to lr and Rh sulfide, the Pd!Ca Y and Pt/Ca Y catalysts show lower
conversions and no ideal hydrocracking behaviour. The surprisingly high activity measured
for Re and especially Mo and W sulfide catalysts in comparison to the other metal sulfides
such as Pd, Pt, Rh and Ir may have been caused by a relatively high acidity of the zeolite
support (due to the formation of CaMo04 or CaW04). The remarkably low conversions
observed for the Ru, Fe, Co and Ni sulfide catalysts (compared to the activity trends
measured for other test reactions (19-25)) are mainly caused by the inhomogeneous
distribution of the metal sulfide and the consequently low amount of metal sulfide located
in the zeolite pores for these catalysts. On all catalysts except Rh/Ca Y and Ir/Ca Y the
hydrogenation function is too weak to obtain ideal hydrocracking behaviour.
On all catalysts the distribution of the metal sulfide over the zeolite particle is very
inhomogeneous (even for Rh/Ca Y and I riCa Y only approximately 40 % of the metal sulfide
is located in the zeolite pores). A large part of the sulfide is located on the outside of the
zeolite particles (sometimes as large metal sulfide crystallites). As a result, the catalysts show
a high degree of coke formation and a strong unbalance between the hydrogenation and the
acidic function. Possibly, higher conversions and/or catalytic properties more close to ideal
Hydrocracking of n-decane over CaY supported transition metal sulfides 85
hydrocracking could be obtained via preparation methods resulting in a high metal sulfide
dispersion and a homogeneous distribution of the metal sulfide throughout the zeolite
particles.
CONCLUSIONS
All the CaY supported metal sulfide catalysts show cracking conversions which are
significantly higher than that of the CaY support. Their hydrocracking activity is determined
by both the hydrogenation properties of the metal sulfide present and its distribution over the
zeolite particle. The relatively good distribution of the Rh and Ir sulfide phase throughout
the zeolite particle, combined with their intrinsically strong hydrogenation properties (19-25)
results in almost ideal hydrocracking behaviour for sulfided Rh/Ca Y and lr/Ca Y. Those
catalysts having a metal sulfide phase mainly located on the outside of the zeolite crystals,
show a high degree of coking, lower conversions and non-ideal hydrocracking properties.
Mo/CaY and W/CaY show relatively high hydrocracking conversions in spite of the high
amount of metal sulfide located on the outside of the zeolite crystals and the high degree of
coke formation. This can be due to a relatively high acidity of the zeolite caused by the
exchange of Ca2+ by NH/ during impregnation.
References
I. Schulz, H. and Weitkamp, J., Ind. Eng. Chern. Prod. Res. Dev. 11 (1972) 46.
2. Weitkamp, J. , Ind. Eng. Chern. Prod. Res. Dev. 21 (1982) 550.
3. Martens, J.A., Jacobs P.A. and Weitkamp, J., Appl. Catal. 20 (1986) 239.
4. Jacobs, P.A. and Martens, J.A., Stud. Surf Sci. Catal. 58 (1991) 445.
5. Jacobs, P.A., Uytterhoeven, J.B., Steyns, M., Froment, G. and Weitkamp, J., in ' Proc. 7'h Int.
Conf. on Zeolites.', Rees, L.V.C., Ed., p. 607. Heyden, London, 1980.
6. Ward, J. W. , Fuel Proc. Technology 35 (1993) 55.
7. Brooks, C.S., Surf Techno!. 10 (1980) 379.
8. Cid, R., Villasenor, J., Orellana, F., Fierro, J.L.G. and Lopez Agudo, A, Appl. Catal.18
(1985) 357.
9. Cid, R., Fierro, J.L.G. and Lopez Agudo, A, Zeolites 10 (1990) 95.
10. Davidova, N., Kovacheva, P. and Shopov, D., Zeolites 6 (1986) 304.
11. Kovacheva, P., Davidova, N. and Novakova, J., Zeolites 11 (1991) 54.
12. Laniecki, M. and Zmierczack, W., in 'Zeolite chemistry and catalysis', Jacobs P.A., et al.
Eds., p. 331. Elsevier, Amsterdam, 1991.
86 Chapter 4
13. Leglise, J., Janin, A., Lavalley, J.C. and Cornet, D., J. Catal. 114 (1988) 388.
14. Leglise, J., el Qotbi, M., Goupil, J.M. and Cornet, D., Catal. Lett. 10 (1991) 103.
15. Yan, T.Y., Ind. Eng. Chern. Res. 29 (1990) 1995.
16. Ward, J.W., Stud. Surf Sci. Catal. 16 (1983) 587.
17. Esener, A.A. and Maxwell, I.E., in 'Advances in Hydrotreating Catalysts', Ocelli, M.L. and
Anthony, R.G., Eds., p. 263. Elsevier, Amsterdam 1989.
18. Martens, J.A., Jacobs, P.A. and Weitkamp, J., Appl. Catal. 20 (1986) 283.
19. Pecoraro, T.A. and Chianelli, R.R., J. Catal. 67 (1981) 430.
20. Vissers, J.P.R., Groot, C.K., van Oers, E.M., de Beer, V.H.J. and Prins, R., Bull. Soc. Chim.
Belg. 93 (1984) 813.
21. Ledoux, M.L., Michaux, 0., Agostini, G., and Panissod, P., J. Catal. 102 (1986) 275.
22. Lacroix, M., Boutarfa, N., Guillard, C., Vrinat, M. and Breysse, M., J. Catal. 120 (1989) 473.
23. Eysbouts, S., de Beer V.H.J. and Prins, R., J. Catal. 109 (1988) 217.
24. Eijsbouts, S., Sudhakar, C., de Beer, V.H.J. and Prins, R., J. Cat a!. 127 (1991) 605.
25. Eijsbouts, S., de Beer, V.H.J. and Prins, R., J. Catal. 127 (1991) 619.
26. Weitkamp, 1., ACS Symposium Series 20 (1975) I.
27. Steijns, M., Froment, G., Jacobs, P.A., Uytterhoeven, J.B. and Weitkamp, J., Ind. Eng. Chern.
Prod. Res. Dev. 20 ( 1981) 654.
28. Mangnus, P.J., Ph. D. Thesis, University of Amsterdam, The Netherlands, 1991.
29. Burch, R. and Collins, A., J. Catal. 97 (1986) 385.
30. Chapter 6 of this Thesis.
31. Chapter 2 of this Thesis.
32. Lunsford, J.H. and Treybig, D.S., J. Catal. 68 (1981) 192.
33. Sinfelt, J.H., Adv. Cat a!. 23 ( 1973) 91.
34. Haag, W.O. and Dessau, R.M., in 'Proc. 8'h Int. Cong. Catal.', Berlin, 1984, Part II, p. 305.
Verlag Chemie, Weinheim, 1984.
35. Mirodatos, C. and Barthomeuf, D., J. Catal. 114 (1988) 121.
36. Leglise, J., Chambellan, A. and Cornet, D., Appl. Catal. 69 (1991) 15.
37. Sie, S.T., Ind. Eng. Chern. Res. 32 (1993) 403.
38. Weitkamp, J., Erda! und Kahle, Erdgas, Petrochemie 31 (1978) 13.
39. Vasquez, M.I., Escardino, A. and Corma, A., Ind. Eng. Chern. Res. 26 (1987) 1495.
40. Arnoldy, P., van den Heykant, J.A.M., de Bok, G.D. and Moulijn, J.A., J. Catal. 92 (1985)
35.
41. Scheffer, B., Mangnus, P.J. and Moulijn, J.A., J. Catal. 121 (1990) 18.
5 HYDROCRACKING OF N-DECANE OVER ZEOLITE SUPPORTED METAL SULFIDE
CATALYSTS: (II) ZEOLITE Y SUPPORTED Ni AND Ni-Mo SULFIDES
ABSTRACT
For zeolite Y supported nickel sulfide catalysts the influence of the metal sulfide
dispersion on the hydrocracking properties for n-decane is examined. In order to obtain
different nickel sulfide distributions (inside or outside the zeolite structure) and disper
sions the preparation method (impregnation of CaY or ion exchange of NaY), sulfidation
procedure (direct sulfidation or sulfidation after drying) as well as metal loading are
varied. A higher nickel sulfide surface (as measured by Dynamic Oxygen Chemisorption)
results in a strong increase of the n-decane conversion, but this is not accompanied by an
improvement of the catalytic properties towards ideal hydrocracking. Additionally, some
zeolite Y supported Ni-Mo sulfide catalysts (varying in preparation method and sul
fidation procedure) are tested for the hydroconversion of n-decane. However, no promotor
effect could be observed . The activity of the bimetallic sulfide catalysts is always almost
equal to that of the most active monometallic sulfide constituent.
87

88 Chapter 5
INTRODUCTION
Hydrocracking is one of the major processes for the conversion of heavy oil fractions
(large high boiling molecules) into more valuable clean low boiling products (1, 2). For
this process bifunctional catalysts with both a hydrogenation - dehydrogenation and a
cracking function are needed. Typical examples of these types of catalysts are noble
metals (Pt, Pd) supported by acidic zeolites. Weitkamp et al. (3, 4) and Jacobs et al. (5-8)
examined the reaction mechanism for the hydrocracking of higher paraffins over these
types of catalysts extensively.
However, modem hydrocracking catalysts are required to have a flexible product
selectivity combined with a high activity and a high resistance against hetero atom (S, N,
0) containing molecules. These requirements can be met by combining a zeolite with a
sulfidic hydrogenation catalyst. In part I of this study (9) several CaY supported transition
metal sulfide (Fe, Co, Ni, Mo, Ru, Rh, Pd, W, Re, Ir and Pt) catalysts prepared by
impregnation are compared on their hydrocracking properties. The CaY supported Rh and
Ir sulfide catalysts show almost ideal hydrocracking behaviour (high conversions
combined with a high product selectivity for isomerization of n-decane and almost no
secondary cracking (8)). The lowest conversions are measured for the Fe, Co and Ni
sulfide catalysts. These catalysts show no isomerization of n-decane and a high degree of
secundary cracking, indicating that the hydrocracking properties are far from ideal ( 8).
For zeolite Y supported nickel sulfide catalysts, Welters et al. (10) have shown that both
the preparation method (impregnation of CaY or ion exchange of NaY) and the sul
fidation procedure (direct sulfidation or sulfidation after drying) can influence the
dispersion and distribution of the sulfide phase (inside or outside the zeolite pores) and
consequently the thiophene hydrodesulfurization activity of these catalysts. Based on their
findings one may assume that also for hydrocracking catalysts improvement of the metal
sulfide dispersion results in a higher conversion and/or catalytic properties more close to
ideal hydrocracking (8). In order to verify this assumption, the influence of the metal
sulfide dispersion on the hydrocracking properties is examined by studying the hydro
conversion of n-decane at moderate pressure (3.0 MPa) for zeolite supported nickel
sulfide catalysts. The dispersion of the nickel sulfide phase is varied by changing the
preparation and sulfidation methods. Dynamic Oxygen Chemisorption (DOC) is used to
compare the dispersion of the nickel sulfide phase.
In commercial hydrocracking catalysts usually Mo or W sulfide promoted by Ni or
Co sulfide are used. Combination of these metal sulfides results in very active hydro
treating catalysts, due to the presence of a so called CoMoS or NiMoS phase ( 11, 12).
Hydrocracking of n-decane over Ni and Ni-Mo sulfide catalysts 89
Possibly, a CoMoS or NiMoS phase can also be prepared on an acidic zeolite support.
Hydrocracking catalysts consisting of a zeolite supported CoMoS or NiMoS phase might
show a substantially higher hydrocracking activity than the single metal sulfide catalysts.
Several studies (1 3-18) have been performed to investigate the promotor effect on
sulfided zeolite supported bimetallic Co-Mo or Ni-Mo catalysts. In some of them a
promotor effect is reported, for instance by Cid et a!. (1 4) and Laniecki and Zmierczack
(17) for thiophene hydrodesulfurization (HDS) and by Leglise et al. (1 8) for benzene
hydrogenation at medium high pressure. However, the general picture is that the promoter
effects, if present at all, are very small. In the present study it is attempted to obtain a
synergetic effect between Mo and Ni sulfide in zeolite supported sulfided Ni-Mo catalysts
in order to achieve a better balance between the (de)hydrogenation and the acidic function
for hydrocracking of n-decane.
EXPERIMENTAL
Catalyst preparation
The CaY support (C~5Na6(A102)56(Si02) 136 * x Hp) is prepared from a NaY
(Na54(Al02) 54(Si02) 138 * x Hp; PQ, CBV -1 00) zeolite by ion exchange with aqueous
CaCl2 solutions followed by washing until Cl· free. CaY supported catalysts containing 4
and 8 wt % Ni are prepared by pore volume impregnation with aqueous solutions of
Ni(N03) 2 . After impregnation, the catalysts are dried in static air at 383 K for 16 h,
followed by calcination in static air at 673 K for 2 h.
NiNaY zeolites containing 4 and 8 wt% Ni are prepared by ion exchange with NiC12
aqueous solutions. After filtration, the zeolite is washed until c1· free and dried at 383 K
for 16 h in static air. The impregnation and ion exchange type catalysts are denoted as
Ni(x)/CaY and Ni(x)NaY respectively, with x representing the weight percentage nickel
(determined by AAS and calculated on the basis of the water-free zeolite).
One bimetaJJic catalyst is prepared by pore volume impregnation with an ammonium
heptamolybdate (AHM) solution of appropriate concentration on Ni(8)NaY zeolite
(Mo(7)/Ni(8)NaY, the catalyst contains 7 wt% Mo). A second Ni-Mo catalyst is prepared
by consecutive impregnation of CaY with an AHM solution and a Ni(N03) 2 solution
(Ni(8)/Mo(7)/CaY). After each impregnation step the catalyst is dried in air at 383 K (16
h) and calcined at 673 K (2 h).
All samples are stored in a desiccator over a saturated CaC12 solution. Prior to
catalytic testing the powders are pressed, grinded and sieved to obtain a particle size
fraction between 125 and 425 t-tm.
90 Chapter 5
Hydrocracking of n-decane All hydrocracking experiments are performed in a microflow reactor containing about
0.8 g of dry catalyst mixed with 5 g of SiC (particle size 0.5 mm) at a total pressure of
3.0 MPa. Prior to reaction the catalysts are sulfided at 673 K (6 K min-1 from room
temperature to 673 K, 2 hat 673 K) in a 10% H2S in H2 flow of 100 std cm3 min-1 at 3.0
MPa pressure (standard sulfidation). In previous work it is shown that drying before
sulfidation can lead to a strong increase in nickel sulfide dispersion (1 0). Therefore, in
some cases sulfidation is preceded by in situ drying at 673 K (heating rate 6 K min-1) in
a He flow. At this temperature the flow is switched to a 10% H2SIH2 flow ( 100 std cm3
min- 1) and the catalyst is sulfided for 2 hat atmospheric pressure (dry sulfidation). The
sulfidation pretreatment is given in brackets after the catalyst notation. Standard
sulfidation and dry sulfidation are abbreviated to (st sulf) and (dry sulf) respectively.
During reaction a H2SIH2 gas flow is led over the catalysts (total flow 1250 std cm3
min-1, H2S : H2 = 1 : 1250). Liquid n-decane is pumped into the system where it is
immediately evaporated and mixed with the H2SIH2 gas flow (liquid flow rate of SO p.l
min·\ molar ratio n-decane : H2 = I : 200; W !F = 0.37 &at. h gn·decan; 1). Gas samples are
taken at the reactor exit and analyzed with an on line gas chromatograph equipped with
a UCON LB 550 X capillary column. The products with one or two carbon atoms can
not be separated by this analysis and for the comparison of product selectivities they are
therefore treated as a Jumped fraction referred to as C l-C2.
Before starting the activity measurement cycle the catalyst is stabilized at 673 K for
roughly 48 h. Subsequently, the reaction temperature is decreased in steps of approxi
mately 20 K, holding the temperature at each step until the conversion is stable. In this
way the n-decane conversion is measured as a function of temperature. At the end of each
run the temperature was increased to 673 K to examine the deactivation of the catalyst
during the entire activity test.
Catalyst characterization Thermogravimetric analysis (TGA) is used to determine the coke content of the spent
nickel sulfide catalysts (oxidation in a 20 % 0 2/He flow, Seteram TG 85 balance).
Because the oxidation of the coke deposits and the metal sulfide phase can not be
separated, the measured weight loss is corrected for the weight loss due to the oxidation
of the nickel sulfide, assuming the presence of Ni3S2.
Dynamic Oxygen Chemisorption (DOC) measurements are used to determine the
relative nickel sulfide dispersion (19-22). Two different sulfidation procedures are used:
(I) the "dry sulf' type samples are directly sulfided in the DOC reactor using the
Hydrocracking of n-decane over Ni and Ni-Mo sulfide catalysts 91
atmospheric pressure procedure described in the previous section; (II) the "st sulf' type
samples are first sulfided ex situ using the high pressure procedure described in the
previous section. Subdsequently, they are sulfided in the DOC reactor at atmospheric
pressure. Control measurements showed that the air contact and the resulfidation have no
measurable influence on the nickel sulfide dispersion. After sulfidation the catalysts are
flushed for one hour at 673 K in He (02 and H20 levels lower than I ppm) to remove
adsorbed H2S, and then cooled to 333 K, at which temperature the oxygen chemisorption
is performed. At this temperature the support does not chemisorb oxygen. According to
Bachelier et al. (19-21) side reactions (S02 and COS formation) are avoided, and the
oxygen is adsorbed irreversibly on the sulfide catalyst. Pulses of 5 % 0 2 in He are
injected in the carrier gas flow and passed over the catalyst sample and a thermal
conductivity detector. When effluent peaks are increased to a constant size (less than 1 %
difference between two successive peaks) the total 0 2 uptake is calculated.
RESULTS
In Fig. 5.1 the conversion ofNi(4)/CaY (st suit) is compared with that ofNi(4)NaY
(st suit). The catalysts appear to have a similarly low conversion. An increase of the
nickel loading to 8 wt % does not result in a significant change of the hydrocracking
properties neither for Ni(8)/Ca Y (st suit) nor for Ni(8)Na Y (st suit) (the results of these
activity measurements are not shown). When dry sulfidation is applied, the catalysts
become much more active, with the strongest increase in activity being observed for the
ion exchanged type catalysts (see Fig. 5.1). In the case of the impregnated Ni(x)/CaY
(dry suit) samples an increase of the nickel content to 8 wt% does not influence the
n-decane conversion (Ni(8)/CaY (dry suit) is therefore not shown). In contrast herewith,
Ni(8)NaY (dry suit) shows a clearly higher activity than Ni(4)NaY (dry suit).
In Table 5.1 the product distributions of the Ni catalysts shown in Fig. 5.1 are given.
None of the catalysts shows any isomerisation of n-decane. Comparison of the product
distributions at the same conversion (about 15%) suggest that the improved activity for
dry sulfided catalysts leads to less secondary cracking, as the number of cracked products
per cracked molecule of decane decreases (Table 5.1, last column), especially for the ion
exchanged catalysts. However, as these catalysts do not show ideal hydrocracking
behaviour, the product distribution is not only dependent on the conversion, but also on
the reaction temperature (23). When the product selectivities are compared at almost the
same reaction temperature (about 660 K) the degree of secondary cracking for the dry
sulfided catalysts appears to be as high as or even higher than for the standard sulfided

92
100
80 ,........, ~
c: 60 0 UJ '--Q) 40 > c: 0 u
20
0 525 575 625 675
temperature [K]
Chapter 5
Figure 5.1: Conversion of n-decane as function of the reaction temperature: .&. Ni(4)/CaY (st sulf); • Ni(4)NaY (st sulf); + Ni(4)/CaY (dry sulf); t. Ni(4)NaY (dry sulf); o Ni(8)NaY (dry sulf).
catalysts. Apparently, the dry sulfidation does not result in a significantly lower degree
of secondary cracking. Also the nickel loading does not have a strong effect on the
product selectivities, not even for Ni(8)NaY (dry sulf), despite its clearly higher
conversion compared to Ni(4)NaY (dry sulf).
In Table 5.2 the coke contents of various spent nickel sulfide catalysts are given. On
all catalysts a high amount of coke is deposited during the activity test. The amount
decreases if the catalysts are dried prior to sulfidation. Also the increase in nickel loading
on Ni(x)NaY (dry sulf) leads to a decrease in coke deposition.
The amounts of oxygen chemisorbed on the catalysts as determined by DOC are
presented in Table 5.3. This amount is a measure for the relative nickel sulfide surface
area. Both standard sulfided catalysts (Ni(4)/CaY and Ni(4)NaY) show a similar 0 2
chemisorption. The oxygen uptake increases if the catalysts are dried before sulfidation.
The increase is strongest for the ion exchanged sample. The 4 and 8 wt% Ni containing
Ni(x)/CaY (dry sulf) samples adsorb similar amounts of 0 2, indicating a comparable
sulfide surface area in spite of the different nickel contents. Ni(8)Na Y (dry sulf) shows
an increase in oxygen chemisorption compared to Ni(4)NaY (dry sulf). However, the
increase is not proportional to the increase in nickel loading, indicating that the nickel
sulfide dispersion in Ni(8)NaY (dry sulf) is lower than in Ni(4)NaY (dry sulf).
Possibly, an improvement of the hydrocracking activity can also be obtained by the
use of bimetallic catalysts. The presence of both Ni and Mo may generate a synergetic
effect (I 1, 12) resulting in a stronger hydrogenation function, and, consequently, in higher
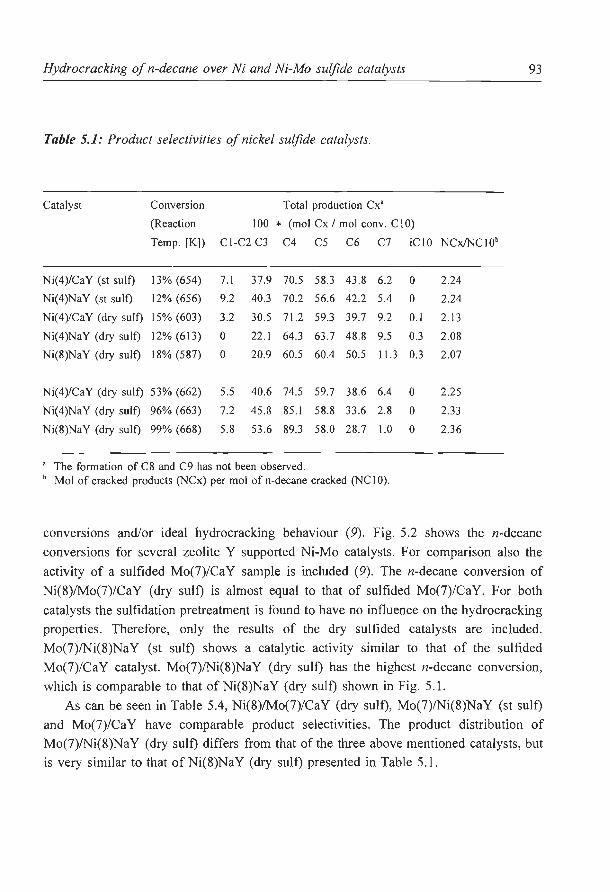
Hydrocracking of n-decane over Ni and Ni-Mo sulfide catalysts 93
Table 5.1: Product selectivities of nickel sulfide catalysts.
Catalyst Conversion Total production Cx'
(Reaction 100 * (mol Cx I mol conv. C!O)
Temp. [K]) C l-C2 C3 C4 cs C6 C7 iCIO NCx!NC! Ob
Ni(4)/CaY (st suit) 13% (654) 7.1 37.9 70.5 58.3 43.8 6.2 0 2.24
Ni(4)NaY (st suit) 12% (656) 9.2 40.3 70.2 56.6 42.2 5.4 0 2.24
Ni(4)/CaY (dry suit) 15% (603) 3.2 30.5 71.2 59.3 39.7 9.2 0.1 2.13
Ni(4)NaY (dry suit) 12% (613) 0 22.1 64.3 63.7 48.8 9.5 0.3 2.08
Ni(8)NaY (dry suit) 18% (587) 0 20.9 60.5 60.4 50.5 11.3 0.3 2.07
Ni(4)/CaY (dry suit) 53% (662) 5.5 40.6 74.5 59.7 38.6 6.4 0 2.25
Ni(4)NaY (dry suit) 96% (663) 7.2 45.8 85.1 58.8 33 .6 2.8 0 2.33
Ni(8)NaY (dry suit) 99% (668) 5.8 53.6 89.3 58.0 28.7 1.0 0 2.36
' The formation of C8 and C9 has not been observed. b Mol of cracked products (NCx) per mol of n-decane cracked (NC 1 0).
conversions and/or ideal hydrocracking behaviour (9). Fig. 5.2 shows the n-decane
conversions for several zeolite Y supported Ni-Mo catalysts. For comparison also the
activity of a sulfided Mo(7)/CaY sample is included (9). The n-decane conversion of
Ni(8)/Mo(7)/CaY (dry sulf) is almost equal to that of sulfided Mo(7)/CaY. For both
catalysts the sulfidation pretreatment is found to have no influence on the hydrocracking
properties. Therefore, only the results of the dry sulfided catalysts are included.
Mo(7)/Ni(8)NaY (st sulf) shows a catalytic activity similar to that of the sulfided
Mo(7)/CaY catalyst. Mo(7)/Ni(8)NaY (dry sulf) has the highest n-decane conversion,
which is comparable to that ofNi(8)NaY (dry sulf) shown in Fig. 5.1.
As can be seen in Table 5.4, Ni(8)/Mo(7)/CaY (dry sulf), Mo(7)/Ni(8)NaY (st sulf)
and Mo(7)/Ca Y have comparable product selectivities. The product distribution of
Mo(7)/Ni(8)N a Y (dry sui f) differs from that of the three above mentioned catalysts, but
is very similar to that of Ni(8)Na Y (dry sulf) presented in Table 5 .1.
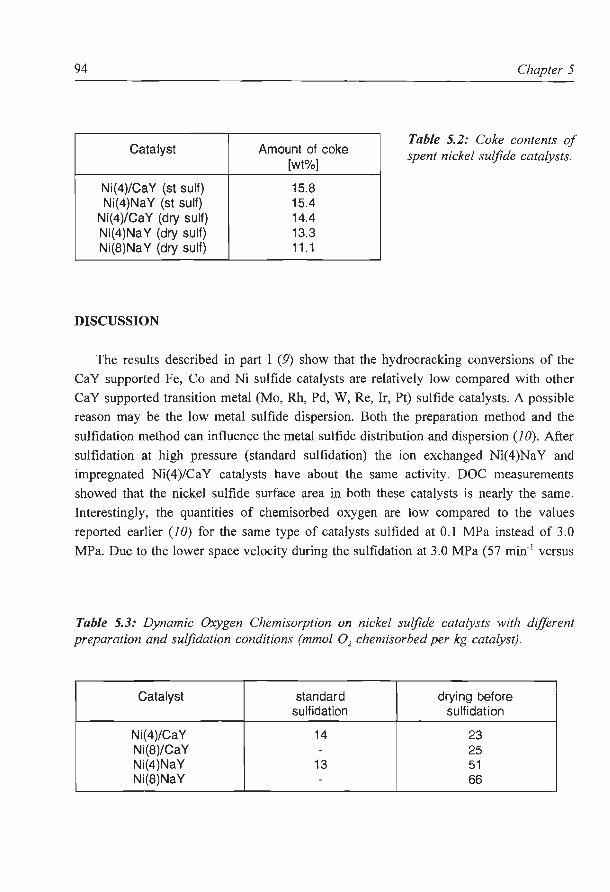
94
Catalyst
Ni(4)/CaY (st sulf) Ni(4)NaY (st sulf)
Ni(4)/CaY (dry sulf) Ni(4)NaY (dry sulf) Ni(S)Na Y (dry sulf)
DISCUSSION
Amount of coke [wt%]
15.8 15.4 14.4 13.3 11.1
Chapter 5
Table 5.2: Coke contents of spent nickel sulfide catalysts.
The results described in part I (9) show that the hydrocracking conversions of the
CaY supported Fe, Co and Ni sulfide catalysts are relatively low compared with other
CaY supported transition metal (Mo, Rh, Pd, W, Re, Ir, Pt) sulfide catalysts. A possible
reason may be the low metal sulfide dispersion. Both the preparation method and the
sulfidation method can influence the metal sulfide distribution and dispersion (1 0). After
sulfidation at high pressure (standard sulfidation) the ion exchanged Ni(4)NaY and
impregnated Ni(4)/CaY catalysts have about the same activity. DOC measurements
showed that the nickel sulfide surface area in both these catalysts is nearly the same.
Interestingly, the quantities of chemisorbed oxygen are low compared to the values
reported earlier (1 0) for the same type of catalysts sulfided at 0.1 MPa instead of 3.0
MPa. Due to the lower space velocity during the sulfidation at 3.0 MPa (57 min-1 versus
Table 5.3: Dynamic Oxygen Chemisorption on nickel sulfide catalysts with different preparation and sulfidation conditions (mmol 0 2 chemisorbed per kg catalyst).
Catalyst standard drying before sulfidation sulfidat ion
Ni(4)/CaY 14 23 Ni(8)/CaY - 25 Ni(4)NaY 13 51 Ni(8)NaY - 66
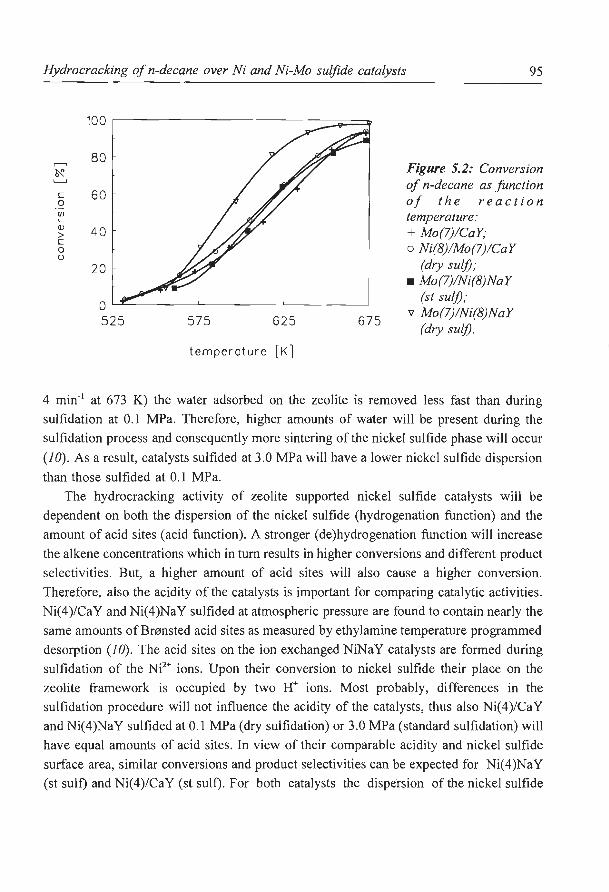
Hydrocracking of n-decane over Ni and Ni-Mo sulfide catalysts
100
80 ~
~
c 0
60 (f)
'-Q) 40 > c 0 (.)
20
0 525 575 625 675
temperature [K]
95
Figure 5.2: Conversion of n-decane as function of the reaction temperature: + Mo(7)/CaY; o Ni(8)/Mo(7)/CaY
(dry sulj); • Mo(7)/Ni(8)NaY
(st sulj); v Mo(7)/Ni(8)NaY
(dry sulj).
4 min- 1 at 673 K) the water adsorbed on the zeolite is removed less fast than during
sulfidation at 0.1 MPa. Therefore, higher amounts of water will be present during the
sulfidation process and consequently more sintering of the nickel sulfide phase will occur
(10) . As a result, catalysts sulfided at 3.0 MPa will have a lower nickel sulfide dispersion
than those sulfided at 0.1 MPa.
The hydrocracking activity of zeolite supported nickel sulfide catalysts will be
dependent on both the dispersion of the nickel sulfide (hydrogenation function) and the
amount of acid sites (acid function). A stronger (de )hydrogenation function will increase
the alkene concentrations which in tum results in higher conversions and different product
selectivities. But, a higher amount of acid sites will also cause a higher conversion.
Therefore, also the acidity of the catalysts is important for comparing catalytic activities.
Ni(4)/CaY and Ni(4)NaY sulfided at atmospheric pressure are found to contain nearly the
same amounts of Bmnsted acid sites as measured by ethylamine temperature programmed
desorption (1 0). The acid sites on the ion exchanged NiNa Y catalysts are formed during
sulfidation of the Nf+ ions. Upon their conversion to nickel sulfide their place on the
zeolite framework is occupied by two H+ ions. Most probably, differences in the
sulfidation procedure will not influence the acidity of the catalysts, thus also Ni(4)/CaY
and Ni(4)NaY sulfided at 0. I MPa (dry sulfidation) or 3.0 MPa (standard sulfidation) will
have equal amounts of acid sites. In view of their comparable acidity and nickel sulfide
surface area, similar conversions and product selectivities can be expected for Ni(4)NaY
(st sulf) and Ni(4)/CaY (st sulf). For both catalysts the dispersion of the nickel sulfide
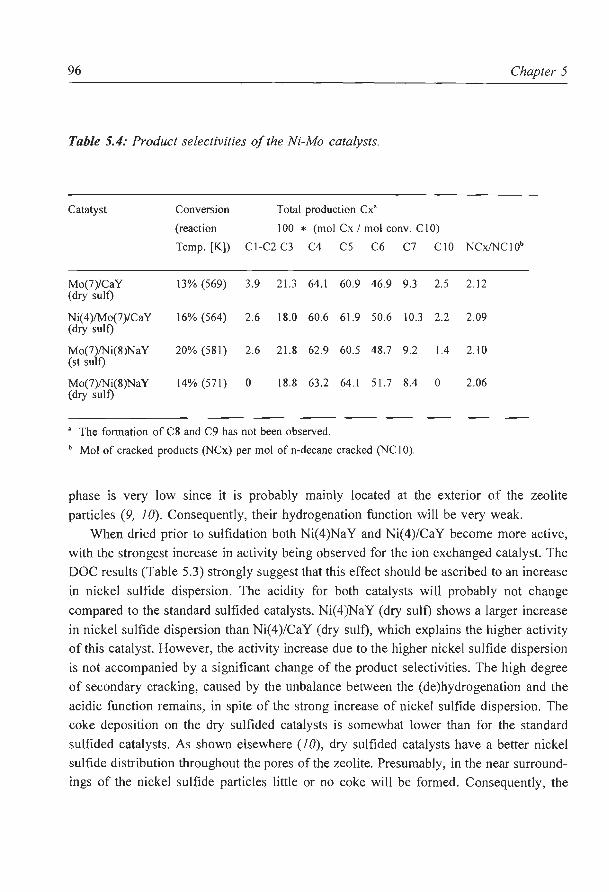
96 Chapter 5
Table 5.4: Product selectivities of the Ni-Mo catalysts.
Catatyst Conversion Total production Cx'
(reaction 100 * (mol Cx I mol conv. CIO)
Temp. [K)) CI-C2 C3 C4 C5 C6 C7 CIO NCx/NCIOb
Mo(7)/CaY (dry sulf)
13% (569) 3.9 21.3 64 .1 60.9 46.9 9.3 2.5 2.12
Ni(4)/Mo(7)/CaY 16% (564) 2.6 18.0 60.6 61.9 50.6 10.3 2.2 2.09 (dry sulf)
Mo(7)/Ni(8)NaY (st sulf)
20% (581) 2.6 21.8 62.9 60.5 48.7 9.2 1.4 2.10
Mo(7)/Ni(8)NaY 14% (571) 0 18.8 63.2 64.1 51.7 8.4 0 2.06 (dry sulf)
' The formation of C8 and C9 has not been observed.
b Mol of cracked products (NCx) per mol of n-decane cracked (NC I 0).
phase is very low since it is probably mainly located at the exterior of the zeolite
particles (9, 10). Consequently, their hydrogenation function will be very weak.
When dried prior to sulfidation both Ni(4)NaY and Ni(4)/CaY become more active,
with the strongest increase in activity being observed for the ion exchanged catalyst. The
DOC results (Table 5.3) strongly suggest that this effect should be ascribed to an increase
in nickel sulfide dispersion. The acidity for both catalysts will probably not change
compared to the standard sulfided catalysts. Ni(4)NaY (dry suit) shows a larger increase
in nickel sulfide dispersion than Ni(4)/CaY (dry suit), which explains the higher activity
of this catalyst. However, the activity increase due to the higher nickel sulfide dispersion
is not accompanied by a significant change of the product selectivities. The high degree
of secondary cracking, caused by the unbalance between the (de)hydrogenation and the
acidic function remains, in spite of the strong increase of nickel sulfide dispersion. The
coke deposition on the dry sulfided catalysts is somewhat lower than for the standard
sulfided catalysts. As shown elsewhere (I 0), dry sulfided catalysts have a better nickel
sulfide distribution throughout the pores of the zeolite. Presumably, in the near surround
ings of the nickel sulfide particles little or no coke will be formed. Consequently, the
Hydrocracking of n-decane over Ni and Ni-Mo sulfide catalysts 97
better nickel sulfide distribution throughout the zeolite pores will prevent at least partially
the formation of coke in these pores. As a result, a larger part of the zeolite pores and
thus more acid sites are available for hydrocracking reactions. Nevertheless, even the
amount of coke present in the dry sulfided catalyst is relatively high, indicating that a
large part of the acid sites which are present in the freshly sulfided sample, are still
covered with coke. In summary, the number of acid sites available for the hydrocracking
reactions is dependent on the dispersion and distribution of the nickel sulfide phase
throughout the pores of the zeolite. A better nickel sulfide dispersion will lead to less
coke formation and, consequently, more available acid sites, resulting in a higher
hydrocracking conversion, but, as both the (de)hydrogenation and the acid function grow,
the product selectivity will not change significantly.
An enhancement of the hydrogenation function may also be obtained by an increase
of the nickel loading. However, for the CaY supported catalysts the nickel sulfide surface
area as measured by DOC does not increase significantly at higher nickel loadings (Table
5.3). Consequently, for this type of catalysts the higher nickel loading does not notably
influence the hydrocracking activity. However, for Ni(x)NaY (dry sulf) type catalysts a
clear effect of the nickel loading can be observed. For Ni(8)NaY (dry sulf) the nickel
sulfide surface area has increased compared to Ni(4)NaY (dry sulf). The higher nickel
sulfide surface area leads to less coking and consequently to a larger amount of acid sites
available under reaction conditions, and in a higher conversion. But again, the increase
in nickel sulfide content does not lead to a stronger hydrogenation function compared to
the acidic function, and thus the catalytic properties are not improved towards ideal
hydrocracking.
In addition to the nickel sulfide catalysts, also the hydrocracking properties of some
Mo and Ni-Mo sulfide catalysts are tested. For the CaY supported Mo catalyst the
conversion is independent of the sulfidation procedure. In contrast with the nickel sulfide
catalysts prepared by ion exchange (Table 5.3), the presence of water during the sulfi
dation of a Mo(7)/CaY catalyst apparently has no influence on the metal sulfide
dispersion. Also for Ni(8)/Mo(7)/CaY the sulfidation method has no inluence on the
catalytic activity. Its activity is almost equal to that of Mo(7)/CaY, indicating that on
Ni(8)/Mo(7)/Ca Y no synergetic effect between the nickel and the molybdenum sulfide
phase is present. The activity of the latter catalyst is almost entirely determined by the
Mo(7)/Ca Y part, which is in agreement with the fact that Ni(8)/Ca Y is far less active
than Mo(7)/Ca Y.
The same applies to Mo(7)/Ni(8)NaY (st suit). Again the activity is comparable to the
Mo(7)/CaY, and no synergetic effect is present. The activity of Mo(7)/Ni(8)NaY (dry
98 Chapter 5
sulf) is comparable to that of Ni(8)NaY. On Mo(7)/Ni(8)NaY (dry sulf) the Ni(8)NaY
part of the catalyst is more active than the Mo component, and consequently the
conversion will be detemined by the Ni part of the catalyst. Clearly on none of these
catalysts a synergetic effect is present.
The absence of a synergetic effect may be due to the fact that a very large part of
both sulfide phases (Ni and Mo) are located at the exterior of the zeolite particles (9).
Due to the low external zeolite surface area large molybdenum and nickel sulfide crystals
are formed, which will hamper the formation of a NiMoS phase. Even if some NiMoS is
formed on the outside of the zeolite particles, its influence on the hydrocracking reaction
will probably be very low, as the metal sulfides on the exterior can not prevent the
deposition of coke in the channels of the zeolite. If all metal sulfides (including NiMoS)
would be located on the outside of the zeolite particles, after coking only a few acid sites
will remain available for cracking reactions, and the activity of the catalysts will be very
low. However, a small part of the metal sulfides are located in the zeolite pores (1 0, 24).
These internal metal sulfides are probably responsible for a large part of the catalytic
activity. More acid sites remain free of coke deposits and are available for hydrocracking
reactions. Apart from the above it is anyhow doubtful whether it is possible to form a
NiMoS phase in the narrow pores of a zeolite. This phase consists of nickel ions located
at the edges of smaii MoS2 slabs (1 1, 12). It is reasonable to assume that these structures
require more space than available in the supercages of a zeolite. Most likely, only single
metal sulfide phases will be formed in the zeolite pores, explaining why for each
bimetaJiic catalyst the conversion is determined by the most active single metal sulfide
component.
In a few papers synergetic effects are claimed for thiophene HDS (1 4, 17) and
benzene hydrogenation (1 8) over zeolite Y supported Co-Mo and Ni-Mo catalysts. These
promotor effects are however very small. In some cases (14, 17), the activity of the
bimetaJiic catalysts is hardly higher than the combined activity of the monometallic
catalysts. The promotor effect observed by Leglise et al. (18) may also be explained by
the formation of a NiMoS phase in the somewhat larger voids and defects usually present
in stabilized Y zeolites (18).
In order to prepare zeolite Y supported Ni-Mo or Co-Mo sulfide catalysts with a
significant promotor effect, other preparation routes have to be used, in which small
bimetallic metal sulfide clusters with stronger hydrogenation properties are prepared in
the supercages of the zeolite. The structure of these clusters must be different from the
NiMoS phase, as this Ni sulfide decorated MoS2 crystals probably can not be formed in
the pores of a zeolite.
Hydrocracking of n-decane over Ni and Ni-Mo sulfide catalysts 99
CONCLUSIONS
Drying of zeolite Y supported Ni catalysts prior to sulfidation results in a higher
nickel sulfide dispersion, and consequently to less coke formation and a substantial
improvement of the hydrocracking conversion. A larger part of the zeolite pores and thus
more acid sites are available for reactions leading to higher hydrocracking conversions.
However, as both the nickel dispersion and the number of acid sites increase, the catalytic
properties are not improved towards ideal hydrocracking.
For none of the zeolite supported Ni-Mo sulfide catalysts a promotor effect can be
observed. In all cases the activity is similar to that of the most active single metal sulfide
catalyst. Most likely, the zeolite pores are too small to allow the formation of a MoS2
supported nickel sulfide phase (NiMoS) in the supercages.
References
1. Bolton, A.P. , ACS monograph 171 (1976) 714.
2. Ward, J.W., Stud. Surf Sci. Catal. 16 (1983) 587.
3. Schulz, H. and Weitkamp, J., Ind. Eng. Chern. Prod. Res. Dev. 11 (1972) 46.
4. Weitkamp, J., Ind. Eng. Chern. Prod. Res. Dev. 21 (1982) 550.
5. Martens, JA., Jacobs, P.A. and Weitkamp, J., Appl. Catal. 20 (1986) 239.
6. Jacobs, P.A., Martens, J.A., Weitkamp, J. and Beyer, H.K., Farad. Discuss. Chern. Soc.
72 (1982) 353.
7. Jacobs, P.A., Thielen, M., Martens, J. and Beyer, H.K., J Mol. Catal. 27 (1984) 11.
8. Jacobs, P.A. and Martens, J.A., Stud. Surf Sci. Catal. 58 (1991) 445.
9. Chapter 4 of this Thesis.
I 0. Chapter 2 of this Thesis.
II. Tops0e, H. and Clausen, B.S., Catal. Rev. -Sci. Eng. 26 (1984) 395.
12. Prins, R., de Beer, V.H.J, and Somorjai, G.A., Catal. Rev. -Sci. Eng. 31 (1989) I.
13 . Cid, R., Villasenor, J., Orellana, F., Fierro, J.L .G. and Lopez Agudo, A., Appl. Catal. 18
(1985) 357.
14. Cid, R. , Orellana, F. and Lopez Agudo, A., Appl. Catal. 32 (1987) 327.
15 . Davidova, N., Kovacheva, P. and Shopov, P., Zeolites 6 (1986) 304.
I 6. Kovacheva, P ., Davidova, N. and Novakova, J., Zeolites 11 (I 991) 54.
17. Laniecki, M. and Zmierczack, W., in 'Zeolite chemistry and catalysis', Jacobs, P.A. , et al.,
Eds., p. 331. Elsevier, Amsterdam, 1991.
18. Leglise, J., Janin, A., Lavalley, J.C. and Cornet, D., J Catal. 114 (1988) 388.
19. Bachelier, J., Duchet, J.C. and Cornet, D., J Phys. Chern. 84 (1980) 1925.

I 00 Chapter 5
20. Bachelier, J., Tiliette, M.J., Duchet, J.C. and Cornet, D., J Catal. 76 (1982) 300.
21. Bachelier, J., Duchet, J.C. and Comet, D., J Catal. 87 (1984) 283.
22. Bouwens, S.M.A.M., Barthe-Zahir, N., de Beer, V.H.J. and Prins, R., J Catal. 131 (1991)
326. 23 . Steyns, M., Froment, G., Jacobs, P.A., Uytterhoeven, J.B. and Weitkamp, J., Ind. Eng.
Chern. Prod. Res. Dev. 20 (1981) 654.
24. Chapter 6 of this Thesis.
ABSTRACT
6 NaY SUPPORTED MOLYBDENUM SULFIDE CATALYSTS PREPARED
VIA IMPREGNATION WITH AMMONIUM HEPTAMOLYBDATE
NaY supported molybdenum sulfide catalysts with increasing Mo loading are prepared
by impregnation with ammonium heptamolybdate and characterized by means of thiophene
hydrodesulfurization (HDS), overall sulfur analysis, Temperature Programmed Sulfidation,
N2 adsorption, Xe adsorption and 129Xe-NMR and High Resolution Electron Microscopy.
After impregnation nearly all Mo is located on the exterior of the zeolite particles. During
calcination in air some of the Mo is redistributed throughout the zeolite pores, resulting in a higher amount ofMo located in the zeolite supercages. For the sulfided catalysts an amount
of Mo comparable to that after calcination is present in the zeolite pores. At higher Mo
loadings the catalysts are incompletely sulfided, which is most likely due to the presence of
large "bulk like" molybdenum oxide particles on the outside of the zeolite particles. The
amount of Mo present in the pores as well as the thiophene HDS activity of the sulfided
catalysts increase with increasing Mo loading. The small MoS2 particles in the zeolite pores
probably contribute significantly to the thiophene HDS activity.
101
102 Chapter 6
INTRODUCTION
Incorporation of transition metal sulfides into acidic zeolites leads to bifunctional
catalysts combining hydrogenation and cracking properties. The catalytic properties of such
bifunctional catalysts are often strongly influenced by the location (in- or outside the zeolite
pores) and dispersion of the metal sulfide phase. In commercial hydrocracking Ni-Mo or Ni
W phases are usually present as the hydrogenating component ( 1). In order to understand the
catalytic properties of these bimetallic catalysts at first a thorough characterization and
understanding of their monometallic counterparts is needed. Therefore, in recent years
fundamental research directed to the application of zeolite materials as supports for
molybdenum compounds (2-19) has increased. However, only a part of these studies deal
with the characterization of molybdenum loaded zeolites in the sulfided state (14-19).
Lopez Agudo et al. (! 2) studied catalysts prepared via impregnation with ammonium
heptamolybdate (AHM) and found that the Y zeolite was losing its crystallinity and
thiophene hydrodesulfurization (HDS) activity with increasing calcination temperature.
Impregnation with AHM produces essentially an external surface loading of molybdenum
due to the failure of the anionic or neutral complexes to penetrate the zeolite cavities in the
presence of water. However, thermal decomposition of these species under constant low
water vapour pressure produces a redispersion of the molybdenum due to solid state ion
exchange of Mo0i0H)2 within the zeolite pores (7, 12). Nickel and molybdenum sulfides
loaded into Y zeolites were characterized well with various techniques by Leglise et al. (! 4)
and Ezzamarty et al. (! 5). It was claimed that, in most cases, the sulfidation of the transition
metals is incomplete. Several authors (8, 16, 17) used the gas phase adsorption ofMo(C0)6
to prepare molybdenum loaded zeolites. After sulfidation these catalysts were found to have
a higher molybdenum sulfide dispersion and a higher activity for thiophene HDS than their
AHM impregnated counterparts.
So far, it is not clear what causes the incomplete formation of MoS2 on zeolite supported
Mo catalysts upon sulfidation (! 4, 15, 19). Possibly, a strong interaction between the Mo
species and the zeolite support exists (9, 12) which hampers sulfidation, or hardly sulfidable
bulk oxides are formed on the outside of the zeolite crystals (19) . Additionally, little
information is available about the distribution of the molybdenum phase over the zeolite
particles (throughout the zeolite pores or on the outside). For catalysts prepared via
impregnation with AHM at first all Mo might be located on the outside of the zeolite
particles, while during calcination possibly the molybdenum oxide phase is partly
redistributed through the zeolite pores (7, 12). The location of the Mo species after
sulfidation is not clear yet. From XPS measurements on sulfided calcined Mo/HY catalysts
NaY supported molybdenum sulfide catalysts prepared with AHM 103
it was concluded that the Mo sulfide phase is homogeneously distributed after sulfidation.
On the other hand Anderson eta!. (1 9) observed (also by means of XPS) agglomeration of
Mo species at the surface of the zeolite after sulfidation.
In the present article the sulfidation behaviour of NaY supported Mo catalysts prepared
by impregnation with AHM and the distribution of the molybdenum phase over the zeolite
particles are extensively studied. In industrial hydrocracking catalysts stabilized Y zeolites
are the most commonly used zeolites (1). Nevertheless, in the present study the original Y
zeolite is used as a support for our model catalysts in order to avoid side effects on the
catalytic activity and molybdenum distribution caused by the presence of extra-framework
alumina or voids and defects in the lattice of the stabilized Y zeolite which may also hamper
the structure analysis (i.e. via 129Xe-NMR) of the catalysts. Atmospheric thiophene HDS is
used as test reaction in order to compare activities. The sulfidation behaviour is studied by
temperature programmed sulfidation (TPS) and overall sulfur analysis, while the distribution
of the molybdenum phase is characterized by N2 adsorption, Xe adsorption and 129Xe-NMR
and High Resolution Electron Microscopy (HREM) combined with Energy Dispersive X-ray
(EDX) Analysis.
EXPERIMENTAL
Catalyst preparation
A series of catalysts containing different amounts of molybdenum are prepared by
impregnation of a NaY support (Na54(Al02) 5iSi02) 136 * 250 H20, PQ CBV-100) with
aqueous (NH4) 6MoP24 * 4 H20 solutions of appropriate concentration. After impregnation
the samples are dried overnight at 383 K in air followed by pelletizing, grinding and sieving
to obtain a fraction of 0.125-0.425 mm. A part of the zeolite samples is subsequently
calcined in air at 673 K for 2 hours. All samples are stored in a desiccator over a saturated
CaCI2 solution. The catalysts are designated Mo(x)/NaY with x representing the weight
percentage Mo (calculated on the basis of the water-free zeolite).
Catalytic activity Thiophene HDS activity measurements are carried out in a microflow reactor under
standard conditions (673 K, I atm, 4.0 % thiophene in H2, 50 std cm3 min-'). Calcined
catalysts samples of 0.25 g are sulfided in situ using a mixture of 10 % H2S in H2 (60 std
cm3 min·', 6 K min·' from 293 K to 673 K, 2 hat 673 K). After sulfidation the H2S/H2 flow
is switched to thiophene/H2• Reaction products are analyzed by on line G.C. analysis. The
first sample is taken after 2 min reaction time and the subsequent ones at intervals of 35
104 Chapter 6
minutes.
Due to the presence of a few acid sites some polymerization (unsaturated products) and
cracking (butenes and polymerized products) takes place resulting in some coke formation
and a few additional products besides the usual butenes and n-butane. Therefore, thiophene
converted to any of the reaction products including coke is taken into account for the
calculation ofthe reaction rate constant (kHos) assuming first order kinetics in thiophene (20).
TPS and overall sulfur analysis
The total sulfur uptake during sulfidation is determined as follows. A sulfided sample is
dissolved in aqua regia while carefully heating the mixture. During this process all
molybdenum species are dissolved and the molybdenum sulfide is completely converted into
sulphate. Subsequently, the amount of sulphate is determined by titration with barium
perchlorate, while the molybdenum content of the solution is analyzed by AAS. Before
analysis the catalyst is sulfided using the same procedure as for the catalytic activity
measurements. After sulfidation, the sample is flushed with He at 673 K for 1 hour to
remove adsorbed H2S and subsequently cooled under He. At room temperature the sample
is exposed to air and the analysis procedure is started.
The sulfidation behaviour of the catalysts is studied in more detail by Temperature
Programmed Sulfidation (TPS). A detailed description of this technique has been given
elsewhere (21, 22). A H2SIH/Ar flow is passed over a catalyst sample loaded in a quartz
tube which is placed in an oven. The H2S concentration in the reactor outlet is measured by
an UV detector (at 195 nm). After H20 and H2S are trapped using molsieves and ZnO
respectively, the gasflow is led through a thermal conductivity detector where changes in the
H2 concentration are monitored. A sulfiding mixture of 3.3% H2S, 28,1 % H2 and 68.6 %
Ar with a flow of 40 std em min·' is used. The measurements are carried out as follows: the
reactor is flushed with argon in order to remove air, followed by sulfidation at room
temperature for 10 min. Then the reactor temperature is raised with 6 K min·' up to 673 K,
kept constant for 1 hour, and further increased with I 0 K min·' up to 1273 K.
Xe adsorption and 129Xe-NMR
To study the presence of molybdenum species inside the zeolite pore system 129Xe-NMR
experiments are carried out in combination with Xe adsorption measurements. The principle
and experimental details of this technique are described elsewhere (23-26). Three series of
samples are measured: (I) the non-calcined samples are carefully dried in He prior to the Xe
adsorption and 129Xe-NMR experiments (heated I K min·' to 453 K, 2 hours at 453 K), (II)
the air calcined samples are also dried in He (heated 6 K min·' to 673 K, 2 hours at 673 K)
NaY supported molybdenum sulfide catalysts prepared with AHM 105
and (III) the sulfidic samples are su1fided prior to the Xe adsorption and 129Xe-NMR
experiments using the same procedure as for the catalytic activity measurements, followed
by flushing with He for 1 hour at 673 K and cooling under He. Only calcined samples are
used for sulfidation. To avoid contact with 0 2 and H20 the samples are transferred into the
NMR tubes using a recirculation type glove box (02 and H20 content lower than 2 ppm).
The samples are evacuated at room temperature to a pressure below 1 o·4 mbar and stored in
a volumetric adsorption apparatus. At 303 K Xe is adsorbed on these samples at different
Xe pressures. The NMR spectra of the adsorbed Xe are recorded at the same temperature on
a Bruker MSL 400 spectrometer at 110.7 MHz with pulse excitation (0.5 s pulse delay) on
stationary samples. The number of scans varies between 2 * 102 and 105.
On the calcined and sulfided samples N2 adsorption measurements are performed. After
sulfidation (using the same procedure as for the 129Xe-NMR experiments) the samples are
transferred into the sample holder without exposure to 0 2 or Hp. The BET surface area and
the micropore volume of the catalysts are subsequently determined by N2 adsorption at 77
K using a Carlo Erba Sorptomatic 1900.
High Resolution Electron Microscopy To study the amount of molybdenum phase located at the exterior of the zeolite particles
HREM is performed on both sulfided and oxidic samples, using a Philips CM 30 ST electron
microscope. The samples are prepared as follows. After grinding, the zeolite particles
containing Mo are suspended in alcohol. A copper grid coated with a micro grid carbon
polymer is loaded with a few droplets of this suspension. Together with HREM, the
transition metal distribution throughout the catalyst particles can be studied (integrally or
segment wise) by means of EDX analysis.
In order to investigate the metal sulfide content inside the zeolite pores, ion milling is
applied. This technique allows one to make specimens sufficiently thin, such that only the
interior of a zeolite crystal remains. For this method about 20 J.tffi thick pellets are pressed
and subsequently ion milled with 5 keY Ar ions (!5° incidence angle and a current of 1 rnA)
until a hole is formed. Next 2 keY Ar ions with 10° incidence angle are applied for 30 min
to reduce the thickness of the amorphous layer. Since in this way a random cut is made out
of the pellet, one has to take into account the possibility that not a slice of the interior of the
crystal is obtained, but rather a slice containing also part of the surface.
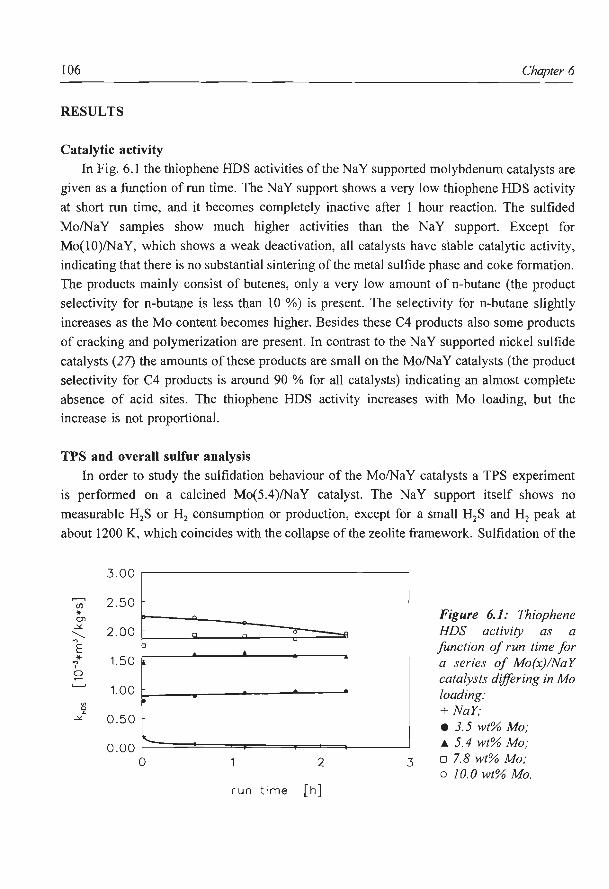
I06 Chapter 6
RESULTS
Catalytic activity
In Fig. 6. I the thiophene HDS activities of the NaY supported molybdenum catalysts are
given as a function of run time. The NaY support shows a very low thiophene HDS activity
at short run time, and it becomes completely inactive after I hour reaction. The sulfided
Mo/NaY samples show much higher activities than the NaY support. Except for
Mo(lO)/NaY, which shows a weak deactivation, all catalysts have stable catalytic activity,
indicating that there is no substantial sintering of the metal sulfide phase and coke formation.
The products mainly consist of butenes, only a very low amount of n-butane (the product
selectivity for n-butane is less than IO %) is present. The selectivity for n-butane slightly
increases as the Mo content becomes higher. Besides these C4 products also some products
of cracking and polymerization are present. In contrast to the NaY supported nickel sulfide
catalysts (27) the amounts of these products are small on the Mo/NaY catalysts (the product
selectivity for C4 products is around 90 % for all catalysts) indicating an almost complete
absence of acid sites. The thiophene HDS activity increases with Mo loading, but the
increase is not proportional.
TPS and overall sulfur analysis In order to study the sulfidation behaviour of the MoiNa Y catalysts a TPS experiment
is performed on a calcined Mo(5.4)/NaY catalyst. The NaY support itself shows no
measurable H2S or H2 consumption or production, except for a small H2S and H2 peak at
about 1200 K, which coincides with the collapse of the zeolite framework. Sulfidation of the
3.00
...--. 2. 5 0 (/)
* CJ'l
,:,(_
2.00 > E
..,* 1.50 ' 0
1.00
"' jl ,:,(_ 0.50
0 .00
D
p
1'-..
0
run tim e
2
[h]
Figure 6.1: Thiophene HDS activity as a function of run time for a series of Mo(x)!NaY catalysts differing in Mo loading: + NaY; • 3.5 wt% Mo; 4 5.4 wt% Mo;
3 o 7.8 wt% Mo; o 10.0 wt% Mo.
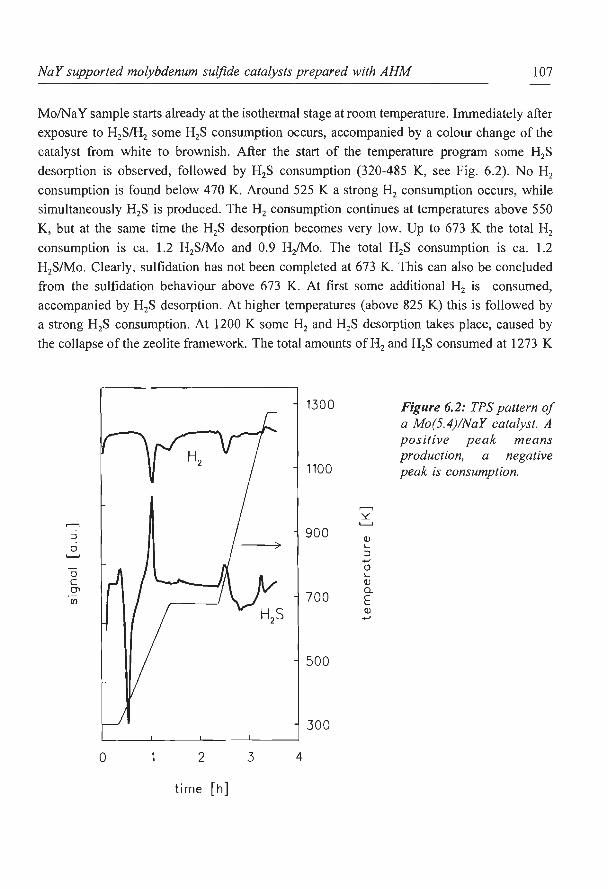
NaY supported molybdenum sulfide catalysts prepared with AHM 107
MoiNa Y sample starts already at the isothermal stage at room temperature. Immediately after
exposure to H2S/H2 some H2S consumption occurs, accompanied by a colour change of the
catalyst from white to brownish. After the start of the temperature program some H2S
desorption is observed, followed by H2S consumption (320-485 K, see Fig. 6.2). No H2
consumption is found below 4 70 K. Around 525 K a strong H2 consumption occurs, while
simultaneously H2S is produced. The H2 consumption continues at temperatures above 550
K, but at the same time the H2S desorption becomes very low. Up to 673 K the total H2
consumption is ca. 1.2 H2S/Mo and 0.9 H2/Mo. The total H2S consumption is ca. 1.2
H2S/Mo. Clearly, sulfidation has not been completed at 673 K. This can also be concluded
from the sulfidation behaviour above 673 K. At first some additional H2 is consumed,
accompanied by H2S desorption. At higher temperatures (above 825 K) this is followed by
a strong H2S consumption. At 1200 K some H2 and H2S desorption takes place, caused by
the collapse of the zeolite framework. The total amounts of H2 and H2S consumed at 1273 K
1300 Figure 6.2: TPS pattern of a Mo(5.4)/NaY catalyst. A positive peak means production, a negative
1100 peak is consumption.
,......., y:
,.......,
~ 900 Q)
0 '-::J ....., 0
0 '-c Q)
0> 700
Q.
(/) E Q) .....,
500
300
0 2 3 4
time [h)
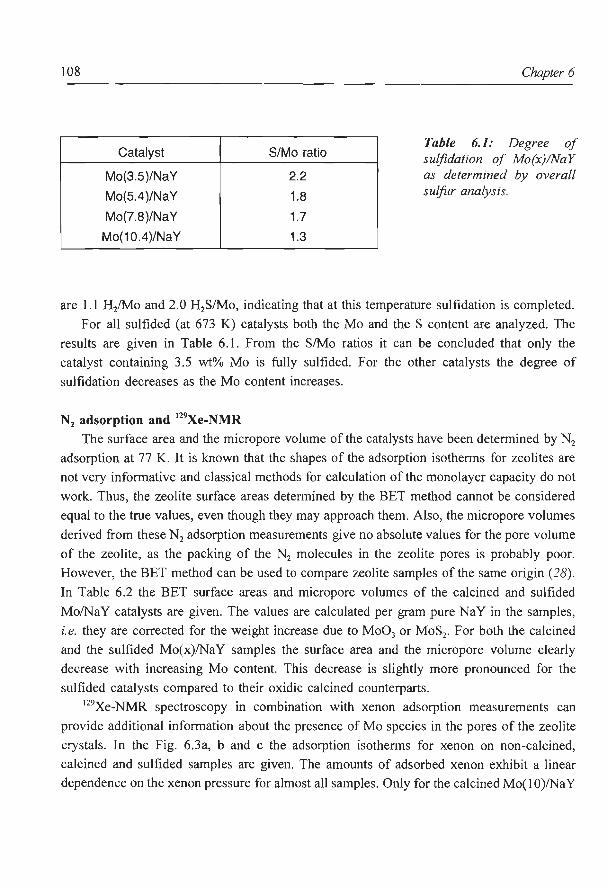
108
Catalyst
Mo(3.5)/NaY
Mo(5.4 )/NaY
Mo(7.8)/NaY
Mo(10.4)/NaY
S/Mo ratio
2.2
1.8
1.7
1.3
Chapter 6
Table 6.1: Degree of sulfidation of Mo(x)/NaY as determined by overall sulfor analysis.
are 1.1 H/Mo and 2.0 H2S/Mo, indicating that at this temperature sulfidation is completed.
For all sulfided (at 673 K) catalysts both the Mo and the S content are analyzed. The
results are given in Table 6.1. From the S/Mo ratios it can be concluded that only the
catalyst containing 3.5 wt% Mo is fully sulfided. For the other catalysts the degree of
sulfidation decreases as the Mo content increases.
N2 adsorption and 129Xe-NMR The surface area and the micro pore volume of the catalysts have been determined by N2
adsorption at 77 K. It is known that the shapes of the adsorption isotherms for zeolites are
not very informative and classical methods for calculation of the monolayer capacity do not
work. Thus, the zeolite surface areas determined by the BET method cannot be considered
equal to the true values, even though they may approach them. Also, the micropore volumes
derived from these N2 adsorption measurements give no absolute values for the pore volume
of the zeolite, as the packing of the N2 molecules in the zeolite pores is probably poor.
However, the BET method can be used to compare zeolite samples of the same origin (28).
In Table 6.2 the BET surface areas and micropore volumes of the calcined and sulfided
Mo/NaY catalysts are given. The values are calculated per gram pure NaY in the samples,
i.e. they are corrected for the weight increase due to Mo03 or MoS2• For both the calcined
and the sulfided Mo(x)/NaY samples the surface area and the micropore volume clearly
decrease with increasing Mo content. This decrease is slightly more pronounced for the
sulfided catalysts compared to their oxidic calcined counterparts. 129Xe-NMR spectroscopy in combination with xenon adsorption measurements can
provide additional information about the presence of Mo species in the pores of the zeolite
crystals. In the Fig. 6.3a, b and c the adsorption isotherms for xenon on non-calcined,
calcined and sulfided samples are given. The amounts of adsorbed xenon exhibit a linear
dependence on the xenon pressure for almost all samples. Only for the calcined Mo( I 0)/Na Y
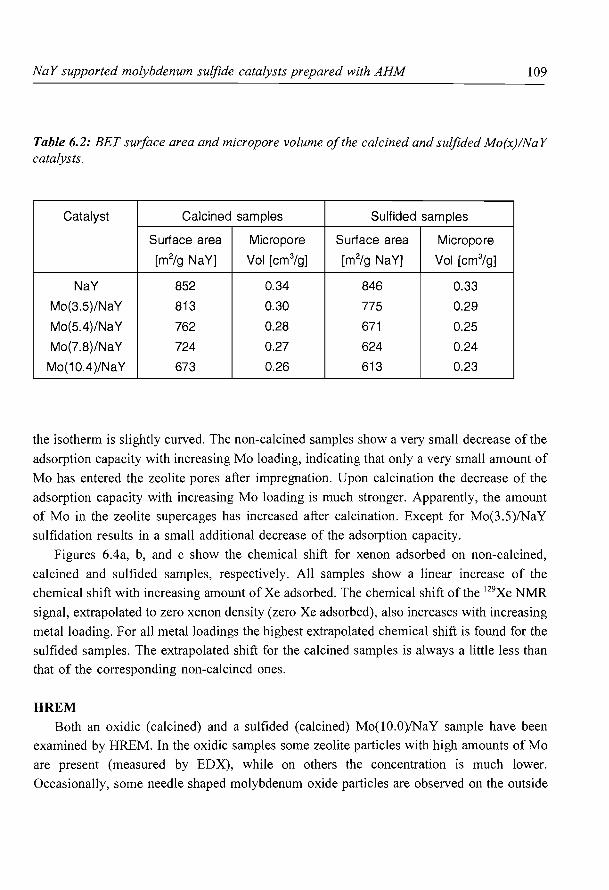
NaY supported molybdenum sulfide catalysts prepared with AHM 109
Table 6.2: BET surface area and micropore volume of the calcined and sul.fided Mo(x)/NaY catalysts.
Catalyst Calcined samples Sulfided samples
Surface area Micropore Surface area Micropore
[m2/g NaY] Vol [cm3/g] [m2/g NaY] Vol [cm3/g]
NaY 852 0.34 846 0.33
Mo(3.5)/NaY 813 0.30 775 0.29
Mo(5.4)/NaY 762 0.28 671 0.25
Mo(7.8)/NaY 724 0.27 624 0.24
Mo(10.4)/NaY 673 0.26 613 0.23
the isotherm is slightly curved. The non-calcined samples show a very small decrease of the
adsorption capacity with increasing Mo loading, indicating that only a very small amount of
Mo has entered the zeolite pores after impregnation. Upon calcination the decrease of the
adsorption capacity with increasing Mo loading is much stronger. Apparently, the amount
of Mo in the zeolite supercages has increased after calcination. Except for Mo(3.5)/NaY
sulfidation results in a small additional decrease of the adsorption capacity.
Figures 6.4a, b, and c show the chemical shift for xenon adsorbed on non-calcined,
calcined and sulfided samples, respectively. All samples show a linear increase of the
chemical shift with increasing amount ofXe adsorbed. The chemical shift of the 129Xe NMR
signal, extrapolated to zero xenon density (zero Xe adsorbed), also increases with increasing
metal loading. For all metal loadings the highest extrapolated chemical shift is found for the
sulfided samples. The extrapolated shift for the calcined samples is always a little less than
that of the corresponding non-calcined ones.
HREM
Both an oxidic (calcined) and a sulfided (calcined) Mo(lO.O)/NaY sample have been
examined by HREM. In the oxidic samples some zeolite particles with high amounts of Mo
are present (measured by EDX), while on others the concentration is much lower.
Occasionally, some needle shaped molybdenum oxide particles are observed on the outside
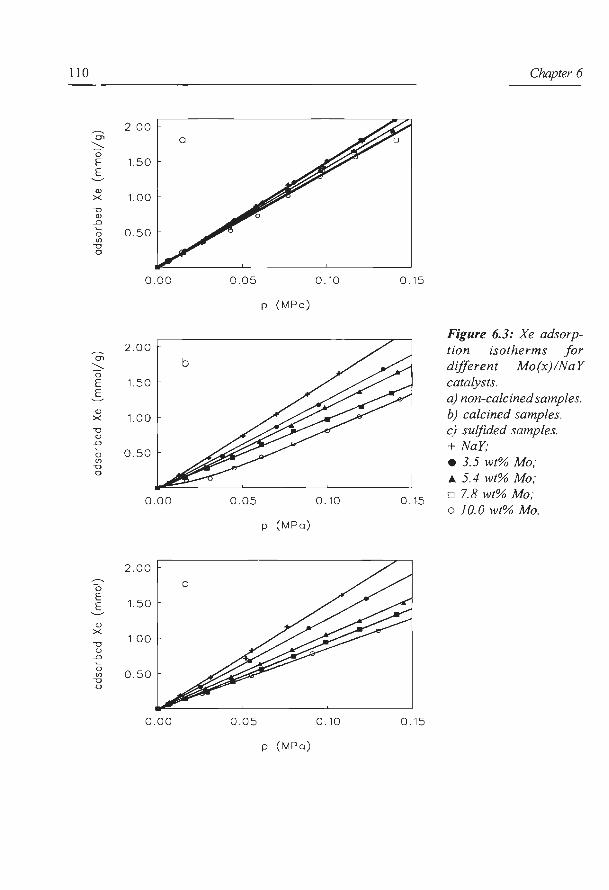
110 Chapter 6
~ 2 .00
Ol
~ 0 E 1.50 E
<lJ X 1.00 "0
<lJ .0 ~
0 .50 0 Ul "0 0
0.00 0.05 0.10 0 . 15
p (MPa)
Figure 6.3: Xe adsorp-~
2.00 tion isotherms for Ol
::::.- different Mo(x)!NaY 0
catalysts. E 1.50 E a) non-calcined samples. <lJ
X 1.00 b) calcined samples. "0 c) sulfided samples.
<lJ .0 + NaY; ~
0 .50 0
• 3.5 wt% Mo; Ul "0 0
J... 5.4 wt% Mo;
0.00 0.05 0.10 0.15 o 7.8 wt% Mo; o 10.0 wt% Mo.
p ( MPa)
2.00 ~
0 E
1.50 E
<lJ X
"0 1.00
<lJ .0 ~
0 0 .50 Ul
"0 0
0.00 0.05 0.10 0 . 15
p ( MPa)
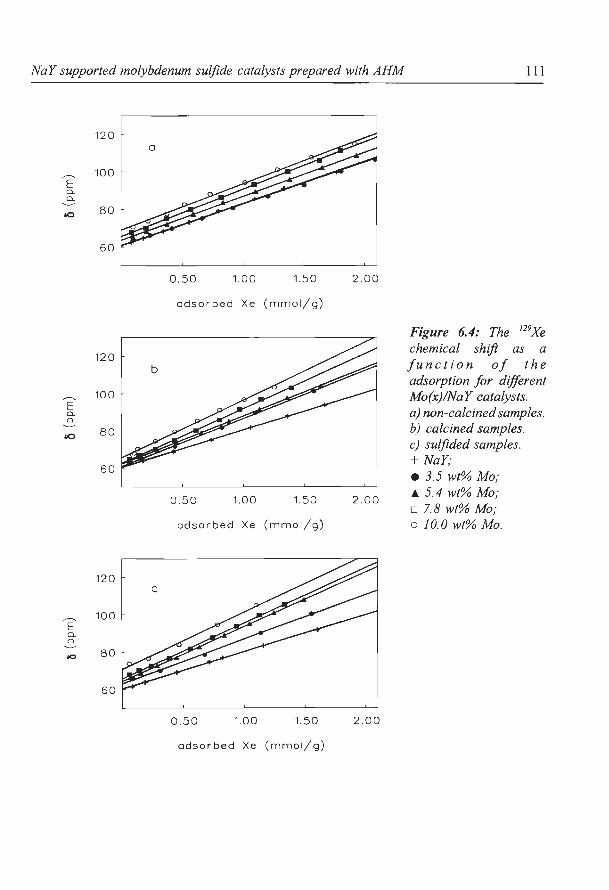
NaY supported molybdenum sulfide catalysts prepared with AHM
~
E Q_ Q_
E Q_ Q_
E Q_ o_
00
120
100
80
60
120
100
80
60
120
100
80
60
0.50 1.00 1.50 2.00
adsorbed Xe (mmol/g)
0.50 1.00 1.50 2.00
adsorbed Xe (mmol/g)
0.50 1.00 1.50 2.00
ads or bed Xe (mmol/ g)
lll
Figure 6.4: The 129Xe chemical shift as a function of the adsorption for different Mo(x)/NaY catalysts. a) non-calcined samples. b) calcined samples. c) sulfided samples. +NaY; • 3.5 wt% Mo; .a. 5.4 wt% Mo; o 7.8 wt% Mo; o 10.0 wt% Mo.
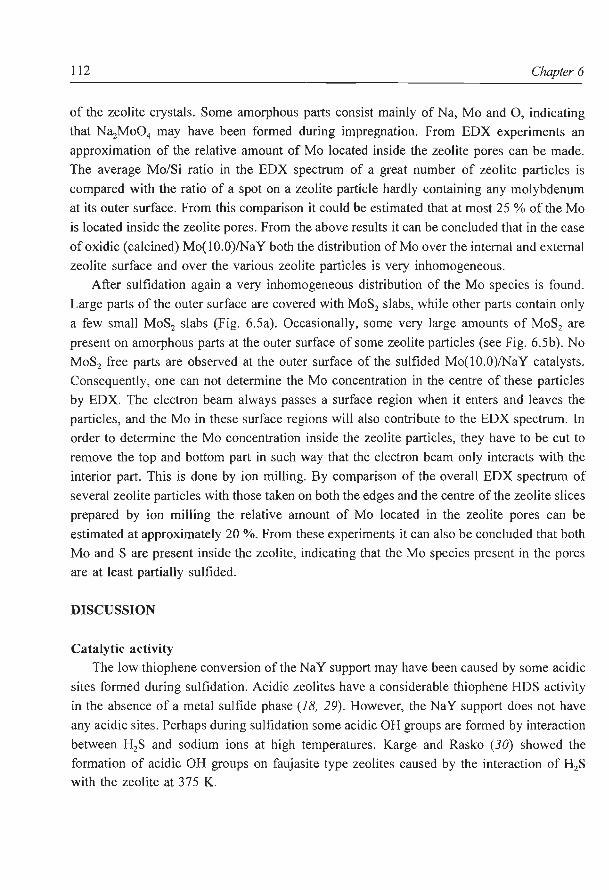
112 Chapter 6
of the zeolite crystals. Some amorphous parts consist mainly of Na, Mo and 0 , indicating
that N3zMo04 may have been formed during impregnation. From EDX experiments an
approximation of the relative amount of Mo located inside the zeolite pores can be made.
The average Mo/Si ratio in the EDX spectrum of a great number of zeolite particles is
compared with the ratio of a spot on a zeolite particle hardly containing any molybdenum
at its outer surface. From this comparison it could be estimated that at most 25 % of the Mo
is located inside the zeolite pores. From the above results it can be concluded that in the case
of oxidic (calcined) Mo(lO.O)/NaY both the distribution ofMo over the internal and external
zeolite surface and over the various zeolite particles is very inhomogeneous.
After sulfidation again a very inhomogeneous distribution of the Mo species is found.
Large parts of the outer surface are covered with MoS2 slabs, while other parts contain only
a few small MoS2 slabs (Fig. 6.5a). Occasionally, some very large amounts of MoS2 are
present on amorphous parts at the outer surface of some zeolite particles (see Fig. 6.5b ). No
MoS2 free parts are observed at the outer surface of the sulfided Mo(l 0.0)/Na Y catalysts.
Consequently, one can not determine the Mo concentration in the centre of these particles
by EDX. The electron beam always passes a surface region when it enters and leaves the
particles, and the Mo in these surface regions will also contribute to the EDX spectrum. In
order to determine the Mo concentration inside the zeolite particles, they have to be cut to
remove the top and bottom part in such way that the electron beam only interacts with the
interior part. This is done by ion milling. By comparison of the overall EDX spectrum of
several zeolite particles with those taken on both the edges and the centre of the zeolite slices
prepared by ion milling the relative amount of Mo located in the zeolite pores can be
estimated at approximately 20 %. From these experiments it can also be concluded that both
Mo and S are present inside the zeolite, indicating that the Mo species present in the pores
are at least partially sulfided.
DISCUSSION
Catalytic activity
The low thiophene conversion of the NaY support may have been caused by some acidic
sites formed during sulfidation. Acidic zeolites have a considerable thiophene HDS activity
in the absence of a metal sulfide phase (18, 29) . However, the NaY support does not have
any acidic sites. Perhaps during sulfidation some acidic OH groups are formed by interaction
between H2S and sodium ions at high temperatures. Karge and Rasko (30) showed the
formation of acidic OH groups on faujasite type zeolites caused by the interaction of H2S
with the zeolite at 375 K.
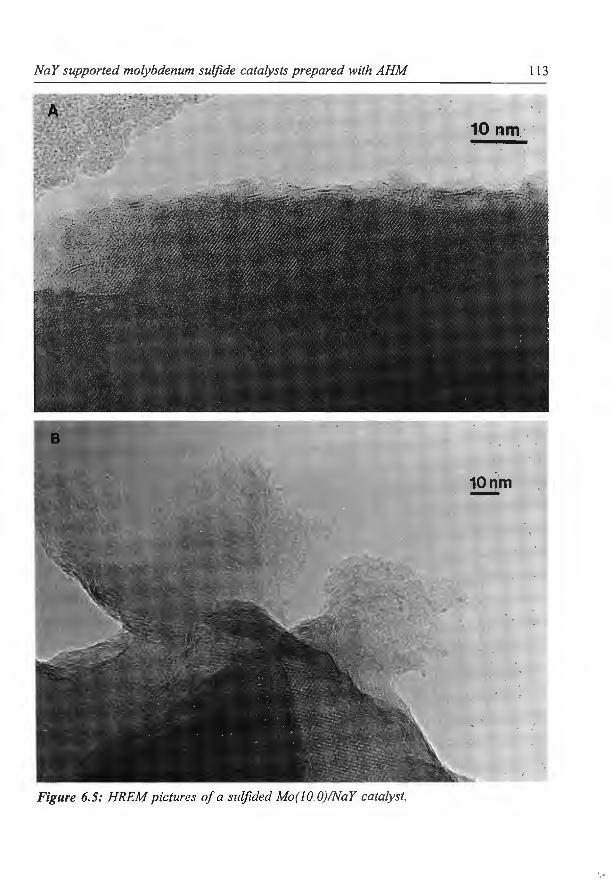
NaY supported molybdenum sulfide catalysts prepared with AHM 113
·tOnm··
10nm -
Figure 6.5: HREM pictures of a sulfided Mo(JO.O)/NaY catalyst.

114 Chapter 6
The presence of products from cracking and polymerization reactions in the case of
sulfided Mo(x)/NaY catalysts indicates that on these catalysts acid sites are also present.
However, these acid sites are most likely not only caused by interaction between the H2S and
the NaY support, but they may also have been formed during impregnation of the zeolite
during which impregnation some ion exchange of the Na+ ions of the zeolite support with
the NH4 + of the (NH4) 6Mo70 24 may occur. After drying and decomposition of the AHM,
N~Mo04 particles are formed, both in the zeolite pores and on the exterior of the zeolite
crystals. The combined HREM - EDX experiments show the presence of N~Mo04 on the
outer surface of the zeolite. At the same time the NH4 + ions are converted into acid sites via
the release of NH3• During sulfidation part of the Na+ ions in N~Mo04 will be released
when N~Mo04 is converted into MoS2. However, not all Na+ ions will be able to return to
their original positions in the NaY zeolite lattice, and some acidity will remain. The low
amount of cracked and polymerized products confirms that only a few such acid sites are
present during reaction.
The increase in activity with increasing molybdenum content is probably caused by an
enlargement of the active MoS2 surface area. The activity (measured after 2 h run time)
levels off at higher metal loadings, which indicates that the active MoS2 surface area
increases less than proportional the Mo content (the MoS2 dispersion decreases at higher Mo
loadings).
For carbon supported catalysts a similar behaviour as a function of the metal loading was
observed (31). The carbon supported catalysts clearly have a higher activity at short run
times but, since they deactivate whereas their NaY supported counterparts are remarkably
stable, both types of catalysts show similar thiophene HDS activities after 2 h run time.
Compared with Mo/Alz03 catalysts (31) the Mo/NaY catalysts show clearly higher HDS
activities, both initially and after 2 h reaction. This is in line with the results obtained for
zeolite Y supported Ni and Co sulfide catalysts (32). Just like carbon, the NaY zeolite seems
to function as an inert support for metal sulfides.
Sulfidation behaviour The sulfidation of the Mo oxide phase present in Mo(5.4)/NaY probably starts already
at room temperature. Some H2S consumption occurs, and the colour of the catalysts changes
from white to brownish. Nevertheless, most of the H2S adsorbed at room temperature is only
adsorbed physically and desorbs in the beginning of the temperature program. Like for
Mo/Alz03 catalysts (22), the degree of sulfidation at room temperature is rather small. At
higher temperatures, up to 500 K, a strong H2S consumption occurs, while no H2 is
consumed. Sulfiding in this region occurs by 0 - S exchange on Mo(VI) (22, 33). The H2S

NaY supported molybdenum sulfide catalysts prepared with AHM 115
consumption at 550 K is 1.7 HzSIMo, indicating that not all 0 atoms of the Mo03 phase
have been replaced by S at this stage. For comparison, on Mo/SiOz a complete conversion
of Mo03 into MoS3 is observed by EXAFS at this stage of the sulfidation process (33).
Around 525 K a large amount ofHzS is produced, accompanied by a strong Hz consumption.
The HzS production is probably the result of the reduction of the molybdenum(VI) ( oxy
)sulfides by Hz, which proceeds via breaking of the bonds between S and Mo (22). Above
550 K some Hz consumption remains, accompanied by a very low HzS production (the
amount of HzS produced is far lower than the amount of Hz consumed). Most likely above
550 K the reduction ofMo(VI) is continued, but now mainly molybdenum oxide is reduced.
Unlike for Mo/Alz03 (22) or Mo/SiOz (33) catalysts a relatively large part of the Mo
species on the NaY zeolite has not been sulfided at 673 K (S/Mo = 1.2). The Hz
consumption perMo atom is 0.9, indicating that a considerably larger part of the Mo (VI)
has been reduced to Mo (IV) at this temperature. Probably, the oxidic Mo species are partly
converted to MoSz, but a considerable fraction is still present as molybdenum oxy-sulfides
or oxides.
From the HREM-EDX experiments it can by concluded that in the oxidic state large
molybdenum oxide particles are present on the outside of the zeolite crystals both as well
dispersed and bulk like Mo oxide. The well dispersed Mo species will show a sulfidation
behaviour similar to that of a Mo/ Alz03 catalyst (22), in which all oxidic Mo species are well
dispersed. At 673 K these Mo species will be completely converted into MoSz. On the other
hand, the sulfidation of the large Mo oxide particles will resemble that of bulk Mo03 (22).
At approximately 500 K the sulfidation will start via the reduction of Mo03 to MoOz and
the subsequent conversion of MoOz into MoSz. However, at these temperatures the MoSz
formation is very slow and probably limited to the surface layers. Consequently, at 673 K
part of the Mo03 is reduced to MoOz without being sulfided. As a result some large
incompletely sulfided Mo oxide particles (only sulfided on the outside) and a large amount
of small MoSz particles are present after sulfidation at 673 K. The reduction and sulfidation
will continue slowly during the isothermal stage at 673 K.
The sulfidation of the bulk like Mo oxide particles is completed above 673 K. At the
continuation of the temperature program again HzS is produced, accompanied by an
equimolar consumption of Hz. The amount of HzS produced at this stage is not very large
(about 0.1 HzS per Mo atom). The reduction of Mo (VI) to Mo (IV) as measured by the Hz
consumption, is completed at this stage. The H2S must originate from the reduction of
elemental sulfur, MoS3 or oxy-sulfide species. However, all these species should have been
reduced already at far lower temperatures (around 525 K) (22), therefore they can not be the
cause of the HzS production above 673 K. The reason for this H2S production is not clear
116 Chapter 6
yet. Additional TPS and temperature programmed reduction experiments on differently
prepared zeolite supported Mo catalysts are needed to explain these results. After the
reduction of the Mo is completed (at about 775 K) the conversion of Mo02 into MoS2
continues in the remaining part of the temperature program. At I 200 K, after the collapse
of the zeolite framework, all Mo is converted into MoS2•
The lower degree of sulfidation at higher Mo contents confirms the assumption that the
incomplete sulfidation is most likely linked with the presence of large molybdenum oxide
particles. A higher Mo loading will result in more and larger molybdenum oxide particles,
and consequently the degree ofsulfidation will be lower. Also the presence ofN~Mo04 (as
observed with HREM-EDX measurements) may hamper the sulfidation of Moat 673 K. In
Fig. 6.5b large particles existing of MoS2 and some amorphous Mo containing parts located
on the outside of a zeolite particle can be seen. Possibly, these are incompletely sulfided Mo
oxide particles. ·
The decreasing degree of sulfidation with increasing Mo loading is in contrast with the
results obtained for Mo/Alz03 catalysts (22). For the latter catalysts sulfidation is found to
be less complete at lower Mo contents. This is due to a stronger interaction between Mo and
the Alz03 support at low Mo loadings. On the other hand, Mo/Si02 catalysts sulfide more
easily at lower Mo contents (33). At higher loadings larger molybdenum oxide particles are
formed, and a more severe reconstruction of the particles is needed for sulfidation (33). On
these Mo/Si02 catalysts the interaction with the support is too weak to influence the
sulfidation behaviour. The MoiNa Y catalysts are most likely completely sulfided at low Mo
contents (Table 6.1 ). This indicates that also for the NaY supported Mo catalysts the
interaction between the Mo and the support is weak, and does not hamper the sulfidation.
Also the Mo species located in the zeolite pores are at least partially sulfided, as the
combined HREM- EDX measurements indicated that both Mo and S are present in the pores
of the zeolite. However, at higher Mo loadings there is a significant difference between the
Mo/Si02 and MoiNa Y catalysts. The surface area on which the larger part of the
molybdenum oxide is deposited is much larger on Mo/Si02 than on Mo/NaY, resulting in
the formation of larger oxide particles on the latter sample. The incomplete sulfidation at
higher loadings is probably completely due to the formation of these relatively large
molybdenum oxide particles which are difficult to sulfide.
On the Mo(3.5)/NaYcatalyst even a slight excess of sulfur is present compared to the
formation of MoS2• This may be due to the inaccuracy of the analysis method, or, perhaps
some elemental S is formed during sulfidation. However, as discussed above, all elemental
S should have been reduced after sulfidation in 10% H2S/H2 at 673 K. The reason for the
presence of excess S is not clear yet. After sulfidation of pure NaY no sulfur is found,
NaY supported molybdenum sulfide catalysts prepared with AHM 117
indicating that the excess sulfur is not caused by the zeolite support. It can not be excluded
that also the other Mo/NaY catalysts contain some excess sulfur, which makes an exact
determination of the degree of sulfidation rather difficult.
Compared with the TPS experiment the overall sulfur analysis shows a higher degree of
sulfidation for the Mo(S.4)/NaY sample (60 % sulfidation vs. 90 %). This may be due to a
longer isothermal sulfidation at 673 K (2 h vs. 1 h) and/or a higher H2S partial pressure ( 104
Pa vs. 3.3 * 103 Pa) applied for overall sulfur analysis.
The low degree of sulfidation found for the MoiNa Y catalysts at high Mo loadings is in
agreement with the results of Leglise et a!. (1 4) and Anderson et al. (1 9), who also found
an incomplete sulfidation for impregnated stabilized Y supported samples containing between
4 and 9 wt% Mo. Most probably, the cause of the incomplete sulfidation is the presence of
large molybdenum oxide particles, and not the presence of strong interactions between the
Mo species and the zeolite support.
Distribution of the Mo species
From the BET surface areas and the micropore volumes given in Table 6.2 it can be
concluded that on both the oxidic calcined and the sulfided samples at least part of the Mo
species are located inside the zeolite pores. For both series of catalysts the surface area and
the pore volume decrease with increasing Mo content. For all samples the decrease in surface
area is proportional to the decrease in pore volume, which indicates that the loss in pore
volume is not caused by partial but by complete filling (over the entire diameter) of the
pores with Mo species.
The decrease in pore volume is much larger than the maximum volume that the Mo
phase (Mo03 or MoS2) can occupy (e.g. for Mo(10.0)/NaY the decrease for the calcined
oxidic sample is 0.08 cm3 g·', while the molybdenum oxide on this sample has a volume of
0.04 cm3 g·', assuming all Mo to be present as Mo03). This can be due to pore blocking,
which means that large empty parts of the zeolite pore system are no longer accessible to N2,
because all entrances to these pores are blocked by the Mo phase. However, in the three
dimensional pore system of the Y zeolite this will probably only occur on a small scale.
The Xe adsorption isotherms of the non-calcined samples show a small but definite
decrease in adsorption capacity with increasing Mo content. At the same time the chemical
shift at infinitely low pressure (extrapolation to zero Xe adsorbed) increases. These results
indicate that already after drying at least a certain part of the Mo phase is deposited in the
zeolite pores. As the Mo70 2/. ion can not enter the zeolite pores, decomposition products of
this large anionic precursor complex must have entered the pores, either during impregnation
or during drying at 383 K. Possibly, some MoO/" ions are formed during impregnation and
118 Chapter 6
have entered the zeolite pores (4). Another possibility is the migration ofMo03 (formed after
decomposition of MoP2t) from the external zeolite surface into the zeolite pores (7),
favoured by a reaction with water vapour according to the equilibrium:
Under the conditions applied for the drying of the non calcined samples the Mo02(0H)2
vapour pressure will be extremely low (7), and so will the amounts of Mo03 redistributed
by this process.
On the oxidic calcined samples the decrease in adsorption capacity with increasing Mo
content is much larger than for the non calcined samples, indicating that for the calcined
samples a larger amount ofMo is located in the zeolite pores. At the same time the chemical
shift at zero Xe pressure on the calcined samples is lower than for the non calcined samples,
which seems to be in contradiction with the lower adsorption capacity (a lower adsorption
capacity indicates the presence of smaller pores, which should result in a higher chemical
shift (23)). This may be due to the presence ofNH/ ions and decomposition products of the
Mo70 246- complex in the zeolite pores ofthe non-calcined sample. The presence ofNH/ and
decomposition products of Mo70 246
• may result in an increased interaction between the Xe
atoms and the sample, resulting in a higher chemical shift. After calcination, a higher amount
of Mo is present in the zeolite pores, but the Mo phase shows less interaction with the 129Xe
atoms.
The NH4 + and Mo species in the pores of the non-calcined zeolite may cause a larger
chemical shift than in the calcined samples, the amounts are however too small to have a
significant effect on the adsorption isotherms. Consequently, the adsorption isotherms show
a relatively small decrease in adsorption capacity as funtion of the Mo loading compared to
the calcined samples.
The. results indicate that during calcination at least a part of the Mo03 is redistributed
through the pores of the zeolite. As the calcination was performed in ambient air which
contains . some water, the redistribution has probably taken place via the formation of
MoOiOH)2 as described above. Due to the low vapour pressure ofMoOiOH)2 (1.7 * 10·4
Nm·2 at 600 K (34)) and the short calcination period (2 hours at 673 K) the amount of Mo03
redistributed in this way will be small, resulting in a relatively small amount of Mo located
in the pores of the zeolite (less than 25% according to the HREM- EDX experiments). The
observation that the slope of the chemical shift versus adsorbed Xe plot (figure 6.4b)
increases with increasing Mo loading suggests a growing degree of pore blocking (23) by
the molybdenum oxide, which is in agreement with the conclusion drawn from the BET
NaY supported molybdenum sulfide catalysts prepared with AHM 119
measurements. The pore blocking may be an additional reason for the weak interaction
between the adsorbed 129Xe and the calcined sample compared to the non-calcined sample.
On the latter sample the Mo species present in the zeolite pores are probably distributed in
such a way that all of them can interact with the 129Xe atoms, resulting in a strong overall
interaction and thus in deshielding of 129Xe. In the calcined samples large Mo particles which
fill the entire supercage are formed (resulting in pore blocking). Consequently, only a small
part of the Mo can interact with the 129Xe atoms, and the interaction between Xe and the
sample will be weak.
After sulfidation the amounts of molybdenum species located in the zeolite pores remain
relatively small. The adsorption capacities of the calcined and the sulfided Mo(x)/NaY
catalysts are virtually the same. The chemical shifts of the adsorbed 129Xe are somewhat
higher for the sulfided catalysts than for the calcined ones. Most likely, about the same
amount of Mo is present in the zeolite pores before and after sulfidation. During the
sulfidation the molybdenum oxides in the zeolite pores are partially or completely converted
into MoS2 . The sulfided species may occupy somewhat more pore volume, as both the BET
results and the 129Xe chemical shift indicate that the remaining pore volume became
somewhat smaller after sulfidation. However, the increase in the chemical shift may also
originate from a stronger interaction between the 129Xe and the Mo species in the pores of
the zeolite after sulfidation. From the higher slope at higher Mo content (Fig. 6.4c) it can
be concluded that, similar to the calcined samples, also for the sulfided samples pore
blocking occurs. Possibly, the Mo species in the zeolite pores have not moved during
sulfidation at 673 K. Anyhow, the amount of Mo inside the zeolite pores does not change
significantly during sulfidation.
The conclusions derived from the BET and the Xe adsorption and 129Xe-NMR results are
confirmed by HREM - EDX. In the calcined and in the sulfided catalysts the distribution of
the Mo phase is rather inhomogeneous. In the sulfided catalysts some large Mo particles,
which at least partially exist of MoS2, are present on the outside of the zeolite particles (Fig.
6.5b). Neither the BET results nor the Xe adsorption and 129Xe-NMR experiments can be
used to quantify the amount of Mo inside the zeolite pores (25). Both techniques however
indicate that for calcined and for sulfided samples a certain amount of Mo species are present
in the zeolite pores. From the EDX results on the ion milled sulfided Mo(IO.O)/NaY sample
it can be estimated that approximately 20 % of the total Mo content is present in the zeolite
pores. These results are in agreement with those reported by Laniecki and Zmierczak ( 17)
who concluded that MoS2 in MoiNa Y catalysts prepared by impregnation is mainly located
on the outside of the zeolite particles. In contrast herewith Ezzamarty et a!. (1 5) concluded
from XPS measurements that for sulfided USY supported Mo catalysts the Mo phase is well
120 Chapter 6
dispersed and mainly present in the zeolite cavities.
HREM shows that most of the zeolite particles are covered with MoS2 particles which
are very large in the a-b plane, and 6 to about 60 A thick along the c axis (in case the MoS2
particles are thicker than 6 A several layers of MoS2 are stacked). Therefore, the dispersion
of the MoS2 located on the outside of the zeolite particles is low. Nevertheless, the NaY
supported Mo catalysts are rather active for thiophene HDS. The low degree of sulfidation
(Table 6.1) may not have a strong influence on the HDS activity, since the non-sulfided Mo
oxide fraction is probably covered by MoS2 and further sulfidation will not substantially
increase the MoS2 surface. Possibly, the catalytic properties are to a relatively large extent
caused by the Mo particles inside the zeolite pores. Higher Mo loadings will mainly result
in larger Mo particles on the exterior of the zeolite particles, and not in a strong increase of
the active molybdenum sulfide surface. Together with the low dispersion of the molybdenum
sulfide on the exterior of the zeolite, this leads to the conclusion that the external
molybdenum sulfide will most likely not contribute very much to the thiophene HDS
activity. N2 adsorption and 129Xe NMR results show that for the sulfided catalysts the amount
of Mo in the zeolite pores increases with increasing Mo content. This will most likely cause
an increase in active molybdenum sulfide surface. Thus, the increase in activity with
increasing Mo loading will at least partially be due to the higher amount of Mo present in
the zeolite pores. In the case of sulfided zeolite Y supported Ni catalysts there are also
indications that especially the small nickel sulfide clusters in the zeolite pores are very active
for thiophene HDS (27). This may be the case for the Mo(x)/NaY catalysts as well.
CONCLUSIONS
NaY supported MoS2 catalysts prepared by impregnation with AHM are active thiophene
HDS catalysts. During impregnation very little Mo enters the pores of the zeolite. During
calcination however, a certain part of the Mo phase is redistributed through the zeolite pores.
No reallocation of the Mo seems to take place during sulfidation. The Mo species in the
zeolite pores are probably converted into MoS2, while the Mo phase on the exterior is only
partly sulfided. This is caused by the presence of large molybdenum oxide particles which
are difficult to sulfide. Most likely only their outer layers are converted into MoS2, while the
core remains unsulfided. The small MoS2 particles in the zeolite pores are probably be the
main contributors to the thiophene HDS activity of these catalysts. Therefore, further
improvement of the catalytic properties may be possible by developing preparation methods
resulting in a more selective formation of MoS2 crystallites in the zeolite pores.
NaY supported molybdenum sulfide catalysts prepared with AHM 121
References
l. Ward, J.W., Stud. Surf Sci. Catal. 16 (1983) 587.
2. Dai, P.E. and Lunsford, J.H., J Catal. 64 (1980) 173 .
3. Abdo, S. and Howe, R.F., J Phys. Chern. 87 (1983) 1713 .
4. Cid, R., Gil-Liambias, F.J., Fierro, J.L.G., Lopez Agudo, A. and Villasenor, J. , J Catal. 89
(1984) 478.
5. Komatsu, T., Namba, S., Yashima, T., Domen, K. and Onishi, T. , J Mol. Catal. 33 (1985)
345.
6. Johns, J.R. and Howe, R.F., Zeolites 5 (1985) 251.
7. Fierro, J.L.G., Conesa, J.C. and Lopez Agudo, A. , J Catal. 108 (1987) 334.
8. Okamoto, Y., Meazawa, A., Kane, H., Mitsushima, I. and Imanaka, T., J Chern. Soc., Farad.
Trans. I 84 ( 1988) 851.
9. Carma, A., Vazquez, M.l., Bianconi, A., Clozza, A., Garcia, J., Pallota, 0. and Cruz, J.M. ,
Zeolites 8 (1988) 464.
10. Kovacheva, P. , Davidova, N. and Novakova, J., Zeolites, 11 (1991) 54.
II . Anderson, J.A., Pawelec, B. and Fierro, J.L.G., Appl. Catal. 99 (1993) 37.
12. Lopez Agudo, A., Cid, R. , Orellana, F. and Fierro, J.L .G., Polyhedron 5 (1986) 187.
13 . Cid, R., Orellana, F. and Lopez Agudo, A., Appl. Catal. 32 (1987) 327.
14. Leglise, J. , Janin, A. , Lavalley, J.C. and Cornet, D., J Catal. 114 (1988) 388.
15 . Ezzamarty, A. , Catherine, E., Cornet, D., Hemidy, J.F., Janin, A., Lavalley, J.C. and Leglise,
J., in 'Zeolites: Facts, Figures, Future', Jacobs, P.A. and van Santen, R.A., Eds., p. I 025.
Elsevier, Amsterdam, 1989.
16. Okamoto, Y., Maezawa, A., Kane, H. and Imanaka, T., J Mol. Catal. 52 (1989) 337.
17. Laniecki, M. and Zmierczak, W., Zeolites 11 (1991) 18.
18. Lopez Agudo, A., Benitez, A. , Fierro, J.L.G., Palacios, J.M. Neira, J. and Cid, R., J Chern
Soc., Farad. Trans. 88 (1992) 385.
19. Anderson, J.A., Pawe1ec, B., Fierro, J.L.G., Arias, P.L. Duque, F. and Cambra, J.F ., Appl.
Catal. 99 (1993) 55.
20. Duchet, J.C., van Oers, E.M., de Beer, V.H.J. and Prins, R. , J Catal. 80 (1983) 386.
21. Scheffer, B., Dekker, N .J.J., Mangnus, P.J. and Moulijn, J.A. , J Cat a!. 121 (1990) 31.
22. Arnoldy, P., van den Heykant, J.A.M. , de Bok, G.D. and Moulijn, J.A., J Catal. 92 (1985)
35.
23. Fraissard, J. and Ito, T., Zeolites 8 (1988) 350.
24. Ito, T. and Fraissard, J., J Chern. Phys. 76 (1982) 5225.
25. Koninyi, T.I., van de Yen, L.J.M. , Welters, W.J.J., de Haan, J.W., de Beer, V.H.J. and van
San ten, R.A., Catal. Lett. 17 ( 1993) I 05.
26. Korimyi, T.I., van de Yen, L.J.M., Welters, W.J.J., de Haan, J.W., de Beer, V.H.J. and van
Santen, R.A. , Coli. and Surf A: Physicochern. Eng. Aspects 72 (1993) 143.
122 Chapter 6
27. Chapter 2 of this Thesis.
28 . Gress, S.J. and Sing, K.S.W., in 'Adsorption, Surface Area and Porosity ', Academic Press,
London, 1982.
29. Chapter 3 of this Thesis.
30. Karge, H.G., and Rasko, J. , J Colloid Interface Sci. 64 (1978) 534.
31. Vissers, J.P.R. , Bache1ier, J. , ten Doeschate, H.J.M., Duchet, J.C., de Beer, V.H.J. and Prins,
R., in Proc. of the 8'h Int. Congr. on Catal., Berlin 1984, Part II, p. 387. Verlag Chemie,
Weinheim, 1984.
32. Welters, W.J.J., Koninyi, T.I., de Beer, V.H.J. and van Santen, R.A., in 'New Frontiers in
Catalysis', Guczi, L. et a!. Eds., p. 1931. Elsevier, Amsterdam, 1993.
33. de Boer, M., Ph. D. Thesis, University of Utrecht, 1992.
34. Glemser, 0., and Haeseler, R.J., Z. Anorg. Allgem. Chern. 316 (1962) 168.
7 NaY SUPPORTED MOLYBDENUM SULFIDE CATALYSTS PREPARED VIA ADSORPTION
OF MOLYBDENUM HEXACARBONYL
ABSTRACT NaY supported molybdenum sulfide catalysts are prepared by gas phase adsorption of
Mo(C0)6 followed by different treatments (immediate sulfidation, but also oxidation or
decomposition of the adsorbed Mo(C0)6, prior to sulfidation). The catalysts are characterized
by means of thiophene hydrodesulfurization (HDS), overall sulfur analysis, N2 adsorption, 129Xe-NMR and High Resolution Electron Microscopy. In situ sulfidation (673 K), oxidation
(673 K) or decomposition (573 K) all result in large amounts of Mo sulfide, Mo oxide or
Mo metal respectively, located on the outside of the zeolite particles. Only a relatively small
amount of the Mo species remain in the zeolite pores. This amount is lowest for the
decomposed sample. The HDS activity measured after in situ sulfidation of the above
samples reveals similar catalytic properties for all samples except the decomposed sample,
which has a clearly lower activity. This is probably due to the lower amount ofMoS2 present
in the zeolite pores of the latter catalyst.
123
124 Chapter 7
INTRODUCTION
Commercial hydrocracking catalysts often combine sulfided Ni-Mo or Ni-W phases as
the hydrogenation component with a zeolite support (either alone or in combination with an
amorphous silica-alumina support) as the acidic component (1-3). Aiming at the
improvement of these catalysts the incorporation of molybdenum sulfide into zeolites has
attracted increasing attention in recent years ( 4-11). Higher amounts of metal sulfides in the
zeolite pores may lead to catalysts with a higher catalytic activity (1 2, 13). Several
preparation techniques can be used to combine the molybdenum precursor material with the
zeolite, such as impregnation with ammonium heptamolybdate (AHM) (4-7), solid state ion
exchange with MoCI5 (8, 9, 14, 15), or gas phase adsorption ofMo(C0)6 (6, 10, 11). In part
I of this study the thiophene HDS activity, the sulfidation behaviour and distribution of the
Mo species in NaY supported Mo catalysts prepared by impregnation with ammonium
heptamolybdate (AHM) are discussed (1 6). It is concluded that MoS2 is mainly located on
the exterior of the zeolite particles. The high catalytic activity of these catalysts is probably
not caused by this MoS2 fraction, but by the relatively small fraction of MoS2 located in the
zeolite pores. The catalytic activity of the NaY supported molybdenum sulfide catalysts may
be improved by increasing the amount higher amounts of MoS2 in the zeolite pores.
However, for this purpose other preparation techniques than impregnation with AHM have
to be studied (J 6).
Gas phase adsorption of Mo(C0)6 in Y zeolites is a promising alternative as preparation
technique. In contrast to impregnation with AHM followed by drying (in which case almost
all Mo species are deposited on the exterior(] 6)), the gas phase adsorption of Mo(CO\
results in precursor catalysts in which all Mo is located in the zeolite pores (17). Recent
studies indicate that the adsorbed Mo(C0)6 or subcarbonyl species are highly reactive
towards H2S and, consequently, may produce highly dispersed molybdenum sulfide systems
(6, 10, 11, 18, 19). After sulfidation the catalysts prepared via Mo(C0)6 showed a higher
thiophene hydrodesulfurization (HDS) activity than the molybdenum sulfide catalysts
prepared via impregnation with AHM (6, 19) . On the other hand, Vrinat et al. (20) found
only low activities for the HDS of dibenzothiophene on reduced NaY supported Mo(C0)6
catalysts. So far, only little information is available about the effect (degree of sulfidation
and the location of the resulting molybdenum species) of sulfidation of the adsorbed
Mo(C0)6.
In the present study NaY supported molybdenum sulfide catalysts are prepared via gas
phase adsorption of Mo(C0)6• Several treatments are used to convert Mo(C0)6 into MoS2,
with the aim of preparing catalysts with a large amount of MoS2 in the zeolite pores.
NaY supported molybdenum sulfide catalysts prepared with Mo(C0) 6 125
Mo(C0)6 adsorbed in NaY is directly su1fided, but also oxidation or decomposition of
Mo(C0)6 prior to sulfidation are used. The latter two treatments are used in order to prepare
a highly dispersed molybdenum oxide or metal phase distributed throughout the pores of the
zeolite, which, after sulfidation, can be converted into a highly dispersed MoS2 phase. The
resulting catalysts are tested regarding their thiophene HDS activity. The degree of
sulfidation is checked by overall sulfur analysis, while the distribution of the Mo phase for
the directly sulfided, the oxidized and decomposed Mo(C0)6 samples is studied by N2
adsorption, Xe adsorption and 129Xe-NMR and High Resolution Electron Microscopy
(HREM) combined with Energy Dispersive X-ray (EDX) analysis. The results are compared
with those obtained for the NaY supported molybdenum catalysts prepared via impregnation
with AHM (1 6).
EXPERIMENTAL
Catalyst preparation Prior to the gas phase adsorption of Mo(C0)6 the NaY support (Na5iAI02) 5iSi02) 138 *
250 Hp, PQ CBV-100) is dried for 2 hat 673 Kin a purified He flow (H20 and 0 2 levels
lower than 2 ppm). After cooling to 333 K the zeolite (sample size circa 1 g) is treated for
approximately 16 h with a mixture of molybdenum hexacarbonyl vapour and He (flow
through rate 50 cm3 min-1). This procedure provides complete saturation of the zeolite with
Mo(C0)6, resulting in a loading of about 2 Mo(C0)6 molecules per supercage (about 11 wt%
Mo).
After saturation the following in situ treatments are applied:
1) sulfidation: This treatment is equivalent to the in situ sulfidation procedure before
thiophene HDS measurements. The sample is heated in a 10% H2SIH2 flow (50 cm3 min-1)
using a temperature program (6 K min-1 to 673 K, 2 hat 673 K), flushed I hat 673 Kin
He (to remove adsorbed H2S) and cooled to room temperature in He (50 cm3 min-1).
2) oxidation: Mo(CO)/NaY samples are oxidized in pure 0 2 with the aim to prepare a highly
dispersed molybdenum oxide phase distributed throughout the zeolite pores. The catalyst is
heated in a 0 2 flow (50 cm3 min-1) using a temperature program (6 K min-1 to 673 K, 2 h
at 673 K), flushed 1 hat 673 K in He (50 cm3 min-1) and cooled -to-room temperature in He.
The Mo(CO)/NaY samples are oxidized at 673 K to enable a comparison with the Mo/NaY
(impr) catalysts, which are calcined at 673 K in ambient air (16). In order to examine the
influence of the oxidation temperature on the distribution of the molybdenum oxide phase
(examined by 129Xe-NMR) one sample is prepared by oxidation at 373 K using the same
procedure as described above.
126 Chapter 7
3) decomposition: Mo(C0)6 adsorbed on NaY is decomposed into Mo(C0)3 or Mo metal
with the aim to prepare a well disp~'Tsed molybdenum phase which is highly reactive towards
H2S. Heating a Mo(CO)JNaY sample in a He flow (50 std cm3 min.1) at 423 K (6 K min-1
to 423 K, 2 h at 423 K) results in the conversion of Mo(C0)6 into Mo(C0)3 (10, 19, 21 ).
For the decomposition to Mo metal the sample is heated to 573 K (6 K min- 1 to 573 K, 2
h at 573 K), followed by cooling to room temperature.
4) For comparison, one Mo(CO)JNaY sample is exposed to ambient air at room temperature
until it is saturated with water, and sulfided prior to further characterization.
Also combinations of these treatments, such as oxidation or decomposition followed by
in situ sulfidation are used. After these treatments the samples used for Mo and S analysis,
HREM and HDS experiments are exposed to air, while those used for the 129Xe-NMR
experiments are transferred into a recirculation type glove box (02 and H20 content lower
than 2 ppm). The pretreatment procedure and temperature are added (between parentheses)
to the catalyst notation (S = sulfided; 0 =oxidized, D =decomposed; for instance Mo/NaY
(S 673) represents a Mo(C0)6/NaY sample sulfided at 673 K). The freshly prepared
Mo(C0)6 sample and the sample exposed to ambient air are denoted as fresh MoiNa Y and
Mo/NaY (air, 293) respectively.
Sulfur and molybdenum analysis The samples are dissolved in aqua regia while carefully heating the mixture. During this
process all Mo species are dissolved and the Mo present as MoS2 is converted into
molybdenum sulphate. Subsequently, the Mo content is analyzed by AAS, while the amount
of sulphate is determined by titration with barium perchlorate.
Xe adsorption and 129Xe-NMR The presence of molybdenum species inside the zeolite pore system is studied by Xe
adsorption measurements and 129Xe NMR spectroscopy. The principles and experimental
details of this technique are described elsewhere (22-24). The samples are transferred into
the NMR tubes using a recirculation type glove box, evacuated at room temperature to a
pressure below 1 o-4 mbar and stored in a volumetric adsorption apparatus. Xe is adsorbed
on these samples at different Xe pressures at 303 K. The NMR spectra of adsorbed Xe are
recorded at the same temperature using a Bruker MSL 400 spectrometer at 110.7 MHz with
pulse excitation (0.5 s pulse delay) on stationary samples. The number of scans varies
between 2 * 102 and 105•
NaY supported molybdenum sulfide catalysts prepared with Mo(C0) 6 127
N2 adsorption measurements
The surface area and the pore volume of the samples are studied by N2 adsorption
experiments. After preparation, the samples are transferred into the sample holder without
exposure to 0 2 or H20. The BET surface area and the micropore volume of the catalysts are
subsequently determined by N2 adsorption at 77 K using a Carlo Erba Sorptomatic 1900.
High Resolution Electron Microscopy
For some samples, the amount of molybdenum located on the exterior of the zeolite
particles is analyzed by HREM, using a Philips CM 30 T electron microscope. The samples
are prepared as follows. After grinding, the Mo-containing zeolite particles are suspended
in alcohol. A copper grid coated with a microgrid carbon polymer is loaded with a few
droplets of this suspension.
Together with HREM, the transition metal distribution throughout the zeolite particles
is studied (integrally or segment wise) by means of Energy Dispersive X-ray (EDX) analysis.
Catalytic activity
Thiophene HDS activity measurements are carried out in a microflow reactor under
standard conditions (673 K, I atm, 4.0 % thiophene in H2, 50 std cm3 min· '). Catalyst
samples of 0.25 g are sulfided in situ using a mixture of 10% H2S in H2 (60 std cm3 min-',
6 K min-1 from 293 K to 673 K, 2 h at 673 K). Reaction products are analyzed by on line
G.C. analysis. The first sample is taken after 2 min reaction time and the following ones at
intervals of 35 minutes.
Due to the presence of a few acid sites some polymerization (unsaturated products) and
cracking (butenes and polymerized products) takes place resulting in a few additional
products besides the usual butenes and butane. Therefore, thiophene converted to any of the
reaction products including coke is taken into account for the calculation of the reaction rate
constant (kHDs) assuming the reaction to be first order in thiophene (25).
RESULTS
Sulfur and molybdenum analysis In Table 7 .I the results of the Mo and S analysis are shown. The Mo contents of the
catalysts are nearly the same. Only the catalysts oxidized in pure 0 2 (0 673 and 0 673, S
673) and the one sulfided after exposure to air (air, S 673) show slightly lower Mo contents.
The S/Mo ratios of the sulfided samples vary clearly. In situ sulfidation (S 673) directly after
adsorption of Mo(C0)6 results in complete sulfidation to MoS2, while intermediate exposure
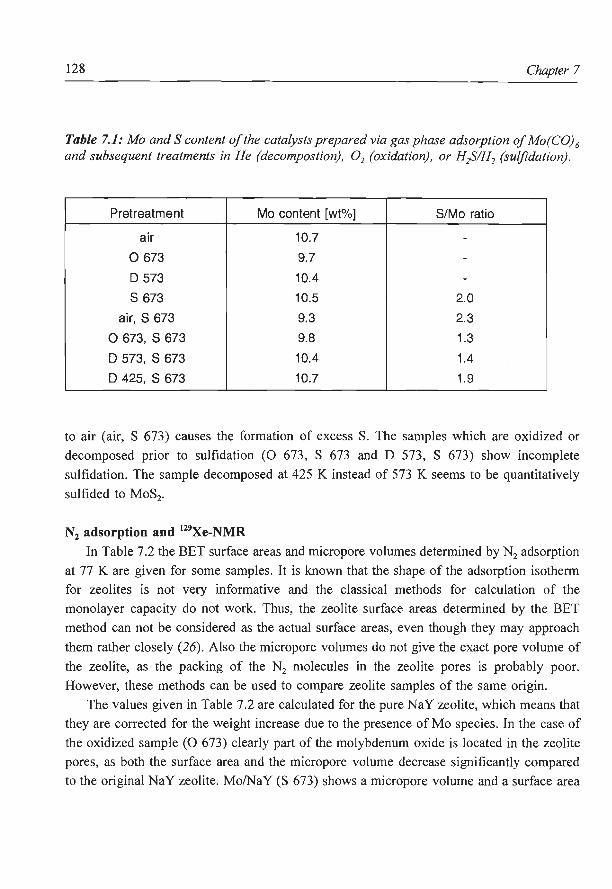
128 Chapter 7
Table 7.1: Mo and S content of the catalysts prepared via gas phase adsorption of Mo(C0) 6
and subsequent treatments in He (decompostion), 0 2 (oxidation), or H~IH2 (sulfidation).
Pretreatment Mo content [wt%] S/Mo ratio
air 10.7 -
0 673 9.7 -
D 573 10.4 -s 673 10.5 2.0
air, S 673 9.3 2.3
0 673, s 673 9.8 1.3
D 573, S 673 10.4 1.4
D 425, S 673 10.7 1.9
to air (air, S 673) causes the formation of excess S. The samples which are oxidized or
decomposed prior to sulfidation (0 673, S 673 and D 573, S 673) show incomplete
sulfidation. The sample decomposed at 425 K instead of 573 K seems to be quantitatively
sulfided to MoS2•
N2 adsorption and 129Xe-NMR
In Table 7.2 the BET surface areas and micropore volumes determined by N2 adsorption
at 77 K are given for some samples. It is known that the shape of the adsorption isotherm
for zeolites is not very informative and the classical methods for calculation of the
monolayer capacity do not work. Thus, the zeolite surface areas determined by the BET
method can not be considered as the actual surface areas, even though they may approach
them rather closely (26). Also the micropore volumes do not give the exact pore volume of
the zeolite, as the packing of the N2 molecules in the zeolite pores is probably poor.
However, these methods can be used to compare zeolite samples of the same origin.
The values given in Table 7.2 are calculated for the pure NaY zeolite, which means that
they are corrected for the weight increase due to the presence of Mo species. In the case of
the oxidized sample (0 673) clearly part of the molybdenum oxide is located in the zeolite
pores, as both the surface area and the micropore volume decrease significantly compared
to the original NaY zeolite. Mo/NaY (S 673) shows a micropore volume and a surface area
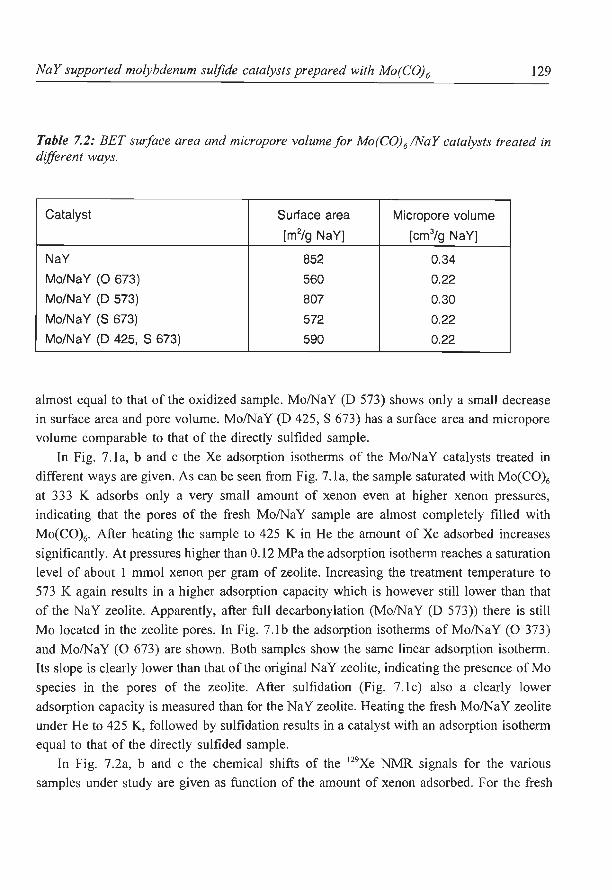
NaY supported molybdenum sulfide catalysts prepared with Mo(C0) 6 129
Table 7.2: BET surface area and micropore volume for Mo(C0) 6 /NaY catalysts treated in different ways.
Catalyst Surface area Micropore volume
[m2/g NaY] [cm3/g NaY]
NaY 852 0.34
Mo/NaY (0 673) 560 0.22
Mo/NaY (D 573) 807 0.30
Mo/NaY (S 673) 572 0.22
Mo/NaY (D 425, S 673) 590 0.22
almost equal to that of the oxidized sample. Mo/NaY (D 573) shows only a small decrease
in surface area and pore volume. Mo/NaY (D 425, S 673) has a surface area and micropore
volume comparable to that of the directly sulfided sample.
In Fig. 7 .I a, b and c the Xe adsorption isotherms of the MoiNa Y catalysts treated in
different ways are given. As can be seen from Fig. 7.1 a, the sample saturated with Mo(C0)6
at 333 K adsorbs only a very small amount of xenon even at higher xenon pressures,
indicating that the pores of the fresh MoiNa Y sample are almost completely filled with
Mo(C0)6• After heating the sample to 425 K in He the amount of Xe adsorbed increases
significantly. At pressures higher than 0.12 MPa the adsorption isotherm reaches a saturation
level of about I mmol xenon per gram of zeolite. Increasing the treatment temperature to
573 K again results in a higher adsorption capacity which is however still lower than that
of the NaY zeolite. Apparently, after full decarbonylation (Mo/NaY (D 573)) there is still
Mo located in the zeolite pores. In Fig. 7 .I b the adsorption isotherms of MoiNa Y (0 373)
and Mo/NaY (0 673) are shown. Both samples show the same linear adsorption isotherm.
Its slope is clearly lower than that of the original NaY zeolite, indicating the presence of Mo
species in the pores of the zeolite. After sulfidation (Fig. 7.1 c) also a clearly lower
adsorption capacity is measured than for the NaY zeolite. Heating the fresh Mo/NaY zeolite
under He to 425 K, followed by sulfidation results in a catalyst with an adsorption isotherm
equal to that of the directly sulfided sample.
In Fig. 7 .2a, b and c the chemical shifts of the 129Xe NMR signals for the various
samples under study are given as function of the amount of xenon adsorbed. For the fresh

130 Chapter 7
2.00 ~
cr> -:::::::- a
0 1.50 E E
Q) 1.00 X
"0 Q)
_o ..._ 0.50 0
Vl "0 0
0.00 0.00 0.05 0.10 0.15
p (MPa)
2.00 Figure 7.1: Xe adsorp-
~ tion isotherms for cr>
various Mo(C0) 6 /NaY ........._ b 0 1.50 derived samples. E E a) • NaY; Q) 1.00 + Mo!NaY (fresh); X
"0 T Mo/NaY (D 425); Q)
_o o Mo/NaY (D 573). ..._ 0.50 0
b) eNaY; (/)
"0 0 o Mo/NaY (0 373);
0 .00 • Mo/NaY (0 673). 0.00 0 .05 0.10 0 .1 5
c) • NaY; p (MPa) o Mo/NaY (D 425,
s 673); • Mo!NaY (S 673) .
2.00 ~
cr> ........._ c
0 1.50 E E
Q) 1.00 X
"0 Q)
_o ..._ 0.50 0 Vl
"0 0
0.00 0.00 0.05 0.10 0.15
p (MPa)
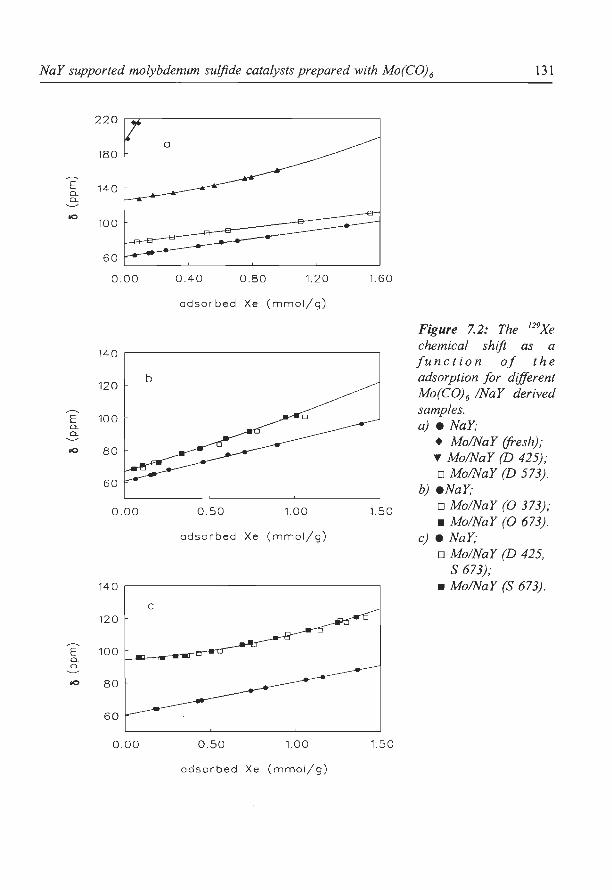
NaY supported molybdenum sulfide catalysts prepared with Mo(C0) 6 131
220
180
~
E 140 o._ o._
oO 100
60
0.00
140
120 b
~
E 100 o._ o._
oO 80
60
0.00
140
c 120
~
E 100 o._ o._
oO 80
60
0.00
0.40 0.80 1.20
adsorbed Xe (mmol/g)
0.50 1.00
adsorbed Xe (mmal/g)
0.50 1.00
adsorbed Xe ( mmol/g )
1.60
1.50
1.50
Figure 7.2: The 129Xe chemical shift as a function of the adsorption for different Mo(C0) 6 /NaY derived samples. a) • NaY;
+ Mo/NaY (fresh); T Mo/NaY (D 425); o Mo!NaY (D 573).
b) eNaY; o Mo/NaY (0 373); • Mo/NaY (0 673).
c) • NaY; o Mo/NaY (D 425,
s 673); • Mo/NaY (S 673) .
132 Chapter 7
MoiNa Y sample a very high chemical shift of about 195 ppm at zero xenon density is
observed. Treatment of the zeolite in He at 425 K or 573 K results in a considerable
decrease of the chemical shift. However, in both cases o at zero xenon density remains
significantly higher than for the pure NaY zeolite. For the sample treated at 425 K the
chemical shift shows a non linear dependence on the amount of Xe adsorbed. As can be seen from Fig. 7.2a and b, oxidation at 373 K or 673 K results in the same chemical shift which
is clearly lower than the shift observed for fresh Mo/NaY, but still significantly higher than
the shift for 129Xe on NaY. After sulfidation (Fig. 7.2c) the chemical shift is also clearly
lower than for the fresh Mo/NaY sample, and higher than for the original NaY zeolite. The
extrapolated chemical shift at zero xenon density for Mo/NaY (S 673) is higher than for
Mo/NaY (0 673). The Mo/NaY (S 673) and the Mo/NaY (D 425, S 673) sample show the
same non linear dependence of the chemical shift from the amount of Xe adsorbed.
HREM HREM is used to examine the distribution of the Mo species on the outside of the zeolite
particles. In fresh MoiNa Y the Mo(C0)6 is of course exclusively located in the pores of the
zeolite. After decomposition in He at 425 K the Mo(C0)3 species formed will still be located
in the zeolite pores (21 , 27) . However, after sulfidation a large part of the Mo is present as
MoS2 slabs on the outside of the zeolite particles. Almost all zeolite particles are partly
covered with several small MoS2 slabs, which are sometimes stacked up to 8 layers thick.
Figure 7.3a shows a Mo/NaY (S 673) particle. The zeolite crystal became amorphous due
to the high intensity of the electron beam needed for this magnification. At several places
MoS2 slabs are visible. The isolated dark spots discemable on the amorphous parts may also
be MoS2 particles, seen from above. Comparison of the average Mo/Si ratio in the EDX
spectrum of a great number of zeolite particles with the ratio at the particle edges reveals a
strong surface enrichment of Mo. As no MoS2 free parts are observed at the outer surface
of Mo/NaY (S 673) zeolite particles, one can not determine the Mo concentration in the
centre ofthese particles by EDX. The electron beam passes always a surface region when
it enters and leaves the particles, and the Mo in these surface regions will also contribute to
the EDX spectrum.
Figure 7.3b also shows a Mo/NaY (air, S 673) particle. The MoS2 distribution on this
sample is more inhomogeneous than for Mo/NaY (S 673). Again a strong surface enrichment
of MoS2 can be observed, but now also the distribution between the various zeolite particles
has become inhomogeneous. On some particles large amounts of MoS2 are concentrated,
while on others almost no Mo is present. Some very small particles existing of pure MoS2
(without zeolite) are also observed. In Fig. 7.3b a MoS2 structure which is partially detached
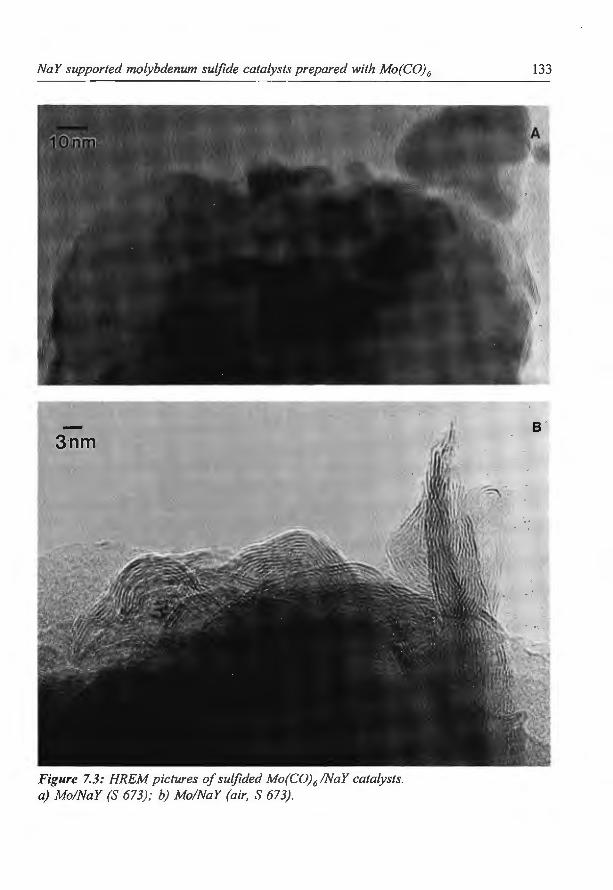
NaY supported molybdenum sulfide catalysts prepared with Mo(C0) 6
Figure 7.3: HREM pictures of sulfided Mo(C0) 6 !NaY catalysts. a) Mo/NaY (S 673) ; b) Mo!NaY (air, S 673).
133
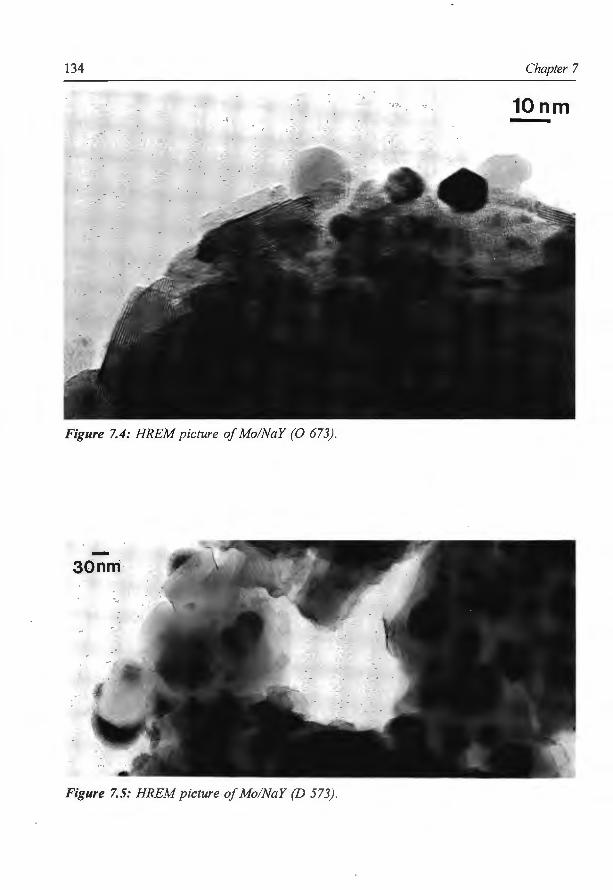
134 Chapter 7
10nm
Figure 7.4: HREM picture of Mo/NaY (0 673).
-30nn.l
Figure 7.5: HREM picture of Mo/NaY (D 573).

NaY supported molybdenum sulfide catalysts prepared with Mo(C0) 6 135
from the zeolite surface can be seen.
Upon oxidation (0 673) again a considerable part of the Mo is located at the exterior of
the zeolite particles (Fig. 7.4). Most of the zeolite particles are partly covered with small
crystalline structures of varying size. The larger structures are examined by EDX and appear
to consist mainly ofMo and 0. Comparison of the average Mo/Si ratio (measured by EDX)
with the ratio at the particle edges again reveals a strong surface enrichment of Mo.
Also in the case of the decomposed sample (D 573) large amounts of Mo are present at
the exterior of the zeolite, as can be seen in Fig. 7.5. Most of the zeolite particles are partly
covered with dark spots. EDX revealed that the dark particles exist mainly of Mo, with only traces of 0 present, indicating that these clusters probably exist of Mo metal. Some zeolite
crystals are covered with large hemispherical Mo particles, while other zeolite crystals are
completely covered with a relatively thin Mo layer. Comparison of the Mo/Si ratio for a
segment of a zeolite particle on which no dark clusters are present with the overall ratio
revealed that only about 1 0 % of the Mo remained in the pores of the zeolite.
Catalytic activity
In Fig. 7.6 the thiophene HDS activities of the sulfided catalysts are given. All catalysts
are sulfided prior to the activity measurement, including those which are already sulfided
(Mo/NaY (S 673) and Mo/NaY (D 425, S 673)). This sulfidation pretreatment is added to
the catalyst notation as *S 673, which means that the samples are (re)sulfided after exposure
to air. For all samples (except Mo/NaY (air, S 673)) the contact to air in between the
treatment after Mo(C0)6 adsorption and the sulfidation prior to the thiophene HDS is
restricted to a few minutes to avoid water adsorption on the zeolite as much as possible.
Thus adsorbed water can not significantly influence the sulfidation process, and the catalysts are comparable to the in situ sulfided samples (after Mo(C0)6 adsorption).
The thiophene HDS activity of the NaY support is negligible compared to the Mo
catalysts. The Mo/NaY (air, S 673); Mo/NaY (S 673, *S 673); Mo/NaY (0 673, *S 673) and
Mo/NaY (D 425, S 673, *S 673) (the latter is not shown in Fig. 7.6) all have a similar
thiophene HDS activity. Only the Mo/NaY (D 573, *S 673) sample shows a clearly lower HDS activity. The deactivation is very low for all catalysts, indicating that both sintering of
the metal sulfide phase and coke formation are very low. The products mainly consist of
butenes, only a small amount of butane is formed. Besides these C4 products also small
amounts of products from cracking and polymerization reactions are observed (the product
selectivity for C4 products is around 95 % for all catalysts).
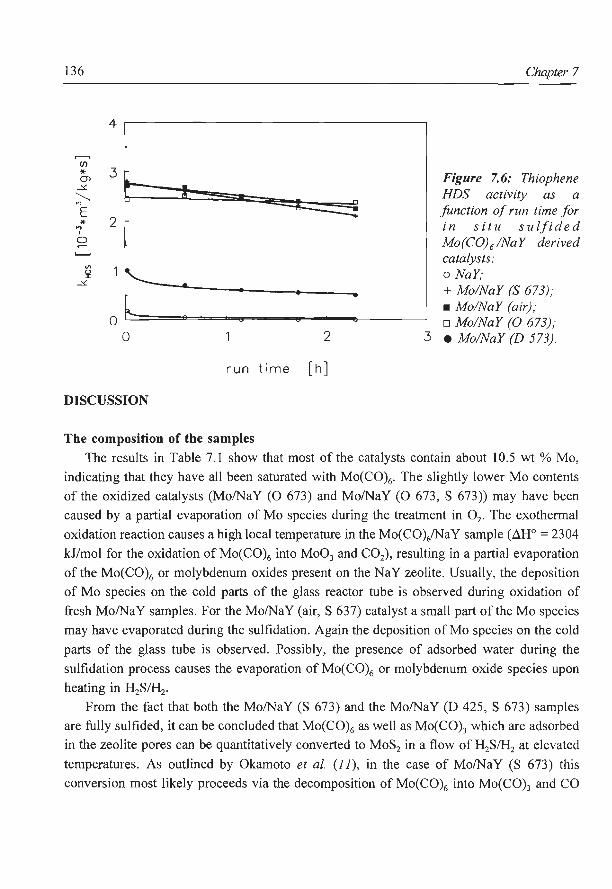
136
4
...---, (f)
* 3 CJ> ~ _y .
"--.. "' E
2 * "' ' 0
Vl
~ 0 r
_y
~ 0
0 2
run time [h]
DISCUSSION
The composition of the samples
Chapter 7
Figure 7.6: Thiophene HDS activity as a function of run time for in situ sulfided Mo(C0) 6 /NaY derived catalysts: o NaY; + Mo/NaY (S 673); • Mo!NaY (air); o Mo!NaY (0 673);
3 e Mo/NaY (D 573).
The results in Table 7.1 show that most of the catalysts contain about 10.5 wt% Mo,
indicating that they have all been saturated with Mo(C0)6. The slightly lower Mo contents
of the oxidized catalysts (Mo/NaY (0 673) and Mo/NaY (0 673, S 673)) may have been
caused by a partial evaporation of Mo species during the treatment in 0 2• The exothermal
oxidation reaction causes a high local temperature in the Mo(CO)/Na Y sample (.6.H0 = 2304
kJ/mol for the oxidation of Mo(C0)6 into Mo03 and C02), resulting in a partial evaporation
of the Mo(C0)6 or molybdenum oxides present on the NaY zeolite. Usually, the deposition
of Mo species on the cold parts of the glass reactor tube is observed during oxidation of
fresh Mo/NaY samples. For the Mo/NaY (air, S 637) catalyst a small part of the Mo species
may have evaporated during the sulfidation. Again the deposition of Mo species on the cold
parts of the glass tube is observed. Possibly, the presence of adsorbed water during the
sulfidation process causes the evaporation of Mo(C0)6 or molybdenum oxide species upon
heating in H2SIH2 .
From the fact that both the Mo/NaY (S 673) and the Mo/NaY (D 425, S 673) samples
are fully sulfided, it can be concluded that Mo(C0)6 as well as Mo(C0)3 which are adsorbed
in the zeolite pores can be quantitatively converted to MoS2 in a flow of H2S/H2 at elevated
temperatures. As outlined by Okamoto et a!. (11), in the case of Mo/NaY (S 673) this
conversion most likely proceeds via the decomposition of Mo(C0)6 into Mo(C0)3 and CO
NaY supported molybdenum sulfide catalysts prepared with Mo(C0) 6 137
(between 333 K and 425 K). Mo(C0)3 is known (1 1) to react already at 373 K with H2S to
form MoS2, H2 and CO.
In the case ofMo/NaY (D 425, S 673) sulfidation will proceed via almost the same route
as for Mo/NaY (S 673). In the former sample Mo(C0)6 is decomposed into Mo(C0)3
and
CO under He at 425 K, followed by cooling to room temperature. The subsequent sulfidation
of the Mo(C0)3 can start already at room temperature. The lower temperature at which the
sulfidation reaction can start may result in a MoS2 distribution which is different from that
obtained on Mo/NaY (S 673). We will return to this point in the next section.
On Mo/NaY (0 673) all Mo is oxidized. Most likely the adsorbed Mo(C0)6 has been
converted into Mo03• On the Mo/NaY (D 573) sample Mo(C0)6 is completely
decarbonylated, and all Mo is present as Mo metal.
Both Mo/NaY (0 673, S 673) and Mo/NaY (D 573, S 673) show incomplete sulfidation.
This may be due to the presence of large Mo particles (either oxidic or metallic). HREM
revealed the presence of oxidic and metallic molybdenum particles as large as 50 and 100
nm for the Mo/NaY (0 673) and Mo/NaY (D 573) samples, respectively. Arnoldy et al. (28)
showed that sulfidation of bulk Mo03 particles is very slow and limited to surface layers at
673 K, and will only be completed at far higher temperatures. Therefore, the large oxidic
molybdenum particles present on the catalyst will probably not be completely sulfided at 673
K. For AHM impregnated NaY catalysts sulfidation is also found to be incomplete due to
the presence of large oxidic molybdenum particles (1 6).
On the sulfidation behaviour of metallic Mo particles hardly any information is available
in literature. Possibly, for the very large metallic Mo particles complete sulfidation is also difficult, and limited to the surface layers of the particles, causing the incomplete sulfidation
ofMo/NaY (D 573, S 673). Additionally, the oxidation ofMo(O) to Mo(IV) in the reductive
H2S/H2 environment may hamper the sulfidation of the Mo metal as well.
Although the possibility that the adsorbed Mo(C0)6 remains stable in ambient air can not
be excluded, it seems likely that upon exposure of a fresh Mo/NaY sample to ambient air
the Mo(C0)6 is slowly oxidized (the colour of the catalyst changes from yellow to pale
blue). Which type of molybdenum oxide is formed is unclear (possibly Mo20 5 * x HP is formed, causing the blue colour of the sample). Upon sulfidation the molybdenum species
on the Mo/NaY (air) sample are completely converted into MoS2. Even a slight excess of
sulfur is present after sulfidation if only MoS2 is formed. This excess S must originate from
elemental S or MoS3. However, at the sulfidation temperature (673 K) these species should
have been reduced immediately. The reason for the presence of the slight excess of sulfur
is therefore not clear.
138 Chapter 7
The distribution of the Mo compounds in the zeolite pores The adsorption isotherms for Xe show that for fresh MoiNa Y the pores are almost
completely filled with Mo(C0)6. This is in line with the enormous chemical shift and the low
intensity of the corresponding 129Xe signal in the NMR spectra. Apparently, there are some
zeolite pores which are still accessible for Xe atoms, in spite of the presence of about 2
Mo(C0)6 molecules per supercage. Tway and Apple (29) also found some Xe adsorption in
the pores of NaY zeolite saturated with Mo(C0)6.
Conversion of Mo(C0)6 to Mo(C0)3 (in Mo/NaY (D 425)) results in a marked
enhancement of the adsorption capacity (Fig. 7. I a) and a strong decrease of the chemical
shift (Fig. 7.2a). The adsorption capacity still remains far lower than that of the pure NaY
zeolite. The Mo(C0)3 present after decomposition in He at 425 K occupies less space than
the Mo(C0)6, but still a large part of the supercages is filled by the Mo(C0)3 molecules.
The shape of the adsorption isotherm suggests a strong interaction between adsorbed Xe
and the Mo/NaY (D 425) sample. Already at low pressures Xe is adsorbed on the sample in
large amounts due to the strong interaction. Consequently, the saturation level is reached at
relatively low pressures, causing a levelling off of the adsorption isotherm. Possibly, Xe is
strongly adsorbed on Mo(C0)3 present in the zeolite pores.
The strong interaction also explains the slightly concave curvature of the chemical shift
as a function of the amount of Xe adsorbed. According to the theory of Fraissard (22, 30)
for strong interaction between the Xe and the adsorption sites, particularly at low Xe
pressures, each Xe atom will have a relatively long residence time on these sites, resulting
in an increase of o compared to samples in which the adsorption is weaker. At higher Xe
concentrations the exchange of the adsorbed Xe atoms with those adsorbed on the other sites
on the NaY zeolite will become faster, and the influence of the strong adsorption on o will
become smaller. Consequently, at increasing Xe concentrations, the average chemical shift
will at first decrease if there is exchange of strongly adsorbed Xe atoms, and then increase
with the number of Xe-Xe collisions, resulting in a concave curvature for o as a function of
the amount of Xe adsorbed.
After full decarbonylation (Mo/NaY (D 573)) HREM results show that large metallic Mo
particles are present on the exterior of the zeolite particles. These are most likely caused by
migration of the metallic Mo atoms formed after decomposition of the Mo(C0)6 above 423
K (1 0, 21). Coddington et a!. ( 31) observed the presence of very small metallic Mo clusters
in the zeolite pores after decomposition of Mo(C0)6/Na Y under vacuum at 4 73 K. Further
heating, however, resulted in sintering of the Mo metal. Also Tway and Apple (29) observed
migration of the Mo metal out of the supercages after decomposition ofMo(C0)6/NaY under
vacuum at 623 K. Migration of the metal atoms from the pores to the exterior at elevated
NaY supported molybdenum sulfide catalysts prepared with Mo(C0) 6 139
temperatures is known for many other zeolite supported metal catalysts as well (32). The
migration is supposedly facilitated by the absence of nucleation sites in the supercages as a
result of which the Mo atoms can move through the zeolite channels until they reach the
outer surface.
Both the BET surface areas and the micropore volumes (Table 7.2) show a small
decrease compared to NaY, indicating that a part of the Mo metal remained inside the zeolite
pores after decomposition of Mo(C0)6 at 573 K. Unfortunately, as discussed before, these
results can not be used to calculate the exact amount of Mo in the zeolite pores.
The Xe adsorption capacity of Mo/NaY (D 573) has markedly increased compared to
Mo/NaY (D 425) (Fig. 7.la) and this is accompanied by a much lower chemical shift (Fig.
7.2a). However, the adsorption capacity ofMo/NaY (D 573) is still lower than for pure NaY.
From these results we can conclude that a certain fraction of the metallic molybdenum is
present in the zeolite pores, but again an accurate estimate of this fraction can not be made
from these experiments (24) . The combined HREM-EDX experiments revealed that only a
very small fraction (approximately 10 %) of the Mo metal is located in the channels of the
zeolite.
On MoiNa Y (0 673) large oxidic molybdenum crystals are present on the outside of the
zeolite particles, as shown by HREM. These oxidic particles are formed during the oxidation
reaction. The reaction between pure 0 2 and Mo(C0)6/Na Y already starts at room temperature
and is very exothermic, resulting in a strong heating of the zeolite particles. During this
reaction the Mo species are able to migrate to the exterior of the zeolite crystals, where they
can form large oxidic particles. Ozkar et al. (33) concluded that upon photo oxidation of
Mo(C0)6 at room temperature all molybdenum oxide clusters are present in the NaY zeolite
pores. However, their oxidation conditions are completely different from ours and may very
well result in a different Mo distribution.
The N2 adsorption experiments show that not all Mo has left the pores after oxidation.
Both the surface area and the micropore volume show a strong decrease compared to the
original NaY (Table 7.2). The decrease in pore volume is much stronger than for Mo/NaY
(D 573), which is not only the result of a higher specific volume of Mo03 compared to Mo
metal, but probably also the amount of Mo present in the pores of the Mo/NaY (0 673) is
higher. The almost proportional relative decrease in surface area and pore volume suggests
that this diminution is not caused by partial but by complete filling (over the entire diameter)
of the pores with molybdenum oxide. For completely filled supercages both the surface area
and the pore volume will decrease to a similar degree, while for only partially filled
supercages the pore volume will decrease significantly faster than the surface area.
The decrease in BET surface area and pore volume of Mo/NaY (0 673) with respect to
140 Chapter 7
NaY is larger than that for calcined samples prepared via impregnation with AHM solutions
(16). Probably, the amount of molybdenum oxide present in the zeolite pores is somewhat
larger for Mo/NaY (0 673) than for the calcined Mo(IO.O wt%)/NaY (impr) sample.
Similar to the samples prepared by impregnation with AHM (1 6) the decrease in pore
volume for the above mentioned Mo(C0)6/NaY derived samples is much larger than the
maximum volume which the molybdenum oxide can occupy. For example; for Mo/NaY (0
673) the decrease is 0.12 cm3 g·' , while the Mo phase which is formed has a volume of only
0.05 cm3 g·', assuming all Mo to be present as Mo03) . This discrepancy may be due to pore
blocking, that means that some parts of the zeolite pores which are empty can no longer be
reached by N2, because all entrances to that part of the zeolite pore system are blocked by
the Mo phase.
Oxidation of fresh Mo/NaY in pure 0 2 either at 373 K or at 673 K resulted in a strong
increase in adsorption capacity for Xe compared to the fresh MoiNa Y (Fig. 7.1 b), but the
Xe adsorption isotherm is still far lower than for NaY. Clearly, a certain amount of
molybdenum oxide is present in the zeolite pores which might be even larger than the
amount ofMo metal in the case ofMo/NaY (D 573). However, some precaution is necessary
comparing these adsorption isotherms, since in Mo/NaY (D 573) only Mo metal is present,
which will occupy much less space per Mo atom than the molybdenum oxide present in
Mo/NaY (0 673). Mo/NaY (0 673) shows a smaller chemical shift than Mo/NaY (D 573),
which seems to be in contradiction with the lower adsorption capacity for Xe (a lower
adsorption capacity indicates the presence of smaller pores, which should result in a larger
chemical shift (22)). This is probably due to the weak interaction between Xe and
molybdenum oxide in Mo/NaY (0 673) compared to the relatively strong interaction between
Xe and Mo metal on Mo/NaY (D 573).
The higher slope in the o versus adsorbed Xe plot for Mo/NaY (0 673) compared to
NaY suggests that some pore blocking occurred (22). From the similar results obtained for
oxidation at 373 K or 673 K we can conclude that the oxidation and also the migration from
the inner to the outer zeolite surface already has been completed at 373 K. Upon further
heating no changes in the distribution of the molybdenum oxide are observed.
Direct comparison of the Xe adsorption and 129Xe NMR results ofMo/NaY (0 673) with
those of the oxidic calcined Mo(IO.O wt%)/NaY (impr) sample (16) reveals a somewhat
higher adsorption capacity of the latter sample than for Mo/NaY (0 673). The chemical
shifts are only slightly different, consistent with the adsorption capacities. Apparently, the
amount of molybdenum oxide present in the zeolite pores is somewhat larger for Mo/NaY
(0 673) than for Mo(lO.O wt%)/NaY (impr), which is in good agreement with the BET
results.
NaY supported molybdenum sulfide catalysts prepared with Mo(C0) 6 141
On Mo/NaY (S 673) large amounts of MoS2 are located at the outside of the zeolite
particles (HREM). Evidently, during sulfidation up to 673 K part of the Mo has migrated
from the zeolite supercages to the exterior. The migration will take place during the
sulfidation procedure, as both the Mo(C0)6 and the Mo(C0)3 are stable in the pores of the
zeolite (21, 27). Perhaps a mobile reaction intermediate is formed during the sulfidation, but
it is also very well possible that the small MoS2 clusters initially formed during sulfidation
migrate out of the zeolite channels upon further heating in H2SIH2 to 673 K. In the latter
case a lower sulfidation temperature may result in a better MoS2 dispersion.
Mo/NaY (S 673) and Mo/NaY (D 425, S 673) show an almost equal decrease in BET
surface area and micropore volume compared to the original NaY. The values measured for
these sulfided catalysts are comparable to that ofMo/NaY (0 673). Evidently, the amounts
of Mo species which remained in the zeolite pores are virtually the same for these catalysts.
Similar to Mo/NaY (0 673) both sulfided catalysts show a proportional decrease in surface
area and pore volume, indicating a complete filling (over the entire diameter) of the pores
with molybdenum sulfide. The decrease in surface area and micropore volume for Mo/NaY
(S 673) and Mo/NaY (D 425, S 673) is only slightly stronger than observed in the case of
the sulfided Mo(lO.O wt %)/NaY (impr) (16), indicating that comparable amounts ofMoS2
are present in the pores of these catalysts.
In agreement with the BET results, Mo/NaY (S 673) and Mo/NaY (D 425, S 673) show
an equal Xe adsorption, which is much higher than for fresh Mo/NaY, but still significantly
lower than for pure NaY. In addition, they show equally high chemical shifts, which are
clearly higher than for NaY. Most likely, the type of molybdenum species formed after
sulfidation and their distribution throughout the zeolite pores are similar for both catalysts.
The decomposition at 425 K before sulfidation has no influence on the distribution of the
resulting MoS2 phase. For the adsorption isotherms ofMo/NaY (S 673) and Mo/NaY (D 425,
S 673) a slight saturation effect can be observed, and the plot of o versus the amount of
adsorbed Xe shows a small concave curvature. These results suggest that the interaction
between the Xe and the sulfide phase in the zeolite pores is relatively strong.
The decrease in adsorption capacity ofMo/NaY (S 673) relative to NaY is somewhat less
than for Mo/NaY (0 673), indicating that the amount of Mo species in the zeolite pores
might be somewhat less for the sulfided sample. Nevertheless, the chemical shift of the
sulfided sample is distinctly higher than for the oxidized sample. This is most likely due to
the stronger interaction between the Xe and the Mo/NaY (S 673) sample. This indicates
again that the interaction between the adsorbed Xe and the Mo species is weaker for the
molybdenum oxide than for the molybdenum sulfide. Also the adsorption isotherms for the
sulfided samples might have been influenced by the stronger interactions, giving a higher Xe
142 Chapter 7
adsorption at low pressures.
The decrease in adsorption capacity of the sulfided Mo(IO.O wt%)/NaY (impr) sample
(16) relative to NaY is somewhat less than that ofMo/NaY (S 673). Probably, the sulfided
Mo(lO.O wt%)/NaY (impr) sample contains somewhat less Mo in the zeolite pores than
MoiNa Y (S 673). However, the chemical shift of the latter is strikingly higher. This implies
that the interaction between the internal Mo species and the Xe atoms is stronger on the
MoiNa Y (S 673) sample. Different Mo phases might be present in the two types of catalysts.
Perhaps on the sulfided Mo(lO.O wt%)/NaY (impr) sample the Mo species located in the
zeolite pores are not entirely converted into MoS2 (on Mo/NaY (S 673) the S/Mo ratio is 2.0,
suggesting a full sulfidation of all Mo, while for Mo(lO.O wt%)/NaY (impr) the S/Mo ratio
is 1.3), resulting in different interactions between the Xe atoms and the samples.
On Mo/NaY (air, S 673) again large amounts of MoS2 are located on the exterior after
sulfidation (HREM), implying that a substantial part of the Mo migrated from the zeolite
pores to the outside. Probably, the molybdenum has migrated to the exterior during the
sulfidation reaction. In addition, the presence of H20 during the sulfidation process can also
influence the distribution of the metal sulfide formed (12).
Large amounts of MoS2 are also found on the outside of the zeolite particles on MoiNa Y
(D 573, S 673) and Mo/NaY (0 673, S 673). Already before sulfidation (on Mo/NaY (D
573) and Mo/NaY (0 673)) large amounts of molybdenum metal or molybdenum oxide are
present on the outside, and these Mo species will probably not redistribute through the
zeolite pores during sulfidation.
The influence of the treatments on the catalytic activity Summarizing, the following description ofthe catalysts can be given. Sulfidation of both
the fresh Mo/NaY and Mo/NaY (D 425) results in the same catalyst system. Both catalysts
are fully sulfided (sulfur analysis) and most of the MoS2 is located on the outside of the
zeolite pores (HREM). A small fraction of the MoS2 is distributed throughout the zeolite
pores. The distribution of the MoS2 for the catalyst sulfided after exposure to ambient air
(Mo/NaY (air, S 673)) is probably only slightly different. Again, a large amount of MoS2
is located on the exterior of the zeolite crystals (HREM).
Like for the above mentioned sulfided samples, after oxidation (Mo/NaY (0 673)) or
after decomposition (Mo/NaY (D 573)) large amounts of Mo are located on the exterior
(HREM). The Xe adsorption and the N2 adsorption measurements indicate that the amount
ofMo present in the pores ofMo/NaY (0 673) is roughly the same as for Mo/NaY (S 673).
On Mo/NaY (D 573) somewhat less Mo seems to be present in the zeolite pores.
The similar thiophene HDS activities (measured after in situ sulfidation) ofMo/NaY (air,
NaY supported molybdenum sulfide catalysts prepared with Mo(C0) 6 143
S 673), Mo/NaY (S 673, *S 673), Mo/NaY (D 425, S 673, *S 673) (not shown in Fig. 7.6)
and Mo/NaY (0 673, *S 673) can be explained by the structural description of the catalysts
given above. Mo/NaY (S 673) and Mo/NaY (D 425, S 673) are equivalent, so it is not
surprising that this also applies to their catalytic properties after resulfidation (during the
resulfidation prior to thiophene HDS the MoS2 distribution will probably not change
significantly). HREM results show that the MoS2 distribution for Mo/NaY (air, S 673) is
about the same as for MoiNa Y (S 673 ), apart from the somewhat more inhomogeneous MoS2
distribution on the exterior of the former catalyst. Apparently, the (partial) oxidation of the
Mo(C0)6 which possibly occurred, as well as the presence of adsorbed water do not result
in a significant difference in the MoS2 distribution compared to Mo/NaY (S 673).
Consequently, also the catalytic activity of the Mo/NaY (air, S 673) catalyst is comparable
to that of Mo/NaY (S 673, *S 673).
The equal activity of Mo/NaY (0 673, *S 673) suggests that the MoS2 distribution on
this catalyst is again similar to that of MoiNa Y (S 673 , *S 673). The amount of Mo located
in the zeolite pores before sulfidation is almost the same as for Mo/NaY (S 673). Possibly,
the location of the Mo species will not change significantly upon sulfidation (I 6), resulting
in a MoS2 distribution in Mo/NaY (0 673 , *S 673) which is almost the same as in Mo/NaY
(S 673 , *S 673). The lower degree of sulfidation will probably not influence the catalytic
properties significantly, as this incomplete sulfidation is supposedly caused by the relatively
large Mo particles, from which only the outer layers are converted into MoS2•
The HDS activities of these catalysts are somewhat higher than for the sulfided Mo(lO.O
wt%)/NaY (impr) catalyst (16). The higher activity may have been caused by the somewhat
larger amount of MoS2 located in the zeolite pores. Laniecki and Zmierczak ( 6) and
Okamoto et a/. (11) also found catalysts prepared by Mo(C0)6 to be more active for
thiophene HDS than catalysts prepared by impregnation with AHM.
MoiNa Y (D 573, *S 673) shows a significantly lower HDS activity than the other
catalysts. In this catalyst less Mo is present in the zeolite pores than in Mo/NaY (0 673) or
Mo/NaY (S 673) already before sulfidation. Upon sulfidation, the distribution of the Mo
species will probably not change significantly. Also for Mo/NaY (D 573, *S 673) the
incomplete sulfidation will probably not influence the catalytic properties significantly, as
this is most likely caused by large Mo particles from which only the outer layers are
converted into MoS2 . The lower activity of this catalyst (with the least Mo in the zeolite
pores) is an additional argument for the relatively high catalytic HDS activity of MoS2
located in the zeolite pores, proposed earlier (12, 16). As mentioned before, it may be
possible to obtain larger amounts of MoS2 in the zeolite pores by applying sulfidation at
rather low temperatures. Whether this will result in higher HDS conversions will depend on
144 Chapter 7
the stability of this highly dispersed MoS2 phase in these catalysts when the temperature is
raised to levels required for catalytic activity. Preliminary results (34) have shown that on
Mo(CO)/NaY samples sulfided at lower temperatures (373 or 473 K) almost all MoS2 is
located in the zeolite pores, resulting in a clearly higher catalytic activity.
CONCLUSIONS
Sulfidation in H2SIH2 at 673 K of either fresh Mo(CO)jNaY or Mo(CO)/NaY results
in catalysts in which most of the MoS2 is located on the exterior of the zeolite particles. All
the Mo is converted into MoS2. The catalysts show similar thiophene HDS activities, which
are slightly higher than those measured for a Mo(lO.O wt%)/NaY (impr) catalyst. Oxidation
of Mo(C0)6/NaY in pure 0 2 at 673 K again leads to migration of a large part of the Mo
phase to the exterior of the zeolite crystals, where large oxidic molybdenum crystals are
formed. Subsequent sulfidation results in a catalyst with the same catalytic properties as directly sulfided Mo(C0)6/NaY.
Upon decomposition of Mo(C0)6 into Mo metal in He at 573 K large Mo particles are
formed on the exterior of the zeolite. Sulfidation of this sample leads to a catalytic activity
which is lower than for the other catalysts. In spite of the fact that on the freshly prepared
Mo(C0)6/NaY samples all Mo is located in the zeolite pores, after the treatments
(decomposition to Mo metal, oxidation or sulfidation) most of the Mo is located on the exterior. The higher HDS activity of those catalysts on which a larger amount of MoS2 is
located inside the zeolite pores, supports the assumption that the MoS2 species in the zeolite
pores contribute significantly to the HDS activity.
References
1. Kitrell, J.R., U.S. Patent 3 558 471, 1971.
2. Miller, K.T., U.S. Patent 4 812 224, 1989.
3. Ward, J.W., Stud. Surf Sci. Catal. 16 (1983) 587. 4. Corma, A., Vazquez, M.l., Bianconi, A., Clozza, A., Garcia, J. , Pallota, 0 . and Cruz, J.M.,
Zeolites 8 (1988) 464.
5. Ezzamarty, A., Catherine, E., Comet, D., Hemidy, J.F., Janin, A., Lavalley, J.C. and Leglise,
J., in 'Zeolites: Facts, Figures, Future', Jacobs, P.A. and van Santen, R.A., Eds., p. 1025.
Elsevier, Amsterdam, 1989.
6. Laniecki, M. and Zmierczak, W., Zeolites 11 (1991) 18.
7. Lopez Agudo, A., Benitez, A., Fierro, J.L.G., Palacios, J.M. Neira, J. and Cid, R. , J. Chern
NaY supported molybdenum sulfide catalysts prepared with Mo(C0) 6 145
Soc., Farad. Trans. 88 (1992) 385.
8. Anderson, J.A., Pawelec, B. and Fierro, J.L.G., App/. Cata/. 99 (1993) 37.
9. Anderson, J.A., Pawelec, B., Fierro, J.L.G. , Arias, P.L. Duque, F. and Cambra, J.F., Appl.
Cata/. 99 (1993) 55.
10. Okamoto, Y., Meazawa, A., Kane, H., Mitsushima, I. and Imanaka, T., J. Chern. Soc., Farad.
Trans. I 84 (1988) 851.
II. Okamoto, Y., Maezawa, A., Kane, H. and Imanaka, T., J. Mol. Cata/. 52 (1989) 337.
12. Chapter 2 of this Thesis.
13 . Chapter 3 of this Thesis.
14. Johns, J.R. and Howe, R.F., Zeolites 5 (1985) 251.
15 . Beyer, H.K., Karge, H.G. and Borbely, G., Zeolites 8 ( 1988) 79.
16. Chapter 6 of this thesis.
17. Komatsu, T. and Yashima, T., J. Mol. Catal. 40 ( 1987) 83 .
18. Laniecki, M. and Zmierczak, W., in 'Zeolites for the nineties, recent research reports of the 8'h international zeolite conference', Janssen, J.C., et a!. Eds. , p. 371. Elsevier, Amsterdam
1989.
19. Okamoto, Y. , Meazawa, A., Kane, H. and lmanaka, T., in ' Proc. of the 91h Int. Cong. on
Catal. ' , Phillips, M.J. and Ternan, M., Eds., p. II. Calgary, Ottawa, June 1988.
20. Vrinat, M.L. , Gachet, C.G. and de Mourgues, L., Stud. Surf Sci. Cata/. 5 (1980) 219.
21. Okamoto, Y., Ogawa, M., Maezewa, A. and Imanaka, T., J. Cata/. 112 (1988) 427.
22. Fraissard, J. and Ito, T., Zeolites 8 (1988) 350.
23. Ito, T. and Fraissard, J. , J. Chern. Phys. 76 (1982) 5225 .
24. Koninyi, T.l., van de Yen, L.J.M. , Welters, W.J.J. , de Haan, J.W., de Beer, V.H.J. and van
San ten, R.A., Catal. Lett. 17 ( 1993) I 05 .
25. Duchet, J.C., van Oers, E.M., de Beer, V.H.J. and Prins, R., J. Catal. 80 (1983) 386.
26. Gress, S.J. and Sing, K.S.W., in 'Adsorption, Surface Area and Porosity' , Academic Press,
London, 1982.
27. Ozkar, S., Ozin, G.A., Moller, K. and Bein, T., J Am. Chern. Soc. 112 (1990) 9575.
28 . Arnoldy, P., van den Heykant, J.A.M., de Bok, G.D. and Moulijn, J.A. , J Cata/. 92 (1985)
35.
29. Tway, C.L. and Apple, T.M., Inorg Chern. 31 (!992) 2885 .
30. Ito, T. and Fraissard, J., J. Chern Soc., Farad. Trans. I 83, (1987) 451.
31. Coddington, J.M., Howe, R.F., Yong, Y.S., Asakura, K. and lwasawa, Y., J Chern. Soc. ,
Farad. Trans 86 (1990) 1015.
32. Sachtler, W.M.H., Tzou, M.S. and Jiang, H.J., Solid State Ionics 26 (1988) 71.
33 . Ozkar, S., Ozin, G.A. and Prokopowics, R.A., Chern. Mater. 4 (1992) 1380.
34. M.J. Vissenberg, R.A. de Haan, G. Verbeck, V.H.J. de Beer, unpublished results.
8 A NEW ASSIGNMENT OF THE SIGNALS
IN 23Na DOR NMR TO SODIUM SITES IN DEHYDRATED NaY ZEOLITE
ABSTRACT A new assignment of the signals in the 23Na DOR NMR spectra to the different sodium
sites in dehydrated NaY zeolite is presented. 23Na DOR- and MAS NMR measurements of
dehydrated NaY, Ca2+ exchanged NaY samples and NaY samples in which Mo(C0)6 is
adsorbed are used for this purpose. Four distinct signals in the 23Na DOR NMR spectra of
dehydrated NaY are found: the first signal with an isotropic chemical shift of -6 ppm and
a quadrupolar coupling constant of 0.4 MHz is assigned to the Na+ cations at site I. The
second signal, with an isotropic chemical shift of - 12 ppm and a quadrupolar coupling
constant of 2.3 MHz, is assigned to the Na+ cations at sites I'!II'. The third and the fourth
signal, with isotropic chemical shifts of -4 and 5 ppm and quadrupolar coupling constants
of 4.2 and 4.7 MHz respectively, are assigned to the Na+ cations at sites II and III.
147
148 Chapter 8
INTRODUCTION
Zeolites and related molecular sieves are becoming more and more important for a great
variety of applications, such as catalysts, adsorbents and ion-exchangers. Their well-defined
pore system and high specific area, in combination with their ability to act as a solid acid
makes them very useful for these applications. In this respect, zeolite Y is one of the more
frequently used zeolites, especially as a catalyst (1). In the as-synthesized form sodium
cations are present to compensate for the negative charge of the zeolite framework (NaY).
A thorough knowledge of the locations of the Na+ cations and the interactions between these
cations and the zeolite lattice and/or the adsorbed reactants is a prerequisite for understanding
the solid-state and catalytic properties of zeolites. This knowledge can also be very useful
for the study of the incorporation of metal, metal oxide or metal sulfide particles in the
zeolite channels, for instance for the development of hydrocracking catalysts (2-4).
Several techniques have been used to study the locations and the interactions of the Na+
cations in theY zeolite, such as XRD (5), ND (6), IR (7,8) and 23Na NMR measurements
(9-12). However, NMR spectra of quadrupolar nuclei, like 23Na, are limited in resolution,
because of the second-order quadrupolar line broadening of the readily observable central
+ 1/2 ~ -1/2 transition in these spectra. The double rotation NMR (DOR) technique (13) is
able to reduce this line broadening and thus gives a much better spectral resolution. The
observed center of gravity of the MAS powder pattern, or the peak position in the DOR
spectrum (oobs) is the sum of two isotropic shifts (in ppm):
~ - cs 2Q o obs -o iso +o iso
(1)
where the first term is the isotropic chemical shift and the second term is the isotropic
second-order quadrupolar shift. In contrast with the first term, the second term is field
dependent and is given by equation 2:
(2)
where I is the nuclear spin, 11 is the asymmetry parameter which describes the deviation of
the local electrical field gradient from cylindrical symmetry, CQ is the quadrupolar coupling
constant defined as the product of the electrical field gradient ( eq) and the nuclear
quadrupole moment ( eQ) divided by h, and vL is the Larmor frequency of the nucleus at the
magnetic field.
In NaY five different sodium sites can be distinguished: site I is located in the hexagonal
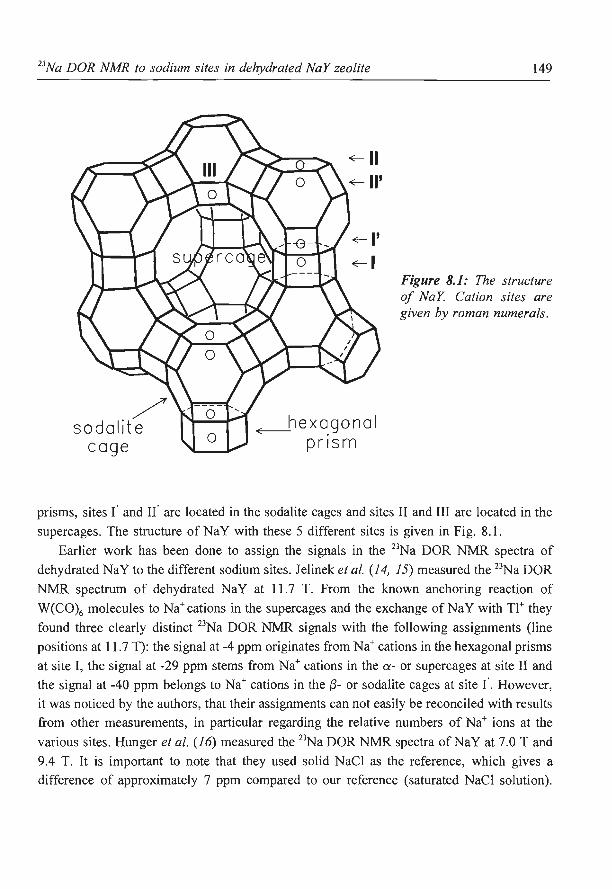
23Na DOR NMR to sodium sites in dehydrated NaY zeolite
/ sodalite
cage
~n
<E--hexa.gonal pr1sm
149
Figure 8.1: The structure of NaY Cation sites are given by roman numerals.
prisms, sites ( and II' are located in the sodalite cages and sites II and III are located in the
supercages. The structure of NaY with these 5 different sites is given in Fig. 8.1.
Earlier work has been done to assign the signals in the 23Na DOR NMR spectra of
dehydrated NaY to the different sodium sites. Jelinek eta!. (14, I 5) measured the 23Na DOR
NMR spectrum of dehydrated NaY at 11.7 T. From the known anchoring reaction of
W(C0)6 molecules to Na+ cations in the supercages and the exchange of NaY with Tl+ they
found three clearly distinct 23Na DOR NMR signals with the following assignments (line
positions at 11.7 T): the signal at -4 ppm originates from Na+ cations in the hexagonal prisms
at site I, the signal at -29 ppm stems from Na+ cations in the a- or supercages at site II and
the signal at -40 ppm belongs to Na+ cations in the {3- or sodalite cages at site I'. However,
it was noticed by the authors, that their assignments can not easily be reconciled with results
from other measurements, in particular regarding the relative numbers of Na+ ions at the
various sites. Hunger eta!. (16) measured the 23Na DOR NMR spectra of NaY at 7.0 T and
9.4 T. It is important to note that they used solid NaCI as the reference, which gives a
difference of approximately 7 ppm compared to our reference (saturated NaCJ solution).
150 Chapter 8
Throughout this paper only the recalculated line positions with respect to the NaCl solution
will be given. From the positions of the signals at these two different field strengths and
DOR at different speeds they assigned the low field signal at -6.4 ppm (9.4 T) or -7.6 ppm
(7.0 T) without noticeable quadrupolar interactions to the sodium cations at site I. The Na+
cations located at sites I' and II are in their view indistinguishable and yield a combined high
field quadrupolar pattern at -41.0 ppm (9.4 T) or -71.0 ppm (7.0 T) with a quadrupolar
coupling constant of 4.2 MHz. !-
In the present paper, we propose on the basis of 23Na DOR and MAS measurements of
NaY a new assignment of the 23Na DOR NMR signals to Na+ sites in dehydrated NaY, which
may be considered as a modification of the Hunger concept. Ca2+ exchanged NaY samples,
and NaY samples in which Mo(C0)6 is adsorbed are used to sustain this new assignment.
EXPERIMENTAL SECTION
Sample preparation
Series of Ca2+ exchanged NaY (Na54(Al02) 5iSi02) 138 * 250 H20 , PQ CBV -1 00) zeolites
are prepared at room temperature, using aqueous solutions of CaC12 of appropriate concentra
tions. After the exchange, the samples are washed until c1· free, and dried in air at 383 K
for 16 h. The composition of the samples is verified by Atomic Absorption Spectroscopy.
All samples are stored in a dessicator over a saturated CaC12 solution. Additionally, two
samples are prepared by gas phase adsorption ofMo(C0)6 in NaY and Ca16N~2Y. Prior to
the adsorption, the zeolite is dried in a He flow at 673 K (heating rate 6 K/min, 2 h at 673
K). After cooling to 333 K the zeolites (sample size about 1 g) are saturated by flowing a
Mo(CO)JHe mixture through the zeolite. This procedure provided full saturation of the
zeolites with Mo(C0)6, leading to a concentration of about 16 Mo(C0)6 molecules per unit
cell. After saturation, these two samples are transferred into a recirculation type glove box
(02 and H20 content lower than 1 ppm). Prior to the NMR measurements all other samples
are dried in a He flow, using the following temperature program: 6 K/min to 673 K, 2 h at
673 K. After cooling down, the samples are transferred into the recirculation type glove box,
in which the samples are filled into air tight spinners.
FT -IR measurements The far-infrared spectra are recorded using a Bruker IFS 113v FT-IR spectrometer
equipped with a heatable in situ cell connected to a vacuum system (pressure lower than 1 0·4
Pa). Spectra are measured at 300 K after evacuation of the samples for 1 h at 723 K. The
far-infrared spectra are recorded using self-supporting samples (3-8 mg/cm2) in the in situ
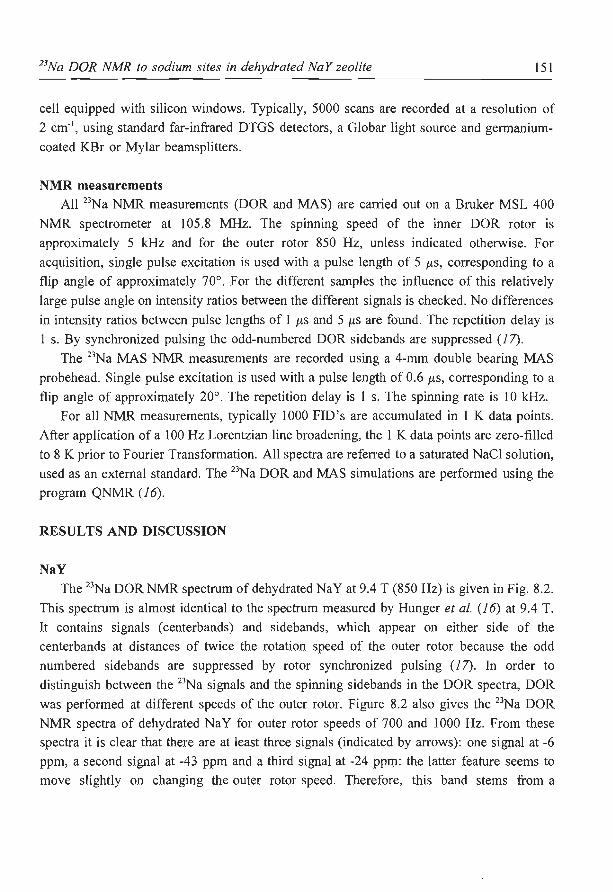
23Na DOR NMR to sodium sites in dehydrated NaY zeolite 151
cell equipped with silicon windows. Typically, 5000 scans are recorded at a resolution of
2 cm·1, using standard far-infrared DTGS detectors, a Globar light source and germanium
coated KBr or Mylar beamsplitters.
NMR measurements All 23Na NMR measurements (DOR and MAS) are carried out on a Bruker MSL 400
NMR spectrometer at 105.8 MHz. The spinning speed of the inner DOR rotor is
approximately 5 kHz and for the outer rotor 850 Hz, unless indicated otherwise. For
acquisition, single pulse excitation is used with a pulse length of 5 J.J-S, corresponding to a
flip angle of approximately 70°. For the different samples the influence of this relatively
large pulse angle on intensity ratios between the different signals is checked. No differences
in intensity ratios between pulse lengths of 1 J.J-S and 5 J.J-S are found. The repetition delay is
1 s. By synchronized pulsing the odd-numbered DOR sidebands are suppressed (17).
The 23Na MAS NMR measurements are recorded using a 4-mm double bearing MAS
probehead. Single pulse excitation is used with a pulse length of 0.6 J.J-S, corresponding to a
flip angle of approximately 20°. The repetition delay is 1 s. The spinning rate is 10 kHz.
For all NMR measurements, typically lOOO FlO's are accumulated in l K data points.
After application of a 100Hz Lorentzian line broadening, the 1 K data points are zero-filled
to 8 K prior to Fourier Transformation. All spectra are referred to a saturated NaCl solution,
used as an external standard. The 23Na DOR and MAS simulations are performed using the
program QNMR (16).
RESULTS AND DISCUSSION
NaY
The 23Na DOR NMR spectrum of dehydrated NaY at 9.4 T (850Hz) is given in Fig. 8.2.
This spectrum is almost identical to the spectrum measured by Hunger et al. (1 6) at 9.4 T. It contains signals (centerbands) and sidebands, which appear on either side of the
centerbands at distances of twice the rotation speed of the outer rotor because the odd
numbered sidebands are suppressed by rotor synchronized pulsing (17). In order to
distinguish between the 23Na signals and the spinning sidebands in the DOR spectra, DOR
was performed at different speeds of the outer rotor. Figure 8.2 also gives the 23Na DOR
NMR spectra of dehydrated NaY for outer rotor speeds of 700 and 1000 Hz. From these
spectra it is clear that there are at least three signals (indicated by arrows): one signal at -6
ppm, a second signal at -43 ppm and a third signal at -24 ppm: the latter feature seems to
move slightly on changing the outer rotor speed. Therefore, this band stems from a
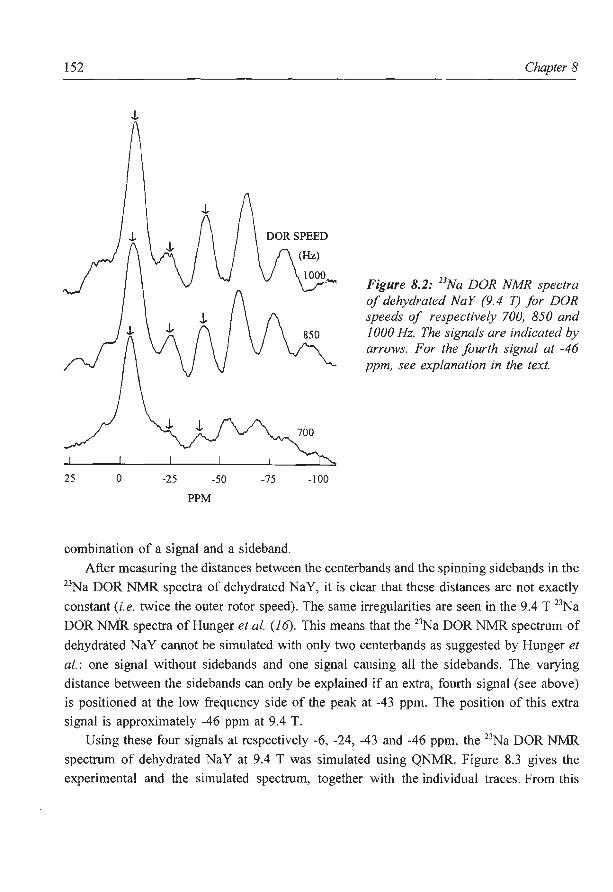
152
25 0 -25 -50 -75
PPM
combination of a signal and a sideband.
-100
Chapter 8
Figure 8.2: 23Na DOR NMR spectra of dehydrated NaY (9.4 T) for DOR speeds of respectively 700, 850 and I 000 Hz. The signals are indicated by arrows. For the fourth signal at -46 ppm, see explanation in the text.
After measuring the distances between the centerbands and the spinning sidebands in the 23Na DOR NMR spectra of dehydrated NaY, it is clear that these distances are not exactly
constant (i.e. twice the outer rotor speed). The same irregularities are seen in the 9.4 T 23Na
DOR NMR spectra of Hunger eta!. (16). This means that the 23Na DOR NMR spectrum of
dehydrated NaY cannot be simulated with only two centerbands as suggested by Hunger et
al.: one signal without sidebands and one signal causing all the sidebands. The varying
distance between the sidebands can only be explained if an extra, fourth signal (see above)
is positioned at the low frequency side of the peak at -43 ppm. The position of this extra
signal is approximately -46 ppm at 9.4 T.
Using these four signals at respectively -6, -24, -43 and -46 ppm, the 23Na DOR NMR
spectrum of dehydrated NaY at 9.4 T was simulated using QNMR. Figure 8.3 gives the
experimental and the simulated spectrum, together with the individual traces. From this
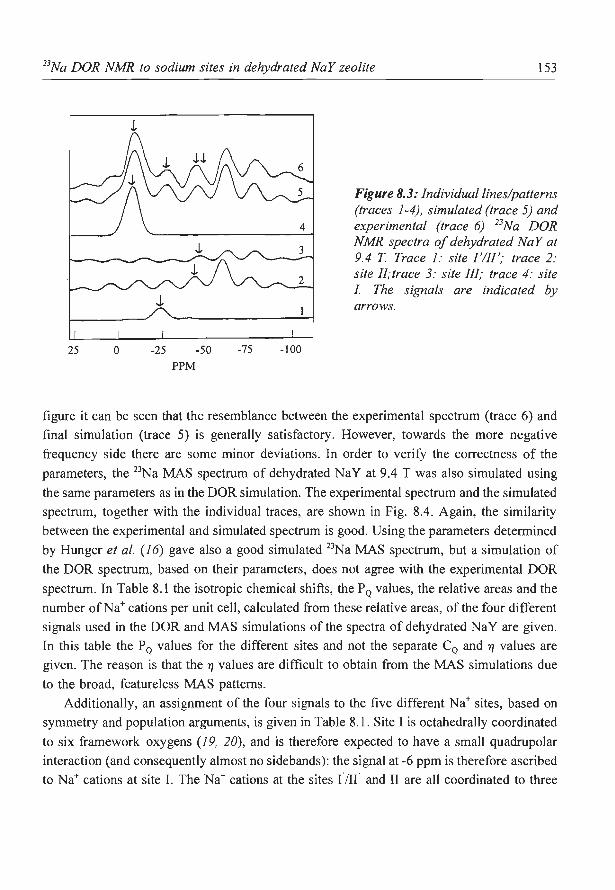
23Na DOR NMR to sodium sites in dehydrated NaY zeolite 153
25 0 -25
PPM
-50 -75 -100
Figure 8.3: Individual lines/patterns (traces 1-4), simulated (trace 5) and experimental (trace 6) 23Na DOR NMR spectra of dehydrated NaY at 9.4 T Trace 1: site !'III'; trace 2: site !!;trace 3: site III; trace 4: site I. The signals are indicated by arrows.
figure it can be seen that the resemblance between the experimental spectrum (trace 6) and
final simulation (trace 5) is generally satisfactory. However, towards the more negative
frequency side there are some minor deviations. In order to verify the correctness of the
parameters, the 23Na MAS spectrum of dehydrated NaY at 9.4 Twas also simulated using
the same parameters as in the DOR simulation. The experimental spectrum and the simulated
spectrum, together with the individual traces, are shown in Fig. 8.4. Again, the similarity
between the experimental and simulated spectrum is good. Using the parameters determined
by Hunger eta/. (16) gave also a good simulated 23Na MAS spectrum, but a simulation of
the DOR spectrum, based on their parameters, does not agree with the experimental DOR
spectrum. In Table 8.1 the isotropic chemical shifts, the P Q values, the relative areas and the
number ofNa+ cations per unit cell, calculated from these relative areas, of the four different
signals used in the DOR and MAS simulations of the spectra of dehydrated NaY are given.
In this table the P 0 values for the different sites and not the separate C0 and 71 values are
given. The reason is that the 71 values are difficult to obtain from the MAS simulations due
to the broad, featureless MAS patterns.
Additionally, an assignment of the four signals to the five different Na+ sites, based on
symmetry and population arguments, is given in Table 8.1. Site I is octahedrally coordinated
to six framework oxygens (19, 20), and is therefore expected to have a small quadrupolar
interaction (and consequently almost no sidebands): the signal at -6 ppm is therefore ascribed
to Na+ cations at site I. The Na+ cations at the sites r'!Ir' and II are all coordinated to three
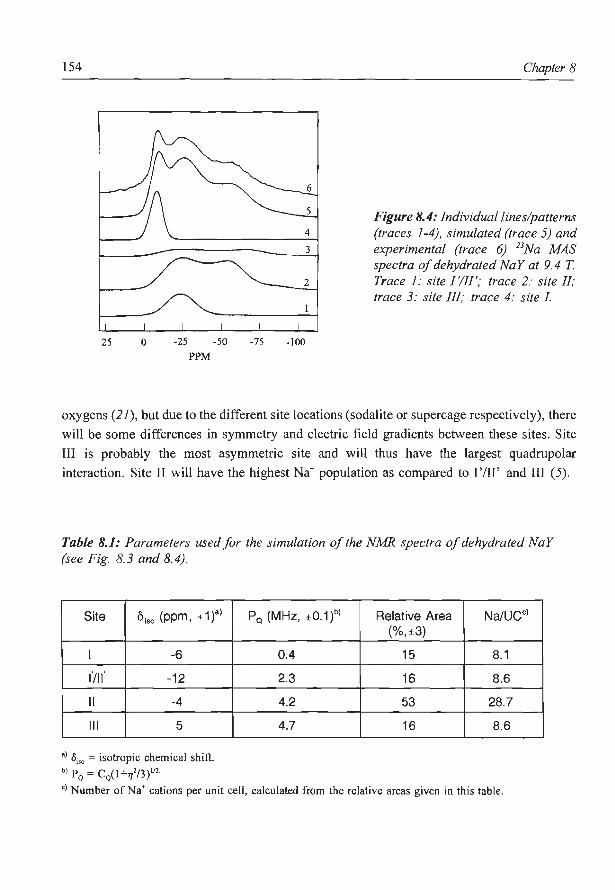
154
25 0 -25
PPM
-50 -75 -100
Chapter 8
Figure 8.4: Individual lines/patterns (traces 1-4), simulated (trace 5) and experimental (trace 6) 23Na MAS spectra of dehydrated NaY at 9. 4 T. Trace I: site I'l l!'; trace 2: site II; trace 3: site III; trace 4: site I.
oxygens (21), but due to the different site locations (sodalite or supercage respectively), there
will be some differences in symmetry and electric field gradients between these sites. Site
III is probably the most asymmetric site and will thus have the largest quadrupolar
interaction. Site II will have the highest Na+ population as compared to I'fll' and III (5) .
Table 8.1: Parameters used for the simulation of the NMR spectra of dehydrated NaY (see Fig. 8.3 and 8.4).
Site oiso (ppm, ±1)a) P 0 (MHz, ±0.1 )b) Relative Area Na/UCc) (%,±3)
I -6 0.4 15 8.1
1'111' -12 2.3 16 8.6
II -4 4.2 53 28.7
Ill 5 4.7 16 8.6
a) 1>;,0
= isotropic chemical shift. b) P
0 = C
0(l +r/13)'12
·
c) Number of Na• cations per unit cell, calculated from the relative areas given in this table.
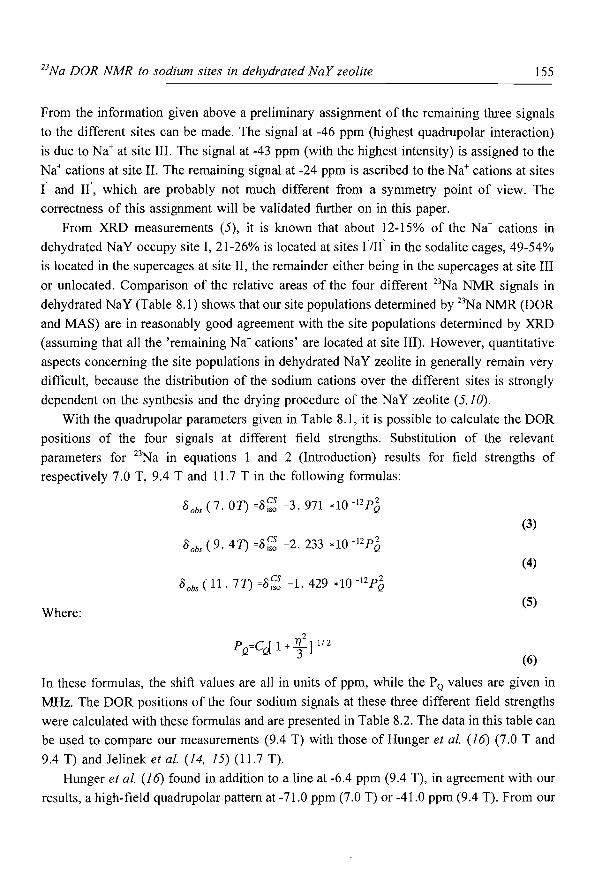
23Na DOR NMR to sodium sites in dehydrated NaY zeolite 155
From the information given above a preliminary assignment of the remaining three signals
to the different sites can be made. The signal at -46 ppm (highest quadrupolar interaction)
is due to Na+ at site III. The signal at -43 ppm (with the highest intensity) is assigned to the
Na+ cations at site II. The remaining signal at -24 ppm is ascribed to the Na+ cations at sites
I' and I( which are probably not much different from a symmetry point of view. The
correctness of this assignment will be validated further on in this paper.
From XRD measurements (5), it is known that about 12-15% of the Na+ cations in
dehydrated NaY occupy site I, 21-26% is located at sites I'll!' in the sodalite cages, 49-54%
is located in the supercages at site II, the remainder either being in the supercages at site III
or unlocated. Comparison of the relative areas of the four different 23Na NMR signals in
dehydrated NaY (Table 8.1) shows that our site populations determined by 23Na NMR (DOR
and MAS) are in reasonably good agreement with the site populations determined by XRD
(assuming that all the 'remaining Na+ cations' are located at site III). However, quantitative
aspects concerning the site populations in dehydrated NaY zeolite in generally remain very
difficult, because the distribution of the sodium cations over the different sites is strongly
dependent on the synthesis and the drying procedure of the NaY zeolite (5,10).
With the quadrupolar parameters given in Table 8.1, it is possible to calculate the DOR
positions of the four signals at different field strengths. Substitution of the relevant
parameters for 23Na in equations I and 2 (Introduction) results for field strengths of
respectively 7.0 T, 9.4 T and 11.7 T in the following formulas:
oobs (7. 07) =8~~ -3. 971 *10 -l2P~ (3)
(4)
Where: (5)
(6)
In these formulas, the shift values are all in units of ppm, while the P 0 values are given in
MHz. The DOR positions of the four sodium signals at these three different field strengths
were calculated with these formulas and are presented in Table 8.2. The data in this table can
be used to compare our measurements (9.4 T) with those of Hunger eta!. (16) (7.0 T and
9.4 T) and Jelinek eta!. (14, 15) (11.7 T).
Hunger eta!. (1 6) found in addition to a line at -6.4 ppm (9.4 T), in agreement with our
results, a high-field quadrupolar pattern at -71.0 ppm (7.0 T) or -41.0 ppm (9.4 T). From our
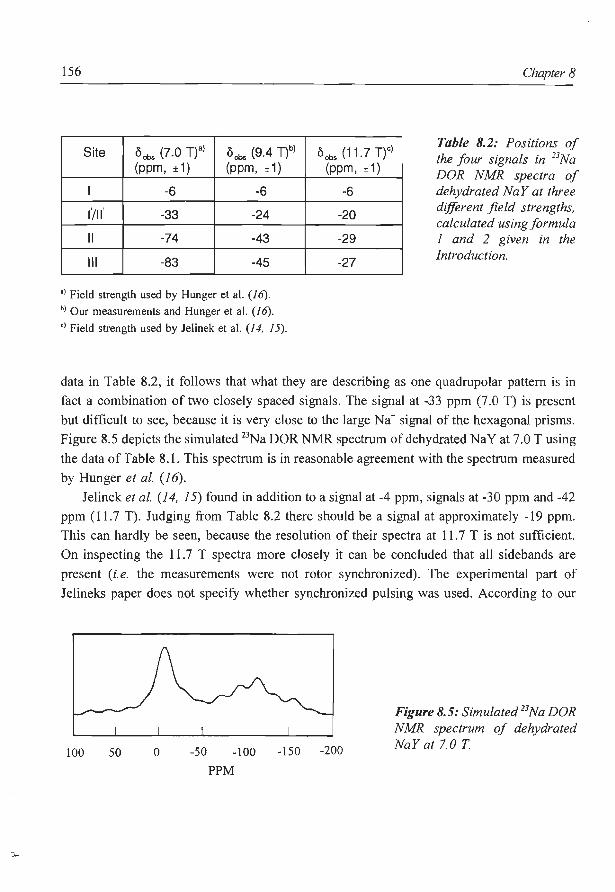
156
Site ooos (7.0 Tt) oobs (9.4 T)b) (ppm, ± 1) (ppm, ±1)
I -6 -6
1"/11" -33 -24
II -74 -43
Ill -83 -45
•l Field strength used by Hunger et al. (16).
b) Our measurements and Hunger et al. (16).
c) Field strength used by Jelinek et al. (14, 15).
o obs ( 11 .7 T)") (ppm, ± 1)
-6
-20
-29
-27
Chapter 8
Table 8.2: Positions of the four signals in 23Na DOR NMR spectra of dehydrated NaY at three different field strengths, calculated using formula 1 and 2 given in the Introduction.
data in Table 8.2, it follows that what they are describing as one quadrupolar pattern is in
fact a combination of two closely spaced signals. The signal at -33 ppm (7.0 T) is present
but difficult to see, because it is very close to the large Na+ signal of the hexagonal prisms.
Figure 8.5 depicts the simulated 23Na DOR J\JMR spectrum of dehydrated NaY at 7.0 Tusing
the data of Table 8.1. This spectrum is in reasonable agreement with the spectrum measured
by Hunger et a!. (1 6).
Jelinek eta!. (14, 15) found in addition to a signal at -4 ppm, signals at -30 ppm and -42
ppm ( 11.7 T). Judging from Table 8.2 there should be a signal at approximately -19 ppm.
This can hardly be seen, because the resolution of their spectra at 11.7 T is not sufficient.
On inspecting the ll . 7 T spectra more closely it can be concluded that all sidebands are
present (i.e. the measurements were not rotor synchronized). The experimental part of
Jelineks paper does not specify whether synchronized pulsing was used. According to our
100 50 0 -50 -100 -150 -200
PPM
Figure 8.5: Simulated 23Na DOR NMR spectrum of dehydrated NaY at 7.0 T
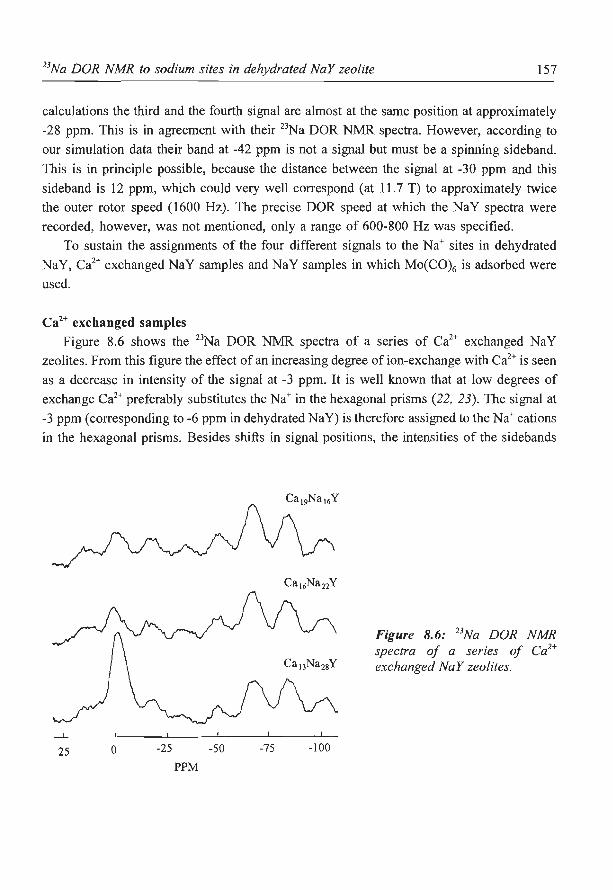
23Na DOR NMR to sodium sites in dehydrated NaY zeolite 157
calculations the third and the fourth signal are almost at the same position at approximately
-28 ppm. This is in agreement with their 23Na DOR NMR spectra. However, according to
our simulation data their band at -42 ppm is not a signal but must be a spinning sideband.
This is in principle possible, because the distance between the signal at -30 ppm and this
sideband is 12 ppm, which could very well correspond (at 11.7 T) to approximately twice
the outer rotor speed (1600Hz). The precise DOR speed at which the NaY spectra were
recorded, however, was not mentioned, only a range of 600-800 Hz was specified.
To sustain the assignments of the four different signals to the Na+ sites in dehydrated
NaY, Ca2+ exchanged NaY samples and NaY samples in which Mo(C0)6 is adsorbed were
used.
Ca2+ exchanged samples
Figure 8.6 shows the 23Na DOR NMR spectra of a series of Ca2+ exchanged NaY
zeolites. From this figure the effect of an increasing degree of ion-exchange with Ca2+ is seen
as a decrease in intensity of the signal at -3 ppm. It is well known that at low degrees of
exchange Ca2+ preferably substitutes the Na+ in the hexagonal prisms (22, 23). The signal at
-3 ppm (corresponding to -6 ppm in dehydrated NaY) is therefore assigned to the Na+ cations
in the hexagonal prisms. Besides shifts in signal positions, the intensities of the sidebands
25 0 -25 -50
PPM
-75 -100
Figure 8.6: 23Na DOR NMR spectra of a series of Ca2
+
exchanged NaY zeolites.
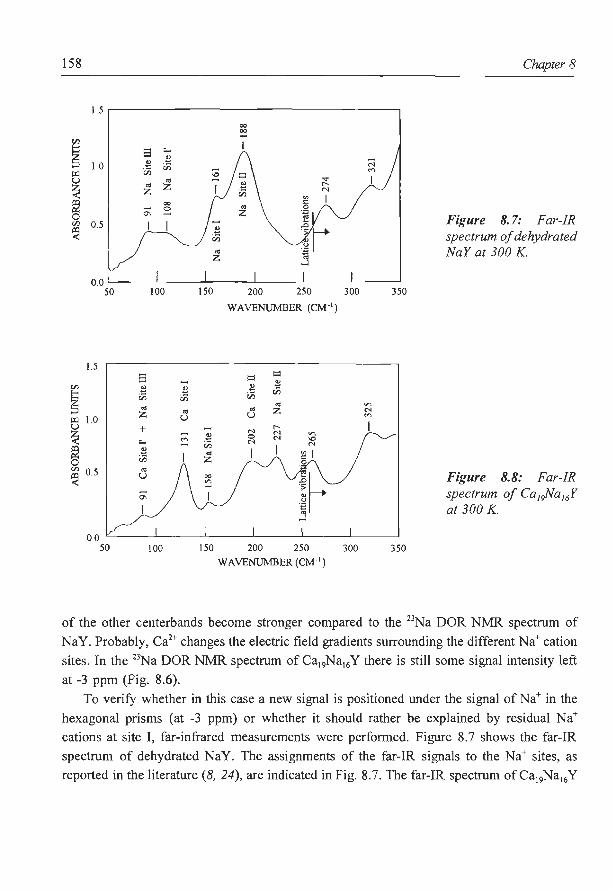
158 ---
1.5
"' ~ 1.0 ~ u ~ gJ 0
"' 0.5 ~
O.Ot/
1.5
~ eJ 1.0
~ gJ 0 ~ 0.5
50
00
~
s ;:...
E E
u~\ Cli Cli
"' .... "' z r-z N
"' I 00 ~
0:: 0 -I I ~ Ia
"' z
I I 100 150 200 250 300
WAVENUMBER (CM-1)
s t:l c::l - ...
E E E a Cli Cli Cli
"' "' "' "' z z u u
+ - N r-
E 0 N
"' N ;:... Vi N
E Cli
"' )\ ~ I v~~\__/ u ·:;:
0:: ~
100 150 200 250 300 WAVENUMBER (CM·1 )
c::; "'
350
"' N
"'
I
350
Chapter 8
Figure 8. 7: Far-IR spectrum of dehydrated NaY at 300 K.
Figure 8.8: Far-IR spectrum of Ca1/Va16Y at 300 K.
of the other centerbands become stronger compared to the 23Na DOR NMR spectrum of
NaY. Probably, Ca2+ changes the electric field gradients surrounding the different Na+ cation
sites. In the 23Na DOR NMR spectrum of Ca19Na16 Y there is still some signal intensity left
at -3 ppm (Fig. 8.6).
To verify whether in this case a new signal is positioned under the signal of Na+ in the
hexagonal prisms (at -3 ppm) or whether it should rather be explained by residual Na+
cations at site I, far-infrared measurements were performed. Figure 8.7 shows the far-IR
spectrum of dehydrated NaY. The assignments of the far-IR signals to the Na+ sites, as
reported in the literature (8, 24), are indicated in Fig. 8.7. The far-IR spectrum ofCa19Na16Y

23Na DOR NMR to sodium sites in dehydrated NaY zeolite 159
is shown in Fig. 8.8. The assignments, according to the same literature, are again indicated
in the figure. It is clear that in Ca19Na16Y there is still some Na+ left in the hexagonal prisms
(peak at 157 em-'), which was not to be expected a priori at this exchange level.
Assuming that Ca2+ changes the electric field gradients and that there is still some Na+
left in the hexagonal prisms, the 23Na DOR NMR spectrum of Ca19Na16Y at 9.4 T was
simulated with the parameters given in Table 8.3 using QNMR. For this simulation again
four signals were needed. From these data it can be seen that the Ca2+ exchange has an
influence on the isotropic chemical shift of the Na+ cations at sites I and fll( For the Na+
cations at sites II and III the isotropic chemical shifts remain almost the same, but the P 0 values become larger compared to NaY. This is caused by the increasing electric field
gradients for the Na+ cations at these sites, induced by local changes in the framework
geometry (24). Figure 8.9 shows the simulated 23Na DOR spectrum of Ca, 9Na16Y (with
individual traces) together with the experimental spectrum.
In the case of Ca19Na16Y, one would expect that almost all the residual Na+ cations are
located in the supercages at site II and III (22). From the relative areas of the four different 23Na NMR signals (Table 8.3), it is obvious that 90% of all residual Na+ cations are present
in the supercages. The Na+ populations at site I and sites fllf are greatly reduced as
compared to dehydrated NaY. This in in agreement with the fact that Ca2+ preferably
substitutes the sodium cations at site I and at higher degrees of ion-exchange also the sodium
25 0 -25 -50
PPM
-75 -100
Figure 8.9: Individual lines/patterns (traces 1-4), simulated (trace 5) and experimental (trace 6) 23Na DOR NMR spectra ofCa1/Va 16Y at 9.4 T. Trace 1: site 1'111'; trace 2: site II; trace 3: site III; trace 4: site I. The signals are indicated by arrows.
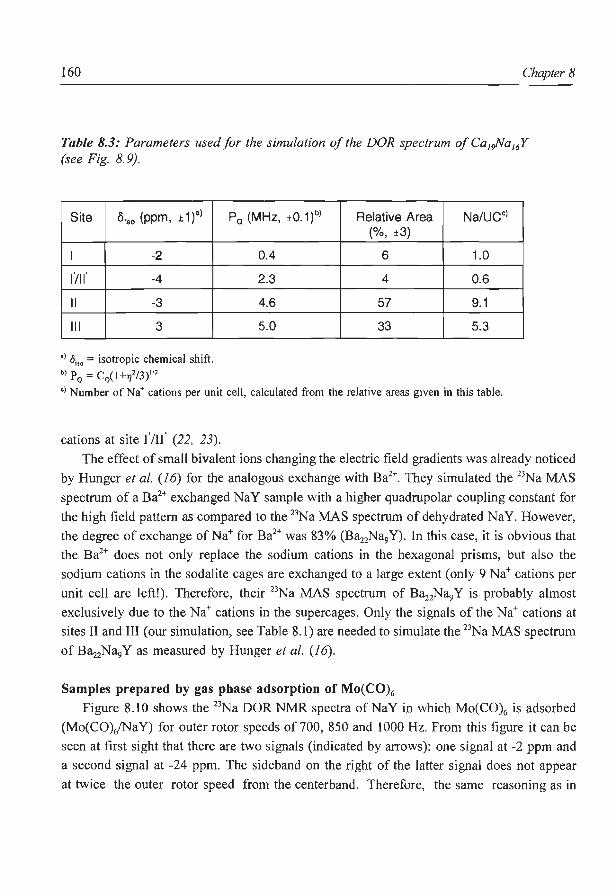
160 Chapter 8
Table 8.3: Parameters used for the simulation of the DOR spectrum of Ca1,)Va16Y (see Fig. 8.9).
Site oiso (ppm, ± 1 t)
I -2
1'111' -4
II -3
Ill 3
•> 0;,0 = isotropic chemical shift. b) Po= Co(l+7]2/3)'n
P0 (MHz, ±0.1)b)
0.4
2.3
4.6
5.0
Relative Area Na/UCc) (%, ±3)
6 1.0
4 0.6
57 9.1
33 5.3
•> Number of Na+ cations per unit cell, calculated !Tom the relative areas given in this table.
cations at site I'll!' (22, 23).
The effect of small bivalent ions changing the electric field gradients was already noticed
by Hunger et al. (I 6) for the analogous exchange with Ba2+. They simulated the 23Na MAS
spectrum of a Ba2+ exchanged NaY sample with a higher quadrupolar coupling constant for
the high field pattern as compared to the 23Na MAS spectrum of dehydrated NaY. However,
the degree of exchange ofNa+ for Ba2+ was 83% (B~2Na; Y). In this case, it is obvious that
the Ba2+ does not only replace the sodium cations in the hexagonal prisms, but also the
sodium cations in the sodalite cages are exchanged to a large extent (only 9 Na+ cations per
unit cell are left!). Therefore, their 23Na MAS spectrum of B~2N~ Y is probably almost
exclusively due to the Na+ cations in the supercages. Only the signals of the Na+ cations at
sites II and III (our simulation, see Table 8.1) are needed to simulate the 23Na MAS spectrum
of B~2Na; Y as measured by Hunger et al. (16).
Samples prepared by gas phase adsorption of Mo(C0)6
Figure 8.10 shows the 23Na DOR NMR spectra of NaY in which Mo(C0)6 is adsorbed
(Mo(CO)/Na Y) for outer rotor speeds of 700, 850 and 1000 Hz. From this figure it can be
seen at first sight that there are two signals (indicated by arrows): one signal at -2 ppm and
a second signal at -24 ppm. The sideband on the right of the latter signal does not appear
at twice the outer rotor speed from the centerband. Therefore, the same reasoning as in
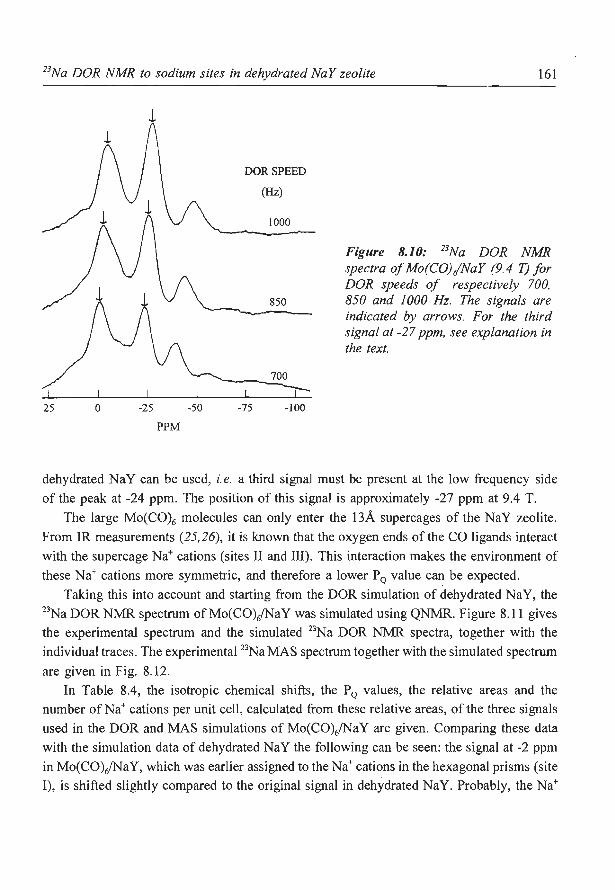
23Na DOR NMR to sodium sites in dehydrated NaY zeolite 161
.1
25 0 -25 -50
PPM
DORSPEED
(Hz)
1000
Figure 8.10: 23Na DOR NMR spectra of Mo(CO)/NaY (9.4 T) for DOR speeds of respectively 700,
850 850 and 1000 Hz. The signals are ~~-------- indicated by arrows. For the third
signal at -27 ppm, see explanation in the text.
-75 -100
dehydrated NaY can be used, i.e. a third signal must be present at the low frequency side
of the peak at -24 ppm. The position of this signal is approximately -27 ppm at 9.4 T.
The large Mo(C0)6 molecules can only enter the 13A supercages of the NaY zeolite.
From IR measurements (25,26), it is known that the oxygen ends of the CO ligands interact
with the supercage Na+ cations (sites II and III). This interaction makes the environment of
these Na+ cations more symmetric, and therefore a lower P 0 value can be expected.
Taking this into account and starting from the DOR simulation of dehydrated NaY, the 23Na DOR NMR spectrum ofMo(CO)iNaY was simulated using QNMR. Figure 8.11 gives
the experimental spectrum and the simulated 23Na DOR NMR spectra, together with the
individual traces. The experimental 23Na MAS spectrum together with the simulated spectrum
are given in Fig. 8.12.
In Table 8.4, the isotropic chemical shifts, the P 0 values, the relative areas and the
number ofNa+ cations per unit cell, calculated from these relative areas, of the three signals
used in the DOR and MAS simulations of Mo(C0)6/NaY are given. Comparing these data
with the simulation data of dehydrated NaY the following can be seen: the signal at -2 ppm
in Mo(C0)6/NaY, which was earlier assigned to the Na+ cations in the hexagonal prisms (site
1), is shifted slightly compared to the original signal in dehydrated NaY. Probably, the Na+
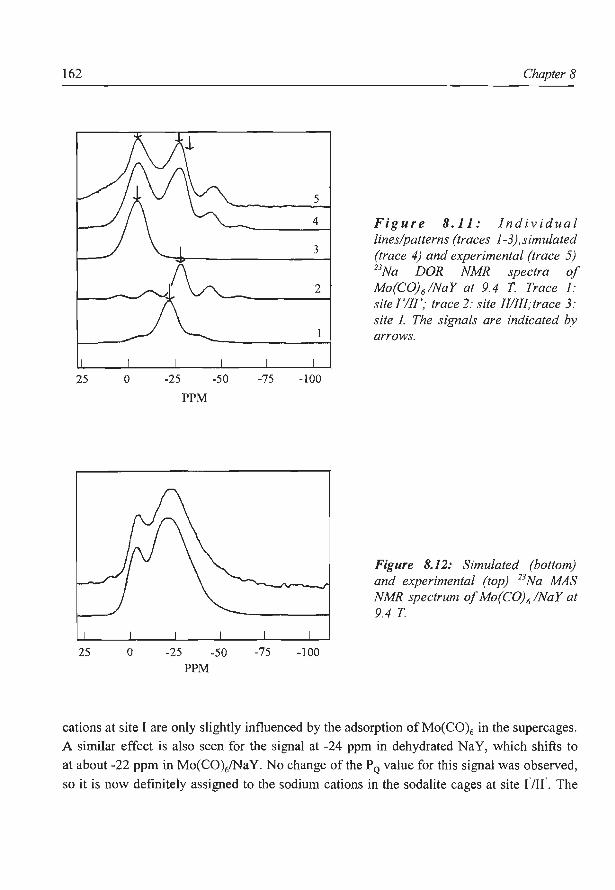
162
25 0
25 0
5
Chapter 8
Figure 8.11: Individual lines/patterns (traces 1-3),simulated (trace 4) and experimental (trace 5) 23Na DOR NMR spectra of
2 Mo(C0) 6 /NaY at 9.4 T. Trace 1: --------~ site 1'111'; trace 2: site Jlllll;trace 3:
-25 -50
PPM
-25 -50 PPM
-75
-75
-100
-100
site I. The signals are indicated by arrows.
Figure 8.12: Simulated (bottom) and experimental (top) 23Na MAS NMR spectrum of Mo(C0)6 /NaY at 9.4 T
cations at site I are only slightly influenced by the adsorption ofMo(C0)6 in the supercages. A similar effect is also seen for the signal at -24 ppm in dehydrated NaY, which shifts to at about -22 ppm in Mo(CO)/NaY. No change of the P0 value for this signal was observed,
so it is now definitely assigned to the sodium cations in the sodalite cages at site I'!If. The
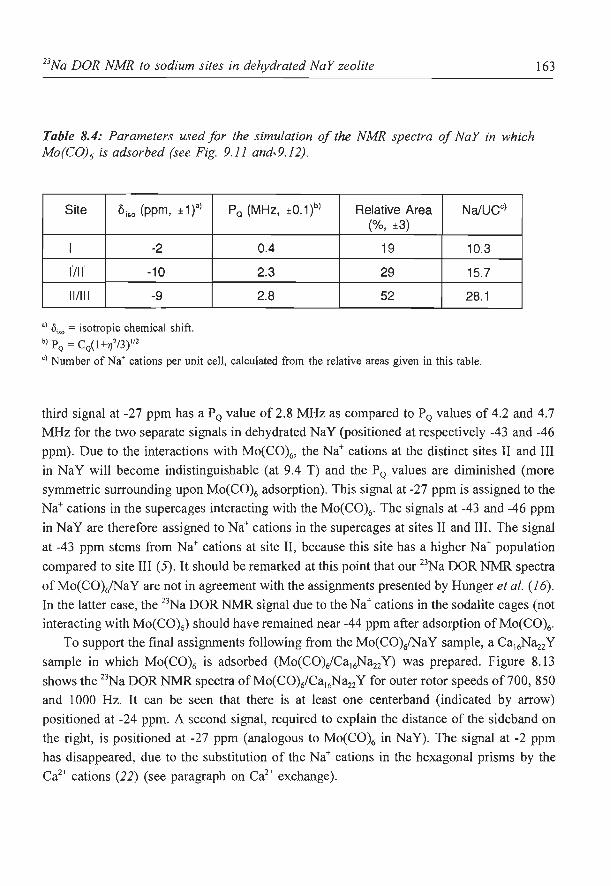
23Na DOR NMR to sodium sites in dehydrated NaY zeolite
Table 8.4: Parameters used for the simulation of the NMR spectra of NaY in which Mo(C0) 6 is adsorbed (see Fig. 9.11 and-9.12).
Site <\so (ppm, ± 1 )a) P a (MHz, ±0.1 )bJ Relative Area Na/UCcJ (%, ±3)
I -2 0.4 19 10.3
1'111 ' -10 2.3 29 15.7
II/III -9 2.8 52 28.1
•) oiso = isotropic chemical shift. b) p Q = Cq(l +172/))1 12
c) Number of Na• cations per unit cell, calculated from the relative areas given in this table.
163
third signal at -27 ppm has a P0 value of 2.8 MHz as compared to P0 values of 4.2 and 4.7
MHz for the two separate signals in dehydrated NaY (positioned at respectively -43 and -46
ppm). Due to the interactions with Mo(C0)6, the Na+ cations at the distinct sites II and III
in NaY will become indistinguishable (at 9.4 T) and the P0 values are diminished (more
symmetric surrounding upon Mo(C0)6 adsorption). This signal at -27 ppm is assigned to the
Na• cations in the supercages interacting with the Mo(C0)6. The signals at -43 and -46 ppm
in NaY are therefore assigned to Na• cations in the supercages at sites II and III. The signal
at -43 ppm stems from Na• cations at site II, because this site has a higher Na• population
compared to site III (5). It should be remarked at this point that our 23Na DOR NMR spectra
ofMo(CO)/NaY are not in agreement with the assignments presented by Hunger et al. (16).
In the latter case, the 23Na DOR NMR signal due to the Na• cations in the sodalite cages (not
interacting with Mo(C0)6) should have remained near -44 ppm after adsorption ofMo(C0)6.
To support the final assignments following from the Mo(CO)iNaY sample, a Ca16N~2Y sample in which Mo(C0)6 is adsorbed (Mo(CO)JCa16N~2Y) was prepared. Figure 8.13
shows the 23Na DOR NMR spectra ofMo(CO)JCa16N~2 Y for outer rotor speeds of 700, 850
and 1000 Hz. It can be seen that there is at least one centerband (indicated by arrow)
positioned at -24 ppm. A second signal, required to explain the distance of the sideband on
the right, is positioned at -27 ppm (analogous to Mo(C0)6 in NaY). The signal at -2 ppm
has disappeared, due to the substitution of the Na• cations in the hexagonal prisms by the
Ca2• cations (22) (see paragraph on Ca2+ exchange).
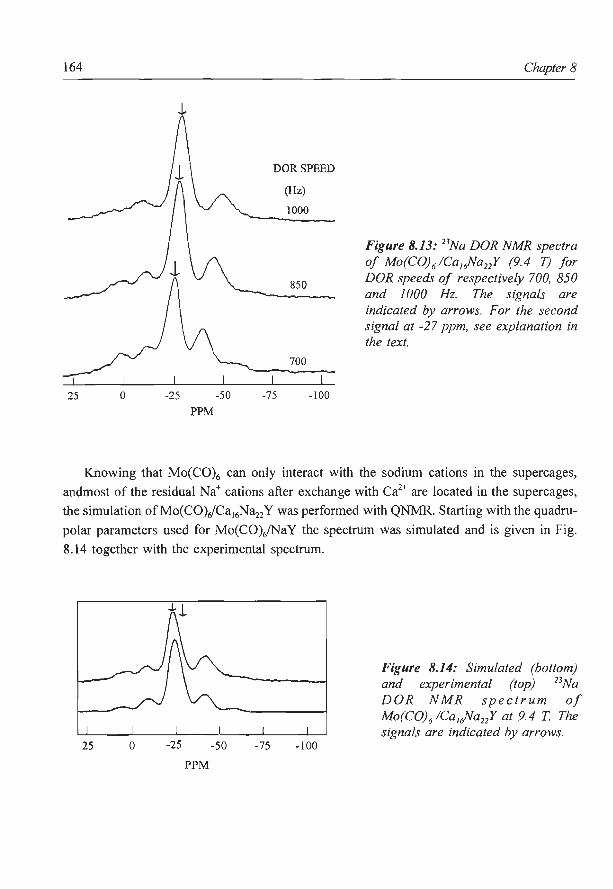
164
25 0 -25 -50
PPM
DORSPEED
-75
(Hz)
1000
850
-100
Chapter 8
Figure 8.13: 23Na DOR NMR spectra of Mo(C0) 6 /Ca11Jia22Y (9.4 T) for DOR speeds of respectively 700, 850 and 1000 Hz. The signals are indicated by arrows. For the second signal at -27 ppm, see explanation in the text.
Knowing that Mo(C0)6 can only interact with the sodium cations in the supercages,
andmost of the residual Na+ cations after exchange with Ca2+ are located in the supercages,
the simulation ofMo(COVCa16N~2Y was performed with QNMR. Starting with the quadru
polar parameters used for Mo(CO)/NaY the spectrum was simulated and is given in Fig.
8.14 together with the experimental spectrum.
PPM
Figure 8.14: Simulated (bottom) and experimental (top) 23Na DOR NMR spectrum of Mo(C0)6 /Ca1~a22Y at 9.4 T The signals are indicated by arrows.
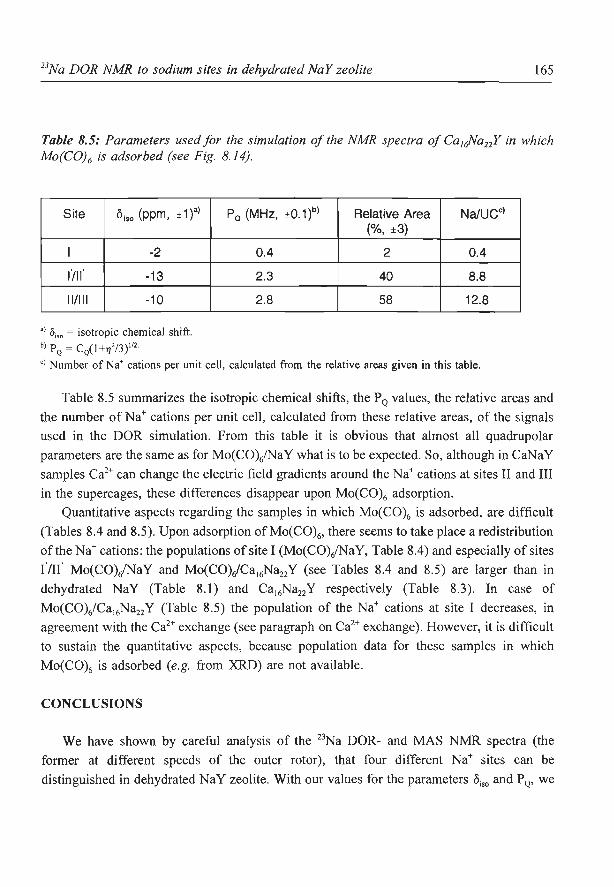
23Na DOR NMR to sodium sites in dehydrated NaY zeolite 165
Table 8.5: Parameters used for the simulation of the NMR spectra of Ca/(Jia22Y in which Mo(C0) 6 is adsorbed (see Fig. 8.14).
Site <\so (ppm, ± 1 )a) P 0 (MHz, ±0.1 )b) Relative Area Na/UCcl (%, ±3)
I -2 0.4 2 0.4
I'M -13 2.3 40 8.8
II/III -10 2.8 58 12.8
•) O;'" = isotropic chemical shift. b) Po= Co(i+1)z!3yrz.
c) Number of Na• cations per unit cell, calculated from the relative areas given in this table.
Table 8.5 summarizes the isotropic chemical shifts, the P 0 values, the relative areas and
the number of Na+ cations per unit cell, calculated from these relative areas, of the signals
used in the DOR simulation. From this table it is obvious that almost all quadrupolar
parameters are the same as for Mo(C0)6/NaY what is to be expected. So, although in CaNaY
samples Ca2+ can change the electric field gradients around the Na+ cations at sites II and III
in the supercages, these differences disappear upon Mo(C0)6 adsorption.
Quantitative aspects regarding the samples in which Mo(C0)6 is adsorbed, are difficult
(Tables 8.4 and 8.5). Upon adsorption ofMo(C0)6, there seems to take place a redistribution
of the Na+ cations: the populations of site I (Mo(C0)6/Na Y, Table 8.4) and especially of sites
(III' Mo(C0)6/NaY and Mo(COVCa16Na22Y (see Tables 8.4 and 8.5) are larger than in
dehydrated NaY (Table 8.1) and Ca16Na22Y respectively (Table 8.3). In case of
Mo(CO)iCa16N~2Y (Table 8.5) the population of the Na+ cations at site I decreases, in
agreement with the Ca2+ exchange (see paragraph on Ca2+ exchange). However, it is difficult
to sustain the quantitative aspects, because population data for these samples in which
Mo(C0)6 is adsorbed (e.g. from XRD) are not available.
CONCLUSIONS
We have shown by careful analysis of the 23Na DOR- and MAS NMR spectra (the
former at different speeds of the outer rotor), that four different Na+ sites can be
distinguished in dehydrated NaY zeolite. With our values for the parameters 0;50 and P 0 , we
166 Chapter 8
are able to simulate not only the 23Na DOR NMR spectra of NaY at 9.4 T, but also those
at 7.0 T (Hunger et al. (16)) The same is true for the 23Na MAS NMR spectra at 7 T,
published by Hunger et al. (16) and at 11.7 T, published by Jelinek et al. (14, 15).
The 23Na DOR- and MAS NMR spectra of Ca19Na16 Y were analyzed taking into account
that not all I-sites are devoid of Na+ cations (far-IR) and, consequently, that some residual
NMR signal remains at -3 ppm. The assembly of center- and sidebands in the 23 Na DOR
NMR spectra can again only be explained by invoking four sites. The o;,0 and/or P Q values
of the Na+ cations at the other sites (I'III', II, III) were influenced by the increasing electric
field gradients values induced by the Ca2+ ions and accompanying changes in the lattice
structure (24).
Adsorption ofMo(C0)6 in either NaY or Ca 16N~2Y has the effects as already proposed
by Jelinek et al. (14, 15). The arguments for postulating different 23Na NMR signals for Na+
ions in super- and sodalite cages are further strengthened. Regarding the quantitative aspects
of our study, the known distribution for some NaY samples (based on XRD measurements)
are reasonably reproduced. Attention should, however, be paid to the proven, extreme
sensitivity of the Na+ distributions in NaY towards the details of synthesis and subsequent
treatments ( 5, I 0). Further experiments are needed to enable distinction of the sites I' and II'
by 23Na NMR.
References
1. Moscou, L., Stud. Surf Sci. Catal. 58 (1991) 1.
2. Ward, 1. W., Stud. Surf Sci. Cat a!. 16 ( 1983) 587.
3. Maxwell, I.E., Catal. Today 1 (1987) 385.
4. Chapter 2 of this Thesis.
5. Mortier, W.J., Van den Bossche, E. and Uytterhoeven, J.B., Zeolites 4 (1984) 41.
6. Fitch, A.N., Jobic, H. and Renouprez, A., J. Phys. Chern. 90 ( 1986) 1311.
7. Baker, M.D., Ozin, G.A. and Godber, J., Catal. Rev.-Sci. Eng. 27 (1985) 591.
8. Baker, M.D., Godber, J. and Ozin, G.A., J. Am. Chern. Soc. 107 (1985) 3033.
9. Tijink, G.A.H., Janssen, R. and Veeman, W.S., J. Am. Chern. Soc. 109 (1987) 7301.
10. Chao, K.-J. and Lin, C.-F., Collect. Czech. Chern. Commun. 57 (1992) 710.
11. Challoner, R. and Harris, R.K. Zeolites 11 (1991) 265 .
12. Beyer, H.K. , Pal-Borbely, G. and Karge, H.G. Microporous Materials 1 (1993) 67.
13. Wu,Y., Sun, B.Q., Pines, A., Samoson, A. and Lippmaa, E., J. Magn. Res. 89 (1990) 297.
14. Jelinek, R., Ozkar, S. and Ozin, G.A. J. Am. Chern. Soc. 114 (1992) 4907.
15. Jelinek, R., Ozkar, S., Pastore, H.O., Malek, A. and Ozin, G.A., J. Am. Chern. Soc. 115
23Na DOR NMR to sodium sites in dehydrated NaY zeolite 167
(1993) 563.
16. Hunger, M., Engelhardt, G., Koller, H. and Weitkamp, J., Solid State Nucl. Magn. Res. 2
(1993) Ill.
17. Samoson, A. and Lippmaa, E., J Magn. Res. 84 (1989) 410.
18. Program for simulation of solid state NMR lineshapes QNMR, developed and supplied by the
Institute of Chemical Physics and Biophysics, Tallinn, Estonia.
19. Mortier, W.J., in 'Compilation of extra framework sites in zeolites', Butterworth & Co Ltd.,
Guilford, 1982; p 26.
20. Lievens, J.L., Verduijn, J.P., Bons, A-J. and Mortier, W.J., Zeolites 12 (1992) 699.
21. Scholle, K.F.M.G.J., Ph.D. Thesis, University ofNijmegen, The Netherlands, 1985.
22. Bennett, J.M. and Smith, J.V., Mat. Res. Bull. 3 (1968) 633.
23. Bennett, J.M. and Smith, J.V., Mat. Res. Bull. 3 (1968) 933.
24. Jacobs, W.P.J.H., van Wolput, J.H.M.C. and van Santen, R.A., Zeolites 13 (1993) 170.
25. Pastore, H.O., Ozin, G.A. and Poe, A.J., J Am. Chern. Soc. 115 (1993) 1215.
26. Ozkar, S.; Ozin, G.A., Moller, K, and Bein, T., J Am. Chern. Soc. 112 (1990) 9575.
9 SUMMARY AND CONCLUDING REMARKS
Hydrocracking cataJysts often consist of a zeolite (acidic function) and non-noble metal
sulfides ((de)hydrogenation function). These catalysts are more active than metal sulfides on
silica-alumina, and are more resistant towards poisoning by sulfur compounds present in the
feed than zeolite supported noble metal catalysts. For process economics the availability of
hydrocracking catalysts having an activity and selectivity adapted to the feed requirements
is of crucial importance. However, the selection of these tailor made catalysts is still difficult
because of the limited knowledge about these cataJysts. The research in this thesis is mainly
focused on the catalytic and structural characterization of zeolite supported metal sulfide
catalysts.
Various zeolite Y supported nickel sulfide catalysts are prepared by impregnation or ion
exchange, and characterized by means of thiophene hydrodesulfurization (HDS), sulfur
analysis, Temperature Programmed Sulfidation (TPS), 129Xe-NMR and Dynamic Oxygen
Chemisorption (DOC). Both the preparation method and the sulfidation method have a strong
influence on the catalytic behaviour. A CaY supported nickel sulfide catalyst prepared by
impregnation is more active than a NaY supported nickel sulfide catalyst prepared by the
same method. Ion exchanged catalysts show a far higher initial activity, but due to the
presence of acid sites deactivation is very strong. The initial activity of these catalysts can
169

170 Chapter 9
be improved significantly by drying prior to sulfidation.
In all catalysts sulfidation results in quantitative nickel sulfide formation, with Ni3S2
being the main product. Occasionally, also some NiS appears to be present. The major part
of the nickel sulfide phase is invariably located on the outside of the zeolite particles. The
fraction of nickel sulfide in the zeolite pores depends on the preparation method and the
pretreatment conditions, and is the highest for ion exchanged nickel sulfide catalysts which
are dried before sulfidation.
Also the overall nickel sulfide dispersion, as determined by DOC, is dependant on both
the preparation method (impregnation vs. ion exchange) and the sulfidation pretreatment
(direct sulfidation or drying before sulfidation). The increase in activity for the catalysts
dried prior to sulfidation compared to the directly sulfided catalysts is completely due to an
increase in nickel sulfide dispersion. The differences in activity between the impregnated
NaY and CaY and the ion exchanged catalysts are most likely not caused by differences in
nickel sulfide dispersion. Probably, the activity of these catalysts is strongly influenced by
the acidity of the support and the presence very active small nickel sulfide clusters in the
pores of the zeolite.
The influence of the zeolite acidity on the HDS activity is examined for a series of
HNaY supported metal sulfide catalysts. With increasing acidity (a higher degree of
exchange of Na + against H+) the initial HDS activity of the metal sulfide catalyst increases.
The acidity has no effect on the metal sulfide dispersion. Probably, a synergetic effect occurs
between the metal sulfide and the acidic zeolite support, resulting in an increase in initial
HDS activity. The reason for this synergetic effect may be an increased adsorption of
thiophene in the pores of the zeolite, due to a strong adsorption on the acid sites. But it
might also be that the acid site can change the thiophene HDS reaction itself, or that the
catalytic properties of the metal sulfide phase are altered. In each case only the HDS activity of the metal sulfide particles located inside the zeolite pores will be increased by the
presence of acid sites.
The differences in activity measured for impregnated NaY and CaY supported nickel
sulfide catalysts and the catalysts prepared by ion exchange can also be explained by the synergetic effect between the metal sulfide and the acid sites in the zeolite pores. Both
impregnated catalysts have the same amount of nickel sulfide located in the zeolite pores.
The higher activity of the CaY supported sample is caused by the higher acidity of this
catalyst. On the ion exchanged sample both the acidity and the amount of nickel sulfide in
the zeolite pores increase, resulting in a far higher initial activity compared to the
impregnated NaY supported catalyst.
The hydrocracking properties of various CaY supported metal (Fe, Co, Ni, Mo, Ru, Rh,
Summary and concluding remarks 171
Pd, W, Re, Ir and Pt) sulfide catalysts are examined by studying the hydroconversion of
n-decane. All metal sulfide catalysts show cracking conversions which are significantly
higher than that of the CaY support. The hydrocracking activity of the catalysts is determined
by both the hydrogenation properties of the metal sulfide phase and its distribution over the
zeolite particle. HREM showed a relatively good distribution of the Rh and Ir sulfide phase
throughout the pores of the zeolite particle. Combined with their intrinsically strong
hydrogenating properties this results in almost ideal hydrocracking behaviour for the sulfided
Rh/Ca Y and Ir/Ca Y catalysts. On other catalysts the metal sulfide is mainly located on the
outside of the zeolite crystals. As a result these catalysts show lower conversions and non
ideal hydrocracking properties, accompanied by a high degree of coking.
Mo/Ca Y and W /CaY show surprisingly high hydrocracking conversions, in spite of the
high amount of metal sulfide located on the outside and the high degree of coke formation.
Probably, this is due to a relatively high acidity of the zeolite caused by exchange of Ca2+
by NH/ during impregnation. The Fe, Co and Ni sulfide catalysts show very low
conversions due to the low dispersion of the metal sulfide phase. Improvement of the nickel
sulfide dispersion by changing the sulfidation procedure (sulfidation after drying instead of
direct sulfidation) results in a strong increase of the n-decane conversion. A larger part of
the zeolite pores is kept free of coke and thus more acid sites are available for reactions. As
both the nickel sulfide dispersion and the number of acid sites increase, the increase in
conversion is not accompanied by an improvement of the catalytic properties towards ideal
hydrocracking.
Sulfided zeolite Y supported Ni-Mo catalysts (varying in preparation method and
sulfidation procedure) do not show a promoter effect for hydrocracking of n-decane. In all
cases the activity is similar to that of the most active single metal sulfide catalyst. Most
likely, the zeolite pores are too small to allow the formation of a bimetallic sulfide phase
(NiMoS) in the supercages.
In order to prepare zeolite Y supported catalysts with high amounts of smaJl molybdenum
sulfide clusters in the zeolite pores, two different preparation methods are examined. On
catalysts prepared by impregnation with ammonium heptamolybdate only very little
molybdenum is introduced in the zeolite pores during impregnation. Due to the size of the
heptamolybdate clusters, the Mo species can not enter the zeolite pores. During calcination
in air part of the Mo is redistributed throughout the pores as Mo02(0H)2. However, the Mo
fraction in the zeolite pores remains small after calcination. After sulfidation the amount of
Mo located in the zeolite pores does not change significantly. The Mo species in the zeolite
pores are probably converted into MoS2, while the Mo phase on the exterior is only partly
sulfided. This is caused by the presence of large molybdenum oxide particles which are
172 Chapter 9
difficult to sulfide. The amount of Mo present in the zeolite pores as well as the thiophene
HDS activity of the sulfided catalysts increase with increasing Mo loading.
For the second preparation method Mo(C0)6 is adsorbed in the zeolite, resulting in a
precursor catalyst in which all Mo is located inside the pores. Upon sulfidation all Mo is
converted into MoS2• However, a large part of the Mo has migrated to the outside during
sulfidation. Also oxidation or decomposition of adsorbed Mo(C0)6 results in large amounts
of molybdenum oxide or molybdenum metal respectively, located on the exterior.
Consequently, sulfidation of these samples again results in catalysts with only small amounts
of MoS2 in the zeolite pores. This amount is the lowest for the sample on which Mo(C0)6
is decomposed. This catalyst also shows the lowest thiophene HDS activity compared with
the other molybdenum sulfide catalysts prepared from Mo(C0)6. Similar to the nickel sulfide
catalysts, also for the molybdenum sulfide catalysts the small metal sulfide particles in the
zeolite pores contribute significantly to the thiophene HDS activity.
Probably, more active catalysts can be prepared by developing methods which result in
higher amounts of metal sulfide in the zeolite pores. Possibly, for those samp.les in which
the metal sulfide precursor is already located inside (Mo(CO)iNaY; ion exchanged zeolites)
lower sulfidation temperatures may result in a reduced mobility of the metal sulfide species,
and consequently in higher amounts of metal sulfide located inside the zeolite pores.
However, most catalytic reactions in which metal sulfide species are involved are performed
at high reaction temperatures. Thus, if high amounts of metal sulfides located inside the
zeolite pores can be prepared at low sulfidation temperatures, methods should be developed
to keep them inside at the high temperatures needed for reaction conditions. 23Na Double Rotation NMR can be a useful technique to study the interactions between
the metal sulfide phase located inside the zeolite pores and the Na+ ions present in the zeolite
support. Four different signals can be distinguished in the 23Na DOR NMR spectrum of
dehydrated NaY. They can be ascribed to Na+ at site I, Na+ at sites I 'III', Na+ at site II and
Na+ at site III . After adsorption ofMo(C0)6 on NaY the signals of the Na+ at the different
sites have clearly shifted compared to the original signal in dehydrated NaY. The signals for
the Na+ cations at site I and 1'/II ' are only slightly shifted, but for the Na+ cations in the
supercage a large change in chemical shift is observed, due to the strong interactions between
these Na+ ions and the Mo(C0)6 adsorbed in these supercages.
SAMENV ATTING
Hydrocracking katalysatoren bestaan vaak uit een zeoliet (de zure functie) en een
overgangsmetaalsulfide (de (de )hydrogeneringsfunctie ). Deze katalysatoren zijn actiever dan
metaalsulfides op een silica-alumina drager, en zijn beter hestand tegen vergiftiging door
zwavelhoudende stoffen dan zeolietgedragen edelmetaal katalysatoren. De beschikbaarheid
van katalysatoren waarvan de activiteit en selectiviteit kan worden aangepast aan de eisen
van de voeding is van cruciaal belang voor het economisch rendement van het hydrocracking
proces. De bereiding van deze "tailormade" katalysatoren is echter nog steeds moelijk
vanwege de beperkte kennis welke over deze katalysator systemen beschikbaar is. Het
onderzoek dat in dit proefschrift beschreven wordt, is dan ook vooral gericht op de
karakterisering van de structuur en de bepaling van de katalytische activiteit van deze zeoliet
gedragen metaal sulfide katalysatoren.
Verschillende zeoliet Y gedragen nikkelsulfide katalysatoren zijn bereid via impregnatie
of ionenwisseling en gekarakteriseerd met behulp van thiofeen hydrodesulfurization (HDS),
zwavel analyse, Temperature Programmed Sulfidation (TPS), 129Xe-NMR en Dynamic
Oxygen Chemisorption (DOC). Zowel de bereidingsmethode als de inzwavelingsprocedure
hebben een sterke invloed op de katalytische activiteit. Voor nikkelsulfide katalysatoren
bereid via impregnatie blijken CaY gedragen katalysatoren actiever te zijn dan NaY gedragen
katalysatoren. Bereiding via ionenwisseling resulteert in een veel hogere initiele activiteit,
maar door de aanwezigheid van zure sites treedt er een sterke deactivering op. De initiele
activiteit van deze katalysatoren kan sterk worden verbeterd door de monsters voorafgaand
aan het inzwavelen te drogen.
Het inzwavelingsproces resulteert bij aile katalysatoren in een volledige conversie van
nikkel naar nikkelsulfide, waarbij hoofdzakelijk Ni3S2 wordt gevormd. Soms blijkt er ook
een kleine hoeveelheid NiS te zijn gevormd. Het grootste dee! van het nikkelsulfide bevindt
zich aan de buitenkant van de zeoliet deeltjes. Het percentage nikkelsulfide in de
zeolietporien is afhankelijk van zowel de bereidingsmethode als de inzwavelingscondities,
en is het hoogst voor de ionengewisselde nikkelsulfide katalysatoren welke zijn gedroogd
voor het inzwavelen.
Ook de nikkelsulfide dispersie (bepaald met DOC) is afhankelijk van zowel de
bereidingsmethode (impregnatie vs. ionenwisseling) als de inzwavelingsprocedure (direct
173
inzwavelen of drogen gevolgd door inzwavelen). De activiteitstoename van de katalysatoren
welke zijn gedroogd voor het inzwavelen t.o.v. de direct ingezwavelde monsters wordt
volledig veroorzaakt door een toename van de nikkelsulfide dispersie. De activiteitsver
schillen tussen de geimpregneerde en de ionengewisselde katalysatoren worden waarschijnlijk
niet veroorzaakt door verschillen in nikkelsulfide dispersie. De activiteiten van deze
katalysatoren worden sterk beinvloedt door de zuurgraad van de drager en de aanwezigheid
van kleine zeer actieve nikkelsulfide deeltjes in de zeolietporien.
De invloed van de zuurgraad op de HDS activiteit is onderzocht voor een serie HNaY
gedragen nikkelsulfide katalysatoren. Met toenemende zuurgraad (meer Na+ uitgewisseld
tegen H) neemt de initiele HDS activiteit van de metaalsulfide kata}ysator sterk toe. De
zuurgraad heeft geen effect op de dispersie van het metaalsulfide. Waarschijnlijk treedt er
een synergetisch effect op tussen het metaalsulfide en de zure zeoliet drager, hetgeen
resulteert in een toename van de initiele activiteit. Een mogelijke oorzaak voor dit
synergetisch effect is een toenemende thiofeen concentratie in de zeolietporien als gevolg van
een sterke adsorptie van thiofeen op zure sites. Maar het is ook mogelijk dat de zure sites
de thiofeen HDS reactie zelf beinvloeden, of dat de katalytische eigenschappen van het
metaalsulfide veranderen onder invloed van de zure sites. In elk geval zal aileen de activiteit
van het metaalsulfide in de zeoliet porien worden beinvloedt door de aanwezigheid van zure
sites.
De activiteitsverschillen tussen de geimpregneerde NaY en CaY en de ionengewisselde
nikkelsulfide katalysatoren kunnen ook worden verklaard door het synergetisch effect tussen
het metaalsulfide en de zure sites in de zeoliet porien. De hogere activiteit van het CaY
gedragen monster t.o.v. NaY wordt veroorzaakt door de hogere zuurgraad van de CaY
drager. Op de ionengewisselde katalysatoren nemen zowel de zuurgraad als de hoeveelheid
nikkelsulfide in de zeolietporien toe, hetgeen resulteert in een hogere initiele activiteit
vergeleken met de geimpregneerde NaY gedragen katalysator.
De hydroconversion van n-dekaan is gebruikt om de hydrocracking eigenschappen van
verschillende CaY gedragen metaalsulfide (Fe, Co, Ni, Mo, Ru, Rh, Pd, W, Re, Ir and Pt)
katalysatoren te onderzoeken. Aile metaalsulfide katalysatoren geven een conversie welke
duidelijk hoger is dan die van de CaY drager. The hydrocracking eigenschappen van de
katalysatoren wordt bepaald door zowel de hydrogeneringseigenschappen van de
metaalsulfide fase als de verdeling van de sulfide fase over het zeoliet deeltje. HREM heeft
aangetoond dat bij de Rh en Ir sulfide katalysatoren de sulfide fase relatief goed is verdeeld
door de ponen van · de zeoliet deeltjes. Samen met de intrinsiek sterke
hydrogeneringseigenschappen van deze metaalsulfides resulteert dit in nagenoeg ideale
hydrocracking eigenschappen voor de ingezwavelde Rh/Ca Y en lr/Ca Y. Bij andere
katalysatoren zit het metaalsulfide hoofdzakelijk aan de buitenkant van de zeoliet deeltjes.
174
Dit resulteert in lagere conversies en niet ideale hydrocracking eigenschappen, tesamen met
een sterke mate van coke vorming in de zeoliet porien.
Mo/Ca Y en W /CaY hebben een verrassend hoge hydrocracking conversie, ondanks de
grote hoeveelheid metaalsulfide die aan de buitenkant zit en de sterke mate van coke
vorming. Dit wordt waarschijnlijk veroorzaakt door een relatief hoge zuurgraad van het
zeoliet ten gevolge van de uitwisseling van Ca2+ tegen NH/ tijdens de impregnatie. De Fe,
Co en Ni sulfide katalysatoren hebben een zeer !age n-dekaan conversie veroorzaakt door de
lage metaalsulfide dispersie. Met een andere inzwavelingsprocedure (drogen voor het
inzwavelen i.p.v. direct inzwavelen) kan de nikkelsulfide dispersie worden verbeterd, hetgeen
resulteert in een sterke toename van de conversie. Een groter dee! van de zeoliet porien
wordt vrijgehouden van coke, waardoor er meer zure beschikbaar zijn voor reacties, met als
gevolg een hogere conversie. Omdat zowel de nikkelsulfide dispersie als het aantal zure sites
toenemen wordt de hogere conversie niet vergezeld door een verbetering van de katalytische
eigenschappen t.o.v. ideal hydrocracking.
Bij ingezwavelde zeoliet Y gedragen Ni-Mo katalysatoren (varierend in bereidings
methode en inzwavelingscondities) wordt geen promotor effect gevonden voor het
hydrocracken van n-dekaan. De activiteit van de katalysator is telkens gelijk aan die van de
meest actieve enkelvoudige metaalsulfide katalysator. Waarschijnlijk zijn de zeoliet porien
te klein voor de vorming van een bimetallische sulfide fase (NiMoS).
Twee verschillende bereidingsmethoden zijn onderzocht met het doe! zeoliet Y gedragen
katalysatoren met een grote hoeveelheid molybdeensulfide in de zeoliet porien te bereiden.
Bij katalysatoren bereid via impregnatie met ammoniumheptamolybdaat wordt gedurende de
impregnatie slechts zeer weinig molybdeen in de zeolietporien afgezet. Doordat de
heptamolybdaat clusters zo groot zijn kan het Mo niet in de smalle porien. Gedurende het
calcineren in de Iucht wordt een dee! van het Mo door de zeolietporien herverdeeld als
Mo02(0H)2. De hoeveelheid molybdeen in de porien blijkt echter ook na het calcineren vrij
laag. Tijdens het inzwavelen verandert de hoeveelheid molybdeen in de porien niet
noemenswaardig. Het molybdeenoxide in de porien wordt waarschijnlijk omgezet in MoS2,
terwijl het Mo aan de buitenkant slecht gedeeltelijk wordt ingezwaveld. Dit wordt
veroorzaakt door grote molybdeenoxide deeltjes welke moeilijk inzwavelbaar zijn . Zowel de
hoeveelheid Mo in de zeolietporien als de thiofeen HDS activiteit van de ingezwavelde
katalysatoren neemt toe met toenemende Mo belading.
Bij de tweede bereidingsmethode is Mo(C0)6 geadsorbeerd in de zeoliet, hetgeen
resulteert in een precursor katalysator waarbij aile Mo zich in de porien bevindt. Na het
inzwavelen is aile Mo omgezet in MoS2• Het grootste dee! van het Mo is echter gedurende
het inzwavelen naar de buitenkant van de zeoliet deeltjes gemigreerd. Ook het oxideren of
ontleden van het geadsorbeerde Mo(C0)6 resulteert in de afzetting van grote hoeveelheden
175
molybdeenoxide ofmolybdeen metaal aan de buitenkant van de zeoliet deeltjes. Inzwaveling
van deze monsters leidt dan ook slechts tot kleine hoeveelheden MoS2 in de zeolietporien.
Deze hoeveelheid is het laagst voor het monster waarop het Mo(C0)6 is ontleed. Deze
katalysator heeft ook de laagste thiofeen HDS activiteit in vergelijking met de andere
molybdeensulfide katalystatoren. Net als bij de nikkelsulfide katalysatoren geldt ook voor de
molybdeensulfide katalysatoren dat de kleine sulfide deeltjes in de zeoliet porien sterk
bijdragen aan de thiofeen HDS activiteit.
Waarschijnlijk kunnen er meer actieve katalysatoren worden bereid door methoden te
ontwikkelen welke resulteren in een grotere hoeveelheid metaalsulfide in de porien. In die
monsters waarbij de metaalsulfide precursor zich reeds in de porien bevindt (Mo(CO)iNaY;
ionengewisselde zeolieten) kan een lagere inzwavelingstemperaturr leiden tot een
verminderde mobiliteit van de metaalsulfide deeltjes, en dus in grotere hoeveelheden
metaalsulfide in de zeolietporien. De meeste kartalytische reacties over metaalsulfides vinden
echter plaats bij hoge reactietemperaturen. Dus zal er een methode moeten worden
ontwikkeld om de metaalsulfides die tijdens de inzwavelin bij !age temperatuur in de porien
worden gevormd ook onder reactiecondities in de porien te houden. 23Na Double Rotation NMR kan zeer nuttig zijn bij het bestuderen van de interacties
tussen het metaalsulfide in de zeolietporien en de Na+ ionen die op de zeoliet drager
aanwezig zijn. Er kunnen 4 verschillende signalen worden onderscheiden in het 23Na DOR
NMR spectrum van gedehydrateerd NaY. Deze signalen kunnen worden toegekend aan Na+
op site I, Na+ op sites I' III', Na+ op site II en Na+ op site III. Na adsorptie van Mo(C0)6 op
NaY zijn de signalen van deNa+ ionen op de verschillende sites duidelijk verschoven t.o.v.
de signalen in gedehydrateerd NaY. De signalen voor de kationen op site I en 1'/II' zijn
slechts in geringe mate verschoven, maar voor de kationen in de superkooien wordt een
sterke verandering in de chemical shift waargenomen. Deze wordt veroorzaakt door de sterke interacties tussen deNa+ ionen en het in deze superkooien geadsorbeerde Mo(C0)6.
176
Dankwoord
Tot slot van dit proefschrift wil ik toch nog even aile mensen bedanken die mij de
afgelopen 4Y:z jaar praktisch en geestelijk hebben bijgestaan bij de totstandkoming van
dit boekje.
Om te beginnen wil ik mijn ouders noemen, die inij vrijheid hebben gegeven om
datgene te doen wat ik leuk vond, maar wei altijd klaar stonden om mij door de
moeilijke tijden heen te helpen.
Mijn dagelijkse begeleiders San de Beer en Rutger van Santen dank ik voor de
prettige en goede begeleiding en de grote mate van vrijheid die ik gedurende mijn
promotieonderzoek heb genoten. San, jouw wijze lessen en onvoorwaardelijke steun
voor mijn werk hebben er in sterke mate toe bijgedragen dat dit onderzoek uiteindelijk
toch nog succesvol werd. Rutger, jouw onnavolgbaar enthousiasme zorgde ervoor dat
ik zelfs na de zwaarste tegenslagen toch weer vol goede moed aan het volgende
experiment begon.
Voor het bespreken van mijn dagelijkse problemen waren er steeds mijn
"sulfidische" collega's: Adelheid Elemans, Jacob van Gestel, Tamas Koninyi, Edwin
van Maurik, Eugene van Oers, Arian Overweg, Wylliam Robinson, Misha Sychev,
Marcel Vissenberg en Gert Vorbeck. Ondanks mijn soms nogal cynische kijk op de
wereld en op onze experimentele problemen in het bijzonder was het toch altijd een
groot genoegen om met jullie samen te werken.
Ook buiten de sulfidegroep zijn er een aantal mensen wier bijdrage onontbeerlijk
is geweest voor de totstandkoming van dit proefschrift: Jan de Haan, Leo van de Yen
en Harry Verhulst van "onze TAK dependance op vloer 3" (zonder jullie NMR
metingen zou dit boekje vee! dunner zijn geweest), en Dick de Haan, Henny
Zandbergen en Jean-Paul Janssens van de Technische Universiteit Delft (de metingen
in Delft waren vaak van cruciaal belang voor het onderzoek).
Daamaast zijn er nog enkele anderen die een minder prominente maar daarom niet
minder belangrijke rol in het onderzoek hebben gespeeld: Theo Kloprogge en Ben
Janssen van de Universiteit Utrecht, Adri van der Kraan en Menno Craje van het IRl
in Delft, Arthur de Jong (helaas heeft geen enkele XPS meting het proefschrift gehaald,
maar dat heeft zeker niet aan jouw inzet gelegen), Jos van Wolput, en, last but not
least, Joop van Grondelle en Wout van Herpen (jullie technische ondersteuning was
177

vaak onontbeerlijk voor een snelle voortgang van het onderzoek).
Het hiervoor beschreven onderzoek is mede tot stand gekomen dankzij het bloed,
zweet en tranen van een groot aantal afstudeerders en enkele stagiaires: John Jozen,
Bart Theelen, Gert-Jan van Moorsel, Theo Dingemans, Gert-Jan Verbakel, Carin van
der Poel, Maurice Kessels, Sjefvan der Ley, Onno van der Waerden, Kars Rodenburg,
Erik Geelen, Rob Cuypers, Rik Berkelmans, Jacqueline Hendriks, Ronald Emmen, en
Mamix van Amerongen, bedankt!
Tenslotte dank ik aile andere (ex-)collega's en vrienden voor de soms wei eens
nuttige, maar altijd zeer verhelderende en gezellige gesprekken tijdens koffiepauzes,
vrijdagmiddag- (en avond-) borrels, vakanties, fietstochten etc. Jullie he ben er voor
gezorgd dat mijn verblijf op de TUE een zeer plezierige aangelegenheid is geworden.
178
Curriculum Vitae
Wim Welters werd geboren op 31 augustus 1966 te Roermond. Na het behalen van zijn
Atheneum B diploma aan het Bisschoppelijk College Echt begon hij in september 1984
met de studie scheikundige technologie aan de Technische Universiteit Eindhoven. Zijn
afstudeeronderzoek betrof de hydrogenering van CO over Rh en Rh-V katalysatoren,
en werd verricht onder Ieiding van drs T. Koerts en prof. dr. R.A. van Santen in de
vakgroep Anorganische Chemie en Katalyse. In juni 1989 werd de ingenieurstitel
behaald. Op 15 augustus 1989 trad hij als AI0-4 in dienst van SON/NWO en startte
hij het in dit proefschrift beschreven onderzoek onder Ieiding van prof. dr. R.A. van
San ten en dr. ir. V .H.J. de Beer, waarop hij op 19 mei 1994 hoopt te promoveren.
179
STELLING EN
behorende bij het proefschrift
Zeolite supported metal sulfides as catalysts for hydrocracking
van
W.J.J. Welters
1. Ultra Stable Y zeoliet is niet geschikt voor fundamenteel wetenschappelijk
onderzoek aan kleine metaal(sulfide) deeltjes in zeolietporien.
- Dit proefschrift.
2. Aileen a! op grond van de kleine diameter van de zeolietporien kan worden
gekoncludeerd dat de vorming van een zogenaamde CoMoS ofNiMoS fase
in deze zeolietporien erg onwaarschijnlijk is.
- Leglise, J., Janin, A., Lavalley, J.C. and Comet, D., J. Catal. 114 (1988)
388.
- Cid, R., Orellana, F. and Lopez Agudo, A., Appl. Cat a!. 32 ( 1987) 327.
- Hoofdstuk 5 van dit proefschrift.
3. XPS is niet geschikt als analysetechniek voor de verdeling van de metaal(sulfide) fase over zeoliet gedragen katalysatorsystemen.
- Ezzamarty, A., Catherine, E., Comet, D., Hemidy, J.F., Janin, A.,
Lavalley, J.C. and Leglise, J., in 'Zeolites: Facts, Figures, Future',
Jacobs, P.A. and van Santen, R.A., Eds., p. 1025. Elsevier, Amsterdam,
1989. - ·Cid, R., Fierro, J.L.G. and Lopez Agudo, A., Zeolites 10 (1990) 95.
4. De vergelijking van de kristalliniteit van zeolieten m.b.v. XRD mag alleen
worden uitgevoerd aan monsters van vergelijkbare samenstelling.
- Cid, R., Llambias, F.J., Fierro, J.L.G., Lopez Agudo, A. and Villasenor,
J., J. Catal. 89 (1984) 478.
- ASTM D 3906-80.
5. De nieuwe procedure ter analyse van EXAFS resultaten zoals voorgesteld door Clausen et al. leidt niet tot een significante verbetering van de schatting van de deeltjesgrootte.
- Clausen, B.S., Grabaek, L., Tops0e, H., Hansen, L.B., Stoltze, P., N0rskov, J.K. and Nielsen, O.L., J Catal. 141 (1993) 368.
6. Het huidige referee-systeem voor wetenschappelijke publicaties zou efficienter kunnen worden door bij de publicatie behalve de auteurs ook de referees te vermelden.
7. Het is op z'n minst dubieus te noemen dat de overheid de ARBOwet invoert voor overheidsinstanties zonder eerst de gebouwen waarin deze instanties gehuisvest zijn aan de eisen van de ARBOwet aan te passen.
8. De piekhoogte wordt alleen gebruikt door luie spectroscopisten.
9. Stellingen over stellingen zijn niet leuk.