z (ss sx: innl
TRANSCRIPT
10 oc Sleep •
Name: Hour: Date:
SLEEPLearning TargetsState and check the Random, 10%, and Normal/Large Sample conditionsfor performing a significance test about a population mean.Calculate the standardized test statistic and P-value for a test about apopulation mean.
• Perform a significance test about a population mean.Lesson 9.3: Day 1: Are you getting enough sleep?
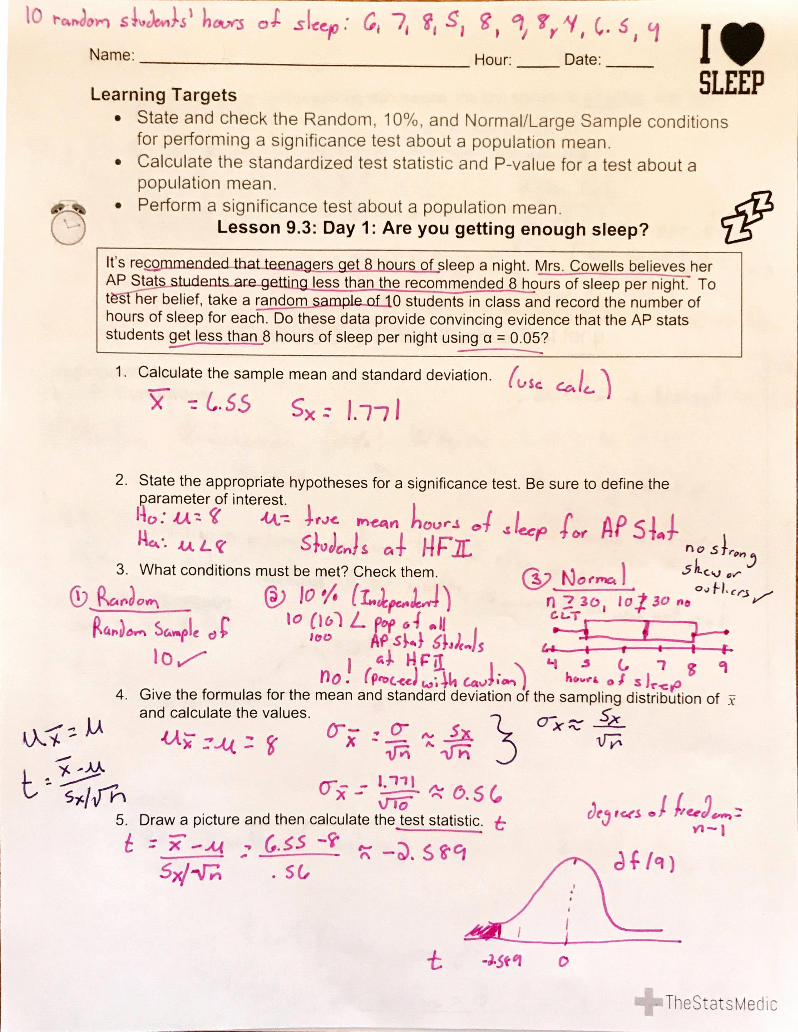
It's a night. Mrs. Cowells believes herAP Stat etting less than the recommended 8 hours of sleep per night. Tot s her belief, take a random sampl ø of 10 students in class and record the number ofhours of sleep for each. Do these data provide convincing evidence that the AP statsstudents get less than 8 hours of sleep per night using a = 0.05?
1. Calculate the sample mean and standard deviation.
z (...SS Sx: Innl
2. State the appropriate hypotheses for a significance test. Be sure to define theparameter of interest.No: mean
3. What conditions must be met? Check them.
10 L 64
no. Cav
no s ron5 kcu
5
4. Give the formulas for the mean and standard deviation of the sampling distribution ofand calculate the values.
x
5. Draw a picture and then calculate the test statistic. &toes
zTheStatsMedic

Name: Hour: Date:
6. Remember, since we are working with means, the test statistic is a t value. Use tableB to find the P-value.
1.74 reno
c. ruh9c I7. What conclusion can we make?
sDLO-cr.
COhvjncjn mean s -1AP tss
• J•é'lesson 9.3 ay 1— Significance Test for p
Important ideas:L.T. #1 Conditions:
Y) cfCh
on h 01 c- Cuc mvs
L.T. #2 Test StatisticOne
L.T. #3 P-value
(Osc lab). g
-Vsc ca r
Qrrv
an)
2 30 CCT
uXS
J 40 (in) ran
j V/0pcrj
V pct I
Name: Hour: Date:
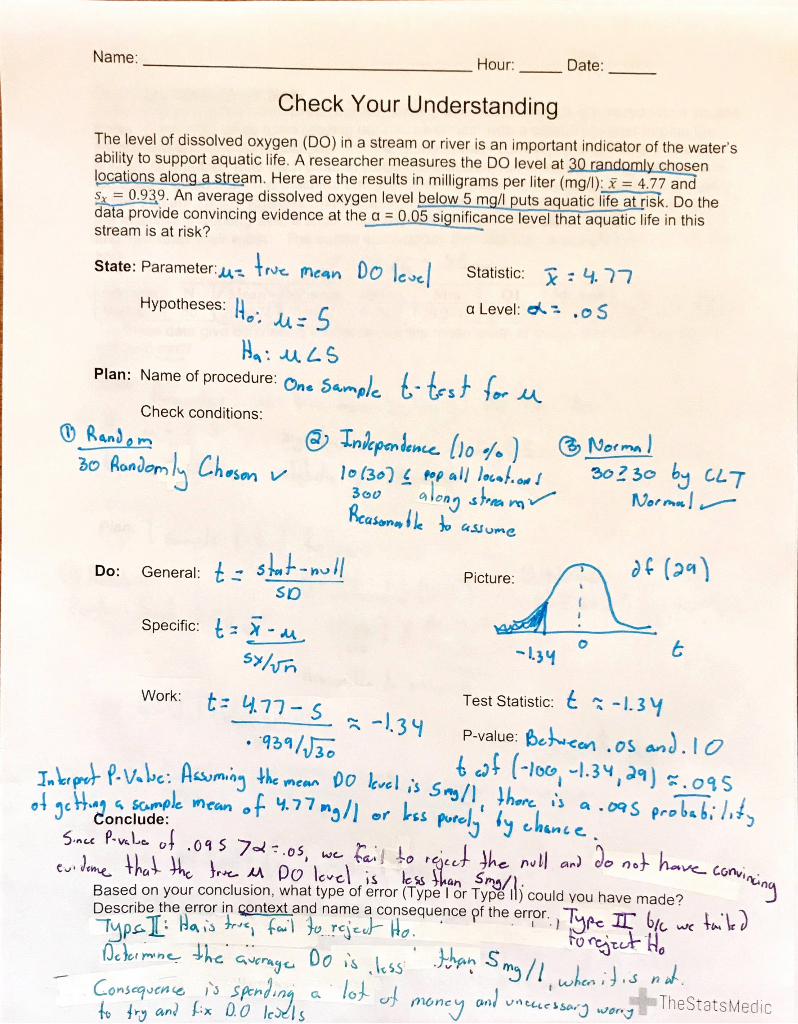
Check Your UnderstandingThe level of dissolved oxygen (DO) in a stream or river is an important indicator of the water'sability to support aquatic life. A researcher measures the DO level at urandomly--c------—hosenloc t' Here are the results in milligrams per liter (mg/l): = 4.77 and
= 0.939. An average dissolved oxygen level below 5 mg/l puts aquatic Do thedata provide convincing evidence at the a = 0.05 significance level that aquatic life in thisstream is at risk?
State: mean DO
Hypotheses:
Plan: Name of procedure:Onc
Check conditions:
30 AonDom Il 10 (30)
3øv
Do: General:so
Specific:
Work: t: 4.77 -s
Statistic:
a Level: .05
all) / 30230 cc -rc.' eno
(PCI)Picture:
Test Statistic: -1.3 Y
-J.3Y P-value: ).lo00
S%/J(-100, V I.3Yjäq)
r.o%S04 sempl mean o f. y. 77 .09 S
S 7Q : .osjDo is Convj
Based on your conclusion, what type of error (Type I or Type I ; could vou have made?Describe the error in qontext and name a consequence pf the error.
00 slos
an) D. 0 1021 Sc.r jotOnc v n waTheStatsMedic

Name: Hour: Date:
Two sided siqnificance testsIn the children's game Don't Break the Ice, small plastic ice cubes are squeezed into a squareframe. Each child takes turns tapping out a cube of "ice" with a plastic hammer hoping thatthe remaining cubes don't collapse. For the game to work correctly, the cubes must be bigenough so that they hold each other in place in the plastic frame but not so big that they aretoo difficult to tap out. The machine that produces the plastic ice cubes is designed to makecubes that are 29.5 millimeters (mm) wide, but the actual width varies a little. To make surethe machine is working well, a supervisor inspects a random sample of 50 cubes every hourand measures their width. The output summarizes the data from a sample taken during onehour.
mean
variable N Mean SEmean stdDev Min 1 Median 3 MaxWidth 50 29.4874 0.0132 0.0935 29.2717 29.4225 29.4821 29.5544 29.7148Do these data give convincing evidence that the mean width of cubes produced this hour is
not 29.5 mm?
State:11.
01
IJq•. Dq. 6
plan:
(100/0J go 10 J
Do:-.nvl)s s 0
so
- qc o y - 04.5. O • ASYS-g sysn .01 32
Conclude:
voc
rc ho
O r coe
'TheStatsMedic

Table entry for p and
C is the point t* with
probability p lyingabove it and
probability C lyingbetween —t* and t*.
Probability p
Table B
df
1
2
3
4
5
67
89
10
12
13
14
15
16
17
18
19
2021
22
23
24
25
2627
2829
3040
50
6080
100
1000
t distribution critical values
Tail probability p
.25
1.000
.816
.765
.741
.727
.718
.711
.706
.703
.700
.697
.695
.694
.692
.691
.690
.689
.688
.688
.687
.686
.686
.685
.685
.684
.684
.684
.683
.683
.683
.681
.679
.679
.678
.677
.675
.674
50%
.20
I .3761.061
.978
.941
.920
.906
.896
.889
.883
.879
.876
.873
.870
.868
.866
.865
.863
.862
.861
.860
.859
.858
.858
.857
.856
.856
.855
.855
.854
.854
.851
.849
.848
.846
.845
.842
.841
60%
.15
I *963
I .3861.250
1.190
1.156
1.134
1.119
1.108
1.100
I .0931.088
1.083
1.079
I .076
I .0741.071
1.069I .067I .066
I .064
I .063I .061
I .060
I .059
1.058
I .058
1.057
1.056
I .055
1.055
I .050
1.042
I .037
I .036
70%
.10
3.0781.886
I .638
1.533I .476
I .44()
1.415
1.397
1.383
1.372I .363
1.356
1.350I. 345
1.341
1.337
1.333
1.330
1.328
1.325
1.323
1.321
1.319
1.318
1.316
1.315
1.314
1.313
1.311
1.310I .303
I .299
I .296
I .292
1.290
I .282
I .282
80%
.05
6.314
2.920
2.3532.132
2.015.943
1.895
1.860
1.833
1.812I .796
1.782
1.771
1.761
1.7531.7461.74()
I.734I .7291.725
1.721
1.717
1.714
1.711
I .7081.706
1.703
1.7011.699
I .697
I .684
1.676
1.671
I .664I .66()I .646
I .645
90%
.025
12.714.303
3.182
2.776
2.571
2.447
2.365
2.3062.262
2.2282.201
2.179
2.1602.145
2.131
2.120
2.1102.101
2.093
2.0862.0802.074
2.0692.0642.0602.056
2.052
2.0482.045
2.0422.021
2.0092.000
I .990
I .984
I .962
I .960
95%
.02
15.894.849
3.4822.9992.757
2.6122.5172.449
2.398
2.359
2.328
2.3032.282
2.2642.2492.235
2.224
2.2142.205
2.197
2.189
2.183
2.1772.1722.1672.1622.158
2.1542.1502.147
2.123
2.1092.0992.088
2.081
2.0562.054
96%
.01
31.82
6.9654.541
3.747
3.365
3.1432.9982.8962.8212.7642.718
2.681
2.6502.6242.6022.5832.567
2.5522.539
2.5282.5182.508
2.5002.492
2.4852.479
2.4732.467
2.462
2.457
2.423
2.403
2.3902.374
2.3642.3302.326
98%
.005
63.669.925
5.8414.6044.0323.7073.499
3.3553.2503.1693.1063.0553.0122.9772.947
2.921
2.8982.8782.8612.8452.831
2.819
2.8072.7972.7872.7792.771
2.7632.7562.750
2.6782.6602.6392.6262.581
2.576
99%
.0025
127.314.09
7.4535.5984.7734.3174.029
3.8333.6903.5813.497
3.4283.3723.3263.2863.2523.2223.1973.174
3.1533.1353.1193.1043.091
3.078
3.0673.057
3.047
3.0383.0302.971
2.9372.915
2.8872.871
2.813
2.807
99.5%
.001
318.3
22.3310.21
7.1735.8935.2084.7854.5014.297
4.144
4.0253.930
3.8523.7873.7333.6863.6463.6113.5793.552
3.5273.5053.4853.467
3.4503.435
3.421
3.4083.396
3.3853.307
3.261
3.2323.1953.174
3.0983.091
99.8%
.0005
636.6
31.6012.92
8.6106.8695.9595.4085.0414.781
4.5874.437
4.3184.2214.140
4.0734.015
3.965
3.9223.8833.850
3.8193.7923.7683.745
3.7253.7073.6903.6743.659
3.646
3.551
3.4963.4603.4163.3903.3003.291
99.9%
Confidence level C

Ill. Sampling Distributions and Inferential Statistics (continued)
Sampling distributions for proportions:
Random
Variable
For one
population:
For two
populations:
Parameters of Standard ErrorSampling Distribution of Sample Statistic
p(l — p)P n p n
PI ¯ PI (l — PI) + 192) n n2PI - P2 n n
2
When PI = p is assumed:
c n n1 2
where i) 2
2
Sampling distributions for means:
Random
Variable
For one
population:
For two
populations:
Standard Parameters of Sampling DistributionError
of Sample Statistic
2 2 2 22 2 s
1 2s2 n n n n2 2
Sampling distributions for simple linear regression:
Random
Variable
For slope:b
Parameters of Sampling Distribution Standard Errorof Sample Statistic
s
x
[3 E(YI -jl)2
2 where
wherex n
E(XIand s
*Standard deviation is a measurement of variability from the theoretical population. Standard error is the estimate of the standard deviation. If thestandard deviation of the statistic is assumed to be known, then the standard deviation should be used instead of the standard error.