yves govaerts rayference radiometric calibration workshop ... govaerts1st... · yves govaerts...
TRANSCRIPT

Yves Govaerts
Rayference
Radiometric Calibration Workshop for European Missions
ESRIN, 30 – 31 August 2017
This work has been funded by the FP7 QA4ECV project

The original idea to use TOA simulated radiance over Libya-4 as an absolute calibration reference dated back to the early 2000s and is still in use since then at EUMETSAT
GOVAERTS AND CLERICI: EVALUATION OF RADIATIVE TRANSFER SIMULATIONS OVER BRIGHT DESERT CALIBRATION SITES 185
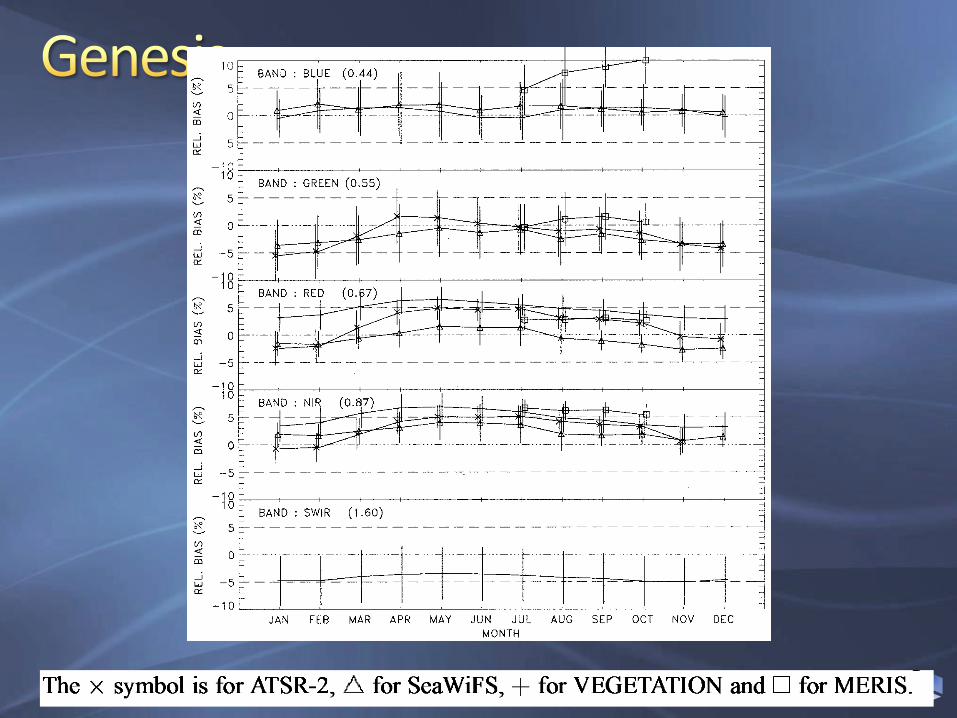
Fig. 7. Seasonal trend of the mean relative bias between observations and simulations averaged over all targets. The standard error is shown with the verticalbars. The symbol is for ATSR-2, for SeaWiFS, for VEGETATION and for MERIS.
only a very limited number of clear sky MERIS observations
are available so far. Hence, comparison results from this
instrument are given for information, but will not be discussed
in great detail.
C. Results and Discussion
The selected desert targets exhibit different types of surface
(Table II) corresponding to different performances of the sur-
face BRF model. Therefore, it is first necessary to verify that
similar results are found over all targets. Statistics over indi-
vidual targets, averaged over the entire acquisition period of
each instrument are examined now. Results are summarized in
Tables VII–X. As can be seen, there is in general a very good
correlation between simulation and observation with the co-
efficient almost always above 0.9. The mean relative bias
hardly exceeds 6%, except in the green spectral region.
Surface properties in that spectral region usually exhibit sharp
variations that can be responsible for large errors as explained
in Section III-C. It is, therefore, not surprising to observe the
largest biases in that band, since surface properties in that spec-
tral region result from interpolation. For instance, the bias be-
tween SeaWiFS observations and simulations exceeds 11% over
target ALG5 in that band, whereas it does not exceed 5% in the
other bands. Concerning the red and NIR bands, which are also
present on SEVIRI, the bias is very consistent from target to
target. From this result, we can conclude that there is no obvious
reason to reject any targets used for the calibration of SEVIRI.
The bias has, thus, been averaged over all targets to establish
the overall accuracy of the calibration reference (Table XI). This
mean bias is very similar for the ATSR-2 and SeaWiFS in-
struments, where the maximum bias does not exceed 3%. The
SEVIRI calibration reference seems to slightly underestimate
ATSR-2 and SeaWiFS radiance, but the magnitude of these dif-
ferences remains below the calibration accuracy of these two
instruments. Nevertheless, these results show the very similar
radiometric behavior of ATSR-2 and SeaWiFS with respect to
the SEVIRI calibration reference. Mean biases with respect to
the VEGETATION instrument are close to 5% in the read and
NIR bands and 4% in the SWIR band. Comparisons with re-
spect to the very first MERIS show a good agreement but in the
blue spectral region. However, not enough data have been pro-
cessed so far to draw final conclusions from these comparisons.
Let us now look at the precision of our reference, character-
ized by . As can be noted, the magnitude of the estimated
bias error is similar or bigger than the bias , which suggests
to investigate in more detail the temporal behavior of . Fig. 7
shows the temporal evolution of monthly mean bias averaged
over all available years. As can be seen, the mean bias exhibits


Comparison of 3 RTMs in the VIS spectral range over Libya-4 wrt MODIS, MERIS, GOME-2 data;
6SV: RTE -> Successive Order of scattering. Widely used in the “land” community for atmospheric correction (HITRAN96)
RTMOM: RTE -> MOM (HITRAN96)
LibRadTranV2beta: RTE -> MC (REPTRAN, HITRAN 2004)
Latest improvements

Comparison between RTM simulations and observations over Libya-4RED: ~600 MODIS observationsBLUE : ~350 MERIS observations
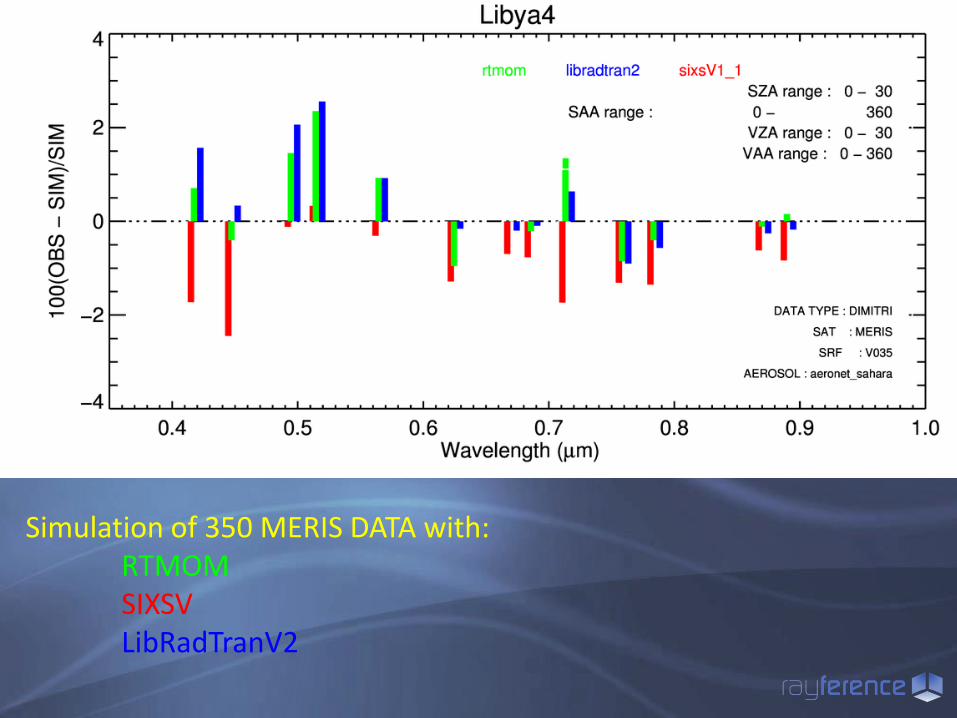
Simulation of 350 MERIS DATA with: RTMOMSIXSVLibRadTranV2

Provided by EUMETSAT
Extraction of one “pixel” centered over Libya-4
SZA and VZA restricted to 0-30 degrees
~70 observations, band-3 and -4


Missing NO2 absorption in RTMOM and SIXV (HITRAN96)
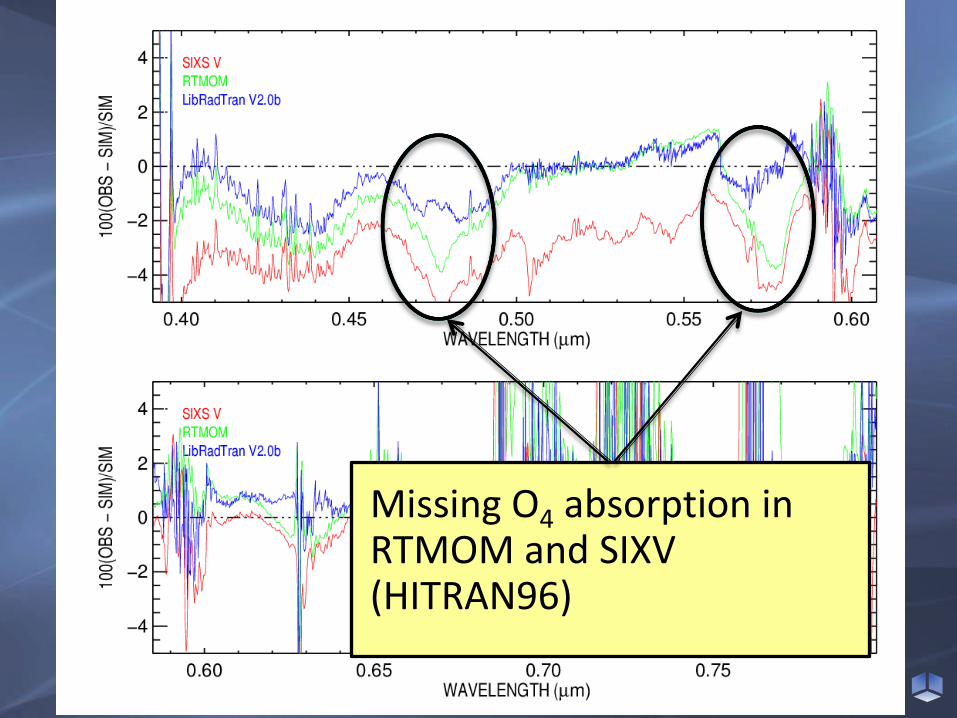
Missing O4 absorption in RTMOM and SIXV (HITRAN96)

SIXSV includes polarization
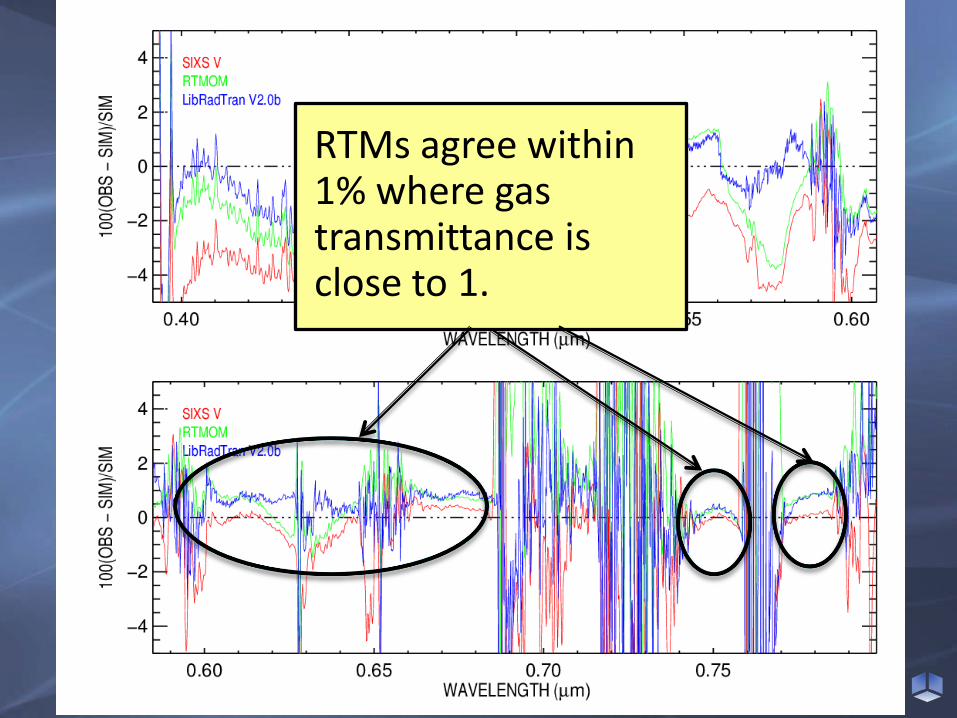
RTMs agree within 1% where gas transmittance is close to 1.


Monte-Carlo effects in LibRadTran

Polarization in SIXSV?

OBJECTIVE:
Analyze surface reflectance azimuthal dependencies due to sand dune organization for different regions-of-interest (ROIs) sizes using a 3D Monte Carlo ray-tracing RTM.
The global 30m digital elevation model (DEM) derived from the Advanced Spaceborne Thermal Emission and Reflection Radiometer (ASTER) observations has been used for this analysis.

ASTER DEM over the Libya-4
10 km
20 km
50 km
100 km

ASTER DEM over the 20km x 20 km
ROI

60m
2,500m
33 - 34o10-12o

0 10 20 30 40SLOPE ANGLE (DEGREE)
0
2
4
6
8R
ELA
TIV
E F
REQ
UEN
CY (%
)
Sand dune repose angle distribution
10 km
20 km
50 km
100 km

0.64
0.80
0.96
1.12
0
30
60
90
120
150
180
209
240
270
300
330
Sand dune azimuth angle
distribution
10 km
20 km
50 km
100 km

Simulation performed with Raytran, a 3D ray-tracing Monte-Carlo radiative transfer model;
Surface topography represented with ASTER DEM;
Sand reflectance is assumed Lambertian (0.3), i.e., BRF effects are only due to the topography.

Example of nadir-looking Raytransurface reflectance simulation over the 100 km × 100 km ROI acquired with a 250 m pixel resolution CCD camera for a sand reflectance value of 0.3
SZA = 50o
SAA = 270o
The ROI size has limited impact on the mean reflectance value

Sand reflectance = 0.3
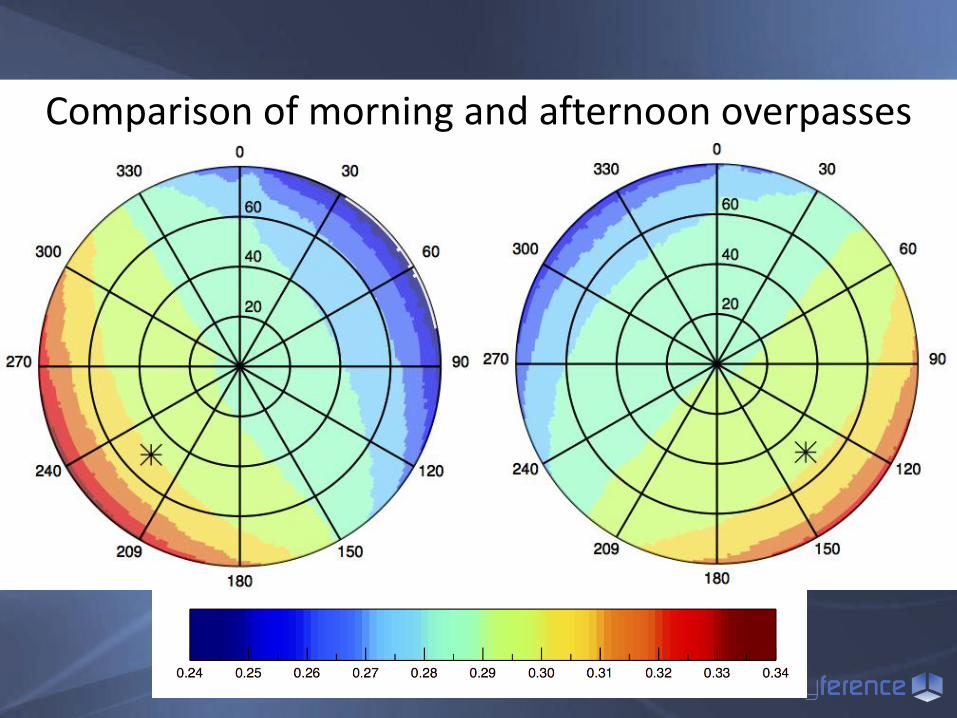
Comparison of morning and afternoon overpasses

Raytran surface reflectance simulation in the principal plane over the 20 × 20 km ROI for SZA = 50◦.
Morning pass : solid line Afternoon pass : dashed line

SAA 135 − 225 RELATIVE DIFFERENCE
−60 −40 −20 0 20 40 60FORWARD VIEWING ANGLE IN THE PRINCIPAL PLANE BACKWARD
−4
−2
0
2
4BR
F R
ELA
TIV
E D
IFFER
EN
CE (%
)
Surface reflectance relative difference in the principal plane between morning and afternoon overpasses
soliddashed
ROI : 10 km 20 km 50 km 100 km

The new required RTM accuracy driven by vicarious calibration of Sentinel satellites better than 3% will necessitate the development of a new generation of RTM:
Non flat earth;
3D effects of any complexity and scales;
Accurate simulation over land surfaces, water bodies and atmospheric media;
Full radiative coupling between these media;
Polarization and IR emission;
Moon.

The major simulated TOA BRF differences between RTMs over Libya-4 are due to the way gas transmittance is handled;
In the 350nm – 500nm spectral interval, the exact contribution of polarization is yet to be estimated;

Analysis of the effects of sand dune ridge alignments and ROI size on surface BRF over CEOS PICS Libya-4;
3D scene construction relies on the 30-m resolution ASTER DEM;
ROI size has a pretty limited impact on the mean BRF averaged over a large number of illumination and viewing conditions;
50 km ROI has the most homogeneous surface reflectance.

Relative difference of surface reflectance in the principal plane between morning and afternoon illumination can exceed 1%;
It is recommended to account for these effects when comparing these two illumination conditions with a required accuracy better than 3%;
Future works should include sand BRF for accurate TOA BRF simulations et would necessitate the development of a new generation of RTM.