youth score index - unicef
TRANSCRIPT

Youth SCORE Index Republic of Moldova
Secondary data analysis report
November 2019
Youth SCORE Index: Republic of Moldova
2
Contents ACRONYMS .................................................................................................................................. 4 GLOSSARY ................................................................................................................................... 4 Executive summary ......................................................................................................................... 9 Background ................................................................................................................................... 10 Methodology and sample .............................................................................................................. 11
Terminology .............................................................................................................................. 12 Key findings .................................................................................................................................. 13 Overall conclusions and recommendations .................................................................................. 16 Chapter 1: Constructive citizenship .............................................................................................. 22
1.1 Active citizenship ................................................................................................................ 23 1.2 Motivation to participate in decision-making ..................................................................... 25 1.3 Constructive citizenship ...................................................................................................... 28 1.4 Comparison with the Adult sample. .................................................................................... 30
Chapter 2: Reversal of brain drain and emigration trends ............................................................ 32 2.1 Emigration Tendency .......................................................................................................... 32 2.2 Comparison with the Adult sample ..................................................................................... 36
Chapter 3: Openness towards outgroups ....................................................................................... 38 3.1 Trust towards outgroups ...................................................................................................... 39 3.2 Negative feelings towards outgroups .................................................................................. 41 3.3 Openness towards outgroups ............................................................................................... 44 3.4 Comparison with the Adult sample ..................................................................................... 47
Chapter 4: Sharing a human rights ethos ...................................................................................... 51 4.1 Overall support for human rights ........................................................................................ 52
4.3 Belief in the universality of human rights ........................................................................... 63 4.4 Sharing human rights ethos ................................................................................................. 65 4.5 Comparison with the Adult sample ..................................................................................... 66
Chapter 5: Support for gender equality and inclusion .................................................................. 68 5.1 Support for women in political positions ............................................................................ 69 5.2 Belief in female inferiority .................................................................................................. 71 5.3 Negative attitudes towards women's participation in workforce ........................................ 71 5.4 Support for gender equality and inclusion .......................................................................... 75 5.5 Comparison with the Adult sample ..................................................................................... 77
Youth SCORE Index: Republic of Moldova
3
ANNEX ......................................................................................................................................... 80 Violence Against Children ........................................................................................................ 81 Access To Information .............................................................................................................. 85 Education ................................................................................................................................... 91
Mental Health And Self-Esteem ............................................................................................... 99 Trust In Institutions ................................................................................................................. 105 Tolerance ................................................................................................................................. 112
View About Future Of The Country ....................................................................................... 116 Human Rights .......................................................................................................................... 123 Aspirations For The Future ..................................................................................................... 129 Participation ............................................................................................................................ 137 Gender ..................................................................................................................................... 141 Parenting .................................................................................................................................. 149

Youth SCORE Index: Republic of Moldova
4
ACRONYMS EU European Union HE Higher Education NGO Non-Governmental Organisation SCORE Social Cohesion and Reconciliation UE University Education UNDP United Nations Development Program UTAG Unitatea Teritorială Autonomă Găgăuzia
GLOSSARY
Indicator Indicator Description
Support for human rights The degree to which one recognizes and believes human rights and civil rights as essential, optional or unnecessary.
Perception that gender equality is achieved
The degree to which one believes that gender equality has been achieved, and discrimination against women has been eradicated.
Support for women in political positions
The degree to which one believes there should be more women in political positions.
Negative attitudes towards women's participation in workforce
The level of discrimination and bias that women face in the job market, such as the prejudice that women should only have delicate jobs (e.g. nurse, secretary, teacher), or that they should quit their jobs to look after children.
Quality of life
The degree to which a person feels active, relaxed and in good spirits in their daily life.
Life satisfaction The degree to which a person feels satisfied with their life overall. Neglect
The degree to which one feels that their needs in terms of clothing, food and health were neglected by their family or caretakers.
Academic aspiration The degree to which one aims to pursue highest academic degree/training. Academic performance Evaluation of one’s own school performance in subjects such as mathematics,
history, and science. Access to information about healthy lifestyles
The degree to which one can access information to learn about healthy ways of living at school.
Access to services and infrastructure
Satisfaction with provision of heating, drinking water, electricity, the Internet and medical services.
Active citizenship Willingness to use all political and social means of action, excluding violence, to further one’s own end.
Aggression The degree to which one is aggressive in daily life, such as frequently getting into fights and confrontations.
Ambitious traits The degree to which one strives to be successful, in charge of things and impress other people.
Anxiety The degree to which one feels anxious and insecure to an extent that the person finds it hard to stop worrying and relax.
Youth SCORE Index: Republic of Moldova
5
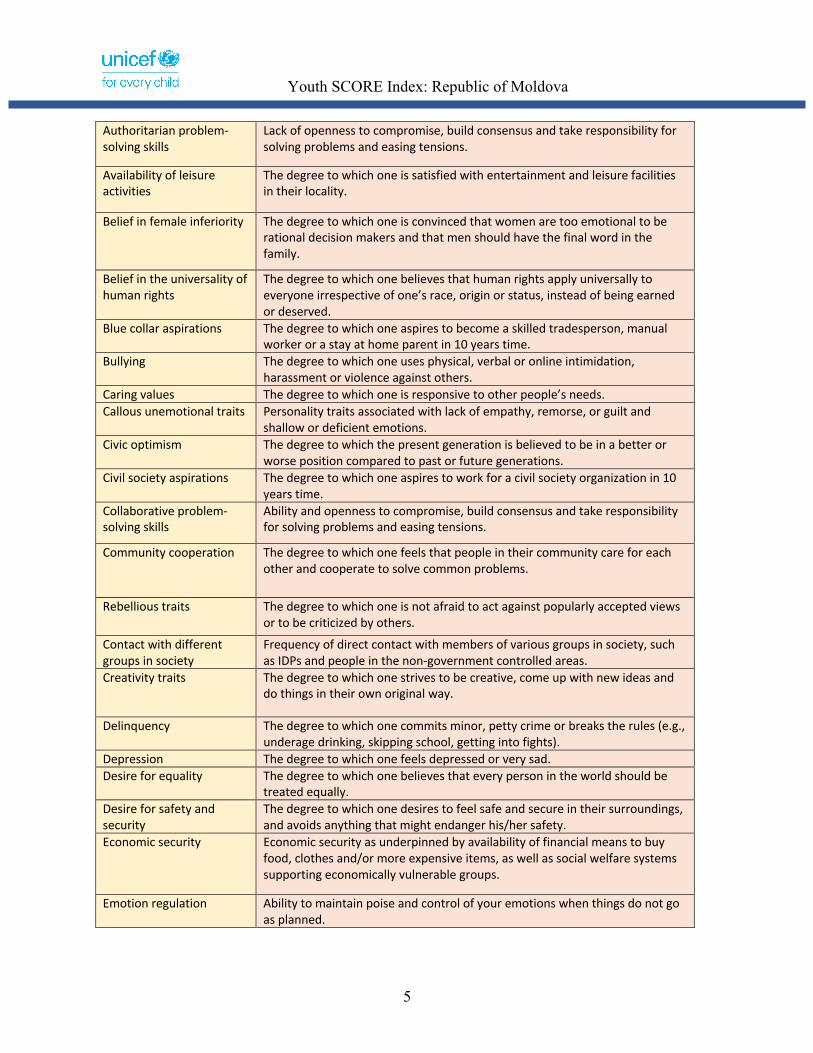
Authoritarian problem-solving skills
Lack of openness to compromise, build consensus and take responsibility for solving problems and easing tensions.
Availability of leisure activities
The degree to which one is satisfied with entertainment and leisure facilities in their locality.
Belief in female inferiority The degree to which one is convinced that women are too emotional to be rational decision makers and that men should have the final word in the family.
Belief in the universality of human rights
The degree to which one believes that human rights apply universally to everyone irrespective of one’s race, origin or status, instead of being earned or deserved.
Blue collar aspirations The degree to which one aspires to become a skilled tradesperson, manual worker or a stay at home parent in 10 years time.
Bullying The degree to which one uses physical, verbal or online intimidation, harassment or violence against others.
Caring values The degree to which one is responsive to other people’s needs. Callous unemotional traits Personality traits associated with lack of empathy, remorse, or guilt and
shallow or deficient emotions. Civic optimism The degree to which the present generation is believed to be in a better or
worse position compared to past or future generations. Civil society aspirations The degree to which one aspires to work for a civil society organization in 10
years time. Collaborative problem-solving skills
Ability and openness to compromise, build consensus and take responsibility for solving problems and easing tensions.
Community cooperation The degree to which one feels that people in their community care for each other and cooperate to solve common problems.
Rebellious traits The degree to which one is not afraid to act against popularly accepted views or to be criticized by others.
Contact with different groups in society
Frequency of direct contact with members of various groups in society, such as IDPs and people in the non-government controlled areas.
Creativity traits The degree to which one strives to be creative, come up with new ideas and do things in their own original way.
Delinquency The degree to which one commits minor, petty crime or breaks the rules (e.g., underage drinking, skipping school, getting into fights).
Depression The degree to which one feels depressed or very sad. Desire for equality The degree to which one believes that every person in the world should be
treated equally. Desire for safety and security
The degree to which one desires to feel safe and secure in their surroundings, and avoids anything that might endanger his/her safety.
Economic security Economic security as underpinned by availability of financial means to buy food, clothes and/or more expensive items, as well as social welfare systems supporting economically vulnerable groups.
Emotion regulation Ability to maintain poise and control of your emotions when things do not go as planned.
Youth SCORE Index: Republic of Moldova
6
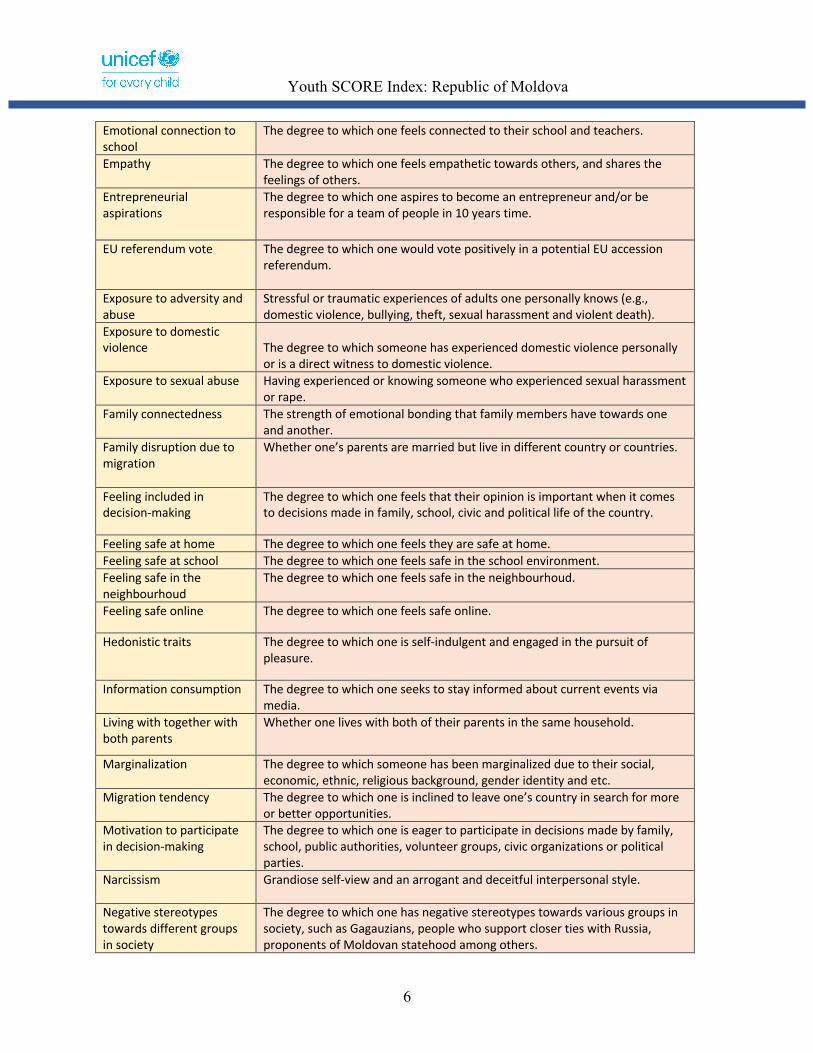
Emotional connection to school
The degree to which one feels connected to their school and teachers.
Empathy The degree to which one feels empathetic towards others, and shares the feelings of others.
Entrepreneurial aspirations
The degree to which one aspires to become an entrepreneur and/or be responsible for a team of people in 10 years time.
EU referendum vote The degree to which one would vote positively in a potential EU accession referendum.
Exposure to adversity and abuse
Stressful or traumatic experiences of adults one personally knows (e.g., domestic violence, bullying, theft, sexual harassment and violent death).
Exposure to domestic violence
The degree to which someone has experienced domestic violence personally or is a direct witness to domestic violence.
Exposure to sexual abuse Having experienced or knowing someone who experienced sexual harassment or rape.
Family connectedness The strength of emotional bonding that family members have towards one and another.
Family disruption due to migration
Whether one’s parents are married but live in different country or countries.
Feeling included in decision-making
The degree to which one feels that their opinion is important when it comes to decisions made in family, school, civic and political life of the country.
Feeling safe at home The degree to which one feels they are safe at home. Feeling safe at school The degree to which one feels safe in the school environment. Feeling safe in the neighbourhoud
The degree to which one feels safe in the neighbourhoud.
Feeling safe online The degree to which one feels safe online.
Hedonistic traits The degree to which one is self-indulgent and engaged in the pursuit of pleasure.
Information consumption The degree to which one seeks to stay informed about current events via media.
Living with together with both parents
Whether one lives with both of their parents in the same household.
Marginalization The degree to which someone has been marginalized due to their social, economic, ethnic, religious background, gender identity and etc.
Migration tendency The degree to which one is inclined to leave one’s country in search for more or better opportunities.
Motivation to participate in decision-making
The degree to which one is eager to participate in decisions made by family, school, public authorities, volunteer groups, civic organizations or political parties.
Narcissism Grandiose self-view and an arrogant and deceitful interpersonal style.
Negative stereotypes towards different groups in society
The degree to which one has negative stereotypes towards various groups in society, such as Gagauzians, people who support closer ties with Russia, proponents of Moldovan statehood among others.
Youth SCORE Index: Republic of Moldova
7
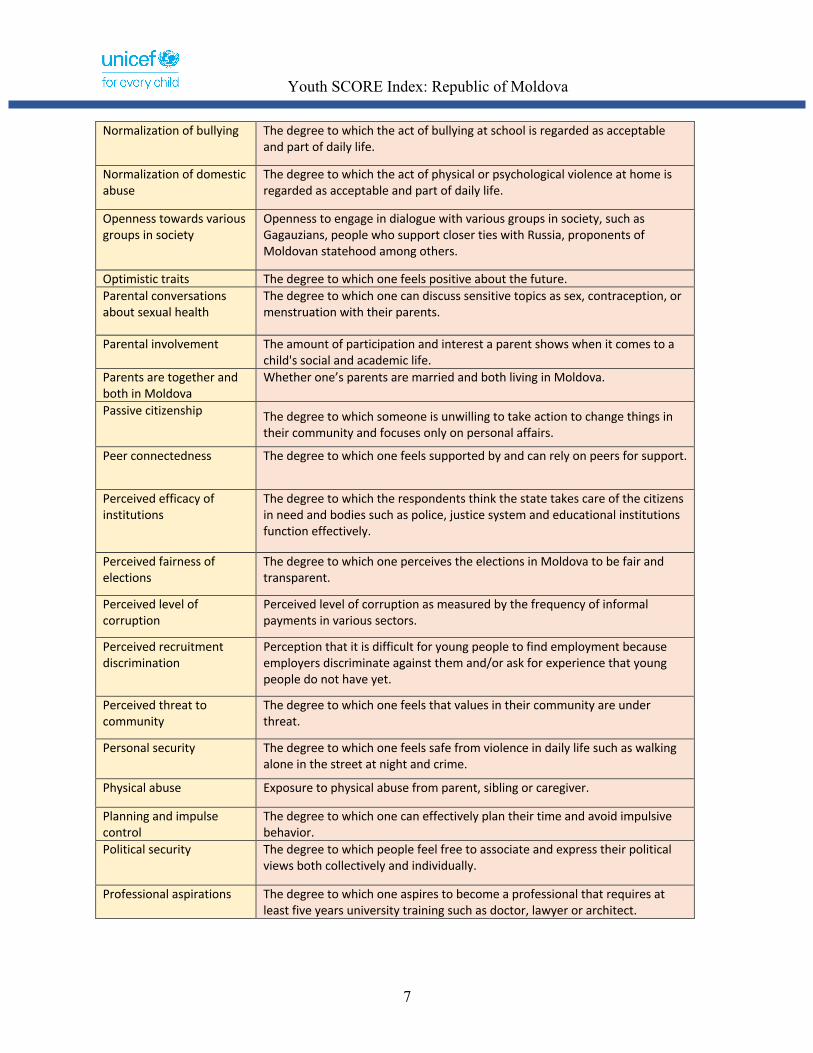
Normalization of bullying The degree to which the act of bullying at school is regarded as acceptable and part of daily life.
Normalization of domestic abuse
The degree to which the act of physical or psychological violence at home is regarded as acceptable and part of daily life.
Openness towards various groups in society
Openness to engage in dialogue with various groups in society, such as Gagauzians, people who support closer ties with Russia, proponents of Moldovan statehood among others.
Optimistic traits The degree to which one feels positive about the future. Parental conversations about sexual health
The degree to which one can discuss sensitive topics as sex, contraception, or menstruation with their parents.
Parental involvement The amount of participation and interest a parent shows when it comes to a child's social and academic life.
Parents are together and both in Moldova
Whether one’s parents are married and both living in Moldova.
Passive citizenship The degree to which someone is unwilling to take action to change things in their community and focuses only on personal affairs.
Peer connectedness The degree to which one feels supported by and can rely on peers for support.
Perceived efficacy of institutions
The degree to which the respondents think the state takes care of the citizens in need and bodies such as police, justice system and educational institutions function effectively.
Perceived fairness of elections
The degree to which one perceives the elections in Moldova to be fair and transparent.
Perceived level of corruption
Perceived level of corruption as measured by the frequency of informal payments in various sectors.
Perceived recruitment discrimination
Perception that it is difficult for young people to find employment because employers discriminate against them and/or ask for experience that young people do not have yet.
Perceived threat to community
The degree to which one feels that values in their community are under threat.
Personal security The degree to which one feels safe from violence in daily life such as walking alone in the street at night and crime.
Physical abuse Exposure to physical abuse from parent, sibling or caregiver.
Planning and impulse control
The degree to which one can effectively plan their time and avoid impulsive behavior.
Political security The degree to which people feel free to associate and express their political views both collectively and individually.
Professional aspirations The degree to which one aspires to become a professional that requires at least five years university training such as doctor, lawyer or architect.

Youth SCORE Index: Republic of Moldova
8
Prosocial values Engaging in voluntary social behaviors intended to benefit others or society as a whole such as helping, sharing, protecting and volunteering.
Psychological abuse Exposure to psychological abuse from parent, sibling or caregiver.
PTSD Experiencing persistent mental and emotional stress that is triggered after exposure to a traumatic or dangerous event.
Readiness for political violence
Propensity to use violent means to achieve political change.
Religiosity The degree to which one's religious denomination and practices are important to them.
Risky sexual behavior Inclination to engage in unprotected sex with multiple partners. Satisfaction with the education system
The degree to which one thinks that education institutions adequately prepare young people for higher education and the labor market.
School dropout tendency The degree to which one is inclined to dropout of school or discontinue their studies.
Self-confidence Being satisfied with one’s self and having confidence in one’s abilities.
Self-harm The degree to which one has tendencies to self-harm.
Social tolerance The degree to which one is tolerant towards different groups (e.g. Muslims, Jews, Roma) in terms of personal interaction and/or acceptance in the community.
Socio-Demographic Status Risk Index
This is a composite scale that combines demographic indicators that can help identify high-risk groups. This scale combines house over-crowdedness, family income, nuclear family and education of parents.
Strength of national self-identification
The degree to which one feels proud to belong to a particular ethnic/national group and finds this identity important.
Substance use Frequency of tobacco, alcohol or drug use.
Suicidality Thoughts of and attempts to injure oneself or committing suicide.
Support for husbands’ involvement with housework
Supporting the belief that husbands should help with housework and taking care of children, and share responsibilities.
Support for linguistic diversity The degree to which one believes that linguistic differences enrich Moldova.
Support for Romanian language use in education
Level of support for Romanian language to be the primary language used in schools.
Support for sexual health education
The degree to which one believes that young people should have access to reproductive health education at schools.
Support for women's reproductive rights
Level of support for women to have the right to take their own decisions about sexual and reproductive health.
Youth SCORE Index: Republic of Moldova
9
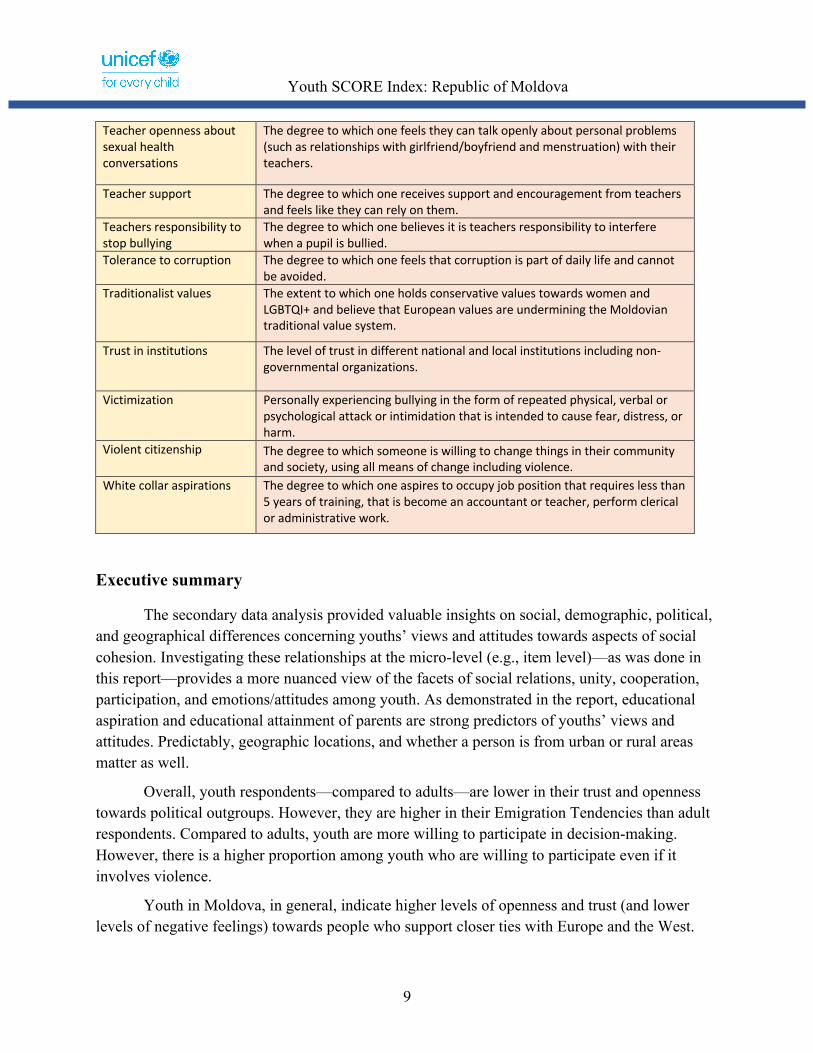
Teacher openness about sexual health conversations
The degree to which one feels they can talk openly about personal problems (such as relationships with girlfriend/boyfriend and menstruation) with their teachers.
Teacher support The degree to which one receives support and encouragement from teachers and feels like they can rely on them.
Teachers responsibility to stop bullying
The degree to which one believes it is teachers responsibility to interfere when a pupil is bullied.
Tolerance to corruption The degree to which one feels that corruption is part of daily life and cannot be avoided.
Traditionalist values The extent to which one holds conservative values towards women and LGBTQI+ and believe that European values are undermining the Moldovian traditional value system.
Trust in institutions The level of trust in different national and local institutions including non-governmental organizations.
Victimization Personally experiencing bullying in the form of repeated physical, verbal or psychological attack or intimidation that is intended to cause fear, distress, or harm.
Violent citizenship The degree to which someone is willing to change things in their community and society, using all means of change including violence.
White collar aspirations The degree to which one aspires to occupy job position that requires less than 5 years of training, that is become an accountant or teacher, perform clerical or administrative work.
Executive summary
The secondary data analysis provided valuable insights on social, demographic, political, and geographical differences concerning youths’ views and attitudes towards aspects of social cohesion. Investigating these relationships at the micro-level (e.g., item level)—as was done in this report—provides a more nuanced view of the facets of social relations, unity, cooperation, participation, and emotions/attitudes among youth. As demonstrated in the report, educational aspiration and educational attainment of parents are strong predictors of youths’ views and attitudes. Predictably, geographic locations, and whether a person is from urban or rural areas matter as well.
Overall, youth respondents—compared to adults—are lower in their trust and openness towards political outgroups. However, they are higher in their Emigration Tendencies than adult respondents. Compared to adults, youth are more willing to participate in decision-making. However, there is a higher proportion among youth who are willing to participate even if it involves violence.
Youth in Moldova, in general, indicate higher levels of openness and trust (and lower levels of negative feelings) towards people who support closer ties with Europe and the West.
Youth SCORE Index: Republic of Moldova
10
When it comes to tolerance among youth, the highest level of tolerance is towards people with a different colour of skin. Youths’ lowest level of tolerance is (by far) towards drug addicts.
In general, older respondents (ages 16-18, compared to ages 14-15) and youth from urban areas (compared to rural areas) express greater overall support for human rights. The same is true for females, and youth with higher parental education or higher educational ambitions.
Background
The SCORE Index is an innovative analytical tool designed to measure society’s level of social cohesion. SCORE was originally developed in Cyprus by the United Nations Development Programme (UNDP) and the Centre for Sustainable Peace and Democratic Development1. SCORE has been implemented in Cyprus, Bosnia-Herzegovina, Liberia, Ukraine, Nepal, and Moldova. Evidence collected through the SCORE is used to design specific programmes aimed at strengthening social cohesion and transforming society towards a peaceful and sustainable development.
SCORE assesses five key elements that make up social cohesion:
1. Intergroup Relations: negative stereotypes, social threats, discrimination.
2. Community Cohesion: intergroup anxiety, social, and cultural distance.
3. Psychological Functioning: level of social support, social skills, empathy, self-regulation, aggression.
4. Economic Opportunities: economic security, a satisfaction of basic needs, vocational skills, entrepreneurship.
5. Governance and Participation: quality of service delivery, civic life satisfaction, freedom from corruption, trust in institutions, political security, constructive civic engagement.
The national representative survey that supported the definition of the SCORE Youth Index was conducted in Moldova with UN support in 2016-2018 separately for adults and youth. Key elements of the SCORE Index in Moldova, including that of SCORE Youth, focus on five key dimensions:
1. Constructive citizenship
2. Reversal of brain drain and emigration trends
3. Openness towards out-groups
4. Sharing a human rights ethos
5. Support for gender equality and inclusion
1 http://www.scoreforpeace.org/about

Youth SCORE Index: Republic of Moldova
11
The youth- and adolescent- focused SCORE Index also examined perceptions on discrimination and respect for diversity, issues of self-awareness and self-esteem, and the ability of youth to participate in decisions affecting their lives. The survey that supported the definition of the Youth SCORE Index also examined perceptions regarding equal access to quality education and employment opportunities, engagement in harmful health behaviors (e.g., alcohol and tobacco use), and levels of violence experienced at home, in school, and in the broader society.
This report focuses on findings from the secondary data analysis of the key five dimensions, followed by conclusions of the analysis of the 12 topics, which is presented in the Annex section. These 12 topics—each presented as separate thematic brief—are: (1) Violence Against Children; (2) Access to Information; (3) Education; (4) Mental Health and Self-Esteem; (5) Trust in Institutions; (6) Tolerance; (7) View about the future of the country; (8) Human Rights; (9) Aspiration for future; (10) Participation; (11) Gender, and; (12) Parenting.
Methodology and sample
This report presents findings from the secondary data analysis of the SCORE Youth Index survey, which covers ages 14 to 18. The data collection was conducted between March and April of 2018, and covered all regions of the country, excluding the Transnistrian region. Data was collected through Youth Friendly Health Centers and local Youth Councils in various districts of the Republic of Moldova. The Youth SCORE Moldova focuses on the five main dimensions, which are: (1) Constructive citizenship; (2) Reversal of brain drain and emigration trends; (3) Openness towards outgroups; (4) Sharing a human rights ethos, and; (5) Support for gender equality and inclusion. All five of these dimensions are obtained using the methods and approaches traditionally used in the SCORE index methodology. This allows comparisons of the findings and interpretations with the Adult sample and with earlier analyses. We mainly focus on investigating the relationships of these five dimensions with the demographic variables.
Statistical analysis. To obtain practical inferences from the data, we used statistical modeling approaches aimed at judging whether differences among demographic groups are substantive. When judging the significance of these differences, we used criteria that are traditionally used in social sciences. Sampling weights were used to adjust for an undersampling in some regions and an oversampling in other regions in the youth survey. Such sampling weights allowed downweighing respondents from Gagauzia (which was oversampled) and upweighing respondents from the Central and Northern regions (which were undersampled). These weights are 0.210 for the Chisinau region; 0.287 for the Northern region; 0.303 for the Central region; 0.143 for the Southern region; and 0.058 for the Gagauzia region.
Sample. The sample consisted of N=1,233 youth respondents, comprised of 53% females, and ages ranging from 14 through 18—with 21% of 14-year-olds; 19% of 15-year-olds;

Youth SCORE Index: Republic of Moldova
12
24% of 16-year-olds; 20% of 17-year-olds; and 16% of 18-year-olds. Of the respondents, 13% are from the Chisinau region; 21% represent the Northern region; 24% represent the Central region; 12% represent the Southern region, and; 30% represent the Gagauzia region.
Approximately 11% of respondents are from the capital city (either Chisinau or Comrat); 2% are from large towns (with 100,000 residents or more); 23% are from small towns (with less than 100,000 residents), and; 64% are from village/rural areas. The questionnaire was conducted in the Romanian language to 63% of the respondents and in Russian to the remaining 37% of the respondents.
Approximately 38% of the respondents had at least one of the parents with a higher education level, while 8% of respondents’ either of the parents had unfinished higher; 23% had secondary vocational; 15% had secondary academic, and; 9% had primary or unfinished secondary.
In the sample, 31% of respondents reported that they could afford a car or other goods of similar cost, when needed; 36% reported that they have enough money for household electronics or other expensive goods, but cannot afford a car or an apartment; 27% reported that they always have money for food and clothes, but we cannot always afford household electronics or other expensive goods; 6% reported that they have enough money for food, but are not always able to buy clothes; and slightly less than 1% reported that they lack money even for food.
Majority (69%) of the respondents reported that they live with both parents; 15% reported that they live with mother only; 4% with father only; 6% with grandparents only; 2% with other relatives; 2% reported that they live by themselves; and remaining reported that they live with guardians who are not family members (1%) or with sisters and brothers only (1%). Household size among the respondents ranged from 1 to 26, with average of 4.8, and about 90% being having six or less people in their household.
Terminology
Throughout the report, three terms that will feature relative more often are dimension, subdimension, and item. The term “dimension” will be used for the main five dimensions, which are (1) Constructive citizenship; (2) Reversal of brain drain and emigration trends; (3) Openness towards outgroups; (4) Sharing a human rights ethos, and; (5) Support for gender equality and inclusion.
In some cases, these dimensions are calculated directly from the responses to the survey questions. We will refer to these survey questions as “items.” In other cases, these dimensions are obtained not from the responses to the survey questions directly—but instead, summary

Youth SCORE Index: Republic of Moldova
13
scores for each of the themes are obtained first (by averaging across relevant items), which are then averaged to form a dimension. We will refer to such summary scores as “subdimensions.”
For example, Openness towards outgroups dimension is not calculated directly from responses to survey questions—but instead, we first calculate Trust and Negative feelings towards outgroups (which are directly obtained from responses to questions), and obtain Openness towards outgroups dimension by averaging these two. In this example, Openness towards outgroups is a dimension, and Trust and Negative feelings are two subdimensions. In contrast, Reversal of brain drain and emigration trends dimension is obtained directly from items (by averaging across items that make up the dimension).
Key findings Constructive citizenship. Compared to adults, youth are more willing to participate in
decision-making. However, a relatively higher proportion of youth (compared to adults) signaled their willingness to use all means, including violence to participate in decisions-making. Young people from rural areas expressed greater enthusiasm to participate in decision-making than their peers in urban areas. This difference is particularly notable in youths’ willingness to take part in decisions made by schools and public authorities. Higher participation by rural youth in local elections or in decisions made by public authorities is likely due to stronger and closer social and community ties.
Unsurprisingly, the majority of youth expressed their willingness to shape decisions within their own family or personal affairs. On the lower extreme, they were reluctant to take part in decisions made by political parties. In particular, there is a very low enthusiasm among youth in Moldova to participate in political decisions. This disinterest needs to be addressed, as it may result in lower voter participation (e.g., in presidential elections) when they reach the voting age. This may also be result of youths’ low trust in governmental institutions.
Youth from the UTAG region are less motivated to participate in decision-making (when compared to non-UTAG regions). This difference is more pronounced in youths’ participation in decisions at (1) volunteer groups and civic organizations; (2) school, and; (3) public authorities.
Reversal of brain drain and emigration trends. On average, youth respondents are substantively higher in their Emigration Tendencies than adult respondents. At the item level, this difference is mostly due to youths’ hope to leave Moldova at some point in the future, and their hope to work somewhere abroad. Among youth, two major elements that affect youths’ emigration tendencies are youths’ believe that (1) Moldova is not a good place to live and work, and (2) they cannot make a real difference if they stay in this country for the long term.
With respect to regional differences, youths from the UTAG region have lower tendencies to emigrate (compared to youth from the other four regions). This is likely—as
Youth SCORE Index: Republic of Moldova
14
discovered from the survey—because (1) their friends and family talk less often about making a better life somewhere else, and (2) relatively smaller proportion of their family members or friends emigrated somewhere else. Youths with higher parental education are substantively higher in their tendency to emigrate compared to youths from a family with lower educational attainment.
Openness towards out-groups. Moldova’s youths’ polarization is best manifested in the Openness towards outgroups dimension. Among youth, fewer people trust those who hold different (or opposite) political views. Youth in Moldova, in general, indicate higher levels of openness and trust (and lower levels of negative feelings) towards people who support closer ties with Europe and the West. This is followed by youths’ trust towards people who want to join Romania. However, there is a polarization among youth when it comes to openness, trust, and negative feelings towards political outgroups. Chiefly, youth who indicate higher levels of trust (or positive feelings) towards people living in Transnistria/Gagauzia, or towards people who support closer ties with Russia—on average—tend to indicate lower levels of trust towards people who support closer ties with Europe (and the West) or want to join Romania (and vice-versa).
Youths from the UTAG region are noticeably higher in their trust and openness (and positive feelings) towards people living in Transnistria, Gagauzia, and people who support closer ties with Russia. In contrast, youth from the non-UTAG regions are significantly higher (than youth from the UTAG region) in their trust and openness towards people who support closer ties with EU/West and people who want to join Romania.
Youth with higher educational aspirations, in general, express negative feelings towards political outgroups less often (compared to youth with lower educational ambitions). They are notably higher in their trust towards people who support closer ties with EU/West and who want to join Romania. However, they are also lower in their trust towards people who support closer ties with Russia (when compared with youth with lower educational attainment).
Overall, youth respondents—compared to adults—are lower in their trust and openness towards political outgroups. At the item level, youth (except for youth in Gagauzia) are less open towards people living in Transnistria, Gagauzia, and people who support closer ties with Russia. In contrast, youth (except for the youth in Gagauzia) are more open (than adults) towards people who want to join Romania. Youths and adults are somewhat similar in their level of openness towards people who support closer ties with EU/West. In general, older respondents (ages 16-18, compared to ages 14-15) and youth from urban areas (compared to rural areas) express greater overall support for human rights. The same is true for females, and youth with higher parental education or higher educational ambitions.
Sharing a human rights ethos. When it comes to supporting human rights, youth expressed the highest agreement with a statement that having a paid holiday for all workers must
Youth SCORE Index: Republic of Moldova
15
be enshrined in law. Their lowest agreement was with guaranteeing the freedom to change, practice, worship, and teach any religion. This particular item was also the one on which youth disagreed among themselves the most—signaling that young people on both sides of the argument feel strongly about it (i.e., there are a relatively smaller proportion of respondents who respond in the middle category).
When it comes to tolerance among youth, the highest level of tolerance is towards people with a different colour of skin. Youths’ lowest level of tolerance is (by far) towards drug addicts. Other minority groups that may be subject to stigmatization (in addition to drug addicts) are people with HIV or AIDS, people with non-traditional sexual orientation, and Roma. This suggests that any intervention attempts to reduce the social rejection of groups (by youth) need to prioritize reducing discrimination against these groups—as they are the ones who may be suffering the most. When compared to males, females are higher in their tolerance towards people with a non-traditional sexual orientation and (and towards people with physical or mental disabilities).
In the regional context, youths from the UTAG region do not differ from non-UTAG youth in the overall social tolerance. However, at the item level, youth from the UTAG region are substantively more tolerant towards Muslims and less tolerant towards people with non-traditional sexual orientation.
Parental education and educational aspirations are positively correlated with social tolerance. Age is also a factor—with social tolerance increasing by age. Moreover, youth from urban areas are more socially tolerant than youth from rural areas. This is specifically more pronounced in (1) tolerance towards Jews; (2) tolerance towards Roma; (3) tolerance towards people living with HIV or AIDS, and; (4) tolerance towards Muslims.
Compared to adults, youth are lower in overall support for human rights. The only exception to this is their opinion on having the freedom to change, practice, worship, and teach any religion—on which youth are more supportive of human rights. Moreover, youth are more socially tolerant (than adults) towards groups (except for tolerance towards people with physical or mental disabilities, in which adults are more tolerant).
Support for gender equality and inclusion. At the dimension level, youths are not markedly higher from adults in their support for gender equality and inclusion. However, when considered at the subdimension level, youth respondents are lower than adults in their support for women in political positions. Inversely, adults are less positive towards women’s participation in the workforce.
Females are more likely to suggest that there should be more women in political positions in Moldova. Moreover, support for women in political positions and gender equality is positively correlated with the educational aspirations of the youth and their parents’ educational attainment.

Youth SCORE Index: Republic of Moldova
16
An important factor in negative attitudes towards women’s participation in the workforce is manifested in youths’ perception that women should have more delicate jobs. This can be prioritized in reducing youths’ overall negative attitudes towards women’s participation. This is also a factor in the gap between youth from urban and rural areas (i.e., youth from urban areas are sizably more positive towards women’s participation in the workforce).
Overall conclusions and recommendations Youth in Moldova are not homogeneous and express a wide range of views and values on
various aspects of social cohesion. Therefore, it is less plausible to look for solutions that fit all youth. Social cohesion is challenging to build and easy to destroy. Nevertheless, there is a belief that social cohesion can be fostered using inexpensive self-monitoring and self-sanctioning mechanisms2. Focusing on micro-level changes using more elaborate, coherent, and targeted interventions—that takes into account Moldova’s history and geography—is an optimal approach.
The majority of the programmes suggested in the area of improving social cohesion rely on participatory interventions. Considering the focus on enhancing social cohesion among youth between ages 14-18, focusing on social institutions—where youth are members of—is ideal for any effort aimed at fostering social cohesion. The most obvious social institution is the school. Research shows that inclusive education systems mirror cohesive societies—meaning that in having an impact at the school level, especially for youth and as early as possible, is perhaps the most optimal strategy. Therefore, focusing on schools as the central channel, and implementing studies and experiments at schools to find what works, must be an integral part in attempts to foster social cohesion among youth in Moldova.
In addition to schooling channels, reaching out through families and social media are other promising ways for promoting social cohesion. Families and social media play an essential role in shaping youths’ views. With changing dynamics in how youth interact with information and considering easy access of Moldova’s youth to the internet—which is one of the fastest and cheapest in the world3—social media’s potential in educating and influencing the youth need to be exploited to the maximum extent. This is also important when considering the most efficient communication strategy. Authorities and political and local leaders can be encouraged to
2 Ostrom E., 1990. Governing the commons: the evolution of institutions for collective action. New York: Cambridge University Press; Wade, R., 1994. Village republics: economic conditions for collective action in South India. San Francisco: Institute for Contemporary Studies. 3 90% of the population has an option to subscribe to a gigabit plan, ranking 3rd in the world. https://web.archive.org/web/20160415032251/http://www.webhostingbuzz.com/blog/2011/03/28/history-of-internet-usage/ https://web.archive.org/web/20130602231649/http://www.netindex.com/value/

Youth SCORE Index: Republic of Moldova
17
communicate with youth effectively through social media to engage them in decision-making and to seek their input. From a more general perspective, Verhoeven (2008) notes that fostering social cohesion depends on communication and indicate that one-sided and asymmetrical communication results in the increase of the disintegration of society. This suggests that communication strategies and actions play a role in fostering social cohesion. This is particularly relevant to youth, as being able to select a proper communication strategy for youth is vital in ensuring that any intervention or messaging is interpreted as intended.
From a methodological perspective, when implementing interventions and programmes, the outcome measures should be based on indicators of dimensions of social cohesion. Such outcomes can either be attitudinal (e.g., feelings of trust), or behavioral (e.g., frequency of actions). There should be a pretest—a measure indicating pre-intervention situations—and posttest to measure the outcome after the intervention. When feasible, there should also be a control group—a group that does not receive any intervention but acts as a comparison group. Having a control/comparison group (e.g., “business as usual”) is particularly necessary to evaluate the effect of the intervention more rigorously before implementing it at a larger and more costly scale.
For any programme, special attention needs to be paid at the inclusivity of the programme itself—and attempts need to be made to eliminate the selection/participation bias. Social intervention may, in some cases, focus on those who are easiest to reach, such as those in and around the capital—which in turn increases inequality. Therefore, sufficient opportunities for youth in remote regions of Moldova need to be created as well, and programmes should avoid targeting specific group of youth (e.g., such as NGO members) unless they are the target of the intervention.
Constructive citizenship. It will be useful to find out reasons for youths’ lower interest to participate in decisions related to anything other than their families. One potential reason: the need for youth to work/generate income, which limits their time to participate in decisions that affect them. In rural areas, in some aspects, youth seem more willing to participate. It will be instructive to investigate further (e.g., to interview the study participants from rural and urban areas, if possible) to understand the context that makes the rural youths’ participation higher—and whether those conditions are feasible in urban or suburban areas.
Moreover, interventions and programmes aimed at channeling youths’ enthusiasm for participation towards nonviolent forms of involvement—away from potentially violent forms of participation—can benefit youth in Moldova. Youth from UTAG is particularly low on their willingness to volunteer and engage with civic organizations or public authorities. An optimal way to reduce the overall gap in participation between UTAG and non-UTAG regions would be by focusing on overcoming gaps in these specific aspects of civic engagement. As part of youths’

Youth SCORE Index: Republic of Moldova
18
civic engagement, volunteerism and involvement in local organisations can be (and should be) promoted in the UTAG region—by creating opportunities to volunteer.
Reversal of brain drain and emigration trends. Among youth in Moldova, family and friends are the two major influences that shape youths’ opinions on emigration. It is estimated that most schoolchildren and almost all university students expect to leave the country to find work. Recent (2018) statistic shows that Moldova’s net migration rate is -9.3 migrant(s)/1,000 population, which is among the lowest in the world. The net migration rate indicates a difference between the number of persons entering and leaving a country during the year per 1,000 persons. Findings from this survey have shed light on some potential root causes of this trend. The main reason for this is that young people don’t envision the future for themselves in Moldova. This challenge is difficult to address with programmes and interventions at the micro-level, and a more holistic approach—that involves all relevant stakeholders—is necessary.
If feasible, it may be informative to dig deeper and conduct an additional study to better understand the nuanced dynamics and driving forces behind different profiles of emigration tendencies. In particular, among youth, we need to know more about (1) youth who want to study abroad and return to their parents, and; (2) youth whose primary interest is to study or work abroad and stay there. It will also be instructive to find out additional motivations of youth who want to work overseas—for example, whether to earn money and come back to invest in Moldova, or whether to earn money to support their family. Among those who returned to Moldova after getting an education abroad, it will be instructive to understand their motivations and reasons for returning.
High emigration and brain drain that Moldova is experiencing results in outcomes such as insufficient intellectual capital in the country. This, in turn, leads to less push for change within the country (i.e., lower participation in political decisions) by youth—which is also related to the reduced trust. Young people have a vital role in improving social cohesion, and emigration trends and brain drain are among the main barriers to it.
Openness towards out-groups. European Committee for Social Cohesion (2004) and the Council of Europe (2011) describe social cohesion as the ability of the society to provide and protect their citizens’ welfare by reducing polarization. Polarization in Moldova, and a sharp contrast between the regions when it comes to youths’ sentiments towards political subgroups pose a risk to social cohesion. Programmes and interventions aimed at reducing such polarization—by promoting acceptance of others’ views—require an elaborate approach that considers specific findings detailed in this report. Openness, trust, and negative attitudes towards political outgroups are the subdimensions in which the youth in Moldova is most polarized.
In Moldova, with its youth having diverse and differing political views, encouraging openness and trust is a crucial requirement for having a more socially cohesive youth. It is believed that group cooperation—by participating in collective decision-making—brings actors

Youth SCORE Index: Republic of Moldova
19
with opposing views closer. Youth in Moldova needs to learn to devote energy to group activities, and to participate in group decision-making, have a general sense of trust in others so that intergroup or communal cooperation is something they are comfortable with. Youth centers can be beneficial in that aspect—since creating shared spaces is vital for fostering social cohesion. One example of a model intervention4 are Search and Better Together projects, which focused on arts as a tool for youth to communicate and understand each other. In the Better Together project, young Lebanese, Syrian, and Palestinian artists taught other youth leaders to express themselves through arts and to work together towards advancing change in their community. In general, females are higher in their openness towards political outgroups than males—indicating that males, on average, are the ones contributing to the polarization relatively more.
Sharing a human rights ethos. The ethnic or group-based hierarchy seems to manifest itself among Moldovan youth. Programmes designed to address processes and mechanisms of discrimination and exclusion is expected to produce positive outcomes on youths’ human rights ethos. In working towards socially cohesive youth in Moldova—which consists of diverse social groups due its unique geographic location and historical context—it is necessary to motivate youth to recognize and value diversity. Research conducted across 13 countries5 showed that positive outcomes are achieved when the youth are integrated into both a minority community (e.g., maintaining their attachment to their cultural background) and the mainstream society.
Schooling of youth is key to building their sense of belonging to the society, and inclusive schooling will increase participation of youth from disadvantaged groups in Moldova. Therefore, inclusive education programmes will benefit traditionally disadvantaged social groups such as Roma youth—who experience outright discrimination. Roma Education Fund (2004) reports that the drop-out rate of Roma students is six times higher than non-Roma students across Eastern Europe—which results in a 50 to 80 percent unemployment rate in some regions. Inclusive education aimed at eliminating discrimination at various levels should acknowledge Roma culture as well. Successful initiates that implemented optional classes aimed at fostering social tolerance—such as Roma NGO Amalipe6 can be used as models or partners. Beyond youths’ school life, a different kind of initiative related to youth engagement and social cohesion—aimed to broaden youths’ opportunities for participation in social life7—was conducted in Turkey and may serve as a good model.
Youth from urban areas are more socially tolerant and express greater overall support for human rights than youth from rural areas. This finding is consistent with the literature—as
4 https://www.sfcg.org/wp-content/uploads/2018/06/Building-social-cohesion-in-conflict-affected-communities.pdf 5 Berry, John; Phinney, Jean; Sam, David & Vedder, Paul. (2006). Immigrant youth: acculturation, identity, and adaptation. Applied Psychology: An International Review, 55, 303-332 6 http://amalipe.com/index.php?nav=program&id=4&lang=2 7 https://www.unicef.org/turkey/en/adolescent-engagement-and-social-cohesion
Youth SCORE Index: Republic of Moldova
20
urbanization is believed to be beneficial for regional cohesion. This is also explained by the fact that urban spatial structures offer more opportunities for building social networks and civic participation.
Research shows that parents’ social networks are central in shaping with whom their children socialize and interact. Therefore, any programme done at this level should consider families as important actors that likely moderates or mediates the effect of the intervention on youth. Conducting a dialogue process and raising awareness to eliminate root causes of the negative attitudes towards outgroups—such as people with HIV or AIDS, people with non-traditional sexual orientation, or Roma—likely to have a greater effect on youth if their families or friends are have a role to play. Schools and teachers can be included as well, as a research8 shows that face-to-face interaction in public school systems is a more promising way to addressing out-group perceptions.
One specific area that also needs to be addressed is the freedom to change, practice, worship, and teach any religion. This is a somewhat controversial issue among youth in Moldova. Firstly, if feasible, additional investigation needs to be conducted to pinpoint the exact point of contention: is the issue with the freedom to (1) change, or (2) practice, or (3) teaching religion? Secondly, there are more nuanced and diagnostic tools for measuring attitudes towards religious and worldview diversity—explicitly aimed at youth—which can be used9.
Support for gender equality and inclusion. A significant predictor of social cohesion among youth is their view of gender equity within the society. Old beliefs and practices—such as women being viewed as wives and mothers—serve as both barriers towards increasing social cohesion. Such views are, unsurprisingly, more common among male youth in Moldova. Relevant interventions can be implemented at the school level. Such interventions should aim to transform schools into the area of equality and inclusion. Specifically, teachers can be trained to recognize stereotypical gender beliefs and can be trained in addressing them. Besides, engagement of mothers, and women in general, to promote positive models built around success through employment may lead to positive outcomes on that aspect.
Moreover, in coordination with stakeholders from the education communities, reflecting on the function of the teachers (who are the central agents of change when it comes to youth’s education) and their role in fostering moral and ethical values, especially regarding issues related to gender discrimination, will be fruitful. It also important to support teachers in becoming agents of social cohesion (e.g., professional development aimed at increasing students’ openness towards outgroups).
8 Larsen (2013) 9 Freely available from https://etfrp.univie.ac.at/en/about-us/staff/sabine-hermisson/ Disclaimer: the measurement tool was developed and validated by Hermisson, Gochyyev, and Wilson (2018).
Youth SCORE Index: Republic of Moldova
21
Women are at a disadvantage in terms of their education, wealth, and well-being in comparison to men across the world—and Moldova is not an exception. Beyond teachers, some successful programmes such as Girl’s Education Initiative10—which has implemented interventions in Egypt aimed at creating girl-friendly bathrooms (for their safety and access) can be used as models as well.
The social cohesion is strongly related to educational outcomes. Youth’s schooling affects their social cohesion since, through schooling, they receive support and tools to develop social skills and build relationships with peers. One of the relevant findings in the literature11 indicates that educational outcomes (such as grades, test scores) are better in schools where teachers knew students’ parents or when parents knew their children’s teachers—meaning that both parents and teachers were part of students’ networks. Interventions aimed at increasing parents’ engagement in their child’s schooling, or promoting teachers to meet their students’ parents, may result in positive outcomes in youths’ social cohesion. Intergenerational communication in schools, one example of which is career days (i.e., where parents share their careers with students), may serve as instances to have a positive impact on social participation. Gamoran and colleagues12 reported the positive effects of the Families and Schools Together (FAST) Program—which was designed to develop relations of trust and shared expectations among parents, school staff, and children. The program improved children’s outcomes, specifically related to behavioral problems. Of 100 schools, half participated in the FAST program, and the other half were used as a control group.
The knowledge index is among the strongest predictor of social cohesion13. Therefore, it is no surprise that Moldova’s youths’ educational aspirations, or their parents’ education level, play an important role in their support for gender equality and inclusion and their human rights ethos.
All stakeholders—such as authorities and civil society groups—need to be involved in fostering social cohesion among youth in Moldova. Although programmes and intervention are mostly executed at local/regional levels and at a relatively smaller scale—it is important that at the government level, entities such as Ministry for Youth and Sport, view youth-specific policies as being applicable across all sectors (ranging from health and employment, to education and security).
10 http://moushirakhattab.com/publication/view/the-girls-education-initiative-in-egypt/ 11 Coleman, James S. (1988) “Social Capital in the Creation of Human Capital.” American Journal of Sociology 94:S95-S120. 12 Gamoran, A., Lopez-Turley, R., Turner, A., & Fish, R. (2012, May). Social capital and inequality in child development: First year findings from an experimental study. 13 Dragolov et al., 2016: Dragolov, G., Ignácz, S., Lorenz, J., Delhey, J. & Boehnke, K. Social cohesion radar: Measuring common ground. An international comparison of social cohesion. Gütersloh: Bertelsmann Stiftung, (2013a).

Youth SCORE Index: Republic of Moldova
22
Chapter 1: Constructive citizenship
The Constructive citizenship dimension is computed by averaging two subdimensions, which are: (1) Active citizenship, and; (2) Motivation to participate in decision-making. The country-level youth average in the Constructive citizenship dimension among young people 6.3, and the averages for the Chisinau, Northern, Central, Southern, and Gagauzia are 6.2, 6.2, 6.7, 5.7, and 5.6 respectively.
At the subdimension level, the country-level youth youth average for the Active citizenship subdimension is 6.8, and the averages for the Chisinau, Northern, Central, Southern, and Gagauzia regions are 7.1, 6.8, 7.1, 6.2, and 6.5 respectively.
The country-level youth youth average for the Motivation to participate in decision-making subdimension is 5.8, and the averages for the Chisinau, Northern, Central, Southern, and Gagauzia regions are 5.3, 5.7, 6.3, 5.3, and 4.7 respectively. These averages are shown in Figure 1.1.
This chapter is organized as follows:
Section 1.1: A closer look at Active citizenship
Figure 1.1. Averages for the Constructive citizenship dimension and relevant subdimensions by regions.
6.2 6.26.7
5.7 5.66.3
7.16.8 7.1
6.2 6.56.9
5.35.7
6.3
5.34.7
5.8
0.0
1.0
2.0
3.0
4.0
5.0
6.0
7.0
8.0
9.0
10.0
Chisinau Northern Central Southern Gagauzia Total
Constructive citizenship by region
Constructive citizenship Active citizenship Motivation to participate in decision-making

Youth SCORE Index: Republic of Moldova
23
Section 1.2: A closer look at Motivation to participate in decision-making Section 1.3: Comparison with the Adult sample
1.1 Active citizenship
1.1.1 Structure of the subdimension
This subdimension is obtained based on a single item that is directed at measuring whether young people are eager to use civic and social means of action while avoiding any kind of violence. They were presented with three response options—shown in Table 1.1—and were asked to select one. Those who chose the second option were categorized as Active citizens—since they are the ones who are keen to take action while avoiding violence.
Which of the following are you willing to do, to change the current conditions in your community or in society more generally?
Table 1.1 Active citizenship item from the Youth survey. I am not willing to do anything; I would just stay focused on my own personal and domestic affairs 1
I am willing to use civic and social means of action but definitely avoid any kind of violence 2
I am willing to use all means of change available to me, including violence if necessary 3
Of the respondents, 68.6% are judged as Active citizens (i.e., selected the second option), while 14.5% selected the first option, and 16.9% selected the third option. The distribution of demographic groups by three categories is summarized in Table 1.2.
Table 1.2 Active citizenship item by demographic variables.
(1) I am not willing to do anything; I would just stay focused on my own personal and domestic affairs
(2) I am willing to use civic and social means of action but definitely avoid any kind of violence
(3) I am willing to use all means of change available to me, including violence if necessary
Male 17.4% 67.1% 15.5% Female 12.0% 69.9% 18.2% non-UTAG 13.4% 68.9% 17.7% UTAG 26.3% 64.8% 8.9% Rural 15.3% 68.2% 16.5% Urban 13.1% 69.3% 17.6% Parents without HE 17.0% 64.6% 18.4% Parents with HE 12.7% 70.4% 16.9% Do not intend UE 26.8% 58.7% 14.5%

Youth SCORE Index: Republic of Moldova
24
Intend to obtain UE 12.0% 70.6% 17.4%
As we can see in the table, among those who selected category 1 (e.g., those who avoid taking part beyond personal affairs) there is a disproportionally (when compared with other two categories) higher percentage of young people: (1) from UTAG region; (2) with lower educational aspirations; (3) parents without higher education, and; (4) males. When there are interventions aimed at improving active citizenship in Moldova, these demographic groups can be prioritized.
1.1.2 Relationship with demographic variables
Gender. Within Moldova, the gender gap among youth in active citizenship is small: 70% of females vs. 67% of males are categorized as active citizens. However, within the Gagauzia region specifically, the gender gap in active Citizenship is substantial: 71% of females and 57.6% of males—indicating a difference of 13 percentage points. These gender differences across all five regions are shown in Figure 1.2.
Age. Age and active citizenship are not associated in this sample.
UTAG. Active citizenship did not vary considerably between the UTAG and non-UTAG regions.
Urbanicity. Active citizenship levels of youth from urban and rural areas do not differ.
Figure 1.2. Averages for the Active citizenship dimension by gender.
7.0 6.9 6.86.1 5.8
6.77.3
6.77.3
6.27.1 7.0
0.01.02.03.04.05.06.07.08.09.0
10.0
Chisinau Northern Central Southern Gagauzia Total
Active citizenship by gender
male female

Youth SCORE Index: Republic of Moldova
25
Parental education. Active citizenship levels of youth are not related to their parents’ education level.
Educational aspirations. Youths who intend to obtain a university education are on average 1.2 points higher in active citizenship than those who don’t plan obtaining university education—illustrated in Figure 1.3. This gap is highest Southern region—where young people without educational aspirations are markedly lower in active citizenship.
1.2 Motivation to participate in decision-making
1.2.1 Structure of the subdimension
This subdimension is measured by five items, which are:
To what extent are you yourself interested to participate in decisions being made by:
1. Your family
Figure 1.3. Averages for Active citizenship dimensions by educational aspiration
5.9
7.1
0.0
1.0
2.0
3.0
4.0
5.0
6.0
7.0
8.0
9.0
10.0
do not intend UE intend UE
Active citizenship by educational aspirations

Youth SCORE Index: Republic of Moldova
26
2. Your school 3. Public authorities 4. Volunteer Groups and Civic Organizations 5. Political Parties
Each of the items above has three ordered levels, which are:
1. I am not at all interested to participate in making decisions 2. I am somewhat interested to participate in making decisions 3. I am strongly interested to participate in making decisions
The item on which respondents scored the highest is, by far, item 1 (Your family). The item on which respondents scored the lowest was Item 6 (Political Parties), These are summarized in Table 1.2. This demonstrates that young people are by far more motivated to shape decisions concerning their family. This is followed by their interest in the decisions related to their school and volunteer groups/civic organizations. Among potential instances affecting their life, young people expressed the minimal enthusiasm to take part in decisions made by political parties. It will be instructive to find out whether this is mainly driven by the fact that youth are, in general, uninterested in politics, or whether they find the participation at that level to be out of their reach.
Table 1.3 Item averages (minimum=0; maximum=10). participate in decisions being made by: Mean Your family 8.29 Your school 5.98 Public authorities 4.82 Volunteer Groups and Civic Organizations 5.66 Political Parties 4.01
1.2.2 Relationship with demographic variables
Gender. There is no considerable difference between males and females.
Age. The relationship between age and motivation to participate in decision-making was not significant.
UTAG. On average, youth from the UTAG region are less motivated to participate in decision-making (when compared to non-UTAG regions). Three main points affecting this gap is their reluctance to get involved in decisions at (1) volunteer groups and civic organizations; (2) school; and (3) public authorities—illustrated in Figure 1.4. This implies, that, an optimal way to
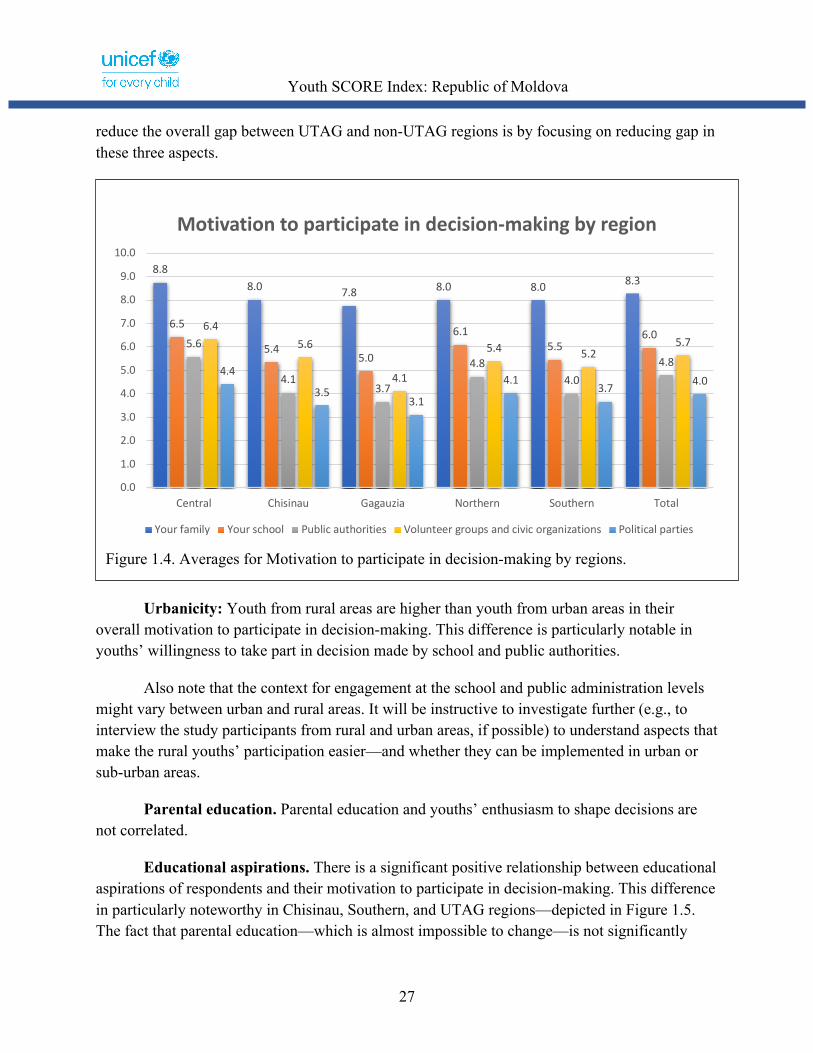
Youth SCORE Index: Republic of Moldova
27
reduce the overall gap between UTAG and non-UTAG regions is by focusing on reducing gap in these three aspects.
Urbanicity: Youth from rural areas are higher than youth from urban areas in their overall motivation to participate in decision-making. This difference is particularly notable in youths’ willingness to take part in decision made by school and public authorities.
Also note that the context for engagement at the school and public administration levels might vary between urban and rural areas. It will be instructive to investigate further (e.g., to interview the study participants from rural and urban areas, if possible) to understand aspects that make the rural youths’ participation easier—and whether they can be implemented in urban or sub-urban areas.
Parental education. Parental education and youths’ enthusiasm to shape decisions are not correlated.
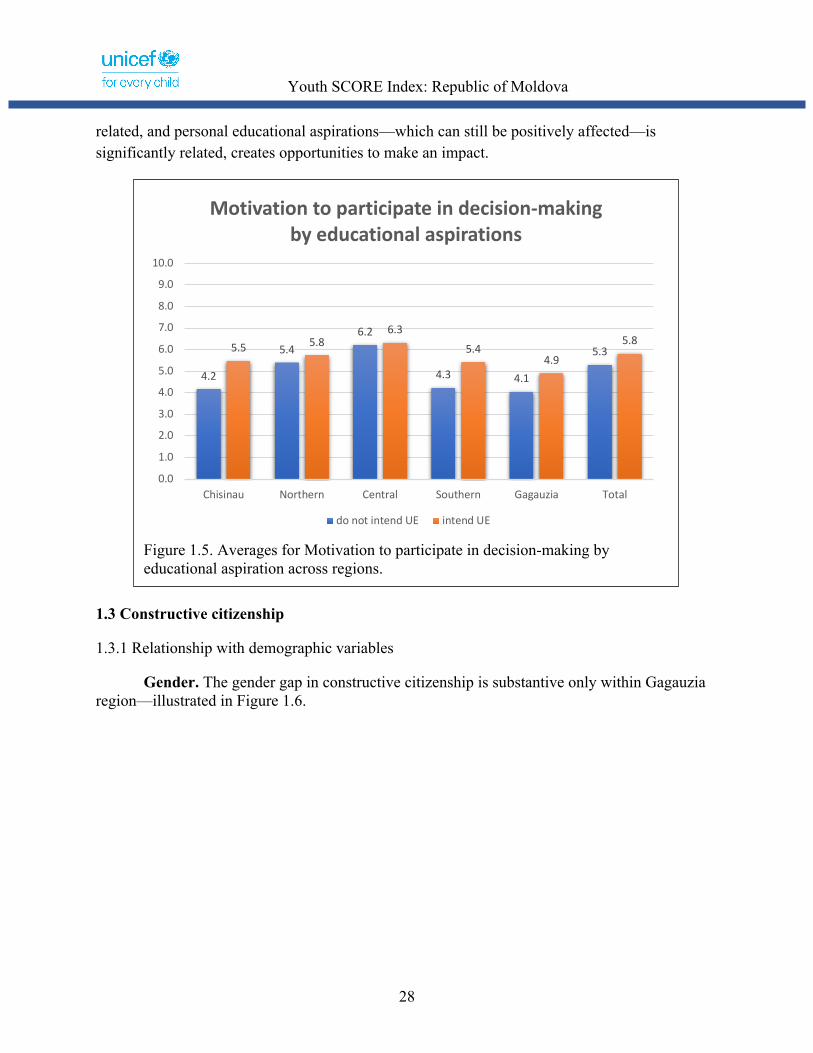
Educational aspirations. There is a significant positive relationship between educational aspirations of respondents and their motivation to participate in decision-making. This difference in particularly noteworthy in Chisinau, Southern, and UTAG regions—depicted in Figure 1.5. The fact that parental education—which is almost impossible to change—is not significantly
Figure 1.4. Averages for Motivation to participate in decision-making by regions.
8.88.0 7.8 8.0 8.0 8.3
6.5
5.45.0
6.15.5
6.05.6
4.13.7
4.84.0
4.8
6.45.6
4.1
5.4 5.25.7
4.4
3.53.1
4.13.7 4.0
0.0
1.0
2.0
3.0
4.0
5.0
6.0
7.0
8.0
9.0
10.0
Central Chisinau Gagauzia Northern Southern Total
Motivation to participate in decision-making by region
Your family Your school Public authorities Volunteer groups and civic organizations Political parties
Youth SCORE Index: Republic of Moldova
28
related, and personal educational aspirations—which can still be positively affected—is significantly related, creates opportunities to make an impact.
1.3 Constructive citizenship
1.3.1 Relationship with demographic variables
Gender. The gender gap in constructive citizenship is substantive only within Gagauzia region—illustrated in Figure 1.6.
Figure 1.5. Averages for Motivation to participate in decision-making by educational aspiration across regions.
4.2
5.46.2
4.3 4.1
5.35.5 5.86.3
5.44.9
5.8
0.0
1.0
2.0
3.0
4.0
5.0
6.0
7.0
8.0
9.0
10.0
Chisinau Northern Central Southern Gagauzia Total
Motivation to participate in decision-making by educational aspirations
do not intend UE intend UE

Youth SCORE Index: Republic of Moldova
29
Age. There is no noticeable relationship between age and Constructive citizenship.
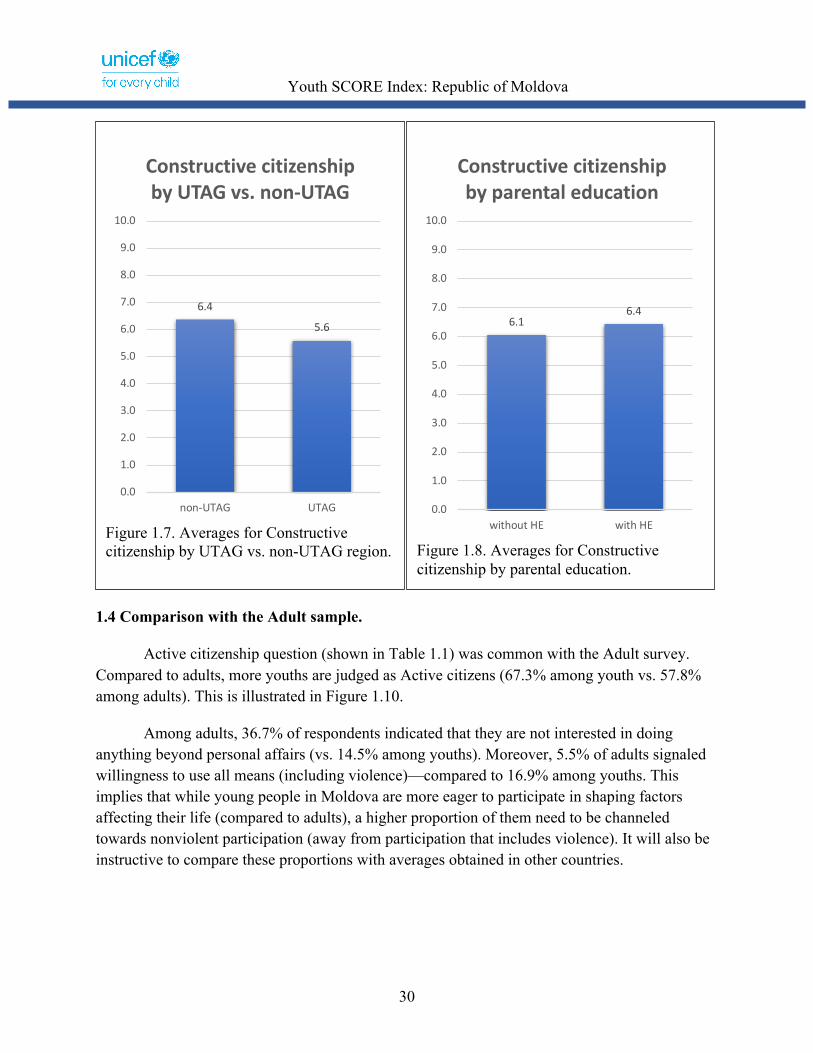
UTAG. Youth from UTAG region are markedly lower in their Constructive citizenship when compared to respondents from other four regions (5.6 vs. 6.4). This difference—depicted in Figure 1.7—is mostly due to the differences in motivation to participate in decision-making.
Urbanicity: Average constructive citizenship does not differ between urban and rural locations.
Parental education. Youth whose parents (either one of the parents) have secondary vocational or finished/unfinished higher education are higher in their Constructive Citizenship—shown in Figure 1.8.
Educational aspirations. There is a significant positive relationship between the educational aspiration of respondents with their Constructive citizenship—illustrated in Figure 1.9.
Figure 1.6. Averages for Constructive citizenship by gender across regions.
6.0 6.36.6
5.65.1
6.26.5 6.26.8
5.9 6.06.4
0.0
1.0
2.0
3.0
4.0
5.0
6.0
7.0
8.0
9.0
10.0
Chisinau Northern Central Southern Gagauzia Total
Constructive citizenship by gender
male female
Youth SCORE Index: Republic of Moldova
30
1.4 Comparison with the Adult sample.
Active citizenship question (shown in Table 1.1) was common with the Adult survey. Compared to adults, more youths are judged as Active citizens (67.3% among youth vs. 57.8% among adults). This is illustrated in Figure 1.10.
Among adults, 36.7% of respondents indicated that they are not interested in doing anything beyond personal affairs (vs. 14.5% among youths). Moreover, 5.5% of adults signaled willingness to use all means (including violence)—compared to 16.9% among youths. This implies that while young people in Moldova are more eager to participate in shaping factors affecting their life (compared to adults), a higher proportion of them need to be channeled towards nonviolent participation (away from participation that includes violence). It will also be instructive to compare these proportions with averages obtained in other countries.
Figure 1.7. Averages for Constructive citizenship by UTAG vs. non-UTAG region.
6.4
5.6
0.0
1.0
2.0
3.0
4.0
5.0
6.0
7.0
8.0
9.0
10.0
non-UTAG UTAG
Constructive citizenship by UTAG vs. non-UTAG
Figure 1.8. Averages for Constructive citizenship by parental education.
6.16.4
0.0
1.0
2.0
3.0
4.0
5.0
6.0
7.0
8.0
9.0
10.0
without HE with HE
Constructive citizenship by parental education

Youth SCORE Index: Republic of Moldova
31
Figure 1.9. Averages for Constructive citizenship by educational aspiration.
5.6
6.5
0.0
1.0
2.0
3.0
4.0
5.0
6.0
7.0
8.0
9.0
10.0
do not intend UE intend UE
Constructive citizenship by educational
aspirations
Figure 1.10. Comparisons with the adult survey.
5.8
6.9
0.0
1.0
2.0
3.0
4.0
5.0
6.0
7.0
8.0
9.0
10.0
Adult Sample Youth Sample
Active citizenship by survey

Youth SCORE Index: Republic of Moldova
32
Chapter 2: Reversal of brain drain and emigration trends
The country-level youth average in the Reversal of brain drain and emigration tendencies dimension is 6.4, and the averages for the Chisinau, Northern, Central, Southern, and Gagauzia regions are 6.6, 6.4, 6.4, 6.6, and 5.9 respectively. These averages are shown in Figure 2.1.
This chapter is organized as follows:
Section 2.1: A closer look at Brain Drain Tendencies Section 2.2: Comparison with the Adult sample
2.1 Emigration Tendency
2.1.1 Structure of the dimension
The Reversal of brain drain and emigration tendencies dimension is obtained by averaging across six relevant items, which are below (in two groups):
1. To what extent do you agree or disagree with each of the following statements:
Q1: Moldova is a good place to live and work;
Figure 2.1. Averages for Reversal of brain drain and emigration trends dimensions.
6.6 6.4 6.4 6.65.9
6.4
0.0
1.0
2.0
3.0
4.0
5.0
6.0
7.0
8.0
9.0
10.0
Chisinau Northern Central Southern Gagauzia Total
Reversal of brain drain and emigration trends by region
Youth SCORE Index: Republic of Moldova
33
Q2: I can make a real difference if I stay in this country for the long term; Q3: At some point in the future, I hope to leave Moldova; Q4: My friends or family often talk about making a better life somewhere else; Q5: Many members of my family or friends emigrated somewhere else to make a
better life;
Response categories for the above items are (1) Strongly Disagree; (2) Somewhat Disagree; (3) Somewhat agree; (4) Strongly agree. 2. Thinking about what your life would ideally be like in ten years' time, when you are in your 20s, how would you evaluate each of the following potential role:
Q6: Work somewhere abroad / outside of my country.
Response categories for the above question are: (1) Such a role is not at all appealing to me; (2) Such a role is interesting, but would not be ideal for me; (3) Such a role would be ideal for me
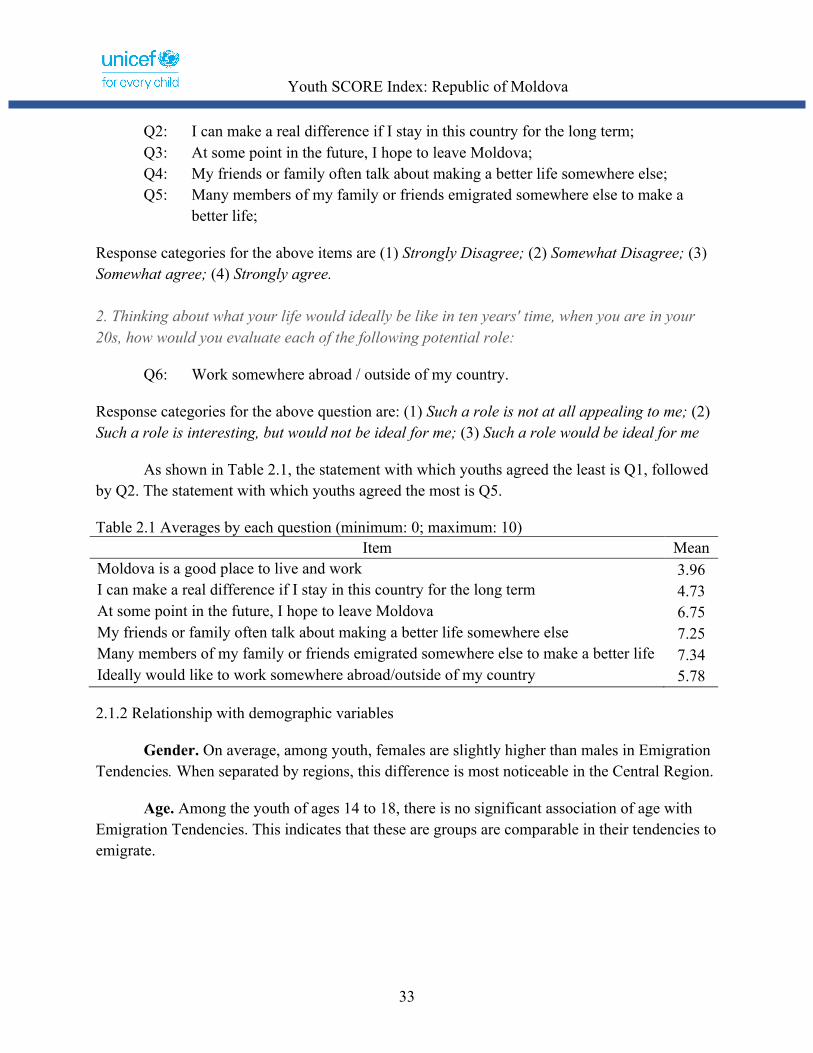
As shown in Table 2.1, the statement with which youths agreed the least is Q1, followed by Q2. The statement with which youths agreed the most is Q5.
Table 2.1 Averages by each question (minimum: 0; maximum: 10) Item Mean
Moldova is a good place to live and work 3.96 I can make a real difference if I stay in this country for the long term 4.73 At some point in the future, I hope to leave Moldova 6.75 My friends or family often talk about making a better life somewhere else 7.25 Many members of my family or friends emigrated somewhere else to make a better life 7.34 Ideally would like to work somewhere abroad/outside of my country 5.78
2.1.2 Relationship with demographic variables
Gender. On average, among youth, females are slightly higher than males in Emigration Tendencies. When separated by regions, this difference is most noticeable in the Central Region.
Age. Among the youth of ages 14 to 18, there is no significant association of age with Emigration Tendencies. This indicates that these are groups are comparable in their tendencies to emigrate.

Youth SCORE Index: Republic of Moldova
34
UTAG. Youths from the UTAG region are considerably lower in their Emigration Tendencies than non-UTAG youth. The average of Emigration Tendencies in UTAG is at 5.94, while an average in other four regions is 6.45—as shown in Figure 2.2.
Two main contributors to this difference are Q4 and Q5. Specifically, respondents from non-UTAG regions (when compared to UTAG respondents) are more likely to report that their (1) friends or family often talk about making a better life somewhere else, and (2) members of their family or friends emigrated somewhere else to make a better life. These are summarized in Figure 2.3. This also implies that families play an important role in shaping youths’ emigration tendencies—and any attempts to change such tendencies should probably be considered at the family level.
Figure 2.2. Averages for Emigration Tendencies by regions.
6.55.9
0.0
1.0
2.0
3.0
4.0
5.0
6.0
7.0
8.0
9.0
10.0
non-UTAG UTAG
Reversal of brain drain and emigration trends by UTAG vs. non-UTAG
Figure 2.4. Averages for Emigration Tendencies by urbanicity.
6.3 6.6
0.0
1.0
2.0
3.0
4.0
5.0
6.0
7.0
8.0
9.0
10.0
Rural areas Urban areas
Reversal of brain drain and emigration trends
by urbanicity
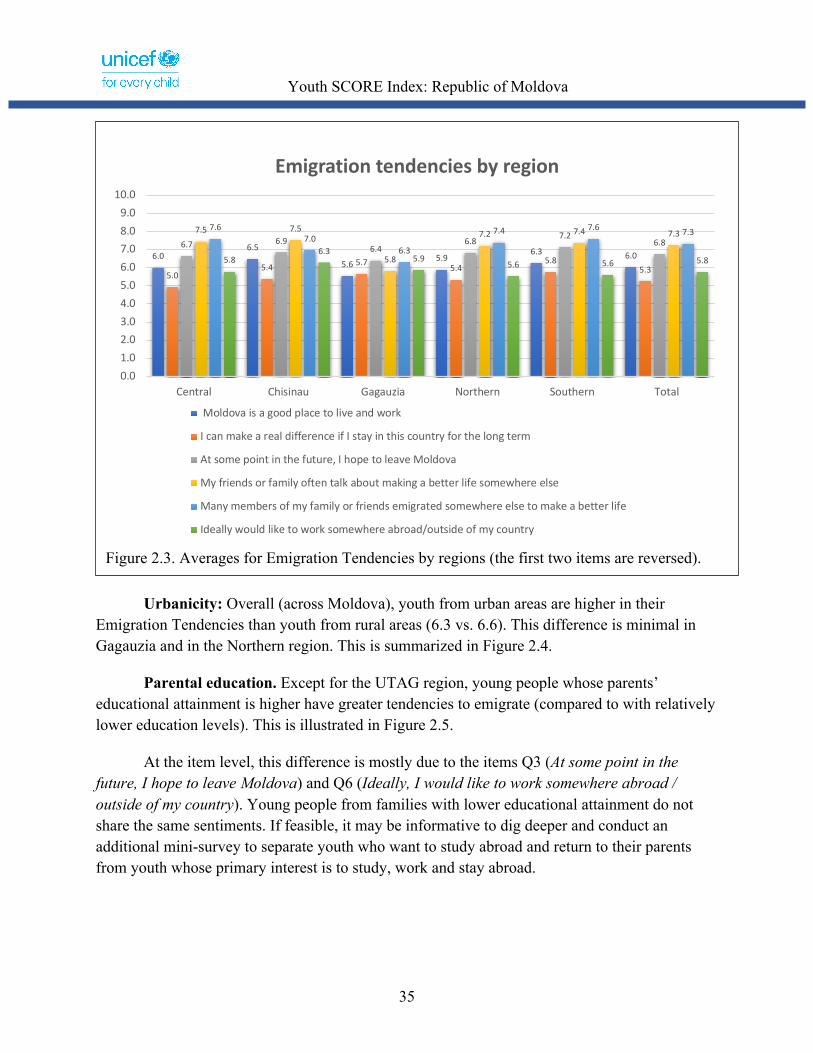
Youth SCORE Index: Republic of Moldova
35
Urbanicity: Overall (across Moldova), youth from urban areas are higher in their Emigration Tendencies than youth from rural areas (6.3 vs. 6.6). This difference is minimal in Gagauzia and in the Northern region. This is summarized in Figure 2.4.
Parental education. Except for the UTAG region, young people whose parents’ educational attainment is higher have greater tendencies to emigrate (compared to with relatively lower education levels). This is illustrated in Figure 2.5.
At the item level, this difference is mostly due to the items Q3 (At some point in the future, I hope to leave Moldova) and Q6 (Ideally, I would like to work somewhere abroad / outside of my country). Young people from families with lower educational attainment do not share the same sentiments. If feasible, it may be informative to dig deeper and conduct an additional mini-survey to separate youth who want to study abroad and return to their parents from youth whose primary interest is to study, work and stay abroad.
Figure 2.3. Averages for Emigration Tendencies by regions (the first two items are reversed).
6.06.5
5.65.9
6.3 6.0
5.05.4 5.7 5.4
5.85.3
6.7 6.96.4
6.8 7.26.8
7.5 7.5
5.8
7.2 7.4 7.37.6
7.06.3
7.4 7.6 7.3
5.86.3
5.95.6 5.6 5.8
0.01.02.03.04.05.06.07.08.09.0
10.0
Central Chisinau Gagauzia Northern Southern Total
Emigration tendencies by region
Moldova is a good place to live and work
I can make a real difference if I stay in this country for the long term
At some point in the future, I hope to leave Moldova
My friends or family often talk about making a better life somewhere else
Many members of my family or friends emigrated somewhere else to make a better life
Ideally would like to work somewhere abroad/outside of my country

Youth SCORE Index: Republic of Moldova
36
Educational aspirations. There is a positive relationship between youths’ educational aspirations and their Emigration Tendencies. Young people who intend to obtain UE are markedly higher in their Emigration Tendencies (than those who don’t)—as illustrated in Figure 2.6. This difference is mostly salient in Q5 (Many members of my family or friends emigrated somewhere else to make a better life).
2.2 Comparison with the Adult sample
On average, youth respondents are substantially higher in their Emigration Tendencies than adult respondents (based on items (Q1-Q5)—as plotted in Figure 2.13. At the item level, the difference is more pronounced in Q3 (At some point in the future, I hope to leave Moldova)—illustrated in Figure 2.7.
Figure 2.5. Averages for Emigration Tendencies by parental education, across regions.
6.4 6.45.9
6.66.0 6.2
6.7 6.5 6.7 6.8
6.06.6
0.0
1.0
2.0
3.0
4.0
5.0
6.0
7.0
8.0
9.0
10.0
Chisinau Northern Central Southern Gagauzia Total
Reversal of brain drain and emigration trends by parental education
without HE with HE

Youth SCORE Index: Republic of Moldova
37
Figure 2.6. Averages for Emigration Tendencies by educational aspirations.
6.26.5
0.0
1.0
2.0
3.0
4.0
5.0
6.0
7.0
8.0
9.0
10.0
do not intend UE intend UE
Reversal of brain drain and emigration trends by educational aspirations
Figure 2.7. Averages for Emigration Tendencies for Adult and Youth samples.
5.4
6.5
0.0
1.0
2.0
3.0
4.0
5.0
6.0
7.0
8.0
9.0
10.0
Adult Sample Youth Sample
Reversal of brain drain and emigration trends by
survey

Youth SCORE Index: Republic of Moldova
38
Chapter 3: Openness towards outgroups
The Openness towards outgroups dimension is obtained by: (1) averaging across Trust, and (reversed) Negative Feelings towards each of the five groups. Among five Openness scores (for each young person), finding the minimum is assigned as their Openness score.
Trust and Negative Feelings (reversed) are averaged based on their trust or negative feelings towards: (1) People living in Transnistria; (2) People from Gagauzia; (3) People who support closer ties with Russia; (4) People who support closer ties with Europe and the West, and; (5) People that want to join Romania.
The country-level youth average in Openness towards outgroups dimension is 2.9, and the averages for the Chisinau, Northern, Central, Southern, and Gagauzia regions are at 2.6, 3.4, 2.8, 3.0, and 1.6 respectively.
The country-level youth average in Trust towards outgroups dimension is at 5.3, and the averages for the Chisinau, Northern, Central, Southern, and Gagauzia regions are 5.0, 5.3, 5.3, 5.5, and 5.3 respectively.
The country-level youth average in Negative feelings towards outgroups dimension is 4.6, and the averages for the Chisinau, Northern, Central, Southern, and Gagauzia regions are 4.9, 4.5, 4.5, 4.7, and 4.4 respectively. These averages are shown in Figure 3.1.
Figure 3.1. Average scores for Openness towards political outgroups dimensions and relevant subdimensions by regions.
2.63.4
2.8 3.0
1.6
2.9
5.0 5.3 5.3 5.5 5.3 5.34.9
4.5 4.5 4.7 4.4 4.6
0.0
1.0
2.0
3.0
4.0
5.0
6.0
7.0
8.0
9.0
10.0
Chisinau Northern Central Southern Gagauzia Total
Openness towards outgroups
Openness towards outgroups Trust towards outgroups Negative feeling towards outgroups
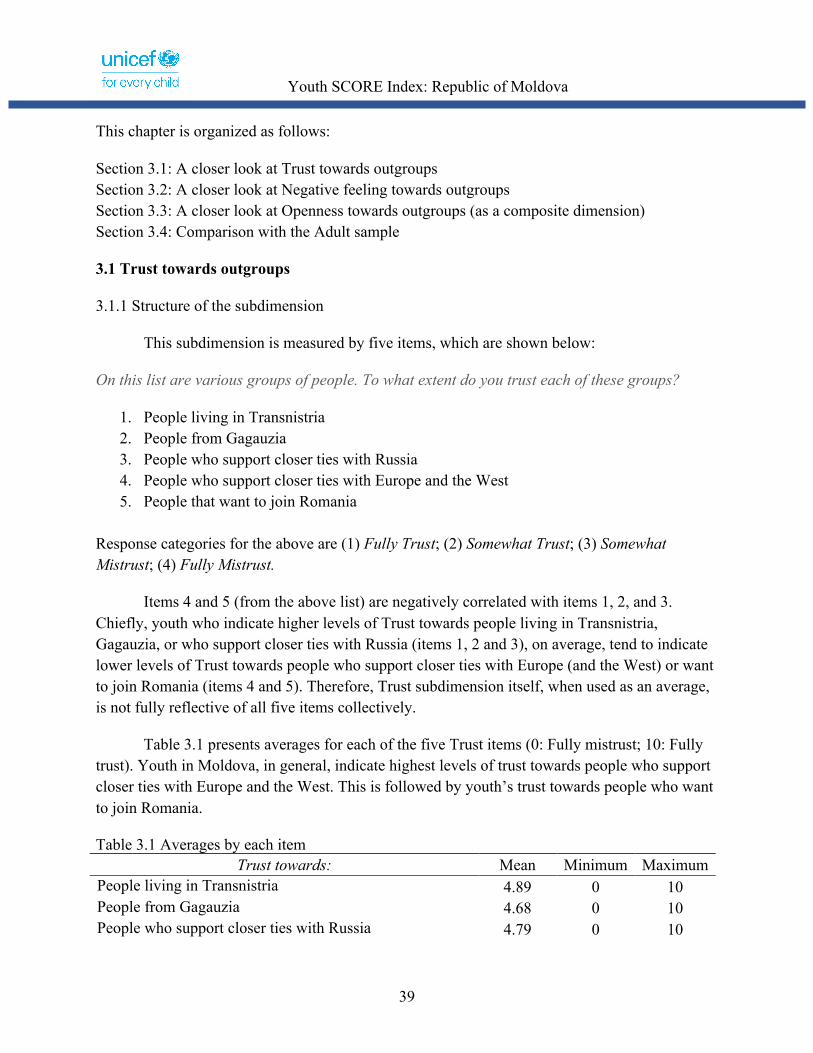
Youth SCORE Index: Republic of Moldova
39
This chapter is organized as follows:
Section 3.1: A closer look at Trust towards outgroups Section 3.2: A closer look at Negative feeling towards outgroups Section 3.3: A closer look at Openness towards outgroups (as a composite dimension) Section 3.4: Comparison with the Adult sample
3.1 Trust towards outgroups
3.1.1 Structure of the subdimension
This subdimension is measured by five items, which are shown below:
On this list are various groups of people. To what extent do you trust each of these groups?
1. People living in Transnistria 2. People from Gagauzia 3. People who support closer ties with Russia 4. People who support closer ties with Europe and the West 5. People that want to join Romania
Response categories for the above are (1) Fully Trust; (2) Somewhat Trust; (3) Somewhat Mistrust; (4) Fully Mistrust.
Items 4 and 5 (from the above list) are negatively correlated with items 1, 2, and 3. Chiefly, youth who indicate higher levels of Trust towards people living in Transnistria, Gagauzia, or who support closer ties with Russia (items 1, 2 and 3), on average, tend to indicate lower levels of Trust towards people who support closer ties with Europe (and the West) or want to join Romania (items 4 and 5). Therefore, Trust subdimension itself, when used as an average, is not fully reflective of all five items collectively.
Table 3.1 presents averages for each of the five Trust items (0: Fully mistrust; 10: Fully trust). Youth in Moldova, in general, indicate highest levels of trust towards people who support closer ties with Europe and the West. This is followed by youth’s trust towards people who want to join Romania.
Table 3.1 Averages by each item Trust towards: Mean Minimum Maximum
People living in Transnistria 4.89 0 10 People from Gagauzia 4.68 0 10 People who support closer ties with Russia 4.79 0 10

Youth SCORE Index: Republic of Moldova
40
People who support closer ties with Europe and the West 6.38 0 10 People that want to join Romania 5.68 0 10
3.1.2 Relationship with covariates
Gender. Females and males do not differ in their levels of Trust towards these five political outgroups.
Age. Trust subdimensions does not have a significant association with respondents’ age.
UTAG. UTAG respondents—when compared to respondents from other regions—are not different in the overall Trust score. However, when analyzed at the item level, the youth from Gagauzia are noticeably higher in their (1) Trust towards people living in Transnistria; (2) people from Gagauzia, and; (3) people who support closer ties with Russia. In contrast, youth from other four regions are significantly higher (than UTAG) in their Trust towards (1) people who support closer ties with EU/West, and; (2) people who want to join Romania. These are shown in Figure 3.2. This signals a contrast between the regions when it comes to youths’ sentiments towards these political subgroups—and any attempt to reduce such polarization requires an elaborate approach that considers these findings.
Figure 3.2. Average scores on items measuring Trust subdimension by regions.
4.8 4.94.6
5.0
6.2
4.94.6 4.6
4.0
4.8
7.9
4.7
3.8
5.2
4.3
5.1
6.8
4.8
6.46.1
7.1 6.9
3.9
6.4
5.45.8
6.65.8
1.6
5.7
0.0
1.0
2.0
3.0
4.0
5.0
6.0
7.0
8.0
9.0
10.0
Chisinau Northern Central Southern Gagauzia Total
Trust towards outgroups by regions
Trust towards people living in TransnistriaTrust towards people from GagauziaTrust towards people who support closer ties with RussiaTrust towards people who support closer ties with EU/West

Youth SCORE Index: Republic of Moldova
41
Urbanicity. Trust towards political outgroups doesn’t vary across levels of urbanicity.
Parental education. Trust towards political outgroups and parental education do not exhibit any significant associations.
Educational aspirations. At the overall level, youth who intend to obtain UE are noticeably higher in their Trust towards political outgroups—as illustrated in Figure 3.3.
Youth with higher educational aspirations are particularly higher in their trust towards people: who (1) support closer ties with EU/West; (2) want to join Romania (when compared with youth with lower educational aspirations). However, they are lower in their Trust towards people who support closer ties with Russia.
3.2 Negative feelings towards outgroups
3.2.1 Structure of the subdimension
This subdimension is measured by five items, which are shown below:
Figure 3.3. Trust towards political outgroups by educational aspiration.
4.85.4
0.0
1.0
2.0
3.0
4.0
5.0
6.0
7.0
8.0
9.0
10.0
do not intend UE intend UE
Trust towards outgroups
by educational aspirations
Figure 3.4. Negative feelings towards political outgroups by gender.
4.7 4.5
0.0
1.0
2.0
3.0
4.0
5.0
6.0
7.0
8.0
9.0
10.0
Male Female
Negative feelings towards outgroups by
gender
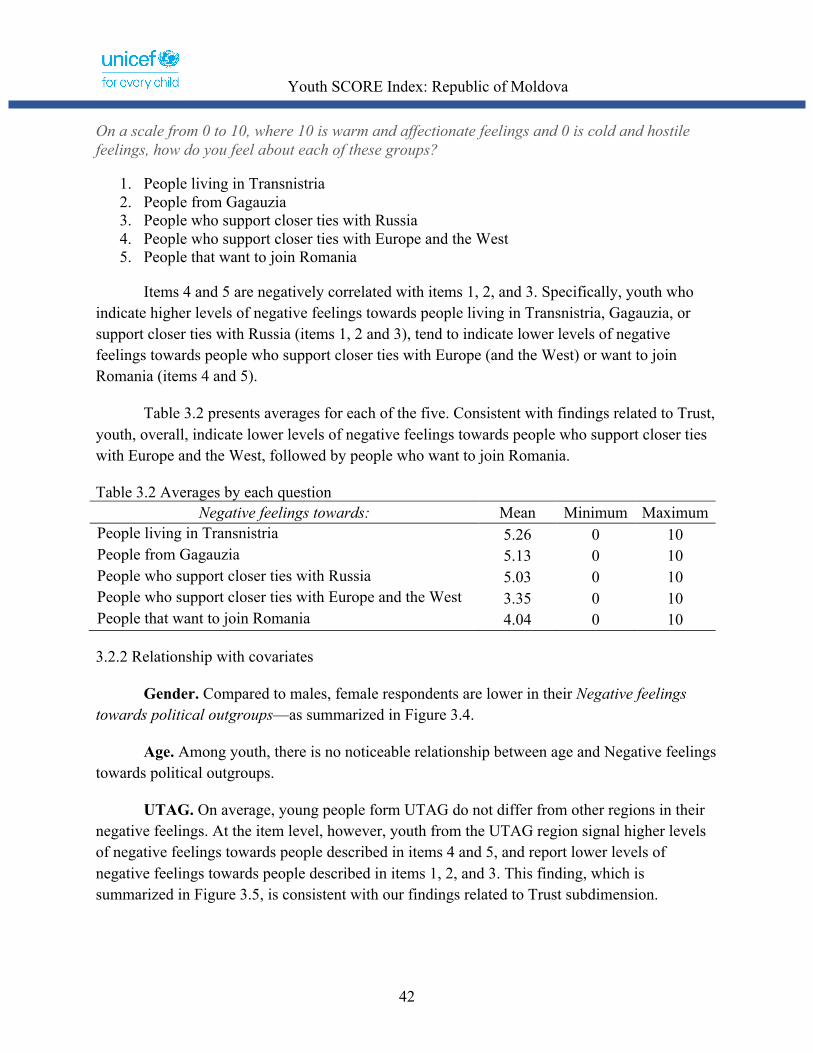
Youth SCORE Index: Republic of Moldova
42
On a scale from 0 to 10, where 10 is warm and affectionate feelings and 0 is cold and hostile feelings, how do you feel about each of these groups?
1. People living in Transnistria 2. People from Gagauzia 3. People who support closer ties with Russia 4. People who support closer ties with Europe and the West 5. People that want to join Romania
Items 4 and 5 are negatively correlated with items 1, 2, and 3. Specifically, youth who indicate higher levels of negative feelings towards people living in Transnistria, Gagauzia, or support closer ties with Russia (items 1, 2 and 3), tend to indicate lower levels of negative feelings towards people who support closer ties with Europe (and the West) or want to join Romania (items 4 and 5).
Table 3.2 presents averages for each of the five. Consistent with findings related to Trust, youth, overall, indicate lower levels of negative feelings towards people who support closer ties with Europe and the West, followed by people who want to join Romania.
Table 3.2 Averages by each question Negative feelings towards: Mean Minimum Maximum
People living in Transnistria 5.26 0 10 People from Gagauzia 5.13 0 10 People who support closer ties with Russia 5.03 0 10 People who support closer ties with Europe and the West 3.35 0 10 People that want to join Romania 4.04 0 10
3.2.2 Relationship with covariates
Gender. Compared to males, female respondents are lower in their Negative feelings towards political outgroups—as summarized in Figure 3.4.
Age. Among youth, there is no noticeable relationship between age and Negative feelings towards political outgroups.
UTAG. On average, young people form UTAG do not differ from other regions in their negative feelings. At the item level, however, youth from the UTAG region signal higher levels of negative feelings towards people described in items 4 and 5, and report lower levels of negative feelings towards people described in items 1, 2, and 3. This finding, which is summarized in Figure 3.5, is consistent with our findings related to Trust subdimension.
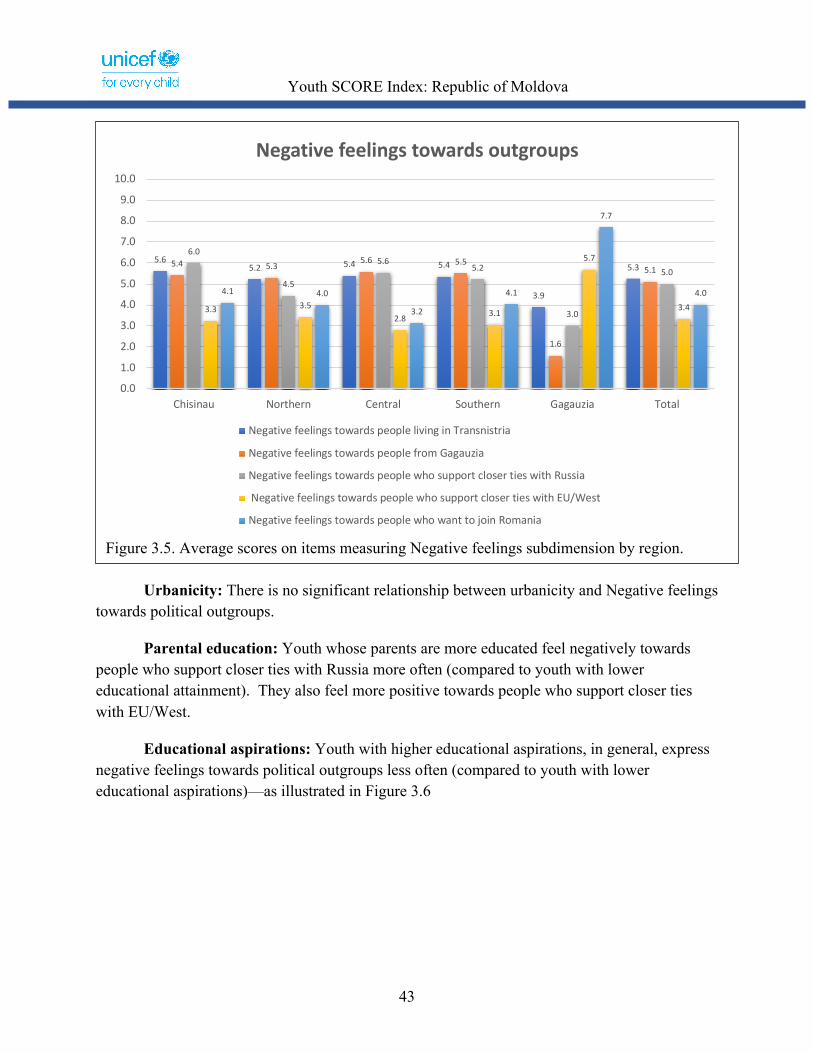
Youth SCORE Index: Republic of Moldova
43
Urbanicity: There is no significant relationship between urbanicity and Negative feelings towards political outgroups.
Parental education: Youth whose parents are more educated feel negatively towards people who support closer ties with Russia more often (compared to youth with lower educational attainment). They also feel more positive towards people who support closer ties with EU/West.
Educational aspirations: Youth with higher educational aspirations, in general, express negative feelings towards political outgroups less often (compared to youth with lower educational aspirations)—as illustrated in Figure 3.6
Figure 3.5. Average scores on items measuring Negative feelings subdimension by region.
5.65.2 5.4 5.4
3.9
5.35.4 5.35.6 5.5
1.6
5.1
6.0
4.5
5.65.2
3.0
5.0
3.3 3.52.8 3.1
5.7
3.4
4.1 4.0
3.2
4.1
7.7
4.0
0.0
1.0
2.0
3.0
4.0
5.0
6.0
7.0
8.0
9.0
10.0
Chisinau Northern Central Southern Gagauzia Total
Negative feelings towards outgroups
Negative feelings towards people living in Transnistria
Negative feelings towards people from Gagauzia
Negative feelings towards people who support closer ties with Russia
Negative feelings towards people who support closer ties with EU/West
Negative feelings towards people who want to join Romania

Youth SCORE Index: Republic of Moldova
44
3.3 Openness towards outgroups
Table 3.3 presents averages for each of the five items. At the country level, youth, by far, express higher levels of openness towards people who support closer ties with Europe and the West. This is followed by people who want to join Romania.
Table 3.3 Averages by each item Openness towards: Mean Minimum Maximum
People living in Transnistria 4.81 0 10 People from Gagauzia 4.77 0 10 People who support closer ties with Russia 4.88 0 10 People who support closer ties with Europe and the West 6.51 0 10 People that want to join Romania 5.82 0 10
3.3.1 Relationship with covariates
Figure 3.6. Negative feelings towards political outgroups by gender.
4.94.5
0.0
1.0
2.0
3.0
4.0
5.0
6.0
7.0
8.0
9.0
10.0
do not intend UE intend UE
Negative feelings towards outgroups by
educational aspirations
Figure 3.7. Openness towards political outgroups by gender.
2.8 3.0
0.0
1.0
2.0
3.0
4.0
5.0
6.0
7.0
8.0
9.0
10.0
Male Female
Openness towards outgroups by gender

Youth SCORE Index: Republic of Moldova
45
Gender. On average, females are higher in their Openness towards political outgroups than male respondents—as illustrated in Figure 3.7.
Age. There is no substantive relationship of youths’ age with their openness towards political outgroups.
UTAG. At the overall level, youth from the UTAG region are markedly less open towards political outgroups (compared to youth from other regions)—as illustrated in Figure 3.8.
At the item level, however, they are less open to people who support closer ties with Europe/West and Romania only—and instead, more open to the remaining three political outgroups, which is demonstrated in Figure 3.9. In order to reduce the gap between youth from the UTAG and non-UTAG regions, these two aspects (attitudes towards people supporting closer ties to Europe/West and towards Romania) should be prioritized.
Figure 3.8. Openness towards political outgroups by UTAG vs. non-UTAG.
3.0
1.6
0.0
1.0
2.0
3.0
4.0
5.0
6.0
7.0
8.0
9.0
10.0
non-UTAG UTAG
Openness towards outgroups by region
Figure 3.11. Trust towards political outgroups by the survey (Adult survey vs. Youth survey).
5.75.3
0.0
1.0
2.0
3.0
4.0
5.0
6.0
7.0
8.0
9.0
10.0
Adult Sample Youth Sample
Trust towards outgroups by survey
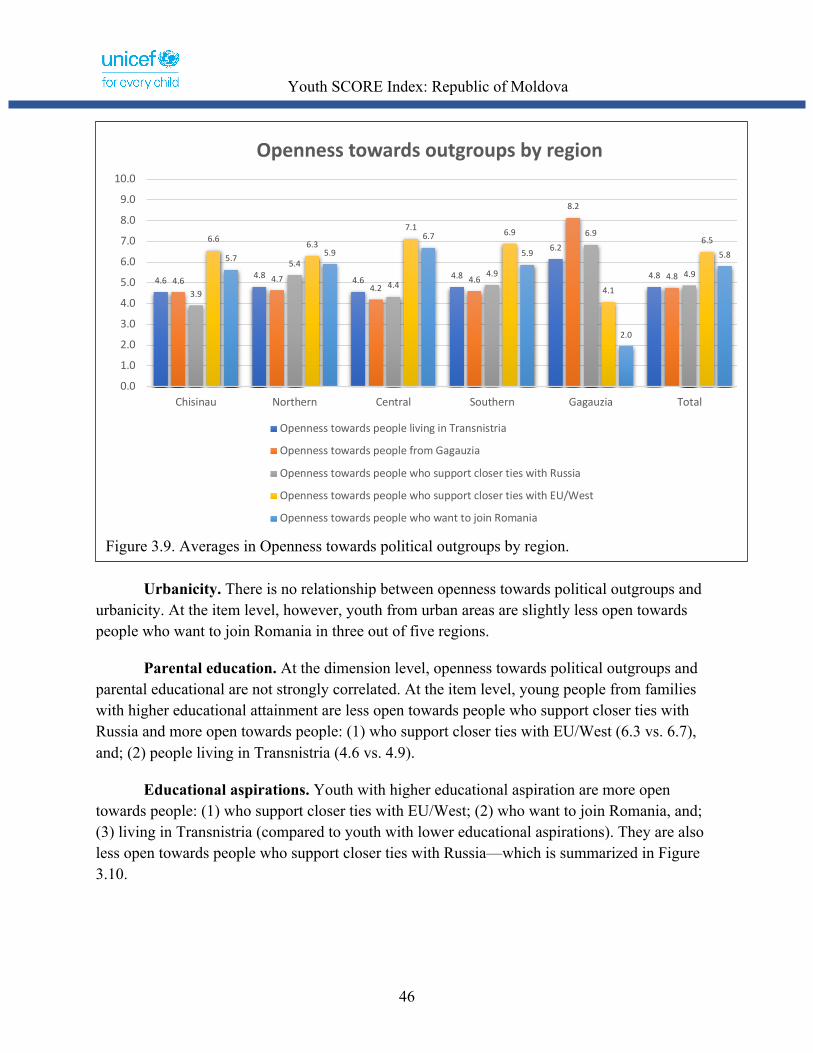
Youth SCORE Index: Republic of Moldova
46
Urbanicity. There is no relationship between openness towards political outgroups and urbanicity. At the item level, however, youth from urban areas are slightly less open towards people who want to join Romania in three out of five regions.
Parental education. At the dimension level, openness towards political outgroups and parental educational are not strongly correlated. At the item level, young people from families with higher educational attainment are less open towards people who support closer ties with Russia and more open towards people: (1) who support closer ties with EU/West (6.3 vs. 6.7), and; (2) people living in Transnistria (4.6 vs. 4.9).
Educational aspirations. Youth with higher educational aspiration are more open towards people: (1) who support closer ties with EU/West; (2) who want to join Romania, and; (3) living in Transnistria (compared to youth with lower educational aspirations). They are also less open towards people who support closer ties with Russia—which is summarized in Figure 3.10.
Figure 3.9. Averages in Openness towards political outgroups by region.
4.6 4.8 4.6 4.8
6.2
4.84.6 4.74.2
4.6
8.2
4.8
3.9
5.4
4.44.9
6.9
4.9
6.6 6.3
7.1 6.9
4.1
6.5
5.7 5.9
6.7
5.9
2.0
5.8
0.0
1.0
2.0
3.0
4.0
5.0
6.0
7.0
8.0
9.0
10.0
Chisinau Northern Central Southern Gagauzia Total
Openness towards outgroups by region
Openness towards people living in Transnistria
Openness towards people from Gagauzia
Openness towards people who support closer ties with Russia
Openness towards people who support closer ties with EU/West
Openness towards people who want to join Romania
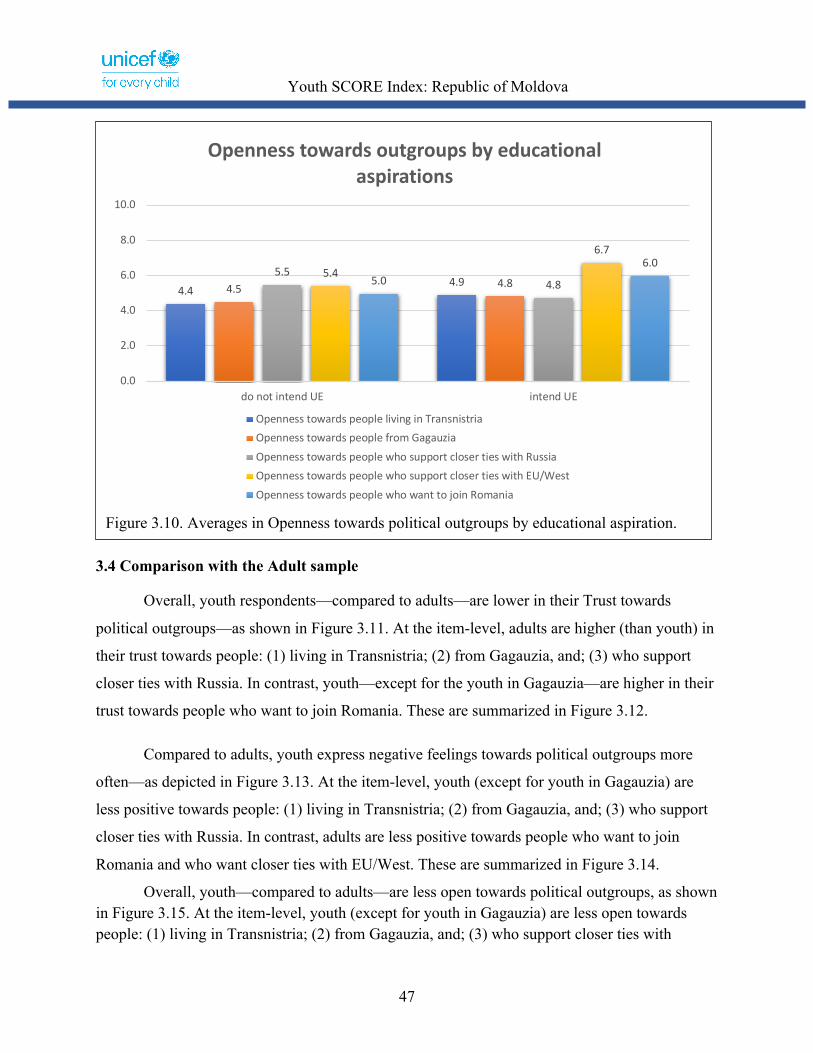
Youth SCORE Index: Republic of Moldova
47
3.4 Comparison with the Adult sample
Overall, youth respondents—compared to adults—are lower in their Trust towards
political outgroups—as shown in Figure 3.11. At the item-level, adults are higher (than youth) in
their trust towards people: (1) living in Transnistria; (2) from Gagauzia, and; (3) who support
closer ties with Russia. In contrast, youth—except for the youth in Gagauzia—are higher in their
trust towards people who want to join Romania. These are summarized in Figure 3.12.
Compared to adults, youth express negative feelings towards political outgroups more
often—as depicted in Figure 3.13. At the item-level, youth (except for youth in Gagauzia) are
less positive towards people: (1) living in Transnistria; (2) from Gagauzia, and; (3) who support
closer ties with Russia. In contrast, adults are less positive towards people who want to join
Romania and who want closer ties with EU/West. These are summarized in Figure 3.14.
Overall, youth—compared to adults—are less open towards political outgroups, as shown in Figure 3.15. At the item-level, youth (except for youth in Gagauzia) are less open towards people: (1) living in Transnistria; (2) from Gagauzia, and; (3) who support closer ties with
Figure 3.10. Averages in Openness towards political outgroups by educational aspiration.
4.44.94.5 4.8
5.54.8
5.4
6.7
5.06.0
0.0
2.0
4.0
6.0
8.0
10.0
do not intend UE intend UE
Openness towards outgroups by educational aspirations
Openness towards people living in TransnistriaOpenness towards people from GagauziaOpenness towards people who support closer ties with RussiaOpenness towards people who support closer ties with EU/WestOpenness towards people who want to join Romania

Youth SCORE Index: Republic of Moldova
48
Russia. In contrast, they are (except for the youth in Gagauzia) more open towards people who want to join Romania. Youth and adult respondents are somewhat similar in their level of openness towards people who support closer ties with EU/West. These are summarized in Figure 3.16.
Figure 3.12. Averages in Trust towards political outgroups by survey (Adult vs. Youth).
6.0
4.8 4.94.6
5.0
6.25.85.8
4.6 4.6
4.0
4.8
7.9
5.6
6.2
3.8
5.2
4.3
5.1
6.8
6.06.3 6.4
6.1
7.16.9
3.9
6.3
4.4
5.45.8
6.6
5.8
1.6
4.7
0.0
1.0
2.0
3.0
4.0
5.0
6.0
7.0
8.0
9.0
10.0
Adult (Moldova) Youth (Chisinau) Youth (Northern) Youth (Central) Youth (Southern) Youth (Gagauzia) Total
Trust towards outgroups by survey
Trust towards people living in TransnistriaTrust towards people from GagauziaTrust towards people who support closer ties with RussiaTrust towards people who support closer ties with EU/West

Youth SCORE Index: Republic of Moldova
49
Figure 3.13. Negative feelings towards political outgroups by the survey (Adult survey vs. Youth survey).
4.14.6
0.0
1.0
2.0
3.0
4.0
5.0
6.0
7.0
8.0
9.0
10.0
Adult Sample Youth Sample
Negative feelings towards outgroups by survey
Figure 3.15. Openness towards political outgroups by the survey (Adult survey vs. Youth survey).
3.7
2.9
0.0
1.0
2.0
3.0
4.0
5.0
6.0
7.0
8.0
9.0
10.0
Adult Sample Youth Sample
Openness towards outgroups by survey
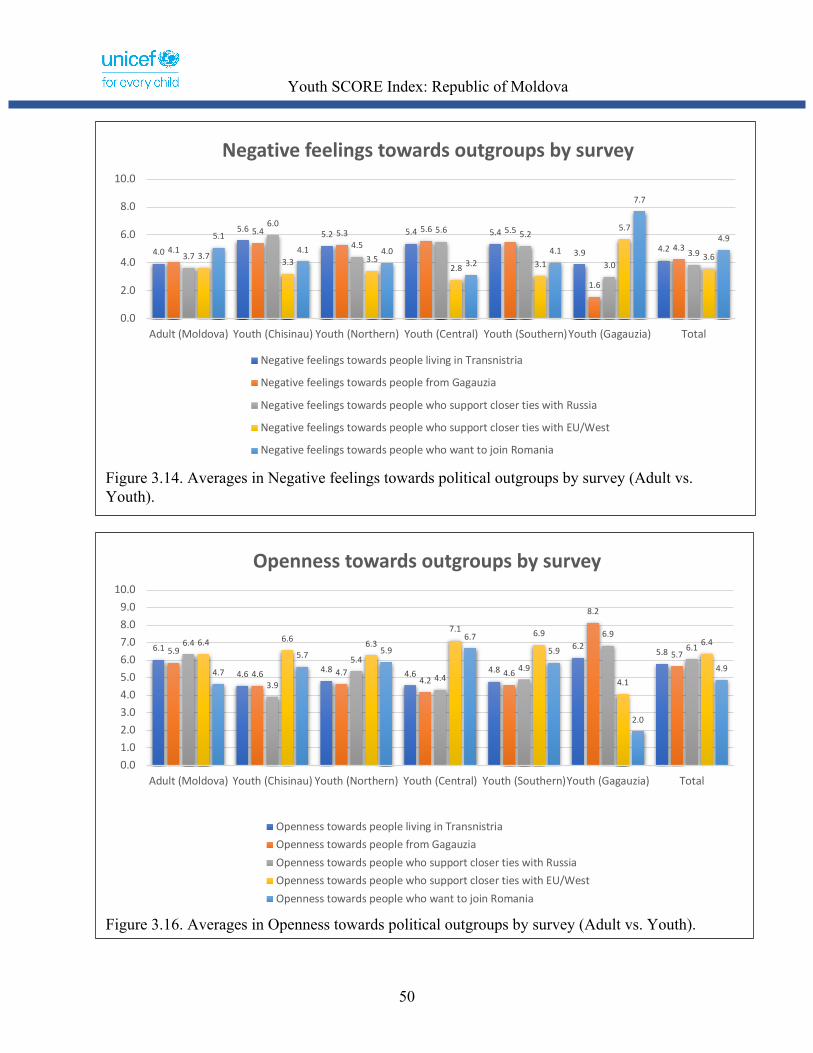
Youth SCORE Index: Republic of Moldova
50
Figure 3.14. Averages in Negative feelings towards political outgroups by survey (Adult vs. Youth).
4.0
5.6 5.2 5.4 5.4
3.9 4.24.1
5.4 5.3 5.6 5.5
1.6
4.33.7
6.0
4.5
5.6 5.2
3.03.93.7
3.3 3.52.8 3.1
5.7
3.6
5.14.1 4.0
3.24.1
7.7
4.9
0.0
2.0
4.0
6.0
8.0
10.0
Adult (Moldova) Youth (Chisinau) Youth (Northern) Youth (Central) Youth (Southern)Youth (Gagauzia) Total
Negative feelings towards outgroups by survey
Negative feelings towards people living in Transnistria
Negative feelings towards people from Gagauzia
Negative feelings towards people who support closer ties with Russia
Negative feelings towards people who support closer ties with EU/West
Negative feelings towards people who want to join Romania
Figure 3.16. Averages in Openness towards political outgroups by survey (Adult vs. Youth).
6.1
4.6 4.8 4.6 4.8
6.25.85.9
4.6 4.74.2
4.6
8.2
5.76.4
3.9
5.4
4.44.9
6.96.16.4 6.6 6.3
7.1 6.9
4.1
6.4
4.7
5.7 5.96.7
5.9
2.0
4.9
0.01.02.03.04.05.06.07.08.09.0
10.0
Adult (Moldova) Youth (Chisinau) Youth (Northern) Youth (Central) Youth (Southern)Youth (Gagauzia) Total
Openness towards outgroups by survey
Openness towards people living in TransnistriaOpenness towards people from GagauziaOpenness towards people who support closer ties with RussiaOpenness towards people who support closer ties with EU/WestOpenness towards people who want to join Romania

Youth SCORE Index: Republic of Moldova
51
Chapter 4: Sharing a human rights ethos
The Sharing a human rights ethos dimension is obtained by averaging across three subdimensions, which are (1) Overall support for human rights; (2) Social tolerance; and (3) Belief in the universality of human rights.
The country-level youth average for Sharing a human rights ethos dimension is at 6.5, and the averages for the Chisinau, Northern, Central, Southern, and Gagauzia regions are 6.9, 6.3, 6.6, 6.4, and 6.4 respectively.
The country-level youth average for the Overall support for human rights subdimension is 7.4, and the averages for the Chisinau, Northern, Central, Southern, and Gagauzia regions are at 8.0, 6.9, 7.5, 7.2, and 7.3 respectively.
The country-level youth average for the Social tolerance of human rights subdimension is 4.8, and the averages for the Chisinau, Northern, Central, Southern, and Gagauzia regions are 5.3, 4.8, 4.6, 4.6, and 4.8 respectively.
The country-level youth average for the Belief in the universality of human rights subdimension is at 7.4, and the averages for the Chisinau, Northern, Central, Southern, and Gagauzia regions are at 7.3, 7.2, 7.5, 7.3, and 7.1 respectively. These averages are shown in Figure 4.1.
Figure 4.1 Average scores for Constructive citizenship dimensions and relevant subdimensions by regions.
6.96.3 6.6 6.4 6.4 6.5
8.0
6.97.5 7.2 7.3 7.3
5.34.8 4.6 4.6 4.8 4.8
7.3 7.2 7.5 7.3 7.1 7.4
0.0
1.0
2.0
3.0
4.0
5.0
6.0
7.0
8.0
9.0
10.0
Chisinau Northern Central Southern Gagauzia Total
Sharing human rights ethos
Sharing human rights ethosOverall support for human rightsSocial toleranceBelief in the universality of human rights

Youth SCORE Index: Republic of Moldova
52
This chapter is organized as follows:
Section 4.1: A closer look at Overall support for human rights Section 4.2: A closer look at Social tolerance Section 4.3: A closer look at Belief in the universality of human rights Section 4.4: A closer look at Sharing human rights ethos Section 4.5: Comparison with the Adult sample
4.1 Overall support for human rights
4.1.1 Structure of the subdimension
This subdimension is measured by five items, which are shown below:
Below is a list of statements about individual claims and priorities, to what extent do you think they are absolutely essential or optional for a well-functioning cohesive society?
1. Demanding equal pay for equal work for women. 2. Having the freedom to change, practice, worship, and teach any religion. 3. Having the right to counsel in front of the law for everyone irrespective of income,
ethnicity, religion, or language. 4. Having paid holiday for all workers enshrined in law. 5. Having the freedom of assembly that protects the ability of people to come together and
collectively express, promote, pursue, and defend their ideas in public spaces.
Each item has three ordered response categories, which are: (1) Totally unnecessary; (2) Good but optional, and (3) Absolutely essential.
Although items are very close in their overall difficulty/easiness—as shown in Table 4.1—the item on which youth expressed the highest inclination is Item 4 (Having paid holiday for all workers enshrined in law), and lowest was Item 2 (Having the freedom to change, practice, worship and teach any religion).
In other words, a relatively higher number of youths indicated that paid holiday must be enshrined in law—and relatively lower number of respondents indicated that freedom to change, practice, worship and teach any religion is essential. This item was also the one on which respondents disagreed among themselves the most (e.g., the dispersion in responses was the highest), while Item 4 was the one in which respondents had the least variation—implying relatively higher levels of consensus.
This signals that the freedom to change, practice, worship, and teach any religion is a somewhat controversial issue among the youth. However, if feasible, it will be informative to
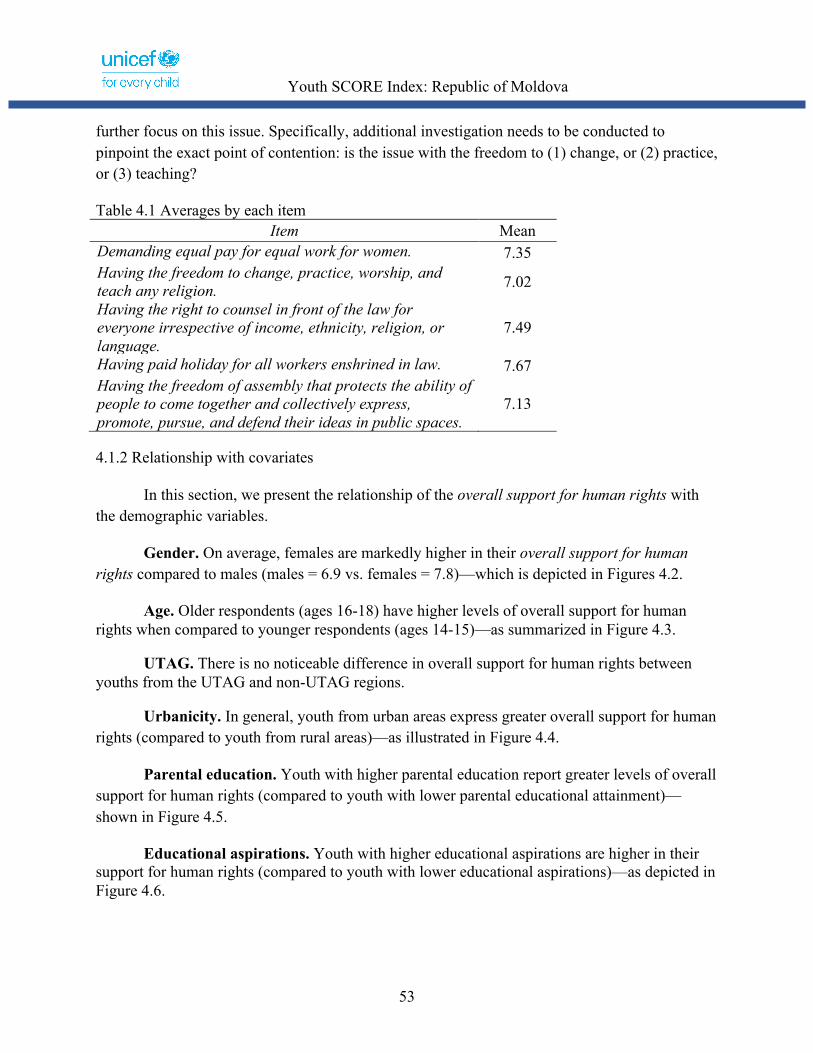
Youth SCORE Index: Republic of Moldova
53
further focus on this issue. Specifically, additional investigation needs to be conducted to pinpoint the exact point of contention: is the issue with the freedom to (1) change, or (2) practice, or (3) teaching?
Table 4.1 Averages by each item Item Mean
Demanding equal pay for equal work for women. 7.35 Having the freedom to change, practice, worship, and teach any religion. 7.02
Having the right to counsel in front of the law for everyone irrespective of income, ethnicity, religion, or language.
7.49
Having paid holiday for all workers enshrined in law. 7.67 Having the freedom of assembly that protects the ability of people to come together and collectively express, promote, pursue, and defend their ideas in public spaces.
7.13
4.1.2 Relationship with covariates
In this section, we present the relationship of the overall support for human rights with the demographic variables.
Gender. On average, females are markedly higher in their overall support for human rights compared to males (males = 6.9 vs. females = 7.8)—which is depicted in Figures 4.2.
Age. Older respondents (ages 16-18) have higher levels of overall support for human rights when compared to younger respondents (ages 14-15)—as summarized in Figure 4.3.
UTAG. There is no noticeable difference in overall support for human rights between youths from the UTAG and non-UTAG regions.
Urbanicity. In general, youth from urban areas express greater overall support for human rights (compared to youth from rural areas)—as illustrated in Figure 4.4.
Parental education. Youth with higher parental education report greater levels of overall support for human rights (compared to youth with lower parental educational attainment)—shown in Figure 4.5.
Educational aspirations. Youth with higher educational aspirations are higher in their support for human rights (compared to youth with lower educational aspirations)—as depicted in Figure 4.6.
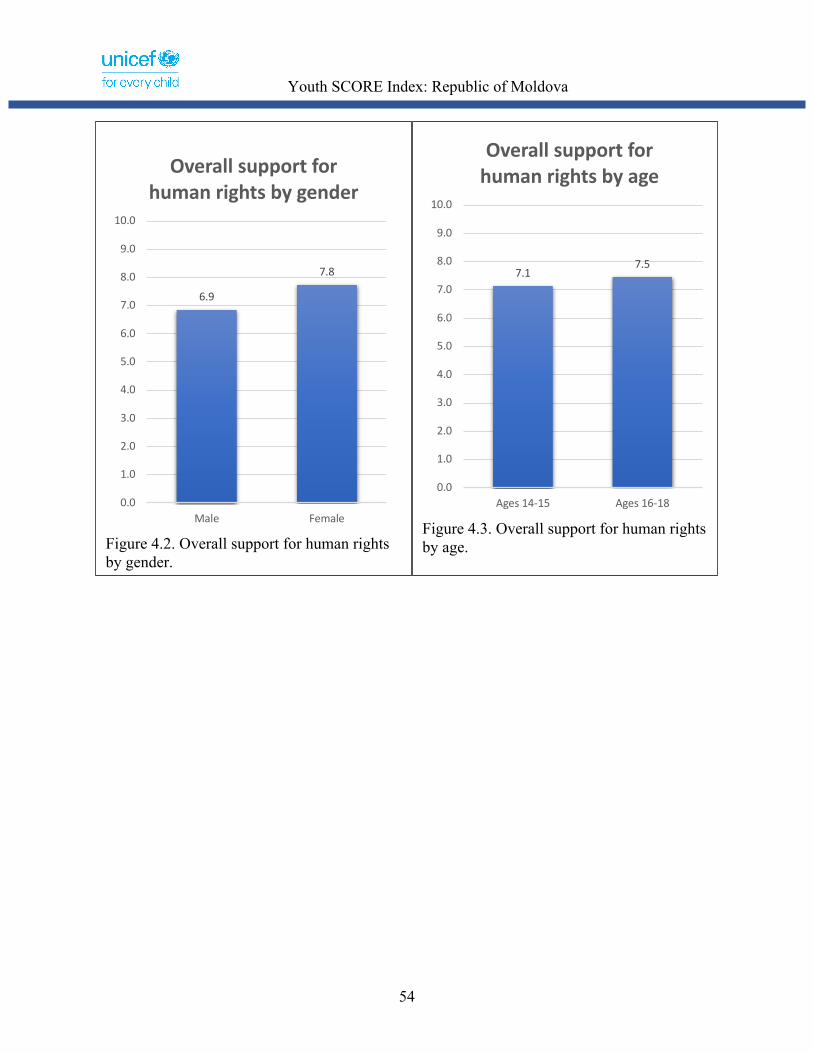
Youth SCORE Index: Republic of Moldova
54
Figure 4.2. Overall support for human rights by gender.
6.9
7.8
0.0
1.0
2.0
3.0
4.0
5.0
6.0
7.0
8.0
9.0
10.0
Male Female
Overall support for human rights by gender
Figure 4.3. Overall support for human rights by age.
7.17.5
0.0
1.0
2.0
3.0
4.0
5.0
6.0
7.0
8.0
9.0
10.0
Ages 14-15 Ages 16-18
Overall support for human rights by age
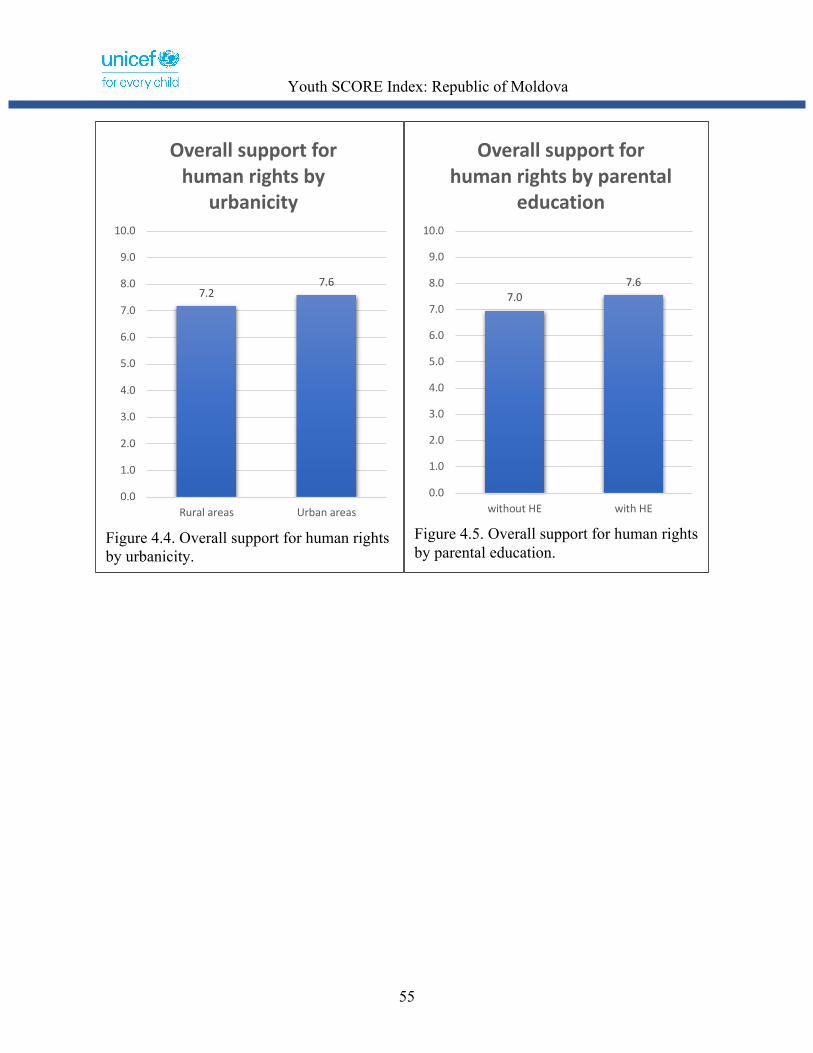
Youth SCORE Index: Republic of Moldova
55
Figure 4.4. Overall support for human rights by urbanicity.
7.27.6
0.0
1.0
2.0
3.0
4.0
5.0
6.0
7.0
8.0
9.0
10.0
Rural areas Urban areas
Overall support for human rights by
urbanicity
Figure 4.5. Overall support for human rights by parental education.
7.07.6
0.0
1.0
2.0
3.0
4.0
5.0
6.0
7.0
8.0
9.0
10.0
without HE with HE
Overall support for human rights by parental
education
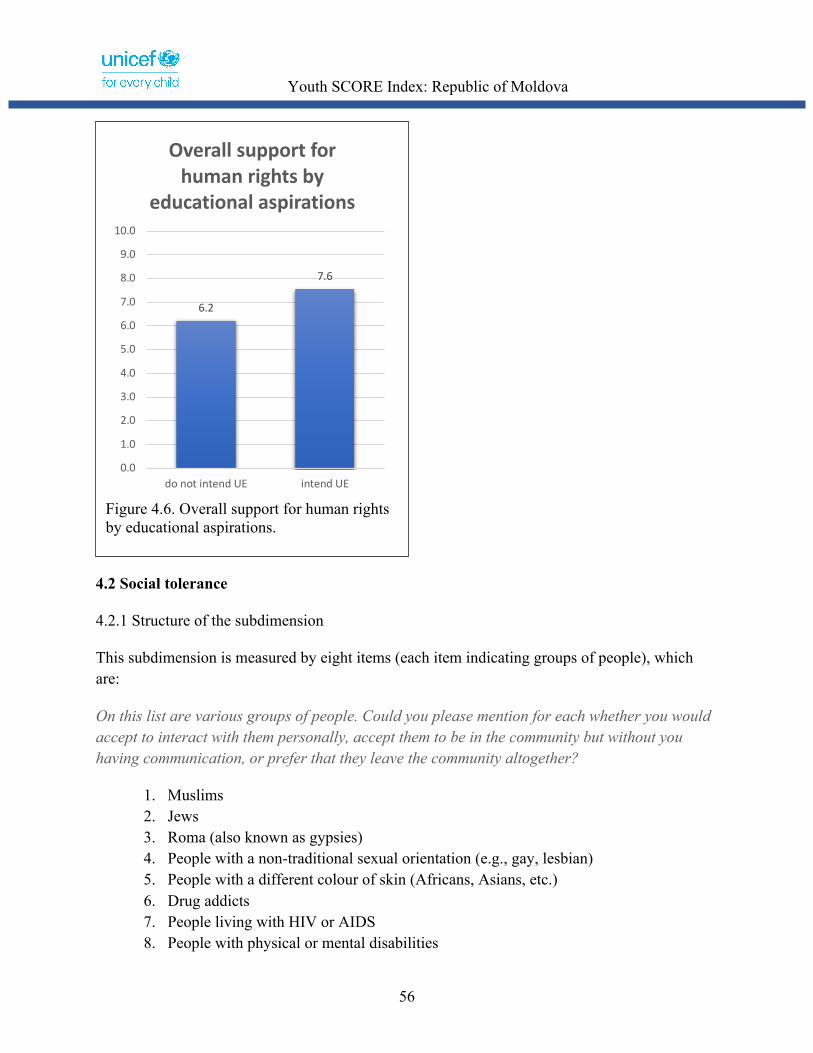
Youth SCORE Index: Republic of Moldova
56
4.2 Social tolerance
4.2.1 Structure of the subdimension
This subdimension is measured by eight items (each item indicating groups of people), which are:
On this list are various groups of people. Could you please mention for each whether you would accept to interact with them personally, accept them to be in the community but without you having communication, or prefer that they leave the community altogether?
1. Muslims 2. Jews 3. Roma (also known as gypsies) 4. People with a non-traditional sexual orientation (e.g., gay, lesbian) 5. People with a different colour of skin (Africans, Asians, etc.) 6. Drug addicts 7. People living with HIV or AIDS 8. People with physical or mental disabilities
Figure 4.6. Overall support for human rights by educational aspirations.
6.2
7.6
0.0
1.0
2.0
3.0
4.0
5.0
6.0
7.0
8.0
9.0
10.0
do not intend UE intend UE
Overall support for human rights by
educational aspirations
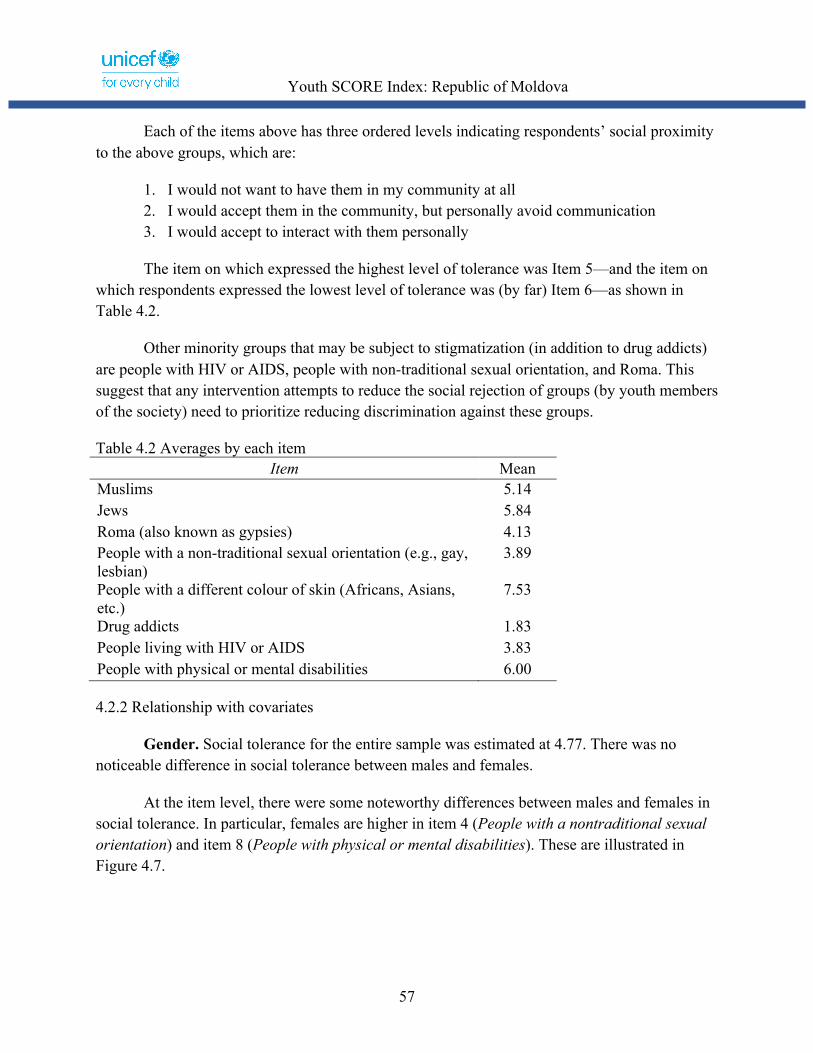
Youth SCORE Index: Republic of Moldova
57
Each of the items above has three ordered levels indicating respondents’ social proximity to the above groups, which are:
1. I would not want to have them in my community at all 2. I would accept them in the community, but personally avoid communication 3. I would accept to interact with them personally
The item on which expressed the highest level of tolerance was Item 5—and the item on which respondents expressed the lowest level of tolerance was (by far) Item 6—as shown in Table 4.2.
Other minority groups that may be subject to stigmatization (in addition to drug addicts) are people with HIV or AIDS, people with non-traditional sexual orientation, and Roma. This suggest that any intervention attempts to reduce the social rejection of groups (by youth members of the society) need to prioritize reducing discrimination against these groups.
Table 4.2 Averages by each item Item Mean
Muslims 5.14 Jews 5.84 Roma (also known as gypsies) 4.13 People with a non-traditional sexual orientation (e.g., gay, lesbian)
3.89
People with a different colour of skin (Africans, Asians, etc.)
7.53
Drug addicts 1.83 People living with HIV or AIDS 3.83 People with physical or mental disabilities 6.00
4.2.2 Relationship with covariates
Gender. Social tolerance for the entire sample was estimated at 4.77. There was no noticeable difference in social tolerance between males and females.
At the item level, there were some noteworthy differences between males and females in social tolerance. In particular, females are higher in item 4 (People with a nontraditional sexual orientation) and item 8 (People with physical or mental disabilities). These are illustrated in Figure 4.7.

Youth SCORE Index: Republic of Moldova
58
Age. Social tolerance increases by age. This relationship between age and social tolerance is not significant for Chisinau, where respondents from the youngest age group are already high in their social tolerance—which is depicted in Figure 4.8.
Figure 4.7. Social tolerance by gender.
5.2 5.1
6.15.6
4.1 4.13.4
4.3
7.4 7.7
2.0 1.7
3.7 3.9
5.76.2
0.0
2.0
4.0
6.0
8.0
10.0
Male Female
Social tolerance by gender
Social tolerance towards MuslimsSocial tolerance towards JewsSocial tolerance towards Roma Social tolerance towards people with non-traditional sexual orientationSocial tolerance towards people with different colour of skinSocial tolerance towards drug addictsSocial tolerance towards people with HIV or AIDSSocial tolerance towards people with physical or mental disabilities

Youth SCORE Index: Republic of Moldova
59
UTAG. There is no difference in social tolerance between youth from UTAG and non-UTAG regions. However, at the item level, youth from the UTAG region are substantially higher on Item 1 (social tolerance towards Muslims) and lower on Item 4 (people with non-traditional sexual orientation). These differences are illustrated in Figure 4.9.
Figure 4.8. Social tolerance by age, across regions.
5.3
4.54.1 4.3 4.3 4.4
5.35.0 5.0 4.7
5.1 5.0
0.0
1.0
2.0
3.0
4.0
5.0
6.0
7.0
8.0
9.0
10.0
Chisinau Northern Central Southern Gagauzia Total
Social tolerance by age
Ages 14-15 Ages 16-18

Youth SCORE Index: Republic of Moldova
60
Urbanicity: Youth from the urban areas are markedly more socially tolerant then youth from rural areas—as visualized in Figure 4.10. Items on which youth from urban and rural areas differed the most are (1) tolerance towards Jews; (2) tolerance towards Roma; (3) tolerance towards people living with HIV or AIDS, and; (4) tolerance towards Muslims. These differences are shown in Figure 4.11.
Figure 4.9. Social tolerance by regions.
5.95.3
4.6 4.8
6.0
5.1
6.7
5.95.6
5.2
6.25.8
4.14.4
3.84.3 4.4
4.1
5.2
4.13.7
3.32.8
3.9
8.1
7.27.5 7.7 7.6 7.5
1.82.1
1.81.4 1.5
1.8
4.7
3.53.8 3.9
3.53.8
6.35.6
6.2 6.2 6.0 6.0
0.01.02.03.04.05.06.07.08.09.0
10.0
Chisinau Northern Central Southern Gagauzia Total
Social tolerance by region
Social tolerance towards MuslimsSocial tolerance towards JewsSocial tolerance towards RomaSocial tolerance towards people with non-traditional sexual orientationSocial tolerance towards people with different colour of skinSocial tolerance towards drug addictsSocial tolerance towards people with HIV or AIDSSocial tolerance towards people with physical or mental disabilities
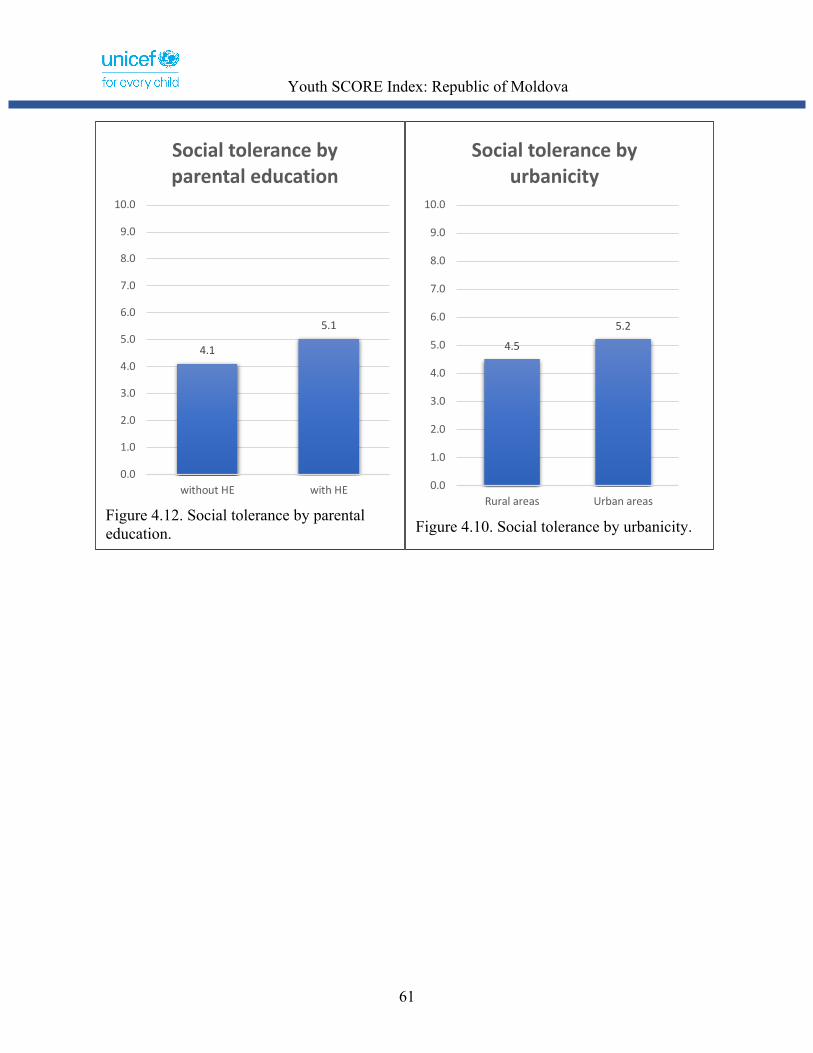
Youth SCORE Index: Republic of Moldova
61
Figure 4.12. Social tolerance by parental education.
4.1
5.1
0.0
1.0
2.0
3.0
4.0
5.0
6.0
7.0
8.0
9.0
10.0
without HE with HE
Social tolerance by parental education
Figure 4.10. Social tolerance by urbanicity.
4.5
5.2
0.0
1.0
2.0
3.0
4.0
5.0
6.0
7.0
8.0
9.0
10.0
Rural areas Urban areas
Social tolerance by urbanicity

Youth SCORE Index: Republic of Moldova
62
Parental education: Youth whose parents have higher educational attainment are markedly higher in their social tolerance (than youth whose parents have lower educational attainment)—shown in Figure 4.12.
Educational aspirations: There is a significant association between the educational aspiration of respondents with their social tolerance—as depicted in Figure 4.13.
Figure 4.11. Social tolerance by urbanicity.
4.8
5.75.4
6.6
4.04.4
3.5
4.7
7.38.0
1.7 2.0
3.54.4
5.9 6.1
0.0
2.0
4.0
6.0
8.0
10.0
Rural areas Urban areas
Social tolerance by urbanicity
Social tolerance towards MuslimsSocial tolerance towards JewsSocial tolerance towards RomaSocial tolerance towards people with non-traditional sexual orientationSocial tolerance towards people with different colour of skinSocial tolerance towards drug addictsSocial tolerance towards people with HIV or AIDSSocial tolerance towards people with physical or mental disabilities

Youth SCORE Index: Republic of Moldova
63
4.3 Belief in the universality of human rights
4.3.1 Structure of the subdimension
This subdimension is comprised of a single item. Respondents were presented with two statements and were asked to pick the one that is the closest to their views—as shown below and Table 4.3.
The items listed in the question above are commonly described as human rights. When it comes to human rights, which of the two statements come closer to your view?
Table 4.3 Belief in universality of human rights in the Youth survey.
First Statement
Strongly Agree with first
Agree with first
Agree with second
Strongly Agree with second
Second Statement
Human rights are universal. All people are entitled to human rights 1 2 3 4
Human rights cannot be universal. Each person should earn their rights through their actions and not expect anything to be given to them just because they exist.
Figure 4.13. Social tolerance by educational aspiration.
4.0
4.9
0.0
1.0
2.0
3.0
4.0
5.0
6.0
7.0
8.0
9.0
10.0
do not intend UE intend UE
Social tolerance by educational aspirations

Youth SCORE Index: Republic of Moldova
64
simply because they are human.
Of the respondents, 46.8% indicated that they strongly agree with the first statement, 31.5% indicated that they agree with the first statement, 15.7% indicated that they agree with the second statement, and 6% of respondents indicated that strongly agree with the second statement. The average was estimated at 7.36.
4.3.2 Relationship with covariates
Gender. There is no difference between male and female respondents in their belief in the universality of human rights.
Age. Age is not association with youths’ belief in the universality of human rights.
UTAG. Belief in the universality of human rights between UTAG and non-UTAG youth does not vary considerably.
Urbanicity. There is no association between urbanicity and belief in the universality of human rights.
Figure 4.14. Sharing human rights ethos by gender.
6.36.7
0.0
1.0
2.0
3.0
4.0
5.0
6.0
7.0
8.0
9.0
10.0
Male Female
Sharing human rights ethos by gender
Figure 4.15. Sharing human rights ethos by age.
6.36.6
0.0
1.0
2.0
3.0
4.0
5.0
6.0
7.0
8.0
9.0
10.0
Ages 14-15 Ages 16-18
Sharing human rights ethos by age
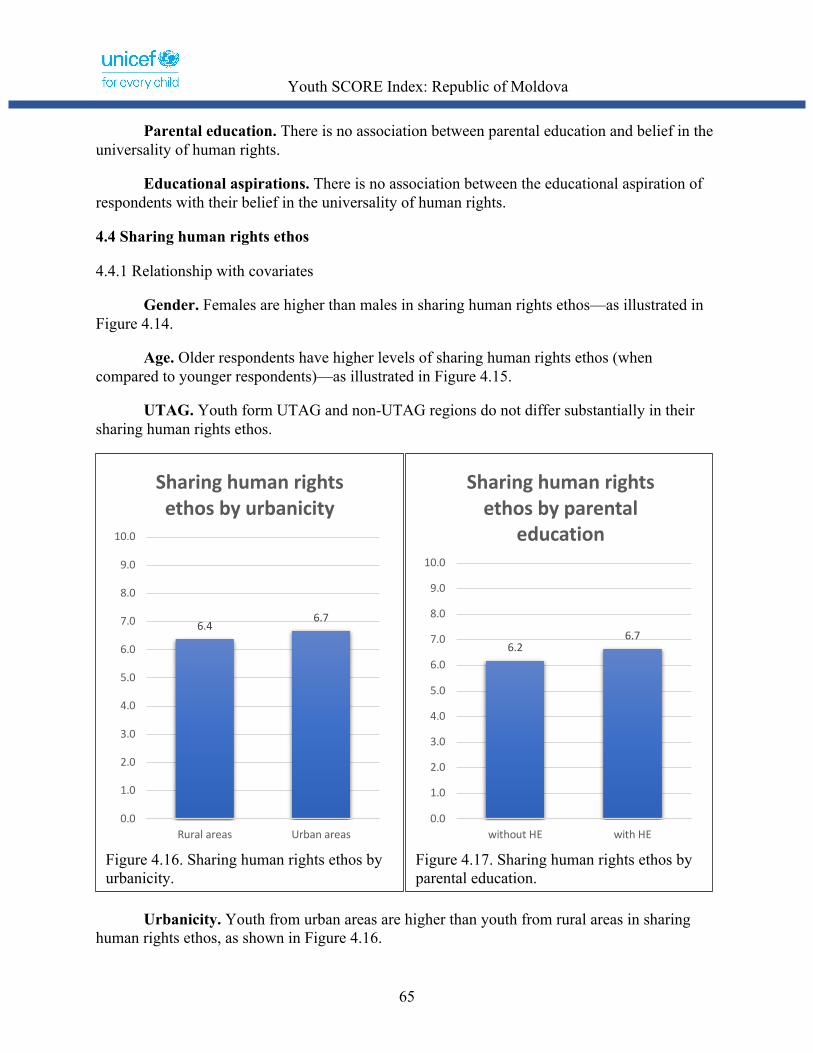
Youth SCORE Index: Republic of Moldova
65
Parental education. There is no association between parental education and belief in the universality of human rights.
Educational aspirations. There is no association between the educational aspiration of respondents with their belief in the universality of human rights.
4.4 Sharing human rights ethos
4.4.1 Relationship with covariates
Gender. Females are higher than males in sharing human rights ethos—as illustrated in Figure 4.14.
Age. Older respondents have higher levels of sharing human rights ethos (when compared to younger respondents)—as illustrated in Figure 4.15.
UTAG. Youth form UTAG and non-UTAG regions do not differ substantially in their sharing human rights ethos.
Urbanicity. Youth from urban areas are higher than youth from rural areas in sharing human rights ethos, as shown in Figure 4.16.
Figure 4.16. Sharing human rights ethos by urbanicity.
6.46.7
0.0
1.0
2.0
3.0
4.0
5.0
6.0
7.0
8.0
9.0
10.0
Rural areas Urban areas
Sharing human rights ethos by urbanicity
Figure 4.17. Sharing human rights ethos by parental education.
6.26.7
0.0
1.0
2.0
3.0
4.0
5.0
6.0
7.0
8.0
9.0
10.0
without HE with HE
Sharing human rights ethos by parental
education
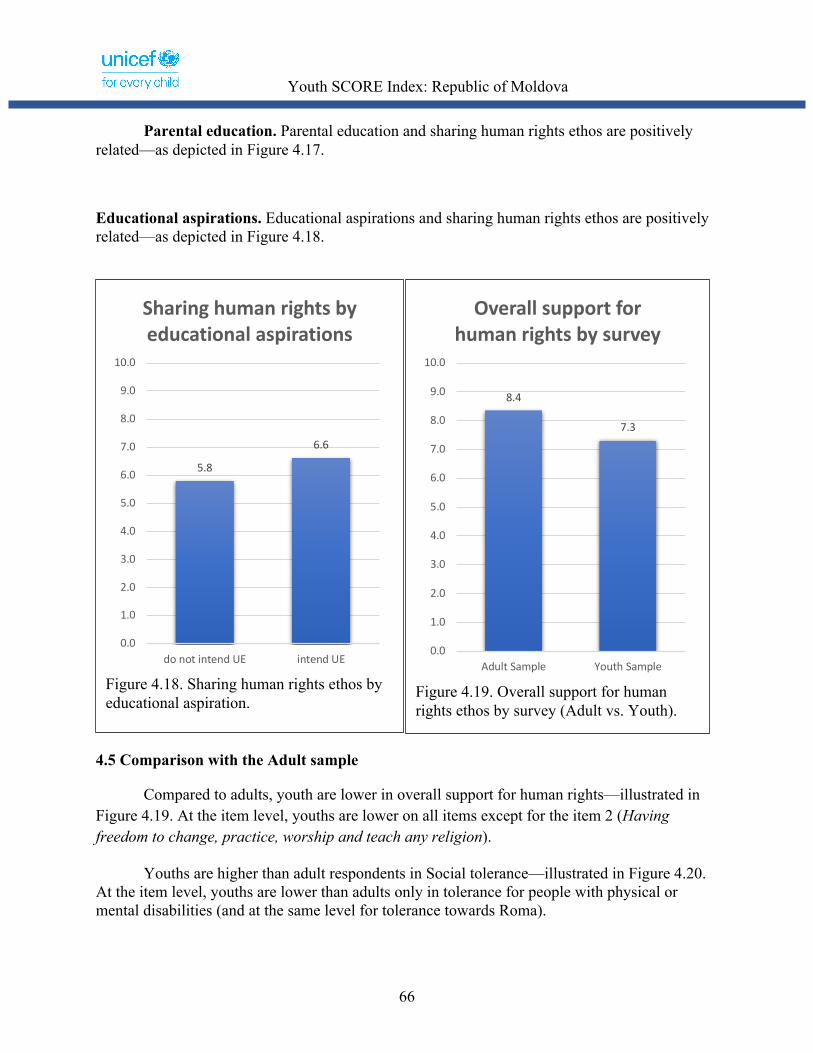
Youth SCORE Index: Republic of Moldova
66
Parental education. Parental education and sharing human rights ethos are positively related—as depicted in Figure 4.17.
Educational aspirations. Educational aspirations and sharing human rights ethos are positively related—as depicted in Figure 4.18.
4.5 Comparison with the Adult sample
Compared to adults, youth are lower in overall support for human rights—illustrated in Figure 4.19. At the item level, youths are lower on all items except for the item 2 (Having freedom to change, practice, worship and teach any religion).
Youths are higher than adult respondents in Social tolerance—illustrated in Figure 4.20. At the item level, youths are lower than adults only in tolerance for people with physical or mental disabilities (and at the same level for tolerance towards Roma).
Figure 4.18. Sharing human rights ethos by educational aspiration.
5.8
6.6
0.0
1.0
2.0
3.0
4.0
5.0
6.0
7.0
8.0
9.0
10.0
do not intend UE intend UE
Sharing human rights by educational aspirations
Figure 4.19. Overall support for human rights ethos by survey (Adult vs. Youth).
8.4
7.3
0.0
1.0
2.0
3.0
4.0
5.0
6.0
7.0
8.0
9.0
10.0
Adult Sample Youth Sample
Overall support for human rights by survey
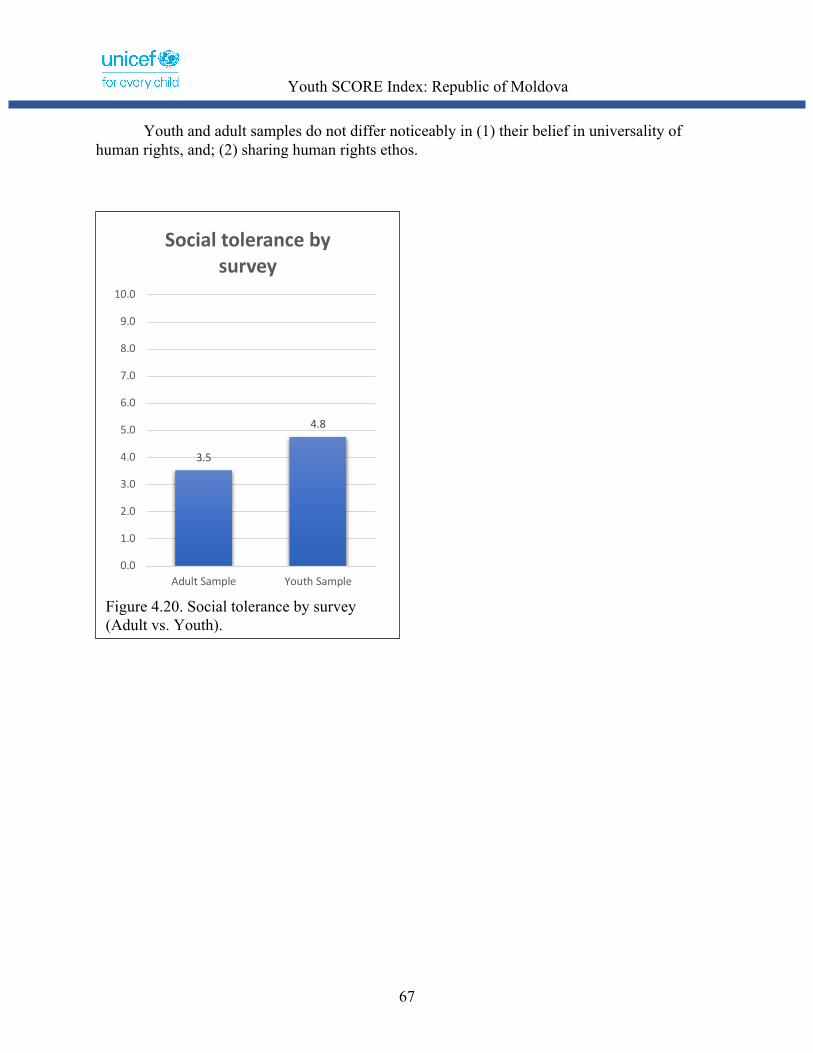
Youth SCORE Index: Republic of Moldova
67
Youth and adult samples do not differ noticeably in (1) their belief in universality of human rights, and; (2) sharing human rights ethos.
Figure 4.20. Social tolerance by survey (Adult vs. Youth).
3.5
4.8
0.0
1.0
2.0
3.0
4.0
5.0
6.0
7.0
8.0
9.0
10.0
Adult Sample Youth Sample
Social tolerance by survey
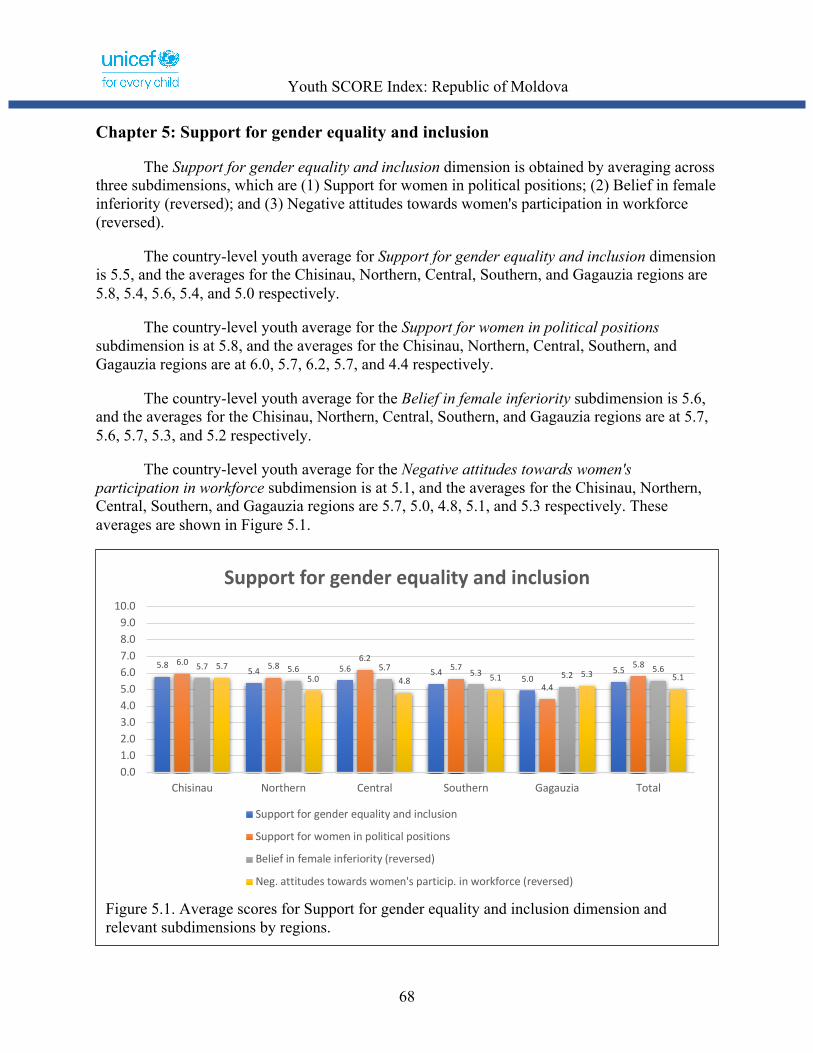
Youth SCORE Index: Republic of Moldova
68
Chapter 5: Support for gender equality and inclusion
The Support for gender equality and inclusion dimension is obtained by averaging across three subdimensions, which are (1) Support for women in political positions; (2) Belief in female inferiority (reversed); and (3) Negative attitudes towards women's participation in workforce (reversed).
The country-level youth average for Support for gender equality and inclusion dimension is 5.5, and the averages for the Chisinau, Northern, Central, Southern, and Gagauzia regions are 5.8, 5.4, 5.6, 5.4, and 5.0 respectively.
The country-level youth average for the Support for women in political positions subdimension is at 5.8, and the averages for the Chisinau, Northern, Central, Southern, and Gagauzia regions are at 6.0, 5.7, 6.2, 5.7, and 4.4 respectively.
The country-level youth average for the Belief in female inferiority subdimension is 5.6, and the averages for the Chisinau, Northern, Central, Southern, and Gagauzia regions are at 5.7, 5.6, 5.7, 5.3, and 5.2 respectively.
The country-level youth average for the Negative attitudes towards women's participation in workforce subdimension is at 5.1, and the averages for the Chisinau, Northern, Central, Southern, and Gagauzia regions are 5.7, 5.0, 4.8, 5.1, and 5.3 respectively. These averages are shown in Figure 5.1.
Figure 5.1. Average scores for Support for gender equality and inclusion dimension and relevant subdimensions by regions.
5.85.4 5.6 5.4
5.05.5
6.0 5.86.2
5.7
4.4
5.85.7 5.6 5.7 5.3 5.25.65.7
5.0 4.8 5.1 5.3 5.1
0.01.02.03.04.05.06.07.08.09.0
10.0
Chisinau Northern Central Southern Gagauzia Total
Support for gender equality and inclusion
Support for gender equality and inclusion
Support for women in political positions
Belief in female inferiority (reversed)
Neg. attitudes towards women's particip. in workforce (reversed)

Youth SCORE Index: Republic of Moldova
69
This chapter is organized as follows:
Section 5.1: A closer look at Support for women in political positions Section 5.2: A closer look at Belief in female inferiority Section 5.3: A closer look at Negative attitudes towards women's participation in workforce Section 5.4: A closer look at Support for gender equality and inclusion as a composite dimension Section 5.5: Comparison with the Adult sample
5.1 Support for women in political positions
5.1.1 Structure of the subdimension
This subdimension is comprised of a single item and aims to measure respondents’ agreement on participation of women in politics in Moldova. Youths were asked to indicate their agreement with the following statement: “I think there should be more women in political positions in Moldova”. Response categories for this statement are (1) Strongly Disagree; (2) Somewhat Disagree; (3) Somewhat agree; (4) Strongly agree.
Of the respondents, 9.4% selected Strongly Disagree; 26.9% selected Somewhat Disagree; 42.8% selected Somewhat Agree; and 20.1% indicated a strong agreement.
5.1.2 Relationship with demographic variables
Gender. Within Moldova overall, and across each of the five regions, females are more likely to express that there should be more women in political positions in Moldova—as illustrated in Figure 5.2. These gender differences are highest in Chisinau and lowest in Gagauzia.
Age. Support for women in political positions and age are not correlated.
UTAG. Youth from the UTAG region noticeably lower (than other regions) in their support for women in political positions—as depicted in Figure 5.3.
Urbanicity. Support for women in political positions and urbanicity are not associated.
Parental education. Support for women in political positions and parental education are not correlated.
Educational aspirations. Youth who intend to obtain UE are higher in their support for women in political positions (than youth who have lower educational aspirations)—as shown in Figure 5.4.
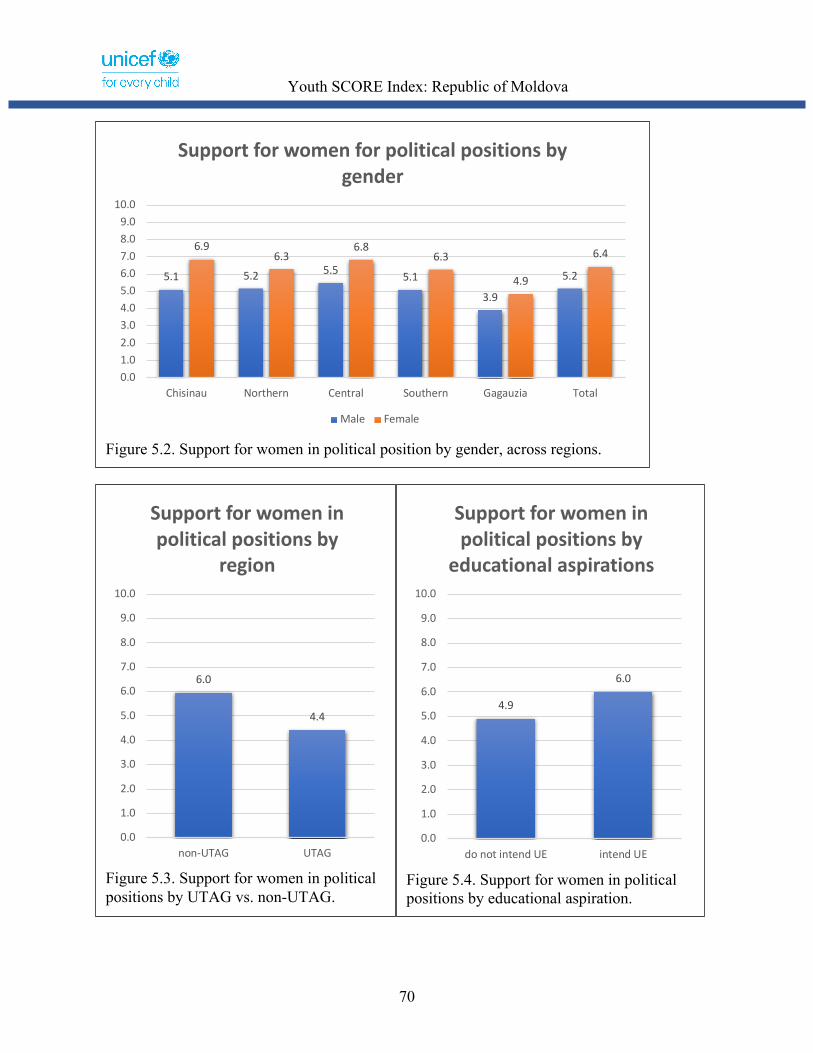
Youth SCORE Index: Republic of Moldova
70
Figure 5.2. Support for women in political position by gender, across regions.
5.1 5.2 5.5 5.1
3.9
5.2
6.96.3
6.86.3
4.9
6.4
0.01.02.03.04.05.06.07.08.09.0
10.0
Chisinau Northern Central Southern Gagauzia Total
Support for women for political positions by gender
Male Female
Figure 5.3. Support for women in political positions by UTAG vs. non-UTAG.
6.0
4.4
0.0
1.0
2.0
3.0
4.0
5.0
6.0
7.0
8.0
9.0
10.0
non-UTAG UTAG
Support for women in political positions by
region
Figure 5.4. Support for women in political positions by educational aspiration.
4.9
6.0
0.0
1.0
2.0
3.0
4.0
5.0
6.0
7.0
8.0
9.0
10.0
do not intend UE intend UE
Support for women in political positions by
educational aspirations

Youth SCORE Index: Republic of Moldova
71
5.2 Belief in female inferiority
5.2.1 Structure of the dimension
This subdimension is measured by two items (with response categories ranging from strongly disagree to strongly agree), which are:
1. I think women are too emotional and this affects their rationality and judgement. 2. I think men in the family should have the final word when important decisions are made.
Table 5.2 Averages by each item Item Mean
I think women are too emotional and this affects their rationality and judgement. 4.45
I think men in the family should have the final word when important decisions are made. 4.41
5.2.2 Relationship with covariates
Gender. Across all five regions, there is a substantial gender gap in youths’ belief in female inferiority—illustrated in Figure 5.5.
Age. Youths’ belief in female inferiority does not vary significantly across age levels in the data.
UTAG. Belief in female inferiority does not vary considerably between youths from UTAG and non-UTAG regions.
Urbanicity: Youths from rural and urban areas do not differ in their belief in female inferiority.
Parental education: Youths whose parents have higher educational attainment are lower in their belief in female inferiority—as illustrated in Figure 5.6.
Educational aspirations: Youth with higher educational aspirations are lower in their belief in female inferiority (compared to those with lower educational aspirations)—as summarized in Figure 5.7.
5.3 Negative attitudes towards women's participation in workforce
5.3.1 Structure of the dimension

Youth SCORE Index: Republic of Moldova
72
This subdimension is measured by three items (with response categories ranging from strongly disagree to strongly agree), which are:
1. I think women should have more delicate jobs (e.g. nurse, teacher, secretary, receptionist).
2. I think women should give up work to raise their children if the men can provide for the family.
3. When women work they are taking jobs away from men.
Table 5.3 summarizes item averages for this subdimension.
Table 5.3 Averages by each item Item Mean
I think women should have more delicate jobs (e.g. nurse, teacher, secretary, receptionist). 6.23
I think women should give up work to raise their children if the men can provide for the family. 4.46
When women work they are taking jobs away from men. 4.13

Youth SCORE Index: Republic of Moldova
73
As we see in Table 5.3, a considerable factor of negative attitudes towards women’s participation in workforce is manifested in youths’ perception that women should have more delicate jobs. This can be prioritized in reducing youths’ overall negative attitudes towards women’s participation.
5.2.2 Relationship with covariates
Gender. Male and female respondents differ substantially in their attitudes towards women’s participation in workforce—as illustrated in Figure 5.8.
Age. Youths’ age is not correlated with their attitude towards women’s participation in workforce.
UTAG. UTAG and non-UTAG respondents do not differ significantly in their attitude towards women’s participation in workforce.
Urbanicity: Youth from urban areas are substantially more positive towards women’s participations in workforce (compared to youth from rural areas)—which is illustrated in Figure
Figure 5.5. Belief in female inferiority (reversed) by gender.
4.7
6.4
0.0
1.0
2.0
3.0
4.0
5.0
6.0
7.0
8.0
9.0
10.0
Male Female
Belief in female inferiority (reversed) by
gender
Figure 5.6. Belief in female inferiority (reversed) by parental education.
5.1
5.8
0.0
1.0
2.0
3.0
4.0
5.0
6.0
7.0
8.0
9.0
10.0
without HE with HE
Belief in female inferiority (reversed) by
parental education

Youth SCORE Index: Republic of Moldova
74
5.9—with the largest difference observed in the first item (“I think women should have more delicate jobs”).
Parental education: Youth from families with a higher educational attainment are considerably more positive towards female participation in workforce (compared to those whose parents have lower educational attainment)—depicted in Figure 5.10.
Figure 5.7. Belief in female inferiority by educational aspiration.
4.5
5.8
0.0
1.0
2.0
3.0
4.0
5.0
6.0
7.0
8.0
9.0
10.0
do not intend UE intend UE
Belief in female inferiority (reversed) by educational aspirations
Figure 5.8. Negative attitudes towards women’s participation in workforce by gender.
4.75.4
0.0
1.0
2.0
3.0
4.0
5.0
6.0
7.0
8.0
9.0
10.0
Male Female
Negative attitudes towards women's
participation in workforce (reversed) by
gender
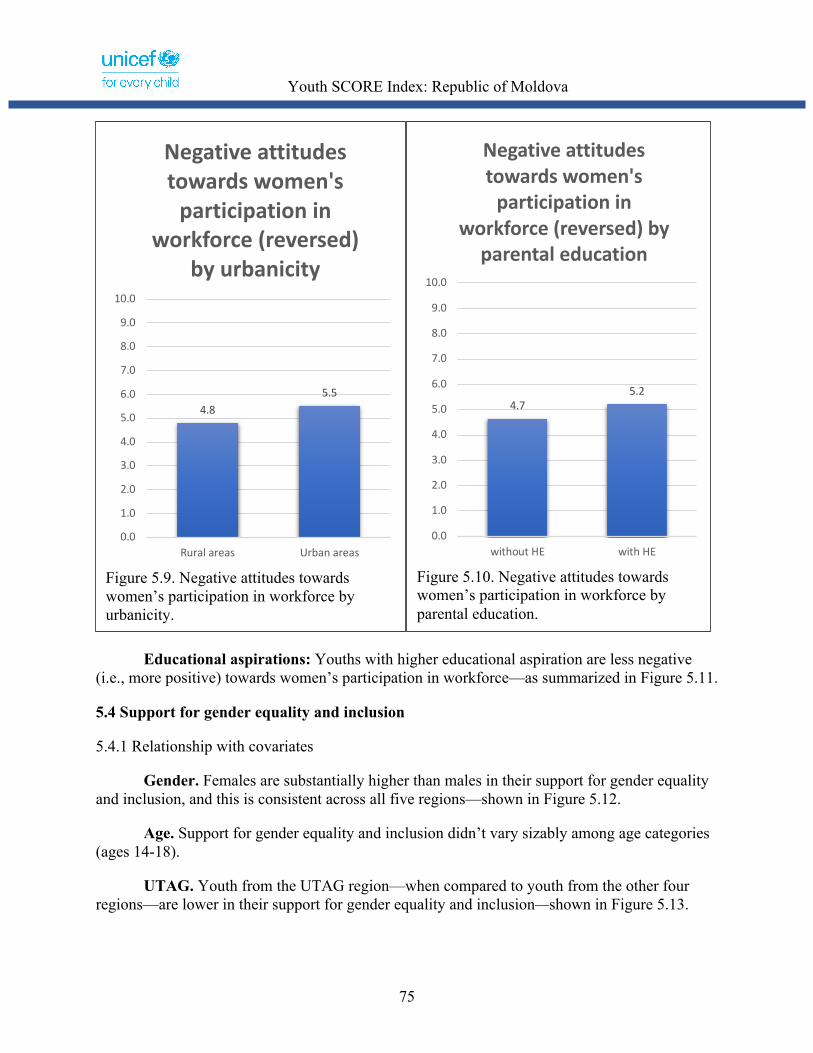
Youth SCORE Index: Republic of Moldova
75
Educational aspirations: Youths with higher educational aspiration are less negative (i.e., more positive) towards women’s participation in workforce—as summarized in Figure 5.11.
5.4 Support for gender equality and inclusion
5.4.1 Relationship with covariates
Gender. Females are substantially higher than males in their support for gender equality and inclusion, and this is consistent across all five regions—shown in Figure 5.12.
Age. Support for gender equality and inclusion didn’t vary sizably among age categories (ages 14-18).
UTAG. Youth from the UTAG region—when compared to youth from the other four regions—are lower in their support for gender equality and inclusion—shown in Figure 5.13.
Figure 5.9. Negative attitudes towards women’s participation in workforce by urbanicity.
4.85.5
0.0
1.0
2.0
3.0
4.0
5.0
6.0
7.0
8.0
9.0
10.0
Rural areas Urban areas
Negative attitudes towards women's
participation in workforce (reversed)
by urbanicity
Figure 5.10. Negative attitudes towards women’s participation in workforce by parental education.
4.75.2
0.0
1.0
2.0
3.0
4.0
5.0
6.0
7.0
8.0
9.0
10.0
without HE with HE
Negative attitudes towards women's
participation in workforce (reversed) by
parental education

Youth SCORE Index: Republic of Moldova
76
Figure 5.11. Negative attitudes towards women’s participation in workforce by educational aspiration.
4.65.2
0.0
2.0
4.0
6.0
8.0
10.0
do not intend UE intend UE
Negative attitudes towards women's
participation in workforce (reversed)
by educational aspirations
Figure 5.13. Support for gender equality and inclusion by UTAG vs. non-UTAG.
5.55.0
0.0
1.0
2.0
3.0
4.0
5.0
6.0
7.0
8.0
9.0
10.0
non-UTAG UTAG
Support for gender equality and inclusion by
region
Figure 5.12. Support for gender equality and inclusion by gender, across regions.
5.0 4.8 5.0 4.84.2
4.9
6.66.0 6.1 6.0
5.66.1
0.0
1.0
2.0
3.0
4.0
5.0
6.0
7.0
8.0
9.0
10.0
Chisinau Northern Central Southern Gagauzia Total
Support for gender equality and inclusion by gender
Male Female
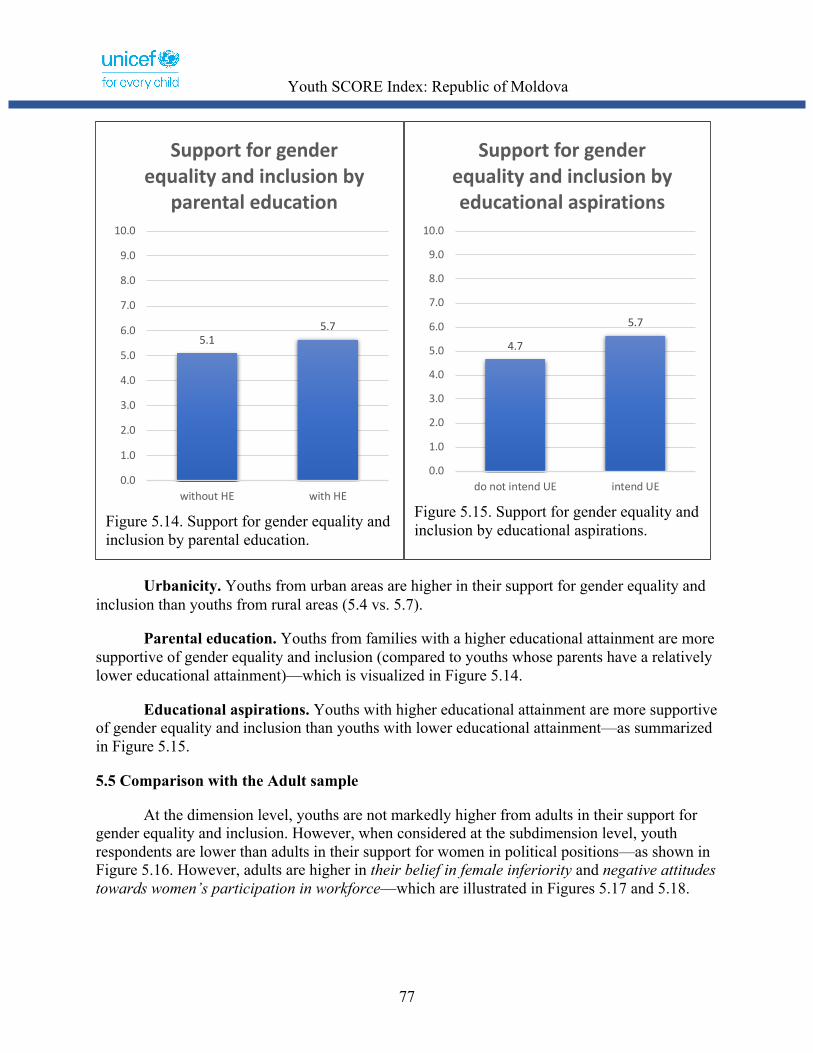
Youth SCORE Index: Republic of Moldova
77
Urbanicity. Youths from urban areas are higher in their support for gender equality and inclusion than youths from rural areas (5.4 vs. 5.7).
Parental education. Youths from families with a higher educational attainment are more supportive of gender equality and inclusion (compared to youths whose parents have a relatively lower educational attainment)—which is visualized in Figure 5.14.
Educational aspirations. Youths with higher educational attainment are more supportive of gender equality and inclusion than youths with lower educational attainment—as summarized in Figure 5.15.
5.5 Comparison with the Adult sample
At the dimension level, youths are not markedly higher from adults in their support for gender equality and inclusion. However, when considered at the subdimension level, youth respondents are lower than adults in their support for women in political positions—as shown in Figure 5.16. However, adults are higher in their belief in female inferiority and negative attitudes towards women’s participation in workforce—which are illustrated in Figures 5.17 and 5.18.
Figure 5.14. Support for gender equality and inclusion by parental education.
5.15.7
0.0
1.0
2.0
3.0
4.0
5.0
6.0
7.0
8.0
9.0
10.0
without HE with HE
Support for gender equality and inclusion by
parental education
Figure 5.15. Support for gender equality and inclusion by educational aspirations.
4.7
5.7
0.0
1.0
2.0
3.0
4.0
5.0
6.0
7.0
8.0
9.0
10.0
do not intend UE intend UE
Support for gender equality and inclusion by educational aspirations

Youth SCORE Index: Republic of Moldova
78
Figure 5.16. Support for women in political positions by surveys (Adult vs. Youth).
6.35.8
0.0
1.0
2.0
3.0
4.0
5.0
6.0
7.0
8.0
9.0
10.0
Adult Sample Youth Sample
Support for women in political positions by
survey
Figure 5.17. Belief in female inferiority by surveys (Adult vs. Youth).
5.15.6
0.0
1.0
2.0
3.0
4.0
5.0
6.0
7.0
8.0
9.0
10.0
Adult Sample Youth Sample
Belief in female inferiority (reversed) by
survey

Youth SCORE Index: Republic of Moldova
79
Figure 5.18. Negative attitude towards women’s participation in workforce by surveys (Adult vs. Youth).
4.65.1
0.0
1.0
2.0
3.0
4.0
5.0
6.0
7.0
8.0
9.0
10.0
Adult Sample Youth Sample
Negative attitudes towards women's
participation in workforce (reversed) by
survey
Youth SCORE Index: Republic of Moldova
80
ANNEX

Youth SCORE Index: Republic of Moldova
81
THEMATIC BRIEF #1
VIOLENCE AGAINST CHILDREN
“The available research on victimization and social capital revealed a
strong association between the two variables. Prior research indicates that
social capital can serve as preventative strategy to bullying victimization. If
students gain strong social ties through different avenues such as
participation in school activities, trust in teachers and peers, or group
norms, it is presumed that bullying victimization will significantly
decrease.”14
Safety of youths in their microsystems such as families, schools, and neighborhoods play
a crucial role in their development. Violence results in both visible and invisible trauma on
youths. Moreover, young people witnessing consistent violence may experience stress and
depression. Research15 shows that being bullied has severe repercussions on adolescent’s life
such as loneliness, anxiety, depression, academic problems, personality disorders, and suicidal
thoughts.
The most common reason for bullying among youth in Moldova is child’s body shape,
followed by child being poor and child’s appearance. Overall, youth report that they are victims
of bullying less often, with the lowest level reported by youths in Gagauzia (1.83) and the
highest level of victimization reported by youths in the Northern region (2.84). Verbal
14http://www.ncsociology.org/sociationtoday/v152/sobba.html 15http://www.ncsociology.org/sociationtoday/v152/sobba.html

Youth SCORE Index: Republic of Moldova
82
victimization is the most common form of victimization among youth in Moldova—and cyber
victimization is the least common form of victimization that was reported by youths.
Young people in Moldova vary in the reported exposure to psychological adversity across
five regions. Youth from the UTAG regions report the lowest levels (2.17), and youth from
Chisinau report the highest level among five regions (3.97)—illustrated in Figure 1.
Exposure to domestic violence and psychological abuse do not vary much across the
regions. Males and females are almost identical in the reported exposure to domestic violence—
with males slightly high or reported psychological abuse. Youths whose parents have higher
levels of education report less exposure to domestic violence (compared to youths whose parents
are lower in their educational attainment)—as illustrated in Figure 2. The same is true for youths
with higher academic aspirations. Among youth in Moldova, reported neglect is below 1 in four
regions, and 1.2 in Chisinau. Males report neglect slightly more often. Same is true for the
reported physical abuse.
Reported bullying by respondents (i.e., how often survey respondents bully others) is
very rare, with males bullying others slightly more often than females. The most common form
of the reported bullying (of others by survey respondents) is verbal bullying.
Bullying others is related to aggression. Reported aggression—although does not vary
across regions noticeably—is the highest among youth in Gagauzia (4.29) and lowest among
youth in the Central region. Male youths are considerably higher in their reported aggression
than female youths. Similarly, youths from urban areas are higher in their reported aggression
than youths from rural areas.
Personal security of youth in Moldova is not very high—with youths from Chisinau
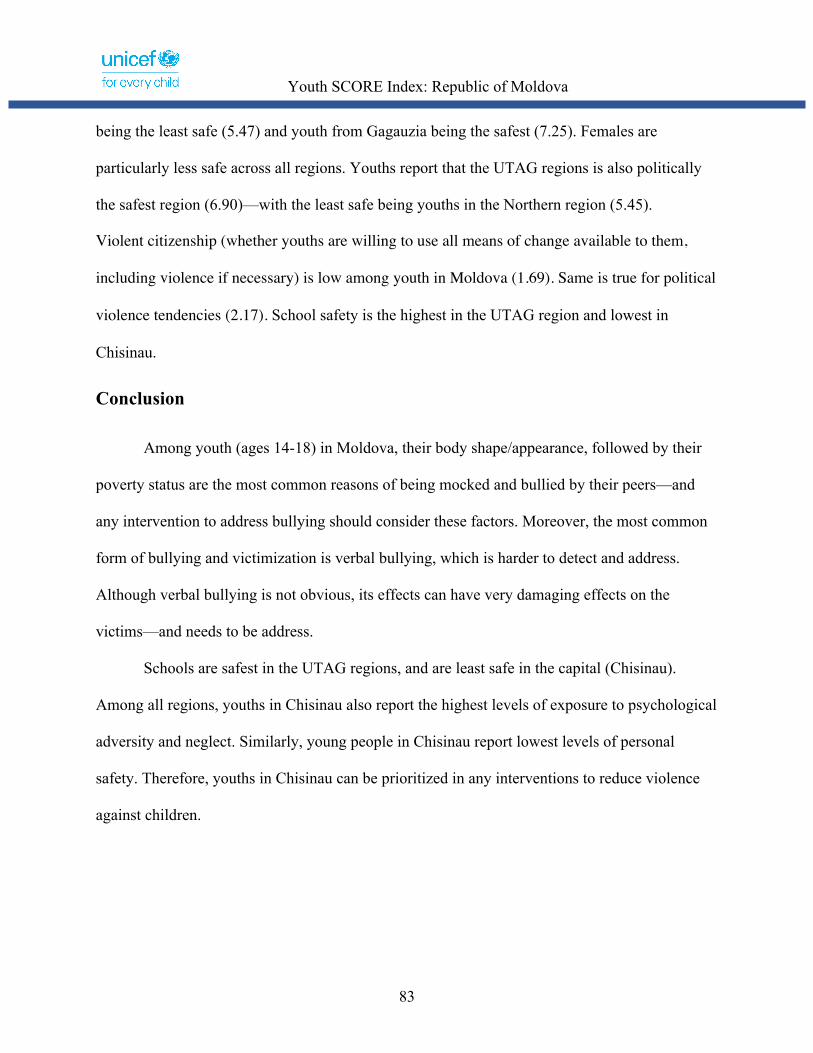
Youth SCORE Index: Republic of Moldova
83
being the least safe (5.47) and youth from Gagauzia being the safest (7.25). Females are
particularly less safe across all regions. Youths report that the UTAG regions is also politically
the safest region (6.90)—with the least safe being youths in the Northern region (5.45).
Violent citizenship (whether youths are willing to use all means of change available to them,
including violence if necessary) is low among youth in Moldova (1.69). Same is true for political
violence tendencies (2.17). School safety is the highest in the UTAG region and lowest in
Chisinau.
Conclusion
Among youth (ages 14-18) in Moldova, their body shape/appearance, followed by their
poverty status are the most common reasons of being mocked and bullied by their peers—and
any intervention to address bullying should consider these factors. Moreover, the most common
form of bullying and victimization is verbal bullying, which is harder to detect and address.
Although verbal bullying is not obvious, its effects can have very damaging effects on the
victims—and needs to be address.
Schools are safest in the UTAG regions, and are least safe in the capital (Chisinau).
Among all regions, youths in Chisinau also report the highest levels of exposure to psychological
adversity and neglect. Similarly, young people in Chisinau report lowest levels of personal
safety. Therefore, youths in Chisinau can be prioritized in any interventions to reduce violence
against children.
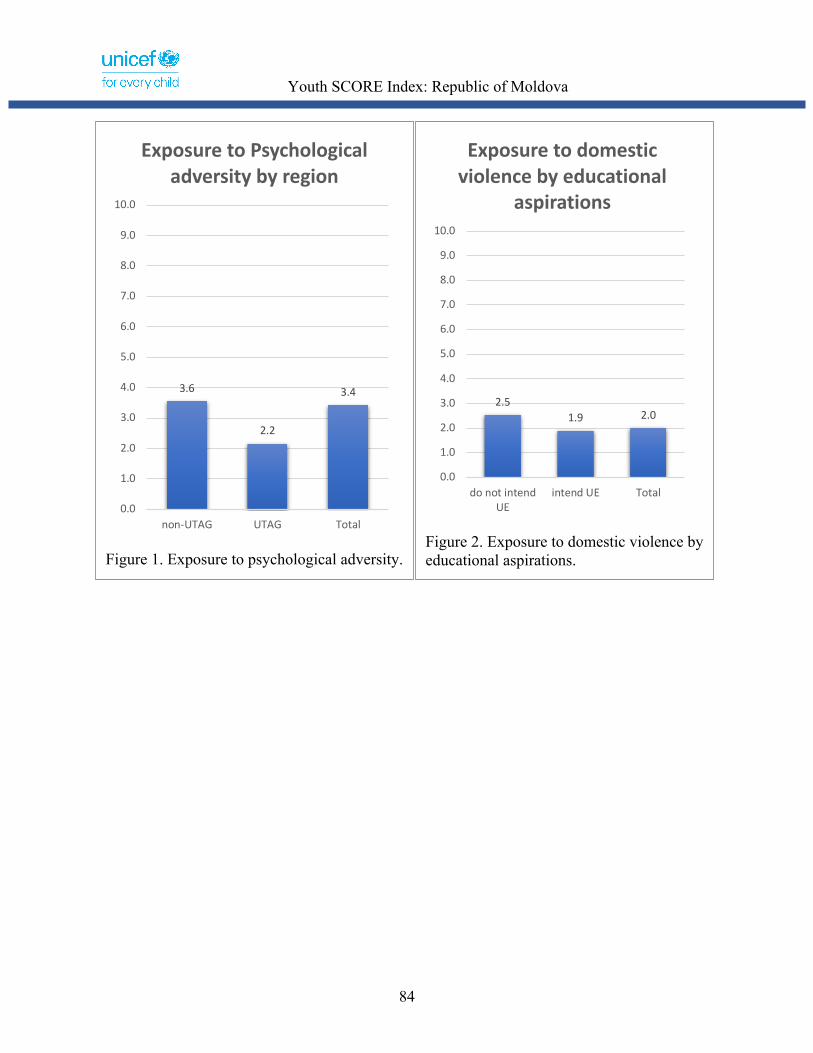
Youth SCORE Index: Republic of Moldova
84
Figure 1. Exposure to psychological adversity.
3.6
2.2
3.4
0.0
1.0
2.0
3.0
4.0
5.0
6.0
7.0
8.0
9.0
10.0
non-UTAG UTAG Total
Exposure to Psychological adversity by region
Figure 2. Exposure to domestic violence by educational aspirations.
2.51.9 2.0
0.0
1.0
2.0
3.0
4.0
5.0
6.0
7.0
8.0
9.0
10.0
do not intendUE
intend UE Total
Exposure to domestic violence by educational
aspirations
Youth SCORE Index: Republic of Moldova
85
THEMATIC BRIEF #2
ACCESS TO INFORMATION
“A catalyst is required to engage individuals in community activities. This
must be underpinned by simple, constant access to information on activities
and available supports.16”
Cohesive society requires the involvement of well-informed citizens in order to create
collaboration and consensus. Open access to information and knowledge is essential to creating a
just society, which can strengthen social cohesion17. This is particularly relevant in the age of
digital technologies and social media—which have an immense effect on youths' participation
and their social connections.
Research18 shows that substantive portion of conflicts and integration is due to the lack of
understanding about each other’s communities and false information about one another. In that
light, and considering geographic and political divisions in Moldova, the need for quality and
fact-based information has never been more central. Access to information can also have
consequences on a smaller scale—such as the lack of access of youth to information related to
events and activities in their community or neighborhood.
16https://www.ria.ie/sites/default/files/rural_conversation_no._2_enhancing_social_cohesion_among_communities_in_rural_ireland.pdf 17https://digitalcommons.law.seattleu.edu/cgi/viewcontent.cgi?article=1890&context=sjsj 18https://reliefweb.int/sites/reliefweb.int/files/resources/62914.pdf

Youth SCORE Index: Republic of Moldova
86
Access to information—in order to keep up with politics and current events—may
include (1) watching the news, listening to the radio, or reading newspaper; (2) personal
interactions with family and friends, or; (3) using online resources.
Overall, across youth in Moldova, interaction with family and friends is the least popular
way to access to information to keep up with politics and current events. The most popular
channel of access to information among youth is the internet.
Among five regions, youths from the UTAG region are substantively higher in their
access to information, as illustrated in Figure 1. Access to information in Moldova is the lowest
in the Central region, closely followed by Chisinau.
The difference between youths from UTAG and non-UTAG regions is most salient in
their access to information using online resources—as illustrated in Figure 2. This difference is
the lowest in the access to information through family and friends.
Youth from urban areas are noticeably higher in their access to information than youth
from rural areas—as illustrated in Figure 3. Moreover, the largest gap between rural and urban
youth is in their access to information using online resources—as illustrated in Figure 4. This
finding is consistent with existing research, which reports that "factors that influence rural social
cohesion include infrastructure [and] access to information communication technology […]19."
Interestingly, youth with higher educational ambitions are slightly lower in their access to
information (in order to keep up with politics and current events) than those with lower
19https://www.ria.ie/sites/default/files/rural_conversation_no._2_enhancing_social_cohesion_among_communities_in_rural_ireland.pdf

Youth SCORE Index: Republic of Moldova
87
educational ambitions. Same is true regarding parental education as well. Specifically, young
people whose parents have higher educational attainment are slightly lower in their access to
information than those whose parents have a lower educational attainment.
Using online resources in order to keep up with politics and current events is more
common among adults compared to youths (ages 14-18)—as illustrated in Figure 5.
Conclusion
Unlike internet and other online resources such as social media, personal (e.g., face-to-
face) interactions with family and friends may not the most common channel to keep up with
politics and current events.
Young people from the UTAG region are higher in their access to information than other
regions—and this is particularly applicable when it comes to access to information using online
resources. Youths in the Central region and Chisinau report the lowest levels of access to
information to keep up with politics and current events. The latter is surprising considering that it
is the capital city, and on average, youths from urban areas are, in general, noticeably higher in
their access to information than youth from rural areas.
Adults in Moldova are substantively higher in their access to information using online
resources than youths. This difference may also be due to the difference in the levels of interest
in politics and current events between adults and youths.
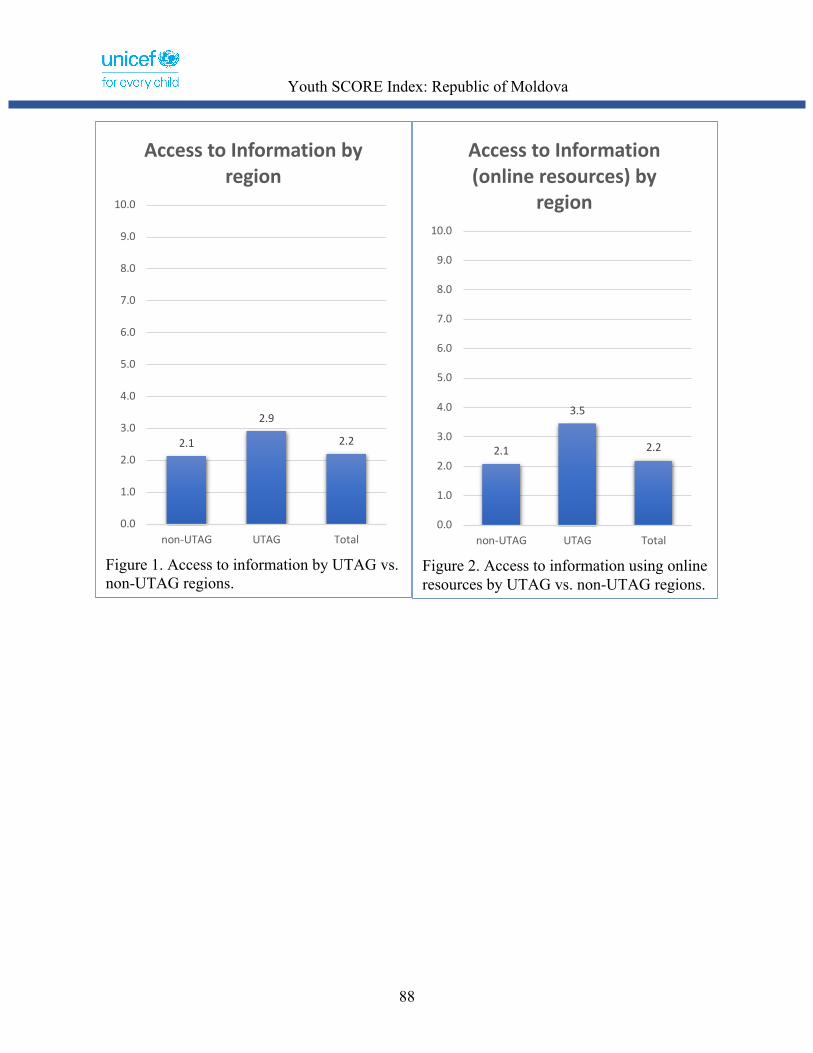
Youth SCORE Index: Republic of Moldova
88
Figure 1. Access to information by UTAG vs. non-UTAG regions.
2.1
2.9
2.2
0.0
1.0
2.0
3.0
4.0
5.0
6.0
7.0
8.0
9.0
10.0
non-UTAG UTAG Total
Access to Information by region
Figure 2. Access to information using online resources by UTAG vs. non-UTAG regions.
2.1
3.5
2.2
0.0
1.0
2.0
3.0
4.0
5.0
6.0
7.0
8.0
9.0
10.0
non-UTAG UTAG Total
Access to Information (online resources) by
region

Youth SCORE Index: Republic of Moldova
89
Figure 3. Access to information by urbanicity.
2.12.4 2.2
0.0
1.0
2.0
3.0
4.0
5.0
6.0
7.0
8.0
9.0
10.0
Rural areas Urban areas Total
Access to Information by urbanicity
Figure 4. Access to information using online resources by urbanicity.
2.02.5
2.2
0.0
1.0
2.0
3.0
4.0
5.0
6.0
7.0
8.0
9.0
10.0
Rural areas Urban areas Total
Access to Information (online resources) by
urbanicity

Youth SCORE Index: Republic of Moldova
90
Figure 5. Access to information using online resources by adult vs. youth samples.
4.6
2.2
0.0
1.0
2.0
3.0
4.0
5.0
6.0
7.0
8.0
9.0
10.0
Adult Sample Youth Sample
Information consumption (online resources) by
region

Youth SCORE Index: Republic of Moldova
91
THEMATIC BRIEF #3
EDUCATION
“Cohesion needs at least equal access to education to generate equal
opportunities20”
Moldova's education system is affected by political divisions, emigration, and
demographic decline. Building a more inclusive education system in Moldova requires a strong
commitment at multiple levels. Educational outcomes matter in all dimensions of the social
cohesion. Education is the greatest equalizer—hence increasing quantity and quality of education
will reduce inequality.
When it comes to youths’ satisfaction with their education and schooling, the
demographic indicator that matters the most often is urbanicity. Specifically, young people from
urban areas are less satisfied with the educational system than youths from rural areas. However,
schooling in urban and rural areas likely differs substantively. There are some issues that
contribute to the increasing gap between rural and urban areas. One relevant finding21 notes that
in almost every village in Moldova, there are some children who rarely attend school—mostly
due to poverty. That statistic, however, may not be manifested in official statistics. It is reported
that, in Moldova, it is enough for students in rural areas to attend school only on the first day of
each school year to be considered as enrolled.
20 OECD (2011), Perspectives on Global Development 2012: Social Cohesion in a Shifting World, OECD Publishing. http://dx.doi.org/10.1787/persp_glob_dev-2012-en 21 https://www.opensocietyfoundations.org/voices/moldova-misleading-first-impressions

Youth SCORE Index: Republic of Moldova
92
Youths’ satisfaction with their schools is closely related to their emotional connection
with their schools. Such emotional connection can be either their connection with school’s sports
team, or their social ties—and plays an important role in youths’ social cohesion. Consistent with
the above finding, youths from urban areas of Moldova feel less emotional connection to their
school than youths from rural areas. This is also consistent with findings related to youths’
willingness to participate in decisions related to their schools.
Youths’ educational aspirations, or their parents’ education, are other two main predictors
of youths’ emotional connection with their school. Specifically, youths whose parents have
higher educational attainment express more emotional connection to school than youths whose
parents are lower in their educational attainment. Similarly, young people who have higher
educational ambitions indicate higher emotional connection to their school than their peers with
lower educational ambitions.
Personal or parental education levels also matter in reported academic performance.
Predictably, youths whose parents have higher educational attainment are higher in their reported
academic performance than youths whose parents are lower in their educational attainment. The
difference in the reported academic achievement is even higher among youths who have higher
educational ambitions and their peers with lower educational ambitions—illustrated in Figure 1
below.
There are some regional differences in reported academic achievement as well.
Specifically, youths from the UTAG region are lower in reported academic performance than
youths from the other four regions.
Youths’ satisfaction with their schools, and their emotional attachment, are closely
related to whether schools provide them with safe spaces. Regional and urbanicity factors are
Youth SCORE Index: Republic of Moldova
93
also associated with factors related to violence in schools. One particular indicator of whether
schools are safe space for youth is the normalization of bullying.
Youths from urban areas are higher in normalization of bullying than youths from rural
areas. This implies that youth in urban areas are more likely to suggest that: (1) it is normal that
kids pick on each other at school, and nothing can be done to change it, or (2) it is normal for
pupils to fight each other and we should let such pupils sort it out themselves, or; (3) it is ok to
film other children when they are fighting each other, and then to post it online. This signals that
more work needs to be done to combat bullying in schools, and urban schools need to be
prioritized. Similarly, youths from the UTAG region are slightly higher in normalization of
bullying than youths from the other four regions. Note that female students are significantly
more opposed to the normalization of bullying than male students.
Among youth, there is a lack of consensus on whether it is teachers’ responsibility to stop
bullying or not. Older students (ages 16-18) suggest more often than younger students (ages 14-
15) that stopping bullying is teachers’ responsibility. Moreover, youths whose parents have
higher educational attainment, or who have higher educational ambitions, agree more often that
stopping bullying is teachers’ responsibility.
Another aspect of students’ perceived safety at school is whether they believe that
teachers and school staff provide them with necessary support and encouragement. Youth from
urban areas report more often (compared to youth from rural areas) that they do not receive
support from school teachers or staff—illustrated in Figure 2 below. Younger students tend to
suggest more often (than older students) that they do not receive support from their teachers or
school staff. Moreover, students with lower educational aspirations tend to suggest more often

Youth SCORE Index: Republic of Moldova
94
not receiving a needed support from teachers or school staff.
One particular support that students may need from teachers is them being able to openly
talk with their teacher about more personal problems, such as relationships with
girlfriend/boyfriend, menstruation, pollution. Female students indicate less often than males that
they can openly talk with their teacher about these topics. Same is true for younger students
(compared to older students), who report that they can talk with their teachers about these topics
less often. Youths from the UTAG region, and youths from urban areas, also report more often
that they can’t talk to their teachers about personal topics (compared to non-UTAG youth or
youth from rural areas).
One particular area where youth from UTAG and non-UTAG regions differ the most is
their support for the use of Romanian language in schools—whether in a form of separate
language being taught, or as the language of instruction. Such polarization—as shown in the
Figure 3 below, poses a significant challenge to social cohesion among youth. Youth from
UTAG oppose the use of Romanian language, which is substantively different from non-UTAG
youths’ views.
Females express support for Romanian language use more often than males, and older
students (ages 16-18) are more positive to it (compared to younger students). Moreover, youths
from urban areas express support for Romanian language use less often than youths from rural
areas.
Youths whose parents have higher educational attainment, or students with higher
personal educational ambitions express support for Romanian language use more often.
Youth SCORE Index: Republic of Moldova
95
Conclusion
Youths from urban and rural schools differ in their schooling experiences. Youths from
urban areas are less satisfied with the educational system than youths from rural areas. This is
also evident by the fact that youths from urban areas report that they do not receive support from
school teachers or staff more often (compared to youth from rural areas). Similarly, youths from
urban areas feel less emotional connection with their school than youths from rural areas.
Moreover, youths from urban areas are higher in the normalization of bullying than youths from
rural areas.
Among youth, there is a lack of consensus on whether it is teachers’ responsibility to stop
bullying or not. In addition, female students report that they cannot talk with their teacher about
personal issues more often than males.
One particular area related to schooling in which youths from the UTAG and non-UTAG
regions are polarized the most is their support for the use of Romanian language in schools
(whether in a form of separate language being taught, or as the language of instruction).
Specifically, youths from UTAG oppose the use of Romanian language, which is different from
non-UTAG youths’ views. Such polarization poses a significant challenge to social cohesion
among youth.

Youth SCORE Index: Republic of Moldova
96
Figure 1. Academic performance by educational aspirations.
5.9
7.2 7.0
0.0
1.0
2.0
3.0
4.0
5.0
6.0
7.0
8.0
9.0
10.0
do not intendUE
intend UE Total
Academic Performance by educational
aspirations
Figure 2. Support from teachers and school staff by urbanicity.
6.2
5.1
5.8
0.0
1.0
2.0
3.0
4.0
5.0
6.0
7.0
8.0
9.0
10.0
Rural areas Urban areas Total
Teacher support by urbanicity

Youth SCORE Index: Republic of Moldova
97
Figure 3. Support for Romanian language use by UTAG vs. non-UTAG regions.
7.0
3.7
6.7
0.0
1.0
2.0
3.0
4.0
5.0
6.0
7.0
8.0
9.0
10.0
non-UTAG UTAG Total
Support for Romania Language Use by region

Youth SCORE Index: Republic of Moldova
98
THEMATIC BRIEF #4
MENTAL HEALTH AND SELF-ESTEEM
“[...] social cohesion (e.g., the density of civic associations, the extent of voluntarism in a
community, or even workplace organization) may determine the structure of individuals’
social networks, the degree of support that flows along network ties, and individuals’
physical or mental health.22”
Research23 shows that social ties and social support are positively and causally related to
mental health, physical health, and longevity Moreover, “[...] looking at the social cohesion of a
society involves aspects which are part of the individual life situation and in this sense
components of the individual quality of life.24” Self-esteem is negatively correlated with
depression and anxiety—and is positively correlated with life satisfaction.
Among youth in Moldova, reported quality of life ranges from 5.52 (Chisinau) to 6.57
(Central region). Females (compared to males), youth from urban areas (compared to rural), and
youth from the UTAG region (compared to non-UTAG) tend to report lower levels of life
quality.
The contrast between Chisinau (6.52) and the Central region (7.39) is consistent when
comparing youths in their optimistic traits as well. Optimistic traits are somewhat high among
youth in Moldova in general (7.12)—and even more in the rural areas. Adults are, in general,
22 Thoits, 2011. 23 Thoits, 2011 24https://www.gesis.org/fileadmin/upload/dienstleistung/daten/soz_indikatoren/eusi/paper14.pdf
Youth SCORE Index: Republic of Moldova
99
more optimistic than youths.
Among youth, planning and impulse control is the lowest in Chisinau (5.83) and the
highest in the UTAG region (7.00). Females are slightly higher in planning and impulse control.
Emotional regulation, however, is the lowest among youth in the Southern region (5.63) and the
highest among youths in the Northern region (6.21).
Peer connectedness—another highly relevant characteristic—among youth in Moldova is
relatively high (7.10)—and parental education is a strong predictor of this. Specifically, youths
whose parents have higher educational levels are relatively higher than those whose parents have
lower educational attainment.
Mental health among youth ranges from 7.04 (Chisinau) to 7.93 (UTAG). When
comparing youth with adults, adults appear to be relatively higher in their mental health than
youths—illustrated in Figure 1.
Lack of self-confidence is not a mental health problem per se, but the two are generally
correlated. In particular, low self-esteem and low self-confidence may lead to mental health
problems. Consistently with the above findings, self-confidence among youths is lower than
adults’ (8.32 vs. 7.37).
Moreover, a factor related to youths’ emotional wellbeing is the availability of leisure
activities. Compared to youths, adults report substantively higher number of available leisure
activities—illustrated in Figure 2. Among youth, availability of leisure activites is the highest in
the Central region (7.08) and the lowest in the Gagauzia.
Punishment or reward sensitivity among youth is the highest in the Central region (5.51)
and the lowest in Gagauzia (4.49). Punishment and reward sensitivity are particularly higher
among female youths, compared to male youths—illustrated in Figure 3. Similarly, reward

Youth SCORE Index: Republic of Moldova
100
sensitivity is higher among youths with higher educational ambitions (compared to their peers
with lower educational ambitions)—illustrated in Figure 4.
Conclusion
Youths in Chisinau reports the lowest levels of quality of life, while youths in the Central
region report the highest levels of life quality. Consistent with that finding, youths from Chisinau
report lowest optimistic traits while youths form the Central region report highest levels of
optimistic traits.
Moreover, youth from urban areas report lower levels of quality of life than youths from
rural areas. Overall, females report lower levels of life quality than males.
Across five regions, planning and impulse control is the lowest in Chisinau as well. The
same is true when comparing youths in their reported mental health. Emotional regulation,
however, is the lowest among youth in the Southern region and the highest among youths in the
Northern region.
Compared to youths, adults report significantly higher number of available leisure
activities for them—and this can be investigated further. Perhaps relatedly, when comparing

Youth SCORE Index: Republic of Moldova
101
youth with adults, adults report higher levels of mental health.
Figure 1. Mental state by adult vs. youth samples.
8.5
7.5
0.0
1.0
2.0
3.0
4.0
5.0
6.0
7.0
8.0
9.0
10.0
Adult Sample Youth Sample
Mental State by region
Figure 2. Availability of leisure activities by adult vs. youth samples.
4.7
6.6
0.0
1.0
2.0
3.0
4.0
5.0
6.0
7.0
8.0
9.0
10.0
Adult Sample Youth Sample
Availability of leisure activities by region
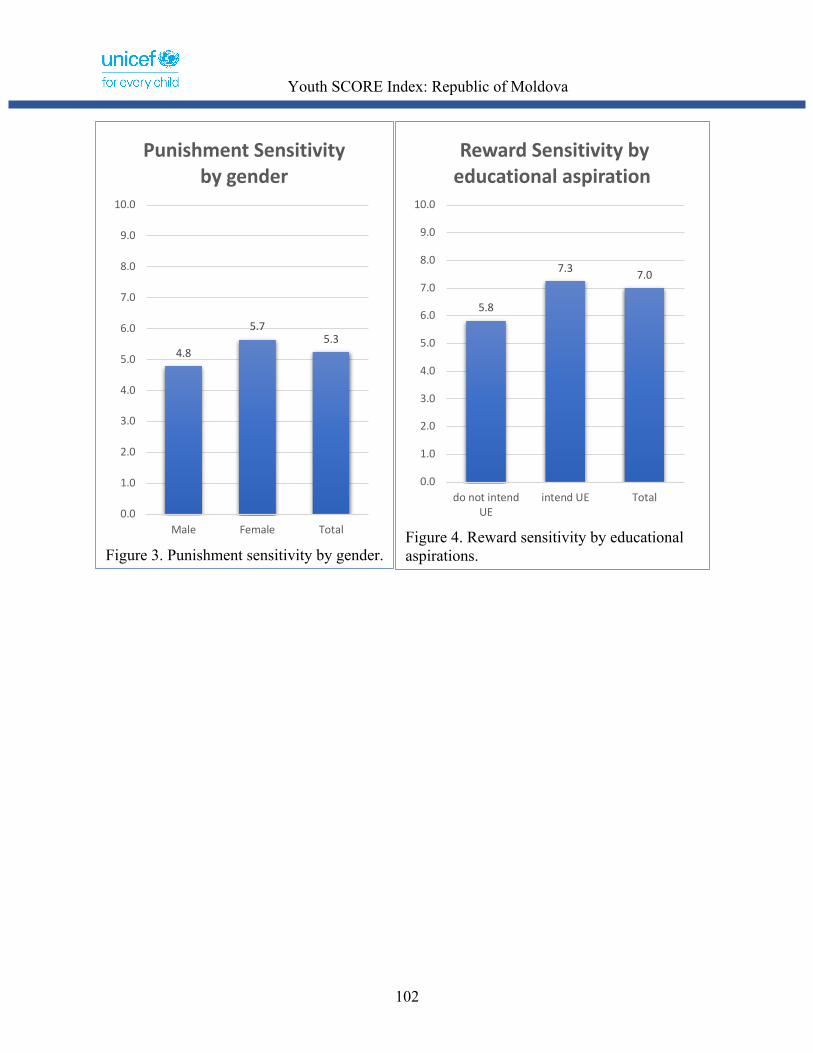
Youth SCORE Index: Republic of Moldova
102
Figure 3. Punishment sensitivity by gender.
4.8
5.75.3
0.0
1.0
2.0
3.0
4.0
5.0
6.0
7.0
8.0
9.0
10.0
Male Female Total
Punishment Sensitivity by gender
Figure 4. Reward sensitivity by educational aspirations.
5.8
7.3 7.0
0.0
1.0
2.0
3.0
4.0
5.0
6.0
7.0
8.0
9.0
10.0
do not intendUE
intend UE Total
Reward Sensitivity by educational aspiration
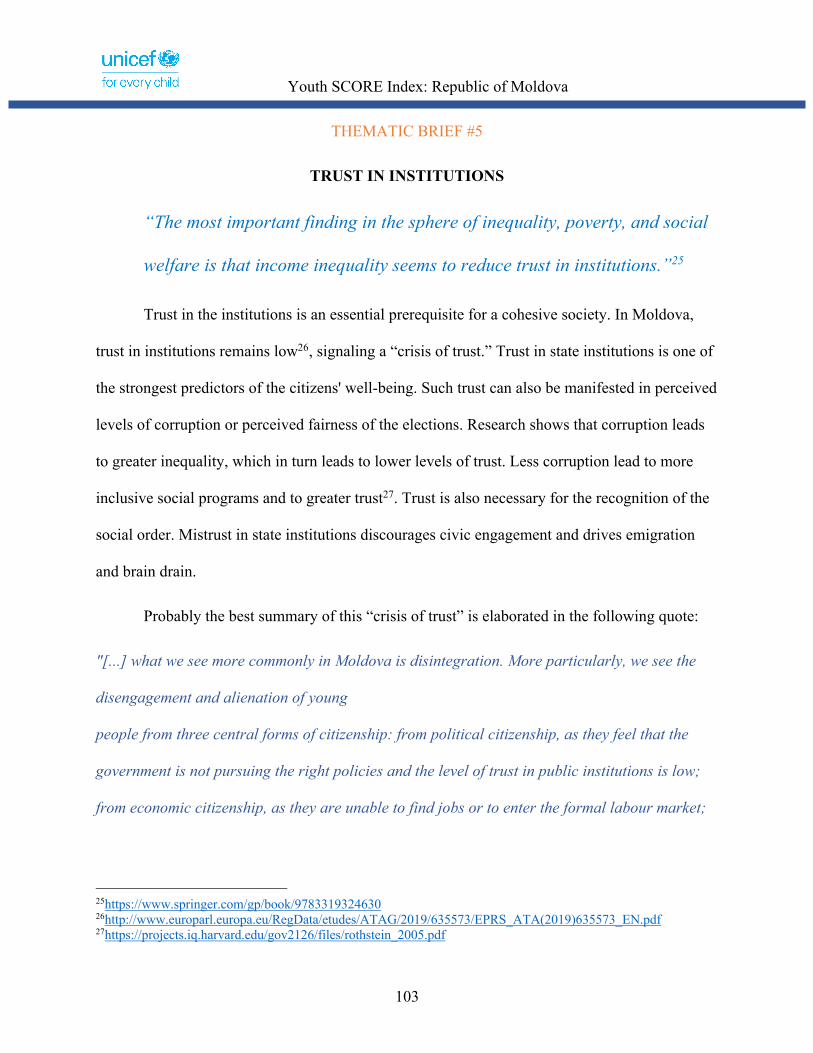
Youth SCORE Index: Republic of Moldova
103
THEMATIC BRIEF #5
TRUST IN INSTITUTIONS
“The most important finding in the sphere of inequality, poverty, and social
welfare is that income inequality seems to reduce trust in institutions.”25
Trust in the institutions is an essential prerequisite for a cohesive society. In Moldova,
trust in institutions remains low26, signaling a “crisis of trust.” Trust in state institutions is one of
the strongest predictors of the citizens' well-being. Such trust can also be manifested in perceived
levels of corruption or perceived fairness of the elections. Research shows that corruption leads
to greater inequality, which in turn leads to lower levels of trust. Less corruption lead to more
inclusive social programs and to greater trust27. Trust is also necessary for the recognition of the
social order. Mistrust in state institutions discourages civic engagement and drives emigration
and brain drain.
Probably the best summary of this “crisis of trust” is elaborated in the following quote:
"[...] what we see more commonly in Moldova is disintegration. More particularly, we see the
disengagement and alienation of young
people from three central forms of citizenship: from political citizenship, as they feel that the
government is not pursuing the right policies and the level of trust in public institutions is low;
from economic citizenship, as they are unable to find jobs or to enter the formal labour market;
25https://www.springer.com/gp/book/9783319324630 26http://www.europarl.europa.eu/RegData/etudes/ATAG/2019/635573/EPRS_ATA(2019)635573_EN.pdf 27https://projects.iq.harvard.edu/gov2126/files/rothstein_2005.pdf
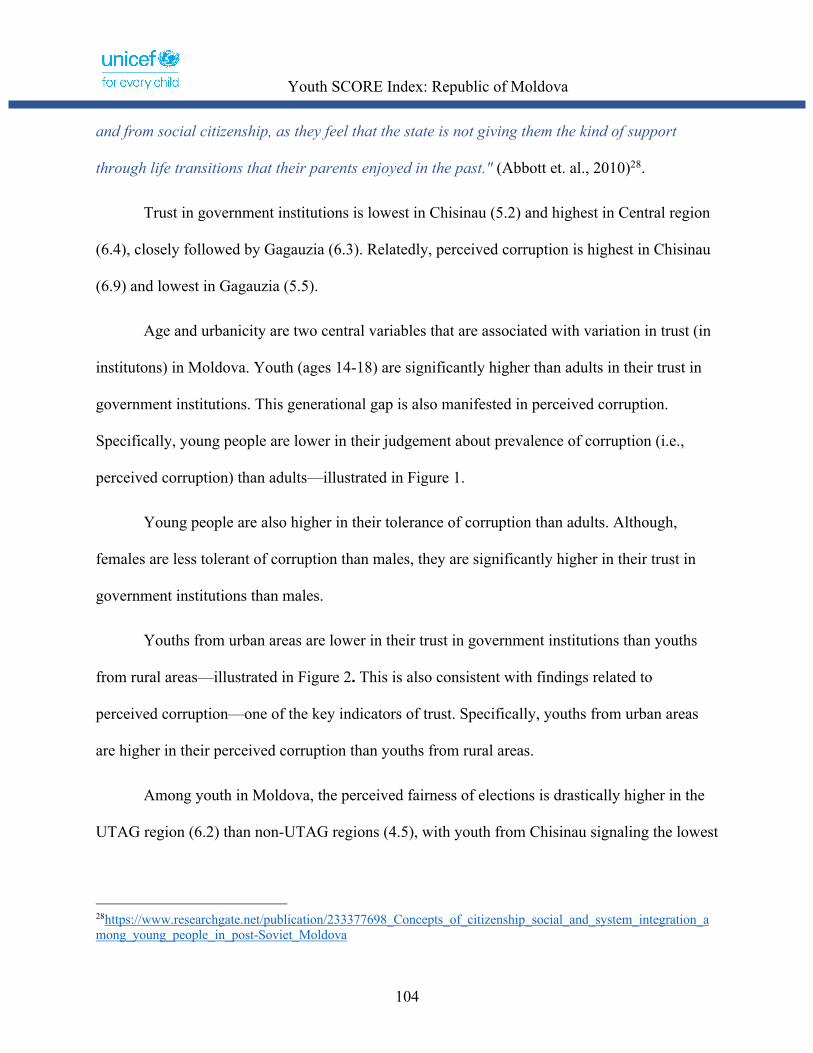
Youth SCORE Index: Republic of Moldova
104
and from social citizenship, as they feel that the state is not giving them the kind of support
through life transitions that their parents enjoyed in the past." (Abbott et. al., 2010)28.
Trust in government institutions is lowest in Chisinau (5.2) and highest in Central region
(6.4), closely followed by Gagauzia (6.3). Relatedly, perceived corruption is highest in Chisinau
(6.9) and lowest in Gagauzia (5.5).
Age and urbanicity are two central variables that are associated with variation in trust (in
institutons) in Moldova. Youth (ages 14-18) are significantly higher than adults in their trust in
government institutions. This generational gap is also manifested in perceived corruption.
Specifically, young people are lower in their judgement about prevalence of corruption (i.e.,
perceived corruption) than adults—illustrated in Figure 1.
Young people are also higher in their tolerance of corruption than adults. Although,
females are less tolerant of corruption than males, they are significantly higher in their trust in
government institutions than males.
Youths from urban areas are lower in their trust in government institutions than youths
from rural areas—illustrated in Figure 2. This is also consistent with findings related to
perceived corruption—one of the key indicators of trust. Specifically, youths from urban areas
are higher in their perceived corruption than youths from rural areas.
Among youth in Moldova, the perceived fairness of elections is drastically higher in the
UTAG region (6.2) than non-UTAG regions (4.5), with youth from Chisinau signaling the lowest
28https://www.researchgate.net/publication/233377698_Concepts_of_citizenship_social_and_system_integration_among_young_people_in_post-Soviet_Moldova

Youth SCORE Index: Republic of Moldova
105
level of perceived election fairness (3.5). This difference, which is noticeably significant, is
illustrated in Figure 3.
Consistent with findings related to perceived corruption, youths from urban areas are
substantively lower in their perceived fairness of elections than youths from rural areas.
Although it is relatively low, young people are still higher in perceived fairness of elections than
adults—illustrated in Figure 4.
Conclusion
Trust in government institutions among youths in Moldova is the lowest in the capital and
the highest in Central and Gagauzia regions. Relatedly, perceived corruption is the highest
among youths in Chisinau as well, and the lowest among youths in Gagauzia. In general, youths
in urban areas report lower levels of trust in government institutions than youths in rural areas. It
is also worth noting that young people are higher than adults in their tolerance of corruption.
Participation in elections (i.e., political participation), as one of the aspects of civic
engagement, is an important indicator of social cohesion. However, for the participation to occur,
there needs to be a trust in the fairness of elections. In other words, voter turnout depends
strongly on perception of electoral integrity. Therefore, in addition to the fair elections,
perception of fairness also plays role in establishing a socially cohesive society. Among youths
in Moldova, the perceived fairness of elections differs substantively between the UTAG and non-
UTAG regions, and is at the lowest level among youths in Chisinau.
Youth SCORE Index: Republic of Moldova
106
Figure 1. Perceived corruption by adult vs. youth samples.
7.9
6.0
0.0
1.0
2.0
3.0
4.0
5.0
6.0
7.0
8.0
9.0
10.0
Adult Sample Youth Sample
Perceived corruption by region
Figure 2. Trust in government institutions by urbanicity.
6.4
5.56.1
0.0
1.0
2.0
3.0
4.0
5.0
6.0
7.0
8.0
9.0
10.0
Rural areas Urban areas Total
Trust in government institutions by urbanicity

Youth SCORE Index: Republic of Moldova
107
Figure 3. Perceived electoral fairness by UTAG vs. non-UTAG regions.
4.5
6.2
4.6
0.0
1.0
2.0
3.0
4.0
5.0
6.0
7.0
8.0
9.0
10.0
non-UTAG UTAG Total
Fairness of Elections by region
Figure 4. Perceived electoral fairness by adult vs. youth samples.
3.4
4.6
0.0
1.0
2.0
3.0
4.0
5.0
6.0
7.0
8.0
9.0
10.0
Adult Sample Youth Sample
Fairness of Election by survey

Youth SCORE Index: Republic of Moldova
108
THEMATIC BRIEF #6
TOLERANCE
“Empathy can be considered as one of the main social ties, enabling
sociability and cooperation in society.”29
Social cohesion is the interdependence between members of a community experienced as
shared loyalties and solidarity30. In an ethnically, geographically, politically, and socially diverse
country that is neighboring with Europe, lack of empathy for social outgroups is perhaps one of
the main challenges to cohesive youth. Nurturing empathy among youth reduces marginalization
and stigmatization of social groups such as people with non-traditional sexual orientation or
people living with HIV or AIDS.
Cognitive and affective empathy with others’ challenges is a critical component of
members of socially cohesive community. Cognitive empathy (a.k.a., perspective taking) is
ability to understand other people's emotions. Affective empathy, in turn, is a feeling in response
to others' emotions—such as feeling stressed when someone else is feeling fearful.
Among youth in Moldova, females indicate higher levels of both cognitive and affective
empathy than males. Moreover, older respondents (ages 16-18) are considerably higher in their
cognitive and affective empathy than younger respondents (ages 14-15). This finding is also
confirmed when comparing youth sample with the adult sample. Specifically, Adults are
29https://www.academia.edu/1725758/From_empathy_to_social_cohesion?auto=download 30 Wolf and Rozance, 2013. https://depts.washington.edu/hhwb/Print_Social.html

Youth SCORE Index: Republic of Moldova
109
significantly higher in empathy than youth sample—illustrated in Figures 1.
In addition to gender and age, two other variables that are strongly associated with
cognitive and affective empathy are (1) parental education and (2) educational aspirations—with
the latter being the strongest predictor. In particular, youths whose parents have higher
educational attainment have greater cognitive and affective empathy than youths whose parents
are lower in their educational attainment. Similarly, young people with higher educational
ambitions are more cognitively empathetic and have higher degree of affective empathy than
their peers with lower educational ambitions—illustrated in Figures 2 and 3.
Across regions in Moldova, youths do not vary significantly in their affective empathy—
with youths from the UTAG and Central regions being the highest and youths from Chisinau
being the lowest. Youths from the UTAG regions are also the highest group in their reported
cognitive empathy—while youths from the Southern region are the lowest.
Conclusion
Unsurprisingly—due to the age and corresponding cognitive and emotional
development—adults are significantly higher in empathy than youths. Similarly, female youths
are noticeably higher in their affective and cognitive empathy than male youths. Other
demographic indicators that are strong predictors of empathy and tolerance are parental
educational attainment and personal educational ambitions—both of which are positively
correlated with the reported levels of affective and cognitive empathy.
Youth SCORE Index: Republic of Moldova
110
Figure 1. Affective empathy by adult vs. youth sample.
7.1
5.2
0.0
1.0
2.0
3.0
4.0
5.0
6.0
7.0
8.0
9.0
10.0
Adult Sample Youth Sample
Affective empathy by region
Figure 2. Cognitive empathy by educational aspirations.
4.6
5.8 5.6
0.0
1.0
2.0
3.0
4.0
5.0
6.0
7.0
8.0
9.0
10.0
do not intendUE
intend UE Total
Cognitive empathy by educational aspirations
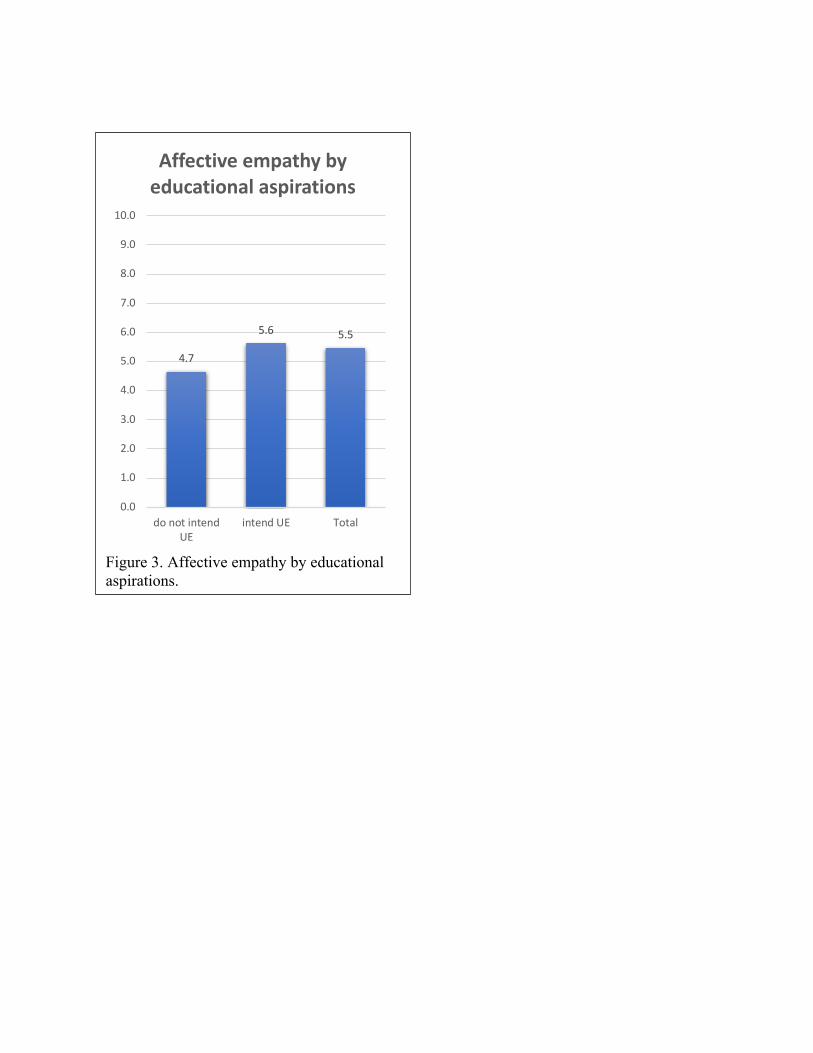
Figure 3. Affective empathy by educational aspirations.
4.7
5.6 5.5
0.0
1.0
2.0
3.0
4.0
5.0
6.0
7.0
8.0
9.0
10.0
do not intendUE
intend UE Total
Affective empathy by educational aspirations
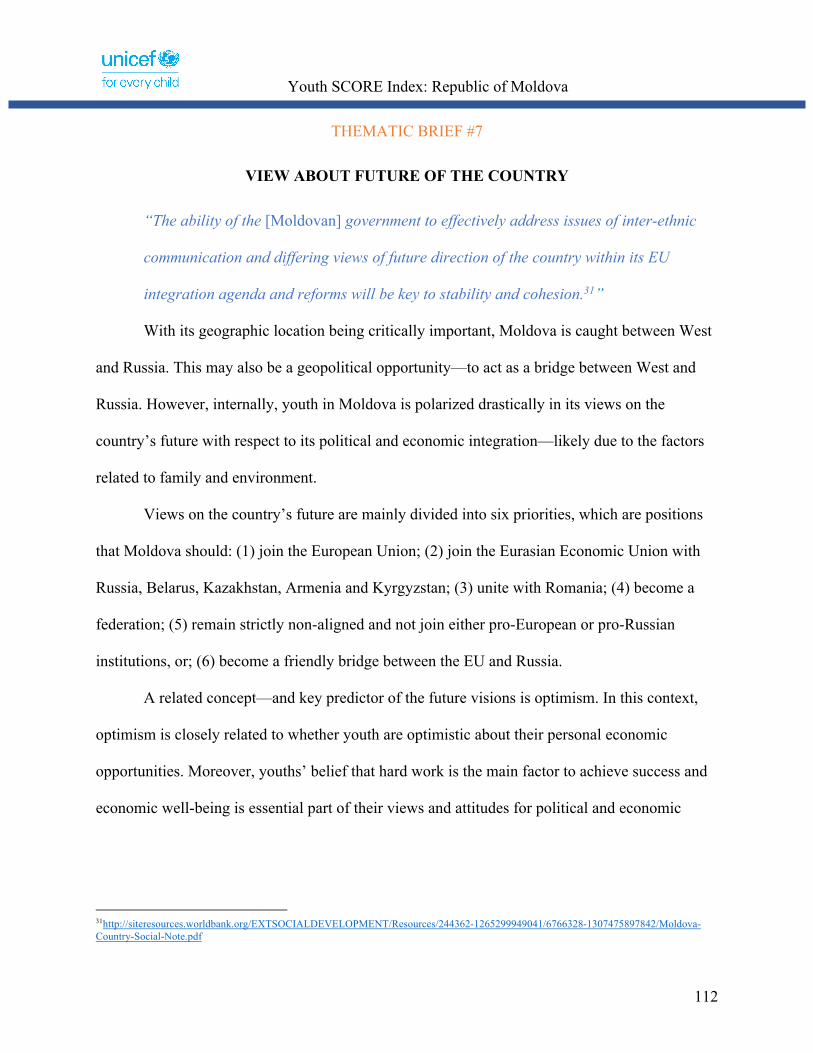
Youth SCORE Index: Republic of Moldova
112
THEMATIC BRIEF #7
VIEW ABOUT FUTURE OF THE COUNTRY
“The ability of the [Moldovan] government to effectively address issues of inter-ethnic
communication and differing views of future direction of the country within its EU
integration agenda and reforms will be key to stability and cohesion.31”
With its geographic location being critically important, Moldova is caught between West
and Russia. This may also be a geopolitical opportunity—to act as a bridge between West and
Russia. However, internally, youth in Moldova is polarized drastically in its views on the
country’s future with respect to its political and economic integration—likely due to the factors
related to family and environment.
Views on the country’s future are mainly divided into six priorities, which are positions
that Moldova should: (1) join the European Union; (2) join the Eurasian Economic Union with
Russia, Belarus, Kazakhstan, Armenia and Kyrgyzstan; (3) unite with Romania; (4) become a
federation; (5) remain strictly non-aligned and not join either pro-European or pro-Russian
institutions, or; (6) become a friendly bridge between the EU and Russia.
A related concept—and key predictor of the future visions is optimism. In this context,
optimism is closely related to whether youth are optimistic about their personal economic
opportunities. Moreover, youths’ belief that hard work is the main factor to achieve success and
economic well-being is essential part of their views and attitudes for political and economic
31http://siteresources.worldbank.org/EXTSOCIALDEVELOPMENT/Resources/244362-1265299949041/6766328-1307475897842/Moldova-Country-Social-Note.pdf

Youth SCORE Index: Republic of Moldova
113
alliances.
Citizens of the socially cohesive society tend to be more optimistic than citizens of non-
cohesive society. Besides, “the effect of optimism about society seems to have stronger effects
than optimism about one’s own life chances.32"
Overall, majority of youth in Moldova favors EU membership (6.89), with the youth
from the UTAG region not favoring integration with EU at all (2.71)—shown in Figure 1. This
sentiment (preference that Moldova joins EU) is particularly high among youth who have higher
educational ambitions—illustrated if Figure 2. Youths in Moldova do not favor joining Eurasian
Economic Union (3.56), with the Gagauzia favoring such integration significantly more (6.36)
—as illustrated in Figure 3. Union with Romania, overall, is not favored as much as with EU
(5.38) by youth in Moldova—with youth from the UTAG region opposing (1.01)—illustrated
Figure 4.
Becoming federation is not favored by youth (3.37), with youth in Gagauzia indicating
slightly more positive views on that (4.72). Remaining strictly non-aligned is not a popular
preference among youth (4.09), with youths from regions ranging from 3.84 (Southern) to 4.70
(review) in their attitudes. The vision to become a friendly bridge between EU and Russia is the
second most popular preference after EU membership—although very close (6.86)—with the
highest consensus among youth from all five regions. Positive attitudes on this range from 6.05
(Southern) to 7.48 (Northern).
Civic optimism—the belief that the next generation will be better off (or previous
generation was worse off) is highest in the Northern region (4.40) and lowest among the youth in
32https://lanekenworthy.files.wordpress.com/2016/08/reading-larsen2013.pdf

Youth SCORE Index: Republic of Moldova
114
the UTAG and Chisinau regions. Females signal relatively lower levels of civic optimism.
Adults are higher in their civic optimism than youths (4.68 vs. 4.20). This is mostly because
adults’ views of the past. Specifically, while adults and youths are almost identical in their view
that the next generation will be better off (5.17 vs. 5.19), youths tend to indicate that the previous
generation was better off more often than adults (6.42 vs. 4.08), indicating lower level of civic
optimism in that aspect—illustrated in Figure 5.
Conclusion
Polarization of Moldova’s youths in their views of country’s future is one of the main
challenges to social cohesion. While majority of youth in four regions of Moldova favors the EU
membership, young people from the UTAG region are drastically against it. In contrast, youths
in Gagauzia favor joining Eurasian Economic Union, while youths from the other four regions
do not favor it. This stark contrast is manifested in youths’ views on the union with Romania as
well. Specifically, youths from the UTAG region drastically oppose such union, while youths
from the remaining four regions are somewhat positive to the union with Romania (although not
as strong as the union with the EU).
Becoming a federation is unpopular among both youths from the UTAG region and by
youths from the other four regions. The same is true with regards to remaining strictly non-
aligned.
The vision to become a friendly bridge between EU and Russia is the second most
popular preference (after EU membership). However, this option is preferred universally across
all five regions (including UTAG), signaling a point of compromise.
Civic optimism—the belief that the next generation will be better off (or previous
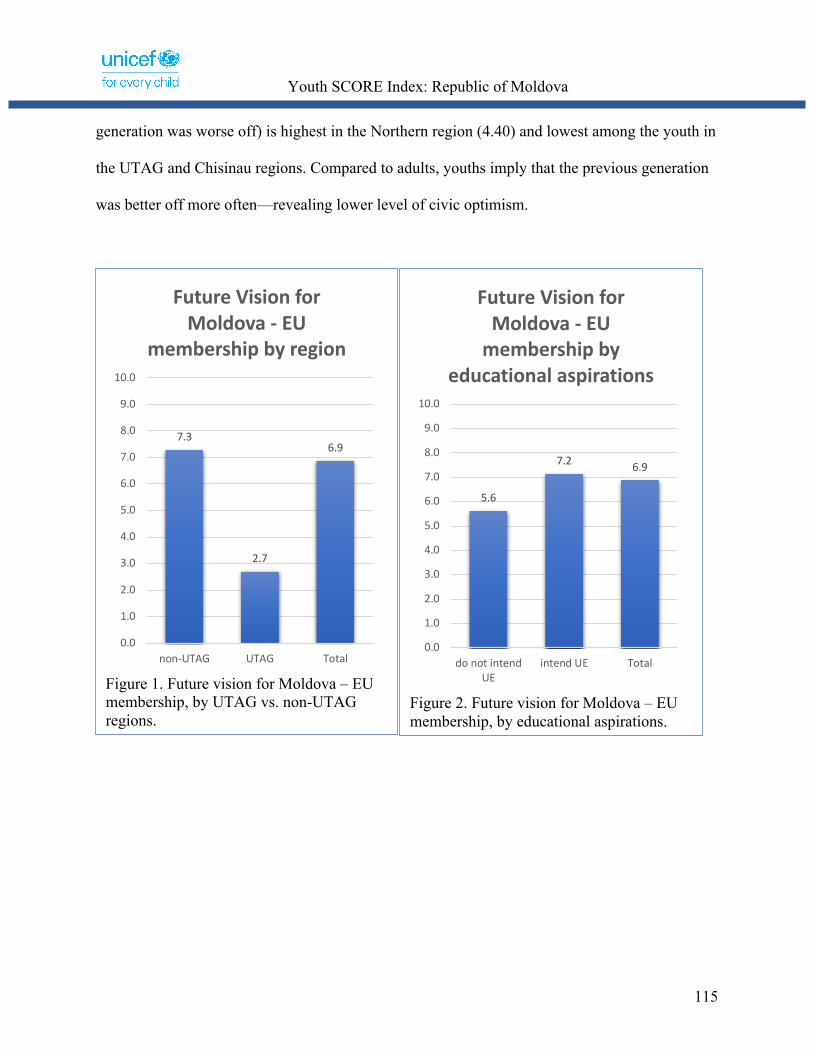
Youth SCORE Index: Republic of Moldova
115
generation was worse off) is highest in the Northern region (4.40) and lowest among the youth in
the UTAG and Chisinau regions. Compared to adults, youths imply that the previous generation
was better off more often—revealing lower level of civic optimism.
Figure 1. Future vision for Moldova – EU membership, by UTAG vs. non-UTAG regions.
7.3
2.7
6.9
0.0
1.0
2.0
3.0
4.0
5.0
6.0
7.0
8.0
9.0
10.0
non-UTAG UTAG Total
Future Vision for Moldova - EU
membership by region
Figure 2. Future vision for Moldova – EU membership, by educational aspirations.
5.6
7.2 6.9
0.0
1.0
2.0
3.0
4.0
5.0
6.0
7.0
8.0
9.0
10.0
do not intendUE
intend UE Total
Future Vision for Moldova - EU
membership by educational aspirations
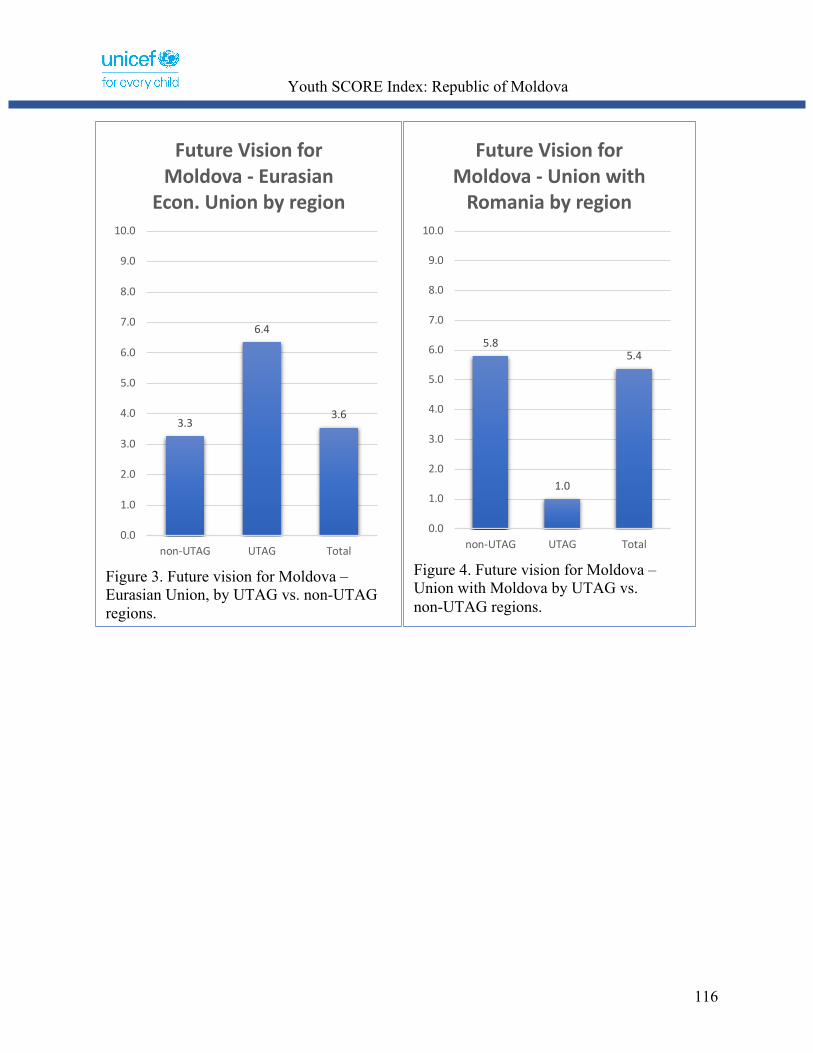
Youth SCORE Index: Republic of Moldova
116
Figure 3. Future vision for Moldova – Eurasian Union, by UTAG vs. non-UTAG regions.
3.3
6.4
3.6
0.0
1.0
2.0
3.0
4.0
5.0
6.0
7.0
8.0
9.0
10.0
non-UTAG UTAG Total
Future Vision for Moldova - Eurasian
Econ. Union by region
Figure 4. Future vision for Moldova – Union with Moldova by UTAG vs. non-UTAG regions.
5.8
1.0
5.4
0.0
1.0
2.0
3.0
4.0
5.0
6.0
7.0
8.0
9.0
10.0
non-UTAG UTAG Total
Future Vision for Moldova - Union with
Romania by region
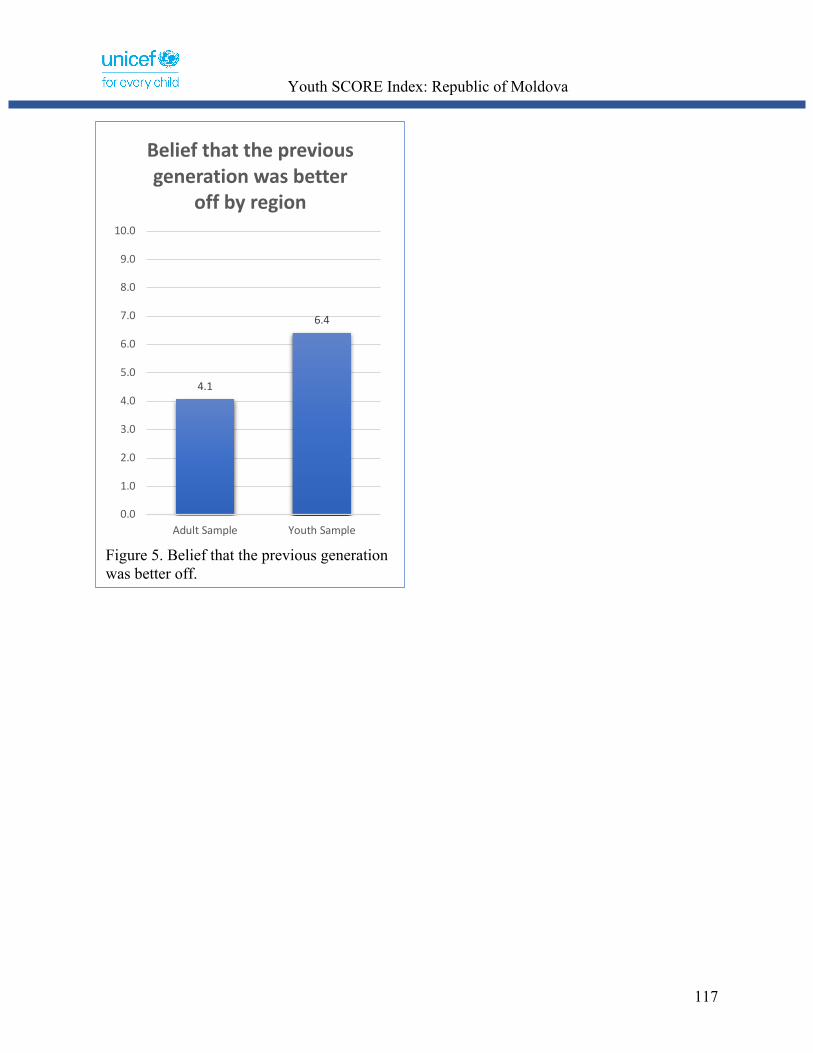
Youth SCORE Index: Republic of Moldova
117
Figure 5. Belief that the previous generation was better off.
4.1
6.4
0.0
1.0
2.0
3.0
4.0
5.0
6.0
7.0
8.0
9.0
10.0
Adult Sample Youth Sample
Belief that the previous generation was better
off by region

Youth SCORE Index: Republic of Moldova
118
THEMATIC BRIEF #8
HUMAN RIGHTS
“[...]the most cohesive countries are those with the most liberal democratic
setup – that is, elevating the rights of minorities groups to a level of
protection equal to those of the majority.”33
Support for human rights is the lowest in the Northern region (6.90) and is the highest in
Chisinau (7.98). A related concept—belief in the universality of human rights among youth in
Moldova is generally high as well (7.36) and does not vary much across the regions (7.12 in
UTAG to 7.54 in the Central region).
Adults and youths are almost identical in their beliefs in the universality of human rights.
Adults, however, are noticeably higher in their overall support for human rights than youths—
illustrated in Figure 1.
Female youths are substantively higher in their overall support for human rights (than
males). Same is true for youths whose parents have higher educational attainment, or youths with
higher educational ambitions—summarized in Figure 2.
Negative stereotypes—which may limit choices and opportunities—are barriers to people
fulfilling their potential. Stereotypes among youth may be formed because of their personal or
their families’ strong political, social, or cultural beliefs and ideas about particular groups.
Among youth in Moldova, the group that suffers from negative stereotypes the most are Roma,
followed by people with non-traditional sexual orientation and people living with HIV and
33 https://brill.com/view/journals/coso/17/3-4/article-p426_10.xml?language=en

Youth SCORE Index: Republic of Moldova
119
AIDS. The highest level of negative stereotypes towards Roma is among youth in Chisinau
(5.82) and the lowest is among youths in the Central region.
The highest level of negative stereotypes towards LGBTQ people is among youths in the
UTAG region (and rural areas), and the lowest is among youths in Chisinau. Females in general
indicate lower level of negative stereotypes than males. The same is true for youths with higher
parental education or higher educational ambitions.
Among regions, youths in Chisinau express the highest level of negative stereotype
towards people who support close ties with Russia (4.72) and youth from the UTAG regions
indicate the lowest level (2.79).
Marginalization—feeling ignored and isolated—is low among youth in Moldova—
ranging from 1.97 (Northern region) to 1.41 (Southern region). Compared to males, female
youths feel less ignored or isolated. The same is true for youths with higher parental education.
The strongest predictor of lower feeling of marginalization, however, is youths’ personal
educational ambitions—illustrated Figure 3.
Conclusion
Support for human rights is the highest in the capital and the lowest in the Northern
region. Adults are more supportive of the human rights than youths. Similarly, female youths are
higher in their support of human rights than male youth. In addition to age and gender, parental
education or personal educational ambitions are positive predictors of the youths’ support for
human rights. These two education-related variables are predictors (negatively correlated) of
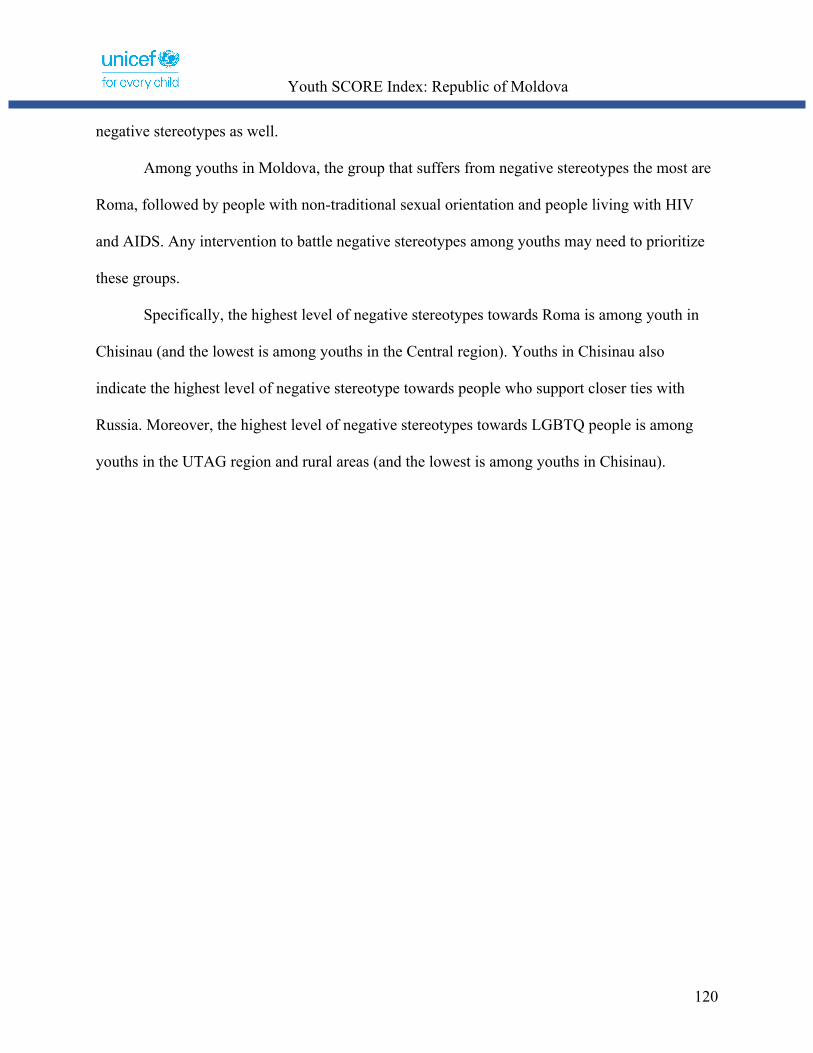
Youth SCORE Index: Republic of Moldova
120
negative stereotypes as well.
Among youths in Moldova, the group that suffers from negative stereotypes the most are
Roma, followed by people with non-traditional sexual orientation and people living with HIV
and AIDS. Any intervention to battle negative stereotypes among youths may need to prioritize
these groups.
Specifically, the highest level of negative stereotypes towards Roma is among youth in
Chisinau (and the lowest is among youths in the Central region). Youths in Chisinau also
indicate the highest level of negative stereotype towards people who support closer ties with
Russia. Moreover, the highest level of negative stereotypes towards LGBTQ people is among
youths in the UTAG region and rural areas (and the lowest is among youths in Chisinau).
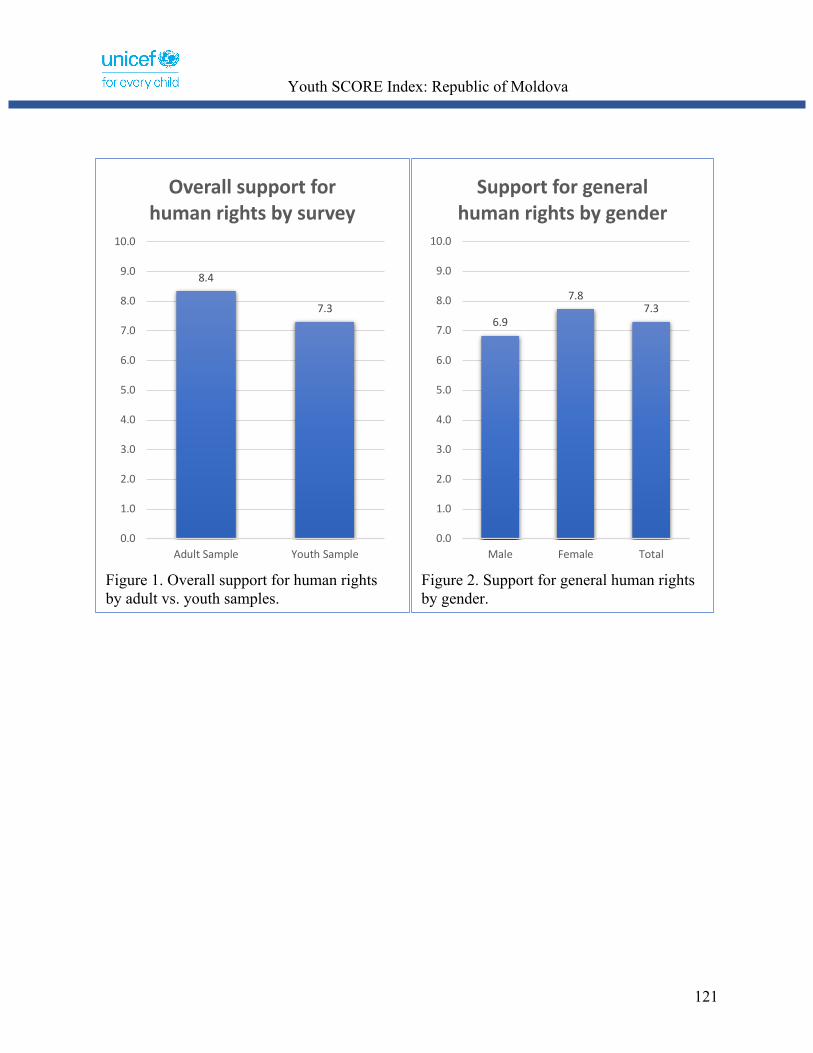
Youth SCORE Index: Republic of Moldova
121
Figure 1. Overall support for human rights by adult vs. youth samples.
8.4
7.3
0.0
1.0
2.0
3.0
4.0
5.0
6.0
7.0
8.0
9.0
10.0
Adult Sample Youth Sample
Overall support for human rights by survey
Figure 2. Support for general human rights by gender.
6.9
7.87.3
0.0
1.0
2.0
3.0
4.0
5.0
6.0
7.0
8.0
9.0
10.0
Male Female Total
Support for general human rights by gender
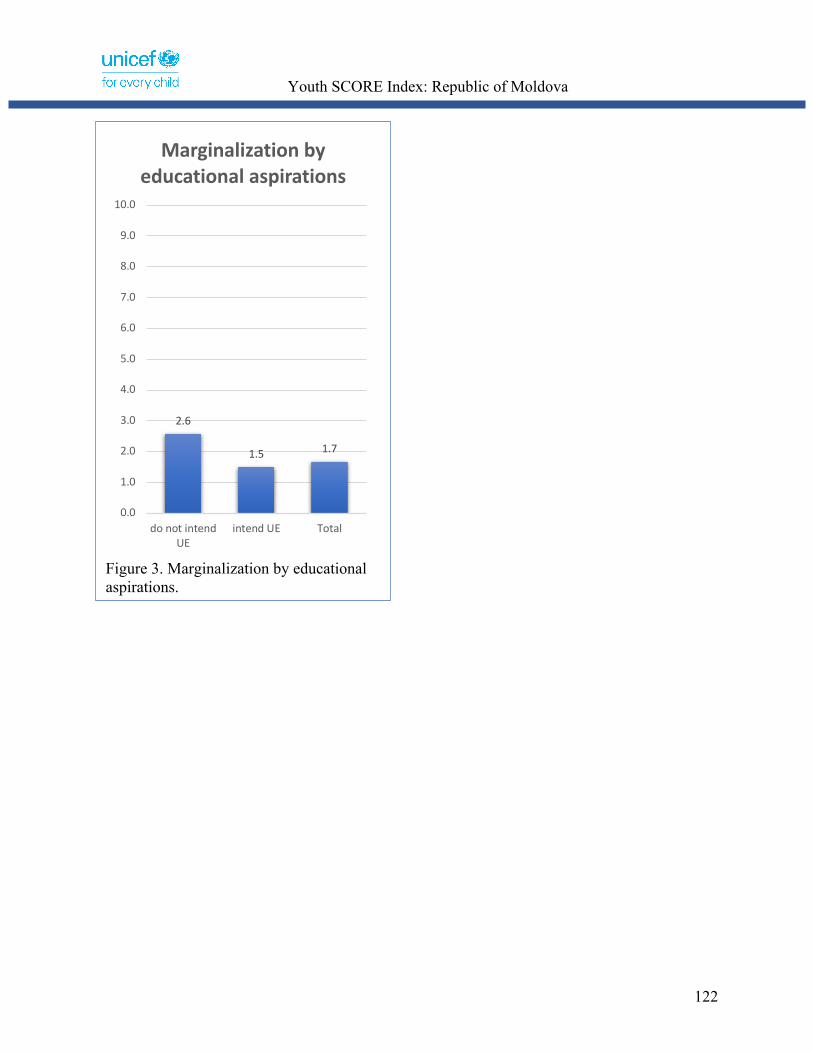
Youth SCORE Index: Republic of Moldova
122
Figure 3. Marginalization by educational aspirations.
2.6
1.5 1.7
0.0
1.0
2.0
3.0
4.0
5.0
6.0
7.0
8.0
9.0
10.0
do not intendUE
intend UE Total
Marginalization by educational aspirations
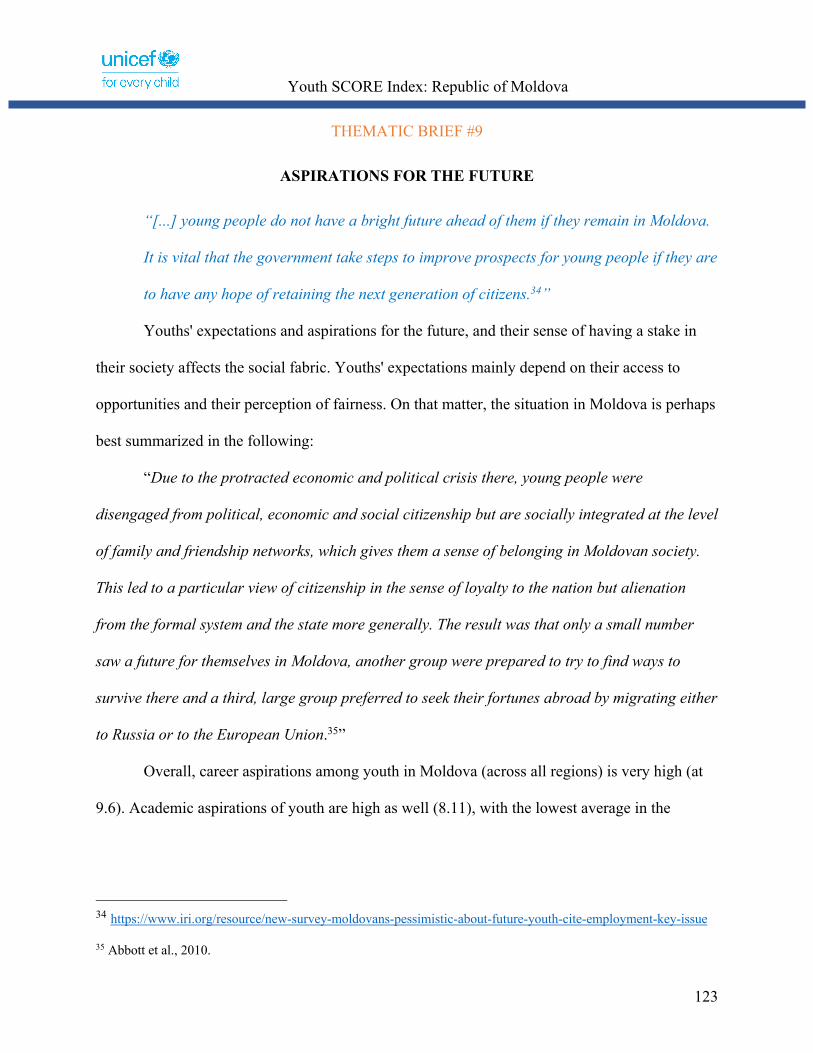
Youth SCORE Index: Republic of Moldova
123
THEMATIC BRIEF #9
ASPIRATIONS FOR THE FUTURE
“[...] young people do not have a bright future ahead of them if they remain in Moldova.
It is vital that the government take steps to improve prospects for young people if they are
to have any hope of retaining the next generation of citizens.34”
Youths' expectations and aspirations for the future, and their sense of having a stake in
their society affects the social fabric. Youths' expectations mainly depend on their access to
opportunities and their perception of fairness. On that matter, the situation in Moldova is perhaps
best summarized in the following:
“Due to the protracted economic and political crisis there, young people were
disengaged from political, economic and social citizenship but are socially integrated at the level
of family and friendship networks, which gives them a sense of belonging in Moldovan society.
This led to a particular view of citizenship in the sense of loyalty to the nation but alienation
from the formal system and the state more generally. The result was that only a small number
saw a future for themselves in Moldova, another group were prepared to try to find ways to
survive there and a third, large group preferred to seek their fortunes abroad by migrating either
to Russia or to the European Union.35”
Overall, career aspirations among youth in Moldova (across all regions) is very high (at
9.6). Academic aspirations of youth are high as well (8.11), with the lowest average in the
34 https://www.iri.org/resource/new-survey-moldovans-pessimistic-about-future-youth-cite-employment-key-issue 35 Abbott et al., 2010.

Youth SCORE Index: Republic of Moldova
124
UTAG region and the highest average in the Central region.
Females, in general, are higher in their academic aspirations—illustrated in Figure 1.
Predictably, parental education plays a vital role in youths’ career ambitions—youth with higher
parental education having higher academic aspirations—illustrated in Figure 2.
The tendency to emigrate among youth is highest in Chisinau (6.6) and lowest in
Gagauzia (5.9), with female youth (compared to males) and youth from urban areas (compared to
rural areas) having slightly higher tendencies to emigrate. Besides, youth with higher parental
education or with higher personal educational ambitions tend to report their willingness to
emigrate more often.
When considering the destinations to emigrate, youths from the UTAG region are
significantly lower than non-UTAG youths in their tendency to emigrate to EU or North
American countries—illustrated in Figure 3. Youth from the UTAG region are noticeably higher
in their tendency to emigrate to Eastern European countries—illustrated in Figure 4.
Youth from Chisinau are the lowest in their tendency to emigrate to Eastern European
countries. Similarly, youth from urban areas are significantly lower in their tendency to emigrate
to Eastern European countries than youth from rural areas (while there is no difference between
the two when it comes to emigration to EU/North America).
Life satisfaction—a central component that drives decisions related to emigration—does
not vary much across regions, with being highest in the UTAG region (7.32), closely followed by
the Central region (7.28), and lowest in the Northern region (6.87), and Chisinau (7.02).
Youth from urban areas report slightly lower satisfaction with their life than youth from
rural areas. Similarly, those who have higher educational ambitions, on average, report relatively
higher satisfaction with their life than those with lower educational ambitions—illustrated in

Youth SCORE Index: Republic of Moldova
125
Figure 5. When compared to the adult sample, youth sample are substantively higher in their
emigration tendencies—illustrated in Figure 6.
Conclusion
In Moldova, youths’ career and academic aspirations are high. Due to high tendency to
emigrate among youth, high career and academic aspirations are likely related to their future
aspirations abroad. This indicates that in Moldova, youths’ future aspirations—due to the lack of
economic opportunities—is detached from to their future in Moldova specifically, and relates to
their future outside of Moldova as well. It is worth noting that female youths and youths from
urban areas have relatively higher tendencies to emigrate (compared to males and youths from
rural areas). Besides, youths are noticeably higher in their emigration tendencies than adults.
In terms of destinations to emigrate, youths from the non-UTAG region favor EU or
North American countries. In contrast, youths from the UTAG region prefer Eastern European
countries.
Life satisfaction among youths is the highest in the UTAG and Central regions and the
lowest in the Northern region. Moreover, youths from urban areas report slightly lower
satisfaction with their life than youth from rural areas.
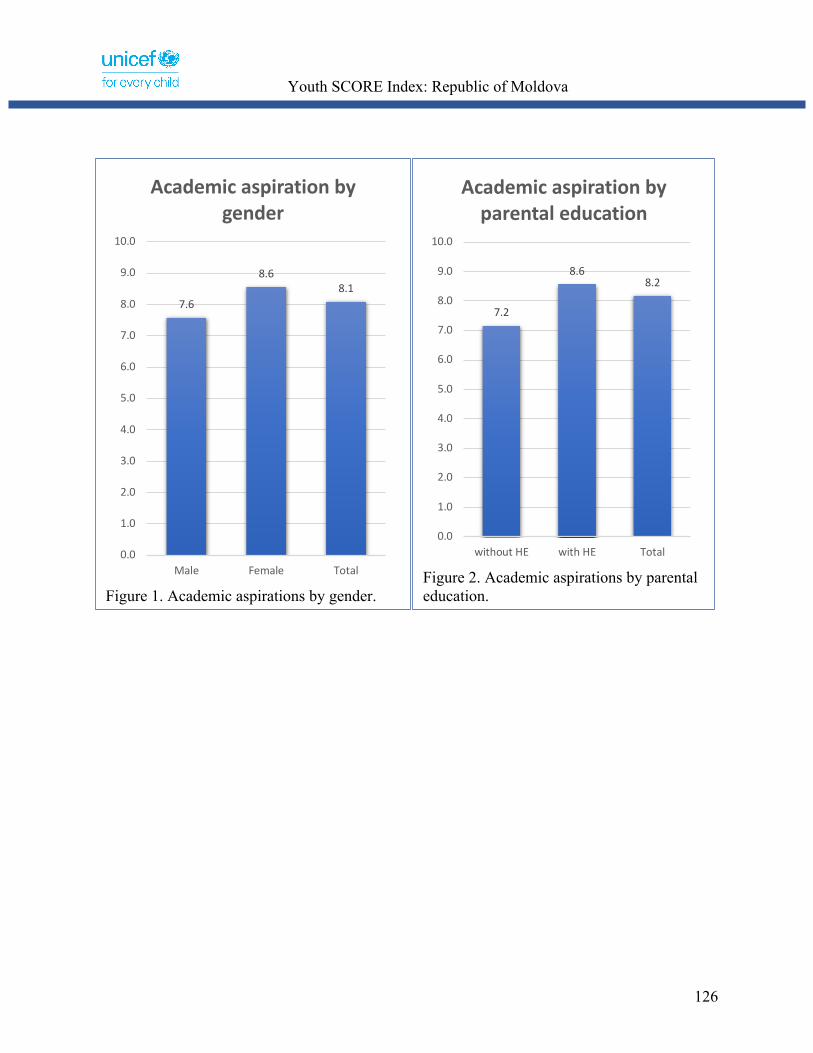
Youth SCORE Index: Republic of Moldova
126
Figure 1. Academic aspirations by gender.
7.6
8.68.1
0.0
1.0
2.0
3.0
4.0
5.0
6.0
7.0
8.0
9.0
10.0
Male Female Total
Academic aspiration by gender
Figure 2. Academic aspirations by parental education.
7.2
8.68.2
0.0
1.0
2.0
3.0
4.0
5.0
6.0
7.0
8.0
9.0
10.0
without HE with HE Total
Academic aspiration by parental education

Youth SCORE Index: Republic of Moldova
127
Figure 3. Emigration tendencies to EU and North American countries by UTAG vs. non-UTAG regions.
6.7
4.1
6.5
0.0
1.0
2.0
3.0
4.0
5.0
6.0
7.0
8.0
9.0
10.0
non-UTAG UTAG Total
Emigration Tendency to EU and North American
countries by region
Figure 4. Emigration tendencies to Eastern European countries by UTAG vs. non-UTAG regions.
2.4
3.5
2.5
0.0
1.0
2.0
3.0
4.0
5.0
6.0
7.0
8.0
9.0
10.0
non-UTAG UTAG Total
Emigration Tendency to Eastern European
countries by region

Youth SCORE Index: Republic of Moldova
128
Figure 5. Life satisfaction by educational aspirations.
6.5
7.2 7.1
0.0
1.0
2.0
3.0
4.0
5.0
6.0
7.0
8.0
9.0
10.0
do not intendUE
intend UE Total
Life Satisfaction by educational aspirations
Figure 6. Emigration tendencies by adult vs. youth samples.
5.4
6.5
0.0
1.0
2.0
3.0
4.0
5.0
6.0
7.0
8.0
9.0
10.0
Adult Sample Youth Sample
Reversal of brain drain and emigration trends by
survey
Youth SCORE Index: Republic of Moldova
129
THEMATIC BRIEF #10
PARTICIPATION
“The political and economic system is one that integrates young people into
the nation state through employment, rights to various kinds of social
security, voting and participation in a political system and civil society (for
example, through youth or sports associations) and access to social
citizenship through welfare and the common accomplishments of growing
up—finding partners, establishing a home and starting a family.”36
Youths are generally underrepresented in decisions and processes that have a direct effect
on their life. Youths’ meaningful participation in communities is an important aspect of social
cohesion. Excluding youth from decisions in the community will result in their alienation and
disengagement. In order to foster social cohesion among youths and increase youths' regard for
democratic values and principles, active participation of youths in their communities—and civic
life in general—need to be promoted.
Moreover, research shows that leisure time plays an important role in youths’ everyday
life37. Sports, music, and volunteering activities enable youth' interactions across communities
and groups.
Overall, youth in Moldova does not feel included in decision-making—with the highest
36 Abbott, 2010. 37 ftp.repec.org › opt › ReDIF › RePEc › icb › wpaper

Youth SCORE Index: Republic of Moldova
130
exclusion from decisions reported in Chisinau, and the highest inclusion reported in the Central
region. Youth in the UTAG region feel slightly less included in decision-making (compared to
youth from the non-UTAG regions). Besides, youth in urban areas feel less included in decision-
making than youth in rural areas. The same relationship is true in youths’ reported motivation to
participate in decision—with youth in urban feeling less motivated.
Youths in the Central region—who are relatively higher in their reported inclusion in
decision-making—also report the highest levels of motivation to participate in decision-making.
Youths from the UTAG region, in turn, report the lowest levels of motivation to participate in
decision-making—illustrated in Figure 1. Youth with higher educational aspirations feel more
motivated to participate in decision-making—as shown in Figure 2.
Predictably, youths in Chisinau report the highest availability of leisure activities, closely
followed by the Central region. Youths from the UTAG and Northern regions indicate the lowest
levels of available opportunities for leisure activities.
Among youths, males (compared to females) and those with higher educational ambitions
(compared to their peers with lower educational aspirations) tend to report the relatively higher
number of leisure activities available to them.
Youths in Moldova, in general, report relatively lower levels of community cooperation
across all regions—with the lowest being in Chisinau (4.48) and highest in the Central region
(4.98).
Females (compared to males) and youth from urban areas (compared to rural areas)
generally report relatively lower levels of community cooperation. In general, adult and youth
samples do not differ in their reported community cooperation.
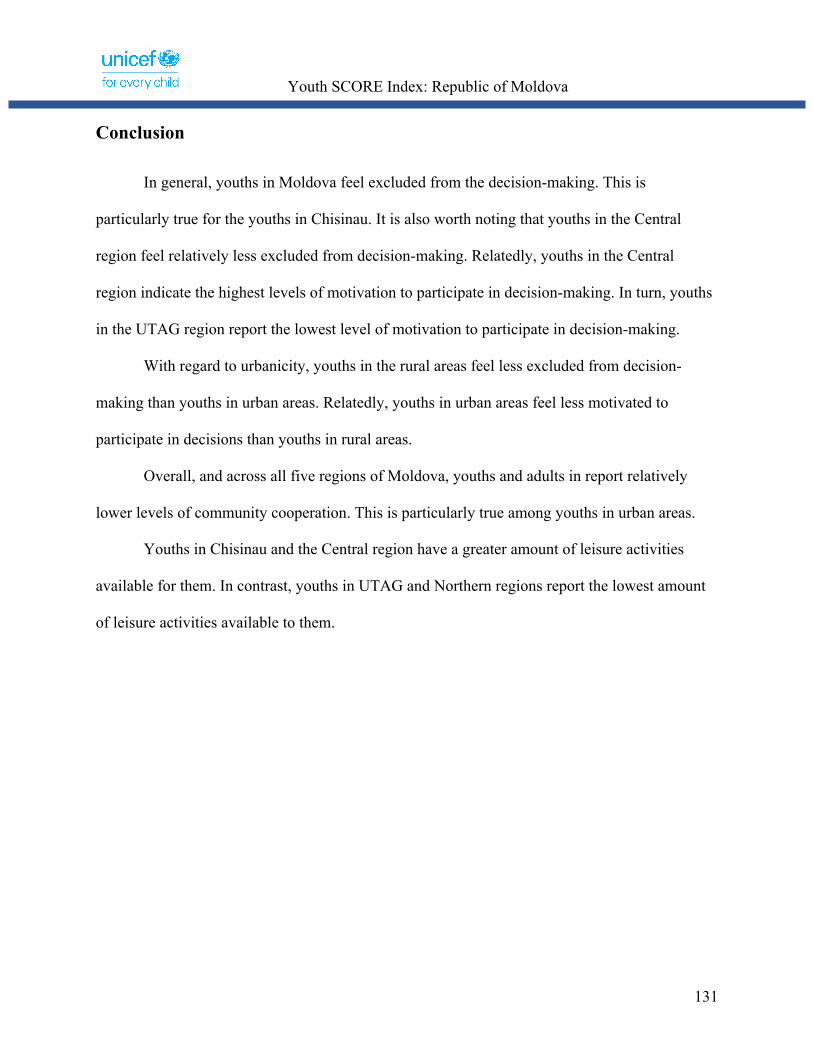
Youth SCORE Index: Republic of Moldova
131
Conclusion
In general, youths in Moldova feel excluded from the decision-making. This is
particularly true for the youths in Chisinau. It is also worth noting that youths in the Central
region feel relatively less excluded from decision-making. Relatedly, youths in the Central
region indicate the highest levels of motivation to participate in decision-making. In turn, youths
in the UTAG region report the lowest level of motivation to participate in decision-making.
With regard to urbanicity, youths in the rural areas feel less excluded from decision-
making than youths in urban areas. Relatedly, youths in urban areas feel less motivated to
participate in decisions than youths in rural areas.
Overall, and across all five regions of Moldova, youths and adults in report relatively
lower levels of community cooperation. This is particularly true among youths in urban areas.
Youths in Chisinau and the Central region have a greater amount of leisure activities
available for them. In contrast, youths in UTAG and Northern regions report the lowest amount
of leisure activities available to them.
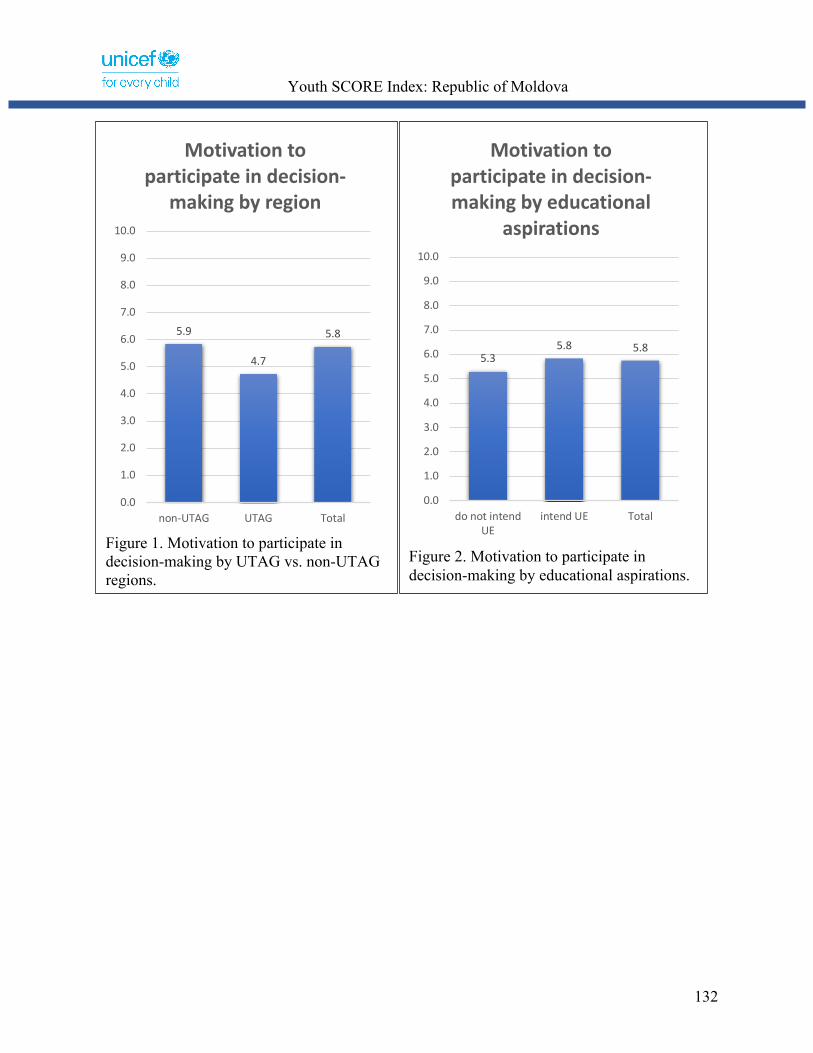
Youth SCORE Index: Republic of Moldova
132
Figure 1. Motivation to participate in decision-making by UTAG vs. non-UTAG regions.
5.9
4.7
5.8
0.0
1.0
2.0
3.0
4.0
5.0
6.0
7.0
8.0
9.0
10.0
non-UTAG UTAG Total
Motivation to participate in decision-
making by region
Figure 2. Motivation to participate in decision-making by educational aspirations.
5.35.8 5.8
0.0
1.0
2.0
3.0
4.0
5.0
6.0
7.0
8.0
9.0
10.0
do not intendUE
intend UE Total
Motivation to participate in decision-making by educational
aspirations

Youth SCORE Index: Republic of Moldova
133
THEMATIC BRIEF #11
GENDER
“[…] awareness of gender equality issues should be supported, especially in childhood
and adolescence, which are the periods in life when gender role attitudes are
internalized”38
In order to foster social cohesion, promoting gender equality in Moldova should be one
of the central priorities. Fight against gender inequality should also include educating youth on
related matters. Gender inequality is rooted in the social structure, which in turn has effects on
youths' perceptions and attitudes.
Overall, youths in Moldova do not perceive that gender equality has been achieved—with
youth in Chisinau disagreeing that gender equality has been achieved the most (5.44), and youth
from the UTAG region indicating the highest agreement (that gender equality is achieved; 6.64).
Females indicate that gender equality hasn’t been achieved more often than males.
Support for women’s reproductive rights is not universally high, with the highest support
among the youth being in Chisinau (7.44) and urban areas overall, and the lowest in Gagauzia
(6.31). Females and males did not differ much on this matter—illustrated in Figure 1.
In Moldova, a lack of reproductive health services, along with a lack of public and
evidence-based sexual education in schools is a concern39. Sexual health and reproductive rights
are human rights40. Support for sexual identity and reproductive rights—which is the highest in
38 https://link.springer.com/article/10.1007/s11205-015-0961-2 39 https://reproductiverights.org/press-room/a-closer-look-at-reproductive-rights-in-moldova 40 https://link.springer.com/article/10.1007/s11205-015-0961-2
Youth SCORE Index: Republic of Moldova
134
Chisinau (6.18) and the lowest in Gagauzia (5.00)—also didn’t differ significantly among males
and females. Adults, compared to youths, are significantly lower in their support for sexual
identity and reproductive rights—which is illustrated in Figure 2.
Support for sexual health education was somewhat mixed—ranging from 7.28 (Southern
region) to 6.65 (Chisinau). Youths with higher educational aspirations are higher in supporting
sexual health education—illustrated in Figure 3.
Although low overall (5.84), the support for women in political positions is the lowest
among the youth in the UTAG region (4.44)—and the highest in the Central region (6.22).
Females (compared to males) and those with higher educational ambitions (compared to peers
with lower educational ambitions) are noticeably higher in their support for women in political
positions—illustrated in Figure 4.
Adults in Moldova are more supportive of women in political positions than youth (6.25
vs. 6.18). Women are victims of the normalization of the domestic abuse—are significantly
lower than males in their normalization of the domestic abuse—illustrated in Figure 5.
The normalization of domestic abuse is the highest among the youths in the Northern
region (4.5) and the lowest among the youths in Chisinau (3.97). Besides, youths from urban
areas are lower in normalization of domestic abuse than youths from rural areas. Similarly,
youths with higher educational ambitions or whose parents have higher levels of education are
less likely to indicate normalization of domestic abuse.
Belief in female inferiority is somewhat low—but still exists—among youth in Moldova
across all regions (4.43), with small variation across the regions. Female youths are substantively
lower in such beliefs than males. The same is true for youth with higher parental education or
personal educational aspirations. Adults and youths didn’t differ significantly on their views on
Youth SCORE Index: Republic of Moldova
135
this matter (4.88 vs. 4.43).
Attitudes towards women’s participation in workforce varies by regions—with youths
from the Central region being relatively more negative than other regions, and youth from
Chisinau having more positive views on that matter (4.26). Females (compared to males) and
youth from urban areas (compared to rural areas) are relatively more positive on that matter. The
same is true for youths with higher parental education or personal academic aspirations. Adults
were less positive towards women’s participation in workforce than youths.
The view that husband should be involved in housework, cooking, taking care of children
or supporting their wives’ career is the highest in the Central region (8.32) and lowest in
Chisinau (7.87). Overall, majority agree that husbands should be involved on such matters
(8.06). Females’ view on that is substantively more positive than males’ view. The same is true
for youths with higher parental education (or higher personal educational aspirations).
Conclusion
In general, youths in Moldova, and Chisinau in particular, express that gender equality
has not been achieved. In contrast, youths in the UTAG region tend to imply that gender equality
has been achieved relatively more often. Youths in Chisinau also express the highest support for
sexual identity and reproductive rights—while youths from the UTAG region indicate the lowest
support for sexual identity and reproductive rights (among five regions).
It is also worth noting that adults are significantly lower in their support for sexual
identity and reproductive rights than youths. Moreover, adults, compared to youths, are less
positive towards women’s participation in workforce. However, adults in Moldova are more
supportive of women in political positions than youths. The support for women in political

Youth SCORE Index: Republic of Moldova
136
positions is the lowest among the youth in the UTAG region and the highest among the youths in
the Central region.
Although the youths in the Central region are more negative (than youths from other
regions) towards women’s participation in workforce, they are more accepting (than other
regions) in their view that husband should be involved in housework, cooking, taking care of
children or supporting their wives’ career. In contrast, youths from Chisinau are more supportive
of women’s participation in workforce (compared to the other four regions)—but less supportive
of husbands’ involvement in the housework.
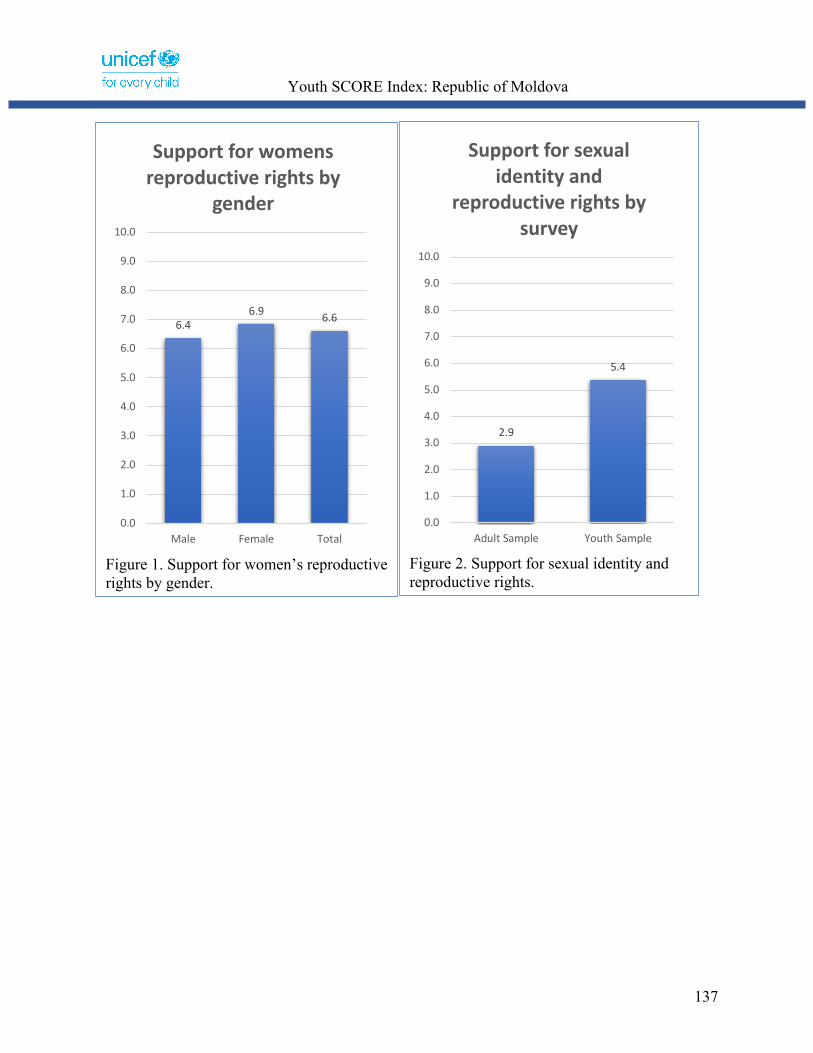
Youth SCORE Index: Republic of Moldova
137
Figure 1. Support for women’s reproductive rights by gender.
6.46.9 6.6
0.0
1.0
2.0
3.0
4.0
5.0
6.0
7.0
8.0
9.0
10.0
Male Female Total
Support for womens reproductive rights by
gender
Figure 2. Support for sexual identity and reproductive rights.
2.9
5.4
0.0
1.0
2.0
3.0
4.0
5.0
6.0
7.0
8.0
9.0
10.0
Adult Sample Youth Sample
Support for sexual identity and
reproductive rights by survey
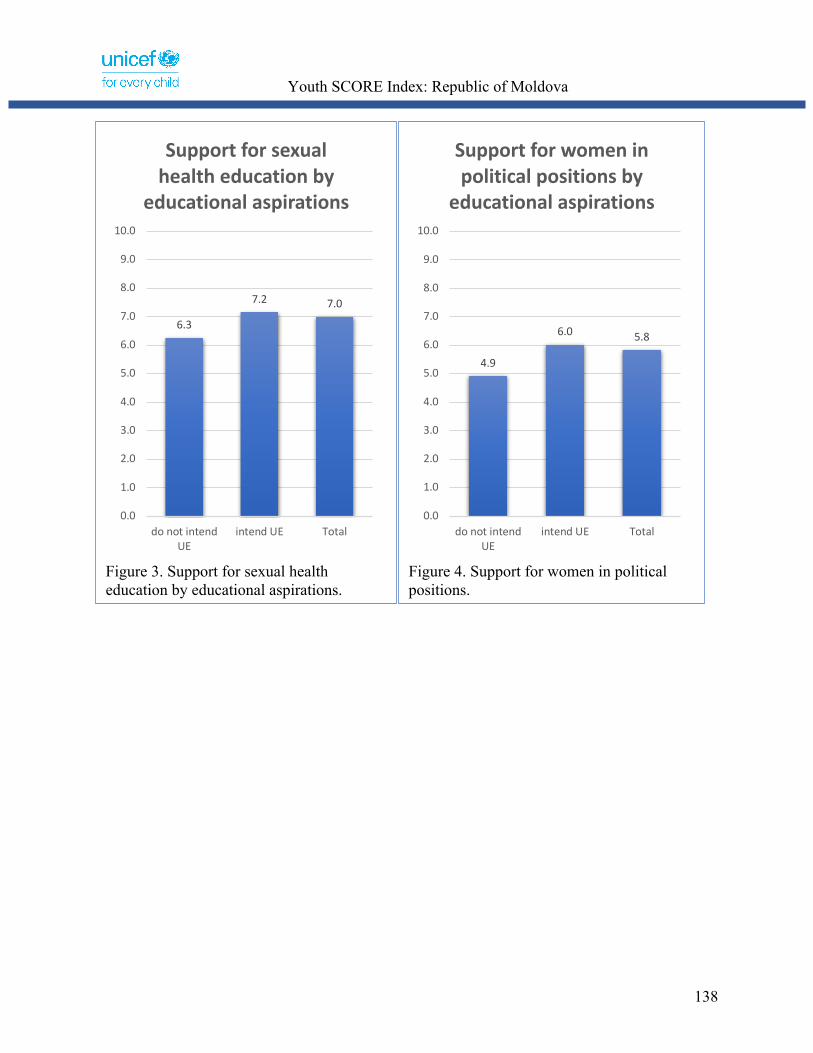
Youth SCORE Index: Republic of Moldova
138
Figure 3. Support for sexual health education by educational aspirations.
6.3
7.2 7.0
0.0
1.0
2.0
3.0
4.0
5.0
6.0
7.0
8.0
9.0
10.0
do not intendUE
intend UE Total
Support for sexual health education by
educational aspirations
Figure 4. Support for women in political positions.
4.9
6.0 5.8
0.0
1.0
2.0
3.0
4.0
5.0
6.0
7.0
8.0
9.0
10.0
do not intendUE
intend UE Total
Support for women in political positions by
educational aspirations
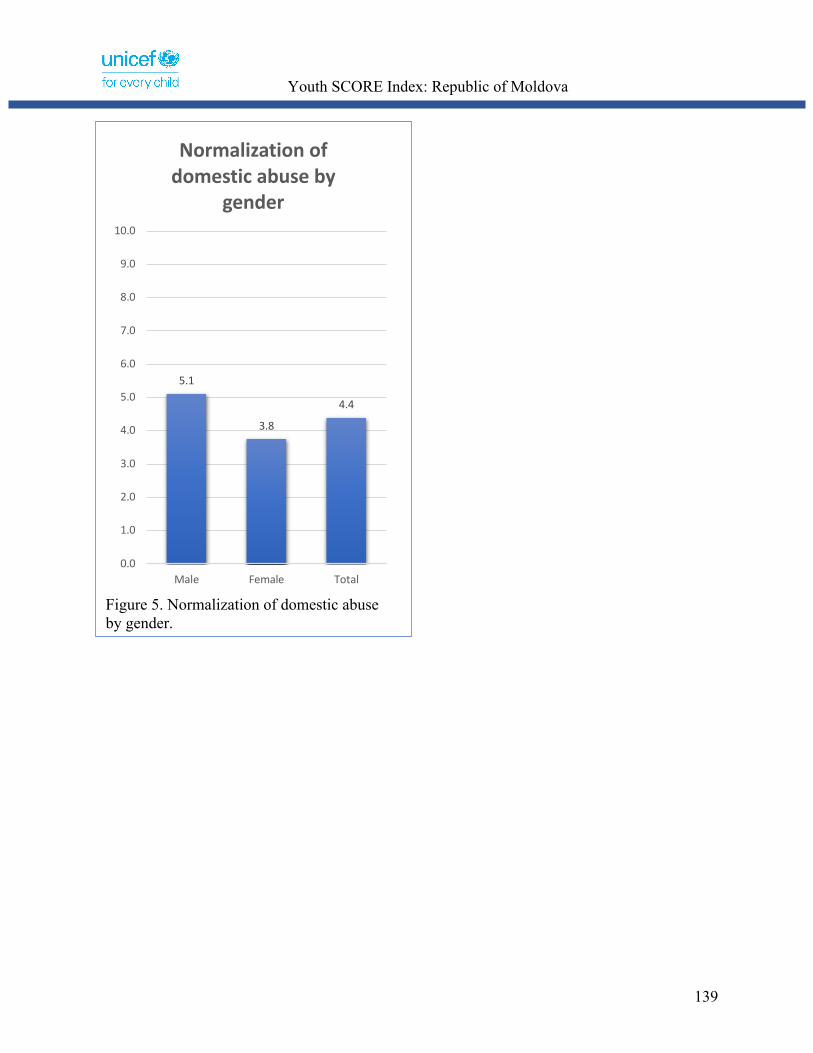
Youth SCORE Index: Republic of Moldova
139
Figure 5. Normalization of domestic abuse by gender.
5.1
3.8
4.4
0.0
1.0
2.0
3.0
4.0
5.0
6.0
7.0
8.0
9.0
10.0
Male Female Total
Normalization of domestic abuse by
gender

Youth SCORE Index: Republic of Moldova
140
THEMATIC BRIEF #12
PARENTING
“We can reasonably expect the cohesiveness and stability of a society to
depend heavily on the unity and strength of its most basic unit, its
cornerstone the family.”41
Family is the fundamental building block of society. Research shows42 that strong family
bonds (interconnectedness within the family) and family cohesion are associated with youths'
better physical, emotional, and academic well-being, and with lower depression. Family
cohesion is also positively associated with youth’s social problem-solving skills. Strong family
ties also result in improved and easier social integration for youth—by youth being able to rely
on family support in their challenges in life.
Relatedly, parenting is correlated with neighborhood cohesion43 as well. Specifically,
socially cohesive neighborhoods—which includes mutual trust among neighbors—can drive
improvements in parenting.
One particular problem in the context of Moldova is that migration to work abroad has
left youth to be raised by their relatives, leading to social problems among youth. Such social
problems range from dropping out of school to ending up as "street children or prey to
traffickers."44
The feeling of safety—at home, neighborhood, or online—is an important predictor of
41 http://www.socsc.hku.hk/cosc/Full%20paper/Leung%20Benjamin_full.pdf 42 https://cpb-us-w2.wpmucdn.com/sites.udel.edu/dist/0/659/files/2013/05/Leidy-Guerra-Toro-2010-Positive-parenting-family-cohesion-and-child-social-competence-among-immigrant-Latino-families.pdf 43 https://www.ncbi.nlm.nih.gov/pubmed/26774530 44 Abbott et al, 2010.

Youth SCORE Index: Republic of Moldova
141
parenting. Youths in Moldova generally indicate that they feel safe at home—with youth in
Chisinau reporting the lowest (but still high, at 9.0) and youth in the UTAG region reporting the
highest (9.4) levels of home safety. Younger respondents (ages 14-15) feel less safe at home than
older respondents (ages 16-18). Moreover, youth whose parents have higher levels of education
feel safer at home than youth whose parents have lower education levels—illustrated in Figure 1.
The same relationship holds when comparing youth with higher educational ambitions to
youth with lower educational ambitions—with the former feeling safer at home. Youth across
five regions vary more in their reported feeling of safety in their neighborhoods. Specifically,
youths in Chisinau and Northern region report the lowest level of safety in their neighborhoods
(7.3 and 7.4) and youths in the UTAG region report the highest levels of neighborhood safety (at
8.4)—illustrated in Figure 2.
Among youth, females report being less safe in their neighborhoods—illustrated in
Figure 3—implying that neighbors are less safe for females. Youth in urban areas also indicate
feeling less safe in their neighborhoods than youth in rural areas. Youths whose parents have
higher education level report that their neighborhoods are safer substantively more often
(compared to youth with lower parental education.
Online safety is also lowest in Chisinau (6.8) and highest in Gagauzia (7.9). Consistent
with findings related to neighborhood safety, females, compared to male youth, report being
substantively less safe online—illustrated in Figure 4.
Parental involvement, as reported by youth respondents, is lowest among youth in
Chisinau (6.8) and highest among youth in the Central region (7.6). Females report substantively
higher parental involvement than males—illustrated in Figure 5. Youth in urban areas report

Youth SCORE Index: Republic of Moldova
142
relatively lower parental involvement than youth in rural areas—as shown in Figure 6.
Youth with higher parental education levels and youth with higher educational
aspirations report higher levels of parental involvement (when compared to youth with lower
parental education or lower educational aspirations).
Overall, youth in Moldova report high levels of family connectedness—with the lowest
being in Chisinau (8.27) and highest being in the Southern region (8.74). Moreover, females
report that their family bonds are strong more often than males. Similarly, youth whose parental
education or personal educational ambitions are higher report strong family bonds more often.
Conclusion
Research indicates that due to the prevalence in the migration to work abroad, a
significant number of youths in Moldova were left to be raised without their parents. Among
youths in Moldova, parental involvement is lowest among youths in Chisinau and highest among
youths in the Central region. Among youths, females report higher parental involvement than
males. Similarly, youths in rural areas report relatively higher levels of parental involvement
than youths in rural areas. Across all five regions, youths in Moldova express relatively higher
levels of family connectedness.

Youth SCORE Index: Republic of Moldova
143
Figure 1. Feeling safe at home by parental education.
8.7
9.5 9.2
0.0
1.0
2.0
3.0
4.0
5.0
6.0
7.0
8.0
9.0
10.0
without HE with HE Total
Feeling safe at home by parental education
Figure 2. Perceived neighborhood safety by UTAG vs. non-UTAG regions.
7.5
8.4
7.6
0.0
1.0
2.0
3.0
4.0
5.0
6.0
7.0
8.0
9.0
10.0
non-UTAG UTAG Total
Feeling safe in the neighbourhood by
region

Youth SCORE Index: Republic of Moldova
144
Figure 3. Perceived neighborhood safety by gender.
8.1
7.27.6
0.0
1.0
2.0
3.0
4.0
5.0
6.0
7.0
8.0
9.0
10.0
Male Female Total
Feeling safe in the neighbourhood by
gender
Figure 4. Perceived online safety by gender.
7.8
6.6
7.2
0.0
1.0
2.0
3.0
4.0
5.0
6.0
7.0
8.0
9.0
10.0
Male Female Total
Feeling safe online by gender
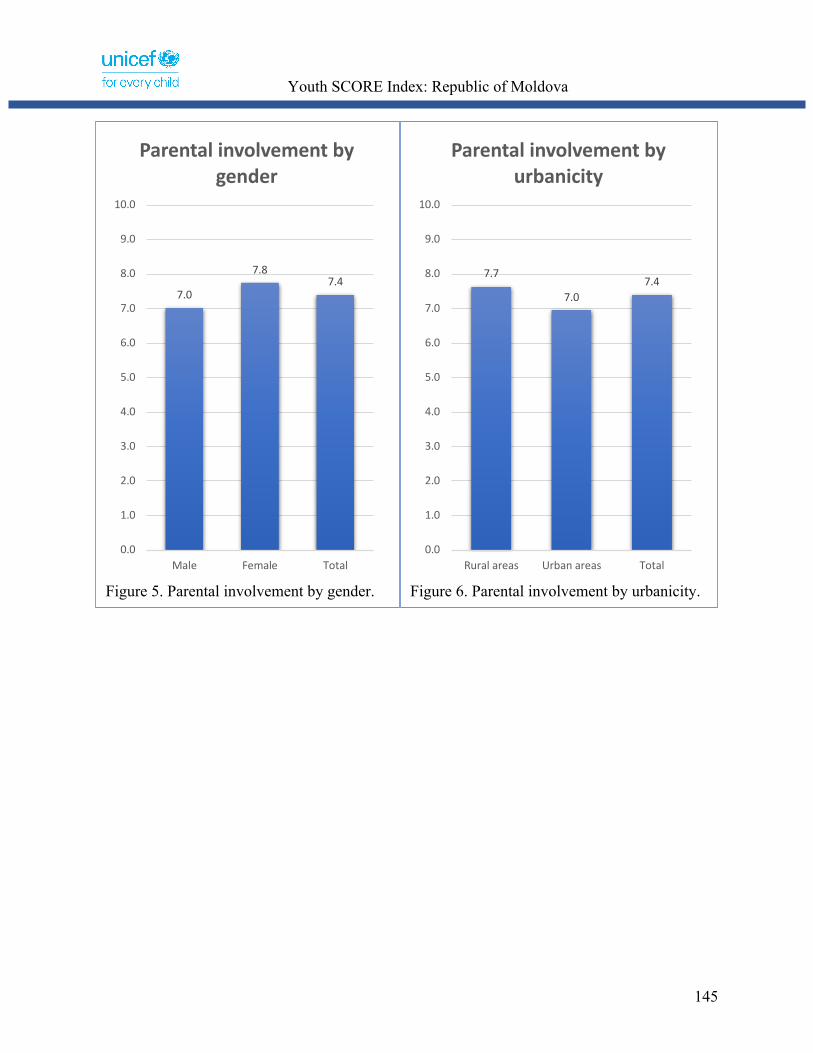
Youth SCORE Index: Republic of Moldova
145
Figure 5. Parental involvement by gender.
7.0
7.87.4
0.0
1.0
2.0
3.0
4.0
5.0
6.0
7.0
8.0
9.0
10.0
Male Female Total
Parental involvement by gender
Figure 6. Parental involvement by urbanicity.
7.7
7.07.4
0.0
1.0
2.0
3.0
4.0
5.0
6.0
7.0
8.0
9.0
10.0
Rural areas Urban areas Total
Parental involvement by urbanicity