yousaf weaving mills limitedyousafweavingmills.com/annualreports/ywml ann15.pdf · yousaf weaving...
TRANSCRIPT
Y O U S A F W E A V I N G M I L L S L I M I T E D Annual Report 2 0 1 5
1
CONTENTS
Company Information 02
Notice of Annual General Meeting 03
Directors’ Report to the Shareholders 04
Statement of Compliance with the Code of Corporate Governance 06
Auditors’ Review on Compliance of the Code of Corporate Governance 08
Auditors’ Report to the Members 09
Balance Sheet 10
Profit & Loss Account 12
Statement of Comprehensive Income 13
Cash Flow Statement 14
Statement of Changes in Equity 15
Notes to the Accounts 16
Key Financial Data of Last Six Years 47
Pattern of Shareholding 49
Form of Proxy 51
Y O U S A F W E A V I N G M I L L S L I M I T E D Annual Report 2 0 1 5
2
COMPANY INFORMATION
BOARD OF DIRECTORSKhawaja Mohammad Nadeem (Chief Executive)Khawaja Mohammad Jawed (Director)Khawaja Mohammad Jahangir (Director)Khawaja Mohammad Tanveer (Director)Khawaja Mohammad Kaleem (Director)Mr. Mohammad Naveed (Director)Mr. Danish Tanveer (Director)Mr. Mohammad Tariq Sufi (Independent Director)
AUDIT COMMITTEEMr. Mohammad Tariq Sufi (Chairman)Khawaja Mohammad Kaleem (Member)Mr. Danish Tanveer (Member)
HR & REMUNERATION COMMITTEEKhawaja Mohammad Kaleem (Chairman)Khawaja Mohammad Nadeem (Member)Mr. Mohammad Naveed (Member)
COMPANY SECRETARYMr. Nadeem Anwar (ACA)
CHIEF FINANCIAL OFFICERMr. Nadeem Anwar (ACA)
BANKERSHabib Metro Bank LimitedNational Bank of PakistanAskari Bank LimitedFaysal Bank LimitedThe Bank of Punjab
AUDITORSAslam Malik & Co.Chartered AccountantsSuite # 18-19,Ist Floor,Central Plaza, Civic Centre,New Garden Town, Lahore. Pakistan
CORPORATE & REGISTERED OFFICE 7/1-E-3 Main Boulevard Gulberg III, LahoreTel : (042) 35717510Fax : (042) 35755760
SHARE REGISTRARSCorp link (Pvt) LimitedWings Arcade, 1-K, Commercial,Model Town, LahoreTel : (042) 35839182Fax : (042) 35869037
Weaving Unit Spinning Unit Dairy Unit49-Kilometer 7-Kilometer Ratta Sharif,Multan Road, Bhai Phero Multan Road,Pattoki Tehsil Kallar Kahar,Tel : (04943) 540083-4 Tel : (04943) 540083-4 D is t r i c t Chakwal
Y O U S A F W E A V I N G M I L L S L I M I T E D Annual Report 2 0 1 5
3
NOTICE OF ANNUAL GENERAL MEETING
Notice is hereby given that the 28th Annual General Meeting of YOUSAF WEAVING MILLS LIMITED will be held on Wednesday,April 13, 2016 at 09:00 a.m. at 31-F, Main Market Gulberg II, Lahore to deal with the following matters :-
ORDINARY BUSINESS:
1. To confirm the minutes of Annual General Meeting held on October 31, 2014.
2. To receive and adopt the audited accounts of the Company for the year ended June 30, 2015 together with the reports of directors and auditors thereon.
3. To appoint auditors for the year ending June 30, 2016 and to fix their remuneration. A share holder of the company has given notice under section 253 of the Companies Ordinance, 1984 proposing appointment of M/S Izhar & Co. Chartered Accountants as auditors of the company for the year ending June 30, 2016 in place of retiring auditors M/S Aslam Malik & Co, Chartered Accountants.
4. To transact any other business with the permission of the Chair.
BY ORDER OF THE BOARD
Lahore: NADEEM ANWARMarch 22, 2016 Company Secretary
BOOK CLOSURE
The Member's Register will remain closed from April 07, 2016 to April 13, 2016 (both days inclusive).
NOTES:
1. A member entitled to attend the meeting may appoint another member as his/her proxy to attend the meeting of him/her behalf. Proxies in order to be effective must be received by the Company not later than 48 hours before the meeting.
2. The beneficial owner of the shares of the company in the central depository system of the CDC or his/her proxy entitled to attend this meeting shall produce his/her original CNIC or passport to prove the identity. CDC Account Holders will further have to follow the guidelines as laid down in Circular No. 1 dated 26 January 2000 issued by the Securities and Exchange Commission of Pakistan.
3. Transfer received in order by the close of business hours on April 06, 2016 will be treated in time. The same or any change in address, if any, alongside valid copy of CNIC for filing annual return of company be sent to our share registrar M/s Corplink (Pvt) Limited, Wings Arcade, 1-K, Commercial, Model Town, Lahore. Tel. 042-5839182.
4. In terms of SECP,s SRO 787(1)/2014, members can now receive audited financial statements alongside notice of AGM electronically through email. Therefore members (physical or CDC shareholders) who are interested in receiving the same are required to send their email addresses and consent for electronic transmission to share registrar of the company or directly to their broker(participant)/CDC investor account services, as the case may be.
5. The company has also placed the audited financial statements for the year ended 30-6-2015 alongside directors and auditor's report thereon on its website www.chakwalgroup.com
Y O U S A F W E A V I N G M I L L S L I M I T E D Annual Report 2 0 1 5
4
DIRECTORS’ REPORT TO THE SHAREHOLDERS
On behalf of the Board of Directors of Yousaf Weaving Mills Limited, we are pleased to submit annual report and the audited financial statements of the Company for the year ended June 30, 2015.
FINANCIAL PERFORMANCE
The financial year 2015 was very severe in the corporate history of the textile industry. Total sales during the year ended June 30, 2015 amounted to Rs. 1,708.644 million as compared to Rs. 2,748.395 million during the corresponding period. The sale volume decrease by 37.83% as compared to last year. Gross loss for the year amounted to Rs. 178.572 million as compared to gross profit Rs. 257.874 million over the last year. Your company has incurred after tax loss of Rs. 347.539 million as compared to after tax profit of Rs. 10.304 million for the corresponding last year. Due to non availability of export and local market at affordable price, the management was forced to operate in conversion to remain operation in the business. Gross loss is mainly due decline in export sale, under/low utilization of manufacturing capacities, decrease in product price in local and international market, no government's support to textile industry, non availability of required financial support from the banks of the company to meet the working capital need to revive its export business mainly contributed in the significant losses of the company. The company needs support from its financial partners by way of rescheduling and restructuring and has capacity to revive its export business and to utilize its production facilities at optimum levels. Certain bank has restructured its loans and the management is making negotiat ion to revive its business relat ionship with other banks to meet its working capital requirement.
Decrease in Administrative expenses reflects the management committed to reduce the expenses keeping in view the difficult business condition faced by the company and where as distribution expenses decreased due to decreased in export sale as compared to corresponding period. The company is able to discharge all its operating and financial liabilities in time through generation of stable cash flows.
Future Prospects and Outlook
The weaving business is experiencing difficult market conditions where demand for gray fabric is falling leading to unfavorable unit prices. Pakistan's share in global textile market has fellen. Meanwhile, over the period our regional competitors China, India and Bangladesh have gain the increased global market share due to low cost of doing business as compared to Pakistan. Moreover, due to global textile recession the price of textile product in local and international market decline with parallel increase in cost of manufactured in Pakistan. This is quite a deplorable state of affairs. However, management is running the affairs with same strength and unwavering determination to show better results in the coming period.
Nevertheless, Pakistan is 4th largest producer of cotton along with huge manufacturing setup for value addition and this provide great advantage to compete with rival countries. Further law and order situation in the country is improving which will attract more customers from Europe and rest of the world and this improved law and order situation is also encouraging fresh domestic and foreign investment in textile industry. Pakistan has GSP plus status from the EU that is a big advantage. However, the benefits from these factors are largely dependent upon the initiatives taken by the Government of Pakistan to ease the cost of doing business and effective implementation of textile policy.
In future Company's ability to produce better results are dependent on uninterrupted and at reduce rate gas and electricity supply, continued demand for fabric from both local and International markets, stability in yarn prices, single digit inflation and controlled law and order situation in the country. The Board of Directors is cognizant of these facts and strives to take all necessary steps to protect the interests of the Company. It is anticipated that economic activities will flourish and the company shall regain its path in further in improving it performance. On vigorous representation, government has announced some positive decision to reduce interest rate, imposition of import regulatory duties, electricity Industrial tariff relief of Rs. 3 per unit and provision of 24 hours a day and 7 day a week supply of RLNG by the government you will see some turn around. The enormous losses is due to feared situation that continue long time and if such government initiative taken by government in right time at early stage of depression, industry financial results would be much better. Additional long term measures are required from the government to enable the weaving industry to become internationally competitive. It is hoped that the government will take serious steps to provide uninterrupted gas supply, refund stuck up taxes, zero rate textile export and encourage value addition in the textile sector. The management is committed to deploy all its resources to find a resolution of the issues and turnaround the financial health of the company.
Salient Aspects of Company's Control and Reporting System
The Company Complies with all the requirements of the Code of Corporate Governance as contained in the listing regulations of the Stock Exchanges. To fulfill this role, the Board is responsible to implement overall corporate governance in the company including approval of the strategic direction as recommended by the Management, approving and monitoring capital expenditure, appointing, removing and creating succession policies for the senior management, establishing and monitoring the achievement of management's goals and ensuring the integrity of internal control and Management Information System. It is also responsible for approving and monitoring financial and other reporting. The Board has delegated responsibility for operation and administration of the company to the Chief Executive/ Managing Director. Responsibilities are delineated by formal authority delegations. The Board has constituted the following committees which work under the guidance of Board of Directors -
a) Audit Committeeb) Human Resource Committee
Independent Director
The Board already elected an independent director to fulfill the requirements of Code of Corporate Governance.
Y O U S A F W E A V I N G M I L L S L I M I T E D Annual Report 2 0 1 5
5
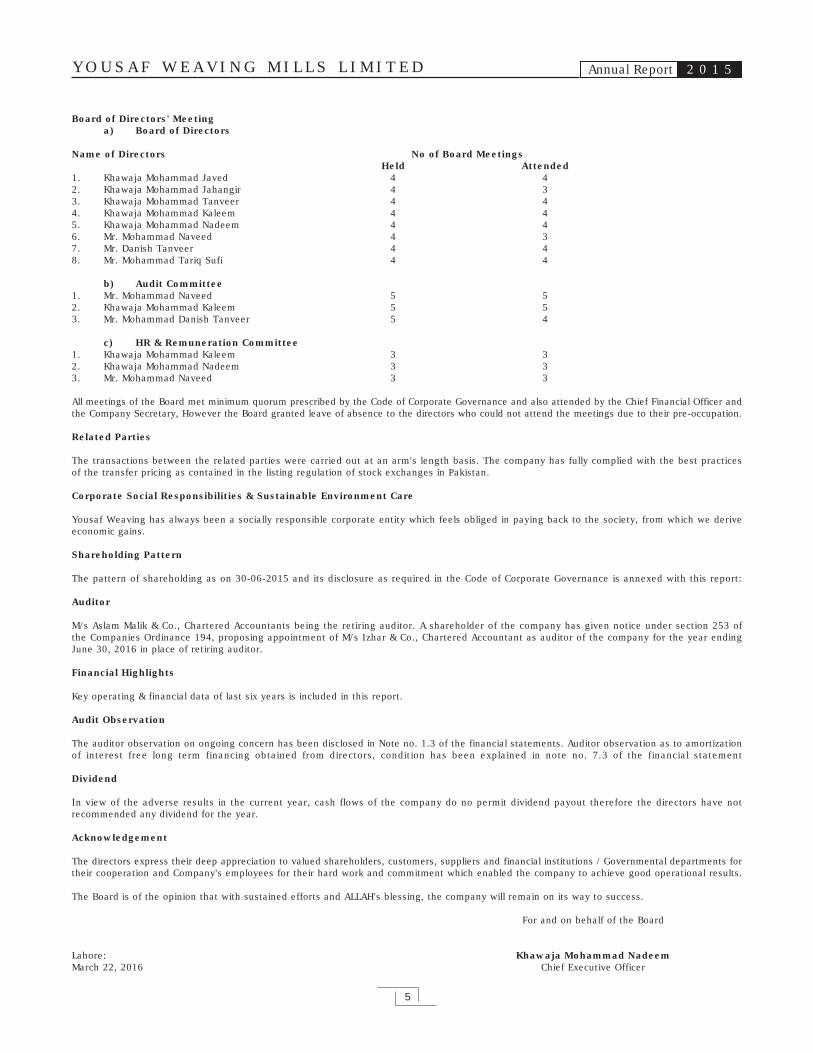
Board of Directors' Meetinga) Board of Directors
Name of Directors No of Board MeetingsHeld Attended
1. Khawaja Mohammad Javed 4 42. Khawaja Mohammad Jahangir 4 33. Khawaja Mohammad Tanveer 4 44. Khawaja Mohammad Kaleem 4 45. Khawaja Mohammad Nadeem 4 46. Mr. Mohammad Naveed 4 37. Mr. Danish Tanveer 4 48. Mr. Mohammad Tariq Sufi 4 4
b) Audit Committee1. Mr. Mohammad Naveed 5 52. Khawaja Mohammad Kaleem 5 53. Mr. Mohammad Danish Tanveer 5 4
c) HR & Remuneration Committee1. Khawaja Mohammad Kaleem 3 32. Khawaja Mohammad Nadeem 3 33. Mr. Mohammad Naveed 3 3
All meetings of the Board met minimum quorum prescribed by the Code of Corporate Governance and also attended by the Chief Financial Officer and the Company Secretary, However the Board granted leave of absence to the directors who could not attend the meetings due to their pre-occupation.
Related Parties
The transactions between the related parties were carried out at an arm's length basis. The company has fully complied with the best practices of the transfer pricing as contained in the listing regulation of stock exchanges in Pakistan.
Corporate Social Responsibilities & Sustainable Environment Care
Yousaf Weaving has always been a socially responsible corporate entity which feels obliged in paying back to the society, from which we derive economic gains.
Shareholding Pattern
The pattern of shareholding as on 30-06-2015 and its disclosure as required in the Code of Corporate Governance is annexed with this report:
Auditor
M/s Aslam Malik & Co., Chartered Accountants being the retiring auditor. A shareholder of the company has given notice under section 253 of the Companies Ordinance 194, proposing appointment of M/s Izhar & Co., Chartered Accountant as auditor of the company for the year ending June 30, 2016 in place of retiring auditor.
Financial Highlights
Key operating & financial data of last six years is included in this report.
Audit Observation
The auditor observation on ongoing concern has been disclosed in Note no. 1.3 of the financial statements. Auditor observation as to amortization of interest free long term financing obtained from directors, condition has been explained in note no. 7.3 of the financial statement
Dividend
In view of the adverse results in the current year, cash flows of the company do no permit dividend payout therefore the directors have not recommended any dividend for the year.
Acknowledgement
The directors express their deep appreciation to valued shareholders, customers, suppliers and financial institutions / Governmental departments for their cooperation and Company's employees for their hard work and commitment which enabled the company to achieve good operational results.
The Board is of the opinion that with sustained efforts and ALLAH's blessing, the company will remain on its way to success.
For and on behalf of the Board
Lahore: Khawaja Mohammad NadeemMarch 22, 2016 Chief Executive Officer
Y O U S A F W E A V I N G M I L L S L I M I T E D Annual Report 2 0 1 5
6
STATEMENT OF COMPLIANCE WITH THE CODE OF CORPORATE GOVERNANCE
This statement is being presented to comply with the Code of Corporate Governance (CCG) contained in regulation No. 35 of listing regulations of both Karachi Stock Exchange and Lahore Stock Exchange for the purpose of establishing a framework of good governance, whereby a listed company is managed in compliance with the best practices of corporate governance.(CCG)
The company has applied the principles contained in the CCG in the following manner:
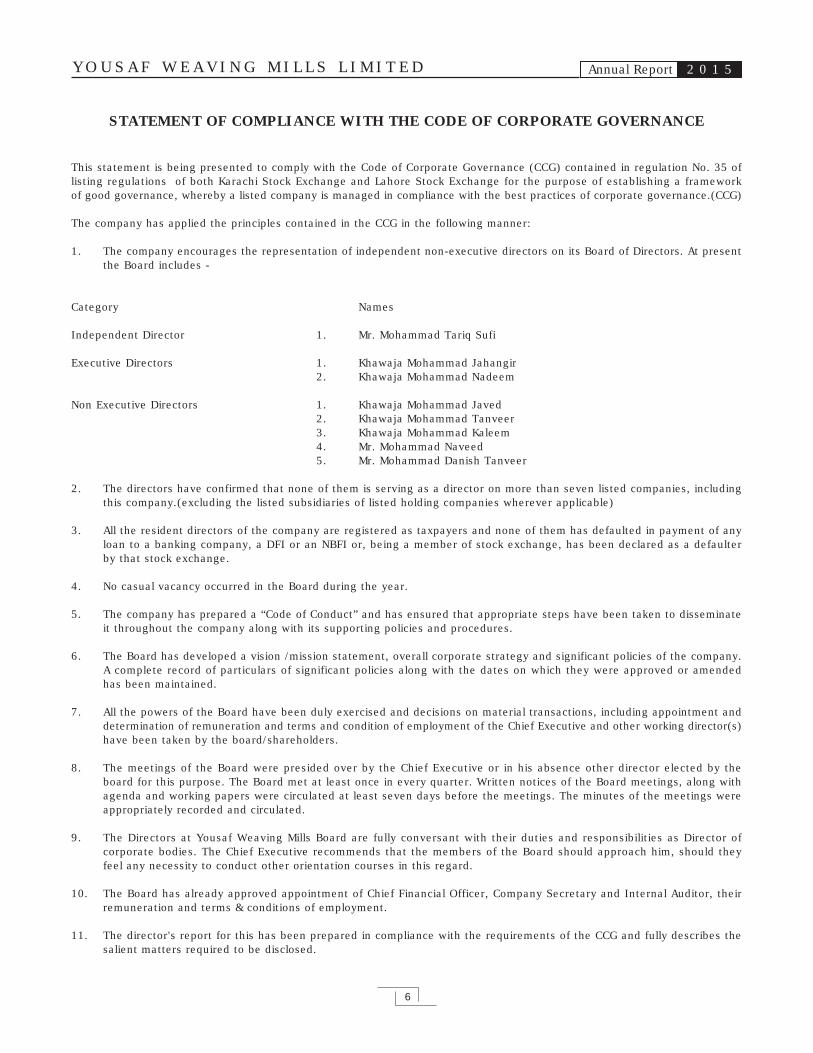
1. The company encourages the representation of independent non-executive directors on its Board of Directors. At present the Board includes -
Category Names
Independent Director 1. Mr. Mohammad Tariq Sufi
Executive Directors 1. Khawaja Mohammad Jahangir2. Khawaja Mohammad Nadeem
Non Executive Directors 1. Khawaja Mohammad Javed2. Khawaja Mohammad Tanveer3. Khawaja Mohammad Kaleem4. Mr. Mohammad Naveed5. Mr. Mohammad Danish Tanveer
2. The directors have confirmed that none of them is serving as a director on more than seven listed companies, includingthis company.(excluding the listed subsidiaries of listed holding companies wherever applicable)
3. All the resident directors of the company are registered as taxpayers and none of them has defaulted in payment of any loan to a banking company, a DFI or an NBFI or, being a member of stock exchange, has been declared as a defaulter by that stock exchange.
4. No casual vacancy occurred in the Board during the year.
5. The company has prepared a “Code of Conduct” and has ensured that appropriate steps have been taken to disseminate it throughout the company along with its supporting policies and procedures.
6. The Board has developed a vision /mission statement, overall corporate strategy and significant policies of the company. A complete record of particulars of significant policies along with the dates on which they were approved or amended has been maintained.
7. All the powers of the Board have been duly exercised and decisions on material transactions, including appointment and determination of remuneration and terms and condition of employment of the Chief Executive and other working director(s) have been taken by the board/shareholders.
8. The meetings of the Board were presided over by the Chief Executive or in his absence other director elected by the board for this purpose. The Board met at least once in every quarter. Written notices of the Board meetings, along with agenda and working papers were circulated at least seven days before the meetings. The minutes of the meetings were appropriately recorded and circulated.
9. The Directors at Yousaf Weaving Mills Board are fully conversant with their duties and responsibilities as Director of corporate bodies. The Chief Executive recommends that the members of the Board should approach him, should they feel any necessity to conduct other orientation courses in this regard.
10. The Board has already approved appointment of Chief Financial Officer, Company Secretary and Internal Auditor, their remuneration and terms & conditions of employment.
11. The director's report for this has been prepared in compliance with the requirements of the CCG and fully describes the salient matters required to be disclosed.

Y O U S A F W E A V I N G M I L L S L I M I T E D Annual Report 2 0 1 5
7
12. The financial statements of the company were duly endorsed by CEO and CFO before approval of the Board.
13. The directors, CEO and executives do not hold any interest in the shares of the company other than that disclosed in the pattern of shareholding.
14. The company has complied with all the corporate and financial reporting requirements of the CCG.
15. The Board has formed an Audit Committee, It comprises of three members, of whom all are non executive directors and the chairman of the committee is also an non executive director.
16. The meetings of the Audit Committee were held at least once every quarter prior to approval of interim and final results of the Company and as required by the CCG. The terms of references of the committee have been formed and advised to the committee for compliance.
17. The board has formed an HR and Remuneration committee; It comprises of three members, including the CEO and the non executive directors while the chairman of the committee is a non executive director.
18. The Board has set up an effective internal audit department which is suitably qualified and experienced for the purpose and is conversant with the policies and procedures of the company.
19. The statutory auditors of the company have confirmed that they have been given satisfactory rating under the quality control review program of the ICAP, that they or any of the partners of the firm, their spouses and minor children do not hold shares of the Company and that the firm and all its partners are in compliance with International Federation of Accountants (IFAC) guidelines on code of ethics as adopted by ICAP.
20. The statutory auditors or the persons associated with them have not been appointed to provide other services except in accordance with the listing regulations and the auditors have confirmed that they have observed IFAC guidelines in this regard.
21. The “closed period” prior to the announcement of interim/final results and business decisions which may materially affect the market price of Company's securities, was determined and intimated to directors, employees and stock exchange(s).
22. Material/price sensitive information has been disseminated among all market participants at once through stock exchange(s).
23. All related party transactions entered during the year were at arm's length basis and these have been placed before the Audit Committee and Board of Directors. These transactions are duly reviewed and approved by Audit Committee and Board of Directors.
24. We confirm that all other material principles enshrined in the CCG have been complied with.
Lahore: Khawaja Mohammad NadeemMarch 22, 2016 Chief Executive

Y O U S A F W E A V I N G M I L L S L I M I T E D Annual Report 2 0 1 5
8
REVIEW REPORT TO THE MEMBERSON STATEMENT OF COMPLIANCE WITH BEST PRACTICES
OF CODE OF CORPORATE GOVERNANCE
We have reviewed the Statement of Compliance with the best practices contained in the Code of Corporate Governance prepared by the Board of Directors of Yousaf Weaving Mills Limited to comply with the Listing Regulation of Karachi Stock Exchange (Guarantee) Limited where the Company is listed.
The responsibility for compliance with the Code of Corporate Governance is that of the Board of Directors of the Company. Our responsibility is to review, to the extent where such compliance can be objectively verified, whether the Statement of Compliance reflects the status of the company's compliance with the provisions of the Code of Corporate Governance and report if it does not. A review is limited primarily to inquiries of the company personnel and review of various documents prepared by the Company to comply with the Code.
As part of our audit of financial statements we are required to obtain an understanding of the accounting and internal control systems sufficient to plan the audit and develop an effective audit approach. We are not required to consider whether the board's statement on internal control covers all risks and controls, or to form an opinion on the effectiveness of such internal controls, the company's corporate governance procedures and risks.
The Code requires the Company to place before, the Audit Committee, and upon recommendation of the Audit Committee, place before the Board of Directors for their review and approval its related party transactions distinguishing between transactions carried out on terms equivalent to those that prevail in arm's length transactions and transactions which are not executed at arm's length price and recording proper justification for using such alternate pricing mechanism. We are only required and have ensured compliance of this requirement to the extent of the approval of the related party transactions by the Board of Directors upon recommendation of the audit Committee. We have not carried out any procedures to determine' whether the related party transactions were undertaken at arm's length price or not.
Based on our review, nothing has come to our attention which causes us to believe that the Statement of Compliance does not appropriately reflect the Company's compliance, in all material respects, with the best practices contained in the Code of Corporate Governance, as applicable to the Company for the year ended June 30, 2015.
Lahore: Aslam Malik & Co.March 22, 2016 Chartered Accountants
Audit Engagement Partner: Mohammad Aslam Malik

Y O U S A F W E A V I N G M I L L S L I M I T E D Annual Report 2 0 1 5
9
AUDITORS’ REPORT TO THE MEMBERS
We have audited the annexed balance sheet of YOUSAF WEAVING MILLS LIMITED as at June 30, 2015 and the related profit and loss account, statement of comprehensive income, cash flow statement and statement of changes in equity together with the notes forming part thereof, for the year then ended and we state that we have obtained all the information and explanations which, to the best of our knowledge and belief, were necessary for the purposes of our audit.
It is the responsibility of the company's management to establish and maintain a system of internal control, and prepare and present the above said statements in conformity with the approved accounting standards and the requirements of the CompaniesOrdinance, 1984. Our responsibility is to express an opinion on these statements based on our audit.
We conducted our audit in accordance with the auditing standards as applicable in Pakistan. These standards require that we plan and perform the audit to obtain reasonable assurance about whether the above said statements are free of any material misstatement. An audit includes examining, on a test basis, evidence supporting the amounts and disclosures in the above said statements. An audit also includes assessing the accounting policies and significant estimates made by management, as well as, evaluating the overall presentation of the above said statements. We believe that our audit provides a reasonable basis for our opinion and, after due verification, we report that:
(a) The company's interest free loan from directors is carried in the statement of financial position at Rs. 480.733 million. Management has not stated the loan at amortized cost, which constitutes a departure from International Financial Reporting Standards. The company's records indicate that had management stated the adoption of new, revised International Financial Reporting Standards and interpretations. Its impact is not quantifiable as payment terms are not determinable.
(b) In our opinion, proper book of accounts have been kept by the company as required by the Companies Ordinance, 1984.
(c) In our opinion
(i) Except for the effect of the matter referred to in paragraph (a) above, the balance sheet and profit and loss account together with the notes thereon have been drawn up in conformity with the Companies Ordinance, 1984, and are in agreement with the books of account and are further in accordance with accounting policies consistently applied.
(ii) The expenditure incurred during the year was for the purpose of the company's business; and
(iii) The business conducted, investments made and the expenditure incurred during the year were in accordance with the objects of the company;
(d) In our opinion, except for the effects of the matter described in the Basis for Qualified Opinion paragraph (a) above, and to the best of our information and according to the explanations given to us, the balance sheet, profit and loss account, statement of comprehensive income, cash flow statement and statement of changes in equity together with the notes forming part thereof conform with approved accounting standards as applicable in Pakistan, and, give the information required by the Companies Ordinance, 1984, in the manner so required and respectively give a true and fair view of the state of the company's affairs as at June 30, 2015 and of the Loss, its cash flows and changes in equity for the year then ended, and
(e) In our opinion Zakat deductible at source under the Zakat and Ushr Ordinance, 1980 (XVIII of 1980), was deducted by the Company and deposited in the Central Zakat Fund established under Section 7 of that Ordinance.
Without qualifying our opinion we draw attention to Note 1.3 in the financial statements which indicates that the company incurred net loss of Rs.347.54 million for the year (2014: Net Profit Rs. 10.31 million), its equity is negative by Rs. 202.19 million (2014: positive by Rs. 146.46 million), its accumulated loss amounted to Rs. 602.19 million (2014: Rs. 253.54 million) and its current liabilities exceed its current assets by Rs. 294.46 million (2014: Rs. 26.08 million). These conditions along with other matters as set forth in Note 1.3 indicate the existence of a material uncertainty that may cause significant doubt about the Company's ability to continue as a going concern.
Lahore: Aslam Malik & Co.March 22, 2016 Chartered Accountants
Audit Engagement Partner: Mohammad Aslam Malik
Lahore:
March 22, 2016
(Khawaja Mohammad Nadeem)
Chief Executive
Y O U S A F W E A V I N G M I L L S L I M I T E D Annual Report 2 0 1 5
10
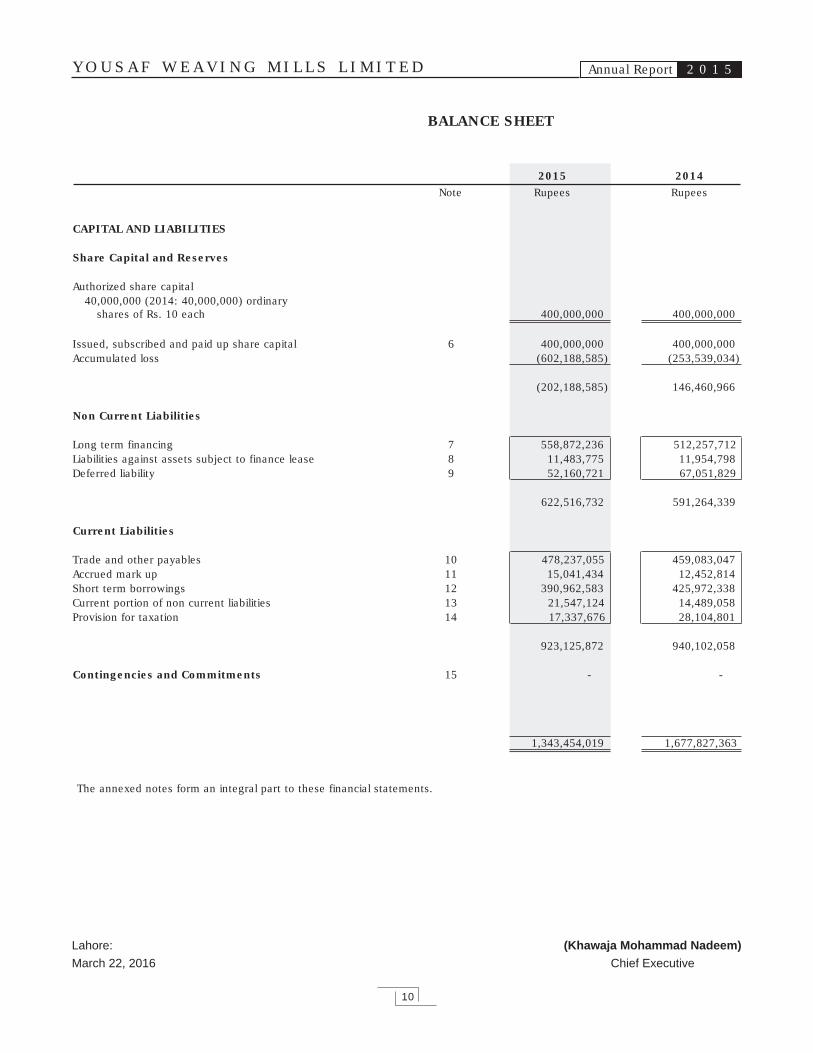
BALANCE SHEET
2015 2014Rupees RupeesNote
CAPITAL AND LIABILITIES
Share Capital and Reserves
Authorized share capital40,000,000 (2014: 40,000,000) ordinary
shares of Rs. 10 each
Issued, subscribed and paid up share capitalAccumulated loss
Non Current Liabilities
Long term financingLiabilities against assets subject to finance leaseDeferred liability
Current Liabilities
Trade and other payablesAccrued mark upShort term borrowingsCurrent portion of non current liabilitiesProvision for taxation
Contingencies and Commitments
The annexed notes form an integral part to these financial statements.
400,000,000 400,000,000
6 400,000,000 400,000,000(602,188,585) (253,539,034)
(202,188,585) 146,460,966
7 558,872,236 512,257,7128 11,483,775 11,954,7989 52,160,721 67,051,829
622,516,732 591,264,339
10 478,237,055 459,083,04711 15,041,434 12,452,81412 390,962,583 425,972,33813 21,547,124 14,489,05814 17,337,676 28,104,801
923,125,872 940,102,058
15 - -
1,343,454,019 1,677,827,363

(Mohammad Naveed)
Director
Y O U S A F W E A V I N G M I L L S L I M I T E D Annual Report 2 0 1 5
11
AS AT JUNE 30, 2015
2015 2014Note Rupees Rupees
ASSETS
Non Current Assets
Property, plant and equipmentIntangible assetsLong term LoansLong term deposits
Current Assets
Stores and sparesStock in tradeTrade debtsLoans and advancesTrade deposits, short term prepayments
and other receivablesSales tax refundableAssets held for disposalCash and bank balances
16 692,696,235 737,441,26517 710,160 887,70018 13,813,565 17,825,70219 7,566,618 7,651,703
714,786,578 763,806,370
20 41,201,916 61,830,93921 228,371,720 390,369,69622 30,281,900 112,938,42023 45,656,300 94,323,308
24 24,369,701 25,078,96718,074,983 29,853,451
25 220,197,542 198,382,44726 20,513,379 1,243,765
628,667,441 914,020,993
1,343,454,019 1,677,827,363
Y O U S A F W E A V I N G M I L L S L I M I T E D Annual Report 2 0 1 5
12
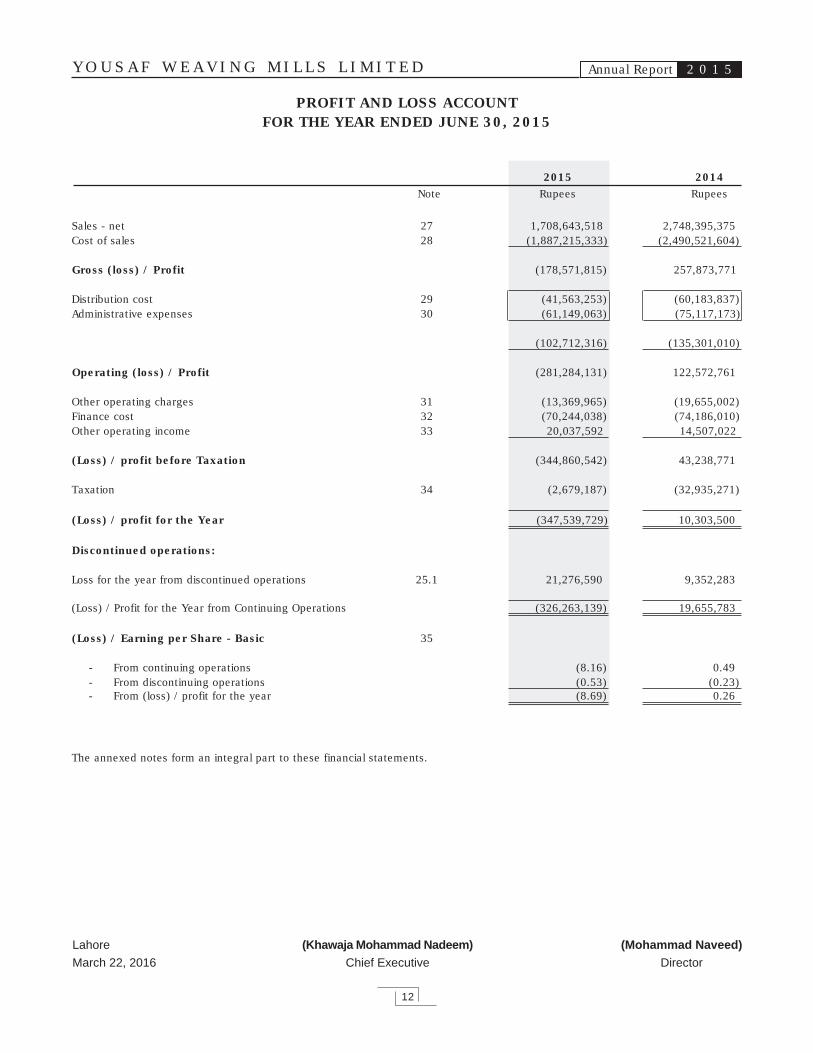
PROFIT AND LOSS ACCOUNTFOR THE YEAR ENDED JUNE 30, 2015
2015 2014Note Rupees Rupees
Lahore
March 22, 2016
(Khawaja Mohammad Nadeem)
Chief Executive
(Mohammad Naveed)
Director
Sales - netCost of sales
Gross (loss) / Profit
Distribution costAdministrative expenses
Operating (loss) / Profit
Other operating chargesFinance costOther operating income
(Loss) / profit before Taxation
Taxation
(Loss) / profit for the Year
Discontinued operations:
Loss for the year from discontinued operations
(Loss) / Profit for the Year from Continuing Operations
(Loss) / Earning per Share - Basic
- From continuing operations- From discontinuing operations- From (loss) / profit for the year
The annexed notes form an integral part to these financial statements.
2728
2930
313233
34
25.1
35
1,708,643,518(1,887,215,333)
(178,571,815)
(41,563,253)(61,149,063)
(102,712,316)
(281,284,131)
(13,369,965)(70,244,038)20,037,592
(344,860,542)
(2,679,187)
(347,539,729)
21,276,590
(326,263,139)
(8.16)(0.53)(8.69)
2,748,395,375(2,490,521,604)
257,873,771
(60,183,837)(75,117,173)
(135,301,010)
122,572,761
(19,655,002)(74,186,010)14,507,022
43,238,771
(32,935,271)
10,303,500
9,352,283
19,655,783
0.49(0.23)0.26
Y O U S A F W E A V I N G M I L L S L I M I T E D Annual Report 2 0 1 5
13
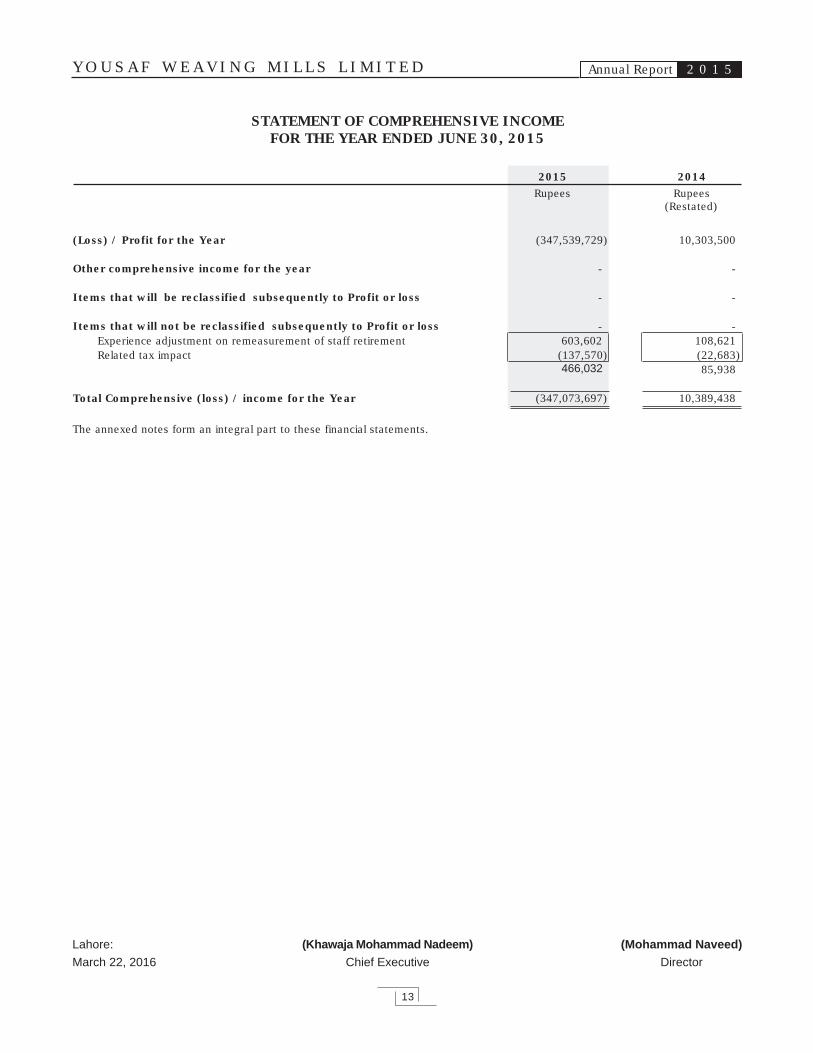
STATEMENT OF COMPREHENSIVE INCOMEFOR THE YEAR ENDED JUNE 30, 2015
2015 2014Rupees Rupees
Lahore:
March 22, 2016
(Khawaja Mohammad Nadeem)
Chief Executive
(Mohammad Naveed)
Director
(Restated)
(Loss) / Profit for the Year (347,539,729) 10,303,500
Other comprehensive income for the year - -
Items that will be reclassified subsequently to Profit or loss - -
Items that will not be reclassified subsequently to Profit or loss - -Experience adjustment on remeasurement of staff retirement 603,602 108,621Related tax impact (137,570) (22,683)
466,032 85,938
Total Comprehensive (loss) / income for the Year (347,073,697) 10,389,438
The annexed notes form an integral part to these financial statements.

Y O U S A F W E A V I N G M I L L S L I M I T E D Annual Report 2 0 1 5
14
CASH FLOW STATEMENTFOR THE YEAR ENDED JUNE 30, 2015
2015 2014Rupees RupeesNote
Lahore:
March 22, 2016
(Khawaja Mohammad Nadeem)
Chief Executive
(Mohammad Naveed)
Director
CASH GENERATED FROM OPERATIONS 36 90,848,194 75,585,024
Finance cost paid (67,655,418) (71,148,755)Gratuity paid (11,515,545) (7,968,530)Income tax paid (9,147,539) (15,545,202)
Net cash from / (used in) operating activities 2,529,692 (19,077,463)
CASH FLOWS FROM INVESTING ACTIVITIES
Property, plant and equipment purchased (9,450,790) (10,344,418)Purchase of assets held for sale - (2,012,340)Capital work in progress - (1,201,634)Proceeds from disposal of property, plant and equipment 2,788,262 6,587,901Proceeds from disposal of assets held for sale - 437,550Proceeds from sale of biological assets 1,050,639 5,989,000Proceeds from sale of stores and raw material 2,895,278 8,725,591Long term loans to employees 4,752,024 (1,875,062)Long term deposits (156,915) 1,686,750
Net Cash generated from Investing Activities 1,878,498 7,993,338
CASH FLOWS FROM FINANCING ACTIVITIES
Long term financing - net (12,100,000) (42,100,000)Liabilities against assets subject to finance lease (1,487,213) (2,603,784)Short term borrowings 29,885,246 23,546,808Dividend paid (1,436,609) -
Net Cash used in Financing Activities 14,861,424 (21,156,976)
Net increase / (decrease) in Cash and Cash Equivalents 19,269,614 (32,241,101)
Cash and cash equivalents at the beginning of the year 1,243,765 33,484,866
Cash and Cash Equivalents at the End of the Year 20,513,379 1,243,765
The annexed notes form an integral part to these financial statements.
Y O U S A F W E A V I N G M I L L S L I M I T E D Annual Report 2 0 1 5
15
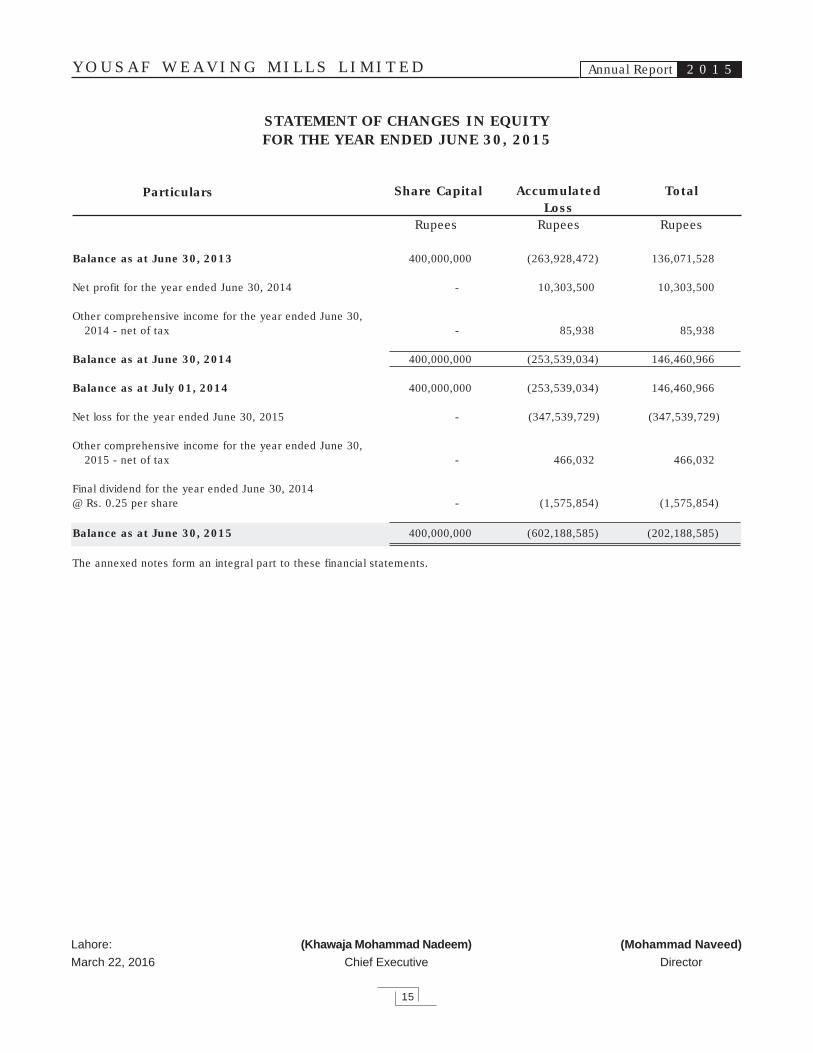
STATEMENT OF CHANGES IN EQUITYFOR THE YEAR ENDED JUNE 30, 2015
Accumulated TotalShare CapitalLoss
Rupees Rupees Rupees
Particulars
Lahore:
March 22, 2016
(Khawaja Mohammad Nadeem)
Chief Executive
(Mohammad Naveed)
Director
Balance as at June 30, 2013 400,000,000 (263,928,472) 136,071,528
Net profit for the year ended June 30, 2014 - 10,303,500 10,303,500
Other comprehensive income for the year ended June 30,2014 - net of tax - 85,938 85,938
Balance as at June 30, 2014 400,000,000 (253,539,034) 146,460,966
Balance as at July 01, 2014 400,000,000 (253,539,034) 146,460,966
Net loss for the year ended June 30, 2015 - (347,539,729) (347,539,729)
Other comprehensive income for the year ended June 30,2015 - net of tax - 466,032 466,032
Final dividend for the year ended June 30, 2014@ Rs. 0.25 per share - (1,575,854) (1,575,854)
Balance as at June 30, 2015 400,000,000 (602,188,585) (202,188,585)
The annexed notes form an integral part to these financial statements.
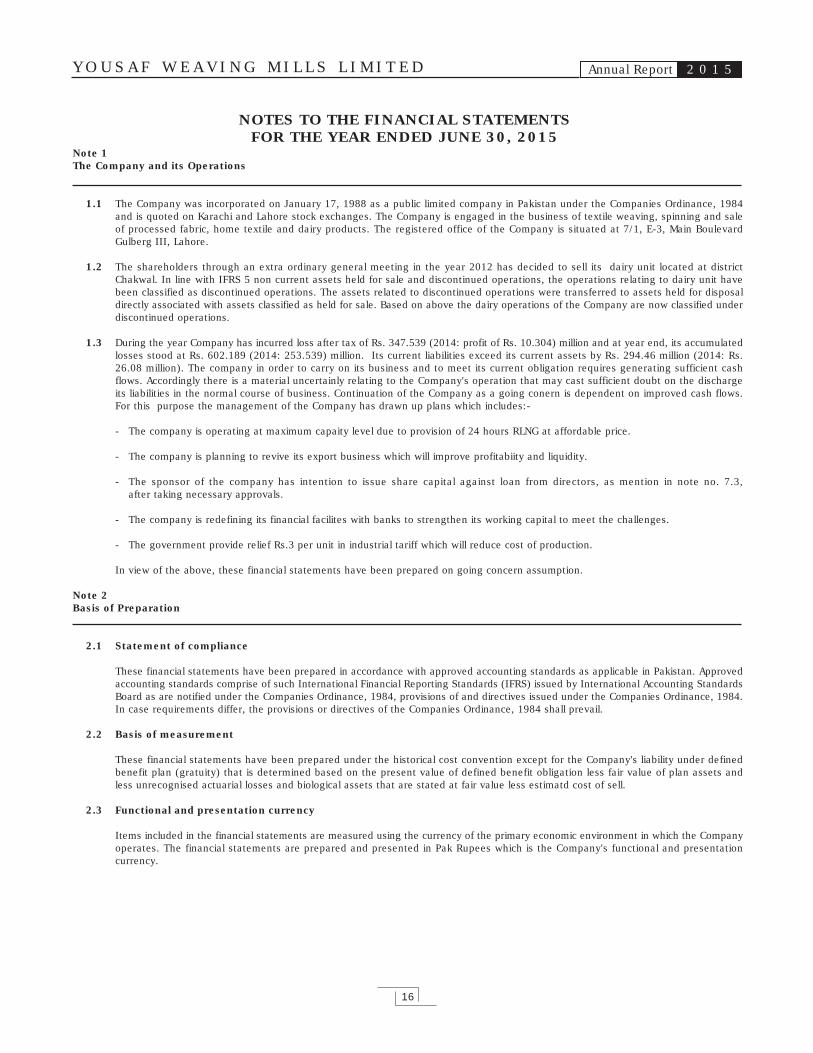
Note 1The Company and its Operations
1.1 The Company was incorporated on January 17, 1988 as a public limited company in Pakistan under the Companies Ordinance, 1984 and is quoted on Karachi and Lahore stock exchanges. The Company is engaged in the business of textile weaving, spinning and sale of processed fabric, home textile and dairy products. The registered office of the Company is situated at 7/1, E-3, Main Boulevard Gulberg III, Lahore.
1.2 The shareholders through an extra ordinary general meeting in the year 2012 has decided to sell its dairy unit located at district Chakwal. In line with IFRS 5 non current assets held for sale and discontinued operations, the operations relating to dairy unit have been classified as discontinued operations. The assets related to discontinued operations were transferred to assets held for disposal directly associated with assets classified as held for sale. Based on above the dairy operations of the Company are now classified under discontinued operations.
1.3 During the year Company has incurred loss after tax of Rs. 347.539 (2014: profit of Rs. 10.304) million and at year end, its accumulated losses stood at Rs. 602.189 (2014: 253.539) million. Its current liabilities exceed its current assets by Rs. 294.46 million (2014: Rs. 26.08 million). The company in order to carry on its business and to meet its current obligation requires generating sufficient cash flows. Accordingly there is a material uncertainly relating to the Company's operation that may cast sufficient doubt on the discharge its liabilities in the normal course of business. Continuation of the Company as a going conern is dependent on improved cash flows. For this purpose the management of the Company has drawn up plans which includes:-
- The company is operating at maximum capaity level due to provision of 24 hours RLNG at affordable price.
- The company is planning to revive its export business which will improve profitabiity and liquidity.
- The sponsor of the company has intention to issue share capital against loan from directors, as mention in note no. 7.3, after taking necessary approvals.
- The company is redefining its financial facilites with banks to strengthen its working capital to meet the challenges.
- The government provide relief Rs.3 per unit in industrial tariff which will reduce cost of production.
In view of the above, these financial statements have been prepared on going concern assumption.
Note 2Basis of Preparation
2.1 Statement of compliance
These financial statements have been prepared in accordance with approved accounting standards as applicable in Pakistan. Approved accounting standards comprise of such International Financial Reporting Standards (IFRS) issued by International Accounting Standards Board as are notified under the Companies Ordinance, 1984, provisions of and directives issued under the Companies Ordinance, 1984. In case requirements differ, the provisions or directives of the Companies Ordinance, 1984 shall prevail.
2.2 Basis of measurement
These financial statements have been prepared under the historical cost convention except for the Company's liability under defined benefit plan (gratuity) that is determined based on the present value of defined benefit obligation less fair value of plan assets and less unrecognised actuarial losses and biological assets that are stated at fair value less estimatd cost of sell.
2.3 Functional and presentation currency
Items included in the financial statements are measured using the currency of the primary economic environment in which the Company operates. The financial statements are prepared and presented in Pak Rupees which is the Company's functional and presentation currency.
NOTES TO THE FINANCIAL STATEMENTSFOR THE YEAR ENDED JUNE 30, 2015
Y O U S A F W E A V I N G M I L L S L I M I T E D Annual Report 2 0 1 5
16
Y O U S A F W E A V I N G M I L L S L I M I T E D Annual Report 2 0 1 5
17
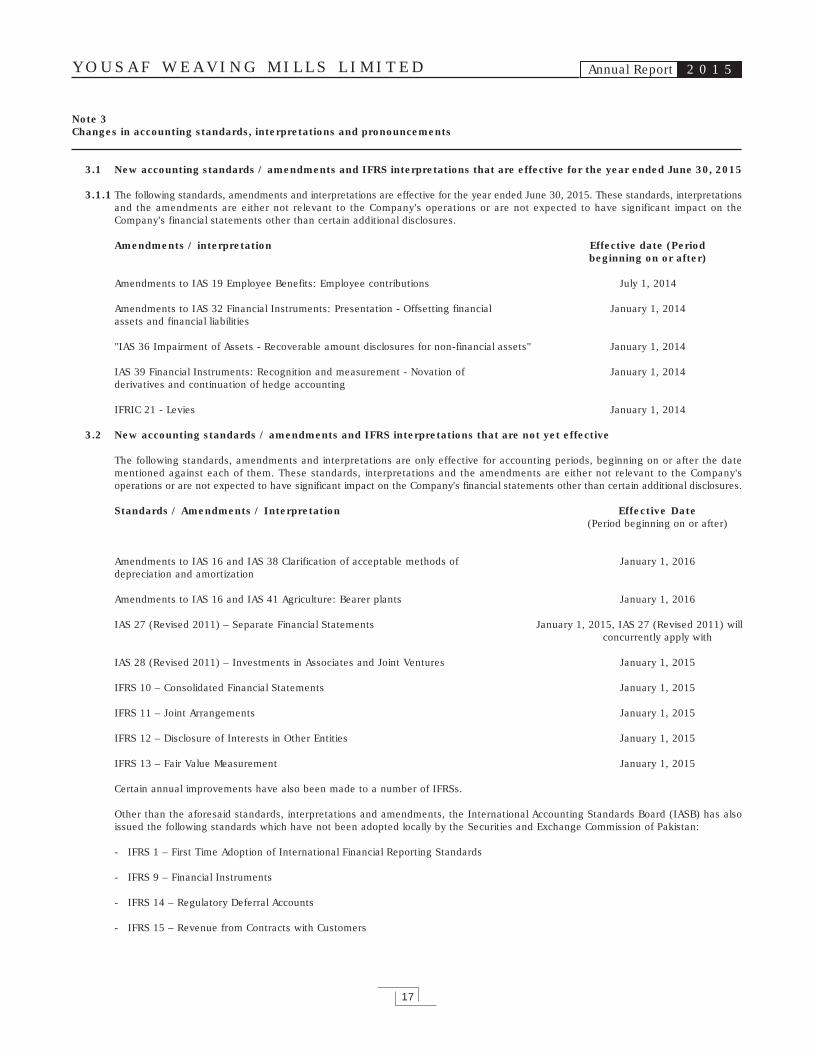
Note 3Changes in accounting standards, interpretations and pronouncements
3.1 New accounting standards / amendments and IFRS interpretations that are effective for the year ended June 30, 2015
3.1.1The following standards, amendments and interpretations are effective for the year ended June 30, 2015. These standards, interpretations and the amendments are either not relevant to the Company's operations or are not expected to have significant impact on the Company's financial statements other than certain additional disclosures.
Amendments / interpretation Effective date (Periodbeginning on or after)
Amendments to IAS 19 Employee Benefits: Employee contributions July 1, 2014
Amendments to IAS 32 Financial Instruments: Presentation - Offsetting financial January 1, 2014assets and financial liabilities
"IAS 36 Impairment of Assets - Recoverable amount disclosures for non-financial assets" January 1, 2014
IAS 39 Financial Instruments: Recognition and measurement - Novation of January 1, 2014derivatives and continuation of hedge accounting
IFRIC 21 - Levies January 1, 2014
3.2 New accounting standards / amendments and IFRS interpretations that are not yet effective
The following standards, amendments and interpretations are only effective for accounting periods, beginning on or after the date mentioned against each of them. These standards, interpretations and the amendments are either not relevant to the Company's operations or are not expected to have significant impact on the Company's financial statements other than certain additional disclosures.
Standards / Amendments / Interpretation Effective Date (Period beginning on or after)
Amendments to IAS 16 and IAS 38 Clarification of acceptable methods of January 1, 2016depreciation and amortization
Amendments to IAS 16 and IAS 41 Agriculture: Bearer plants January 1, 2016
IAS 27 (Revised 2011) – Separate Financial Statements January 1, 2015, IAS 27 (Revised 2011) willconcurrently apply with
IAS 28 (Revised 2011) – Investments in Associates and Joint Ventures January 1, 2015
IFRS 10 – Consolidated Financial Statements January 1, 2015
IFRS 11 – Joint Arrangements January 1, 2015
IFRS 12 – Disclosure of Interests in Other Entities January 1, 2015
IFRS 13 – Fair Value Measurement January 1, 2015
Certain annual improvements have also been made to a number of IFRSs.
Other than the aforesaid standards, interpretations and amendments, the International Accounting Standards Board (IASB) has also issued the following standards which have not been adopted locally by the Securities and Exchange Commission of Pakistan:
- IFRS 1 – First Time Adoption of International Financial Reporting Standards
- IFRS 9 – Financial Instruments
- IFRS 14 – Regulatory Deferral Accounts
- IFRS 15 – Revenue from Contracts with Customers
Y O U S A F W E A V I N G M I L L S L I M I T E D Annual Report 2 0 1 5
18
Note 4Significant Accounting Policies
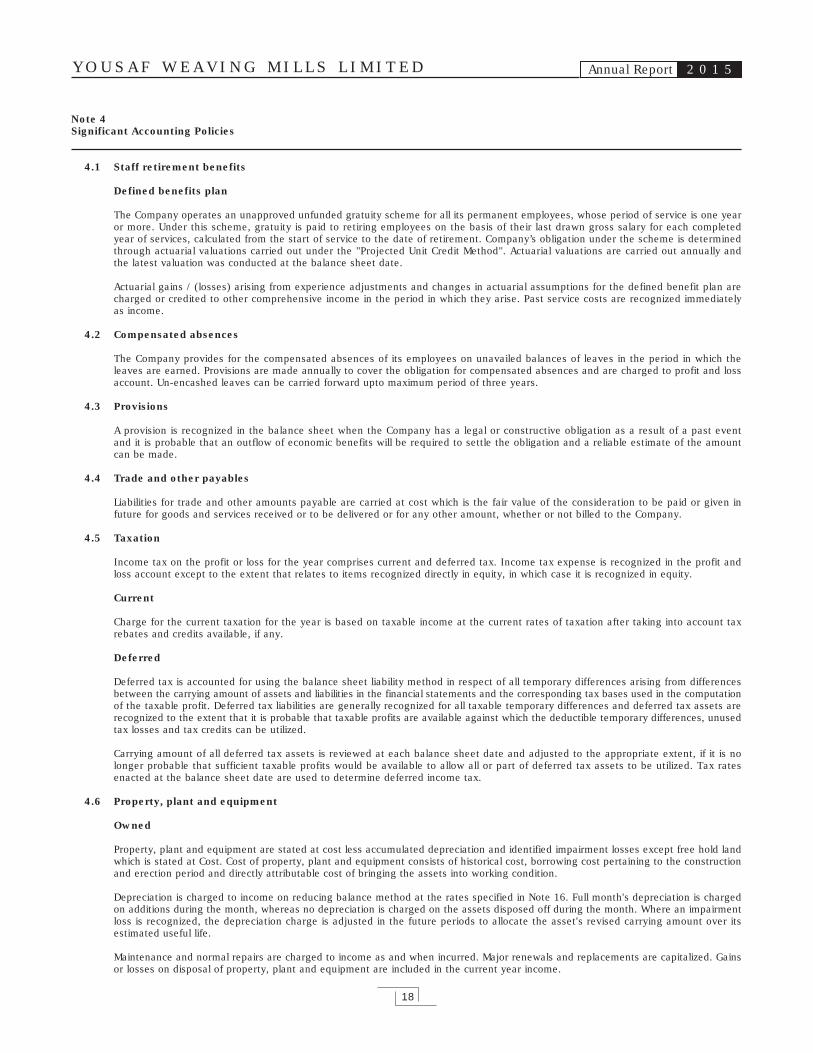
4.1 Staff retirement benefits
Defined benefits plan
The Company operates an unapproved unfunded gratuity scheme for all its permanent employees, whose period of service is one year or more. Under this scheme, gratuity is paid to retiring employees on the basis of their last drawn gross salary for each completed year of services, calculated from the start of service to the date of retirement. Company’s obligation under the scheme is determined through actuarial valuations carried out under the "Projected Unit Credit Method". Actuarial valuations are carried out annually and the latest valuation was conducted at the balance sheet date.
Actuarial gains / (losses) arising from experience adjustments and changes in actuarial assumptions for the defined benefit plan are charged or credited to other comprehensive income in the period in which they arise. Past service costs are recognized immediately as income.
4.2 Compensated absences
The Company provides for the compensated absences of its employees on unavailed balances of leaves in the period in which the leaves are earned. Provisions are made annually to cover the obligation for compensated absences and are charged to profit and loss account. Un-encashed leaves can be carried forward upto maximum period of three years.
4.3 Provisions
A provision is recognized in the balance sheet when the Company has a legal or constructive obligation as a result of a past event and it is probable that an outflow of economic benefits will be required to settle the obligation and a reliable estimate of the amount can be made.
4.4 Trade and other payables
Liabilities for trade and other amounts payable are carried at cost which is the fair value of the consideration to be paid or given in future for goods and services received or to be delivered or for any other amount, whether or not billed to the Company.
4.5 Taxation
Income tax on the profit or loss for the year comprises current and deferred tax. Income tax expense is recognized in the profit and loss account except to the extent that relates to items recognized directly in equity, in which case it is recognized in equity.
Current
Charge for the current taxation for the year is based on taxable income at the current rates of taxation after taking into account tax rebates and credits available, if any.
Deferred
Deferred tax is accounted for using the balance sheet liability method in respect of all temporary differences arising from differences between the carrying amount of assets and liabilities in the financial statements and the corresponding tax bases used in the computation of the taxable profit. Deferred tax liabilities are generally recognized for all taxable temporary differences and deferred tax assets are recognized to the extent that it is probable that taxable profits are available against which the deductible temporary differences, unused tax losses and tax credits can be utilized.
Carrying amount of all deferred tax assets is reviewed at each balance sheet date and adjusted to the appropriate extent, if it is no longer probable that sufficient taxable profits would be available to allow all or part of deferred tax assets to be utilized. Tax rates enacted at the balance sheet date are used to determine deferred income tax.
4.6 Property, plant and equipment
Owned
Property, plant and equipment are stated at cost less accumulated depreciation and identified impairment losses except free hold land which is stated at Cost. Cost of property, plant and equipment consists of historical cost, borrowing cost pertaining to the construction and erection period and directly attributable cost of bringing the assets into working condition.
Depreciation is charged to income on reducing balance method at the rates specified in Note 16. Full month's depreciation is charged on additions during the month, whereas no depreciation is charged on the assets disposed off during the month. Where an impairment loss is recognized, the depreciation charge is adjusted in the future periods to allocate the asset's revised carrying amount over its estimated useful life.
Maintenance and normal repairs are charged to income as and when incurred. Major renewals and replacements are capitalized. Gains or losses on disposal of property, plant and equipment are included in the current year income.
Y O U S A F W E A V I N G M I L L S L I M I T E D Annual Report 2 0 1 5
19
Note 4 - Significant Accounting Policies … Contd.
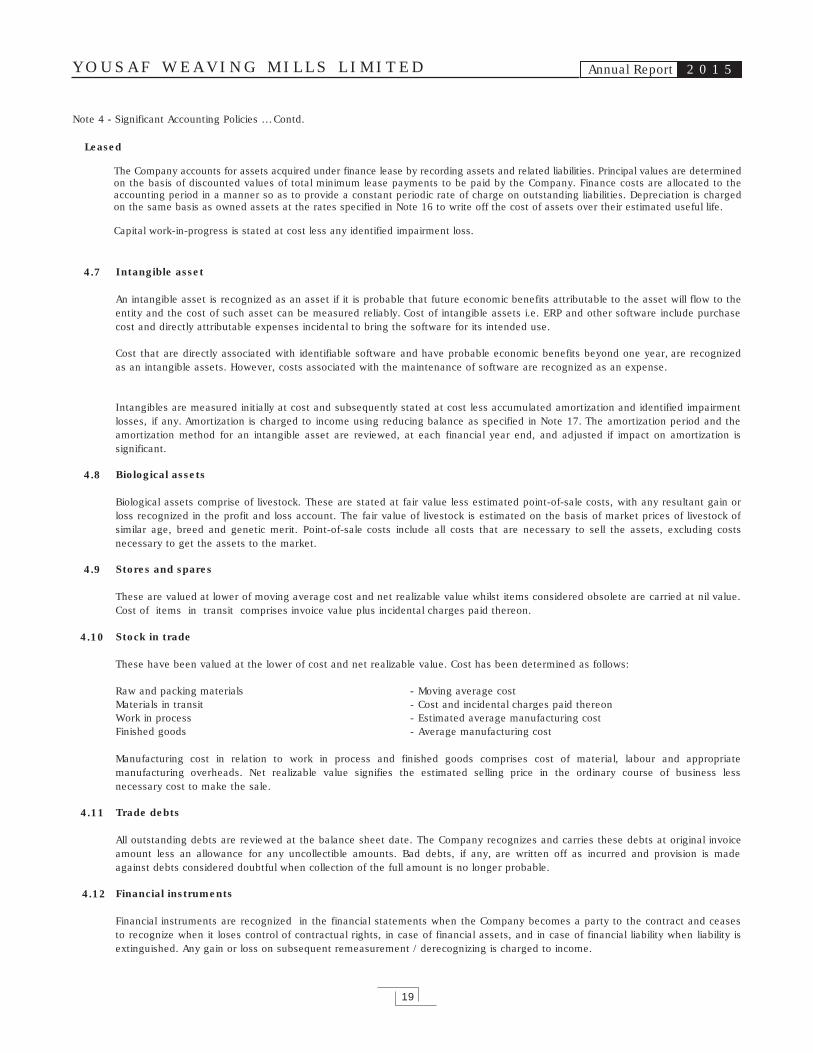
4.7 Intangible asset
4.8 Biological assets
4.9 Stores and spares
4.10 Stock in trade
Raw and packing materials - Moving average costMaterials in transit - Cost and incidental charges paid thereonWork in process - Estimated average manufacturing costFinished goods - Average manufacturing cost
4.11 Trade debts
4.12 Financial instruments
An intangible asset is recognized as an asset if it is probable that future economic benefits attributable to the asset will flow to theentity and the cost of such asset can be measured reliably. Cost of intangible assets i.e. ERP and other software include purchasecost and directly attributable expenses incidental to bring the software for its intended use.
All outstanding debts are reviewed at the balance sheet date. The Company recognizes and carries these debts at original invoiceamount less an allowance for any uncollectible amounts. Bad debts, if any, are written off as incurred and provision is madeagainst debts considered doubtful when collection of the full amount is no longer probable.
These have been valued at the lower of cost and net realizable value. Cost has been determined as follows:
Manufacturing cost in relation to work in process and finished goods comprises cost of material, labour and appropriatemanufacturing overheads. Net realizable value signifies the estimated selling price in the ordinary course of business lessnecessary cost to make the sale.
Cost that are directly associated with identifiable software and have probable economic benefits beyond one year, are recognizedas an intangible assets. However, costs associated with the maintenance of software are recognized as an expense.
Intangibles are measured initially at cost and subsequently stated at cost less accumulated amortization and identified impairmentlosses, if any. Amortization is charged to income using reducing balance as specified in Note 17. The amortization period and theamortization method for an intangible asset are reviewed, at each financial year end, and adjusted if impact on amortization issignificant.
Biological assets comprise of livestock. These are stated at fair value less estimated point-of-sale costs, with any resultant gain orloss recognized in the profit and loss account. The fair value of livestock is estimated on the basis of market prices of livestock ofsimilar age, breed and genetic merit. Point-of-sale costs include all costs that are necessary to sell the assets, excluding costsnecessary to get the assets to the market.
These are valued at lower of moving average cost and net realizable value whilst items considered obsolete are carried at nil value.Cost of items in transit comprises invoice value plus incidental charges paid thereon.
Financial instruments are recognized in the financial statements when the Company becomes a party to the contract and ceasesto recognize when it loses control of contractual rights, in case of financial assets, and in case of financial liability when liability isextinguished. Any gain or loss on subsequent remeasurement / derecognizing is charged to income.
Leased
The Company accounts for assets acquired under finance lease by recording assets and related liabilities. Principal values are determined on the basis of discounted values of total minimum lease payments to be paid by the Company. Finance costs are allocated to the accounting period in a manner so as to provide a constant periodic rate of charge on outstanding liabilities. Depreciation is charged on the same basis as owned assets at the rates specified in Note 16 to write off the cost of assets over their estimated useful life.
Capital work-in-progress is stated at cost less any identified impairment loss.
Y O U S A F W E A V I N G M I L L S L I M I T E D Annual Report 2 0 1 5
20
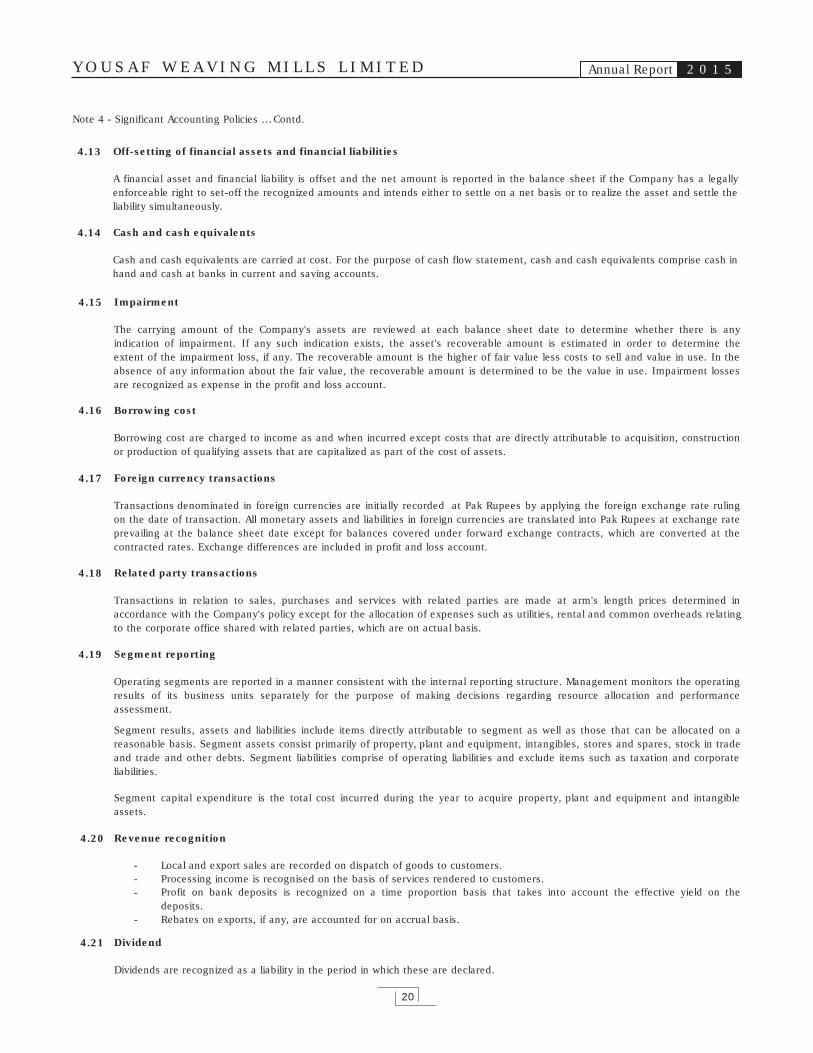
4.13 Off-setting of financial assets and financial liabilities
4.14 Cash and cash equivalents
A financial asset and financial liability is offset and the net amount is reported in the balance sheet if the Company has a legallyenforceable right to set-off the recognized amounts and intends either to settle on a net basis or to realize the asset and settle theliability simultaneously.
Cash and cash equivalents are carried at cost. For the purpose of cash flow statement, cash and cash equivalents comprise cash inhand and cash at banks in current and saving accounts.
Note 4 - Significant Accounting Policies … Contd.
4.15 Impairment
4.16 Borrowing cost
4.17 Foreign currency transactions
4.18 Related party transactions
4.19 Segment reporting
4.20 Revenue recognition
- Local and export sales are recorded on dispatch of goods to customers.- Processing income is recognised on the basis of services rendered to customers.-
- Rebates on exports, if any, are accounted for on accrual basis.
4.21 Dividend
Transactions denominated in foreign currencies are initially recorded at Pak Rupees by applying the foreign exchange rate rulingon the date of transaction. All monetary assets and liabilities in foreign currencies are translated into Pak Rupees at exchange rateprevailing at the balance sheet date except for balances covered under forward exchange contracts, which are converted at thecontracted rates. Exchange differences are included in profit and loss account.
Transactions in relation to sales, purchases and services with related parties are made at arm's length prices determined inaccordance with the Company's policy except for the allocation of expenses such as utilities, rental and common overheads relatingto the corporate office shared with related parties, which are on actual basis.
Operating segments are reported in a manner consistent with the internal reporting structure. Management monitors the operatingresults of its business units separately for the purpose of making decisions regarding resource allocation and performanceassessment.
Dividends are recognized as a liability in the period in which these are declared.
Segment results, assets and liabilities include items directly attributable to segment as well as those that can be allocated on areasonable basis. Segment assets consist primarily of property, plant and equipment, intangibles, stores and spares, stock in tradeand trade and other debts. Segment liabilities comprise of operating liabilities and exclude items such as taxation and corporateliabilities.
Segment capital expenditure is the total cost incurred during the year to acquire property, plant and equipment and intangibleassets.
Profit on bank deposits is recognized on a time proportion basis that takes into account the effective yield on thedeposits.
The carrying amount of the Company's assets are reviewed at each balance sheet date to determine whether there is anyindication of impairment. If any such indication exists, the asset's recoverable amount is estimated in order to determine theextent of the impairment loss, if any. The recoverable amount is the higher of fair value less costs to sell and value in use. In theabsence of any information about the fair value, the recoverable amount is determined to be the value in use. Impairment lossesare recognized as expense in the profit and loss account.
Borrowing cost are charged to income as and when incurred except costs that are directly attributable to acquisition, constructionor production of qualifying assets that are capitalized as part of the cost of assets.
Y O U S A F W E A V I N G M I L L S L I M I T E D Annual Report 2 0 1 5
21
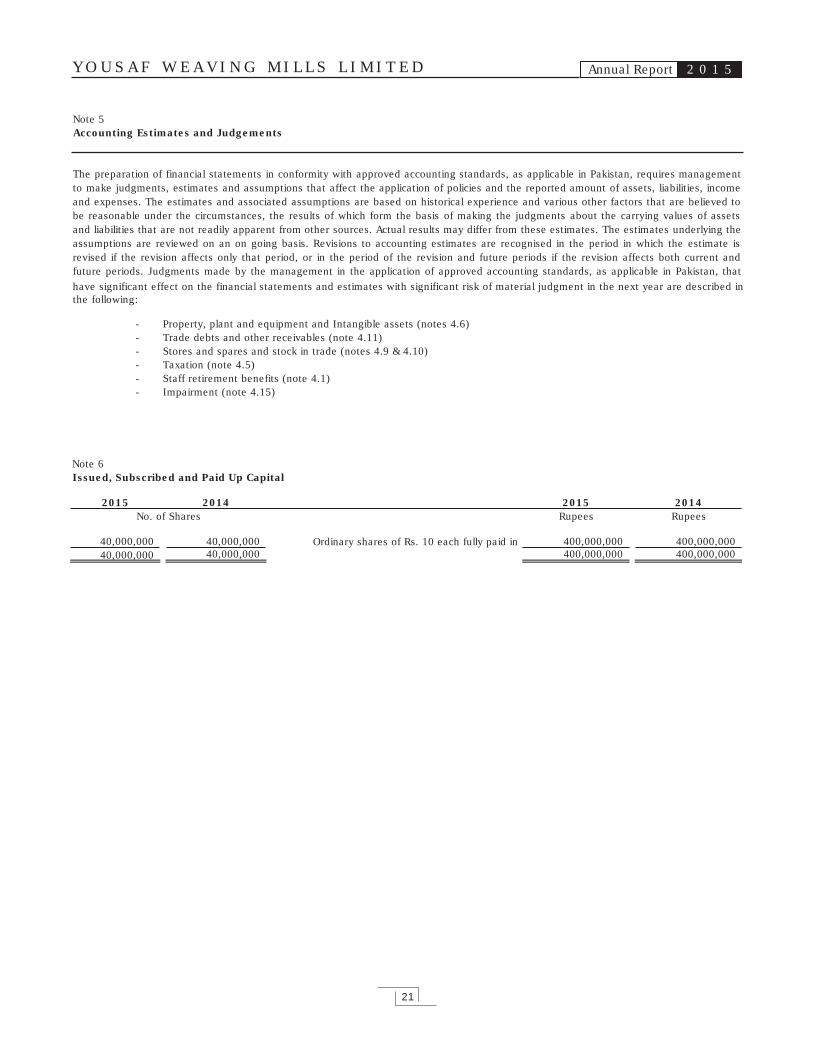
Note 5Accounting Estimates and Judgements
------
The preparation of financial statements in conformity with approved accounting standards, as applicable in Pakistan, requires managementto make judgments, estimates and assumptions that affect the application of policies and the reported amount of assets, liabilities, incomeand expenses. The estimates and associated assumptions are based on historical experience and various other factors that are believed tobe reasonable under the circumstances, the results of which form the basis of making the judgments about the carrying values of assetsand liabilities that are not readily apparent from other sources. Actual results may differ from these estimates. The estimates underlying theassumptions are reviewed on an on going basis. Revisions to accounting estimates are recognised in the period in which the estimate isrevised if the revision affects only that period, or in the period of the revision and future periods if the revision affects both current andfuture periods. Judgments made by the management in the application of approved accounting standards, as applicable in Pakistan, thathave significant effect on the financial statements and estimates with significant risk of material judgment in the next year are described inthe following:
Property, plant and equipment and Intangible assets (notes 4.6)Trade debts and other receivables (note 4.11)Stores and spares and stock in trade (notes 4.9 & 4.10)Taxation (note 4.5)Staff retirement benefits (note 4.1)Impairment (note 4.15)
Note 6Issued, Subscribed and Paid Up Capital
2014 2015 2014Rupees Rupees
40,000,000 400,000,000 400,000,00040,000,000 400,000,000 400,000,000
2015No. of Shares
40,000,000 Ordinary shares of Rs. 10 each fully paid in40,000,000
Y O U S A F W E A V I N G M I L L S L I M I T E D Annual Report 2 0 1 5
22
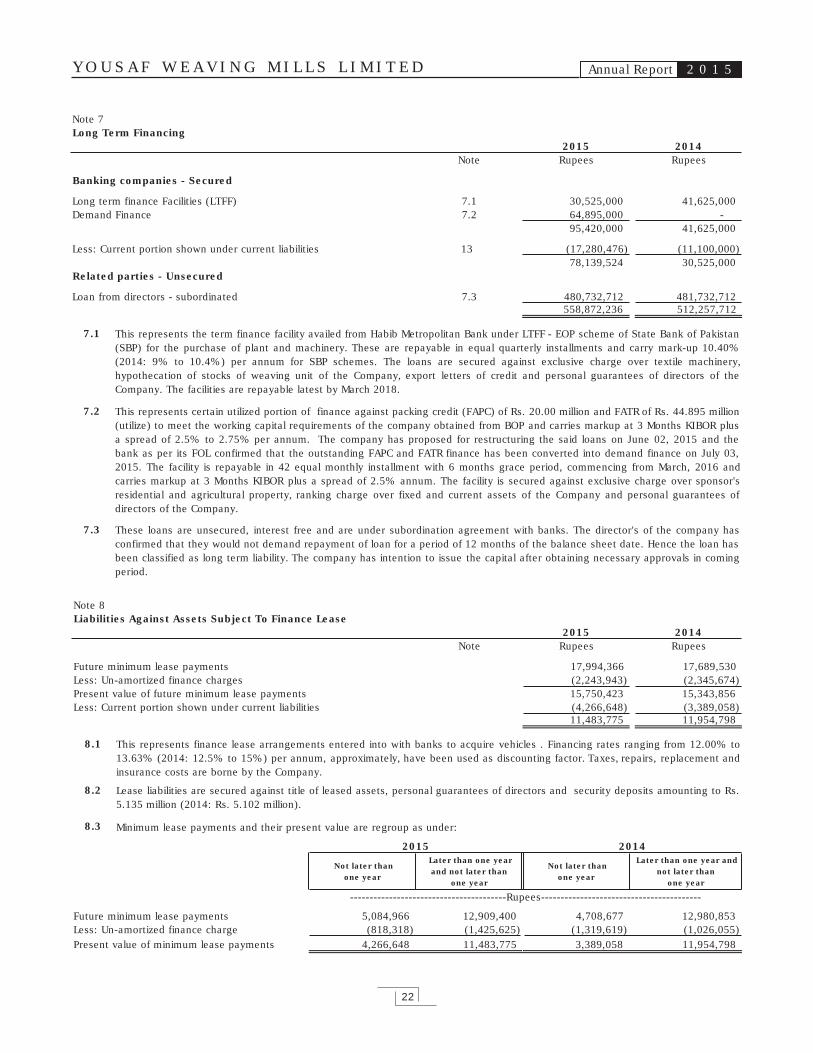
Note 7Long Term Financing
2015 2014Note Rupees Rupees
Banking companies - Secured
Long term finance Facilities (LTFF) 7.1 30,525,000 41,625,000Demand Finance 7.2 64,895,000 -
95,420,000 41,625,000
Less: Current portion shown under current liabilities 13 (17,280,476) (11,100,000)78,139,524 30,525,000
Related parties - Unsecured
Loan from directors - subordinated 7.3 480,732,712 481,732,712558,872,236 512,257,712
7.1
7.2
7.3
This represents certain utilized portion of finance against packing credit (FAPC) of Rs. 20.00 million and FATR of Rs. 44.895 million(utilize) to meet the working capital requirements of the company obtained from BOP and carries markup at 3 Months KIBOR plusa spread of 2.5% to 2.75% per annum. The company has proposed for restructuring the said loans on June 02, 2015 and thebank as per its FOL confirmed that the outstanding FAPC and FATR finance has been converted into demand finance on July 03,2015. The facility is repayable in 42 equal monthly installment with 6 months grace period, commencing from March, 2016 andcarries markup at 3 Months KIBOR plus a spread of 2.5% annum. The facility is secured against exclusive charge over sponsor'sresidential and agricultural property, ranking charge over fixed and current assets of the Company and personal guarantees ofdirectors of the Company.
This represents the term finance facility availed from Habib Metropolitan Bank under LTFF - EOP scheme of State Bank of Pakistan(SBP) for the purchase of plant and machinery. These are repayable in equal quarterly installments and carry mark-up 10.40%(2014: 9% to 10.4%) per annum for SBP schemes. The loans are secured against exclusive charge over textile machinery,hypothecation of stocks of weaving unit of the Company, export letters of credit and personal guarantees of directors of theCompany. The facilities are repayable latest by March 2018.
These loans are unsecured, interest free and are under subordination agreement with banks. The director's of the company hasconfirmed that they would not demand repayment of loan for a period of 12 months of the balance sheet date. Hence the loan hasbeen classified as long term liability. The company has intention to issue the capital after obtaining necessary approvals in comingperiod.
Note 8Liabilities Against Assets Subject To Finance Lease
2015 2014Note Rupees Rupees
Future minimum lease payments 17,994,366 17,689,530Less: Un-amortized finance charges (2,243,943) (2,345,674)Present value of future minimum lease payments 15,750,423 15,343,856Less: Current portion shown under current liabilities (4,266,648) (3,389,058)
11,483,775 11,954,798
8.1
8.2
8.3
Future minimum lease payments 5,084,966 12,909,400 4,708,677 12,980,853Less: Un-amortized finance charge (818,318) (1,425,625) (1,319,619) (1,026,055)Present value of minimum lease payments 4,266,648 11,483,775 3,389,058 11,954,798
2015 2014
This represents finance lease arrangements entered into with banks to acquire vehicles . Financing rates ranging from 12.00% to13.63% (2014: 12.5% to 15%) per annum, approximately, have been used as discounting factor. Taxes, repairs, replacement andinsurance costs are borne by the Company.
Lease liabilities are secured against title of leased assets, personal guarantees of directors and security deposits amounting to Rs.5.135 million (2014: Rs. 5.102 million).
Minimum lease payments and their present value are regroup as under:
Not later thanone year
Later than one yearand not later than
one year
Not later thanone year
Later than one year andnot later than
one year
----------------------------------------Rupees-----------------------------------------
Y O U S A F W E A V I N G M I L L S L I M I T E D Annual Report 2 0 1 5
23
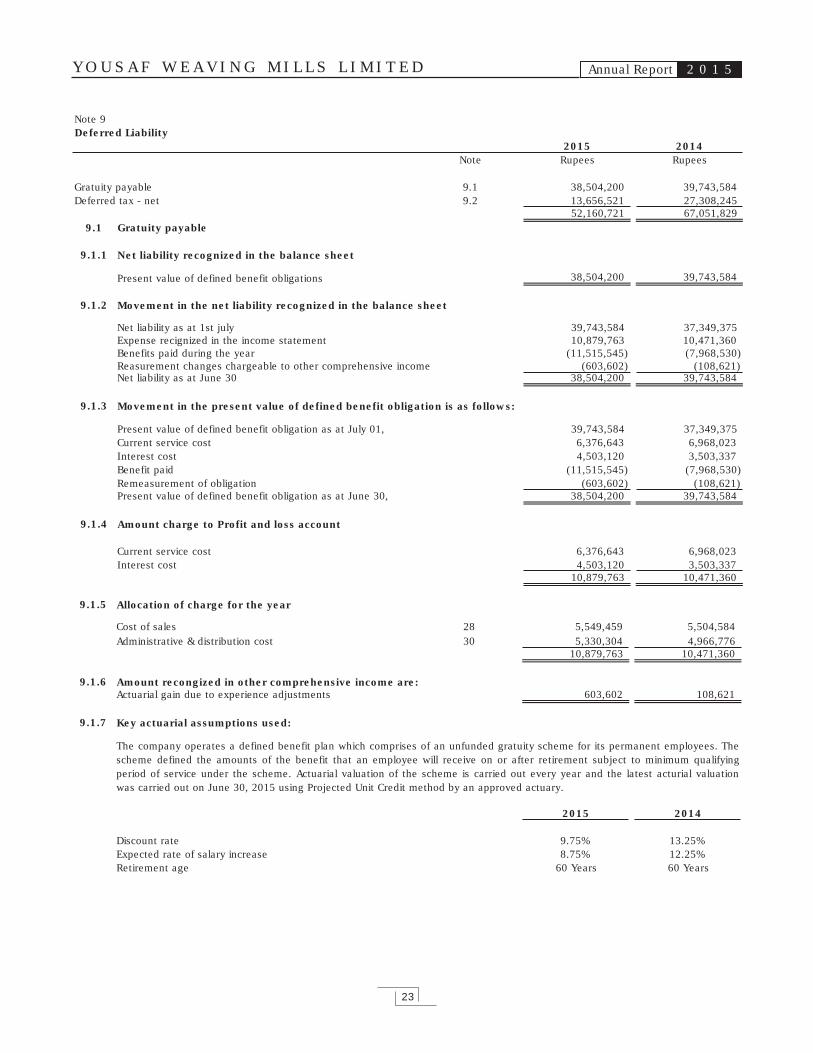
Note 9Deferred Liability
2015 2014Note Rupees Rupees
Gratuity payable 9.1 38,504,200 39,743,584Deferred tax - net 9.2 13,656,521 27,308,245
52,160,721 67,051,8299.1 Gratuity payable
9.1.1
Present value of defined benefit obligations 38,504,200 39,743,584
9.1.2
Net liability as at 1st july 39,743,584 37,349,375Expense recignized in the income statement 10,879,763 10,471,360Benefits paid during the year (11,515,545) (7,968,530)Reasurement changes chargeable to other comprehensive income (603,602) (108,621)Net liability as at June 30 38,504,200 39,743,584
9.1.3
Present value of defined benefit obligation as at July 01, 39,743,584 37,349,375Current service cost 6,376,643 6,968,023Interest cost 4,503,120 3,503,337Benefit paid (11,515,545) (7,968,530)Remeasurement of obligation (603,602) (108,621)Present value of defined benefit obligation as at June 30, 38,504,200 39,743,584
9.1.4
Current service cost 6,376,643 6,968,023Interest cost 4,503,120 3,503,337
10,879,763 10,471,360
Net liability recognized in the balance sheet
Movement in the net liability recognized in the balance sheet
Amount charge to Profit and loss account
Movement in the present value of defined benefit obligation is as follows:
9.1.5
Cost of sales 28 5,549,459 5,504,584Administrative & distribution cost 30 5,330,304 4,966,776
10,879,763 10,471,360
9.1.6Actuarial gain due to experience adjustments 603,602 108,621
9.1.7
2015 2014
Discount rate 9.75% 13.25%Expected rate of salary increase 8.75% 12.25%Retirement age 60 Years 60 Years
Key actuarial assumptions used:
Allocation of charge for the year
The company operates a defined benefit plan which comprises of an unfunded gratuity scheme for its permanent employees. Thescheme defined the amounts of the benefit that an employee will receive on or after retirement subject to minimum qualifyingperiod of service under the scheme. Actuarial valuation of the scheme is carried out every year and the latest acturial valuationwas carried out on June 30, 2015 using Projected Unit Credit method by an approved actuary.
Amount recongized in other comprehensive income are:

Y O U S A F W E A V I N G M I L L S L I M I T E D Annual Report 2 0 1 5
24
9.1.8
Change in Increase in Decrease inassumption assumption assumption
Discount rate + - by 100 bps 35,721,999 41,715,117Salary increase + - by 100 bps 41,715,117 35,673,958
9.2 Deferred tax liability - Net2015 2014
Rupees RupeesTaxable temporary differences
- Accelerated tax depreciation 104,307,115 78,635,596
Deducted temporary differences- Recognized losses (82,907,110) (47,904,985)
- Staff retirement benefits and others (7,881,054) (3,445,049)- Recognised in Other Comprehensive Income 137,570 22,683
(7,743,484) (3,422,366)
13,656,521 27,308,245
The sensitivity of the defined benefit obligation to changes in the weighted principle assumption is:
Sensitivity analysis for actuarial assumptions:
Note 9 - deferred liability … Contd.
Note 10Trade and Other Payables
2015 2014Note Rupees Rupees
Creditors- Secured 10.1 51,647,955 115,288,735- Unsecured 10.2 338,264,927 308,846,098
Accrued liabilities 80,216,145 25,109,199Unclaimed dividend 3,247,016 3,107,771Workers' (profit) participation fund 10.3 - 2,266,503Income tax payable 769,799 744,539Other liabilities 4,091,213 3,720,202
478,237,055 459,083,047
10.1
10.2
2015 2014Rupees Rupees
83,540,275 85,011,171 565,345 593,755 7,266,736 6,358,842 91,372,356 91,963,768
10.3 Workers' (profit) participation fund2015 2014
Rupees Rupees
Opening balance 2,266,503 10,386,278Charge for the year - 2,275,725
2,266,503 12,662,003Payments made during the year (2,266,503) (10,395,500)
- 2,266,503
Chakwal Spinning Mills LimitedChakwal Textile Mills LimitedKohinoor Spinning Mills Limited
These are secured against letters of credit issued by the bankers of the Company.
This includes amount due to following related parties on account of raw material purchases as follows:
The Company retained workers' profit participation fund for its business operation. Interest was provided at the prescribed rate under theCompanies Profit (Workers') Participation Act, 1968.

Y O U S A F W E A V I N G M I L L S L I M I T E D Annual Report 2 0 1 5
25
Note 11Accrued Mark up
2015 2014Note Rupees Rupees
Long term financing 7 774,829 1,079,288Short term borrowings 12 14,266,605 11,373,526
15,041,434 12,452,814
Note 12Short Term Borrowings
2015 2014Note Rupees Rupees
Banking companies - Secured
Running finance / packing credit / export finances 12.1 345,359,486 383,003,368
Related parties - Unsecured
- Loan from directors 12.2 6,244,720 365,948
Others
- Unpresented cheques 12.3 39,358,377 42,603,022
390,962,583 425,972,338
12.1 Terms and conditions of borrowings
- Purpose
- Mark up
- Securities
12.2
12.3 This represents cheques issued but not presented on the balance sheet date. These cheques have been honoured subsequent tothe balance sheet date.
These facilities have been obtained with sanctioned limit of Rs. 958.755 million (2014: 992.7 million) for working capitalrequirements, procure stock of cotton, retirement of import bills, local and foreign LCs, discounting local bills / receivables and loanagainst trust receipts etc.
The mark up rate on various limits is 3-month Kibor plus a spread of 2% to 3.5% (2014: 3-month Kibor plus 2% to 4%) perannum, payable quarterly. Further, some limits carry commission against local LCs at 0.20% to 0.25% (2014: 0.20% to 0.25%)per quarter.
These facilities are secured against pledge of raw material stocks, registered hypothecation charge over fabrics and yarn stocks,lien on export orders, imports documents, irrevocable L/Cs and export bills, charges over fixed and current assets of the Companyand personal guarantees of sponsoring directors of the Company.
This represents interest free funds obtained from directors to meet working capital requirements of the Company.
Y O U S A F W E A V I N G M I L L S L I M I T E D Annual Report 2 0 1 5
26
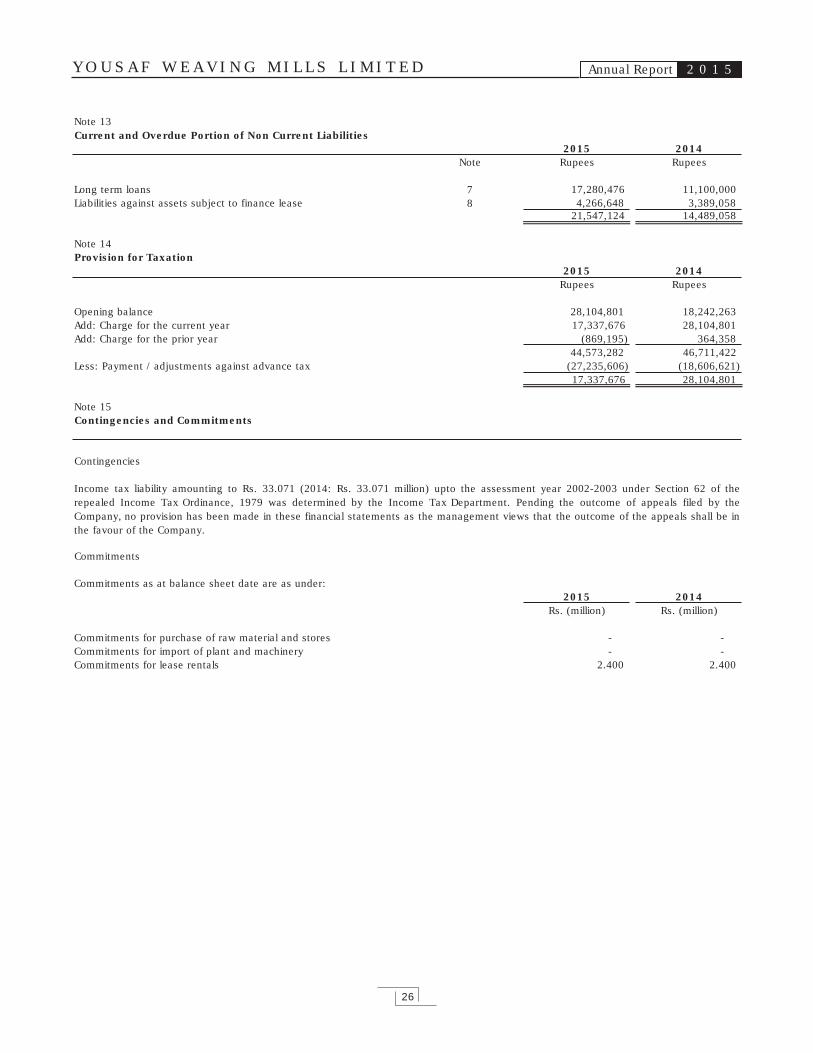
Note 13Current and Overdue Portion of Non Current Liabilities
2015 2014Note Rupees Rupees
Long term loans 7 17,280,476 11,100,000Liabilities against assets subject to finance lease 8 4,266,648 3,389,058
21,547,124 14,489,058
Note 14Provision for Taxation
2015 2014Rupees Rupees
Opening balance 28,104,801 18,242,263Add: Charge for the current year 17,337,676 28,104,801Add: Charge for the prior year (869,195) 364,358
44,573,282 46,711,422Less: Payment / adjustments against advance tax (27,235,606) (18,606,621)
17,337,676 28,104,801
Note 15Contingencies and Commitments
Contingencies
Commitments
Commitments as at balance sheet date are as under:2015 2014
Rs. (million) Rs. (million)
Commitments for purchase of raw material and stores - -Commitments for import of plant and machinery - -Commitments for lease rentals 2.400 2.400
Income tax liability amounting to Rs. 33.071 (2014: Rs. 33.071 million) upto the assessment year 2002-2003 under Section 62 of therepealed Income Tax Ordinance, 1979 was determined by the Income Tax Department. Pending the outcome of appeals filed by theCompany, no provision has been made in these financial statements as the management views that the outcome of the appeals shall be inthe favour of the Company.
Y O U S A F W E A V I N G M I L L S L I M I T E D Annual Report 2 0 1 5
27
Not
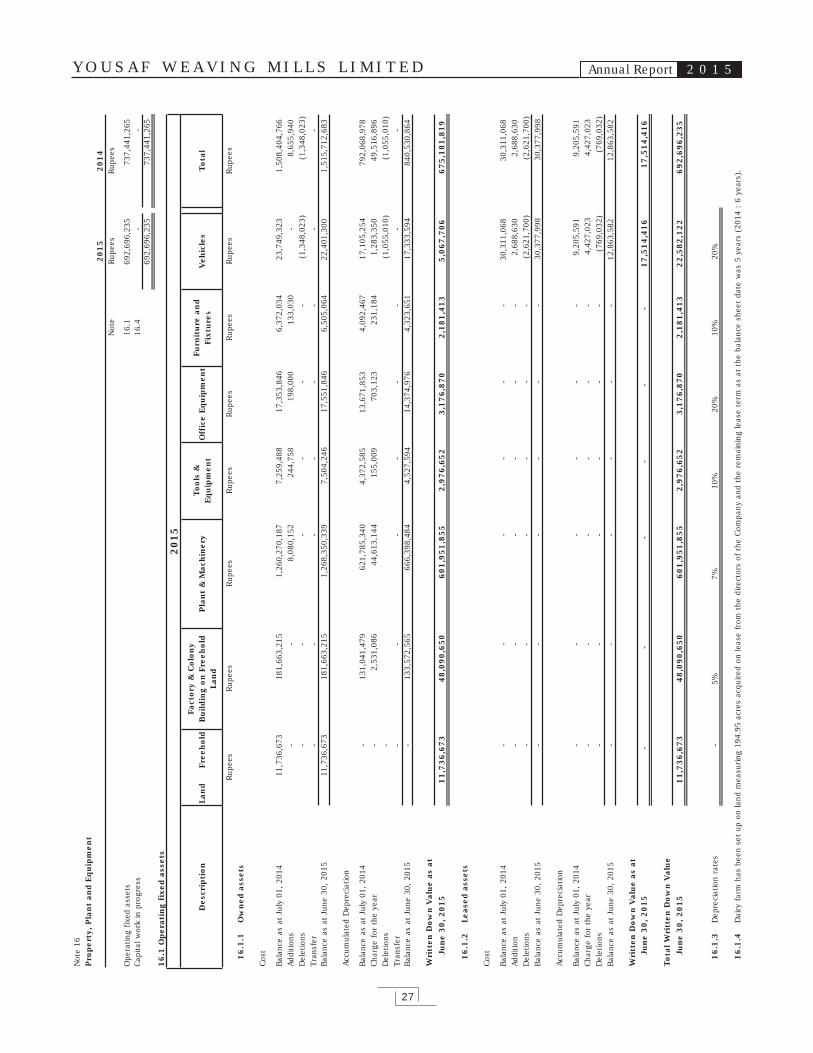
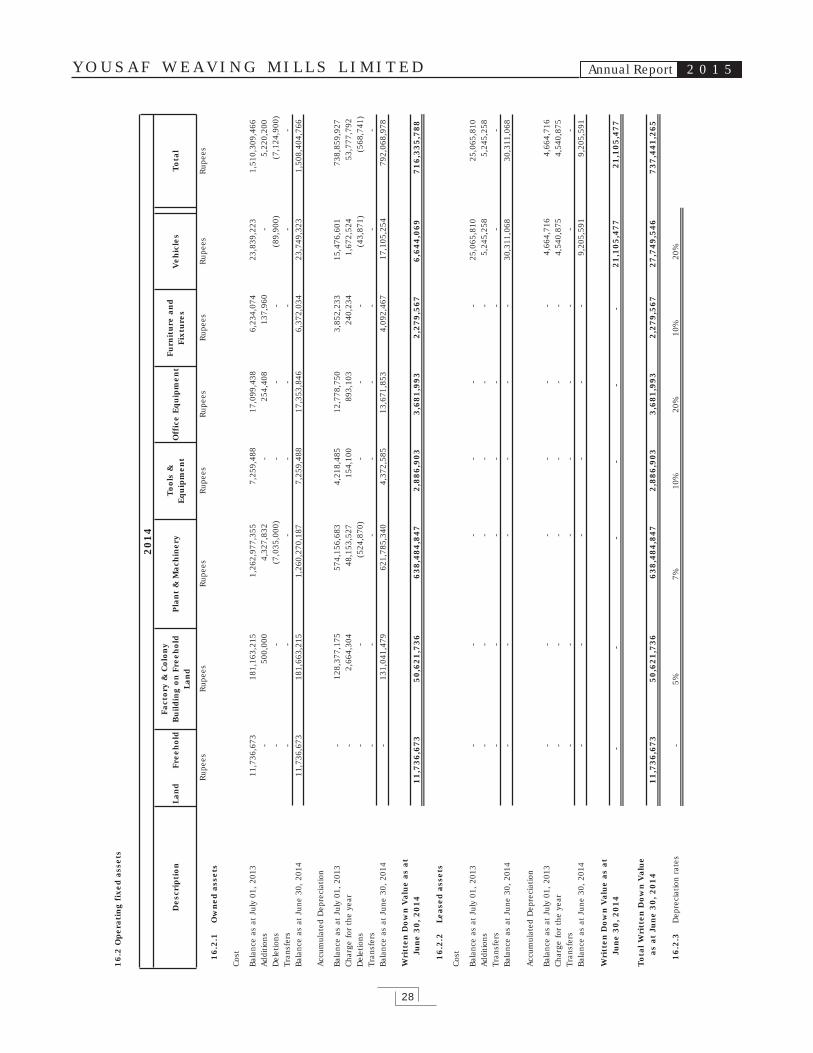
e 16
Pro
per
ty,
Pla
nt
and
Eq
uip
men
t2
01
52
01
4N
ote
Rup
ees
Rup
ees
Ope
ratin
g fix
ed a
sset
s16
.169
2,69
6,23
573
7,44
1,26
5Ca
pita
l wor
k in
pro
gres
s16
.4-
-69
2,69
6,23
573
7,44
1,26
5
16
.1 O
per
atin
g f
ixed
ass
ets
Lan
d
Fr
eeh
old
Fact
ory
& C
olo
ny
Bu
ildin
g o
n F
reeh
old
Lan
dP
lan
t &
Mac
hin
ery
To
ols
&E
qu
ipm
ent
Off
ice
Eq
uip
men
tFu
rnit
ure
an
dFi
xtu
res
Veh
icle
sT
ota
l
Rup
ees
Rup
ees
Rup
ees
Rup
ees
Rup
ees
Rup
ees
Rup
ees
Rup
ees
16
.1.1
Ow
ned
ass
ets
Cost
Bala
nce
as a
t Ju
ly 0
1, 2
014
11,7
36,6
7318
1,66
3,21
51,
260,
270,
187
7,25
9,48
817
,353
,846
6,37
2,03
423
,749
,323
1,50
8,40
4,76
6Ad
ditio
ns-
-8,
080,
152
244,
758
198,
000
133,
030
-8,
655,
940
Del
etio
ns-
--
--
-(1
,348
,023
)(1
,348
,023
)Tr
ansf
er-
--
--
--
-Ba
lanc
e as
at
June
30,
201
511
,736
,673
181,
663,
215
1,26
8,35
0,33
97,
504,
246
17,5
51,8
466,
505,
064
22,4
01,3
001,
515,
712,
683
Accu
mul
ated
Dep
reci
atio
n
Bala
nce
as a
t Ju
ly 0
1, 2
014
-13
1,04
1,47
962
1,78
5,34
04,
372,
585
13,6
71,8
534,
092,
467
17,1
05,2
5479
2,06
8,97
8Ch
arge
for
the
yea
r-
2,53
1,08
644
,613
,144
155,
009
703,
123
231,
184
1,28
3,35
049
,516
,896
Del
etio
ns-
(1,0
55,0
10)
(1,0
55,0
10)
Tran
sfer
--
--
--
--
Bala
nce
as a
t Ju
ne 3
0, 2
015
-13
3,57
2,56
566
6,39
8,48
44,
527,
594
14,3
74,9
764,
323,
651
17,3
33,5
9484
0,53
0,86
4
Wri
tten
Do
wn
Val
ue
as a
tJu
ne
30
, 2
01
51
1,7
36
,67
34
8,0
90
,65
06
01
,95
1,8
55
2,9
76
,65
23
,17
6,8
70
2,1
81
,41
35
,06
7,7
06
67
5,1
81
,81
9
16
.1.2
Leas
ed a
sset
s
Cost
Bala
nce
as a
t Ju
ly 0
1, 2
014
--
--
--
30,3
11,0
6830
,311
,068
Addi
tion
--
--
--
2,68
8,63
02,
688,
630
Del
etio
ns-
--
--
-(2
,621
,700
)(2
,621
,700
)Ba
lanc
e as
at
June
30,
201
5-
--
--
-30
,377
,998
30,3
77,9
98
Accu
mul
ated
Dep
reci
atio
n
Bala
nce
as a
t Ju
ly 0
1, 2
014
--
--
--
9,20
5,59
19,
205,
591
Char
ge f
or t
he y
ear
--
--
--
4,42
7,02
34,
427,
023
Del
etio
ns-
--
--
-(7
69,0
32)
(769
,032
)Ba
lanc
e as
at
June
30,
201
5-
--
--
-12
,863
,582
12,8
63,5
82
Wri
tten
Do
wn
Val
ue
as a
tJu
ne
30
, 2
01
5-
--
--
-1
7,5
14
,41
61
7,5
14
,41
6
To
tal W
ritt
en D
ow
n V
alu
eJu
ne
30
, 2
01
51
1,7
36
,67
34
8,0
90
,65
06
01
,95
1,8
55
2,9
76
,65
23
,17
6,8
70
2,1
81
,41
32
2,5
82
,12
26
92
,69
6,2
35
16
.1.3
Dep
reci
atio
n ra
tes
-5%
7%10
%20
%10
%20
%
16
.1.4
20
15
Des
crip
tio
n
Dai
ry f
arm
has
bee
n se
t up
on
land
mea
surin
g 19
4.95
acr
es a
cqui
red
on le
ase
from
the
dire
ctor
s of
the
Com
pany
and
the
rem
aini
ng le
ase
term
as
at t
he b
alan
ce s
heet
dat
e w
as 5
yea
rs (
2014
: 6
yea
rs).
Y O U S A F W E A V I N G M I L L S L I M I T E D Annual Report 2 0 1 5
28
16
.2 O
per
atin
g f
ixed
ass
ets
Lan
d
Fr
eeh
old
Fact
ory
& C
olo
ny
Bu
ildin
g o
n F
reeh
old
Lan
dP
lan
t &
Mac
hin
ery
To
ols
&E
qu
ipm
ent
Off
ice
Eq
uip
men
tFu
rnit
ure
an
dFi
xtu
res
Veh
icle
sT
ota
l
Rup
ees
Rup
ees
Rup
ees
Rup
ees
Rup
ees
Rup
ees
Rup
ees
Rup
ees
16
.2.1
Ow
ned
ass
ets
Cost
Bala
nce
as a
t Ju
ly 0
1, 2
013
11,7
36,6
7318
1,16
3,21
51,
262,
977,
355
7,25
9,48
817
,099
,438
6,23
4,07
423
,839
,223
1,51
0,30
9,46
6Ad
ditio
ns-
500,
000
4,32
7,83
2-
254,
408
137,
960
-5,
220,
200
Del
etio
ns-
-(7
,035
,000
)-
--
(89,
900)
(7,1
24,9
00)
Tran
sfer
s-
--
--
--
-Ba
lanc
e as
at
June
30,
201
411
,736
,673
181,
663,
215
1,26
0,27
0,18
77,
259,
488
17,3
53,8
466,
372,
034
23,7
49,3
231,
508,
404,
766
Accu
mul
ated
Dep
reci
atio
n
Bala
nce
as a
t Ju
ly 0
1, 2
013
-12
8,37
7,17
557
4,15
6,68
34,
218,
485
12,7
78,7
503,
852,
233
15,4
76,6
0173
8,85
9,92
7Ch
arge
for
the
yea
r-
2,66
4,30
448
,153
,527
154,
100
893,
103
240,
234
1,67
2,52
453
,777
,792
Del
etio
ns-
-(5
24,8
70)
--
-(4
3,87
1)(5
68,7
41)
Tran
sfer
s-
--
--
--
-Ba
lanc
e as
at
June
30,
201
4-
131,
041,
479
621,
785,
340
4,37
2,58
513
,671
,853
4,09
2,46
717
,105
,254
792,
068,
978
Wri
tten
Do
wn
Val
ue
as a
tJu
ne
30
, 2
01
41
1,7
36
,67
35
0,6
21
,73
66
38
,48
4,8
47
2,8
86
,90
33
,68
1,9
93
2,2
79
,56
76
,64
4,0
69
71
6,3
35
,78
8
16
.2.2
Leas
ed a
sset
s
Cost
Bala
nce
as a
t Ju
ly 0
1, 2
013
--
--
--
25,0
65,8
1025
,065
,810
Addi
tions
--
--
--
5,24
5,25
85,
245,
258
Tran
sfer
s-
--
--
--
-Ba
lanc
e as
at
June
30,
201
4-
--
--
-30
,311
,068
30,3
11,0
68
Accu
mul
ated
Dep
reci
atio
n
Bala
nce
as a
t Ju
ly 0
1, 2
013
--
--
--
4,66
4,71
64,
664,
716
Char
ge f
or t
he y
ear
--
--
--
4,54
0,87
54,
540,
875
Tran
sfer
s-
--
--
--
-Ba
lanc
e as
at
June
30,
201
4-
--
--
-9,
205,
591
9,20
5,59
1
Wri
tten
Do
wn
Val
ue
as a
tJu
ne
30
, 2
01
4-
--
--
-2
1,1
05
,47
72
1,1
05
,47
7
To
tal W
ritt
en D
ow
n V
alu
eas
at
Jun
e 3
0,
20
14
11
,73
6,6
73
50
,62
1,7
36
63
8,4
84
,84
72
,88
6,9
03
3,6
81
,99
32
,27
9,5
67
27
,74
9,5
46
73
7,4
41
,26
5
16
.2.3
Dep
reci
atio
n ra
tes
-5%
7%10
%20
%10
%20
%
Des
crip
tio
n
20
14
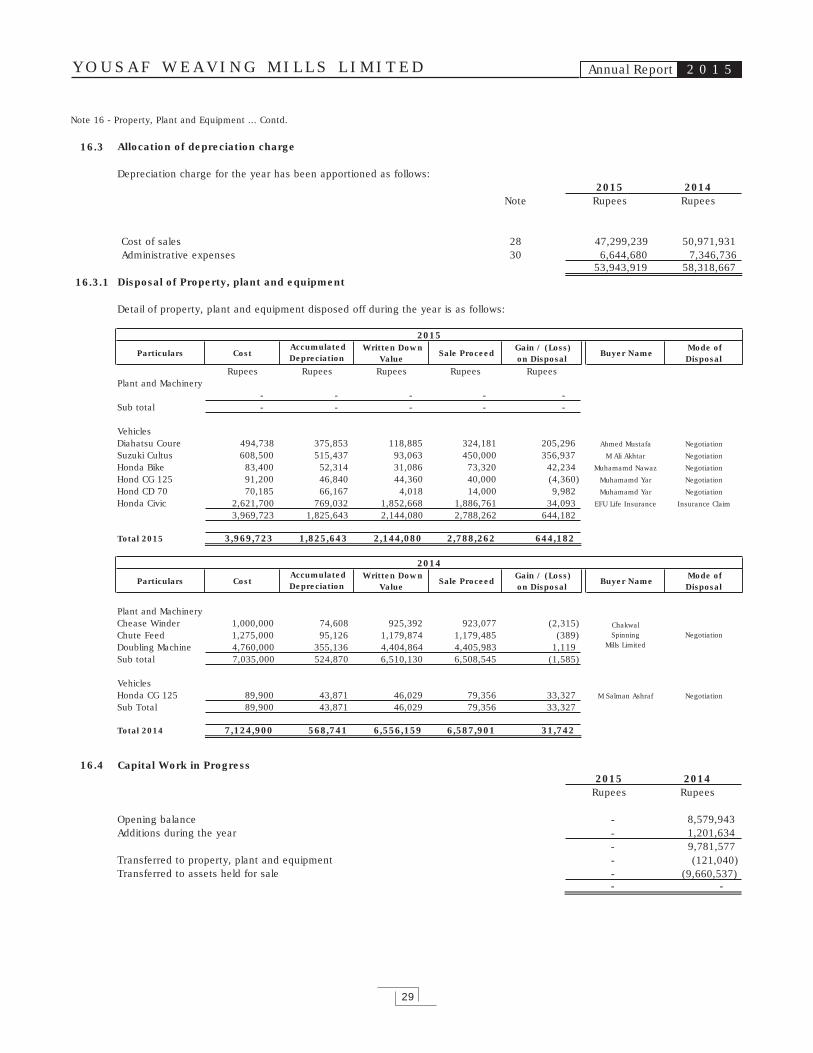
Y O U S A F W E A V I N G M I L L S L I M I T E D Annual Report 2 0 1 5
29
Note 16 - Property, Plant and Equipment ... Contd.
16.3 Allocation of depreciation charge
Depreciation charge for the year has been apportioned as follows:2015 2014
Note Rupees Rupees
Cost of sales 28 47,299,239 50,971,931Administrative expenses 30 6,644,680 7,346,736
53,943,919 58,318,66716.3.1 Disposal of Property, plant and equipment
Detail of property, plant and equipment disposed off during the year is as follows:
16.4 Capital Work in Progress2015 2014
Rupees Rupees
Opening balance - 8,579,943Additions during the year - 1,201,634
- 9,781,577Transferred to property, plant and equipment - (121,040)Transferred to assets held for sale - (9,660,537)
- -
Rupees Rupees Rupees Rupees RupeesPlant and Machinery
- - - - -Sub total - - - - -
VehiclesDiahatsu Coure 494,738 375,853 118,885 324,181 205,296 Ahmed Mustafa Negotiation
Suzuki Cultus 608,500 515,437 93,063 450,000 356,937 M Ali Akhtar Negotiation
Honda Bike 83,400 52,314 31,086 73,320 42,234 Muhamamd Nawaz Negotiation
Hond CG 125 91,200 46,840 44,360 40,000 (4,360) Muhamamd Yar Negotiation
Hond CD 70 70,185 66,167 4,018 14,000 9,982 Muhamamd Yar Negotiation
Honda Civic 2,621,700 769,032 1,852,668 1,886,761 34,093 EFU Life Insurance Insurance Claim
3,969,723 1,825,643 2,144,080 2,788,262 644,182
Total 2015 3,969,723 1,825,643 2,144,080 2,788,262 644,182
Plant and MachineryChease Winder 1,000,000 74,608 925,392 923,077 (2,315)Chute Feed 1,275,000 95,126 1,179,874 1,179,485 (389)Doubling Machine 4,760,000 355,136 4,404,864 4,405,983 1,119Sub total 7,035,000 524,870 6,510,130 6,508,545 (1,585)
VehiclesHonda CG 125 89,900 43,871 46,029 79,356 33,327 M Salman Ashraf Negotiation
Sub Total 89,900 43,871 46,029 79,356 33,327
Total 2014 7,124,900 568,741 6,556,159 6,587,901 31,742
Mode ofDisposal
2014
Particulars Buyer NameCost AccumulatedDepreciation
Negotiation
Mode ofDisposal
2015
Particulars Cost AccumulatedDepreciation
Written DownValue
Sale Proceed Gain / (Loss)on Disposal
Buyer Name
Written DownValue
Sale Proceed Gain / (Loss)on Disposal
ChakwalSpinning
Mills Limited
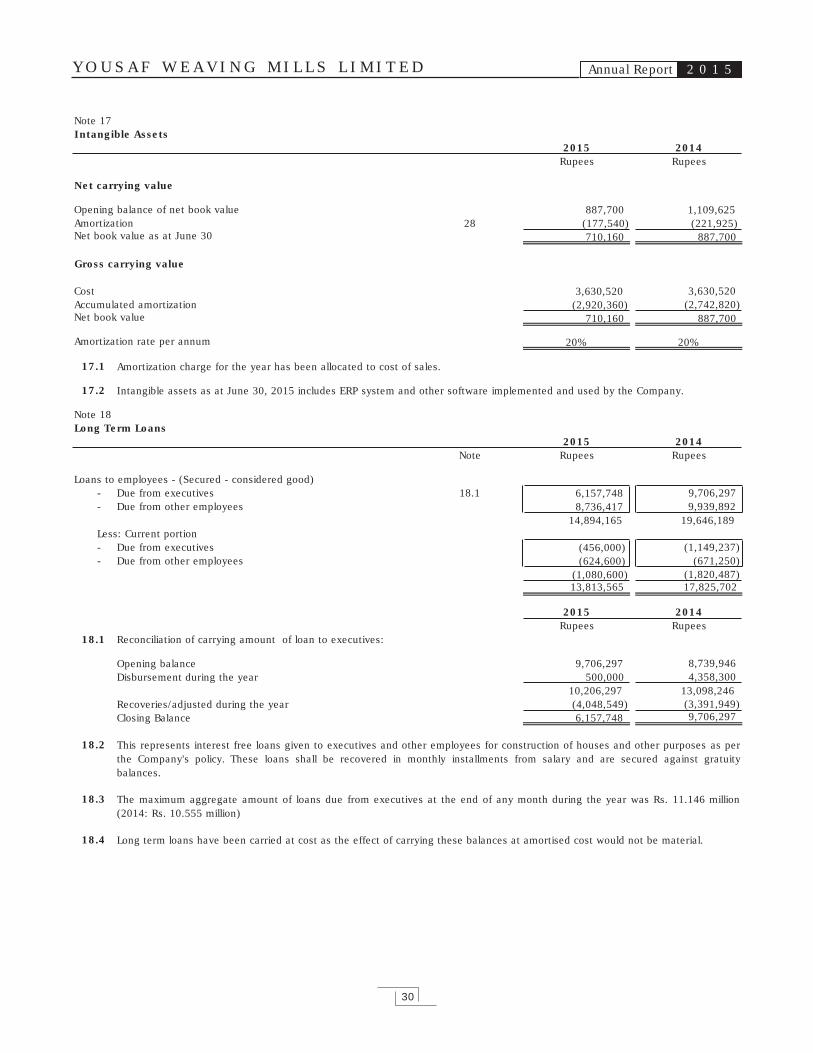
Y O U S A F W E A V I N G M I L L S L I M I T E D Annual Report 2 0 1 5
30
(1,080,600)13,813,565
(624,600) (456,000)
Note 17Intangible Assets
2015 2014Rupees Rupees
Net carrying value
Opening balance of net book value 887,700 1,109,625Amortization 28 (177,540) (221,925)Net book value as at June 30 710,160 887,700
Gross carrying value
Cost 3,630,520 3,630,520Accumulated amortization (2,920,360) (2,742,820)Net book value 710,160 887,700
Amortization rate per annum 20% 20%
17.1
17.2
Note 18Long Term Loans
2015 2014Note Rupees Rupees
Loans to employees - (Secured - considered good)- Due from executives 18.1 6,157,748 9,706,297- Due from other employees 8,736,417 9,939,892
14,894,165 19,646,189Less: Current portion- Due from executives (1,149,237)- Due from other employees (671,250)
(1,820,487)17,825,702
2015 2014Rupees Rupees
18.1 Reconciliation of carrying amount of loan to executives:
9,706,297 8,739,946 500,000 4,358,300 10,206,297 13,098,246 (4,048,549) (3,391,949) 6,157,748 9,706,297
18.2
18.3
18.4
The maximum aggregate amount of loans due from executives at the end of any month during the year was Rs. 11.146 million(2014: Rs. 10.555 million)
Amortization charge for the year has been allocated to cost of sales.
Intangible assets as at June 30, 2015 includes ERP system and other software implemented and used by the Company.
Disbursement during the year
Recoveries/adjusted during the yearClosing Balance
This represents interest free loans given to executives and other employees for construction of houses and other purposes as perthe Company's policy. These loans shall be recovered in monthly installments from salary and are secured against gratuitybalances.
Opening balance
Long term loans have been carried at cost as the effect of carrying these balances at amortised cost would not be material.
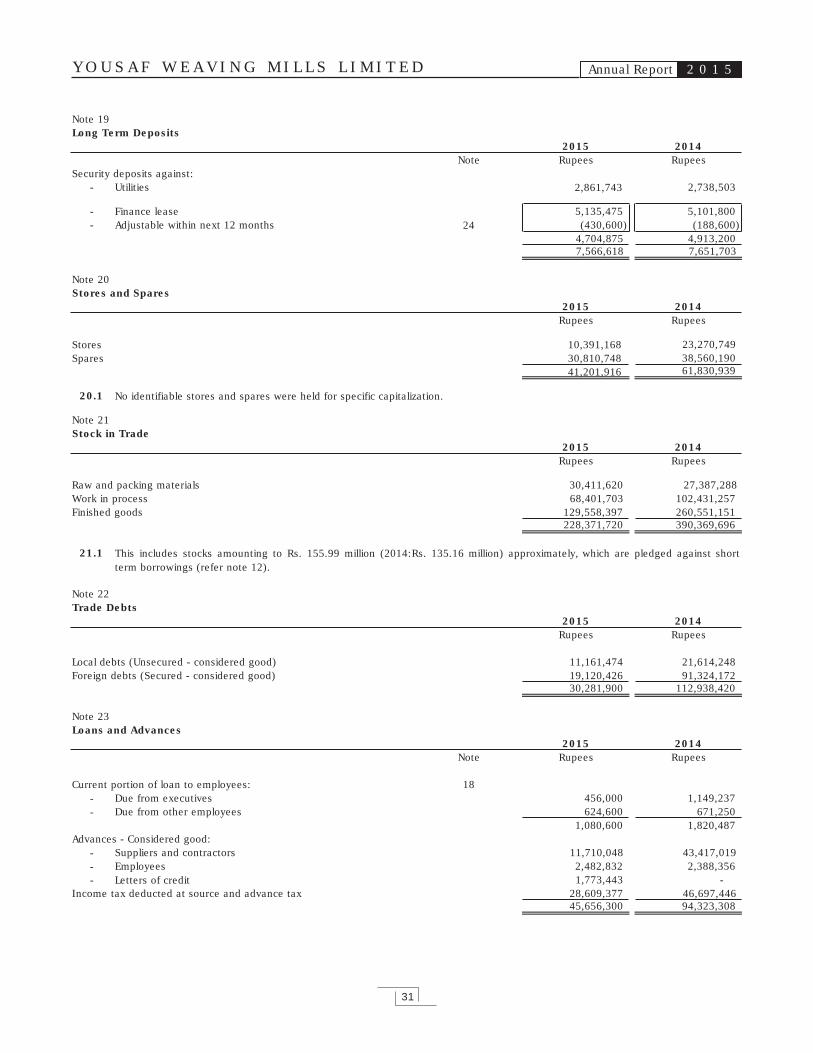
Y O U S A F W E A V I N G M I L L S L I M I T E D Annual Report 2 0 1 5
31
Note 19Long Term Deposits
2015 2014Note Rupees Rupees
Security deposits against:- Utilities 2,861,743 2,738,503
- Finance lease 5,135,475 5,101,800- Adjustable within next 12 months 24 (430,600) (188,600)
4,704,875 4,913,2007,566,618 7,651,703
Note 20Stores and Spares
2015 2014Rupees Rupees
Stores 10,391,168 23,270,749Spares 30,810,748 38,560,190
41,201,916 61,830,939
20.1 No identifiable stores and spares were held for specific capitalization.
Note 21Stock in Trade
2015 2014Rupees Rupees
Raw and packing materials 30,411,620 27,387,288Work in process 68,401,703 102,431,257Finished goods 129,558,397 260,551,151
228,371,720 390,369,696
21.1
Note 22Trade Debts
2015 2014Rupees Rupees
Local debts (Unsecured - considered good) 11,161,474 21,614,248Foreign debts (Secured - considered good) 19,120,426 91,324,172
30,281,900 112,938,420
Note 23Loans and Advances
2015 2014Note Rupees Rupees
Current portion of loan to employees: 18- Due from executives 456,000 1,149,237- Due from other employees 624,600 671,250
1,080,600 1,820,487Advances - Considered good:
- Suppliers and contractors 11,710,048 43,417,019- Employees 2,482,832 2,388,356- Letters of credit 1,773,443 -
Income tax deducted at source and advance tax 28,609,377 46,697,44645,656,300 94,323,308
This includes stocks amounting to Rs. 155.99 million (2014:Rs. 135.16 million) approximately, which are pledged against shortterm borrowings (refer note 12).
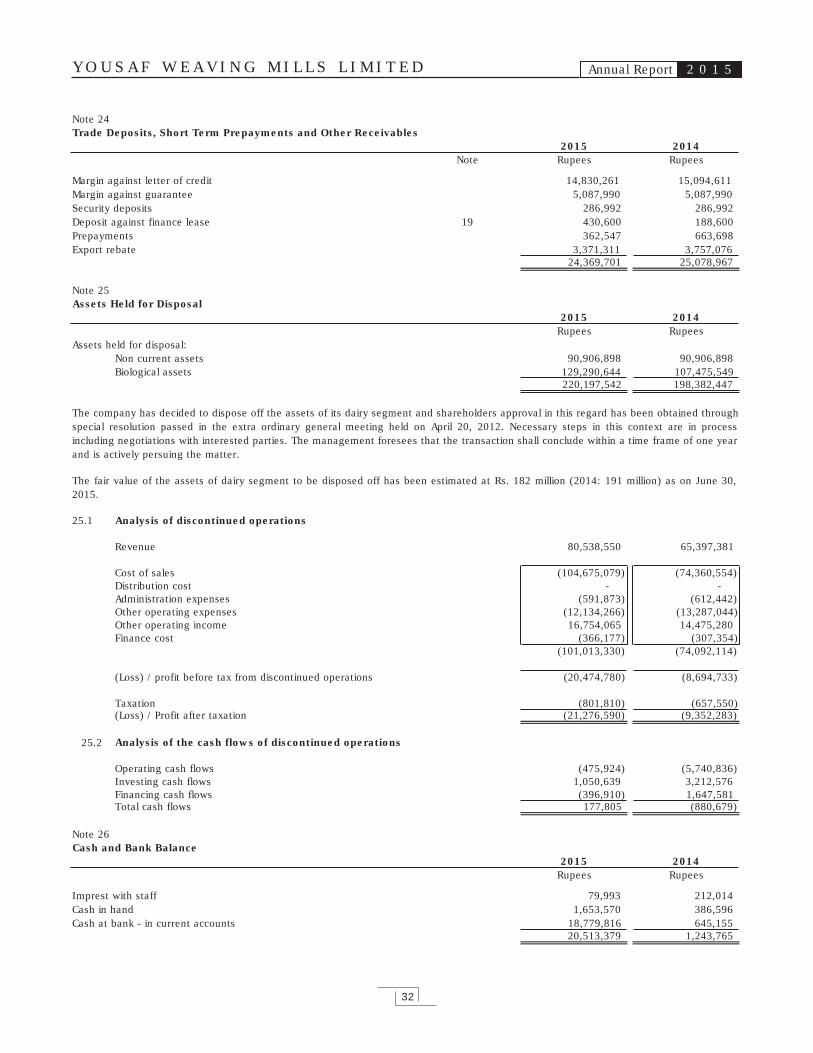
Y O U S A F W E A V I N G M I L L S L I M I T E D Annual Report 2 0 1 5
32
Note 24Trade Deposits, Short Term Prepayments and Other Receivables
2015 2014Note Rupees Rupees
Margin against letter of credit 14,830,261 15,094,611Margin against guarantee 5,087,990 5,087,990Security deposits 286,992 286,992Deposit against finance lease 19 430,600 188,600Prepayments 362,547 663,698Export rebate 3,371,311 3,757,076
24,369,701 25,078,967
Note 25Assets Held for Disposal
2015 2014Rupees Rupees
Assets held for disposal:Non current assets 90,906,898 90,906,898Biological assets 129,290,644 107,475,549
220,197,542 198,382,447
25.1 Analysis of discontinued operations
Revenue 80,538,550 65,397,381
Cost of sales (104,675,079) (74,360,554)Distribution cost - -Administration expenses (591,873) (612,442)Other operating expenses (12,134,266) (13,287,044)Other operating income 16,754,065 14,475,280Finance cost (366,177) (307,354)
(101,013,330) (74,092,114)
(Loss) / profit before tax from discontinued operations (20,474,780) (8,694,733)
Taxation (801,810) (657,550)(Loss) / Profit after taxation (21,276,590) (9,352,283)
25.2 Analysis of the cash flows of discontinued operations
Operating cash flows (475,924) (5,740,836)Investing cash flows 1,050,639 3,212,576Financing cash flows (396,910) 1,647,581Total cash flows 177,805 (880,679)
Note 26Cash and Bank Balance
2015 2014Rupees Rupees
Imprest with staff 79,993 212,014Cash in hand 1,653,570 386,596Cash at bank - in current accounts 18,779,816 645,155
20,513,379 1,243,765
The company has decided to dispose off the assets of its dairy segment and shareholders approval in this regard has been obtained throughspecial resolution passed in the extra ordinary general meeting held on April 20, 2012. Necessary steps in this context are in processincluding negotiations with interested parties. The management foresees that the transaction shall conclude within a time frame of one yearand is actively persuing the matter.
The fair value of the assets of dairy segment to be disposed off has been estimated at Rs. 182 million (2014: 191 million) as on June 30,2015.

Y O U S A F W E A V I N G M I L L S L I M I T E D Annual Report 2 0 1 5
33
Note 27Sales
2015 2014Rupees Rupees
Exports- Grey cloth 479,568,477 942,732,726- Processed cloth 53,045,701 184,688,175- Export rebate 210,662 882,932
532,824,840 1,128,303,833Local
- Grey cloth 540,223,952 883,695,547- Processed cloth 2,316,343 6,258,316- Yarn 442,283,489 611,833,900- Milk 80,538,550 65,397,381
1,065,362,334 1,567,185,144
Waste sales 2,829,962 2,200,715Processing income 161,015,070 126,787,556
1,762,032,206 2,824,477,248
Sales tax (32,930,479) (44,841,535)Commission (20,458,209) (31,240,338)
1,708,643,518 2,748,395,375
Note 28Cost of Sales
2015 2014Note Rupees Rupees
Raw materials consumed 28.1 1,050,917,240 1,756,643,239Salaries, wages and other benefits 28.2 151,344,097 162,376,172Dying and processing charges 11,748,910 28,253,071Fuel and power 289,449,254 316,841,888Stores, spares and chemicals consumed 84,519,145 78,811,301Packing material 14,261,569 23,210,209Insurance 2,940,998 2,401,156Repairs and maintenance 6,030,622 7,274,920Miscellaneous 14,200,397 13,284,892Amortization 17 177,540 221,925Depreciation 16.3 47,299,239 50,971,931
1,672,889,011 2,440,290,704Work in process:
- Opening work in process 102,431,257 93,291,721- Closing work in process (68,401,703) (102,431,257)
34,029,554 (9,139,536)
Cost of goods manufactured 1,706,918,565 2,431,151,168
Finished goods:- Opening finished goods 260,551,151 267,038,095- Cloth purchased 49,304,014 52,883,492
309,855,165 319,921,587- Closing finished goods (129,558,397) (260,551,151)
180,296,768 59,370,436
1,887,215,333 2,490,521,604
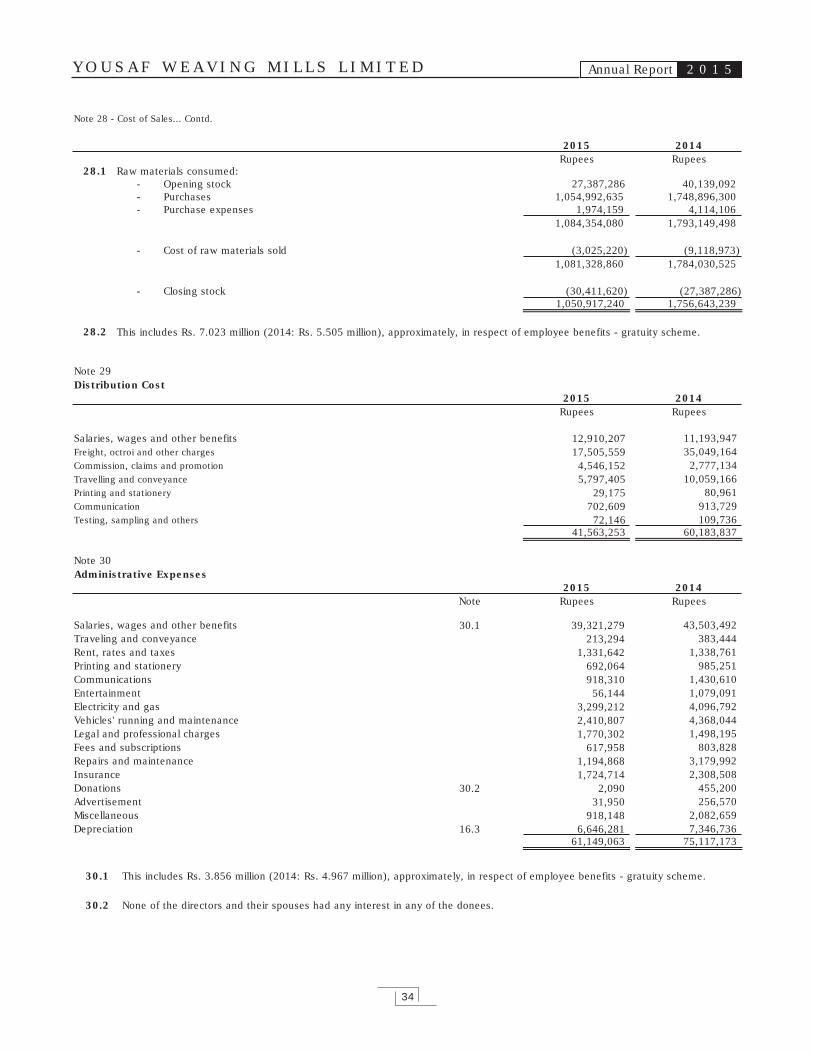
Y O U S A F W E A V I N G M I L L S L I M I T E D Annual Report 2 0 1 5
34
Note 28 - Cost of Sales... Contd.
2015 2014Rupees Rupees
28.1 Raw materials consumed:- Opening stock 27,387,286 40,139,092- Purchases 1,054,992,635 1,748,896,300- Purchase expenses 1,974,159 4,114,106
1,084,354,080 1,793,149,498
- Cost of raw materials sold (3,025,220) (9,118,973)1,081,328,860 1,784,030,525
- Closing stock (30,411,620) (27,387,286)1,050,917,240 1,756,643,239
28.2
Note 29Distribution Cost
2015 2014Rupees Rupees
Salaries, wages and other benefits 12,910,207 11,193,947Freight, octroi and other charges 17,505,559 35,049,164Commission, claims and promotion 4,546,152 2,777,134Travelling and conveyance 5,797,405 10,059,166Printing and stationery 29,175 80,961Communication 702,609 913,729Testing, sampling and others 72,146 109,736
41,563,253 60,183,837
Note 30Administrative Expenses
2015 2014Note Rupees Rupees
Salaries, wages and other benefits 30.1 39,321,279 43,503,492Traveling and conveyance 213,294 383,444Rent, rates and taxes 1,331,642 1,338,761Printing and stationery 692,064 985,251Communications 918,310 1,430,610Entertainment 56,144 1,079,091Electricity and gas 3,299,212 4,096,792Vehicles' running and maintenance 2,410,807 4,368,044Legal and professional charges 1,770,302 1,498,195Fees and subscriptions 617,958 803,828Repairs and maintenance 1,194,868 3,179,992Insurance 1,724,714 2,308,508Donations 30.2 2,090 455,200Advertisement 31,950 256,570Miscellaneous 918,148 2,082,659Depreciation 16.3 6,646,281 7,346,736
61,149,063 75,117,173
30.1
30.2
This includes Rs. 7.023 million (2014: Rs. 5.505 million), approximately, in respect of employee benefits - gratuity scheme.
This includes Rs. 3.856 million (2014: Rs. 4.967 million), approximately, in respect of employee benefits - gratuity scheme.
None of the directors and their spouses had any interest in any of the donees.
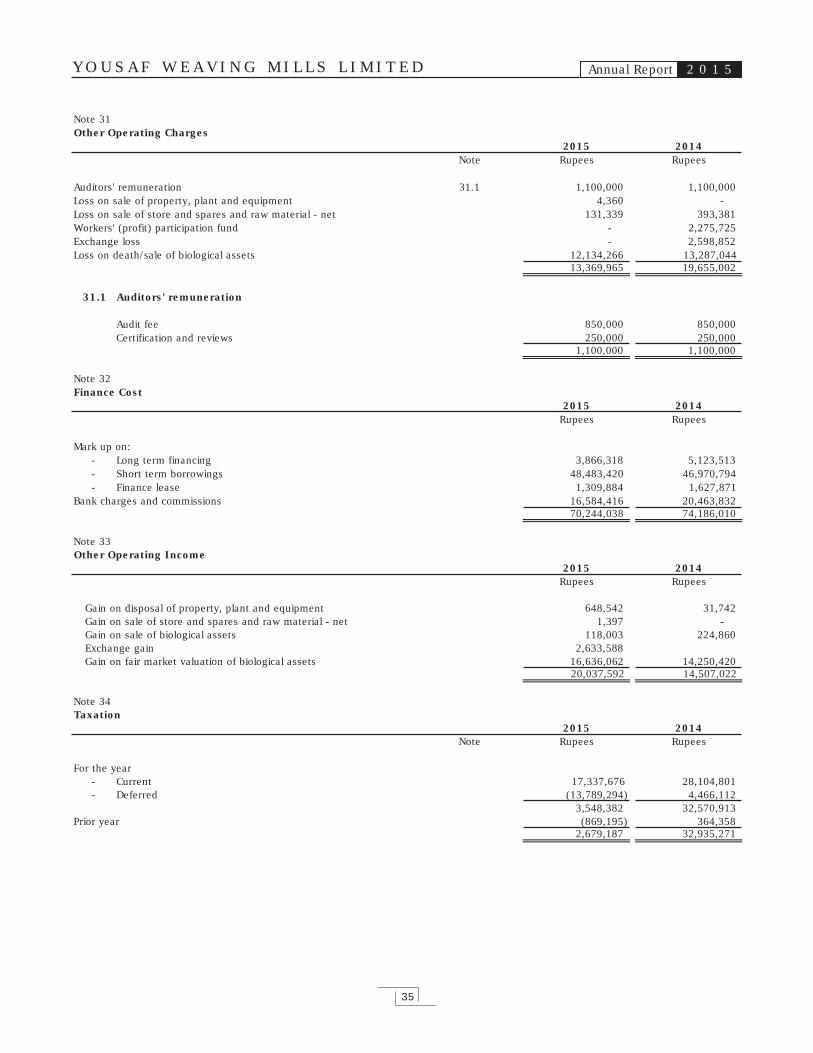
Y O U S A F W E A V I N G M I L L S L I M I T E D Annual Report 2 0 1 5
35
Note 31Other Operating Charges
2015 2014Note Rupees Rupees
Auditors' remuneration 31.1 1,100,000 1,100,000Loss on sale of property, plant and equipment 4,360 -Loss on sale of store and spares and raw material - net 131,339 393,381Workers' (profit) participation fund - 2,275,725Exchange loss - 2,598,852Loss on death/sale of biological assets 12,134,266 13,287,044
13,369,965 19,655,002
31.1 Auditors' remuneration
Audit fee 850,000 850,000Certification and reviews 250,000 250,000
1,100,000 1,100,000
Note 32Finance Cost
2015 2014Rupees Rupees
Mark up on:- Long term financing 3,866,318 5,123,513- Short term borrowings 48,483,420 46,970,794- Finance lease 1,309,884 1,627,871
Bank charges and commissions 16,584,416 20,463,83270,244,038 74,186,010
Note 33Other Operating Income
2015 2014Rupees Rupees
Gain on disposal of property, plant and equipment 648,542 31,742Gain on sale of store and spares and raw material - net 1,397 -Gain on sale of biological assets 118,003 224,860Exchange gain 2,633,588Gain on fair market valuation of biological assets 16,636,062 14,250,420
20,037,592 14,507,022
Note 34Taxation
2015 2014Note Rupees Rupees
For the year- Current 17,337,676 28,104,801- Deferred (13,789,294) 4,466,112
3,548,382 32,570,913Prior year (869,195) 364,358
2,679,187 32,935,271

Y O U S A F W E A V I N G M I L L S L I M I T E D Annual Report 2 0 1 5
36
Note 35Earnings / (Loss) per Share
2015 2014Rupees Rupees
Weighted average number of ordinary shares outstanding during the year 40,000,000 40,000,000
Continuing operations:
Profit after taxation (326,263,139) 19,655,783
Earnings per share - basic (Rupees per share) (8.16) 0.49
Discontinuing operations:
(Loss) / profit after taxation (21,276,590) (9,352,283)
(Loss) / earnings per share - basic (Rupees per share) (0.53) (0.23)
Profit after taxation (347,539,729) 10,303,500
Earnings per share - basic (Rupees per share) (8.69) 0.26
35.1 Diluted earnings / (loss) per share
Number of shares
There is no dilution effect on the basic earnings / (loss) per share of the Company as the Company has no such commitments thatwould result in dilution of earnings of the Company.
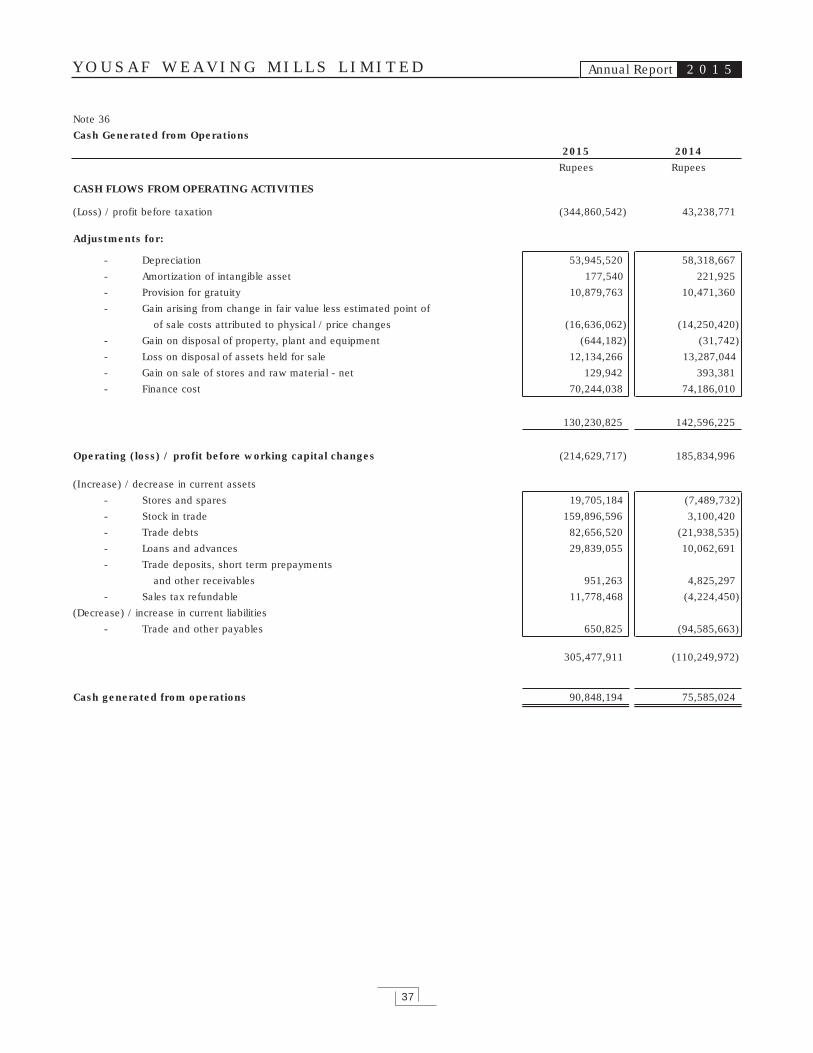
Y O U S A F W E A V I N G M I L L S L I M I T E D Annual Report 2 0 1 5
37
Note 36Cash Generated from Operations
2015 2014Rupees Rupees
CASH FLOWS FROM OPERATING ACTIVITIES
(Loss) / profit before taxation (344,860,542) 43,238,771
Adjustments for:
- Depreciation 53,945,520 58,318,667- Amortization of intangible asset 177,540 221,925- Provision for gratuity 10,879,763 10,471,360- Gain arising from change in fair value less estimated point of
of sale costs attributed to physical / price changes (16,636,062) (14,250,420)- Gain on disposal of property, plant and equipment (644,182) (31,742)- Loss on disposal of assets held for sale 12,134,266 13,287,044- Gain on sale of stores and raw material - net 129,942 393,381- Finance cost 70,244,038 74,186,010
130,230,825 142,596,225
Operating (loss) / profit before working capital changes (214,629,717) 185,834,996
(Increase) / decrease in current assets- Stores and spares 19,705,184 (7,489,732)- Stock in trade 159,896,596 3,100,420- Trade debts 82,656,520 (21,938,535)- Loans and advances 29,839,055 10,062,691- Trade deposits, short term prepayments
and other receivables 951,263 4,825,297- Sales tax refundable 11,778,468 (4,224,450)
(Decrease) / increase in current liabilities- Trade and other payables 650,825 (94,585,663)
305,477,911 (110,249,972)
Cash generated from operations 90,848,194 75,585,024
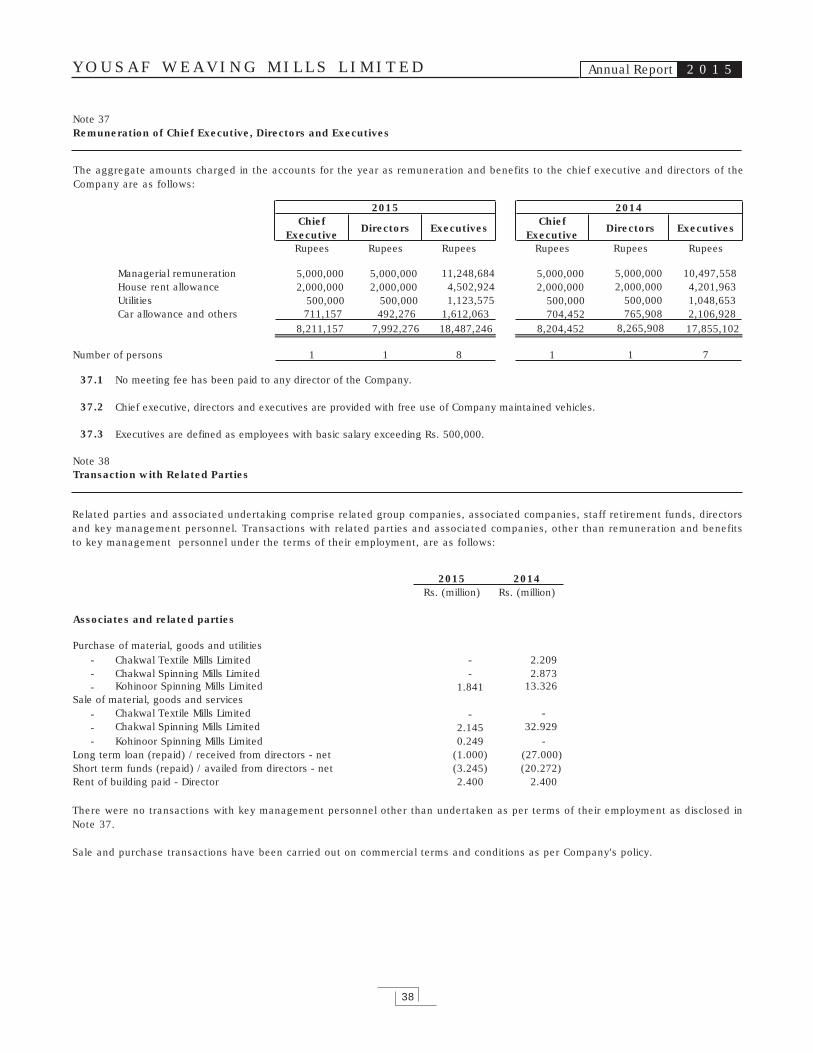
Y O U S A F W E A V I N G M I L L S L I M I T E D Annual Report 2 0 1 5
38
Related parties and associated undertaking comprise related group companies, associated companies, staff retirement funds, directors and key management personnel. Transactions with related parties and associated companies, other than remuneration and benefits to key management personnel under the terms of their employment, are as follows:
The aggregate amounts charged in the accounts for the year as remuneration and benefits to the chief executive and directors of the Company are as follows:
Note 37Remuneration of Chief Executive, Directors and Executives
Rupees Rupees Rupees Rupees Rupees
Managerial remuneration 5,000,000 5,000,000 5,000,000 10,497,558House rent allowance 2,000,000 2,000,000 2,000,000 4,201,963Utilities 500,000 500,000 500,000 1,048,653Car allowance and others 711,157 492,276 1,612,063 704,452 2,106,928
8,211,157 7,992,276 18,487,246 8,204,452 17,855,102
Number of persons 1 1 8 1 7
37.1 No meeting fee has been paid to any director of the Company.
37.2
37.3
Note 38Transaction with Related Parties
2014Rs. (million)
Associates and related parties
Purchase of material, goods and utilities- Chakwal Textile Mills Limited 2.209- Chakwal Spinning Mills Limited 2.873- Kohinoor Spinning Mills Limited 13.326
Sale of material, goods and services- Chakwal Textile Mills Limited -- Chakwal Spinning Mills Limited 32.929- Kohinoor Spinning Mills Limited -
Long term loan (repaid) / received from directors - net (27.000)Short term funds (repaid) / availed from directors - net (20.272)Rent of building paid - Director 2.400
2015 2014Chief
ExecutiveDirectors Executives
ChiefExecutive
Directors Executives
Rupees
5,000,0002,000,000
Rs. (million)
4,502,9241,123,575
765,908500,000
11,248,684
-
8,265,908
1
Chief executive, directors and executives are provided with free use of Company maintained vehicles.
Executives are defined as employees with basic salary exceeding Rs. 500,000.
2015
(1.000)(3.245)2.400
0.2492.145
-1.841
-
There were no transactions with key management personnel other than undertaken as per terms of their employment as disclosed in Note 37.
Sale and purchase transactions have been carried out on commercial terms and conditions as per Company's policy.
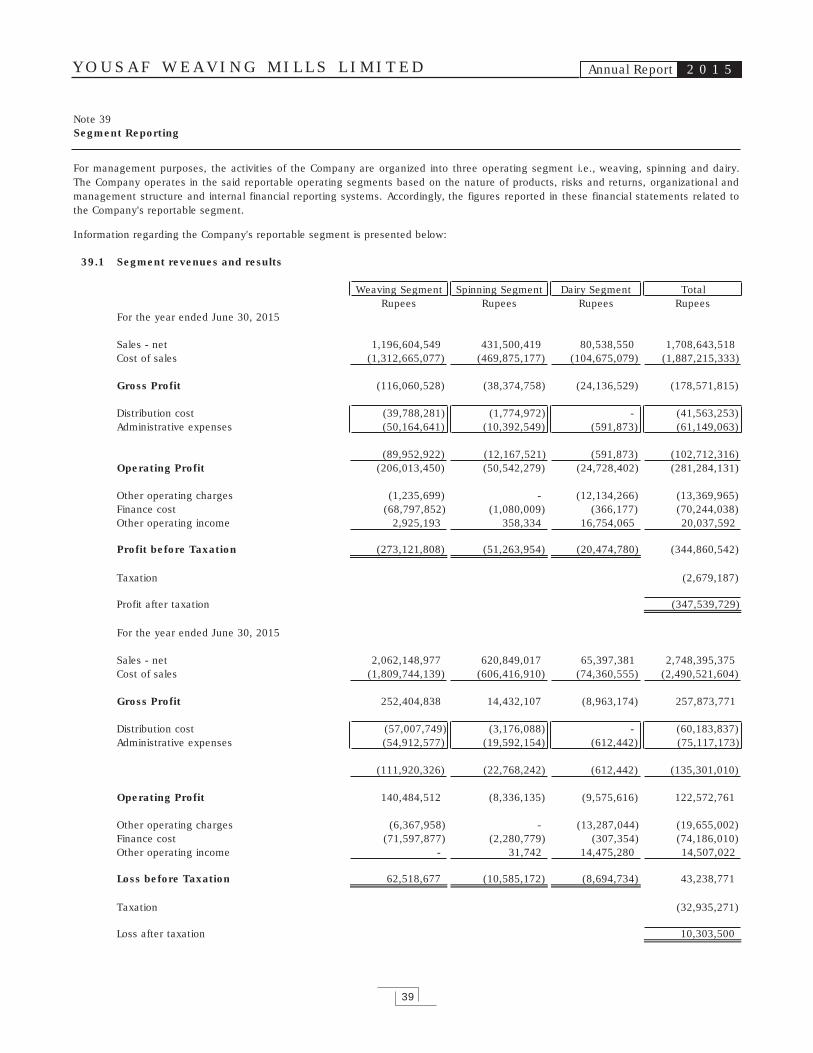
Y O U S A F W E A V I N G M I L L S L I M I T E D Annual Report 2 0 1 5
39
Note 39Segment Reporting
Information regarding the Company's reportable segment is presented below:
39.1 Segment revenues and results
Weaving Segment Spinning Segment Dairy Segment TotalRupees Rupees Rupees Rupees
For the year ended June 30, 2015
Sales - net 1,196,604,549 431,500,419 80,538,550 1,708,643,518Cost of sales (1,312,665,077) (469,875,177) (104,675,079) (1,887,215,333)
Gross Profit (116,060,528) (38,374,758) (24,136,529) (178,571,815)
Distribution cost (39,788,281) (1,774,972) - (41,563,253)Administrative expenses (50,164,641) (10,392,549) (591,873) (61,149,063)
(89,952,922) (12,167,521) (591,873) (102,712,316)Operating Profit (206,013,450) (50,542,279) (24,728,402) (281,284,131)
Other operating charges (1,235,699) - (12,134,266) (13,369,965)Finance cost (68,797,852) (1,080,009) (366,177) (70,244,038)Other operating income 2,925,193 358,334 16,754,065 20,037,592
Profit before Taxation (273,121,808) (51,263,954) (20,474,780) (344,860,542)
Taxation (2,679,187)
Profit after taxation (347,539,729)
For the year ended June 30, 2015
Sales - net 2,062,148,977 620,849,017 65,397,381 2,748,395,375Cost of sales (1,809,744,139) (606,416,910) (74,360,555) (2,490,521,604)
Gross Profit 252,404,838 14,432,107 (8,963,174) 257,873,771
Distribution cost (57,007,749) (3,176,088) - (60,183,837)Administrative expenses (54,912,577) (19,592,154) (612,442) (75,117,173)
(111,920,326) (22,768,242) (612,442) (135,301,010)
Operating Profit 140,484,512 (8,336,135) (9,575,616) 122,572,761
Other operating charges (6,367,958) - (13,287,044) (19,655,002)Finance cost (71,597,877) (2,280,779) (307,354) (74,186,010)Other operating income - 31,742 14,475,280 14,507,022
Loss before Taxation 62,518,677 (10,585,172) (8,694,734) 43,238,771
Taxation (32,935,271)
Loss after taxation 10,303,500
For management purposes, the activities of the Company are organized into three operating segment i.e., weaving, spinning and dairy.The Company operates in the said reportable operating segments based on the nature of products, risks and returns, organizational andmanagement structure and internal financial reporting systems. Accordingly, the figures reported in these financial statements related tothe Company's reportable segment.

Y O U S A F W E A V I N G M I L L S L I M I T E D Annual Report 2 0 1 5
40
Note 39 - Segment Reporting ... Contd.
39.1.1
39.1.2
39.2 Entity-wide disclosures regarding single reportable segment are as follows:
- Information about products
One product of the weaving segment comprises 3.62% (2014: 4.97%) of total sales for the year.
One product of the spinning segment comprises 35.59% (2014: 44.68%) of total sales for the year.
- Information about major customers
One customer of the weaving segment accounts for 25.96% (2014: 15.44%) of total sales for the year.
One customer of the spinning segment accounts for 28.84% (2014: 38.20%) of total sales for the year.
One customer of the dairy segment accounts for 95.47% (2014: 99.68%) of total sales for the year.
- Information about geographical area2015 2014
Rupees Rupees
Local sale 1,229,207,366 1,696,173,415Export sale 532,824,840 1,128,303,833
1,762,032,206 2,824,477,248
- All non-current assets of the Company are located in Pakistan as at reporting date.
39.3 Segment assets and liabilities
Reportable segments' assets and liabilities are reconciled to total assets and liabilities as follows:
Weaving Segment Spinning Segment Dairy Segment TotalRupees Rupees Rupees Rupees
As at June 30, 2015
Segment assets for reportable segments 901,125,033 151,066,188 244,578,438 1,296,769,659Unallocated assets 46,684,360Total assets as per balance sheet 1,343,454,019
Segment liabilities for reportable segments 1,387,515,707 46,265,165 94,524,056 1,528,304,928Unallocated liabilities 17,337,676Total liabilities as per balance sheet 1,545,642,604
As at June 30, 2014
Segment assets for reportable segments 1,205,631,840 151,066,188 244,578,438 1,601,276,466Unallocated assets 76,550,897Total assets as per balance sheet 1,677,827,363
Segment liabilities for reportable segments 1,362,472,375 46,265,165 94,524,056 1,503,261,596Unallocated liabilities 28,104,801Total liabilities as per balance sheet 1,531,366,397
Revenue reported above represents revenue generated from external customers. Inter-segment sales during the year isRs. 2.949 million (2014 : Nil)
The accounting policies of the reportable segments are the same as the Company’s accounting policies described in note 3 to thefinancial statements.
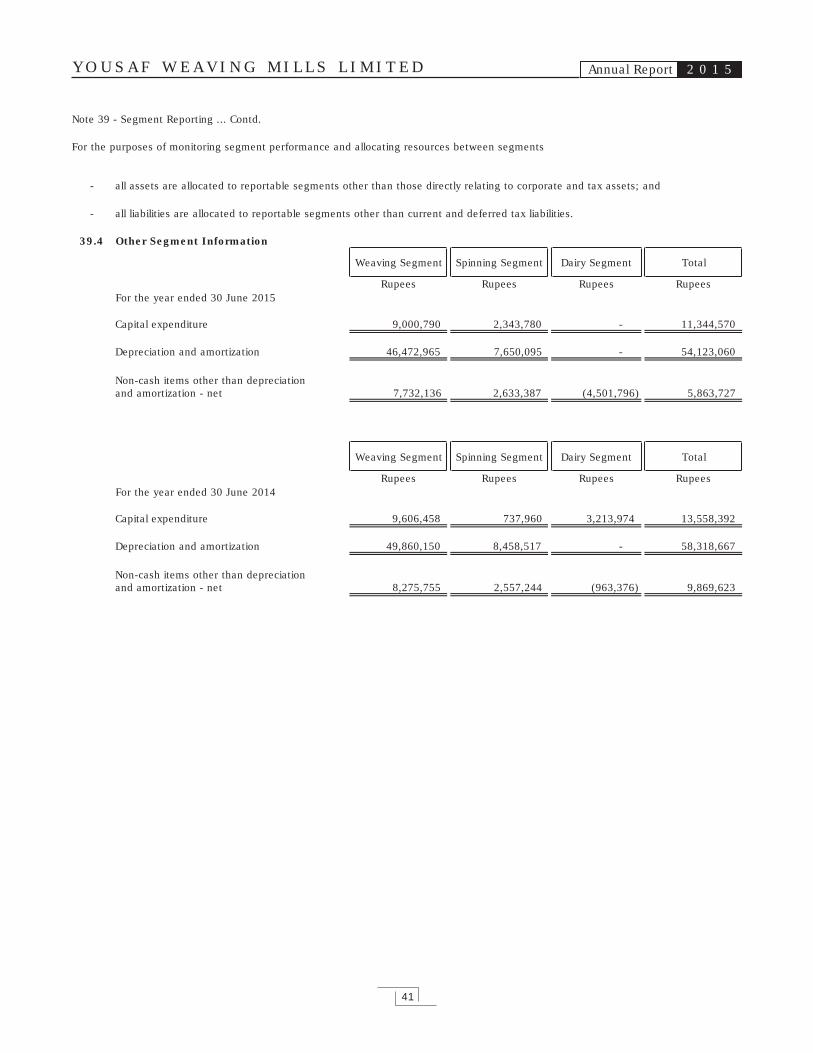
Y O U S A F W E A V I N G M I L L S L I M I T E D Annual Report 2 0 1 5
41
Note 39 - Segment Reporting ... Contd.
For the purposes of monitoring segment performance and allocating resources between segments
- all assets are allocated to reportable segments other than those directly relating to corporate and tax assets; and
- all liabilities are allocated to reportable segments other than current and deferred tax liabilities.
39.4 Other Segment Information
Weaving Segment Spinning Segment Dairy Segment Total
Rupees Rupees Rupees RupeesFor the year ended 30 June 2015
Capital expenditure 9,000,790 2,343,780 - 11,344,570
Depreciation and amortization 46,472,965 7,650,095 - 54,123,060
Non-cash items other than depreciationand amortization - net 7,732,136 2,633,387 (4,501,796) 5,863,727
Weaving Segment Spinning Segment Dairy Segment Total
Rupees Rupees Rupees RupeesFor the year ended 30 June 2014
Capital expenditure 9,606,458 737,960 3,213,974 13,558,392
Depreciation and amortization 49,860,150 8,458,517 - 58,318,667
Non-cash items other than depreciationand amortization - net 8,275,755 2,557,244 (963,376) 9,869,623
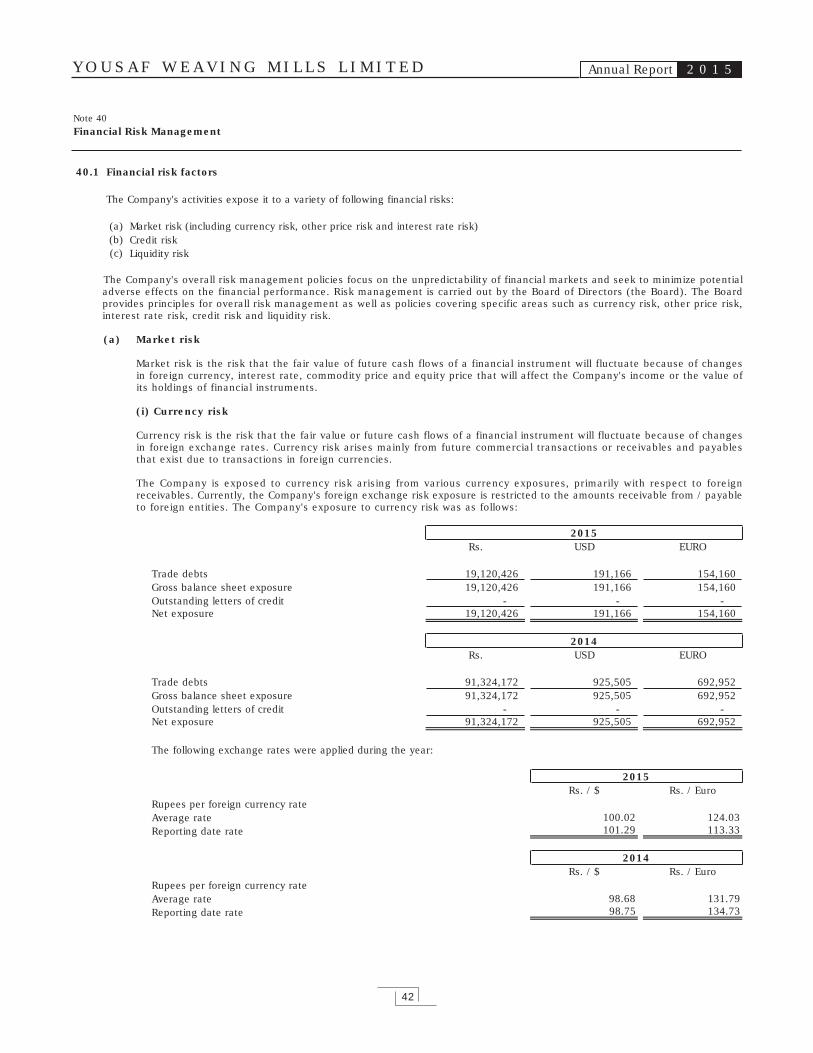
Y O U S A F W E A V I N G M I L L S L I M I T E D Annual Report 2 0 1 5
42
Note 40Financial Risk Management
40.1 Financial risk factors
(a) Market risk (including currency risk, other price risk and interest rate risk)(b)(c)
The Company's activities expose it to a variety of following financial risks:
Credit riskLiquidity risk
The Company's overall risk management policies focus on the unpredictability of financial markets and seek to minimize potential adverse effects on the financial performance. Risk management is carried out by the Board of Directors (the Board). The Board provides principles for overall risk management as well as policies covering specific areas such as currency risk, other price risk, interest rate risk, credit risk and liquidity risk.
(a) Market risk
Market risk is the risk that the fair value of future cash flows of a financial instrument will fluctuate because of changes in foreign currency, interest rate, commodity price and equity price that will affect the Company's income or the value of its holdings of financial instruments.
(i) Currency risk
Currency risk is the risk that the fair value or future cash flows of a financial instrument will fluctuate because of changes in foreign exchange rates. Currency risk arises mainly from future commercial transactions or receivables and payables that exist due to transactions in foreign currencies.
The Company is exposed to currency risk arising from various currency exposures, primarily with respect to foreign receivables. Currently, the Company's foreign exchange risk exposure is restricted to the amounts receivable from / payable to foreign entities. The Company's exposure to currency risk was as follows:
Rs. USD EURO
19,120,426 191,166 154,16019,120,426 191,166 154,160
- - -19,120,426 191,166 154,160
Rs. USD EURO
91,324,172 925,505 692,95291,324,172 925,505 692,952
- - -91,324,172 925,505 692,952
Rs. / $ Rs. / Euro
100.02 124.03101.29 113.33
Rs. / $ Rs. / Euro
98.68 131.7998.75 134.73
2015
2014
Trade debtsGross balance sheet exposureOutstanding letters of creditNet exposure
Trade debtsGross balance sheet exposureOutstanding letters of creditNet exposure
Rupees per foreign currency rateAverage rateReporting date rate
Rupees per foreign currency rateAverage rateReporting date rate
The following exchange rates were applied during the year:
2015
2014
Y O U S A F W E A V I N G M I L L S L I M I T E D Annual Report 2 0 1 5
43
Sensitivity analysis
If the functional currency, at reporting date, had weakened / strengthened by 5% against the foreign currencies with all other variables held constant, the impact on profit before taxation for the year would have been Rs. 0.956 million (2014: Rs. 4.566 million) respectively higher / lower, mainly as a result of exchange gains / losses on translation of foreign exchange denominated financial instruments. In management's opinion, the sensitivity analysis is unrepresentative of inherent currency risk as the year end exposure does not reflect the exposure during the year.
(ii) Other price risk
Other price risk represents the risk that the fair value or future cash flows of a financial instrument will fluctuate because of changes in market prices (other than those arising from interest rate risk or currency risk), whether those changes are caused by factors specific to the individual financial instrument or its issuer, or factors affecting all similar financial instrument traded in the market. The Company is not exposed to equity and commodity price risk.
(iii) Interest rate risk
This represents the risk that the fair value or future cash flows of a financial instrument will fluctuate because of changes in market interest rates.
The Company has no significant long-term interest-bearing assets. The Company's interest rate risk arises from long term financing and short term borrowings. As the borrowings are obtained at variable rates, these expose the Company to cash flow interest rate risk.
At the balance sheet date the interest rate profile of the Company’s interest bearing financial instruments was as follows:
Note 40 - Financial Risk Management ... Contd.
2015 2014Rupees Rupees
Floating rate instruments
Financial liabilities
Long term financing 30,525,000 41,625,000Liabilities against assets subject to finance lease 15,750,423 15,343,856Short term borrowings 390,962,583 425,972,338
Financial assets
Bank balances - saving accounts - -
Cash flow sensitivity analysis for variable rate instruments
If interest rates at the balance sheet date, fluctuate by 1% higher / lower with all other variables held constant, (loss) / profit before taxation for the year would have been Rs. 4.372 million (2014: Rs. 4.829 million) lower / higher, mainly as a result of higher / lower interest expense on floating rate borrowings. This analysis is prepared assuming the amounts of liabilities outstanding at balance sheet dates were outstanding for the whole year.
Y O U S A F W E A V I N G M I L L S L I M I T E D Annual Report 2 0 1 5
44
(b) Credit risk
Credit risk represents the risk that one party to a financial instrument will cause a financial loss for the other party by failing to discharge an obligation. Carrying amounts of financial assets represent the maximum credit exposure. The maximum exposure to credit risk at the reporting date was as follows:
Note 40 - Financial Risk Management ... Contd.
2015 2014Rupees Rupees
Long term loans 13,813,565 17,825,702Long term deposits 2,861,743 2,738,503Trade debts 30,281,900 112,938,420Loan and advances 1,080,600 1,820,487Trade deposits, short term prepayments and other receivables 9,108,840 9,795,756Bank balances 18,779,816 645,155
The aging of trade debts at balance sheet date is as follows:2015 2014
Rupees Rupees
Current 1,157,230 17,001,2911 - 30 days 10,866,690 47,712,87131 - 60 days 2,939,039 22,554,01061 - 120 days 5,875,502 12,374,143120 days and above 9,506,743 13,296,105
30,281,900 112,938,420
The credit risk on liquid funds is limited because the counter parties are banks with reasonably high credit ratings. The Company believes that it is not exposed to major concentration of credit risk as its exposure is spread over a large number of counter parties and trade debts are subject to specific credit ceilings.
The credit quality of bank balances that are neither past due nor impaired can be assessed by reference to external credit ratings (if available) or to historical information about counter party default rate:
Long Term
Allied Bank Limited PACRA A1+ AA+Askari Bank Limited PACRA A1+ AABank Alfalah Limited PACRA A1+ AAFaysal Bank Limited PACRA A1+ AAHabib Metropolitan Bank Limited PACRA A1+ AA+Meezan Bank Limited JCR - VIS A1+ AAMCB Bank Limited PACRA A1+ AAANIB Bank Limited PACRA A1+ AA-National Bank of Pakistan JCR - VIS A1+ AAAUnited Bank Limited JCR - VIS A1+ AA+Summit Bank JCR - VIS A -1 AAl-Baraka Bank (Pakistan) Limited PACRA A1 ABank Of Punjab PACRA A1+ AA-Bank Al Habib Limited PACRA A1+ AA+Habib Bank Limited JCR - VIS A1+ AAA
AgencyRating
Short Term
Due to company's long standing business relationship with these counterparties and after giving due consideration to their strong financial standing, management does not expect non-performance by these counter parties on their obligation to the company. Accordingly, the credit risk is minimal.
Y O U S A F W E A V I N G M I L L S L I M I T E D Annual Report 2 0 1 5
45
Carrying Amount On DemandContractual cash
flowsWithin 1 Year 1-2 Years 2-5 Years
Rupees Rupees Rupees Rupees Rupees Rupees
Long term finances 30,525,000 - 30,525,000 11,100,000 11,100,000 8,325,000Liabilities against leased assets 15,750,423 - 12,858,891 5,084,966 4,236,984 3,536,941Trade and other payables 473,376,043 - 473,376,043 473,376,043 - -Accrued mark up 15,041,434 - 15,041,434 15,041,434 - -Short term borrowings 390,962,583 390,962,583 - - - -
925,655,483 390,962,583 531,801,368 504,602,443 15,336,984 11,861,941
Contractual maturities of financial liabilities as at June 30, 2014:
Carrying Amount On DemandContractual cash
flowsWithin 1 Year 1-2 Years 2-5 Years
Rupees Rupees Rupees Rupees Rupees Rupees
Long term finances 41,625,000 - 41,625,000 11,100,000 11,100,000 19,425,000Liabilities against leased assets 15,343,856 - 12,526,741 4,459,088 3,713,038 4,354,615Trade and other payables 454,618,306 - 454,618,306 454,618,306 - -Accrued mark up 12,452,814 - 12,452,814 12,452,814 - -Short term borrowings 425,972,338 425,972,338 - - - -
950,012,314 425,972,338 521,222,861 482,630,208 14,813,038 23,779,615
Description
Description
2015 2014Rupees Rupees
Total borrowings 490,649,231 470,986,396Cash and bank balances (20,513,379) (1,243,765)Net Debt 470,135,852 469,742,631
Equity (202,188,585) 146,460,966
Total Capital Employed 267,947,267 616,203,597
Gearing Ratio 175.46% 76.23%
Note 40 - Financial Risk Management ... Contd.
(c) Liquidity risk
Liquidity risk is the risk that an entity will encounter difficulty in meeting obligations associated with financial liabilities. The Company manages liquidity risk by maintaining sufficient cash and the availability of funding through an adequate amount of committed credit facilities. As at the balance sheet date, the Company had Rs. 958.755 million (2014: Rs. 992.7 million) worth short term borrowing limits available from financial institutions and Rs. 20.513 million (2014: Rs. 1.244 million) cash and bank balances. Following are the contractual maturities of financial liabilities, including interest payments.
Contractual maturities of financial liabilities as at June 30, 2015:
The contractual cash flows relating to the above financial liabilities have been determined on the basis of interest rates / mark up rates effective as at 30 June. The rates of interest / mark up have been disclosed in Note 7 and Note 12 to these financial statements.
40.2 Fair values of financial assets and liabilities
The carrying values of all financial assets and liabilities reflected in financial statements approximate their fair values. Fair value is determined on the basis of objective evidence at each reporting date.
Note 41Capital Risk Management
While managing capital, the objectives of the Company are to ensure that it continues to meet the going concern assumption, enhance shareholders' wealth and meets stakeholders' expectations. The Company ensures its sustainable growth viz. maintaining optimal capital structure, keeping its finance cost low, exercising the option of issuing right shares or repurchase shares, if possible, selling surplus property, plant and equipment without affecting the optimal operating level, and regulate its dividend payout thus maintaining smooth capital management.
In line with others in the industry, the Company monitors capital on the basis of the gearing ratio. This ratio is calculated as net debt divided by total capital. Net debt is calculated as total borrowings (including current and non current) less cash and cash equivalents. Total capital is calculated as equity as shown in the balance sheet plus net debt.
As on the balance sheet date, the gearing ratio of the Company was as under:
46
Y O U S A F W E A V I N G M I L L S L I M I T E D Annual Report 2 0 1 5
Note 42Plant Capacity and Production
2015 2014
Number of looms installed 153 153
Installed capacity converted into 50 picks based on 364 days(Sq. Meters approximately) 73,673,861 73,673,861
Actual production convertedinto 50 picks - (Sq. Meters) 38,894,419 50,124,875
Number of spindles installed 15,936 15,936
Installed capacity in 20's count(Kgs) - approximately 7,848,991 7,848,991
Actual production after conversion into 20's count (Kgs) 2,055,776 3,660,834
Number of animals 608 498
42.1
Note 43Number of Employees
2015 2014
Number of Employees 871 1,059
Note 44Adjusting Event after Balance Sheet Date
Rs. '000
FATR 44,895FAPC 20,000
Note 45General
45.1
45.2
Reclassification
These financial statements were authorized for issue on March 22, 2016 by the Board of Directors of the Company.
The Bank of Punjab on July 03, 2015, restructure the outstanding short term borrowing of FATR & FAPC into long term loan.
These financial statements reflect the said reclassification in the year ending June 30, 2016 as below;
Under utilization of installed capacities is mainly due to non availability of power.
The figures have been rounded off to the nearest rupee.
From To
Short Term Borrowing Long Term FinancingShort Term Borrowing Long Term Financing
Lahore
March 22, 2016
(Khawaja Mohammad Nadeem)
Chief Executive
(Mohammad Naveed)
Director
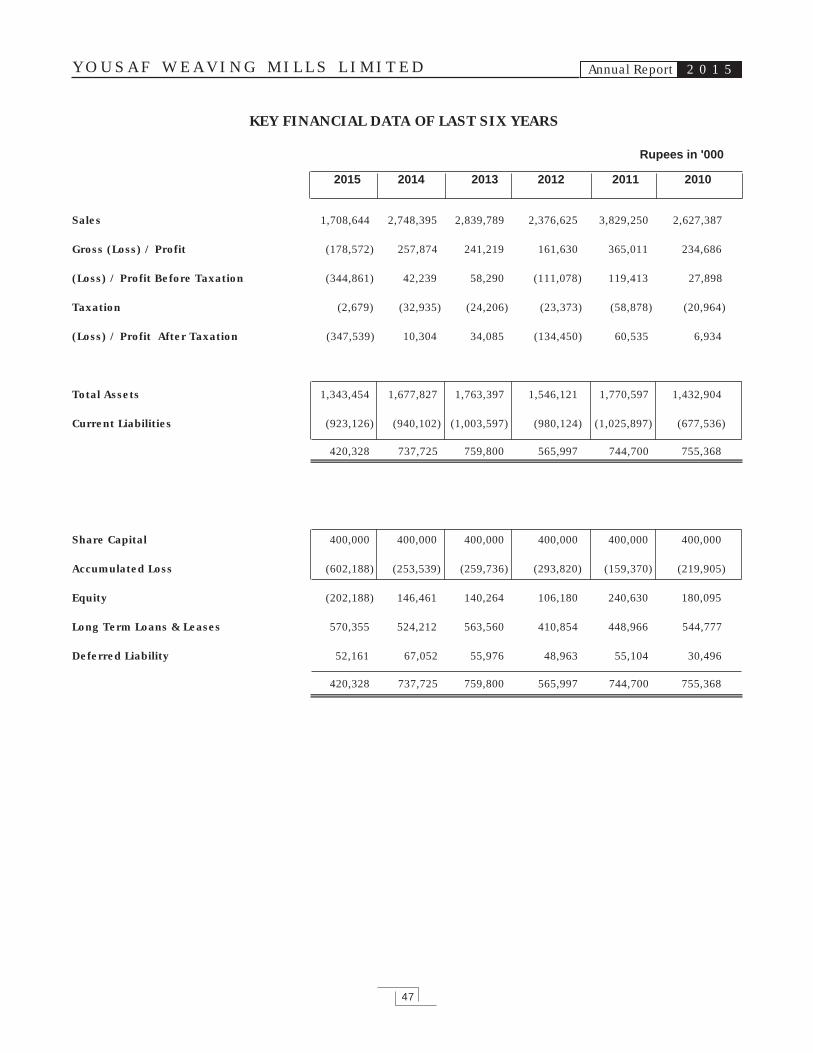
Y O U S A F W E A V I N G M I L L S L I M I T E D Annual Report 2 0 1 5
47
KEY FINANCIAL DATA OF LAST SIX YEARS
Rupees in '000
2014 2013 2012 2011 2010
Sales
Gross (Loss) / Profit
(Loss) / Profit Before Taxation
Taxation
(Loss) / Profit After Taxation
Total Assets
Current Liabilities
Share Capital
Accumulated Loss
Equity
Long Term Loans & Leases
Deferred Liability
2,748,395
257,874
42,239
(32,935)
10,304
1,677,827
(940,102)
737,725
400,000
(253,539)
146,461
524,212
67,052
737,725
2,839,789
241,219
58,290
(24,206)
34,085
1,763,397
(1,003,597)
759,800
400,000
(259,736)
140,264
563,560
55,976
759,800
2,376,625
161,630
(111,078)
(23,373)
(134,450)
1,546,121
(980,124)
565,997
400,000
(293,820)
106,180
410,854
48,963
565,997
3,829,250
365,011
119,413
(58,878)
60,535
1,770,597
(1,025,897)
744,700
400,000
(159,370)
240,630
448,966
55,104
744,700
2,627,387
234,686
27,898
(20,964)
6,934
1,432,904
(677,536)
755,368
400,000
(219,905)
180,095
544,777
30,496
755,368
2015
1,708,644
(178,572)
(344,861)
(2,679)
(347,539)
1,343,454
(923,126)
420,328
400,000
(602,188)
(202,188)
570,355
52,161
420,328
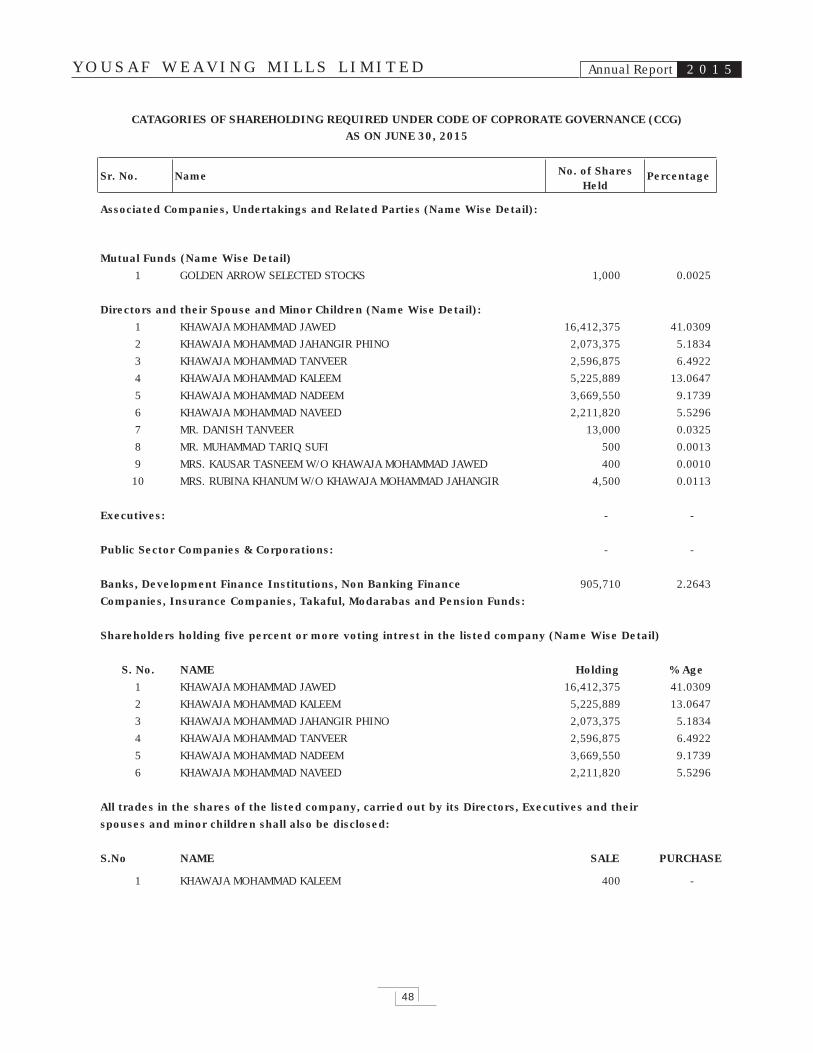
CATAGORIES OF SHAREHOLDING REQUIRED UNDER CODE OF COPRORATE GOVERNANCE (CCG)AS ON JUNE 30, 2015
Sr. No. Name No. of SharesHeld
Percentage
Associated Companies, Undertakings and Related Parties (Name Wise Detail):
Y O U S A F W E A V I N G M I L L S L I M I T E D Annual Report 2 0 1 5
48
Mutual Funds (Name Wise Detail)
1 GOLDEN ARROW SELECTED STOCKS 1,000 0.0025
Directors and their Spouse and Minor Children (Name Wise Detail):
1 KHAWAJA MOHAMMAD JAWED 16,412,375 41.0309
2 KHAWAJA MOHAMMAD JAHANGIR PHINO 2,073,375 5.1834
3 KHAWAJA MOHAMMAD TANVEER 2,596,875 6.4922
4 KHAWAJA MOHAMMAD KALEEM 5,225,889 13.0647
5 KHAWAJA MOHAMMAD NADEEM 3,669,550 9.1739
6 KHAWAJA MOHAMMAD NAVEED 2,211,820 5.5296
7 MR. DANISH TANVEER 13,000 0.0325
8 MR. MUHAMMAD TARIQ SUFI 500 0.0013
9 MRS. KAUSAR TASNEEM W/O KHAWAJA MOHAMMAD JAWED 400 0.0010
10 MRS. RUBINA KHANUM W/O KHAWAJA MOHAMMAD JAHANGIR 4,500 0.0113
Executives: - -
Public Sector Companies & Corporations: - -
Banks, Development Finance Institutions, Non Banking Finance 905,710 2.2643
Companies, Insurance Companies, Takaful, Modarabas and Pension Funds:
Shareholders holding five percent or more voting intrest in the listed company (Name Wise Detail)
S. No. NAME Holding %Age
1 KHAWAJA MOHAMMAD JAWED 16,412,375 41.0309
2 KHAWAJA MOHAMMAD KALEEM 5,225,889 13.0647
3 KHAWAJA MOHAMMAD JAHANGIR PHINO 2,073,375 5.1834
4 KHAWAJA MOHAMMAD TANVEER 2,596,875 6.4922
5 KHAWAJA MOHAMMAD NADEEM 3,669,550 9.1739
6 KHAWAJA MOHAMMAD NAVEED 2,211,820 5.5296
All trades in the shares of the listed company, carried out by its Directors, Executives and their
spouses and minor children shall also be disclosed:
S.No NAME SALE PURCHASE
1 KHAWAJA MOHAMMAD KALEEM 400 -
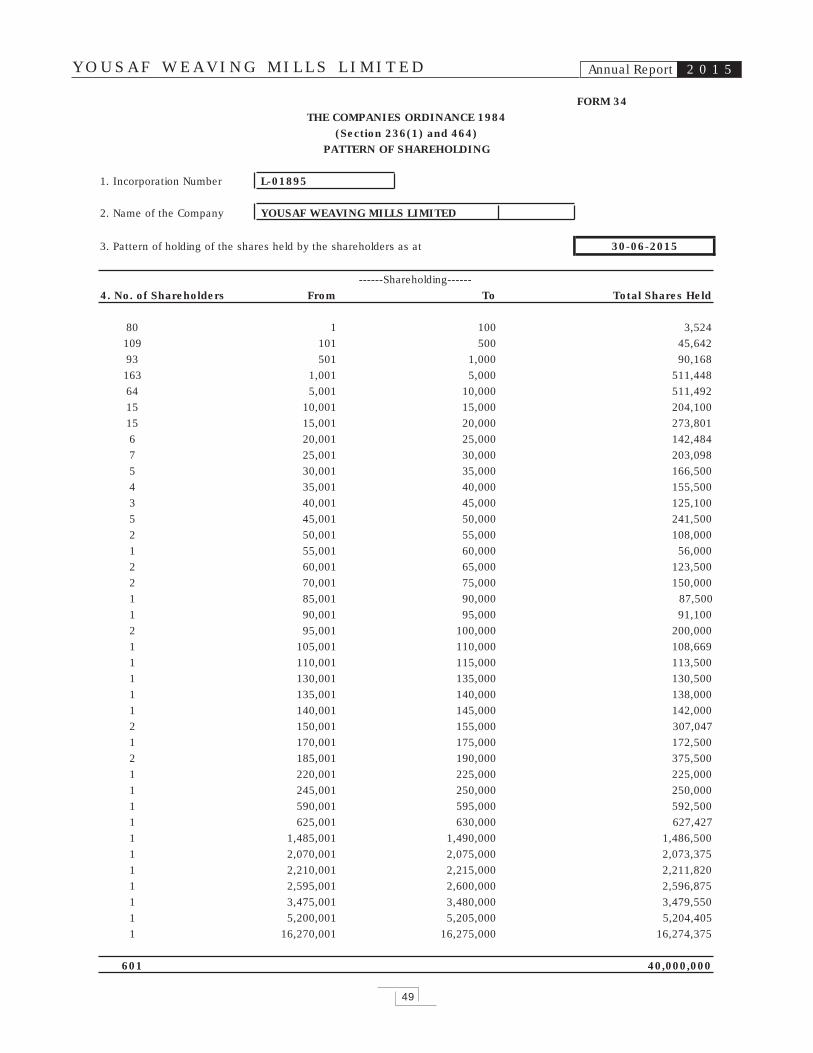
Y O U S A F W E A V I N G M I L L S L I M I T E D Annual Report 2 0 1 5
49
FORM 34THE COMPANIES ORDINANCE 1984
(Section 236(1) and 464)PATTERN OF SHAREHOLDING
1. Incorporation Number L-01895
2. Name of the Company YOUSAF WEAVING MILLS LIMITED
3. Pattern of holding of the shares held by the shareholders as at 30-06-2015
------Shareholding------4. No. of Shareholders From To Total Shares Held
80 1 100 3,524109 101 500 45,64293 501 1,000 90,168163 1,001 5,000 511,44864 5,001 10,000 511,49215 10,001 15,000 204,10015 15,001 20,000 273,8016 20,001 25,000 142,4847 25,001 30,000 203,0985 30,001 35,000 166,5004 35,001 40,000 155,5003 40,001 45,000 125,1005 45,001 50,000 241,5002 50,001 55,000 108,0001 55,001 60,000 56,0002 60,001 65,000 123,5002 70,001 75,000 150,0001 85,001 90,000 87,5001 90,001 95,000 91,1002 95,001 100,000 200,0001 105,001 110,000 108,6691 110,001 115,000 113,5001 130,001 135,000 130,5001 135,001 140,000 138,0001 140,001 145,000 142,0002 150,001 155,000 307,0471 170,001 175,000 172,5002 185,001 190,000 375,5001 220,001 225,000 225,0001 245,001 250,000 250,0001 590,001 595,000 592,5001 625,001 630,000 627,4271 1,485,001 1,490,000 1,486,5001 2,070,001 2,075,000 2,073,3751 2,210,001 2,215,000 2,211,8201 2,595,001 2,600,000 2,596,8751 3,475,001 3,480,000 3,479,5501 5,200,001 5,205,000 5,204,4051 16,270,001 16,275,000 16,274,375
601 40,000,000
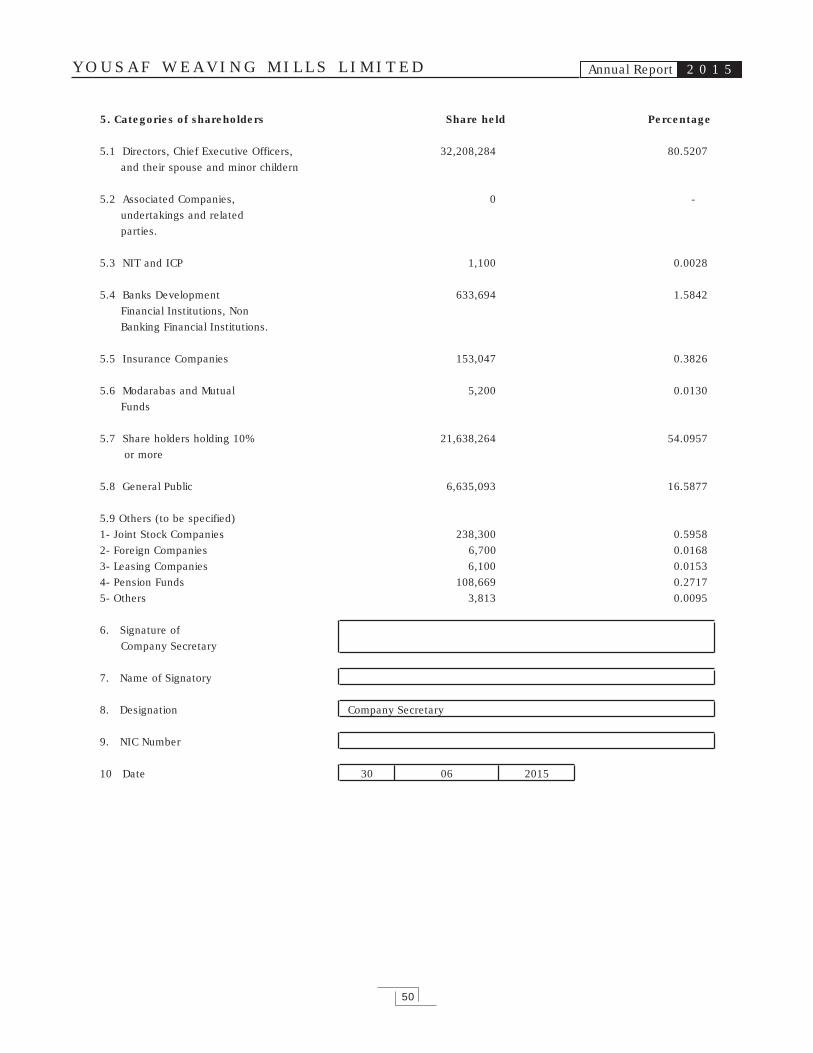
Y O U S A F W E A V I N G M I L L S L I M I T E D Annual Report 2 0 1 5
50
5. Categories of shareholders Share held Percentage
5.1 Directors, Chief Executive Officers, 32,208,284 80.5207 and their spouse and minor childern
5.2 Associated Companies, 0 - undertakings and related parties.
5.3 NIT and ICP 1,100 0.0028
5.4 Banks Development 633,694 1.5842 Financial Institutions, Non Banking Financial Institutions.
5.5 Insurance Companies 153,047 0.3826
5.6 Modarabas and Mutual 5,200 0.0130 Funds
5.7 Share holders holding 10% 21,638,264 54.0957 or more
5.8 General Public 6,635,093 16.5877
5.9 Others (to be specified)1- Joint Stock Companies 238,300 0.59582- Foreign Companies 6,700 0.01683- Leasing Companies 6,100 0.01534- Pension Funds 108,669 0.27175- Others 3,813 0.0095
6. Signature of Company Secretary
7. Name of Signatory
8. Designation Company Secretary
9. NIC Number
10 Date 30 06 2015
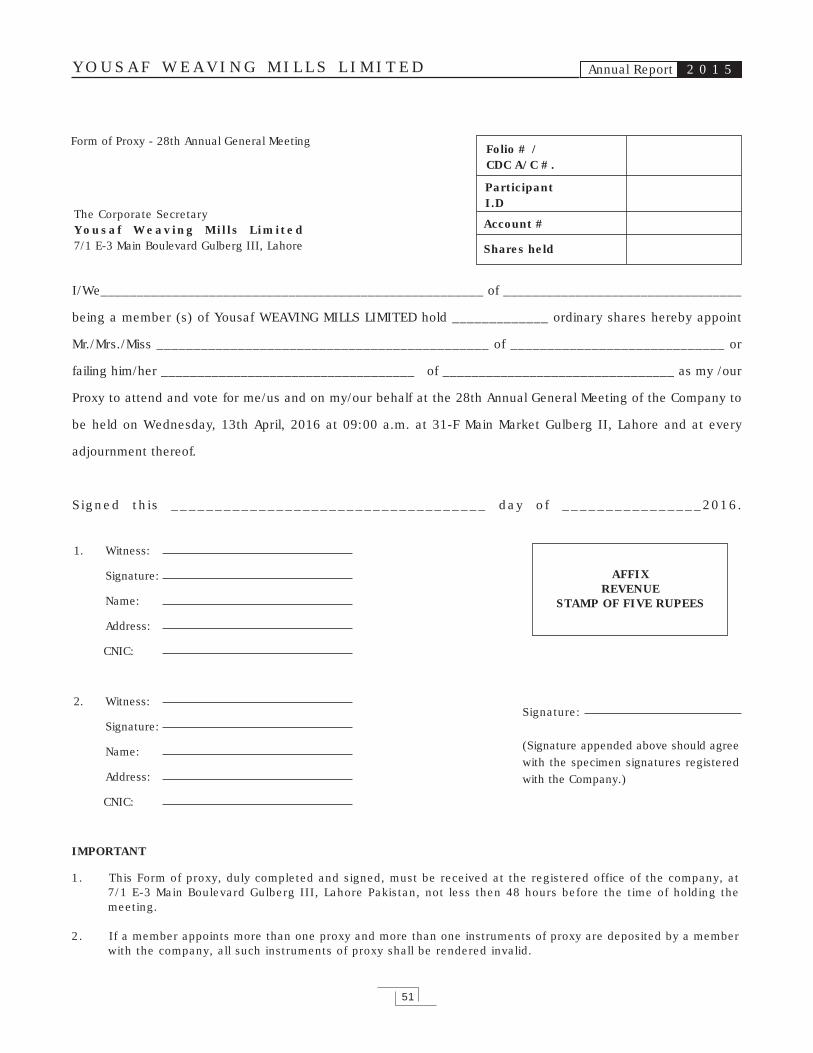
Y O U S A F W E A V I N G M I L L S L I M I T E D Annual Report 2 0 1 5
51
I/We_____________________________________________________ of _________________________________
being a member (s) of Yousaf WEAVING MILLS LIMITED hold _____________ ordinary shares hereby appoint
Mr./Mrs./Miss _____________________________________________ of _____________________________ or
failing him/her ___________________________________ of ________________________________ as my /our
Proxy to attend and vote for me/us and on my/our behalf at the 28th Annual General Meeting of the Company to
be held on Wednesday, 13th April, 2016 at 09:00 a.m. at 31-F Main Market Gulberg II, Lahore and at every
adjournment thereof.
S igned th is ____________________________________ day of ________________2016.
IMPORTANT
1. This Form of proxy, duly completed and signed, must be received at the registered office of the company, at 7/1 E-3 Main Boulevard Gulberg III, Lahore Pakistan, not less then 48 hours before the time of holding the meeting.
2. If a member appoints more than one proxy and more than one instruments of proxy are deposited by a member with the company, all such instruments of proxy shall be rendered invalid.
Form of Proxy - 28th Annual General Meeting
The Corporate Secretary Yousaf Weaving Mi l ls L imited7/1 E-3 Main Boulevard Gulberg III, Lahore
AFFIXREVENUE
STAMP OF FIVE RUPEES
1. Witness:
Signature:
Name:
Address:
CNIC:
2. Witness:
Signature:
Name:
Address:
CNIC:
Signature:
(Signature appended above should agreewith the specimen signatures registered with the Company.)
Account #
Shares held
ParticipantI.D
Folio # /CDC A/C #.