your wealth & life - ubs · your wealth & life. ... in fact, it’s not unusual for a...
TRANSCRIPT

ab
Personal strategies for wealth managementCIO Wealth Management Research
Valuing your human capital
Your Wealth & Life

2 September 2015 Your Wealth & Life
Contents01 Editorial
02 Valuing your human capital
10 Interview: David McWilliams speaks with Chip Castille
13 Case studies
14 Case study 1: Shifting gears
15 Case study 2: A winning playbook
16 Case study 3: Two brothers, two approaches
17 Appendix
20 Disclaimer
21 Publication details
This report has been prepared by UBS Financial Services Inc. (“UBS FS”). Please see important disclaimers and disclosures at the end of this report.This report was published on 9 September 2015.
Your Wealth & Life September 2015 1
Dear readers,One of Nobel Prize winner Gary Becker’s greatest con-tributions to economics was his study of how an indi-vidual’s investment in education and training is similar to business investment in equipment and employee devel-opment. The simple and underappreciated conclusion: Your most important asset is yourself. Yet, perhaps no asset is more overlooked by individuals and households in terms of its importance when managing wealth than human capital.
We continue our total wealth approach this quarter with an in-depth look at how this intangible asset – human capital – impacts financial decisions over the life cycle. Some people have safe human capital, others have vola-tile human capital, and yet others might have human capital that is correlated with financial assets. All of these possibilities affect personal balance sheets, and therefore the choices we make, in different ways.
As always, we hope the material presented here helps you to make better-informed investment decisions. For those using our goals-based wealth management approach, the content presented pertains specifically to allocating the Longevity portfolio.
Michael Crook, CAIA
Mike Ryan, CFA
Mike Ryan, CFAChief Investment Strategist, WMA
Regional CIO, Wealth Management US
Michael Crook, CAIAHead of Portfolio & Planning Research
CIO, Wealth Management US

2 September 2015 Your Wealth & Life
When the 2012 NFL draft com-menced at Radio City Music Hall directly across the street
from our midtown Manhattan offices, several of us – like many other fans and talking heads – were focused on the strength of the quarterback class.
Two of those draft picks, Robert Grif-fin III and Russell Wilson, are particularly interesting in retrospect. Griffin was selected as the second overall pick in the draft, whereas Wilson was selected as the 75th overall pick. Griffin signed a four-year $21mn rookie contract with the Redskins while Wilson signed a three-year $3mn contract with the Seahawks. At the time, Griffin’s earnings potential – or human capital – was much greater than Wilson’s, based on his per-ceived talent on the field.
Fast forward three seasons and the out-look for the quarterbacks has changed dramatically. Since earning the NFL’s
Offensive Rookie of the Year award in 2012, Griffin has been sidelined by inju-ries and inconsistent performance for much of the last two seasons. He will likely not be Washington’s starting quar-terback in 2015. Wilson, on the other hand, has led his team to the playoffs in all three seasons, including one Super Bowl win. Despite being drafted 73 picks after Griffin, Wilson now has a much greater and more certain human capital than Griffin (see Fig. 1).
What is human capital?Most of us are not professional athletes. Nevertheless, human capital plays an equally important role in our financial lives. When a 21- or 22-year-old gradu-ates from college, she (and it’s more likely to be she now than he) typically doesn’t have much financial wealth. In fact, it’s not unusual for a graduate to have a neg-ative net worth on paper due to student loans and other costs of education.
Michael Crook, CAIA, and Andrea Fisher, CFA
Valuing your human capital

Your Wealth & Life September 2015 3
However, a more holistic view of the graduate’s balance sheet would find that she is actually quite well-off. Why? The knowledge gained while in school will pay dividends throughout her life in the form of higher wages and increased life-time earnings. This human capital, which is broadly defined as the attributes that enable someone to produce economic value through his or her labor, includes knowledge, skills, training, creativity, and judgment, among other traits.
Graduating from high school, college, and graduate school all typically lead to increases in human capital – even after accounting for tuition and opportunity costs (see Fig. 2). According to a study by the Federal Reserve Bank of San Fran-cisco, college graduates can expect to earn $800,000 more than non-college graduates over their lifetimes.1
The choice of major also matters. The Federal Reserve Bank of New York looked at returns on college degrees by major and found that an engineering degree typically offers a return of 21% above the cost of attendance, whereas
a social sciences degree had an average return of 15% (see Fig. 3). In addition to their education, individuals can impact the value of their human capital in a multitude of ways, including through networking, selecting to enter specific industries or professions, maintaining and improving their skill base, and by working more or less.
There are two important wealth man-agement aspects of human capital:
• First, we must protect and grow our human capital.
• Second, the impact of human capital on our balance sheets is large enough to impact our ideal asset allocation.
We explore both of these topics in the remainder of this publication.
Source: Spotrac.com, UBS
20
15
10
5
0
25
2012 2016 2017 20182014 20152013
Fig. 1: The tables have turned since rookie year
R. Wilson’s and R. Griffin III's estimated earnings, in millions of dollars
2019
Griffin III
Wilson
Projections based on current contract
Human capital is broadly defined
as the attributes that enable someone
to produce economic value
Source: Reproduced with permission from Jaison R. Abel and Richard Deitz, “Do the Benefits of College Still Outweigh the Costs?” Federal Reserve Bank of New York, Current Issues in Economics and Finance, vol. 20, no. 3 (2014), available at http://www.newyorkfed.org/research/current_issues/ci20-3.html, UBS.
Associate’s ROR
Bachelor’s ROR
16
12
0
4
8
20
1970 1977 1984 1991 1998 2005 2012
Fig. 2: College is still worth the cost
Rate of return (ROR), in %

4 September 2015 Your Wealth & Life
The investment impactWhy is the conventional wisdom that younger investors should hold signifi-cantly more in stocks than older inves-tors? Two reasons are frequently given: first, time horizon; and second, less com-monly, the presence of labor income.
Time horizon plays a role, but the real-ity is that a 60-year time horizon for a 40-year-old isn’t all that different from a 35-year time horizon for a 65-year-old. Both time horizons are long enough to provide a fairly high confidence in equi-ties outperforming bonds for the entirety of the period. In fact, holding everything else constant, shifting from a 10-year horizon to a 30-year horizon would only add one to two percentage points of equity to most investors’ allocations.2 So clearly time horizon alone doesn’t explain the large shift into equities.
Labor income is the main reason we advise younger investors to hold more in stocks. A commonly used metaphor is that human capital is similar to a bond in that you receive a recurring stream of income in exchange for your labor output. More specifically, human capi-tal would either be a series of coupon payments or perhaps a term annuity, but the exact analogy isn’t important. What is important is that a worker has a large asset on his or her balance sheet that has some of the characteristics of a bond and should be accounted for in asset allocation decisions.
Over the course of our lifetimes, human capital typically shifts from the dominant asset on our balance sheet to a de mini-mis position (see Fig. 4). It is this shift that results in the “glide path” of declin-ing equity exposure (discussed in greater
Note: Percentage return based on the cost of the degree. The total cost includes the out-of-pocket costs as well as the opportunity cost of going to school.
Source: Reproduced with permission from Jaison R. Abel and Richard Deitz, “Do the Benefits of College Still Outweigh the Costs?” Federal Reserve Bank of New York, Current Issues in Economics and Finance, vol. 20, no. 3 (2014), available at http://www.newyorkfed.org/research/current_issues/ci20-3.html, UBS.
20151050 25
Fig. 3: Return to bachelor’s degree by major
Wage-based returns by major, in %
All majors
Engineering
Math and computers
Health
Business
Communications
Technologies
Social sciences
Sciences
Architecture
Liberal arts
Agriculture & natural resources
Leisure and hospitality
Education Source: UBS
Human capital
Financial assetsAge
80
60
0
20
40
100
25 30 35 40 45 50 55 60
Fig. 4: Human capital as percentage of assets declines over time
Illustrative total wealth balance sheet, % of total wealth
Human capital is similar
to a bond in that you
receive a recurring stream
of income in exchange
for your labor output

Your Wealth & Life September 2015 5
detail in the Interview section) over the life cycle exhibited in most target date retirement funds.
Protecting human capitalBecause human capital is such a substan-tial asset, it’s important to consider ways to protect against its potential loss. This point cannot be emphasized enough as such loss would be catastrophic to the lifetime financial health of most individu-als or families.
Life insurance and disability insurance are two specific ways to accomplish this hedge in the event of human capital loss due to death or disability. One important implication of the human capital frame-work is that individuals should actu-ally have more insurance when they are young (and human capital is the high-est), and less insurance as they age. Due to the difficulty in precisely measuring human capital, many financial planning tools contain calculators that estimate

6 September 2015 Your Wealth & Life
insurance needs based on financial objectives and goals. This “needs-based” framework generally leads to a similar answer as a human capital framework.
Additionally, we all must take steps to ensure that we are not the proverbial “buggy whip maker” of the 21st cen-
tury. Aptitude with technology, devel-opment of skill sets that complement machines and computers, leadership skills, and an understanding of how jobs will change over the next 30 years are all important aspects of maintaining and growing our human capital.
To provide one example from our busi-ness, 30 years ago it would have been technologically impossible for an advi-sor to combine all of the aspects of a family’s wealth and estimate thousands of potential outcomes to determine the best course of action for the family. Today, that type of analysis is common-place in financial planning. The software has improved the productivity of the human, and the human has improved the productivity of the software. These types of human-computer “teams” are likely going to be increasingly common across all industries.3
Three types of human capitalQuantitatively, the value of an indi-vidual’s human capital is roughly equal to the net present value of his or her future earnings. Accordingly, actions that increase those earnings (e.g., fur-ther education) are additive to human capital, whereas actions that decrease future earnings (e.g., reduced schedule) are detractive. The “riskiness” of human capital also matters because a stable income of $150,000 per year might be equally valuable to a worker as an aver-age income of $200,000 that fluctu-ates wildly on a yearly basis. From an investment standpoint, we’re specifically interested in the income portion that the investor intends to save over time. A worksheet for estimating human capital is provided in Appendix A on pg. 17.
In general, there are three distinct human capital possibilities that investors need to consider (statistical properties are provided in Fig. 5):
1) They have safe human capital; 2) They have volatile human capital; or3) They have correlated human capital.
Fig. 5: Three human capital scenarios
Volatility (standard deviation) and correlation to US equities
Volatility Correlation
Safe 0% 0
Volatile 25% 0
Correlated 25% 0.25
Source: UBS. See Appendix B for more details.

Your Wealth & Life September 2015 7
Safe human capital is typically associ-ated with tenured professors, unionized employees, and other workers with very stable jobs. We believe that these jobs are few and far between as many histori-cally stable jobs are becoming less so in the current economy. For instance, some large law firms (typically considered safe employers) experienced significant lay-offs during the financial crisis. More acutely, technology is quickly disrupting the workforce in many industries; trans-portation, financial services, education, hotels and motels, and retail are just a few examples.
Volatile human capital is just that – earnings that fluctuate, sometimes dramatically, on a frequent basis. Rus-sell Wilson, Robert Griffin III, and other professional athletes clearly have vola-tile human capital, but so do many serial entrepreneurs, those in the arts and entertainment industry, C-suite profes-sionals, and workers who are paid on a commission or bonus structure basis. In general, research indicates that high life-time earnings are correlated with more volatile earnings, so if you are a high-wage earner, you are likely to fit into this category.
Finally, some individuals have corre-lated human capital. A recent paper by David Blanchett and Philip Straehl of Morningstar4 attempted to quantify the relationship between estimated human capital and various asset classes, and found that some industries – particularly cyclical ones – exhibit low but positive correlations to risk assets. Intuitively this makes sense. Someone in the real estate industry, for instance, almost certainly has human capital that is correlated with real estate investment trusts (REITs), and a mining executive’s income will likely be tied to commodity prices. These relation-ships become even more significant for
investors who are compensated through profit sharing and restricted employer stock or stock options.
We focus on these three broad group-ings for a few reasons. One, we believe it would be a mistake to be overly pre-cise when measuring or accounting for human capital. Second, it is also likely a stretch to expect human capital to be highly correlated to any one asset class. Personal actions and choices can far outweigh broader industry factors, for example. For that reason, we believe
8 September 2015 Your Wealth & Life
taking human capital characteristics into account based on general groupings (i.e., safe, volatile, or correlated) is a bet-ter approach.
By way of example, financial services employees do not automatically fall into the correlated human capital category, even if they receive stock compensation. Oftentimes their income is better cat-egorized as volatile because year-over-year fluctuations may have been driven by unique factors (e.g., employer’s finan-cial health) which were not correlated to the broader equity market.
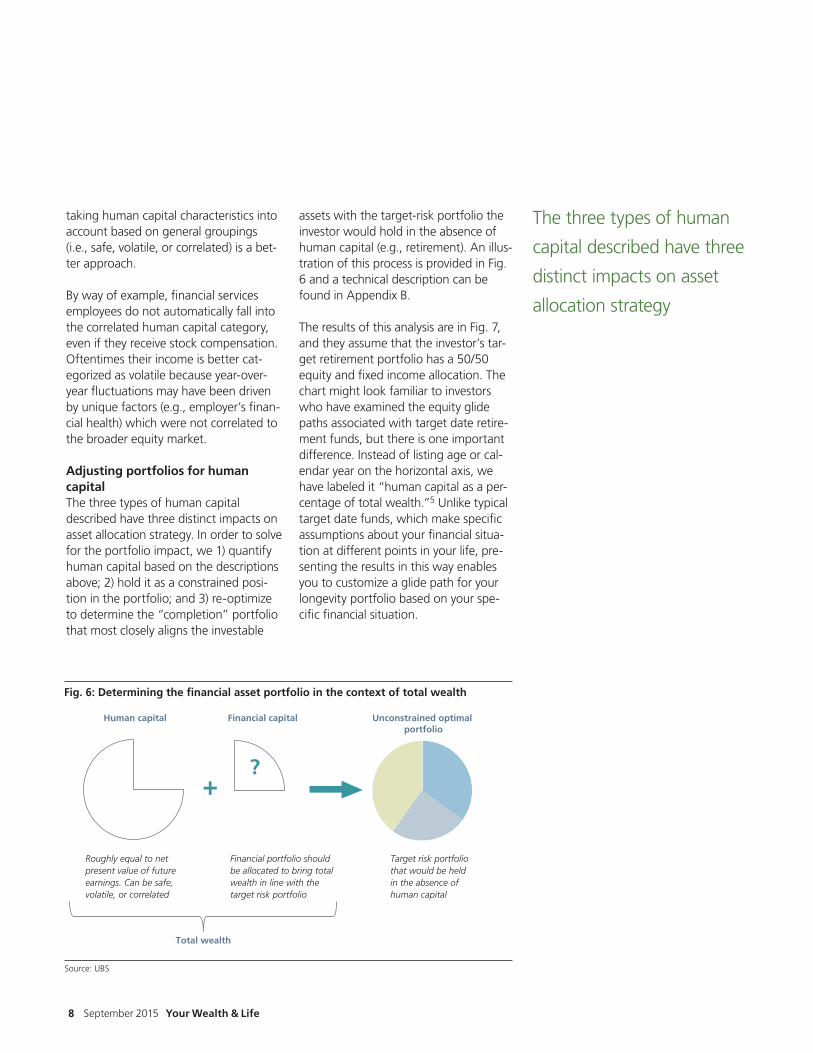
Adjusting portfolios for human capitalThe three types of human capital described have three distinct impacts on asset allocation strategy. In order to solve for the portfolio impact, we 1) quantify human capital based on the descriptions above; 2) hold it as a constrained posi-tion in the portfolio; and 3) re-optimize to determine the “completion” portfolio that most closely aligns the investable
assets with the target-risk portfolio the investor would hold in the absence of human capital (e.g., retirement). An illus-tration of this process is provided in Fig. 6 and a technical description can be found in Appendix B.
The results of this analysis are in Fig. 7, and they assume that the investor’s tar-get retirement portfolio has a 50/50 equity and fixed income allocation. The chart might look familiar to investors who have examined the equity glide paths associated with target date retire-ment funds, but there is one important difference. Instead of listing age or cal-endar year on the horizontal axis, we have labeled it “human capital as a per-centage of total wealth.”5 Unlike typical target date funds, which make specific assumptions about your financial situa-tion at different points in your life, pre-senting the results in this way enables you to customize a glide path for your longevity portfolio based on your spe-cific financial situation.
Source: UBS
Total wealth
Human capital Financial capital Unconstrained optimal portfolio
Fig. 6: Determining the financial asset portfolio in the context of total wealth
+?
Financial portfolio should be allocated to bring total wealth in line with the target risk portfolio
Target risk portfolio that would be held in the absence of human capital
Roughly equal to net present value of future earnings. Can be safe, volatile, or correlated
The three types of human
capital described have three
distinct impacts on asset
allocation strategy

Your Wealth & Life September 2015 9
ConclusionsThe following are three rules of thumb that most, if not all, investors should use as they relate to managing their portfolios based on their human capital:
1) Decrease equity exposure as financial assets increase as a percentage of total wealth;2) Underweight or completely avoid assets that you know to be highly correlated to your human capital, such as
company stock; and3) Be diligent about protecting human capital through both personal actions and appropriate insurance structures.
Beyond these rules of thumb, there are also some guidelines you can use to account for the unique characteristics associated with your human capital (safe, volatile, or correlated):
Source: UBS
VolatileSafe Correlated
80
60
0
20
40
100
95 85 75 65 55 45 35 25 15 5
Fig. 7: Equity glide paths based on characteristics of human capital
Target equity allocation, in %
Human capital as percentage of total wealth
If you have correlated human capital:• Equity exposure starts to decline
almost immediately after com-mencing work
• The pace of decline in equity exposure is more gradual overall than for safe or volatile human capital
• Once financial assets comprise a majority of total wealth, you should hold roughly the same portfolio you would hold if already retired
If you have safe human capital:• Equity exposure remains high for
most of your working career• Equity exposure begins to decline
only after financial assets exceed a majority of total wealth
• From that point, equity exposure declines until retirement
If you have volatile human capital:• Equity exposure begins to decline
after financial assets exceed roughly 25% of total wealth
• Once financial assets comprise 75% of total wealth, you should hold roughly the same portfolio you would hold if already retired
David McWilliams: Chip, you were part of the team that built the industry’s first target date fund. What was the impetus for developing that product?
Chip Castille: It was the early 1990s, and the very influential work that Brinson, Hood, and Beebower had just published suggested, or rather forcibly argued, that asset allocation explained 95%-plus of your investment outcome. The thought within defined contribution (DC) plans at that time was that individuals should move among funds and change their asset allocation as they got older.
And we thought that instead of asking investors to do it themselves, why not do it for them? In that way, we could manage the asset allocation risk, which we knew was the most important risk, yet the one that average investors are least qualified to manage.
So that was the basic idea behind the first target date fund. At the time, we were very excited about its prospects, and now we’re happy that our first product designed for DC turned into something pretty special in the marketplace.
David: Why would an investor want a portfolio where the allocation changes over time based on his or her age?
Chip: It really comes down to taking a more holistic view of your assets. We have two types of assets: human capital, which is our know-how and our ability to earn wages from that know-how, and financial capital, which is what we’ve saved and invested.
When you’re young, you don’t have a lot of financial capital, but you have a lot of human capital since you have all of your working years ahead of you. Now, if you think about it from an asset allocation perspective, human capital kind of behaves like a bond. You get paid on a regular basis, and there’s typically some inflation
David McWilliams, Head of
Wealth Management Trans-
formation at UBS, recently
interviewed Chip Castille,
Managing Director and Chief
Retirement Strategist at Black-
Rock. Mr. Castille’s investment
expertise includes asset alloca-
tion, manager selection, and
structure problems. He is an
active researcher and writes
about retirement issues affect-
ing individuals and institutions.
He also serves on a variety of
retirement industry boards.
Interview
Chip Castille
10 September 2015 Your Wealth & Life

adjustment. It certainly behaves more like a bond than equity.
At the same time, most people have a preferred level of risk that they’re com-fortable with. For some people, it’s high. For others, it’s low. Regardless, most people have a level of risk that they’re comfortable taking with their assets, and that risk remains constant, on a relative basis, throughout their lives.
When you’re young and have a lot of human capital that acts like a bond, you will typically need to take your financial capital and put it in something that has more risk, because that’s the only way to get closer to your preferred risk level.
What happens as you get older is that you have less and less bond exposure in your portfolio because you have less and less human capital. So to maintain that same target level of risk that you’re com-fortable with, you need to start buying bonds.
This means that when you’re looking at your investment portfolio over time, you’ll likely start with a lot of equities, but you will reduce that exposure as your human capital falls to bring your portfolio more in line with your long-term risk tolerance. That’s the motivation behind a target date fund and the con-cept of an equity glide path.
David: So what exactly is an equity glide path?
Chip: It’s based on this premise that you’re going to change your asset allo-cation over time. You’re going to start with a lot of equities in your portfolio when you have a lot of human capi-tal, and over time, you will end with a more balanced portfolio when you no longer have much human capital. That sequence of portfolios is what we refer to as an equity glide path.
David: Does that mean that an equity glide path should stop gliding once an individual retires?
Chip: We think so. You’re changing your equity allocation as you convert human capital into financial capital. When you reach retirement, you’re essentially saying that you don’t want to sell any more human capital, even if you have some. You’re retiring and not going to earn any more wages. By say-ing that, you’ve lost the motivation for changing your asset allocation.
We like to describe the day you retire as the riskiest day of your financial life. That’s because for most people, it’s going to be the largest amount of retire-ment savings that you’re going to have since you’ve been building it up and now you’re going to start spending it. In addi-tion, you don’t have the ability – or it will be much harder – to earn wages in the future to replenish any investment losses.
“ If your older self could meet your younger self,
that person would probably have a lot to say.
One statement would be, ‘Hey, pay me. I want
to retire.’”
Your Wealth & Life September 2015 11
If your older self could meet your younger self, that person would prob-ably have a lot to say. One statement would be, “Hey, pay me. I want to retire.” Essentially, that young person should be thinking about what he or she owes that older self in terms of retire-ment needs.
Thinking about retirement as debt actu-ally fits nicely with how people tend to think about things they own and things they owe to others on their “personal balance sheet.” What’s exciting about where we are as an industry, as asset managers and advisors who have been historically focused on growing assets, is that we’re now developing the ability to help people understand more clearly what their retirement needs are.
The analogy I like to use is: You know what house prices are. Imagine a hous-ing market where everyone knew the price of their house but nobody knew what the mortgage was. You talk to your advisor and she or he recommends mailing in a $1,000 check each month, since that seems to be the right amount. And then 30 years later, a banker will show up and tell you whether or not you have actually paid off your house.
That’s roughly the retirement system we’ve built. Everyone knows the value of their investment portfolio, but nobody knows what the cost of their retirement will be.
That is the opportunity we have to help our clients understand how to relate their investment portfolio to what their needs will be in the future.
“ That’s roughly the retirement system we’ve built.
Everyone knows the value of their investment
portfolio, but nobody knows what the cost of
their retirement will be.”
And finally, that retirement nest egg has to last for the longest period because it’s your first day of retirement.
Because of this, we think it’s more important to get the right level of risk on your retirement date and to own that portfolio throughout your retirement than it is to try to get a couple of more years of maybe good returns out of the equity market.
David: What aspects of human capital are important when it comes to asset allocation?
Chip: As I mentioned earlier, human capital tends to have characteristics like a bond due to the regularity of payments. But there are other characteristics that are important. One of them is the risk of that future earnings stream and the fact that wages tend to take a certain shape or profile over time. This shape can vary by country, industry, and level of educa-tion. So when designing the glide path, it’s often useful to look at the shape of human capital through time. For exam-ple, US real wages tend to peak when one is around 45 years old and then they taper off. In Japan, this typically occurs several years later in the early 50s.
David: I’ve heard retirement described as a debt you owe yourself. Could you touch on why it could be seen this way?
Chip: I think that’s a really useful way to develop some intuition about what’s happening when you’re saving for retirement.
12 September 2015 Your Wealth & Life

Your Wealth & Life September 2015 13
Case studies
Hockey jock, retiree?• Lucas is 33 years old and a three-time
Stanley Cup champion.
• He is considering retiring from the league when his contract expires in two years.
Twins diverge• Andrew and William are 40-year-old
twin brothers.
• Andrew is an orthopedic surgeon and William is a sociology professor.
• Earlier this year, their father passed away and they each inherited $2mn.
Portfolio manager pauses• Elizabeth is a 50-year-old portfolio
manager for an equity mutual fund.
• Her current compensation is tied to management fees received by the fund.
• She is currently phasing out of her role as a portfolio manager in favor of other pursuits.
14 September 2015 Your Wealth & Life
Case study 1
Shifting gears
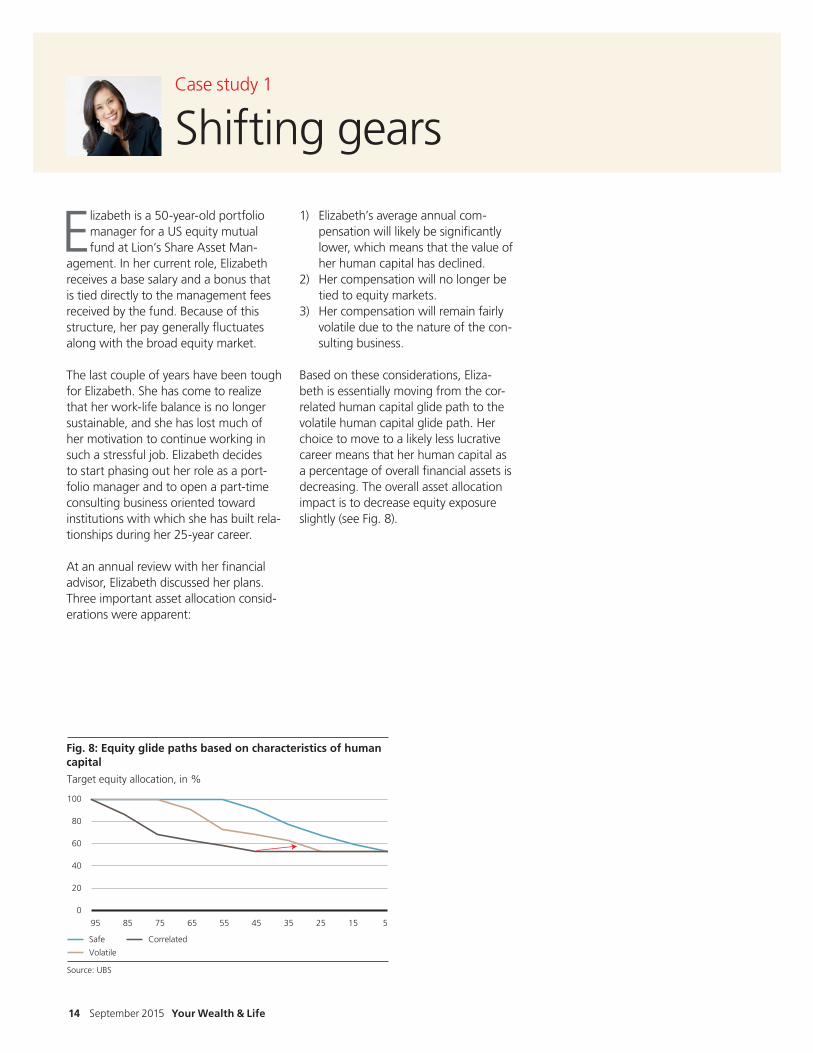
Elizabeth is a 50-year-old portfolio manager for a US equity mutual fund at Lion’s Share Asset Man-
agement. In her current role, Elizabeth receives a base salary and a bonus that is tied directly to the management fees received by the fund. Because of this structure, her pay generally fluctuates along with the broad equity market.
The last couple of years have been tough for Elizabeth. She has come to realize that her work-life balance is no longer sustainable, and she has lost much of her motivation to continue working in such a stressful job. Elizabeth decides to start phasing out her role as a port-folio manager and to open a part-time consulting business oriented toward institutions with which she has built rela-tionships during her 25-year career.
At an annual review with her financial advisor, Elizabeth discussed her plans. Three important asset allocation consid-erations were apparent:
1) Elizabeth’s average annual com-pensation will likely be significantly lower, which means that the value of her human capital has declined.
2) Her compensation will no longer be tied to equity markets.
3) Her compensation will remain fairly volatile due to the nature of the con-sulting business.
Based on these considerations, Eliza-beth is essentially moving from the cor-related human capital glide path to the volatile human capital glide path. Her choice to move to a likely less lucrative career means that her human capital as a percentage of overall financial assets is decreasing. The overall asset allocation impact is to decrease equity exposure slightly (see Fig. 8).
Source: UBS
Volatile
Safe Correlated
80
60
0
20
40
100
95 85 75 65 55 45 35 25 15 5
Fig. 8: Equity glide paths based on characteristics of human capital
Target equity allocation, in %
Your Wealth & Life September 2015 15
Case study 2
A winning playbook
Lucas Bernard is a three-time Stan-ley Cup champion. He is currently 33 years old, co-captain of his
team, and a leading defenseman in the National Hockey League. Lucas’s pro career started 14 years ago, at the ripe age of 19 when he was selected in the second round of the NHL Entry Draft after playing one season for the North Dakota University hockey team. At that time, he signed a three-year rookie con-tract for around $1mn/year.
Over the years, his talent on the ice has brought him greater fame and fortune than he could have ever imagined. As he honed his game, he diligently worked with his financial advisor, Monica LeFleur, to establish and build a sizable financial asset base with his earnings. Lucas is con-sidering retiring from the league when his current contract expires in two years.
With this change on the near horizon, Monica informs him that no major shifts are needed within his investment portfo-lio at this time. Lucas doesn’t fully com-prehend how what he perceives to be an abrupt change in his income would not trigger a bigger change in his port-folio strategy. Monica explains that she
evaluated his investment approach after each contract signing, and walks him through the key stages of his career to illustrate.
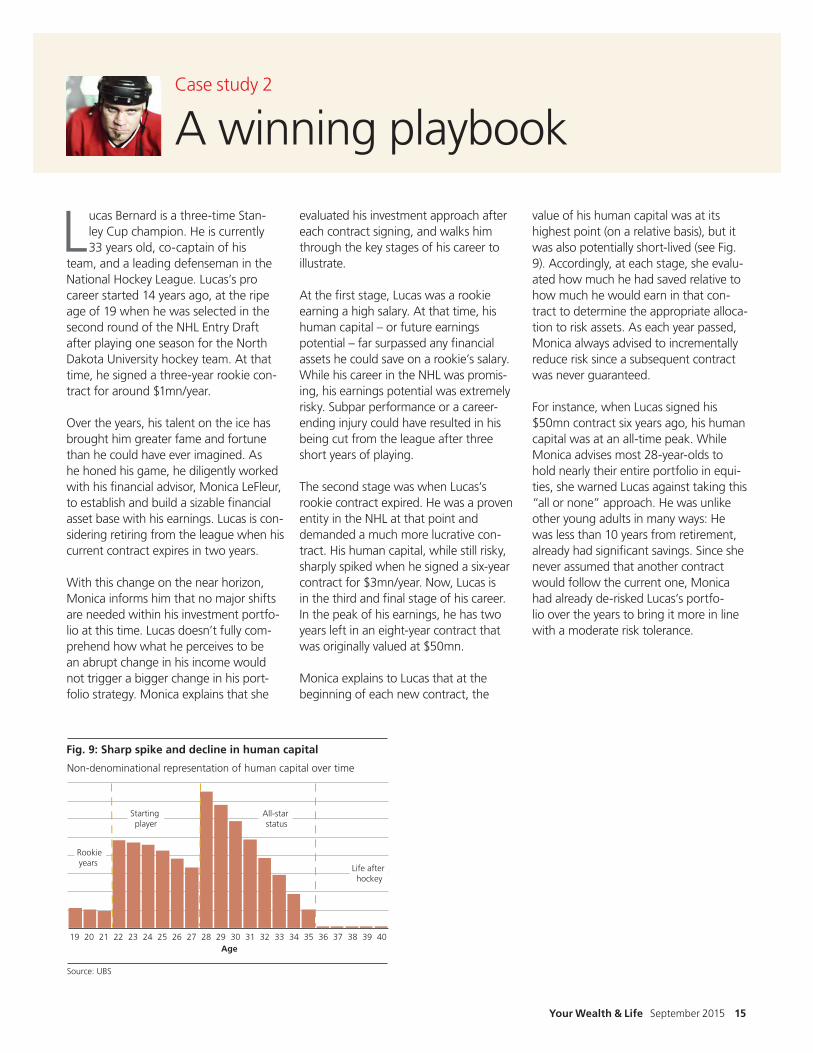
At the first stage, Lucas was a rookie earning a high salary. At that time, his human capital – or future earnings potential – far surpassed any financial assets he could save on a rookie’s salary. While his career in the NHL was promis-ing, his earnings potential was extremely risky. Subpar performance or a career-ending injury could have resulted in his being cut from the league after three short years of playing.
The second stage was when Lucas’s rookie contract expired. He was a proven entity in the NHL at that point and demanded a much more lucrative con-tract. His human capital, while still risky, sharply spiked when he signed a six-year contract for $3mn/year. Now, Lucas is in the third and final stage of his career. In the peak of his earnings, he has two years left in an eight-year contract that was originally valued at $50mn.
Monica explains to Lucas that at the beginning of each new contract, the
Source: UBS
Fig. 9: Sharp spike and decline in human capital
Non-denominational representation of human capital over time
19 20 21 22 23 24 25 26 27 28 29 30 31 32 33 34 35 36 37 38 39 40 Age
Rookie years
Starting player
Life aer hockey
All-star status
value of his human capital was at its highest point (on a relative basis), but it was also potentially short-lived (see Fig. 9). Accordingly, at each stage, she evalu-ated how much he had saved relative to how much he would earn in that con-tract to determine the appropriate alloca-tion to risk assets. As each year passed, Monica always advised to incrementally reduce risk since a subsequent contract was never guaranteed.
For instance, when Lucas signed his $50mn contract six years ago, his human capital was at an all-time peak. While Monica advises most 28-year-olds to hold nearly their entire portfolio in equi-ties, she warned Lucas against taking this “all or none” approach. He was unlike other young adults in many ways: He was less than 10 years from retirement, already had significant savings. Since she never assumed that another contract would follow the current one, Monica had already de-risked Lucas’s portfo-lio over the years to bring it more in line with a moderate risk tolerance.
16 September 2015 Your Wealth & Life
Case study 3
Two brothers, two approaches
Andrew and William Brown are 40-year-old twin brothers. Grow-ing up, they were inseparable.
They played the same sports, had the same friends, and both decided to attend the University of Michigan. From that day forward, however, they began down what would turn into two very different career paths. Today, Andrew is a highly sought-after orthopedic surgeon and Wil-liam is a sociology professor. Earlier this year, Andrew and William lost their father rather unexpectedly to cancer. Upon his death, the two sons inherited approximately $2mn each in investable assets and are now working with their respective financial advisors to deter-mine how to allocate the new funds. While they are both moderate risk inves-tors, plan to work for 25 more years, and save the same percentage (but not dollar amount) of their incomes, their advisors have provided each of them with dif-ferent allocation advice. To understand why, we must review their economic circumstances.
Andrew is married to Maureen – also a successful doctor – and they have an eight-year-old daughter, Bella. They
are both high-income earners and have amassed more than $750k in savings. While the $2mn inheritance is a notice-able addition to their existing financial asset base, they have yet to reach their peak earnings years and their human capital is substantial.
William is married to Marsha, who stays at home to take care of their eight-year-old son, Thomas. While William earns a comfortable living as a tenured professor at a local university, the estimated value of his future earnings is modest in com-parison to that of Andrew and his wife, Maureen. Accordingly, the $2mn inheri-tance was a financial windfall for the cou-ple as they only had $50k in their savings account prior to receiving it.
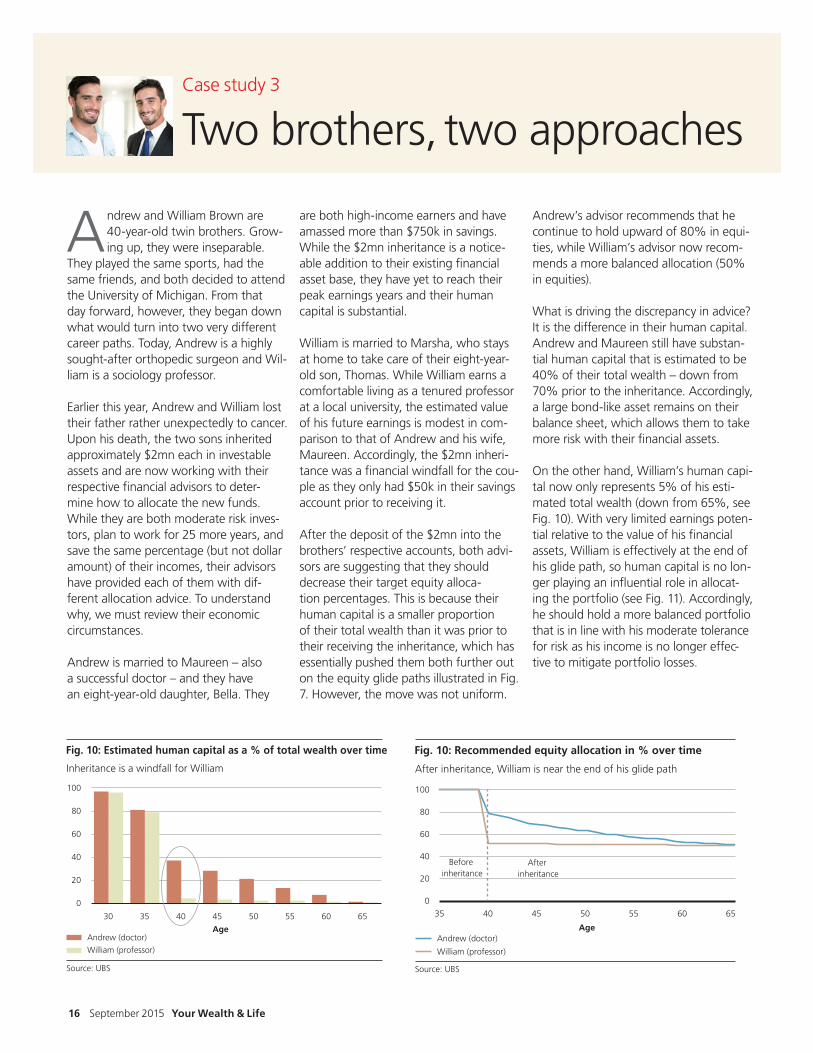
After the deposit of the $2mn into the brothers’ respective accounts, both advi-sors are suggesting that they should decrease their target equity alloca-tion percentages. This is because their human capital is a smaller proportion of their total wealth than it was prior to their receiving the inheritance, which has essentially pushed them both further out on the equity glide paths illustrated in Fig. 7. However, the move was not uniform.
Source: UBS
William (professor)
Andrew (doctor)
Before inheritance
Aer inheritance
Age
80
60
0
20
40
100
35 40 45 50 55 60 65
Fig. 10: Recommended equity allocation in % over time
Aer inheritance, William is near the end of his glide path
Source: UBS
80
60
40
20
0
100
40 453530 55 60 6550
Fig. 10: Estimated human capital as a % of total wealth over time
Inheritance is a windfall for William
Andrew (doctor)Age
William (professor)
Andrew’s advisor recommends that he continue to hold upward of 80% in equi-ties, while William’s advisor now recom-mends a more balanced allocation (50% in equities).
What is driving the discrepancy in advice? It is the difference in their human capital. Andrew and Maureen still have substan-tial human capital that is estimated to be 40% of their total wealth – down from 70% prior to the inheritance. Accordingly, a large bond-like asset remains on their balance sheet, which allows them to take more risk with their financial assets.
On the other hand, William’s human capi-tal now only represents 5% of his esti-mated total wealth (down from 65%, see Fig. 10). With very limited earnings poten-tial relative to the value of his financial assets, William is effectively at the end of his glide path, so human capital is no lon-ger playing an influential role in allocat-ing the portfolio (see Fig. 11). Accordingly, he should hold a more balanced portfolio that is in line with his moderate tolerance for risk as his income is no longer effec-tive to mitigate portfolio losses.

Your Wealth & Life September 2015 17
Appendix A
Fig. 12. Net present value calculation
Human capital can be estimated in Excel
A B C D E F G
1
Step 1
Years until retirement
Step 2
SalaryAnnual savings
(%)Annual savings
($)
Step 3
Discount rate
Step 4
Estimate of human capital
2 20 $500,000 10.0% =C2*D2 3.00% =NPV(F2,E2:$E46)
3 19 $550,000 10.0% $55,000
4 18 $600,000 10.0% $60,000
5 17 $650,000 10.0% $65,000
6 16 $700,000 10.0% $70,000
Source: UBS
An individual’s human capital can be estimated as a net present value calculation of future savings at any given time. To do so, we recommend using the “NPV” (net present value) function within Excel. Below are helpful guidelines for attempting this cal-culation, in Excel, organized by column:
Step 1
In Column B, identify the individual’s number of years until retirement. For this example, a 40-year old planning to retire at age 65 has 25 years until retirement.
Step 2
In Columns C and D, estimate the individual’s salary and annual savings (as a percentage of salary) for each year until retirement.
Step 3
In Column F, determine the appropriate rate to discount future savings. While there are unique attributes associated with each individual’s future earnings and savings potential, you can apply a rule of thumb based on our framework. If the individual’s human capital is safe, consider a discount rate of 3.0%. If the individual’s human capital is risky or cor-related, consider a discount rate of 7.0%.
Step 4
Finally, in Column G, use the NPV Excel formula circled below. Note, the formula is: = NPV(discount rate, range of projected savings).
Objective
Estimating human capital
18 September 2015 Your Wealth & Life
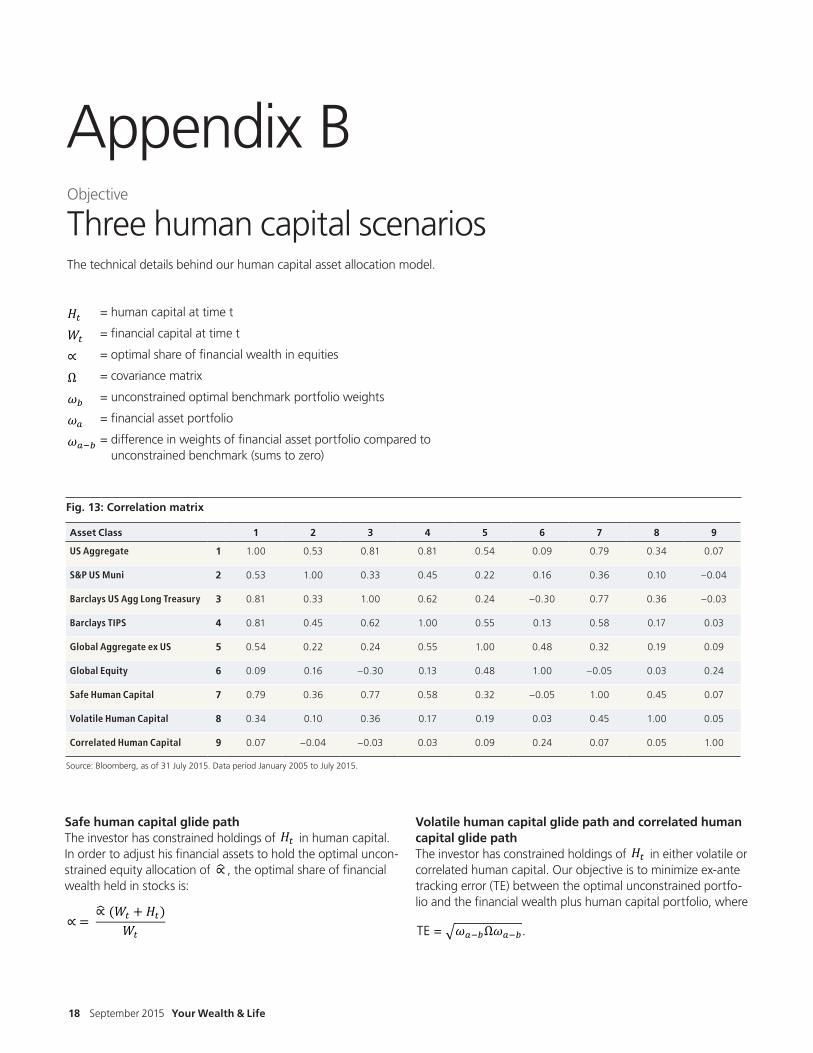
Fig. 13: Correlation matrix
Asset Class 1 2 3 4 5 6 7 8 9
US Aggregate 1 1.00 0.53 0.81 0.81 0.54 0.09 0.79 0.34 0.07
S&P US Muni 2 0.53 1.00 0.33 0.45 0.22 0.16 0.36 0.10 –0.04
Barclays US Agg Long Treasury 3 0.81 0.33 1.00 0.62 0.24 –0.30 0.77 0.36 –0.03
Barclays TIPS 4 0.81 0.45 0.62 1.00 0.55 0.13 0.58 0.17 0.03
Global Aggregate ex US 5 0.54 0.22 0.24 0.55 1.00 0.48 0.32 0.19 0.09
Global Equity 6 0.09 0.16 –0.30 0.13 0.48 1.00 –0.05 0.03 0.24
Safe Human Capital 7 0.79 0.36 0.77 0.58 0.32 –0.05 1.00 0.45 0.07
Volatile Human Capital 8 0.34 0.10 0.36 0.17 0.19 0.03 0.45 1.00 0.05
Correlated Human Capital 9 0.07 –0.04 –0.03 0.03 0.09 0.24 0.07 0.05 1.00
Source: Bloomberg, as of 31 July 2015. Data period January 2005 to July 2015.
Appendix B
= human capital at time t
= financial capital at time t
= optimal share of financial wealth in equities
= covariance matrix
= unconstrained optimal benchmark portfolio weights
= financial asset portfolio
= difference in weights of financial asset portfolio compared to unconstrained benchmark (sums to zero)
Objective
Three human capital scenarios
Q3 Your Wealth & Life / Appendix / Characters: n/a Michael Crook, CAIA; Andrea Fisher, CFA; Thomas Thibeault II (date and page numbers automatically update) 31 August 2015
Page 2 of 2
Appendix B
Notation 𝐻𝐻𝐻𝐻𝑡𝑡𝑡𝑡 = human capital at time t
𝑊𝑊𝑊𝑊𝑡𝑡𝑡𝑡 = financial capital at time t
∝ = optimal share of financial wealth in equities
Ω = covariance matrix
𝜔𝜔𝜔𝜔𝑏𝑏𝑏𝑏 = unconstrained optimal benchmark portfolio weights
𝜔𝜔𝜔𝜔𝑎𝑎𝑎𝑎 = financial asset portfolio
𝜔𝜔𝜔𝜔𝑎𝑎𝑎𝑎−𝑏𝑏𝑏𝑏 = difference in weights of financial asset portfolio compared
∝ = ∝� (𝑊𝑊𝑊𝑊𝑡𝑡𝑡𝑡 + 𝐻𝐻𝐻𝐻𝑡𝑡𝑡𝑡)
𝑊𝑊𝑊𝑊𝑡𝑡𝑡𝑡
TE = �𝜔𝜔𝜔𝜔𝑎𝑎𝑎𝑎−𝑏𝑏𝑏𝑏Ω𝜔𝜔𝜔𝜔𝑎𝑎𝑎𝑎−𝑏𝑏𝑏𝑏.
Safe human capital glide pathThe investor has constrained holdings of in human capital. In order to adjust his financial assets to hold the optimal uncon-strained equity allocation of , the optimal share of financial wealth held in stocks is:
Volatile human capital glide path and correlated human capital glide pathThe investor has constrained holdings of in either volatile or correlated human capital. Our objective is to minimize ex-ante tracking error (TE) between the optimal unconstrained portfo-lio and the financial wealth plus human capital portfolio, where
Q3 Your Wealth & Life / Appendix / Characters: n/a Michael Crook, CAIA; Andrea Fisher, CFA; Thomas Thibeault II (date and page numbers automatically update) 31 August 2015
Page 2 of 2
Appendix B
Notation 𝐻𝐻𝐻𝐻𝑡𝑡𝑡𝑡 = human capital at time t
𝑊𝑊𝑊𝑊𝑡𝑡𝑡𝑡 = financial capital at time t
∝ = optimal share of financial wealth in equities
Ω = covariance matrix
𝜔𝜔𝜔𝜔𝑏𝑏𝑏𝑏 = unconstrained optimal benchmark portfolio weights
𝜔𝜔𝜔𝜔𝑎𝑎𝑎𝑎 = financial asset portfolio
𝜔𝜔𝜔𝜔𝑎𝑎𝑎𝑎−𝑏𝑏𝑏𝑏 = difference in weights of financial asset portfolio compared
∝ = ∝� (𝑊𝑊𝑊𝑊𝑡𝑡𝑡𝑡 + 𝐻𝐻𝐻𝐻𝑡𝑡𝑡𝑡)
𝑊𝑊𝑊𝑊𝑡𝑡𝑡𝑡
TE = �𝜔𝜔𝜔𝜔𝑎𝑎𝑎𝑎−𝑏𝑏𝑏𝑏Ω𝜔𝜔𝜔𝜔𝑎𝑎𝑎𝑎−𝑏𝑏𝑏𝑏.
The technical details behind our human capital asset allocation model.
Michael Crook is an Executive Director and Head of Portfolio & Planning Research in CIO Wealth Management Research, where he advises investors on asset allocation, portfolio con-struction, and financial planning. He is an author of numer-ous academic and professional articles.
Chip Castille is a Managing Director and Chief Retirement Strategist at BlackRock. He is responsible for the develop-ment, product management, and distribution of BlackRock’s US retirement strategies and services. He is a member of BlackRock’s Global Operating Committee. He co-authored “Optimizing Manager Structure and Budgeting Manager Risk” with John Pirone and Duane Whitney, which received the Bernstein Fabozzi/Jacobs Levy award for Outstanding arti-cle in 2000.
Andrea Fisher was until recently Senior Strategist in the Portfolio & Planning Research group in CIO Wealth Manage-ment Research. She focused on advice related to investment strategy, portfolio construction, goals-based wealth manage-ment, and financial planning.
David McWilliams is Head of Wealth Management Transfor-mation at UBS. Wealth Management Transformation is a new organization that helps Financial Advisors through its focus on team-building, training, planning, increasing productivity, and delivering holistic wealth management.
Mike Ryan is Chief Investment Strategist for Wealth Man-agement Americas and Regional Chief Investment Officer for Wealth Management US. He brings together market and investment insights, and positions them so as to optimize impact for clients.
Thomas Thibeault II We would like to acknowledge the assistance of Thomas Thibeault II, previously a Graduate Train-ing Program analyst, in the preparation of this report.
About the contributors
Your Wealth & Life September 2015 19
20 September 2015 Your Wealth & Life
The views of third-party, non-UBS personnel expressed in this report do not necessarily reflect the views of UBS or any of its business areas, including Chief Investment Office (CIO) Wealth Management (WM) Research. Chief Investment Office Wealth Management Research is published by UBS Wealth Management and UBS Wealth Management Americas, Business Divisions of UBS AG (UBS) or an affiliate thereof. CIO WM Research reports published outside the US are branded as Chief Investment Office WM. In certain countries UBS AG is referred to as UBS SA. This publication is for your information only and is not intended as an offer, or a solicitation of an offer, to buy or sell any investment or other specific product. The analysis contained herein does not constitute a personal recommendation or take into account the particular investment objectives, investment strategies, financial situation and needs of any specific recipient. It is based on numer-ous assumptions. Different assumptions could result in materially different results. We recommend that you obtain financial and/or tax advice as to the implications (including tax) of investing in the manner described or in any of the products mentioned herein. Certain services and products are subject to legal restrictions and cannot be offered worldwide on an unrestricted basis and/or may not be eligible for sale to all investors. All information and opinions expressed in this document were obtained from sources believed to be reliable and in good faith, but no representation or warranty, express or implied, is made as to its accuracy or com-pleteness (other than disclosures relating to UBS and its affili-ates). All information and opinions as well as any prices indicated are current only as of the date of this report, and are subject to change without notice. Opinions expressed herein may differ or be contrary to those expressed by other business areas or divi-sions of UBS as a result of using different assumptions and/or cri-teria. At any time, investment decisions (including whether to buy, sell or hold securities) made by UBS AG, its affiliates, subsidiar-ies and employees may differ from or be contrary to the opinions expressed in UBS research publications. Some investments may not be readily realizable since the market in the securities is illiquid and therefore valuing the investment and identifying the risk to which you are exposed may be difficult to quantify. UBS relies on information barriers to control the flow of information contained
in one or more areas within UBS, into other areas, units, divisions or affiliates of UBS. Futures and options trading is considered risky. Past performance of an investment is no guarantee for its future performance. Some investments may be subject to sudden and large falls in value and on realization you may receive back less than you invested or may be required to pay more. Changes in FX rates may have an adverse effect on the price, value or income of an investment. This report is for distribution only under such circumstances as may be permitted by applicable law.
Distributed to US persons by UBS Financial Services Inc., a subsid-iary of UBS AG. UBS Securities LLC is a subsidiary of UBS AG and an affiliate of UBS Financial Services Inc. UBS Financial Services Incorporated of Puerto Rico is a subsidiary of UBS Financial Ser-vices Inc. UBS Financial Services Inc. accepts responsibility for the content of a report prepared by a non-US affiliate when it distrib-utes reports to US persons. All transactions by a US person in the securities mentioned in this report should be effected through a US-registered broker dealer affiliated with UBS, and not through a non-US affiliate. The contents of this report have not been and will not be approved by any securities or investment authority in the United States or elsewhere.
UBS specifically prohibits the redistribution or reproduction of this material in whole or in part without the prior written permission of UBS and UBS accepts no liability whatsoever for the actions of third parties in this respect.
Version as per April 2015.
© UBS 2015. The key symbol and UBS are among the registered and unregistered trademarks of UBS. All rights reserved.
Disclaimer

Your Wealth & Life September 2015 21
Publication details
PublisherUBS Financial Services Inc. Wealth Management Research 1285 Avenue of the Americas, 20th Floor New York, NY 10019
This report was published on 9 September 2015.
Editors in chiefMichael CrookAndrea Fisher
Contributors
(in alphabetical order)
Chip CastilleMichael CrookAndrea FisherDavid McWilliamsMike RyanThomas Thibeault II
Project Management Paul Leeming
Desktop PublishingGeorge StilabowerCognizant Group – Basavaraj Gudihal, Srinivas Addugula, Pavan Mekala and Virender Negi
1 Bengali, Leila, and Mary Daly, “Is it still worth going to college?” FRBSF Economic Letter, Federal Reserve Bank of San Francisco, May 2014.
2 Jagannathan, Ravi, and Narayana Kocherlakota, “Why Should Older People Invest Less in Stocks than Younger People?” Quarterly Review, Federal Reserve Bank of Minneapolis, Summer 1996.
3 Cowen, Tyler, Average Is Over: Powering America Beyond the Age of the Great Stagnation, Dutton, 2013 and Dwoskin, Elizabeth, “Before a Robot Takes Your Job, You’ll Be Working Side By Side,” The Wall Street Journal, August 25, 2015.
4 Blanchett, David, and Philip Straehl, “No Portfolio Is an Island,” Financial Analysts Journal. May/June 2015, Volume 71, Issue 3.
5 “Your Wealth & Life: Goals-Based Wealth Management,” UBS, 2Q 2015.
Endnotes

ab
UBS Financial Services Inc. is a subsidiary of UBS AG.www.ubs.com/financialservicesinc