your w ater quality information - suez water | · your w ater quality information annual water...
TRANSCRIPT

your water quality informationannual water quality report
issued may 2017 SUEZ | New York Operations

2 | annual water quality report
our commitment to you
“We take great pride in our ability to provide you with drinking water that meets or surpasses all state and federal standards.”
Dear Customer,
SUEZ is dedicated to providing you and your family with water that is safe and healthy. At SUEZ, we take great pride in our ability to provide you with drinking water that meets—and often surpasses—all the health and safety standards set by the United States Environmental Protection Agency (USEPA), the New York State Department of Environmental Conservation (NYSDEC) and the New York State Department of Health (NYSDOH). Water is an essential element in our lives—it makes up 65 percent of our bodies, and health experts recommend that we drink eight glasses of water a day. That’s why it’s so important that we conduct the many tests that we do on your water. You can read more about these test results in this report.
As part of this commitment, we regularly test water samples to be sure that your water meets the safety standards. All the test results are on file with the NYSDOH, the agency that monitors and regulates drinking water quality in our state. Both the EPA and the NYSDOH require water suppliers to produce an Annual Water Quality Report for customers. This report provides important information about your drinking water. It shows how your drinking water measured up to government standards during 2016. Please read it carefully and feel free to call us at 845.623.1500, if you have any questions about your water or your service. You can contact the EPA Safe Drinking Water Hotline at 800.426.4791, the NYSDOH at 518.402.7713 or the Rockland County Department of Health at 845.364.2608. If you have specific questions about water as it relates to your personal health, we suggest that you contact your health care provider.
Sincerely,
Chris Graziano Vice President and General Manager
United States. In addition to owning and operating regulated utilities, SUEZwho we are SUEZ provides water and wastewater services to over 7 million people in the
operates municipal systems through public-private partnerships and contract agreements. Three of the nation’s largest water and wastewater contracts are operated by SUEZ.
“We take great pride in our ability to provide you with drinking water that meets or surpasses all state and federal standards.”

3
about yourwater supply
facts and figures SUEZ’ public water system identification number is NY4303673. We provide service to approximately 300,000 people in Rockland and parts of Orange County. About 70 percent of our water supply is from various wells located throughout the county, and the remaining 30 percent is surface water supply from the Lake DeForest and Letchworth reservoirs. In 2016, SUEZ produced 10.41 billion gallons of water. We determined that 21.76 percent of the water we produced is non-revenue producing. This is water lost due to leaks, main breaks, under-registering meters, fire fighting, hydrant flushing and theft of service. On average about 45 inches of rain fall each year in the Hackensack River Watershed, which is the source of our surface water supply. Surface water is water from reservoirs, rivers, lakes and streams. This type of water, unlike groundwater, is stored on the earth’s surface. Groundwater filters naturally through the layers of the earth. It is then stored in deep, porous rocks called aquifers.
The New York Public Service Commission sets water rates to cover the costs of providing service. The average residential customer uses approximately 6,700 gallons of water per month, or approximately $800 annually (including surcharges). A typical dollar pays for system improvements, operations and maintenance, taxes, interest and debt, dividends and reinvestment and depreciation costs.
EPA Safe Drinking Water Hotline: 800.426.4791
register for eBilling By choosing paperless eBilling you will help protect and preserve our natural resources. Your eBill will be sent directly to your email inbox. It has the added benefit of allowing you to pay the bill directly from your bank account free of charge. To register for eBilling visit mysuezwater.com or call the customer service number listed on your bill.
we’re listening!
If you are interested in serving on our Customer Advisory Panel, please call us at 845-623-1500.
use water wisely!
Water is a precious resource. Please call us for water-saving tips or visit us at mysuezwater.com.

4 | annual water quality report
source water assessment program In 2004 the New York State Department of Health completed a source water assessment for this system based on available information. Possible and actual threats to this drinking water source were evaluated. The state source water assessment includes a susceptibility rating based on the risk posed by each potential source of contamination and how easily contaminants can move through the subsurface to the wells and to the surface water source. The susceptibility rating is an estimate of the potential for contamination of the source water.
It does not mean that the water delivered to consumers is or will become contaminated. See the Water Quality Table for a list of the contaminants that have been detected. The source water assessments provide resource managers with additional information for protecting source waters into the future.
In 2016, our water was derived from 60 drilled wells and from Lake DeForest and the Letchworth reservoirs. The source water assessment has rated the drilled wells as having a high susceptibility to microbials, nitrates and industrial solvents and a high susceptibility to other industrial contaminants. These ratings are due primarily to the close proximity of permitted discharge facilities (industrial/commercial facilities that discharge wastewater into the environment and are regulated by the state and/ or federal government) to the wells and the associated industrial activity in the assessment area. In addition, some of the wells draw from fractured bedrock and the overlying soils do not provide adequate protection from potential contamination.
This assessment also found Lake DeForest to have an elevated susceptibility to contamination. Due to the amount of residential lands in the assessment area, there is an elevated potential for contamination from pesticides, sediments, DBP precursors, phosphorus and microbials. There is also noteworthy susceptibility to contamination from other sources including Chemical Bulk Storage (CBS) facilities and Hazardous Substances Emergency Events Surveillance (HSEES) facilities. Hydrologic characteristics (e.g. basin shape and flushing rates) generally make reservoirs highly sensitive to existing and new sources of phosphorus and microbial contamination.
While the source water assessment rates our wells and Lake DeForest as being susceptible to microbials, nitrates and other contaminants, please note that our water is disinfected and treated to ensure that the finished water delivered into your home meets New York State’s drinking water standards.
conservation tip
EPA-labeled WaterSense products help you save water,
energy and money.
5
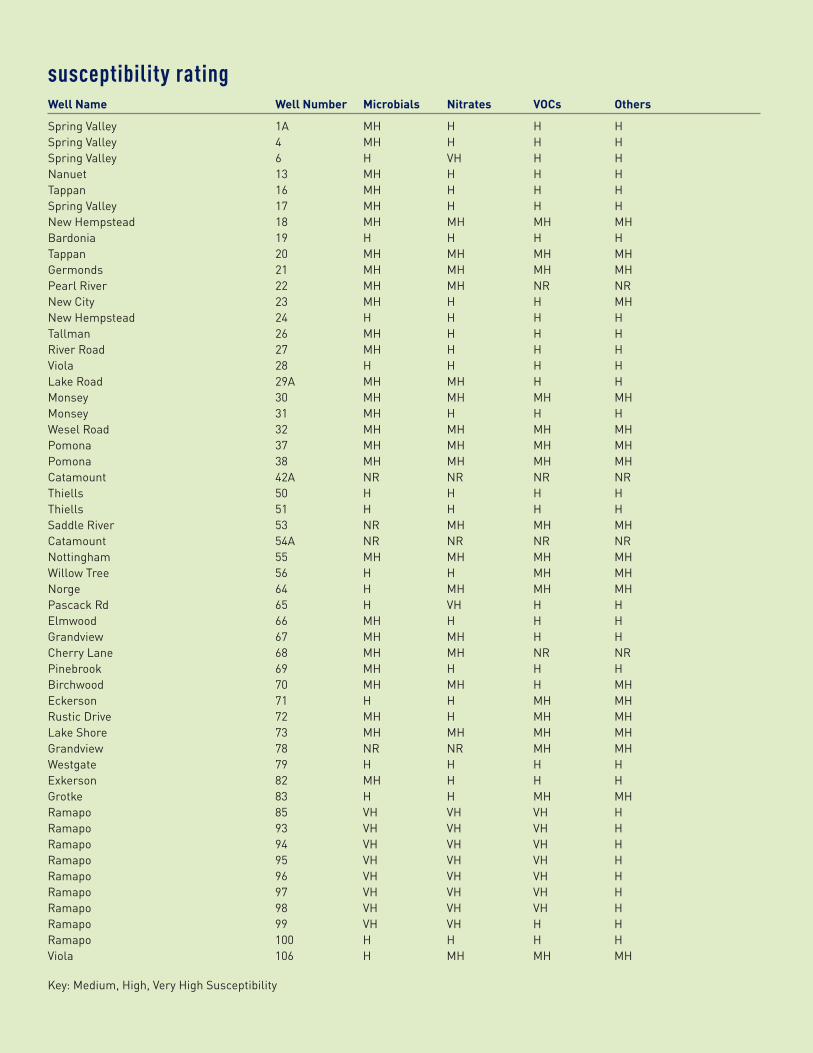
susceptibility rating Well Name Well Number Microbials Nitrates VOCs Others
Spring Valley 1A MH H H H Spring Valley 4 MH H H H Spring Valley 6 H VH H H Nanuet 13 MH H H HTappan 16 MH H H HSpring Valley 17 MH H H H New Hempstead 18 MH MH MH MH Bardonia 19 H H H HTappan 20 MH MH MH MHGermonds 21 MH MH MH MHPearl River 22 MH MH NR NR New City 23 MH H H MH New Hempstead 24 H H H H Tallman 26 MH H H HRiver Road 27 MH H H H Viola 28 H H H HLake Road 29A MH MH H H Monsey 30 MH MH MH MHMonsey 31 MH H H HWesel Road 32 MH MH MH MH Pomona 37 MH MH MH MHPomona 38 MH MH MH MHCatamount 42A NR NR NR NR Thiells 50 H H H HThiells 51 H H H HSaddle River 53 NR MH MH MH Catamount 54A NR NR NR NRNottingham 55 MH MH MH MHWillow Tree 56 H H MH MH Norge 64 H MH MH MHPascack Rd 65 H VH H H Elmwood 66 MH H H HGrandview 67 MH MH H HCherry Lane 68 MH MH NR NR Pinebrook 69 MH H H HBirchwood 70 MH MH H MHEckerson 71 H H MH MHRustic Drive 72 MH H MH MH Lake Shore 73 MH MH MH MH Grandview 78 NR NR MH MHWestgate 79 H H H HExkerson 82 MH H H HGrotke 83 H H MH MHRamapo 85 VH VH VH HRamapo 93 VH VH VH H Ramapo 94 VH VH VH H Ramapo 95 VH VH VH HRamapo 96 VH VH VH HRamapo 97 VH VH VH HRamapo 98 VH VH VH HRamapo 99 VH VH H HRamapo 100 H H H HViola 106 H MH MH MH
Key: Medium, High, Very High Susceptibility

6 | annual water quality report
about your water quality
As state regulations require, we routinely test your drinking water for numerous contaminants, including total coliform, turbidity, inorganic compounds, nitrate, nitrite, lead and copper, volatile organic compounds, radioactive contaminants, total trihalomethanes and synthetic organic compounds. The Water Quality Table shows which compounds were detected in your drinking water.
Detailed analytical testing information concerning each of SUEZ’ sources is included in a supplement to this statement. This information is available for review at the Finkelstein Memorial Library, 24 Chestnut Street, Spring Valley, New York. The phone number is 845.352.5700. Additionally, the supplement is available on our website (www.mysuezwater.com) or a hard copy may be reviewed by contacting SUEZ’ Customer Service Department at 845.623.1500, option 1.
is our water system meeting other rules? During the first quarter of 2016 SUEZ Water New York exceeded the standard or maximum contaminant level (MCL) for Total Trihalomethanes at two sampling locations. The levels were below the standard or maximum contaminant level following the second quarter samples for the remainder of the year.
SUEZ met or surpassed all other state and federal drinking water requirements.
The heart of our mission is providing the highest quality drinking water and protecting our environment.

7
about the treatment process We treat both groundwater and surface water to remove impurities. Our laboratory regularly tests the quality of the water before, during and after the treatment process. We monitor it for dozens of substances and detected those listed on the Water Quality Table. We also monitor for turbidity which is a measure of the cloudiness of water because it is a good indicator of the effectiveness of our filtration system. Our job is to provide you and your family with water that meets all government standards for health and safety. The treatment process differs depending upon whether the water is from our wells, Lake DeForest Water Treatment Plant or Letchworth Water Treatment Plant.
lake deforest water treatment plant Physical treatment includes traveling screens, aeration (Dissolved Air Flotation - DAF) and filtration (dual media). Chemical treatment includes potassium permanganate (prior to traveling screens), anionic polymer (prior to flocculation), alum (prior to flocculation), sodium hypochlorite (prior to filtration and post-filtration) and polyphosphates (post-filtration). Sodium hypochlorite is added to protect against microbiological contamination and sodium hydroxide and polyphosphates are added to reduce corrosion of metal piping and plumbing.
letchworth water treatment plant Water comes from any one of three reservoirs that are within the Palisades Interstate Park property. The treatment process employs conventional methods including chemical addition, mixing, flocculation, sedimentation, filtration, disinfection and corrosion control. The process is similar to the process used at Lake DeForest with the exception of the DAF process.
supply from wells All wells are treated with sodium hypochlorite for disinfection and polyphosphates for corrosion control. Certain wells receive additional treatment through granular activated carbon filtration, aeration and/ or ultraviolet disinfection. Wells that have been determined to be GWUDI (Ground Water Under Direct Influence of Surface Water) employ additional treatment steps including ultraviolet disinfection and filtration.

8 | annual water quality report
drinking water qualityThe water quality table shows how the quality of your drinking water in 2016 compared to the standards set by the New York State Department of Health. water quality characteristics Inorganic Chemicals MCLG MCL
Average Result
Highest Result
Range of Results Violation Likely Source
Arsenic ppb 1 0 10 ND 7.7 ND - 7.7 No Erosion of natural deposits; runoff from orchards; runoff from glass and electronics production wastes
Barium ppm 2 2 0.21 0.57 0.01 - 0.57 No Discharge of drilling wastes; discharge from metal refineries; erosion of natural deposits Chromium ppb 100 100 ND 3.3 ND - 3.3 No Discharge from steel and pulp mills; erosion of natural deposits Cyanide ppb 200 200 ND 0.01 ND - 0.013 No Discharge from steel/metal factories; Discharge from plastic and fertilizer factories Nitrate as nitrogen ppm 10 10 1.39 3.30 ND - 3.30 No Runoff from fertilizer use; leaching from septic tanks, sewage; erosion of natural deposits
1 – The average result represents the running annual average of this contaminant. The range of results represents individual samples collected in 2016.
Lead and Copper MCLG AL 90th Percentile
Range of Results Violation Likely Source
Lead ppb 2 0 15 4.3 ND - 57 No Corrosion of household plumbing Copper ppm 2 1.3 1.3 0.64 0.024 - 1.40 No Corrosion of household plumbing
2 – The level presented represents the 90th percentile of the 214 sites tested. A percentile is a value on a scale of 100 that indicates the percent of a distribution that is equal to or below it. The 90th percentile is equal to or greater than 90% of the lead values detected in your water system. In this case, 214 samples were collected in your water system and the 90th percentile value was the 94th (2.70 ppb) sample during the first round and the 99th sample (4.3 ppb) during the second round. The action level for lead was exceeded at two of the sites tested. The action level for copper was exceeded at one of the sites tested.
MCLG MCL Level Found
Range of Results
Date of Sample Violation Likely Source
Turbidity NTU 3 NA TT=1NTU TT=95% <0.3NTU
0.25 100%
0.02 - 0.25 100%
July 2016 No Soil run-off
3 – Turbidity is a measure of the cloudiness of the water. We test it because it is a good indicator of the effectiveness of our filtration system. Our highest single turbidity measurement (0.25 NTU) for the year occurred in July. State regulations require that turbidity must always be below 1 NTU. The regulations require that 95% of the turbidity samples collected have measurements below 0.3 NTU.
MCLG MCL Average Result
Range of Results Violation Likely Source
Distribution Turbidity NTU NA 5 0.26 0.09 - 2.22 No Sediment, iron and manganese
Disinfectant Residual MCLG MCL
Average Result RAA
Highest Result RAA
Range of Results (individual sites) Violation Likely Source
Distribution Chlorine Residual ppm NA 4 0.86 0.91 0.11 - 1.90 No Water additive used to control microbes
MCLG MCL Average Result
Range of Ratio
Lowest Ratio Violation Likely Source
TOC Removal Ratio (RAA) NA >=1 1.14 1.00 - 1.47 1.10 No Naturally present in the environment
Radionuclides MCLG MCL Average Result
Range of Results Violation Likely Source
Alpha emitters - pCi/L 0 15 ND ND - 6.00 No Erosion of natural deposits Combined radium pCi/L 0 5 2.21 0.66 - 4.89 No Erosion of natural deposits Uranium ug/L 0 30 3.65 ND - 13.33 No Erosion of natural deposits
Organic Chemicals (volatile) EPA MCLG
EPA MCL
New York MCL
Average Result
Range of Results Violation Likely Source
cis-1,2-dichloroethylene ppb 70 70 5 ND ND - 2.2 No Discharge from chemical plants and other industrial activities tetrachloroethylene ppb 0 5 5 ND ND - 2.3 No Discharge from factories and dry cleaners; waste sites; spills trichloroethylene ppb 0 5 5 ND ND - 0.86 No Discharge from metals degreasing sites and other factories Toluene ppb 1000 1000 5 ND ND - 0.7 No Discharge from petroleum factories cis-1,3-dichloro-propene ppb NA NA NA ND ND - 2.40 NA Discharge from chemical factories MTBE ppb NA NA 10 ND ND - 0.5 No A fuel additive, leakage from underground fuel storage tanks
Organic Chemicals (pesticides, herbicides, polyaromatic hydrocarbons)
EPA MCLG
EPA MCL
New York MCL
Average Result
Range of Results Violation Likely Source
Chlordane ppb 0 2 2 ND ND - 0.35 No Residue of banned termiticide di(2-ethylhexyl)phthalate ppb 0 6 6 ND ND - 0.83 No Discharge from rubber and chemical factories
Disinfection By-Products (Stage 2)
EPA MCLG
EPA MCL
NY MCL
Highest LRAA Result
Range of Results (individual sites) Violation Likely Source
TTHMs (Total Trihalomethanes) ppb 4
(thms: bromoform, bromodichloromethane, chlorodibromomethane, chloroform) NA 80 80 84.2 ND - 104.5 Yes By-product of drinking water disinfection
HAA5 (Haloacetic Acids) ppb 4
(HAA5: dibromoacetic acid, dichloroacetic acid, monobromoacetic acid, monochloroacetic acid, trichloroacetic acid) NA 60 60 38.3 ND - 51.3 No By-product of drinking water disinfection
4 – DBP max levels in the range of results are site specific. Please note that the high value in the range does not result in an MCL violation, since compliance is based on the LRAA.
Notes:

9
secondary standards - water quality parameters related to the aesthetic quality of drinking water. Other Substances
New York MCL Average Result Range of Results** Violation Likely Source
Alkalinity ppm NA 164 2 - 256 No Natural mineral Aluminum ppb NA ND ND - 58 No Treatment process Calcium ppm NA 67 2 - 333 No Natural mineral Chloride ppm 250 75 5 - 179 No Natural mineral, road salt Color CU 15 3 ND - 5 No Natural mineral and organic matter Specific Conductance umhos NA 686 59 - 1120 No Natural mineral Hardness (as CaCO3) ppm NA 167 5 - 400 No Natural mineral Iron ppb* 300 ND ND - 245 No Erosion of natural deposits Manganese ppb* 300 ND ND - 121 No Erosion of natural deposits Odor TON 3 1C N - 3C No Naturally occurring, chlorine pH 6.5-8.5 7.5 6.3 - 8.6 No Natural mineral, treatment process Orthophosphate ppm NA 0.23 ND - 2.09 No Treatment process Sodium ppm NA 51 8 - 77 No Natural mineral, road salt Sulfate ppm 250 19 5 - 30 No Natural mineral Total Dissolved Solids ppm NA 272 29 - 616 No Natural mineral Zinc ppm 5 ND ND - 0.05 No Natural mineral *Sequestering agent used for treatment of iron and manganese. Health Effects Health Note for Sodium: Water containing more than 20 ppm of sodium should not be used for drinking water by people on diets that severely restrict sodium. Water containing more than 270 ppm of sodium should not be used for drinking by people on diets that moderately restrict sodium.
unregulated contaminant monitoring rule 3 data (UCMR3) Substance
EPA MCLG
EPA MCL
NY MCL
Highest Result
Range of Results Violation Likely Source
Chromium ppb NA NA NA 3.7 ND - 3.7 NA Prevalent natural element Molybdenum ppb NA NA NA 1.40 ND - 1.40 NA Common sources of molybdenum include legumes and lentils, grains, leafy vegetables, liver and nuts Strontium ppb NA NA NA 570 ND - 570 NA Naturally occurring element Vanadium ppb NA NA NA 5.10 ND - 5.10 NA Naturally occurring element 1,4-Dioxane ppb NA NA NA 0.50 ND - 0.50 NA Used as a solvent, cleaning agent, chemical stabilizer, surface coating, adhesive agent, and an ingredient in
chemical manufacture Chlorate ppb NA NA NA 1000 ND - 1000 NA Known by-product of the drinking water disinfection process, forming when sodium hypochlorite or chlorine
dioxide is used in the disinfection process Chromium (VI) ppb NA NA NA 3.40 ND - 3.40 NA Industries that process or use chromium, chromium compounds, or chromium processes 1,1-Dichloroethane ppb NA NA NA 54 ND - 54 NA VOCs are used in many industrial processes in the creation of consumer products. VOCs are also essential
ingredients in many personal care products and other materials including fragrances, paints, lubricants, adhesives, cleaners, gasoline additives, home furnishings, and more
Chloro-difluoro-methane mg/l NA NA NA 110 ND - 110 NA VOCs are used in many industrial processes in the creation of consumer products. VOCs are also essential ingredients in many personal care products and other materials including fragrances, paints, lubricants, adhesives, cleaners, gasoline additives, home furnishings, and more
Additional information about unregulated contaminants can be found at the following link, courtesy of American Water Works Association: http://www.drinktap.org/home/water-information/water-quality/ucmr3.aspx
definitions Action Level (AL): The concentration of a contaminant which, if exceeded, triggers treatment or other requirements which a water system must follow. LRAA: Locational running annual average. Maximum Contaminant Level (MCL): The highest level of a contaminant that is allowed in drinking water. MCLs are set as close to the MCLGs as feasible. Maximum Contaminant Level Goal (MCLG): The level of a contaminant in drinking water below which there is no known or expected risk to health. MCLGs allow for a margin of safety. Maximum Residual Disinfectant Level (MRDL): The highest level of a disinfectant allowed in drinking water. There is convincing evidence that addition of a disinfectant is necessary for control of microbial contaminants. Maximum Residual Disinfectant Level Goal (MRDLG): The level of a drinking water disinfectant below which there is no known or expected risk to health. MRDLGs do not reflect the benefits of the use of disinfectants to control microbial contamination. Micrograms per liter (ug/l): Corresponds to one part of liquid in one billion parts of liquid (parts per billion - ppb). Milligrams per liter (mg/l): Corresponds to one part of liquid in one million parts of liquid (parts per million - ppm).
Million Fibers per Liter (MFL): A measure of the presence of asbestos fibers that are longer than 10 micrometers. Millirems per year (mrem/yr): A measure of radiation absorbed by the body. Nanograms per liter (ng/l): Corresponds to one part of liquid to one trillion parts of liquid (parts per trillion - ppt). Nephelometric Turbidity Unit (NTU): A measure of the clarity of water. Turbidity in excess of 5 NTU is just noticeable to the average person. Non-Detects (ND): Laboratory analysis indicates that the constituent is not present. Picocuries per liter (pCi/L): A measure of the radioactivity in water. Picograms per liter (pg/l): Corresponds to one part per of liquid to one quadrillion parts of liquid (parts per quadrillion - ppq). ppb Parts per billion: Corresponds to one part of liquid in one billion parts of liquid. ppm Parts per million: Corresponds to one part of liquid in one million parts of liquid. RAA: Running annual average. Treatment Technique (TT): A required process intended to reduce the level of a contaminant in drinking water. <: This means “greater than.” >: This means “less than.”

10 | annual water quality report
health information health note Drinking water, including bottled water, may reasonably be expected to contain at least small amounts of some contaminants. The presence of contaminants does not necessarily indicate that the water poses a health risk. More information about contaminants and potential health effects can be obtained by calling the EPA Safe Drinking Water Hotline at 800.426.4791.
Some people may be more vulnerable to contaminants in drinking water than the general population. Immuno-compromised persons, such as those with cancer undergoing chemotherapy, those who have undergone organ transplants, people with HIV/AIDS or other immune system disorders, some elderly individuals, and infants can be particularly at risk from infections. Those listed should seek advice about drinking water from their health care providers. EPA/CDC guidelines on appropriate means to lessen the risk of infections by cryptosporidium and other microbial contaminants are available from the EPA’s Safe Drinking Water Hotline at 800.426.4791.
arsenic information We have learned through our testing that some contaminants have been detected; however, these contaminants were detected below current federal drinking water requirements. Although our water was compliant with the MCL for arsenic, some of our results were greater than one-half of the MCL. Therefore, we are required to present the following information on arsenic in drinking water:
New York State and EPA have promulgated a drinking water arsenic standard of 10 parts per billion. While your drinking water meets the standard for arsenic, it does contain low levels of arsenic. The standard balances the current understanding of arsenic’s possible health effects against the costs of removing arsenic from drinking water. EPA continues to research the health effect of low levels of arsenic, which is a mineral known to cause cancer in humans at high concentrations and is linked to other health effects such as skin damage and circulatory problems.
lead information If present, elevated levels of lead can cause serious health problems, especially for pregnant women and young children. Your water is lead free when it leaves our treatment plant. Lead in drinking water is primarily from materials and components associated with service lines and home plumbing. SUEZ is responsible for providing high quality drinking water, but cannot control the variety of materials used in plumbing components. When your water has been sitting for several hours, you can minimize the potential for lead exposure by flushing your tap for 30 seconds to 2 minutes before using water for drinking and cooking. If you are concerned about lead in your water, you may wish to have your water tested. Information on lead in drinking water, testing methods, and steps you can take to minimize exposure is available from the EPA’s Safe Drinking Water hotline at 800.426.4791 or by visiting the EPA website at www.epa.gov/safewater/lead.
Additionally, the New York State Department of Health has established a Free Lead Testing Pilot Program for state residents. For more information, contact the Bureau of Water Supply Protection at (518) 402-7650 or visit www.health.ny.gov/environmental/water/drinking/lead/free_lead_testing_pilot_program.
To learn more about lead, please visit http://www.mysuezwater.com or http://www.epa.gov/lead

11
conservation tips SUEZ encourages its customers to use water wisely. In 2017 we will launch a program which offers rebates on water-saving devices and appliances. These products will help customers save water, energy and lower their utility bills. Here are some simple steps you can take to save water.
• Check every faucet in your home for leaks. Just a slow drip can waste almost 6,000 gallons per year.
• Check your toilet for leaks by putting a few drops of food coloring in the tank. If you see color in thetoilet bowl after 15 minutes, you have a leak. Fixing a toilet leak can save more than 30,000 gallonsa year.
• Use your water meter to detect hidden leaks. Simply turn off all taps and water-using appliancesand then check the meter reading over a 15 minute period. If the meter moves, you have a leak thatshould be repaired.
• Plant a conservation garden using native or drought tolerant plants.
• Use pesticides and fertilizers sparingly and only according to the manufacturer’s instructions.
how rates are determined Customers may notice that water is the least expensive bill when compared to other utilities such as cell phone, cable or electricity. For about a penny per gallon, SUEZ collects, stores, treats, tests and delivers water 24 hours a day, seven days a week. The company also makes proactive investments to stay ahead of ever-growing regulations.
From time to time, SUEZ files a rate case to address the costs of providing safe and reliable service. The New York State Public Service Commission (PSC) is responsible for setting rates and ensuring that adequate service is provided by utilities. Any proposed increase in rates is subject to their detailed review and decision. To begin, the company submits a filing to demonstrate the need for a rate increase. This includes estimates of expenses, such as operating expenses (labor, energy, chemicals, benefits, materials, fuel, etc.), depreciation expense, taxes, a return on investor-provided capital, and recognition of utility plant additions.
As an example, SUEZ invested $55 million in infrastructure during the last three years. This involved upgrading or replacing critical assets like dams, booster stations, tanks and underground water mains and making water supply improvements in the system. As one of the largest property taxpayers in Rockland County, SUEZ pays over $20 million per year in property taxes. As a result, approximately 1/4 of each customer bill is for the payment of these taxes. In total, approximately 1/3 of customer bills is for the payment of all taxes (including property taxes mentioned above).
The Department of Public Service staff team analyzes the rate filing and represents the public interest. An Administrative Law Judge presides over the case, hears all the evidence and provides recommendations to the PSC. Rate cases proceed in an entirely open process with opportunity for stakeholder input. Commission deliberations are held in public meetings and a written order is issued resolving all outstanding issues and matters necessary to determine the utility company’s revenue requirements and the amounts to charge customers.
To read more about the rate case review process in New York, visit the PSC website: http://on.ny.gov/1CQYDd3.

In keeping with our commitment to the environment, this report was printed on paper containing at least 10% post consumer fiber.
SUEZ New York Operations
360 West Nyack Road West Nyack, NY 10994
[email protected]/SuezWaterNY
PWSID # NY4303673
THIS REPORT CONTAINS IMPORTANT INFORMATION ABOUT YOUR DRINKING WATER.
Este informe contiene información muy importante sobre su agua beber. Tradúzcalo ó hable con alguien que lo entienda bien.
watershed recreation program The recreation program, which runs from April 1 through November 30, enables our customers to enjoy fishing or bird watching at Oradell, Lake Tappan, Woodcliff Lake and Lake DeForest reservoirs. Wheelchair accessible areas are located at Lake Tappan and Woodcliff Lake.
For a permit application, please visit suezwatershed.com or call 845-623-1500.