your our platform solution · maintenance contracts, aud 450 m, ugl (02/2020) maintenance,...
TRANSCRIPT

1
Investor Relations
Company Presentation
Q1 2020 results,
May 12, 2020
Marcelino Fernández Verdes, CEOPeter Sassenfeld, CFOMike Pinkney, Head of Corporate StrategyTobias Loskamp, Head of Capital Markets Strategy
OUR SOLUTION
YOUR PLATFORM
© H
annah P
alu
dan
Krist
ense
n
© Martin Barraud

2
Table of contents
© HOCHTIEF
© CPB Contractors© TWA Hotel/David Mitchell
© HOCHTIEF
Highlights 3
Cash flow 5
Net cash 6
Recent project awards 7
Order book 8
Americas 9
Asia Pacific 10
Europe 11
Abertis 12
Outlook and dividend 13
Appendix
Group overview & one-offs 15
P&L 16 Balance sheet 17 Group financing structure 20 Americas 21 Asia Pacific 23 Europe 26 Abertis 30 f/x rates 32 HOCHTIEF Group overview 33
3
HOCHTIEF Group – Q1 2020 overview
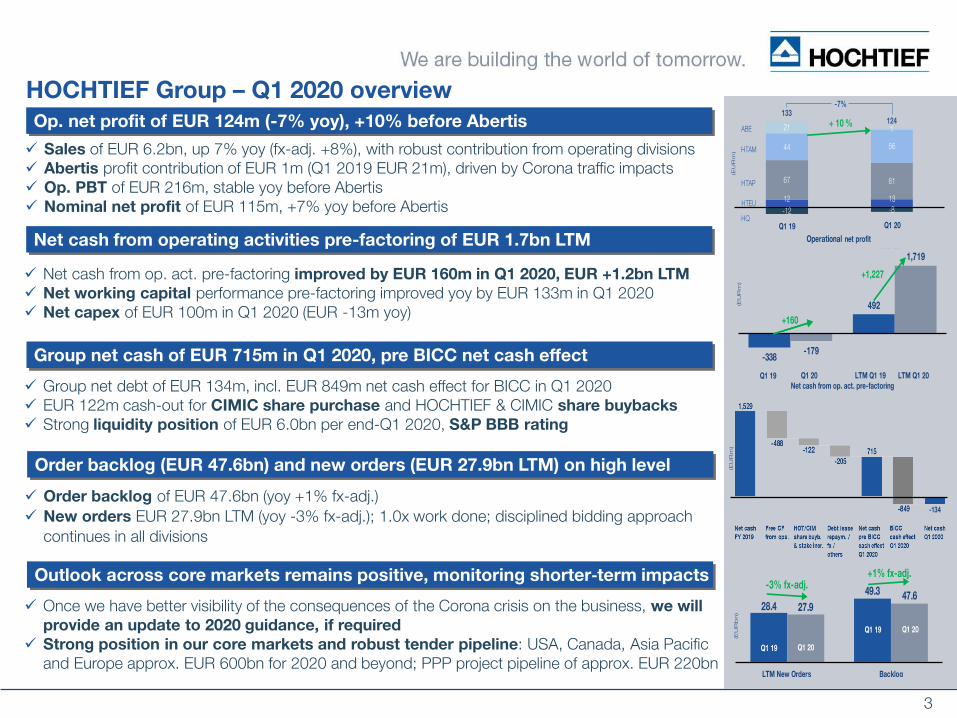
Sales of EUR 6.2bn, up 7% yoy (fx-adj. +8%), with robust contribution from operating divisions Abertis profit contribution of EUR 1m (Q1 2019 EUR 21m), driven by Corona traffic impacts Op. PBT of EUR 216m, stable yoy before Abertis Nominal net profit of EUR 115m, +7% yoy before Abertis
Net cash from op. act. pre-factoring improved by EUR 160m in Q1 2020, EUR +1.2bn LTM
Net working capital performance pre-factoring improved yoy by EUR 133m in Q1 2020 Net capex of EUR 100m in Q1 2020 (EUR -13m yoy)
Net cash from operating activities pre-factoring of EUR 1.7bn LTM
Group net debt of EUR 134m, incl. EUR 849m net cash effect for BICC in Q1 2020 EUR 122m cash-out for CIMIC share purchase and HOCHTIEF & CIMIC share buybacks
Strong liquidity position of EUR 6.0bn per end-Q1 2020, S&P BBB rating
Group net cash of EUR 715m in Q1 2020, pre BICC net cash effect
Order backlog of EUR 47.6bn (yoy +1% fx-adj.)
New orders EUR 27.9bn LTM (yoy -3% fx-adj.); 1.0x work done; disciplined bidding approach
continues in all divisions
Order backlog (EUR 47.6bn) and new orders (EUR 27.9bn LTM) on high level
Once we have better visibility of the consequences of the Corona crisis on the business, we will
provide an update to 2020 guidance, if required
Strong position in our core markets and robust tender pipeline: USA, Canada, Asia Pacific and Europe approx. EUR 600bn for 2020 and beyond; PPP project pipeline of approx. EUR 220bn
Outlook across core markets remains positive, monitoring shorter‐term impacts
Op. net profit of EUR 124m (-7% yoy), +10% before Abertis
H1 19 H1 19H1 18 * H1 18 *
Q1 20
7%
-34%
-8%
27%
12 13
67 61
44 56
21 1
-12 -8
133
124
(EU
Rm
)
-7%
Operational net profit
28.4
49.3
27.9
47.6
LTM New Orders Backlog
(EU
Rb
n)
-3% fx-adj.
Q1 19 Q1 20
Q1 19 Q1 20
+1% fx-adj.
(EU
Rm
)
HTAM
HTAP
HQ
ABE
HTEU
-338
492
-179
1,719
(EU
Rm
)
Net cash from op. act. pre-factoring
Q1 19 Q1 20 LTM Q1 20LTM Q1 19
+160
+1,227
Q1 19 Q1 20
-134
+ 10 %
4
HOCHTIEF Group – Q1 2020 key figures
(EUR million)
Q1
2020
Q1
2019
Δ Q1
in %
Δ Q1
in EURm
LTM
Q1 2020
FY
2019
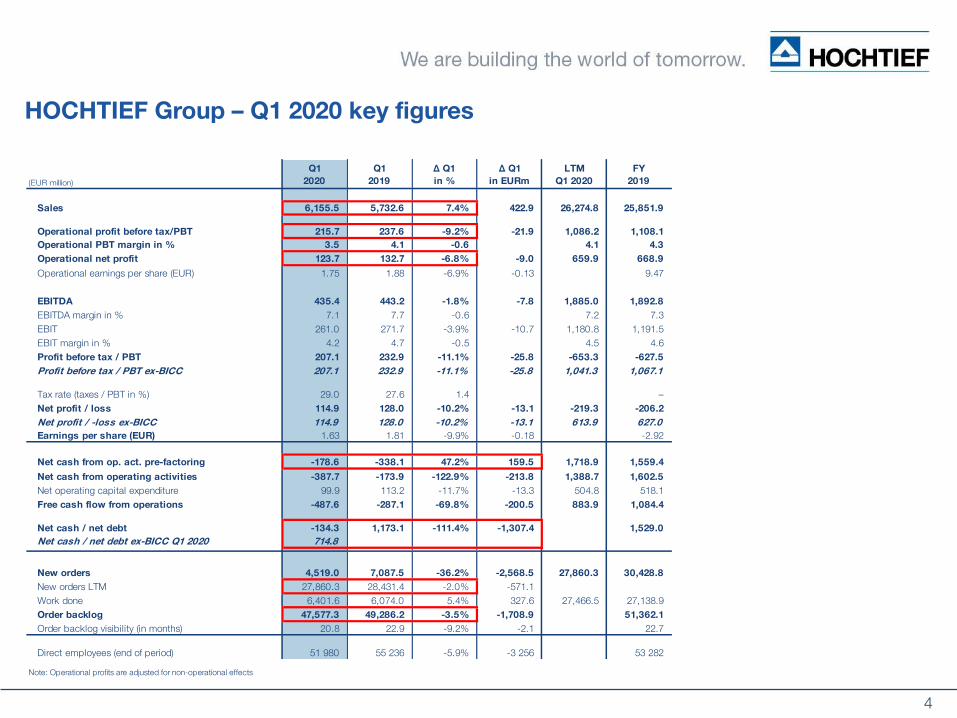
Sales 6,155.5 5,732.6 7.4% 422.9 26,274.8 25,851.9
Operational profit before tax/PBT 215.7 237.6 -9.2% -21.9 1,086.2 1,108.1
Operational PBT margin in % 3.5 4.1 -0.6 4.1 4.3
Operational net profit 123.7 132.7 -6.8% -9.0 659.9 668.9
Operational earnings per share (EUR) 1.75 1.88 -6.9% -0.13 9.47
EBITDA 435.4 443.2 -1.8% -7.8 1,885.0 1,892.8
EBITDA margin in % 7.1 7.7 -0.6 7.2 7.3
EBIT 261.0 271.7 -3.9% -10.7 1,180.8 1,191.5
EBIT margin in % 4.2 4.7 -0.5 4.5 4.6
Profit before tax / PBT 207.1 232.9 -11.1% -25.8 -653.3 -627.5
Profit before tax / PBT ex-BICC 207.1 232.9 -11.1% -25.8 1,041.3 1,067.1
Tax rate (taxes / PBT in %) 29.0 27.6 1.4 –
Net profit / loss 114.9 128.0 -10.2% -13.1 -219.3 -206.2
Net profit / -loss ex-BICC 114.9 128.0 -10.2% -13.1 613.9 627.0
Earnings per share (EUR) 1.63 1.81 -9.9% -0.18 -2.92
Net cash from op. act. pre-factoring -178.6 -338.1 47.2% 159.5 1,718.9 1,559.4
Net cash from operating activities -387.7 -173.9 -122.9% -213.8 1,388.7 1,602.5
Net operating capital expenditure 99.9 113.2 -11.7% -13.3 504.8 518.1
Free cash flow from operations -487.6 -287.1 -69.8% -200.5 883.9 1,084.4
Net cash / net debt -134.3 1,173.1 -111.4% -1,307.4 1,529.0
Net cash / net debt ex-BICC Q1 2020 714.8
New orders 4,519.0 7,087.5 -36.2% -2,568.5 27,860.3 30,428.8
New orders LTM 27,860.3 28,431.4 -2.0% -571.1 30,428.8
Work done 6,401.6 6,074.0 5.4% 327.6 27,466.5 27,138.9
Order backlog 47,577.3 49,286.2 -3.5% -1,708.9 51,362.1
Order backlog visibility (in months) 20.8 22.9 -9.2% -2.1 22.7
Direct employees (end of period) 51 980 55 236 -5.9% -3 256 53 282
Note: Operational profits are adjusted for non-operational effects

5
HOCHTIEF Group – Cash Flow performance
• Net cash from operating activities of EUR -179m pre-factoring in Q1 2020 reflects first quarter seasonality;improvement of EUR 160m yoy; LTM EUR +1.2bn to EUR 1.7bn Q1 2020 net cash-inflow from op. act. pre working capital of EUR 366m, up EUR 27m yoy
• Factoring volume down qoq by EUR 0.2bn to EUR 1.5bn per end-Q1 2020 (yoy EUR -0.3bn)
• Net op. capex during Q1 2020 down yoy by EUR 13m
• Free Cash flow from ops. pre-factoring EUR +173m yoy to EUR -279m in Q1 2020; EUR +1.1bn LTM
(EUR million)
Q1
2020
Q1
2019
∆
Q1
LTM
Q1 2020
LTM
Q1 2019
∆
LTM
FY
2019
Net cash from op. act. pre NWC change 365.9 339.4 26.5 1,529.0 1,366.8 162.2 1,502.5
NWC change -753.6 -513.3 -240.3 -140.3 163.0 -303.3 100.0
Net cash from operating activities -387.7 -173.9 -213.8 1,388.7 1,529.8 -141.1 1,602.5
Net cash from op. act. pre-factoring -178.6 -338.1 159.5 1,718.9 492.2 1,226.7 1,559.4
Gross operating capital expenditure -106.1 -116.8 10.7 -531.8 -450.9 -80.9 -542.5
Operating assets disposals 6.2 3.6 2.6 27.0 67.6 -40.6 24.4
Net operating capital expenditure -99.9 -113.2 13.3 -504.8 -383.3 -121.5 -518.1
Free cash flow from operations -487.6 -287.1 -200.5 883.9 1,146.5 -262.6 1,084.4
Free cash from operations pre-factoring -278.5 -451.3 172.8 1,214.1 108.9 1,105.2 1,041.3

6
HOCHTIEF Group – Net cash development
Key drivers of net cash Q1 2020 qoq
Net cash (+) / net debt (-)
EURm
period end (EUR million)
Q1
2020
Q1
2019
D
yoy
D
qoq
FY
2019
HOCHTIEF Group -134 1,173 -1,307 -1,663 1,529
HOCHTIEF Americas 1,156 1,010 145 -312 1,467
HOCHTIEF Asia Pacific -532 972 -1,504 -1,090 559
HOCHTIEF Asia Pacific ex-BICC 318 972 -655 -489 807
HOCHTIEF Europe 354 249 105 -158 511
Corp. HQ, Abertis, consolidation -1,112 -1,058 -54 -104 -1,008
• HOCHTIEF net debt position of EUR 134m
per end-Q1 2020
• Adjusting for the EUR 849m net cash
effect for BICC (incl. negative fx-effects at CIMIC) in the quarter, net cash would stand at EUR 715m
• Factoring volume down EUR 0.2bn qoq to EUR 1.5bn at end-Q1 2020 (EUR -0.3bn yoy)
• During Q1 2020 HOCHTIEF
invested a total EUR 100m in net op.
capex to support the Group’s growth,
invested EUR 101m in the purchase of
CIMIC shares
Additionally HOCHTIEF & CIMIC carried
out share buybacks of EUR 21m
• Strong liquidity position of EUR 6.0bn per end-Q1 2020
• S&P BBB rating remains unchanged with a stable outlook for HOCHTIEF and CIMIC as published in January 2020 post announcement of CIMIC’s decision to exit the Middle East region

7
HOCHTIEF Group – Selected recent significant project announcements
Rail sector contracts, AUD 180 m,
UGL (03/2020) operations and maintenance of Adelaide’s North-South tram and bus network and manufacturing of new locomotives, Newcastle, NSW, Australia
Port Wakefield to Port Augusta
Regional Projects Alliance, AUD 237
m, CPB Contractors (03/2020), South Australia
Maintenance contracts, AUD 450 m,
UGL (02/2020) maintenance, turnarounds and project services for clients in the oil and gas sector in Western Australia and Victoria, Australia
Sydney Metro City & Southwest
PPP, UGL & Pacific Partnerships,
AUD 3.7 bn (11/2019) JV, contract extension to operate and maintain the full metro line form Rouse Hill to Bankstown, NSW, Australia
Perth Metronet, CPB Contractors,
AUD 423 m (11/2019) Yanchep rail extension and Thornlie – Cockburn Link as part of Perth Metronet Program, Western Australia
Monash Freeway Upgrade, AUD 761
m, CPB Contractors (09/2019) design and construct of an interchange, Victoria, Australia
Western Sydney Airport, AUD 644 m,
CPB Contractors (09/2019) earthworks project, Australia
Route 210, USD 136 m, Flatiron
(03/2020) rehabilitation and lane replacements of a portion in Los Angeles, California, USA
Love Field Airport, USD 124 m,
Flatiron (03/2020) reconstruction of Taxiway C, Dallas, Texas, USA
Hospital, Turner (02/2020) new bed tower and clinical services podium adjacent to the existing Wexner Medical Center, Columbus, Ohio, USA
Research Building 4, Turner (03/2020) construction of a research facility and high-rise for Nationwide Children’s Hospital in Columbus, Ohio, USA
Nursing and Health school, Turner
(02/2020) preconstruction/construction management services for a 13-story, mid-rise academic tower on Drexel University Campus, Philadelphia, Pennsylvania, USA
Apartment Tower, Turner (02/2020) construction of 24-story, 214-unit mixed-use building in Portland, Oregon, USA
Waverly Unity Church Site, Turner
(09/19) residential complex with 374 units, Seattle, USA
Terminal C Orlando International
Airport, Turner (08/2019) in Orlando, Florida, USA
Cross River Rail, Pacific
Partnerships, AUD 6.3bn, CPB
Contractors & UGL (04/08/2019) tunnel, stations and development (PPP) / Rail Integration and Systems Alliance package in Brisbane, Australia
Campbelltown and Nepean
Hospital, AUD 803 m, CPB
Contractors (08/2019), redevelopment work in NSW, Australia
Curragh Mine, AUD 1.3 bn,
Thiess (09/2019) 6-year contract extension to provide mining services in Queensland, Australia
Hessian Police, HOCHTIEF
(11/2019) Refurbishment, modernization and operation of 50 buildings in Mühlheim/Main and Kassel, Germany
London Power Tunnels,
HOCHTIEF, GBP 400 m (12/2019) JV, second phase of the project for the energy supply of London
Dutch A12/A15 motorway
project (ViA15), HOCHTIEF, EUR
1.2 bn (01/2020) JV, design, construction, finance, operation and maintenance, vicinity of Arnhem, Netherlands

8
22.3 22.9 23.6 23.6 23.4
23.3 22.723.1 23.5
20.1
3.7 3.83.8 4.3
4.1
49.3 49.450.5 51.4
47.6
Q1 2019 H1 2019 9M 2019 FY 2019 Q1 2020
100%
% of
total
9%
42%
49%
-3%; +1% fx-adjusted
14.7 15.9
11.8 9.5
1.82.3
28.4 27.9
LTM Q1 2019 LTM Q1 2020
-2% ; -3% fx-adj.
HOCHTIEF Group – Order backlog and New orders
Order backlog (EUR bn)
* New orders excl. f/x-effects within CIMIC backlog
New orders (EUR bn)
• HOCHTIEF Group:
Order backlog remained on high level at EUR 47.6bn (+1% yoy, fx-adjusted). Q1 2020 includes approx. EUR 2.2bn negative
fx-effects. Focus remains on developed markets. Enhanced quality with approx. 2/3 of order book in construction mgt.,
mining, services & alliance-style construction contracts
New orders EUR 27.9bn LTM (-3% fx-adj.), 1.0x work done; disciplined bidding approach continues in all divisions
• Americas: Order backlog +5% yoy, +2% fx-adj., new orders EUR 15.9bn LTM (+8% nom., +4% fx-adj.), >1.0x work done LTM
• Asia Pacific: EUR 20.1bn order backlog (OpCos stable yoy with -1%), order intake of EUR 9.5bn LTM (-17% fx-adj.), visibility of
25 months at CIMIC
• Europe: Order backlog up 12% yoy to EUR 4.1bn; visibility of 37 months. New orders EUR 2.3bn LTM (+26%), 1.5x work done
• Strong pipeline of projects to be tendered and / or awarded in key markets identified – in total approx. EUR 600bn:
Asia Pacific (52% of total): CIMIC: AUD 90bn in 2020, and around AUD 400bn in 2021+
Americas (38%): Turner: USD 70bn in 2020, USD 89bn beyond that; Flatiron: USD 16bn in 2020, USD 60bn 2021+
Europe (11%): EUR 16bn in 2020, about EUR 60bn in total
• PPP project pipeline of approx. EUR 220bn
9
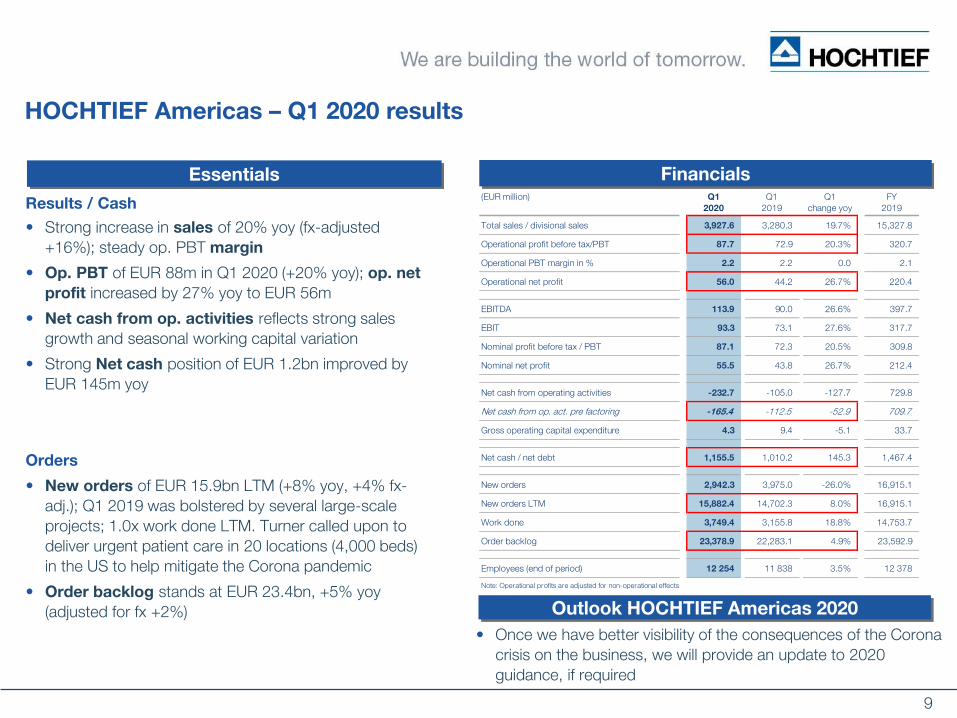
Essentials
Outlook HOCHTIEF Americas 2020
• Once we have better visibility of the consequences of the Corona
crisis on the business, we will provide an update to 2020
guidance, if required
Financials
HOCHTIEF Americas – Q1 2020 results
Results / Cash
• Strong increase in sales of 20% yoy (fx-adjusted
+16%); steady op. PBT margin
• Op. PBT of EUR 88m in Q1 2020 (+20% yoy); op. net
profit increased by 27% yoy to EUR 56m
• Net cash from op. activities reflects strong sales
growth and seasonal working capital variation
• Strong Net cash position of EUR 1.2bn improved by
EUR 145m yoy
Orders
• New orders of EUR 15.9bn LTM (+8% yoy, +4% fx-
adj.); Q1 2019 was bolstered by several large-scale
projects; 1.0x work done LTM. Turner called upon to
deliver urgent patient care in 20 locations (4,000 beds)
in the US to help mitigate the Corona pandemic
• Order backlog stands at EUR 23.4bn, +5% yoy
(adjusted for fx +2%)
(EUR million) Q1
2020
Q1
2019
Q1
change yoy
FY
2019
Total sales / divisional sales 3,927.6 3,280.3 19.7% 15,327.8
Operational profit before tax/PBT 87.7 72.9 20.3% 320.7
Operational PBT margin in % 2.2 2.2 0.0 2.1
Operational net profit 56.0 44.2 26.7% 220.4
EBITDA 113.9 90.0 26.6% 397.7
EBIT 93.3 73.1 27.6% 317.7
Nominal profit before tax / PBT 87.1 72.3 20.5% 309.8
Nominal net profit 55.5 43.8 26.7% 212.4
Net cash from operating activities -232.7 -105.0 -127.7 729.8
Net cash from op. act. pre factoring -165.4 -112.5 -52.9 709.7
Gross operating capital expenditure 4.3 9.4 -5.1 33.7
Net cash / net debt 1,155.5 1,010.2 145.3 1,467.4
New orders 2,942.3 3,975.0 -26.0% 16,915.1
New orders LTM 15,882.4 14,702.3 8.0% 16,915.1
Work done 3,749.4 3,155.8 18.8% 14,753.7
Order backlog 23,378.9 22,283.1 4.9% 23,592.9
Employees (end of period) 12 254 11 838 3.5% 12 378
Note: Operational profits are adjusted for non-operational effects

10
HOCHTIEF Asia Pacific, CIMIC (in AUD) – Q1 2020 results
Essentials
Results / Cash
• Net profit of AUD 166m on revenue of AUD 3.3bn led to robust EBIT, PBT and NPAT margins of 8.4%, 6.9% and 5.0% respectively
• Operating cash flow pre-factoring increased by AUD 892m in LTM, factoring balance down by AUD 203m yoy
• Continuing strict focus on managing working capital and generating sustainable cash-backed profits
• Net debt of AUD 991m, or AUD 462m net cash if adjusted for Q1 2020 impact of Middle East exit
• In January 2020 Moody’s (Baa2/Stable) and S&P
(BBB/Stable/A-2) reaffirmed solid investment grade credit ratings, after the Middle East exit announcement
Work in hand / pipeline
• Stable Work in hand of AUD 36.1bn is equivalent to more than two years’ worth of revenue. AUD 2.5bn of new work
awarded in Q1 2020, disciplined bidding maintained
• AUD 90bn of tenders relevant to CIMIC to be bid and / or awarded for the remainder of 2020, and around AUD 400bn for 2021 and beyond, incl. AUD 130bn worth of PPP projects
Financials
Outlook 2020 CIMIC
• Once CIMIC has better visibility of the consequences of
COVID‐19 on the business, CIMIC will provide an update
to 2020 profit guidance, if required
(AUD m) Q1 2020 Q1 2019 % change
Revenue1 3,305.0 3,407.7 -3.0%
EBITDA 521.3 502.3 3.8%
EBITDA margin 15.8% 14.7% 1.1pp
D&A -242.5 -224.1 -8.2%
Operating profit2
278.8 278.2 0.2%
Operating profit margin 8.4% 8.2% 0.2pp
Net finance costs -50.8 -30.5 -66.6%
Profit before tax 228.0 247.7 -8.0%
PBT margin 6.9% 7.3% -0.4pp
Income tax -66.1 -66.9 1.2%
Effective tax rate 29.0% 27.0% 2.0pp
Non-controlling interests 4.1 0.3 -
NPAT 166.0 181.1 -8.3%
NPAT margin3
5.0% 5.3% -0.3pp
Earnings per share (basic) - NPAT 51.3c 55.8c -8.1%
(AUD m) Q1 2020 Q1 2019 % change LTM
Operating cash flow4 pre-factoring -16.3 50.1 1,640.6
Variation in factoring -10.3 200.0 -203.0
Operating cash flow4
-26.6 250.1 1,437.6
Interest, finance costs and taxes -103.2 -70.9 -45.6% -496.1
Net operating cash flow -129.8 179.2 941.5
Gross capital expenditure -162.9 -165.2 1.4% -772.1
Gross capital proceeds 5.7 4.9 16.3% 23.3
Net capital expenditure -157.2 -160.3 1.9% -748.8
Free operating cash flow5
-287.0 18.9 192.7
(AUD m) Mar 2020
BICC/FX
one-off8
Mar 2020
(excl. BICC) Dec 2019
Net cash/(debt), excl. leases6
-991.4 1,452.9 461.5 831.6
Lease liabilities -880.5 0.0 -880.5 -902.1
Net cash/(debt), after all leases6
-1,871.9 1,452.9 -419.0 -70.5
Net contract debtors7
1,537.0 1,374.4
(AUD m) Q1 2020 Q1 2019 % change Dec 2019
Operating Companies' work in hand 33,849.0 34,200.0 -1.0% 35,316.0
Corporate9
2,212.0 2,681.0 -17.5% 2,195.0
Total work in hand10
36,061.0 36,881.0 -2.2% 37,511.0
1 Revenue excludes revenue from joint ventures and associates of AUD 611.2m (Q1 19: AUD 642.6m)
2 Operating profit is EBIT adjusted for any one-off items. No one-off items in Q1 2020 or Q1 2019
3 Margins are calculated on revenue which excludes revenue from joint ventures and associates
4 Operating cash flow includes cash flow from operating activities and changes in short term financial assets and investments before interest, finance
costs and taxes
5 Free operating cash flow is defined as net operating cash flow less net capital expenditure for property, plant and equipment
6 Net cash/debt includes cash and equivalent liquid assets (which includes cash, cash equivalents and short term financial assets and investments)
7 Net contract debtors represents the net of amounts due from customers and amounts due to customers
8 Payments for Middle East exit of AUD 1.45bn gross of tax included in statutory net cash
9 Corporate work in hand includes work in hand from CIMIC's share of investments of Ventia
10 WIH includes work in hand from CIMIC's share of work in hand from joint ventures and associates

11
HOCHTIEF Europe – Q1 2020 results
Essentials Financials
Outlook 2020 HOCHTIEF Europe
• Once we have better visibility of the consequences of
the Corona crisis on the business, we will provide an
update to 2020 guidance, if required
Results / Cash
• Sales of EUR 264m reflect disciplined bidding approach and progress of long-term projects acc. to schedule
• Op. PBT yoy stable at EUR 13m
• Op. Net profit up EUR 1m yoy to EUR 13m in Q1 2020
• Net cash from op. activities in Q1 reflects seasonality; solid underlying improvement of EUR 63m yoy
• Solid net cash position of EUR 354m, up EUR 105m yoy
• Real estate net assets <EUR 100m
Orders
• New orders of EUR 537m up 20% yoy, EUR 2.3bn LTM (+26%), equivalent to 1.5x work done
• Order backlog up 12% yoy to EUR 4.1bn. Visibility of 37 months
(EUR million) Q1
2020
Q1
2019
Q1
change yoy
FY
2019
Total sales / divisional sales 264.0 281.5 -6.2% 1,233.0
Operational profit before tax/PBT 13.2 13.2 0.0% 66.3
Operational PBT margin in % 5.0 4.7 0.3 5.4
Operational net profit 13.3 12.4 7.3% 61.0
EBITDA 29.8 23.9 24.7% 97.3
EBIT 18.7 11.3 65.5% 49.6
Nominal Profit before tax / PBT 10.2 10.2 0.0% 53.8
Nominal Net profit 10.2 9.2 10.9% 45.4
Net cash from operating activities -67.0 -129.6 62.6 42.3
Gross operating capital expenditure 3.0 2.2 0.8 11.0
Net cash / net debt 353.8 249.0 104.8 511.4
New orders 537.4 448.6 19.8% 2,227.6
Work done 331.1 342.2 -3.2% 1,534.0
Order backlog 4,127.8 3,696.8 11.7% 4,318.0
Employees (end of period) 5 214 5 393 -3.3% 5 314
of which Germany 3 262 3 282 -0.6% 3 336
Note: Operational profits are adjusted for non-operational effects

12
Abertis – Q1 2020 results
(EUR million) Q1
2020
Q1
2019
change
yoy
FY
2019
Nominal result
EBITDA 1.2 21.4 -94.2% 122.4
Profit before tax / PBT 1.2 21.4 -94.2% 122.4
Net profit / NPAT 1.2 21.4 -94.2% 122.4
Operational result
Profit before tax / PBT 1.2 21.4 -94.2% 122.4
Net profit / NPAT 1.2 21.4 -94.2% 122.4
Abertis - dividend received 0.0 0.0 n.a. 172.8
Abertis key financial figures (100%)
(EUR million) Q1
2020
Q1 2019
change
yoy
FY 2019
Operating revenues 1,043 1,221 -15% 5,361
EBITDA 667 801 -17% 3,737
Net profit 119 231 -48% 1,101
• Traffic performance of -11% yoy in Q1 2020 impacted by temporary lockdown measures in key markets starting in March 2020: Spain -13%, France -12%, Brazil -4%, Chile -19%, Italy -22%
• As a result revenue decreased by -15% yoy to EUR 1.0bn and EBITDA decreased by -17% yoy
• Abertis’ net profit fell to EUR 119m in Q1 2020
• Abertis profit contribution to HOCHTIEF (20% stake) after PPA subsequently at EUR 1.2m
• On 28th April 2020 Abertis paid half of the EUR 875m dividend to its shareholders (EUR 86m HOCHTIEF share of 1st tranche). The AGM resolved the other half shall be paid in Q4 2020 subject to verification by the Abertis board of directors of Covid-19 impacts
• Strong liquidity position after recent capital market transactions
• RCO acquisition expected to close end of Q2
Abertis – Key Figures (100%)Essentials
Abertis investment – contribution to HOCHTIEF

13
HOCHTIEF Group – Outlook and dividend
1.00
1.50 1.702.00
2.60
3.38
4.98
5.80
0.20
2012 2013 2014 2015 2016 2017 2018 2019
Proposal
+ 50%
+ 13%
+ 18%
+ 30%
+ 30%
* special dividend
*
+16%
+ 47%
Dividend (EUR / HOT share)
Guidance 2020
Once we have better visibility of the consequences of the
Corona crisis on the business, we will provide an update to
2020 guidance, if required
FY 2019 dividend of EUR 5.80 / share
Solid operational performance of geographically diversified
core business, robust balance sheet and positive outlook drive
increase in dividend
16% increase yoy, CAGR 2012-19 of 29%
Total HOCHTIEF dividend payment of EUR 410m (EUR 352m
for 2018)
Payout of 65% of EUR 627m nominal net profit FY 2019 pre-
BICC one-off effect
Organic growth opportunities
Strong pipeline of projects to be tendered and / or awarded
in key markets – in total about EUR 600bn
Asia Pacific (52% of total)
Americas (38%)
Europe (11%)
Significant PPP opportunities of approx. EUR 220bn in
all core HOCHTIEF markets

14
Appendix: Q1 2020
The Spiral, New York, USA
©Marcel Steinbach
© T
ishm
an
Sp
eye
r

15
HOCHTIEF Group - overview
Non-operational effects reconciliation:
EUR millionPBT Net profit PBT Net profit PBT Net profit
Nominal earnings 207.1 114.9 232.9 128.0 -627.5 -206.2
Non-operational effects 8.6 8.8 4.7 4.7 1,735.6 875.1
Operational earnings 215.7 123.7 237.6 132.7 1,108.1 668.9
Q1 2020 FY 2019Q1 2019
HOCHTIEF Group
(EUR million)
Orders (nominal)
New orders 4,519.0 7,087.5 -36.2% 30,428.8
HOCHTIEF Americas 2,942.3 3,975.0 -26.0% 16,915.1
HOCHTIEF Asia Pacific 1,006.6 2,639.2 -61.9% 11,134.5
HOCHTIEF Europe 537.4 448.6 19.8% 2,227.6
HQ/Consolidation 32.7 24.7 32.4% 151.6
Work done 6,401.6 6,074.0 5.4% 27,138.9
HOCHTIEF Americas 3,749.4 3,155.8 18.8% 14,753.7
HOCHTIEF Asia Pacific 2,288.6 2,552.9 -10.4% 10,701.8
HOCHTIEF Europe 331.1 342.2 -3.2% 1,534.0
HQ/Consolidation 32.5 23.1 40.7% 149.4
Order backlog (yoy) 47,577.3 49,286.2 -3.5% 51,362.1
HOCHTIEF Americas 23,378.9 22,283.1 4.9% 23,592.9
HOCHTIEF Asia Pacific 20,070.9 23,311.1 -13.9% 23,451.7
HOCHTIEF Europe 4,127.8 3,696.8 11.7% 4,318.0
HQ/Consolidation -0.3 -4.8 93.8% -0.5
P&L-key figures (nominal)
Sales (nominal) 6,155.5 5,732.6 7.4% 25,851.9
HOCHTIEF Americas 3,927.6 3,280.3 19.7% 15,327.8
HOCHTIEF Asia Pacific 1,931.4 2,147.9 -10.1% 9,143.2
HOCHTIEF Europe 264.0 281.5 -6.2% 1,233.0
HQ/Consolidation 32.5 22.9 41.9% 147.9
EBITDA 435.4 443.2 -1.8% 1,892.8
HOCHTIEF Americas 113.9 90.0 26.6% 397.7
HOCHTIEF Asia Pacific 303.9 318.4 -4.6% 1,334.2
HOCHTIEF Europe 29.8 23.9 24.7% 97.3
HQ/Consolidation -12.2 10.9 -211.9% 63.6
EBIT 261.0 271.7 -3.9% 1,191.5
HOCHTIEF Americas 93.3 73.1 27.6% 317.7
HOCHTIEF Asia Pacific 162.2 177.1 -8.4% 763.5
HOCHTIEF Europe 18.7 11.3 65.5% 49.6
HQ/Consolidation -13.2 10.2 -229.4% 60.7
Profit before tax (nominal) 207.1 232.9 -11.1% -627.5
HOCHTIEF Americas 87.1 72.3 20.5% 309.8
HOCHTIEF Asia Pacific 120.6 140.0 -13.9% -1,065.5
HOCHTIEF Europe 10.2 10.2 0.0% 53.8
HQ/Consolidation -10.8 10.4 -203.8% 74.4
PBT-margin on sales (nominal) 3.4 4.1 -0.7 -2.4
HOCHTIEF Americas 2.2 2.2 0.0 2.0
HOCHTIEF Asia Pacific 6.2 6.5 -0.3 -11.7
HOCHTIEF Europe 3.9 3.6 0.3 4.4
HQ/Consolidation -33.2 45.4 -78.6 50.3
Net profit (nominal) 114.9 128.0 -10.2% -206.2
HOCHTIEF Americas 55.5 43.8 26.7% 212.4
HOCHTIEF Asia Pacific 61.1 66.6 -8.3% -525.9
HOCHTIEF Europe 10.2 9.2 10.9% 45.4
HQ/Consolidation -11.9 8.4 -241.7% 61.9
FY
2019
Q1
2020
Q1
2019
Δ %
Q1
HOCHTIEF Group
(EUR million)
P&L-key figures (operational)
Profit before tax (operational) 215.7 237.6 -9.2% 1,108.1
PBT-margin on sales (operational) 3.5 4.1 -0.6 4.3
Net profit (operational) 123.7 132.7 -6.8% 668.9
Cash & Capex
Net cash from operating activities -387.7 -173.9 -122.9% 1,602.5
HOCHTIEF Americas -232.7 -105.0 -121.6% 729.8
HOCHTIEF Asia Pacific -88.7 100.9 -187.9% 724.5
HOCHTIEF Europe -67.0 -129.6 48.3% 42.3
HQ/Consolidation 0.7 -40.2 101.7% 105.9
Gross operating capex 106.1 116.8 -9.2% 542.5
HOCHTIEF Americas 4.3 9.4 -54.3% 33.7
HOCHTIEF Asia Pacific 97.4 104.5 -6.8% 491.2
HOCHTIEF Europe 3.0 2.2 36.4% 11.0
HQ/Consolidation 1.4 0.7 100.0% 6.6
Net operating capex 99.9 113.2 -11.7% 518.1
HOCHTIEF Americas 1.7 9.7 -82.5% 29.6
HOCHTIEF Asia Pacific 94.0 101.4 -7.3% 477.2
HOCHTIEF Europe 2.8 1.4 100.0% 4.7
HQ/Consolidation 1.4 0.7 100.0% 6.6
Net cash / net debt -134.3 1,173.1 -111.4% 1,529.0
Net cash / net debt ex-BICC 714.8 1,173.1 -39.1% 1,529.0
HOCHTIEF Americas 1,155.5 1,010.2 14.4% 1,467.4
HOCHTIEF Asia Pacific -531.5 972.2 -154.7% 558.6
HOCHTIEF Asia Pacific ex-BICC 317.6 972.2 -67.3% 558.6
HOCHTIEF Europe 353.8 249.0 42.1% 511.4
HQ/Consolidation -1,112.1 -1,058.3 -5.1% -1,008.4
Note: Operational profits are adjusted for non-operational effects
FY
2019
Q1
2020
Q1
2019
Δ %
Q1

16
HOCHTIEF Group – Statement of earnings
• Sales: +7% yoy (fx-adjusted +8%). 97% sales are international.
• Materials & personnel costs: increased yoyin line with sales growth
• Result from equity accounted companies:
Lower earnings contribution from Abertisovercompensated by higher earnings contributions from Joint Ventures
• Tax rate: decrease yoy, if adjusted by profit contribution of equity accounted investment in Abertis
HOCHTIEF Group
(EUR million)
Sales 6,155.5 5,732.6 7.4%
Change in inventories 20.2 0.4 -4,950.0%
Materials -4,453.7 -4,039.1 10.3%
Personnel costs -1,093.3 -1,093.0 0.0%
Other operating income 48.6 63.2 -23.1%
Other operating expenses -285.1 -251.9 13.2%
Results from at equity accounted companies 31.3 27.9 -12.2%
Net non-operating expenses adjustment 11.9 3.1 -283.9%
EBITDA 435.4 443.2 -1.8%
Depreciation and amortization -174.4 -171.5 1.7%
EBIT 261.0 271.7 -3.9%
Net interest income and other financial result -42.0 -35.7 17.6%
Net non-operating expenses adjustment -11.9 -3.1 -283.9%
Profit before tax / PBT 207.1 232.9 -11.1%
Taxes -60.1 -64.2 -6.4%
Tax rate (taxes / PBT in %) 29.0 27.6 1.4
Profit after tax 147.0 168.7 -12.9%
Minority interest -32.1 -40.7 -21.1%
Consolidated net profit 114.9 128.0 -10.2%
Q1
2020
Q1
2019
∆ %
Q1

17
HOCHTIEF Group – Balance sheet (assets)
Non-current assets:
• Intangible assets, PPE and Equity method
investments: Decreased mainly due to fx-effects
• Deferred tax assets: Declined mainly due to fx-effects
Current assets:
• Trade receivables: Increase due to operational growth
• Marketable securities: Increase relates to cash investments by Corporate Headquarter
• Cash and cash equivalents: Strong group position of EUR 5.4bn
HOCHTIEF Group
(EUR million)
Assets 18,891.1 17,901.5 989.6
Non-current assets 5,710.6 6,064.7 -354.1
Intangible assets 1,135.7 1,187.2 -51.5
Property, plant and equipment 1,728.3 1,857.3 -129.0
Investment properties 3.8 3.8 0.0
Equity-method investments 1,823.7 1,927.8 -104.1
Other financial assets 80.0 83.7 -3.7
Financial receivables 116.3 97.9 18.4
Other receivables and other assets 174.2 166.2 8.0
Income tax assets 20.4 19.9 0.5
Deferred tax assets 628.2 720.9 -92.7
Current assets 13,180.5 11,836.8 1,343.7
Inventories 426.0 435.0 -9.0
Financial receivables 141.7 172.0 -30.3
Trade receivables and other receivables 6,582.3 6,317.7 264.6
Marketable securities 638.9 454.1 184.8
Cash and cash equivalents 5,391.6 4,458.0 933.6
Δ
FY
FY
2019
Q1
2020

18
HOCHTIEF Group – Balance sheet (liabilities and equity)
Shareholders’ equity:
Changes in Q1 2020
• Profit after taxes: EUR 147m• Fx-effects: EUR -36m• Dividends: EUR -10m• Share buyback programs: EUR -147m* • Other: EUR -56m
Non-current liabilities:
• Financial liabilities: Increased mainly due to the drawing of syndicated loan facilities
Current liabilities:
• Financial liabilities: Net increase due to short-term borrowing from banks, offsetting repayment of the HOCHTIEF AG bond due in March 2020 (EUR 750 million)
• Financial liabilities (exit from Middle East): Decreased due to payment of obligations as the majority of CIMIC’s financial guarantees of certain BICC liabilities materialized
• Trade payables and other liabilities: Decreased mainly due to seasonality and fx-effects
Supply Chain Financing balance of EUR 460m vs EUR 656m at December 2019, showing a strong decline during Q1 2020; SCF program under review
SCF included in trade payables
* = incl. purchase of CIMIC shares by HOCHTIEF
HOCHTIEF Group
(EUR million)
Liabilities and shareholders’ equity 18,891.1 17,901.5 989.6
Shareholders' equity 1,483.1 1,584.8 -101.7
Attributable to the group 1,174.2 1,275.6 -101.4
Minority interest 308.9 309.2 -0.3
Non-current liabilities 6,649.9 4,268.5 2,381.4
Provisions for pensions and similar obligations 411.7 428.2 -16.5
Other provisions 355.0 350.7 4.3
Financial liabilities 5,174.1 2,726.3 2,447.8
Lease liabilities 475.1 535.6 -60.5
Trade payables 111.7 125.6 -13.9
Other liabilities 71.6 59.7 11.9
Deferred tax liabilities 50.7 49.0 1.7
Current liabilities 10,758.1 12,048.2 -1,290.1
Other provisions 948.1 1,046.6 -98.5
Financial liabilities 1,242.8 944.0 298.8
Financial liabilities (exit from Middle East) 155.9 927.4 -771.5
Lease liabilities 245.7 255.9 -10.2
Trade payables and other liabilities 8,165.6 8,874.3 -708.7
Δ
FY
Q1
2020
FY
2019

19
HOCHTIEF Group – Statement of cash flows
HOCHTIEF Group
(EUR million)
Profit after tax / PAT 147.0 168.7 -21.7 -335.2
Depreciation, amortization, impairments and impairment reversals 169.4 170.5 -1.1 680.0
Changes in provisions -17.3 -12.0 -5.3 13.6
Changes in deferred taxes 46.5 27.4 19.1 -581.7
Gains / losses from disposals of non-current assets and marketable securities -4.2 -2.6 -1.6 -8.8
Other non-cash income and expenses and deconsolidations 24.5 -12.0 36.5 1,732.4
Net working capital change -753.6 -514.9 -238.7 99.5
Changes in other balance sheet items 0.0 -0.6 0.6 2.1
Cash flow from operating activities -387.7 -175.5 -212.2 1,601.9
Intangible assets, property, plant and equipment, and investment properties -99.8 -153.9 54.1 -563.0
Operational purchases -106.0 -116.8 10.8 -542.5
Other purchases 0.0 -40.7 40.7 -44.9
Payments from asset disposals 6.2 3.6 2.6 24.4
Acquisitions and participating interests -918.4 -46.4 -872.0 -154.7
Disbursements for the acquisition of Abertis HoldCo 0.0 0.0 0.0 -1.5
Other purchases -918.6 -47.2 -871.4 -179.3
Payments from asset disposals / divestments 0.2 0.8 -0.6 26.1
Changes in cash and cash equivalents due to changes in the scope of consolidation 1.4 12.3 -10.9 -0.4
Changes in marketable securities and financial receivables -221.7 -12.2 -209.5 -248.4
Cash flow from investing activities -1,238.5 -200.2 -1,038.3 -966.5
Payments from repurchase / sale of treasury stock -19.1 0.0 -19.1 1.5
Payments for repurchase of treasury stock at CIMIC -2.4 0.0 -2.4 -10.4
Payments into equity by non-controlling interests 4.5 0.0 4.5 17.1
Payments from equity to non-controlling interests -100.5 0.0 -100.5 -28.5
Dividends to HOCHTIEF`s and non-controlling interests -6.1 -1.5 -4.6 -462.0
Proceeds from new borrowing 3,829.4 51.7 3,777.7 2,233.2
Debt repayment -934.8 -97.8 -837.0 -1,249.0
Repayment of lease liabilities -69.3 -69.2 -0.1 -300.9
Cash flow from financing activities 2,701.7 -116.8 2,818.5 201.0
Net change in cash and cash equivalents 1,075.5 -492.5 1,568.0 836.4
Effects of exchange rates changes -141.9 71.6 -213.5 55.7
Overall change in cash & cash equivalents (acc. balance sheet) 933.6 -420.9 1,354.5 892.1
Cash and cash equivalents at the start of the year 4,458.0 3,565.9 892.1 3,565.9
Cash and cash equivalents at year-end 5,391.6 3,145.0 2,246.6 4,458.0
Q1
2020
Q1
2019
∆
Q1
FY
2019

20
HOCHTIEF Group financing structure Q1 2020
Net cash / Net debt calculation:
• Strong liquidity position of EUR 6.0bn per end-Q1 2020 (cash, cash equivalents and marketable securities)
• Limited refinancing requirements in 2020 of EUR 219m
• Repayment of EUR 750m bond which matured in March 2020; early refinancing executed in August 2019
• Existing cash credit facilities partly drawn-
down in March purely as a precautionary measure
end Q1 2020 endQ1 2019 end FY 2019
period end (EUR m)
Cash and cash equivalents 5,392 3,145 4,458
Marketable securities 639 463 454
Financial Receivables 252 237 287
Financial assets 6,282 3,845 5,199
Bonds or notes issued 1,720 2,045 2,501
Amounts due to banks 4,653 603 1,130
Other financial liabilities 43 27 39
Financial liabilities 6,416 2,676 3,670
Net cash (+) / Net debt (-) -134 1,169 1,529
ufn = until further notice

21
HOCHTIEF Americas
TWA Hotel, New York, USA
©LINXS©ScottPease/peasephotography.com © TWA Hotel/David Mitchell

22
13%
38%
14%
16%
5%
3%
4%7% Transportation/Misc
Commercial/Data/Retail
Education/R&D
Healthcare
Hotel/Residential
Industrial
Public/Justice
Sports/Entertainment
52%
8%
23%
6%
11% Transmission
Highway
Bridges
Transit
Airports
Water
Others
Civil:
• Flatiron #9 US transportation infrastructure contractor also ranks high in segments: highway, bridge, transport/rail and water contractors1),active in Western parts of the US, Texas, North & South Carolina, West Virginia & Canada
• Most contracts are local government contracts; e.g. several contracts with the California Department of Transportation and the Colorado Department of Transportation.
• Additional footprint in Eastern US infra market through E.E. Cruz, New York region
HOCHTIEF Americas
Segmental overview
Building:
• Turner #1 US building construction management company, Market Leader in sustainable construction (Green Building), healthcare, education, commercial offices and hotels & convention centers segments1)
• Segment-specific expertise and nation-wide network provide competitive advantage
• Strong reputation as construction manager provides quality contracts from repeat customers: limited risks, low fixed costs, low capital intensity
• 80% private clients, 20% government contracts
1) Source: latest ENR ranking
Order backlog FY 2019

23
HOCHTIEF Asia Pacific
WestConnex, Sydney, Australia
©Thiess© image courtesy of CPB Contractors
© C
PB
Contr
acto
rs©
CP
B C
ontr
acto
rs

24
HOCHTIEF Asia Pacific
• Results:
• reflects HOCHTIEF’s stake in CIMIC (76.1% end March
2020, increased by 340 ppt yoy), associated financing &
holding costs, and impact of variations in f/x
• Nominal Net profit of EUR 61m, stable yoy fx-adjusted,
PBT margin slightly down yoy to 6.2%
• Net debt position of EUR 531m, adjusting for the EUR
849m net cash effect for BICC (incl. adverse fx-effects at
CIMIC) in the quarter, net cash would stand at EUR 318m
New orders / order backlog:
• Strong, diversified order book at EUR 20.0bn, equivalent to
over 2.2 years’ sales
• Project pipeline across all operating companies:
Major projects CIMIC is currently bidding for:
e.g. Western Harbour Tunnel and Waringah Freeway
Upgrade; Sydney Metro Greater West – North South Rail Link
Stage 1 PPP; M6 Stage 1; Inland Rail PPP; Lake Vermont
mining extension; Third Runway Concourse and Apron
Works, Honk Kong; Terminal 2 Expansion Works; Hong
Kong; KPC mining extension 2022
Financials
Outlook 2020 CIMIC
• Once CIMIC has better visibility of the consequences of COVID‐19 on the business, CIMIC will provide an update to 2020 profit
guidance, if required
(EUR million) Q1
2020
Q1
2019
Q1
change yoy
FY
2019
Total sales / divisional sales 1,931.4 2,147.9 -10.1% 9,143.2
Nominal profit before tax / PBT 120.6 140.0 -13.9% -1,065.5
Nominal profit before tax / PBT ex-BICC 120.6 140.0 -13.9% 629.1
Nominal PBT margin in % 6.2 6.5 -0.3 -11.7
Nominal PBT margin in % ex-BICC 6.2 6.5 -0.3 6.9
Nominal net profit / loss 61.1 66.6 -8.3% -525.9
Nominal net profit / loss ex-BICC 61.1 66.6 -8.3% 307.3
Net cash / net debt -531.5 972.2 -1,503.7 558.6
Net cash / net debt ex-BICC 317.6 972.2 -654.6 558.6
Order backlog 20,070.9 23,311.1 -13.9% 23,451.7
Employees (end of period) 34 296 37 799 -9.3% 35 375
25
43%
27%
24%
6%
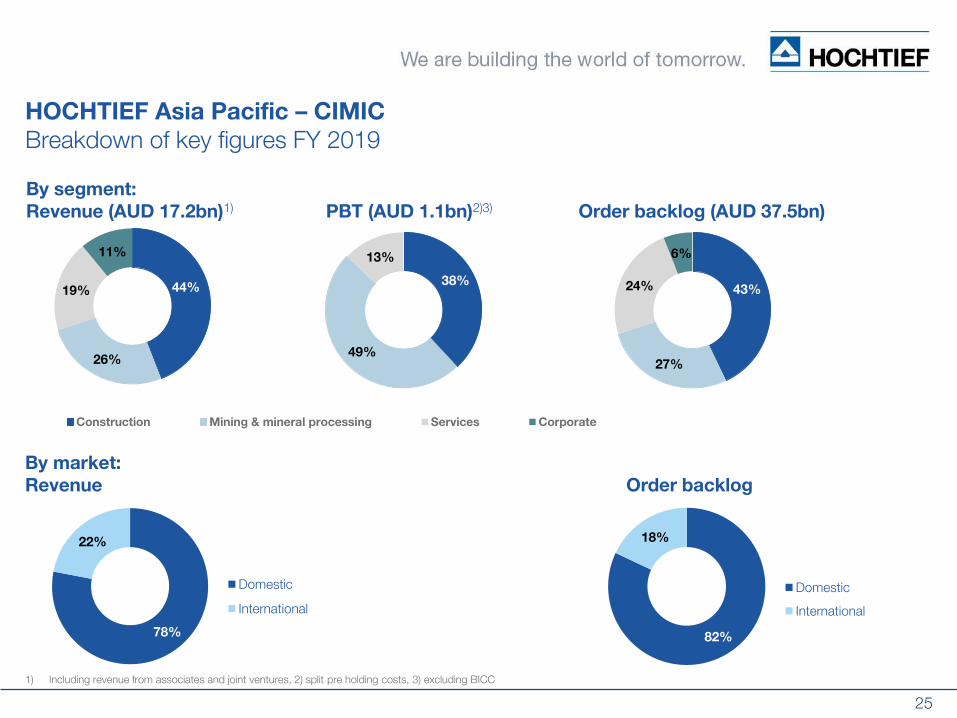
HOCHTIEF Asia Pacific – CIMIC
Breakdown of key figures FY 2019
78%
22%
Domestic
International
By market:
Revenue Order backlog
38%
49%
13%
82%
18%
Domestic
International
By segment:
Revenue (AUD 17.2bn)1) PBT (AUD 1.1bn)2)3) Order backlog (AUD 37.5bn)
1) Including revenue from associates and joint ventures, 2) split pre holding costs, 3) excluding BICC
44%
26%
19%
11%
Construction Mining & mineral processing Services Corporate

26
HOCHTIEF Europe
Marien Tower, Frankfurt, Germany
© H
OC
HTIE
F©
Dirk L
aub
ner

27
HOCHTIEF Europe:
Growth in HOCHTIEF’s regional construction markets
• HDB1) revised its 2020 sales forecast for the German
construction market in April the corona pandemic:
Expected nominal sales growth in 2020: down to 0.0%
from +5.5% forecasted in December
Sales growth in 2019: +6.7% (nominal) equivalent to 1.7%
in real-terms
• German federal government plans to invest record amount of
some EUR 270bn in the period to 2030 in expanding and
maintaining transportation network.2)
1) Federation of the German construction industry 2) German federal government, 2030 Transport Infrastructure plan)
6.7%
0.0%
2019 2020e
German constr. market nominal sales growth

28
General market overview PPP
PPPs of HOCHTIEF Europe (Q1 2020):
• Australia: the coalition of governments continue to support the National PPP Policy Framework which
established that projects valued over AUD 50m should be considered for PPP procurement
• New Zealand: government is pursuing non-traditional procurement options, involving greater private
sector involvement in the provision of infrastructure and services
• Canada: outlook for infrastructure procurement through PPP schemes remain positive, as recently
elected governments in Alberta and Ontario confirmed their support for PPP
• USA: PPP market in 2020 could potentially be impacted by local and federal elections, which could
delay large project procurement processes. But 2020 could be a strong year for social infrastructure
PPPs
• Germany: government program of 11 PPP roads is progressing, with some delays on individual project
levels. Government coalition agreement from 2018 has confirmed the current program, which should
lead to a good level of transportation infrastructure activity for the years ahead. Social infrastructure
PPP projects should remain on a steady level driven by education and administration projects
• UK: Scotland has good prospects, but steady projects are also expected in Wales and Ireland
• Norway: public roads authority continued with procurement of major road projects through PPPs. First
procurements are expected early 2020.
• Eastern Europe: there remains a steady flow of individual projects
Contract volume Total investment HT capital required HT capital provided
in EURm in EURm in EURm in EURm
Total Roads 10 10,006.0 226.2 199.2
Total Social infrastructure 26 4,046.8 1,861.6 25.2 28.0
Total 36 4,046.8 11,867.5 251.4 227.2
No. of
projects

29
PPP Pipeline and recent PPP project awards
Recent project awards
• A12/A15 motorway project (ViA15), Netherlands, EUR
1.2bn, HOCHTIEF JV (01/2020) ), DBFOM contract
• 5-year contract to refurbish and modernize the properties of two
police authorities in Hesse, HOCHTIEF PPP Solutions
• Cross River Rail, Brisbane, Australia, AUD 5.4bn, TSD PPP
and RIS package (04/2019), Pacific Partnerships, CPB
Contractors & UGL in JV
• Regional Rail Project, AUD 1.26bn, Pacific Partnerships,
UGL & CBP Contractors (02/2019), JV, DBFM contract,
Dubbo, NSW, Australia
• Los Angeles Int. Airport Automated People Mover, USD
4.6bn, Financial Close (06/2018) in JV an elevated 2.25 mile-
long guideway with six stations as well as pedestrian bridges to
airport terminals, parking garages and fixed facilities; operation
and maintenance for ~25 years.
• Via Pacific Partnerships, CIMIC is well positioned to take
advantage of increasing usage of PPP model having delivered
>20 PPP projects with a market value of around AUD 32bn
Greenfield PPP project pipeline from 2020
Greenfield PPP market opportunities
• Greenfield PPP tender pipeline, identified by project from
2020, currently amounts to approx. EUR 220bn
• Historical tender success ratio of ~30% (higher in certain
geographies)
35%
63%
30%
29%25%
8%10%
Australia/NZ USA Canada Europe PPP TenderPipeline
Rail Road Social

30
Abertis Investment
Autopista AP-7, Spain
© Miquel Gonzalez/Abertis

31
• Abertis & GIC to acquire a 70%1)
stake in Red de Carreteras de Occidente (RCO) – One of the largest transport
operators in Mexico (876km toll roads/5 concessions) managing the primary connection between Mexico‘s two largest
cities - Mexico City and Guadalajara - in the country‘s fast-growing industrial corridor
• Abertis to fully consolidate RCO and to invest EUR 1.5bn for a 50.1% stake (closing expected in H1 2020)
• RCO financials (2018)2): EUR 411m revenues, EUR 375m adj. EBITDA, EUR 1.6bn net debt
• 23 years of remaining concessions life extending lifespan of Abertis’ concession portfolio, geographic diversification
and growth platform, attractive capex profile, proven track-record and clear regulatory framework
• RCO is a quality asset with good strategic fit for Abertis and a source of long-term cash flow generation
1) Stake may increase by another 6% (max.) after tender offer to minorities 2) fx rate EUR/MXN: 21.7.; Adjusted EBITDA excludes non-cash major maintenance capex provision and non-recurring items
FARAC CONIPSA COVIQSA COTESA AUTOVIM
Abertis – RCO acquisition in October 2019

32
f/x rates and effects
End of period:
Period average:
March
31, 2020
March
31, 2019
Change
(%)
EUR/USD 1.10 1.12 -2%
USD/EUR 0.91 0.89 2%
EUR/AUD 1.80 1.58 14%
AUD/EUR 0.56 0.63 -12%
Q1
Jan-Mar
2020
Jan-Mar
2019
Change
(%)
EUR/USD 1.10 1.14 -3%
USD/EUR 0.91 0.88 3%
EUR/AUD 1.71 1.59 8%
AUD/EUR 0.58 0.63 -7%
Q1

33
Appendix: HOCHTIEF Group overview
©Mark_Dexter
Metro Copenhagen, Denmark
34
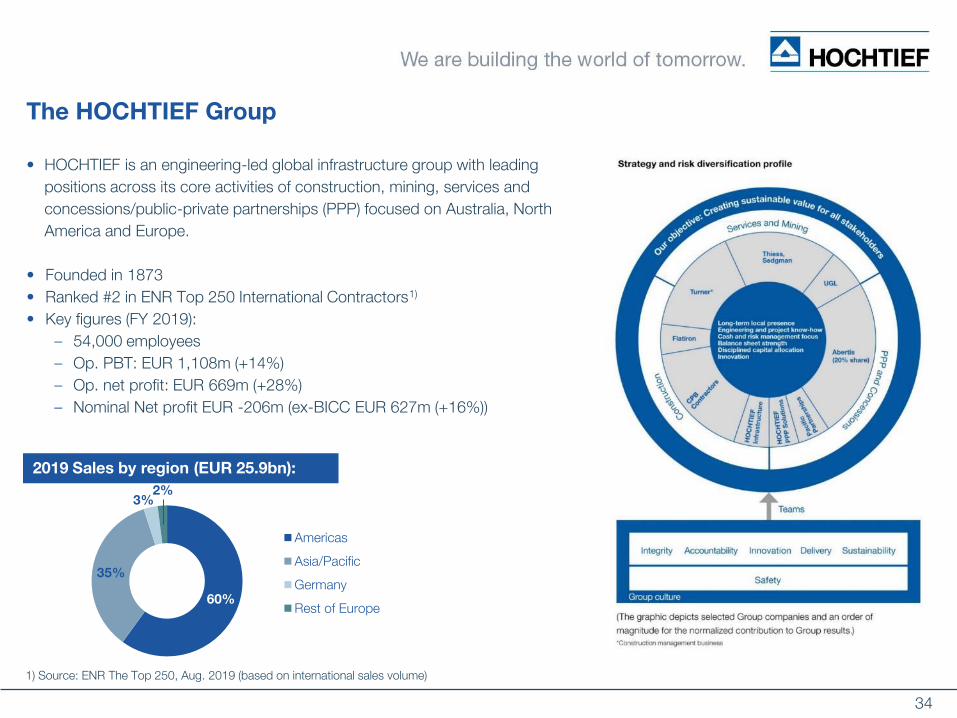
The HOCHTIEF Group
• HOCHTIEF is an engineering-led global infrastructure group with leading
positions across its core activities of construction, mining, services and
concessions/public-private partnerships (PPP) focused on Australia, North
America and Europe.
• Founded in 1873
• Ranked #2 in ENR Top 250 International Contractors1)
• Key figures (FY 2019):
– 54,000 employees
– Op. PBT: EUR 1,108m (+14%)
– Op. net profit: EUR 669m (+28%)
– Nominal Net profit EUR -206m (ex-BICC EUR 627m (+16%))
60%
35%
3%2%
Americas
Asia/Pacific
Germany
Rest of Europe
1) Source: ENR The Top 250, Aug. 2019 (based on international sales volume)
2019 Sales by region (EUR 25.9bn):

35
HOCHTIEF, leading positions in developed markets – FY 2019
Corporate Headquarters (strategic & operational management holding company)
Division
HOCHTIEF Americas
Division
HOCHTIEF Asia Pacific
Division
HOCHTIEF Europe
Abertis Infraestructuras
Largest US building construction management company and top 10 civil engineering contractor
Leading position in Australian and S.E. Asian construction, contract mining, services and PPPs
Leading German-based contractor and PPP developerfocused on Central and Northern European markets
20% equity investment in leading international toll road operator
© H
OC
HT
IEF
© Turner Construction Company © CPB Contractors © Miquel Gonzalez/Abertis
59% 36% 5%
Americas (EUR 15.3bn) Asia Pacific (EUR 9.1bn) Europe (EUR 1.2bn)
Sales1)
Total: EUR 26bn
Total: EUR 627mNominal
net profit1)
1) Total incl. Headquarters and consolidation, excl. BICC

36
Shareholder remuneration
Dividend (EUR per share)
• Strong share price performance since Dec 2012
• 2019 ordinary dividend:
EUR 5.80 per share, +16% yoy vs 2018 EUR 4.98
Total dividend payment for 2019 of EUR 410m
CAGR: +29% since 2012
• Dividend policy
Payout ratio increased to 65% of nominal net profit from fiscal year 2018
Share price performance (2012-today)Market cap 2012-19 (year-end in EURm)
Shareholder structure
(70.65m shares)
ACS (Actividades de
Construcción y Servicios
S.A.)
50.4%
Atlantia
S.p.A.
18.0%
Free float
31.6%
CAGR: +29%

37
Group transformation: Streamlined, diversified and cash focused model
Improving performance…
…driven by group transformation
1) Operational earnings are adjusted for deconsolidation effects / 2018 figures restated for IFRS 16
1)
Reshaping the portfolio to focus on core competences in Construction, Contract mining, PPP and Services
De
live
rin
g f
or
sh
are
ho
lde
rs

38
HOCHTIEF Group – Performance Summary 2013-19 (I)
173
19
0
26
5
36
1
45
2
523 6
69
2.1%2.3%
2.8%
3.4%
3.8%
4.1%4.3%
0.0%
0.5%
1.0%
1.5%
2.0%
2.5%
3.0%
3.5%
4.0%
4.5%
5.0%
0
100
200
300
400
500
600
700
800
2013 2014 2015 2016 2017 2018 2019
Op. Net profit Op. PBT margin
Op. net profit/Op. PBT marginSales
2014
Mar: AurelisOct: formartDec: John HollandDec: 50% of LEI Services
2013
Jun: LEI TelcoSep: AirportsSep: Services
Divestments
Order book visibilityOrder book
(Order book/work done)
(EU
R m
)
22,499 22,09921,097
19,908
22,63123,882
25,852
2013 2014 2015 2016 2017 2018 2019
35.9 36.3 36.0
43.144.6
47.3
51.4
2013 2014 2015 2016 2017 2018 2019
1.5 1.5 1.5
1.91.8
1.9 2.0
2013 2014 2015 2016 2017 2018 2019 1) 2018 figures restated for IFRS 16
1)

39
-667-884
308 359 385 333253
100
2012 2013 2014 2015 2016 2017 2018 2019
-944
-40
470
805704
1,266
1,5641,529
2012 2013 2014 2015 2016 2017 2018 2019
(EU
R m
)
EUR m
1) Free Cash Flow from Operations is after capex, working capital changes, taxes and financial costs, but before divestments, dividends etc.2) 2016 net cash position is after EUR 402m net investments (M&A) and EUR 367m HOT & CIM share buybacks in 2016
Cash-in from ∆ NWC
Gross Capex
Free Cash Flow from Operations Net Cash (+) / Net Debt (-)
2)
(EU
R m
)
(EU
R m
)
(EU
R m
)
41
-214
322
985 986
1,120
1,230
1,084
2012 2013 2014 2015 2016 2017 2018 2019
1,215
912
575
285 273357
411
543
2012 2013 2014 2015 2016 2017 2018 2019
HOCHTIEF Group – Performance Summary 2012-19 (II)

40
CR – Corporate Responsibility Program
Focusing on six areas with clearly defined objectives
1. Compliance Set standards with Code of Conduct
2. Attractive working environment Further strengthen position as a sought-after employer and make a name for ourselves among the most attractive employers in the industry
3. Procurement Redouble efforts to ensure fair, transparent procurement
processes and further step up purchases of sustainable
products and materials
4. Sustainable products and
services
Develop sustainable products and services, taking an integrated approach and ensuring top quality from end to end
5. Active climate and resource
protection
Conserve natural resources and enhance protection; save
actively carbon emissions ourselves and jointly with our clients
6. Corporate citizenship Get involved wherever our company is at work or can offer added value by virtue of its capabilities

41
Disclaimer
This presentation and the report contain forward-looking statements. These statements reflect the current views, expectations and
assumptions of the Executive Board of HOCHTIEF Aktiengesellschaft and are based on information currently available to the
Executive Board. Such statements involve risks and uncertainties and do not guarantee future results, performance or events.
Actual results, performance or events relating to HOCHTIEF Aktiengesellschaft and the HOCHTIEF Group, including but not limited
to possible future divestments, profit before tax, consolidated net profit and dividends, may differ materially from the expectations
and assumptions described in such statements due to, among other things, changes in the general economic, sectoral and
competitive environment, risks associated with capital markets, currency exchange rate fluctuations, changes in international and
national laws and regulations, in particular with respect to tax laws and regulations, the conduct of other shareholders, and other
factors. Statements on dividends are additionally subject to the recognition of a corresponding unappropriated net profit in the
published separate financial statements of HOCHTIEF Aktiengesellschaft for the fiscal year concerned and the adoption by the
competent decision-making bodies of appropriate resolutions taking into account the prevailing situation of the Company.
HOCHTIEF Aktiengesellschaft does not assume any obligations to update any forward-looking statements.

42
Financial Calendar and Contacts
For further information
please contact:
Investor Relations
HOCHTIEF Aktiengesellschaft
Alfredstasse 236
45133 Essen, Germany
Phone: +49 201 824 1870
Fax: +49 201 824 9 1870
[email protected] HorstMike Pinkney Nadine WärmerTobias Loskamp
23 July 20 Half-year results (provisional)