you for downloading this document from the rmit research...
TRANSCRIPT

Thank
Citatio
See th
Version
Copyri
Link to
you for do
on:
is record i
n:
ght Statem
o Published
wnloading
in the RMI
ment: ©
d Version:
this docum
IT Researc
ment from
ch Reposit
the RMIT R
ory at:
Research RRepository
PLEASE DO NOT REMOVE THIS PAGE
Salim, F 2012, 'Probing streets and the built environment with ambient and communitysensing', Journal of Urban Technology, vol. 19, no. 2, pp. 47-67.
http://researchbank.rmit.edu.au/view/rmit:20581
Submitted Version
2012 The Society of Urban Technology
http://dx.doi.org/10.1080/10630732.2012.698066

Probing Streets and the Built Environment with Ambient and Community Sensing Flora Dilys Salim Spatial Information Architecture Laboratory (SIAL), RMIT University [email protected] Postal Address: GPO Box 2476 Melbourne VIC 3001 Australia Phone: +61 3 9925 4572, Fax: +61 3 9925 3460
Abstract Data has become an important currency in today’s world economy. Ephemeral and real-time data
from Twitter, Facebook, Google, urban sensors, weather stations, and the Web contain hidden
patterns of the city which are useful for informing architectural and urban design. However, often
data required for informing a particular building or urban project is not available. In order to gather
local and real-time data of the city, sensor devices, which are now embedded in today’s urban
infrastructures, buildings, vehicles, and mobile phones, have become useful tools for probing streets
and the built environment. The proliferations of low-cost microcontrollers that leverage physical
computing have also made sensor devices more accessible and easier to configure. The wealth of
data from these sensors, if aggregated, synthesized, and analyzed, has the potential to increase our
understanding of human and social behaviors in the city. This paper presents a number of projects
which use ambient or community sensing to probe streets and the built environment in order to
capture real-time and historical data that are pertinent to specific urban contexts. The data that was
further analyzed could be used to better inform various stakeholders of the city in their decision
making processes, such as to assist travelers navigating the city by providing informed choices or to
help architects or planners to identify better design options in an architectural or urban design,
building retrofits, or new urban intervention projects.
Keywords urban probes, sensors, ambient sensing, community sensing, mobile technology, physical computing
1. Introduction
Cities and communities are emergent and holistic living systems. Analyzing data flows from our
urban environment is essential to reveal hidden patterns that can lead to understand the state of the
city and inform new developments, building retrofit projects, or urban planning. For architects and
urban designers, designing places and spaces begins with embodiment (McCullough 2004),
understood as an intrinsic yet emergent quality of interactions (McCullough 2004; Dourish 2001). In
the current pervasive computing age, the boundaries between the physical and the digital have
blurred (Salim et al. 2011), and the digital urban layer that embodies people and places has become
as important as the physical layer of cities (Ratti and Berry 2007; Santo et al. 2010). Place-based
interaction can now occur naturally as users interact with places within urban spaces on both the

physical and the digital layers (Salim et al. 2011). There are significant lessons and experiences that
can be drawn from interacting with the local real-time data from a specific urban context, location, or
space while formulating strategic and critical decisions over a site.
The first challenge is to identify the right data sources and gather the required data. To extract
information, knowledge, and intelligence that can aid decision making, it is essential to analyze and
synthesize data in its raw state. However, the dynamic spatio-temporal information about the city and
how it is emerging over time may not necessarily be easily extracted from online data sources (Salim
et al. 2010). Understanding the state of a city within a particular context, such as traffic congestion or
public transportation, and a particular time period, is an arduous task. Real-time and historical data
from the urban environment are large, complex, and may not be all relevant. Although there is
already a great deal of processed data and increasingly available data in the public domain such as
through Gov2.0 initiatives – attempts from government agencies to make government data more
transparent and open and government’s interactions with the public more participatory and
collaborative (Mergel 2010) – these data are in disaggregated forms and may not represent real-time
situations. Collections of raw data from multiple sources and domains need to be cleaned in order
that data aggregation and management can be applied. A major part of any urban research involving
non-standardized data sources is the process of cleaning the data. This pre-processing stage, before
any data analysis can be performed, can be very costly and time consuming. In addition, often the
data that we need to inform a particular building or urban site project has specific data requirements,
such as the pedestrian volume and flow on a particular street during a specific period of time. Such
data is unlikely to be available online due to the specific nature of the project.
When social, cultural, or behavioural data of a local site or community is not available, cultural
probes (Gaver, Dunne, and Pacenti 1999), which is a package of maps, postcards, and other materials
useful to provoke inspirational responses, can be used as tools for gathering tacit or local knowledge.
However, when traditional cultural probes are used to gather data, the responses are static and do not
provide a real-time and dynamic data that can show patterns of emergence over time. In order to
investigate the flux and emergence of a particular urban context, new methodological approaches to
gather and represent data are required. The ubiquity of personal and mobile computing, wearable
devices, sensors, and digital artefacts in our built environment, which has transformed spatial
interactions in urban cities as well as the way urban data is collected, holds the potential for a more
efficient approach to gather real-time and dynamic data.
This paper proposes the use of sensors as urban probes for investigating environmental, behavioural,
cultural attributes of the urban environment in four case studies. Urban probes are functional
artefacts, which combine the technological and social aspects of urban computing, for collecting
information about the users or the use of technology in real-world setting (Paulos and Jenkins 2005).
Paulos and Jenkins (2005) introduced urban probes that explore urban trash with elements of
provocation to generate inspirational and playful responses. Urban probes demonstrated in (Paulos
and Jenkins 2005) were used for observing urban public trash system and the response from the
public or recipients of the probes for performing interventions and deriving cultural meaning of a
place.
In this paper, sensors will be used as urban probes, not just for investigating cultural meanings, but
also for gathering information about the natural environment which may not require any human input
or public response. The purpose of the probes, aside from being tools for information gathering, is
for informing architectural and urban design projects and can be used as active urban intervention
tools.

2. Ambient and Community Sensing with Urban Probes
The proliferation of sensors and Web 2.0 data contribute to new opportunities to extract emerging
behavioral patterns of the city. Three types of existing urban sensors that can be used as probes are
infrastructure sensors, vehicle sensors, and mobile devices. Ambient sensing, in this paper, refers to
the use of sensors in the infrastructure, existing systems, or with DIY urban probes. Community
sensing requires public participation, employing mobile phones or physical computing prototypes, to
crowdsource information when probing a specific issue. This definition extends Krause et al’s (2008)
definition of community sensing, which is a method to share and access data from privately held
sensors such as mobile devices.
Archived and real-time data from sensors embedded in the urban environment provides the potential
for monitoring the current operating conditions of the city. Lessons can be drawn from existing
building projects that have good energy performance ratings, demonstrate sustainable building
operations, or accommodate satisfied occupants. Solar and energy analysis can be performed on the
existing land use of the built environment. Residential and office buildings are now installed with
smart meters which stream real-time energy use data. Coupled archived socio-economic data and
data from energy simulations of the built environment, live sensor data after matching with expert
domain specific knowledge can provide information that is pertinent to discovering patterns of
sustainable urban living.
Inherently, the issues of transportation are closely associated with urban living. Public transport and
personal motor vehicles are major contributors to greenhouse gas emissions and air pollution in
urban cities. Today’s vehicles and on-road infrastructures are equipped with a large number of
sophisticated sensory devices which are capable of monitoring and providing data pertaining to
vehicle status, real-time traffic conditions, traffic incidents, and road crashes (Salim et al. 2008).
Sensors, in intelligent transportation systems, are designed and created to monitor the conditions of
the vehicles, the road, and the environment in specific vicinities, such as weather information and
traffic conditions. Communication and satellite navigation devices are becoming intrinsic features of
the recently released vehicles. Global Positioning System (GPS) has been used widely in navigation,
map creation, land surveying, and also tracking vehicle maneuvers.
Communities have also been probed using crowdsourced applications on their mobile phones. Urban
commuters carry sensors embedded in their mobile devices. Mobile devices and smart phones are
now equipped with GPS, accelerometers, compasses, and various other sensors. In addition, the rise
of micro-blogging (Twitter), social networking (Facebook, Ning, Academia, and the like), and Web
2.0 powered with geo-tagging capabilities provides networks of emergence and convergence of
spatial interactions and knowledge of and about our cities. With their mobile devices, urban
commuters are able to tap into the online resources for tasks such as travel information, route
planning, getting nearest points of interests, and much more. Mobile phone data can be mined to
reveal hidden patterns, such as the project by Eagle et al. (2009) which employs mobile phone data
to infer behavioral data of friendships.
Given the proliferation of open source microcontrollers, sensors, and actuators, new digital and
electronic kits can now be designed and deployed as probes. This is particularly useful when existing
sensor devices are not accessible or further customization is required. Open source electronic
prototyping platform such as Arduino, which allows numerous types of sensors, actuators, and
microcontrollers to be connected with any household objects, computer codes, and digital devices,
have popularized the “make” or do-it-yourself (DIY) culture (Hertz 2011). The Arduino board with
its family of sensors was chosen for several reasons, first was the cheap and ready availability of the
device and its add-on components. Support for a wide variety of sensors, an easy-to-use development

environment and a thriving open source Arduino community formed the other reasons. Arduino is
open source and it uses a variant of the Processing IDE and a modified version of C++ called Wiring
as the embedded language.
Using the data gathered from ambient and community sensing as environmental or socio-cultural
probes, these data are then further analyzed. When this information is used in early stages of
architectural or urban design, this will have a great impact on the project since 80% of design
decisions affecting a building project’s outcomes are made in the first 20% of the project life
(Crawford et al. 2004). If relevant public data exist from online data streams, social network data, or
crowd-sourced mobile applications, the collected data needs to be aggregated with the online data.
This pool of data may then be analyzed quantitatively and qualitatively, and visualized. Quantitative
approaches may include statistical and computational data mining. The domain experts need to
interpret the results of data mining into knowledge that can be visualized, such as using mashup
techniques. A mashup interrelates information from various online data sources in order to present
and visualize the data contextually to the user is intended for contextual information representation
for a situated purpose through “ingestion, augmentation, and presentation” of online information
sources (Jhingran 2006). This is useful for informing decision making processes in urban design or
planning projects or performing interventions.
Using sensors as probes, individuals and communities can access and process digital data about their
environment while interacting with their physical environment. Web 2.0 initiatives such as Open
Street Map facilitate “crowdsourced” activities – public participation to contribute data and content
to a specific application – in populating the world maps. With the availability of Pachube, a site for
publishing sensor data feeds, sensing with DIY urban probes has become collective and
participatory. Hence, the usage of such probes facilitates an integrated initiative of ambient and
community sensing. A recent example of ambient and community sensing was the real-time radiation
monitoring during Japan tsunami in March 2011 (Pachube 2011). Using Geiger counter, which was
used to measure nuclear radiation, as the sensor of the probes, the data were streamed live to
Pachube. A site was set up to mashup the geotagged sensor data with Google Maps to visualize the
radiation across Japan. The real-time visualization showed a good indication where the radiations
were at its worst.
To probe the built or natural environment using ambient or community sensing, it is essential to
establish the data requirements for the specific issue that requires probing and investigate the
availability of sensors. If mobile devices are going to be used, special applications or “apps” may
need to be developed for specific probing purposes. If data sources from existing sensors or the
sensor devices are not available, then DIY urban probes need to be made using Arduino.
3. Case studies The following prototypes employ ambient or community sensing to probe the natural or built
environment in Melbourne. An example of DIY urban probe for environmental probing is Ambient
Light Informer, a DIY urban probe for analysing a site to inform the design of responsive louvers of
a reading room in Melbourne Botanical Garden. Automated POE, the DIY urban probe, which
enabled automation of Post Occupancy Evaluation (POE) survey for probing occupants’ perception
of comfort in a particular building. U&I Aware is a project that uses infrastructure and in-vehicle
sensors for probing street intersections. In two ongoing projects, iCO2mmunity and Transafe, web
and mobile applications were designed as cultural probes to gather data and improve our
understanding of public perception of transport performance, sustainability, and safety. Transafe and
iCO2mmunity used mobile phones to probe streets and public transportation.

3. 1. Ambient Light Informer
A new reading space in Melbourne Botanical Garden needs to be designed (Fig. 1). The key part of
the design brief given to a Master of Architecture student in RMIT was that reading space needs to
be passively designed to provide good light environment for reading.
Figure 1. Left – a site chosen for the pavilion in Melbourne Botanical Garden. Right – the pavilion
model.
To inform the design, instead of using the traditional approach of using light simulation and a solar
path diagram in order to predict the light level at different times of day, experiments were performed
with a lux reader and ambient light informer, the DIY urban probe, made of a number of light
sensors connected to an Arduino (Figure 2) in the preliminary design processes. Although there can
be a number of parameters in designing a comfortable reading space, such as noise, temperature,
wind, and light, given the short time frame of the project, light was chosen as a design constraint of
the reading space for proof of concept.
Firstly, we experimented with Rhino 3D models that are responsive to real-time ambient light data
input from Arduino Light-Dependent-Resistors (LDR). Changes on the ambient light level trigger
fluctuations on LDR readings, which subsequently trigger updates on the parametric models set in
Rhino (Figure 2). The parametric variations in the Rhino model are scripted using RhinoScript.
Figure 2. Responsive Rhino 3D models connected to light sensors
Secondly, the student went around a number of popular reading locations around the city of
Melbourne and carrying the ambient light informer which consists of an arduino light sensor and a
lux reader to measure the ambient light level in these spaces (Figure 3). After general observations
and analysing these data, we conclude that on average, Melbournians would find 580-600 lux a
comfortable light level for reading. This particular part of the study is essential given there can be
cultural differences in how people in general respond to a certain light level in doing specific tasks as

well as regulatory differences in lighting requirements. This task was also performed to calibrate the
arduino light sensor.
Thirdly, we calibrated the reading of the Arduino LDR with the lux reader (Figure 4). Given that the
models set up in Rhino can respond to ambient light level read by the LDR, the solution space for the
optimal design can be narrowed to those that match the real-time ambient light data.
Finally, he fabricated a number of pavilion models with different scales, colours (to simulate
materials), and louver openings (Figure 5). Within the fabricated models on site, he used an Arduino
board and three LDRs to measure the ambient light level on site at different times of the summer
days to determine the best orientation, material properties, and the angle of louver openings.
Figure 3. Left – Popular reading locations around Melbourne CBD. Right – the ambient light level
measurement.
Figure 4. The calibration of the light sensor data and light reader.

Figure 5. Ambient light analysis using Arduino and light sensors being placed inside the physical
models.
This experiment demonstrates the value of working with live / real-time ambient sensor data on site
in the modelling process. It also demonstrates the use of embodied virtuality with physical models.
The interaction with such physical models becomes embodied since the meaning of the interaction
takes place at a certain time, location, and constraints. The manipulation of placement, orientation,
size, openings, shadings, and timing of the experiments directly generate data streams that can be
further analysed as input to the digital parametric models. Design decisions can be derived from the
analysis of the ambient data that are streamed from the digital platform embodied in the physical
models.
3.2. Automated POE Architects and urban planners have long used design precedence and energy simulation for designing
sustainable built environment. Simulation tools are used to estimate projected energy use and carbon
emission during the design stage. However, the actual energy use measured during occupancy stage
is often a lot higher than the estimated energy use in the design stage. In order to design buildings
that yield high energy ratings and accommodate satisfied occupants, design precedence needs to be
coupled with a comprehension of the ambient urban environment and the understanding of
occupancy patterns.
The assessment of surveys on workplace conditions, termed as Post Occupancy Evaluation (POE),
was conducted in the recently built office tower in Monash University Caulfield campus, using a
novel and non-traditional approach. This project was as a two-month summer project in Monash
University, conducted by Prateek Rungta.
POE study provides information that can be used either in modifying existing building systems or in
subsequent building design to maximize productivity in the workplace by identifying previously
successful combinations of variables under a building designer's control. These variables include, but
are not limited to, temperature, noise, ambience, space, cleanliness and lighting (Leaman 2004). The
POE surveys are usually paper based and completed by building occupants, since it is their comfort
that the study seeks to evaluate. Naturally, this field is of interest to building managers.
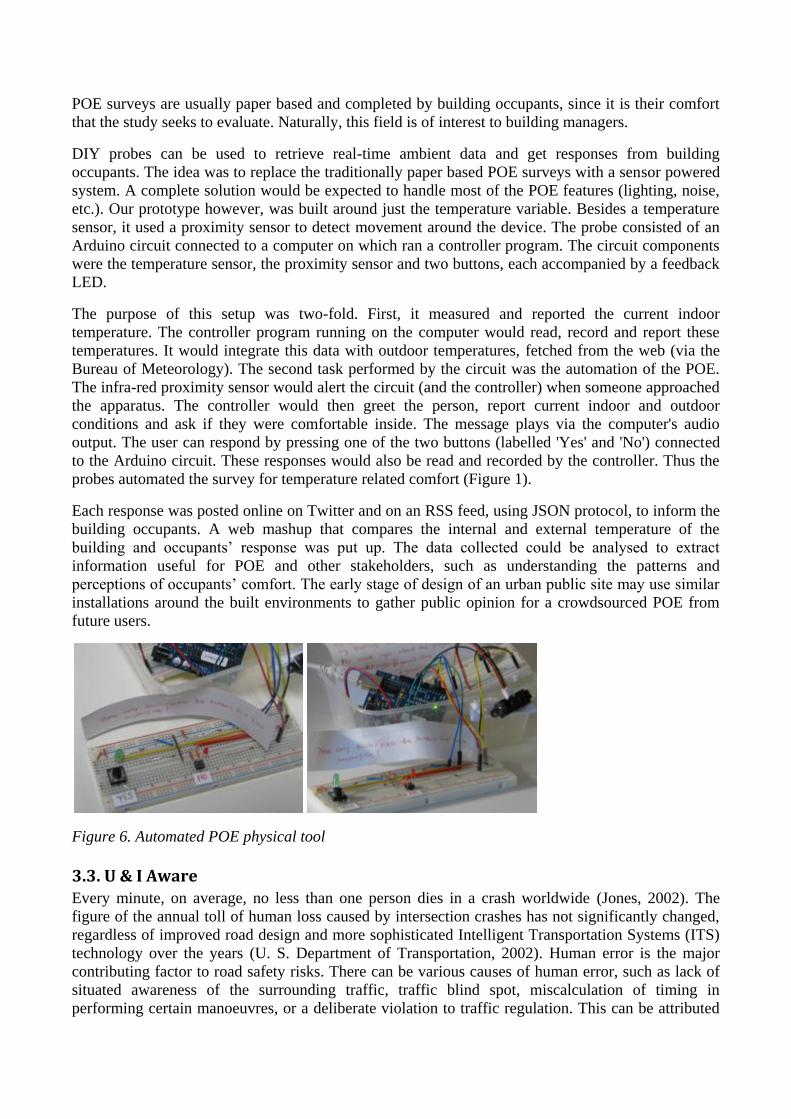
DIY probes can be used to retrieve real-time ambient data and get responses from building
occupants. The idea was to replace the traditionally paper based POE surveys with a sensor powered
system. A complete solution would be expected to handle most of the POE features (lighting, noise,
etc.). Our prototype however, was built around just the temperature variable. Besides a temperature
sensor, it used a proximity sensor to detect movement around the device. The probe consisted of an
Arduino circuit connected to a computer on which ran a controller program. The circuit components
were the temperature sensor, the proximity sensor and two buttons, each accompanied by a feedback
LED.
The purpose of this setup was two-fold. First, it measured and reported the current indoor
temperature. The controller program running on the computer would read, record and report these
temperatures. It would integrate this data with outdoor temperatures, fetched from the web (via the
Bureau of Meteorology). The second task performed by the circuit was the automation of the POE.
The infra-red proximity sensor would alert the circuit (and the controller) when someone approached
the apparatus. The controller would then greet the person, report current indoor and outdoor
conditions and ask if they were comfortable inside. The message plays via the computer's audio
output. The user can respond by pressing one of the two buttons (labelled 'Yes' and 'No') connected
to the Arduino circuit. These responses would also be read and recorded by the controller. Thus the
probes automated the survey for temperature related comfort (Figure 1).
Each response was posted online on Twitter and on an RSS feed, using JSON protocol, to inform the
building occupants. A web mashup that compares the internal and external temperature of the
building and occupants’ response was put up. The data collected could be analysed to extract
information useful for POE and other stakeholders, such as understanding the patterns and
perceptions of occupants’ comfort. The early stage of design of an urban public site may use similar
installations around the built environments to gather public opinion for a crowdsourced POE from
future users.
Figure 6. Automated POE physical tool
3.3. U & I Aware Every minute, on average, no less than one person dies in a crash worldwide (Jones, 2002). The
figure of the annual toll of human loss caused by intersection crashes has not significantly changed,
regardless of improved road design and more sophisticated Intelligent Transportation Systems (ITS)
technology over the years (U. S. Department of Transportation, 2002). Human error is the major
contributing factor to road safety risks. There can be various causes of human error, such as lack of
situated awareness of the surrounding traffic, traffic blind spot, miscalculation of timing in
performing certain manoeuvres, or a deliberate violation to traffic regulation. This can be attributed
to various road users with different cognitive and physical abilities/disabilities. Thus, behavioural
changes need to be advocated through effective information delivery.
Each intersection is unique because of the diversity of intersections’ characteristics such as different
intersection shapes, number of intersection legs, signalized/ unsignalized, traffic volume, rural /
urban setting, types of vehicles using the intersection, various average traffic speed, median width,
road turn types, and number of lanes (Salim et al. 2007a). Therefore, the complex nature of
intersection collisions requires systems that warn drivers about possible collisions. A meticulous
study on a particular intersection by performing site study and observation is usually done to
understand different issues in each intersection and perform intervention such as for improving
intersection safety.
Our previous work, the U&I Aware (Salim et al., 2007b) is a context-aware framework for collision
avoidance on road intersections. It encapsulated three components: collision learning, collision
detection, and collision warning. The framework was designed as the basis of early collision warning
device for road users. In particular, the collision learning component employed existing in-vehicle
sensors such as Global Positioning System (GPS) and forward, rear, and side collision sensor devices
to analyse collision manoeuvres and near-collision events. Since these privately owned probes were
not available during the research, the sensor data were simulated. The collision learning component
was equipped with data mining techniques to extract collision patterns from data streams from in-
vehicle and on-the-road sensors. By analysing the data from these sensors, we can derive collision
patterns of each intersection which are then used to match driver behaviours with the knowledge
base to predict future collision. The collision warning system was simulated on mobile devices in
each vehicle.
3.4. iCo2mmunity
Public transport and personal motor vehicles are major contributors to greenhouse gas emissions and
air pollution in urban cities. The City of Melbourne recently issued a publication that presented
various strategies to reduce carbon emission to fifty to sixty percents across the municipality by the
year 2020 in various areas, of which passenger transport is identified as one of the key areas (City of
Melbourne, 2008). In 2003, 73.6% of total greenhouse emissions in Australia is comprised of CO2,
of which 56% is contributed by the electricity and heat production, while 15.9% is contributed by
public transport and passenger cars (AGO 2003 as cited in Coutts 2006). The major cause of air
pollution in Australian urban context is motor vehicles (Australian State of the Environment
Committee, 2001) as traffic contributes to 75% of the total urban air pollution (Simmonds and Keay,
1997). There is a need for a mechanism to quantify the impact made by individuals’ choice on their
travel modes and leverage the public awareness of the impact of their decision in a positive way.
The City of Melbourne (CBD and surrounding areas) receives 770,000 visitors daily (City of
Melbourne, 2009). A major fraction of Melbourne’s 770,000 daily visitors are commuters who live
outside the city. The city’s current residential population is around 90,000 (City of Melbourne,
2009). Melbourne has 1700 new residents each week (Real Estate Institute of Victoria (REIV),
2009) and its population is predicted to grow by 1 million in 2030 (Department of Sustainability and
Environment (DSE), 2002). The impending growth of the city places more burdens on the existing
transportation infrastructure and road networks that are already heavily under-performing and the
impact propagates on specific urban issues, including road safety, carbon emission, occupancy and
comforts, and crime and safety.
The increasing travel-time also contributes to the increase of personal carbon footprints of
commuters. The increase of CO2 is parallel to population and density increase (Hoffmann, 2009;
Coutts, 2006). In the city of Melbourne, the trends of atmospheric pollutants closely follow the
trends of traffic volumes (Simmonds and Keay, 1997). Although railways accounted for only 2.5%
of 2008 transport emissions, road transport accounted for 86.3% of 2008 transport emissions, an
increase of 27.5% between 1990 and 2008. This is because 91% of 770,000 daily commuters to the
city of Melbourne work (City of Melbourne, 2009) opting to drive to work (IBM Press Room, 2010).
Clustering of population profiles, based on preferred transport mode, reveals trends that will be
useful for government to formulate public policies for improvement of the system and public
satisfaction (Salim 2010). Since data for such a study is not available, we need to use an urban probe
to gather a large dataset from the public, and web and mobile applications are the best tools for this
purpose. However, as previously discussed, to compel users to actively participate in the
crowdsourcing activity through the application, there must be a value or benefit they receive from
participating. Given the choices of various transportation modes in the city and different route
options, commuters need access to an online advisory system that provides real-time information on
the current and emerging conditions of the urban transportation networks.
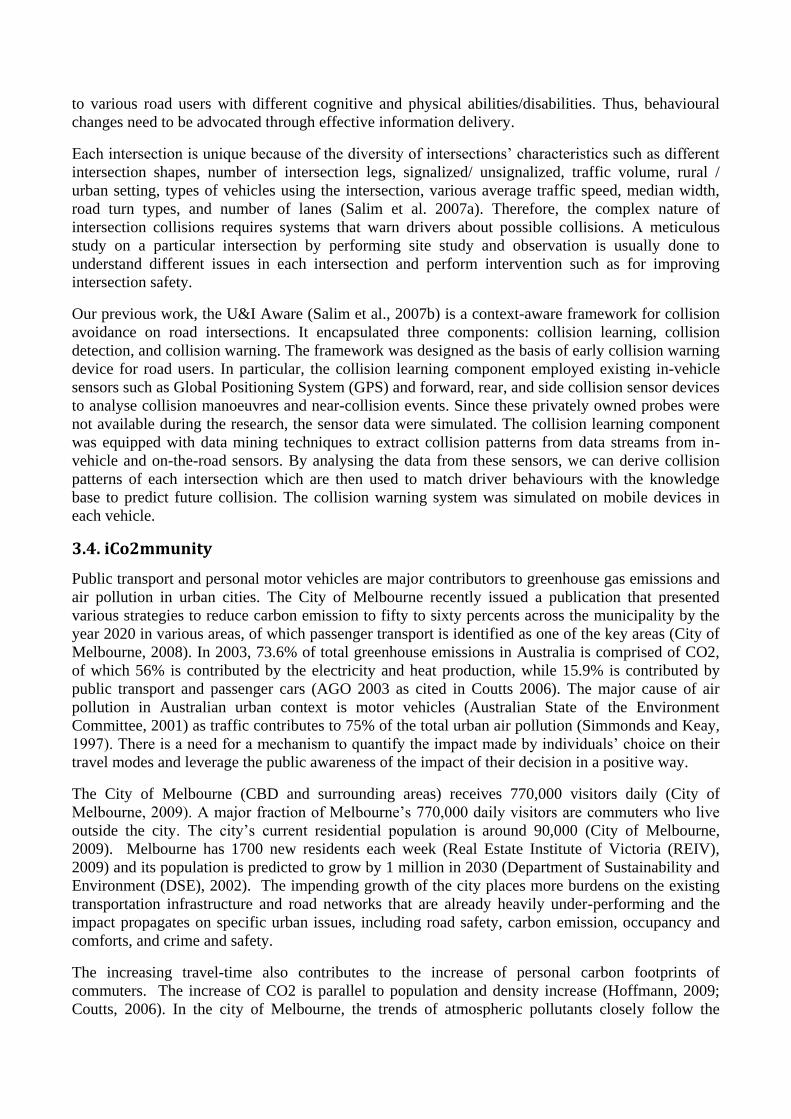
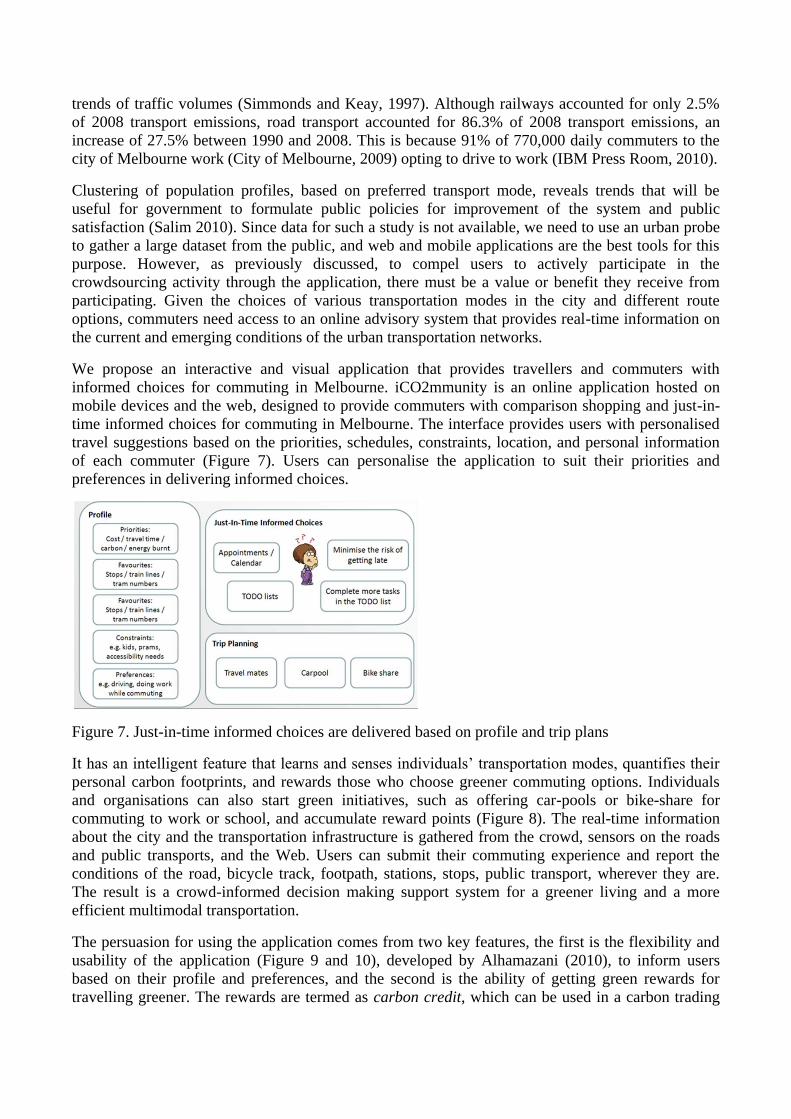
We propose an interactive and visual application that provides travellers and commuters with
informed choices for commuting in Melbourne. iCO2mmunity is an online application hosted on
mobile devices and the web, designed to provide commuters with comparison shopping and just-in-
time informed choices for commuting in Melbourne. The interface provides users with personalised
travel suggestions based on the priorities, schedules, constraints, location, and personal information
of each commuter (Figure 7). Users can personalise the application to suit their priorities and
preferences in delivering informed choices.
Figure 7. Just-in-time informed choices are delivered based on profile and trip plans
It has an intelligent feature that learns and senses individuals’ transportation modes, quantifies their
personal carbon footprints, and rewards those who choose greener commuting options. Individuals
and organisations can also start green initiatives, such as offering car-pools or bike-share for
commuting to work or school, and accumulate reward points (Figure 8). The real-time information
about the city and the transportation infrastructure is gathered from the crowd, sensors on the roads
and public transports, and the Web. Users can submit their commuting experience and report the
conditions of the road, bicycle track, footpath, stations, stops, public transport, wherever they are.
The result is a crowd-informed decision making support system for a greener living and a more
efficient multimodal transportation.
The persuasion for using the application comes from two key features, the first is the flexibility and
usability of the application (Figure 9 and 10), developed by Alhamazani (2010), to inform users
based on their profile and preferences, and the second is the ability of getting green rewards for
travelling greener. The rewards are termed as carbon credit, which can be used in a carbon trading

system (Figure 11 and 12) that simulates the idea of selling or buying carbon points through a central
system, also developed by Alhamazani (2010), based on real-world Chicago Climate Exchange
trading system (http://www.chicagoclimatex.com/).
Figure 8. The data flow process in iCO2mmuity
Figure 9. User input to the iCO2mmunity web application

Figure 10. Three charts comparing CO2, distance and time
As a basic simulation, a friendly and simply designed application to implement a carbon credits
trading system to simulate the idea of selling or buying carbon points through a central system. This
system has the potential to be linked to the central system we have illustrated in our conceptual
model in chapter 3. So that the points gained while travelling can be reflected in this trading system
and can be accessible. This method enables users who use their smart cards for travelling to offer the
points they have gained within this system. As shown in Figure 6, the application has a page where
the user can view his/her carbon credits.

Figure 11. The main page of the carbon trading system
Figure 12. Transaction using carbon points
With the need to increase Melbourne’s liveability amidst its growth, iCO2mmunity will help
integrating live information sources and optimising the multimodal transportation as a holistic
system. Stakeholders and city planners will benefit from information about transportation usage
which is being crowdsourced in the system. The integration of live information will also increase
usability of information and awareness of greener, sooner, and safer journey planning for travelling
across Melbourne. Such information, when analysed and visualised in varying industry domains, can
inform strategic decision making in sustainable development of the city. Businesses and services in
the city can benefit economically from a more manageable and streamlined transportation system.
This project will also help preparing the community for carbon pricing, as there will be an increased
awareness of their personal carbon footprints of their daily travelling activities.
3. 5. Transafe Local media sources often report that a high percentage of commuters feel unsafe and vulnerable,
particularly while travelling on public transportation networks (Herald Sun 2010; The Age 2010a;
The Age 2010b). In actuality, however, Melbourne has a very safe transport system and the level of
crime occurring on Melbourne’s transportation networks is dropping: in 2005-06, 45 offences per
million train passengers were reported, compared to 33 per million passengers in 2008-09, where
75% of public transport offences in the City of Melbourne occur on trains, train stations and station
car parks (Victorian Auditor General 2010). In contrast, the safety perception scores on Melbourne’s
trains is significantly lower than trams and buses, and has not improved over the last five years
despite a statistical decrease in the number of offences occurring per passenger (Victorian Auditor
General 2010). The perception of safety is important as it influences how people feel and behave
towards their surroundings; however, perceptions of safety do not solely depend on levels of crime.
Thus, the perception of high levels of crime on Melbourne’s public transport can potentially
introduce social barriers experienced by (tourist) visitors to Melbourne, international students, and
locals who feel unsafe on public transport. Thus, understanding public perceptions of safety and
developing policies and strategies to alleviate negative perceptions of crime and safety in the City of
Melbourne have become key agendas of Melbourne City Council and Victorian State Government.
With all these complex sustainability, performance, and safety issues of public transportation, we
need to gather public opinion and sentiments about Melbourne’s transportation network. We use

mobile devices as probes to crowdsource data from public. The challenge of using mobile
applications as probes to crowdsource information is that applications must be useful, attractive, and
persuasive that users will be compelled to actively contribute information. Fogg stated that a
computer application can play the role as a persuasive social actor by rewarding the users with
constructive feedback, simulating targeted user behaviour, or giving social support (Fogg 2002). The
rapid advancement of Web 2.0 technologies has pushed the edge for online persuasion, given the
ability of social marketers to “outreach” to larger online social players (Chinn and Artz 2008).
When mobile phones are loaded with applications that enable crowdsourced content to be submitted,
the applications would evolve over time with developers only need to create an intuitive placeholder
for the crowdsourced content. We call this as crowd place-making, spatial movement of the crowd
that is voluntarily reported via mobile applications that can track their locations using GPS and geo-
tagging and accept rich user inputs about their whereabouts. Foursquare have become a popular
social-networked place-making application and has been used widely given that the app for
Blackberry and iPhone are available and it is connected to Facebook’s status updates. Users of
foursquare can "check-in" to places in the city, "shout" their status, and share tips about a place. If a
place does not yet exist in the app, users can create new place, add information about the place, and
add it to existing categories (i.e. restaurant, entertainment, education, transportation infrastructure,
shopping, and so on). This type of applications is reliant on the crowd to populate the content and
hence the existing application is capable of evolving from one use to another. Foursquare has also
been used by shop and restaurant owners to promote their business by adding incentives and
vouchers to those who are using foursquare to "check-in" into their locations. Hence, the application
has evolved from a purely place-making tool to a marketing tool. Facebook has followed suit when
Facebook Places was introduced.
Transafe combines interactive mobile applications with social media to capture and analyze public
perceptions of safety to deliver ‘crowdsourced’ collective intelligence about places in the City of
Melbourne and their affective states at various times of the day (Hamilton et al. 2011). In contrast to
a related precedent, Oakland Crimespotting, which is a project that mashes up crime data from local
police authority and visualize it in Google Map, Transafe gathers the locals’ perception of crime and
safety and compare it with data from local police and Crime Stoppers. Figure 13 illustrates the
proposed platform for Transafe, centered around a mobile phone application that allows for:
Direct user interaction: users interact with the application to submit and view crowdsourced
crime and safety perception data. Mobile phone sensors will be used as input for user place-
marking, timestamps etc.
Stakeholder interaction: organizations such as city councils, public transport entities, and state
government can input infrastructure or (real-time) transport information and law enforcement can
provide crime news and information;
User services: improving personal safety perceptions through enabling a user tracking system, or
connection to civil services such as emergency calls (‘000’) or criminal/suspicious activity
reporting to Crime Stoppers.

Figure 13. Proposed Transafe platform
As an urban probe, Transafe introduces the use of an ‘emometer’, a crowd voting mechanism with
emoticons to encourage people to explain their feelings or perceptions of a particular place at any
given time. These emoticons have ranges of intensity and so the user can provide an intricate color
display of perceptions. A user can enter information about their perceptions of a particular area by
selecting one or all of the 8 emoticons with different colors representing Sad/Happy, Bored/Excited,
Scared/Safe, Angry/Peaceful sliding scales (see Figure 14).
Figure 14. Emometer
The submitted Emometer data is then aggregated across the user crowd and the result will determine
the overall color/mood of a particular area/locale. Visualizing the ‘feelings’ of places in the city on
different ‘map’, ‘list’ and ‘reality’ viewing modes then allows for the user to see collective safety
perceptions of places at different granularity (see Figure 15): Figure 15a illustrates the ‘map’ view
augmented with the crowd’s ‘mood’ for each city block; Figure 15b shows the ‘list’ view of the
crowd’s mood for particular buildings and landmarks; and, Figure 15c depicts the ‘reality’ map
indicating nearby buildings and facilities.

(a) Map view (b) List view (c) Reality view
Figure 15. Multiple map view interface
Once the Transafe application has been fully developed, we will need to extensively test and evaluate
it on a variety of users. We will need to enable recognition of the individual user contributions
through the emoticons and uploading of information. We need to explore the effective ways to
influence users to submit information to Transafe and hence build up the collective intelligence about
the city. Transafe needs to be designed to encourage users to keep the application running and submit
information to the Transafe crowdsourced database.
In the Transafe platform and mobile phone application presented in this paper, crowdsourced social
network data can be clustered and labeled to discover patterns of public sentiments over a specific
place in the City of Melbourne at different times of the day. Finding recurring patterns and
monitoring emergence and changes of the sentiment patterns can inform us of specific activities,
events, time, or places that affect public perception of safety. By applying association rules mining,
we can thus discover public perception trends in relation to various factors and user groups of the
city. Such information can then be streamed back to the public or stakeholders of the city and better
inform city planning.
4. Conclusion
We have proposed ambient and community sensing as a method for surveying the city for specific
environmental, behavioral, or cultural investigations. Sensor devices can be used as urban probes to
gather data that can be analyzed for urban intervention or informing design decision making
processes in an urban project. The use of urban probes is instrumental for understanding a specific
urban context. Types of urban probes include existing sensors embedded in the natural or built
environment, in urban infrastructure and vehicles, mobile devices, and Do-It-Yourself (DIY) sensing
devices. We have showcased five projects that employed ambient or community sensing prototypes
as probes for a specific urban context. Future works include a tighter integration between ambient
and community sensing by linking physical computing and mobile devices as probes and correlating
data gathered from the integrated probes. The integration will provide a powerful combination of the
extensibility, creativity, and customizability of DIY physical computing prototypes and the mobility,
connectivity, and social aspects of mobile devices.
References K. T. Ahalmazani, Pervasive Awareness and Persuasive Technology for Sustainable Travel Behaviour, PhD
Thesis, (Melbourne, Australia: Caulfield School of Information Technology, Faculty of Information
Technology, Monash University, 2008).
Arduino, <www.arduino.cc> Accessed Feb 24, 2012.

Australian Greenhouse Office (AGO), Overview: 2003 Australian national greenhouse gas inventory,
Department of Environment and Heritage, Canberra.
Australian State of the Environment Committee, Australia State of the Environment 2001, Independent Report
to the Commonwealth Minister for the Environment and Heritage. (Canberra: CSIRO Publishing on behalf of
the Department of the Environment and Heritage, 2001)
<http://www.environment.gov.au/soe/2001/publications/report/pubs/soe2001.pdf> Accessed Feb 24, 2012.
City of Melbourne, Zero Net Emissions by 2020 Update 2008. (Melbourne: Melbourne City Council, 2008) <http://www.melbourne.vic.gov.au/Environment/WhatCouncilisDoing/Documents/zero_net_emissions_2020.
pdf > Accessed Feb 24, 2012.
City of Melbourne, City of Melbourne Annual Report 2008-09 (Melbourne: Melbourne City Council, 2009)
http://www.melbourne.vic.gov.au/annualreport/ourcity_melbtoday.shtml Accessed Feb 24, 2012.
S. J. Chinn and N. Artz, "Social Marketing, Social Networking," in R. A. Oglesby and M. G. Adams, ed.,
Business Research Yearbook: Global Business Perspectives. Vol. 15, (Beltsville, MD, US: International
Academy of Business Disciplines, 2008) 395-400.
A. M. Coutts, J. Beringer, and N. J. Tapper, “Characteristics influencing the variability of urban CO2 fluxes in
Melbourne, Australia”, Atmospheric Environment, Vol. 41, January (2007) 51-62.
P. Dourish, Where the Action Is: The Foundations of Embodied Interaction, (Cambridge: MIT Press, 2001).
N. Eagle, A. Pentland, and D. Lazer, “Inferring Social Network Structure using Mobile Phone Data”,
Proceedings of the National Academy of Sciences (PNAS), 106(36), (2009) 15274-15278.
<http://reality.media.mit.edu/pdfs/Eagle_PNAS09.pdf>
B. J. Fogg, Persuasive Technology: Using Computers to Change What We Think and Do (Interactive
Technologies) (San Francisco: Morgan Kauffman, 2002).
B. Gaver, T. Dunne, and E. Pacenti, “Design: Cultural probes”, Interactions, Vol. 6, 1, January (1999) 21-29.
M. Hamilton, F. Salim, E. Cheng, S.L. Choy, “Transafe: A Crowdsourced Mobile Platform for Crime and
Safety Perception Management”, paper presented at ISTAS 2011: IEEE International Symposium on
Technology and Society, (Chicago, May 23-25 2011).
Herald Sun (2010), “Government says rail crime rate dropping as violence hotspots revealed”, Herald Sun
(June 28 2010) <http://www.heraldsun.com.au/news/victoria/citys-most-dangerous-stations/story-e6frf7kx-
1225884963316> Accessed Feb 24, 2012.
G. Hertz, “Arduino Microcontrollers and The Queen’s Hamlet: Utilitarian and Hedonized DIY Practices in
Contemporary Electronic Culture”, Proceedings of the 31st Conference of the Association for Computer Aided
Design in Architecture (ACADIA 2011), (Banff, Canada, 11-16 October 2011), 44-47.
IBM Press Room, “IBM Global Commuter Pain Study reveals Melbourne drivers have one of the best
commutes in the world” (01 July 2010) <http://www-03.ibm.com/press/au/en/pressrelease/32029.wss>
Accessed Feb 24, 2012.
A. Jhingran, “Enterprise information mashups: integrating information, simply”, Proceedings of the 32nd
international conference on Very Large Data Bases (Seoul, Korea: VLDB Endowment, 2006) 3-4.
W. D. Jones, “Building safer cars”, IEEE Spectrum, vol. 39 (2002) 82-85.
A. Krause , E. Horvitz , A. Kansal , F. Zhao, “Toward Community Sensing”, Proceedings of the 7th
international conference on Information processing in sensor networks, (April 22-24 2008), 481-492.
A. Leaman, “Outside the comfort zone: building human and basic needs”, Human Gives Journal, Vol.11, No.
2 (2004).
I. Mergel, “Gov 2.0 revisited: Social media strategies in the public sector”, PA TIMES, 33(3) (Summer 2010),
7, 10. <http://patimes.eznuz.com/printFriendlyPDF/articlePDF/22647.pdf> Accessed Feb 24, 2012.
Oakland Crimespotting <http://oakland.crimespotting.org> Accessed Feb 24, 2012.
Open Street Map <http://openstreetmap.org/> Accessed Feb 24, 2012.
Pachube, <www.pachube.com> Accessed Feb 24, 2012.
Pachube, “Crowdsourced real-time radiation monitoring in Japan” (March 24, 2011)
<http://community.pachube.com/node/611#3d> Accessed Feb 24, 2012.

E. Paulos and T. Jenkins, “Urban probes: encountering our emerging urban atmospheres”, Proceedings of the
SIGCHI conference on Human factors in computing systems (CHI) (2005).
C. Ratti and D. Berry, in V. Chatelet ed. “Sense of the city: wireless and the emergence of real-time urban
systems”. Interactive Cities, Editions HYX, (Orléans: 2007).
F. D. Salim, S.W. Loke, A. Rakotonirainy, B. Srinivasan, S. Krishnaswamy (2007a), “Collision pattern
modelling and real-time collision detection at road intersections”, Proceedings of the 2007 IEEE Intelligent
Transportation Systems Conference, (Seattle, USA, 30 September – 3 October 2007).
F. D. Salim, S.W. Loke, A. Rakotonirainy, B. Srinivasan, S. Krishnaswamy (2007b), “U&I aware: A
framework using data mining and collision detection to increase awareness for intersection users”, The 21st
International Conference on Advanced Information Networking and Applications Workshops, (Niagara Falls,
Canada, 21-23 May 2007), 530-535.
F. D. Salim, L. Cai, M. Indrawan, S.W. Loke, “Road intersections as pervasive computing environments:
towards a multiagent real-time collision warning system”, Proceedings of the Sixth Annual IEEE International
Conference on Pervasive Computing and Communications (PerCom 2008), (US: IEEE, 2008)
F. D. Salim, J. Burry, J., D. Taniar, V.C. Lee, A. Burrow, “The Digital Emerging and Converging Bits of
Urbanism”, Proceedings of eCAADe 28th conference: Future Cities, (Zurich, Switzerland, 15-18 September
2010).
F. D. Salim, H. Mulder, J. Burry, “Form fostering: A novel design approach for interacting with parametric
models in the embodied virtuality”, Journal of Information Technology in Construction (ITcon), vol. 16,
(2011) 133-148.
Y. Santo, J. H. Frazer, R. Drogemuller, “Co-adaptive environments: investigation into computer and network
enhanced adaptable, sustainable and participatory environments”, Proceedings of eCAADe 28th conference:
Future Cities, (Zurich, Switzerland, 15-18 September 2010).
I. Simmonds, K. Keay, “Weekly cycle of meteorological variations in Melbourne and the role of pollution and
anthropogenic heat release”, Atmospheric Environment, 31, (1997) 1589–1603.
The Age (2010a), “Tram violence taskforce dissolved,” The Age (June 9 2010)
<http://www.theage.com.au/victoria/tram-violence-taskforce-dissolved-20100608-xtog.html> Accessed Feb
24, 2012.
The Age (2010b), “It's a war zone, say Melbourne's train drivers,” The Age (June 12 2010)
<http://www.theage.com.au/victoria/its-a-war-zone-say-melbournes-train-drivers-20100611-y3o7.html>
Accessed Feb 24, 2012.
U.S. Department of Transportation - Federal Highway Administration and Institute of Transportation
Engineers (2004), Intersection Safety Briefing Sheet, <http://www.ite.org/decade/pubs/BriefingSheets.pdf>,
Accessed Feb 24, 2012.
Victorian Auditor General, “Victorian Auditor General’s Report: Personal Safety and Security on the
Metropolitan Train System,” (Victorian Auditor General’s Report, June 2010).
<http://download.audit.vic.gov.au/files/20100609_Rail_Safety_Full_Report.pdf> Accessed Feb 24, 2012.