ylg - presentation - 2q 2018...
TRANSCRIPT
仁恒置地集团YANLORD LAND GROUP LIMITED
2Q and 1H 2018 Results Presentation

Yanlord 2Q and 1H 2018 Business Review

3
Yanlord 2Q and 1H 2018 Business Review
• Underscored by healthy market demand for the Group’s quality developments in the PRC, recognisedrevenue for the period increased 125.9% to RMB9.663 billion in 2Q 2018 from RMB4.277 billion in 2Q2017. The growth in revenue was attributable to a significant increase in gross floor area (“GFA”)delivered to customers to 363,572 square metre (“sqm”) in 2Q 2018 from 127,951 sqm in 2Q 2017.
• In-line with the greater recognised revenue of the Group, gross profit rose 110.8% to RMB3.831 billionin 2Q 2018 as compared to RMB1.817 billion in 2Q 2017. Net profit attributable to owners of theCompany similarly rose approximately 219.6% to RMB1.478 billion in 2Q 2018 from RMB462.5 millionin 2Q 2017.
• Demand for quality developments in the Group’s core markets continue to drive sales, accumulatedpre-sales pending recognition as at 30 June 2018 stood at RMB14.199 billion with advances receivedfor pre-sale of properties amounting to approximately RMB11.522 billion.

4
Yanlord 2Q and 1H 2018 Business Review
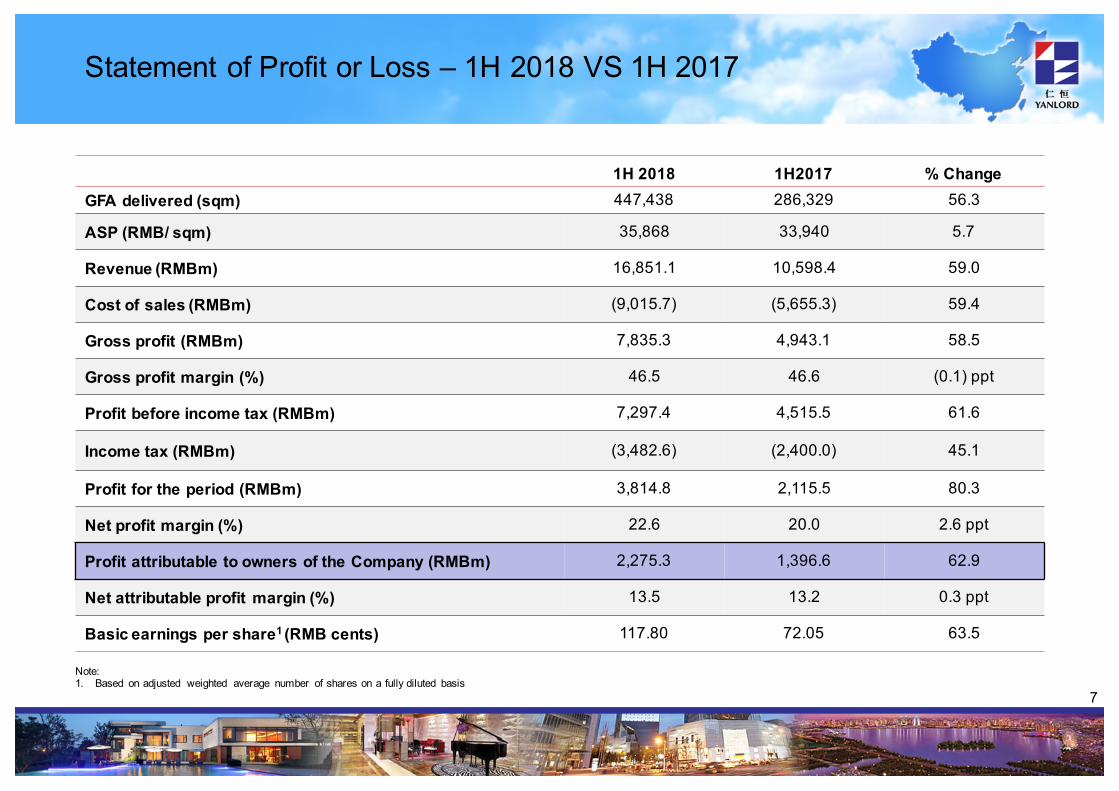
• Recognised revenue in 1H 2018 rose 59.0% to RMB16.851 billion led by higher average selling price(“ASP”) achieved and GFA delivered to customers in 1H 2018 over the same period in 2017.Underscored by the delivery of higher profit margin projects during the period, gross profit in 1H 2018rose 58.5% to RMB7.835 billion while gross profit margin for 1H 2018 remained at approximately46.5% as compared to 1H 2017. Reflecting the increase in 1H 2018 revenue, net profit attributable toowners of the Company similarly rose 62.9% to RMB2.275 billion in 1H 2018 as compared to 1H 2017.
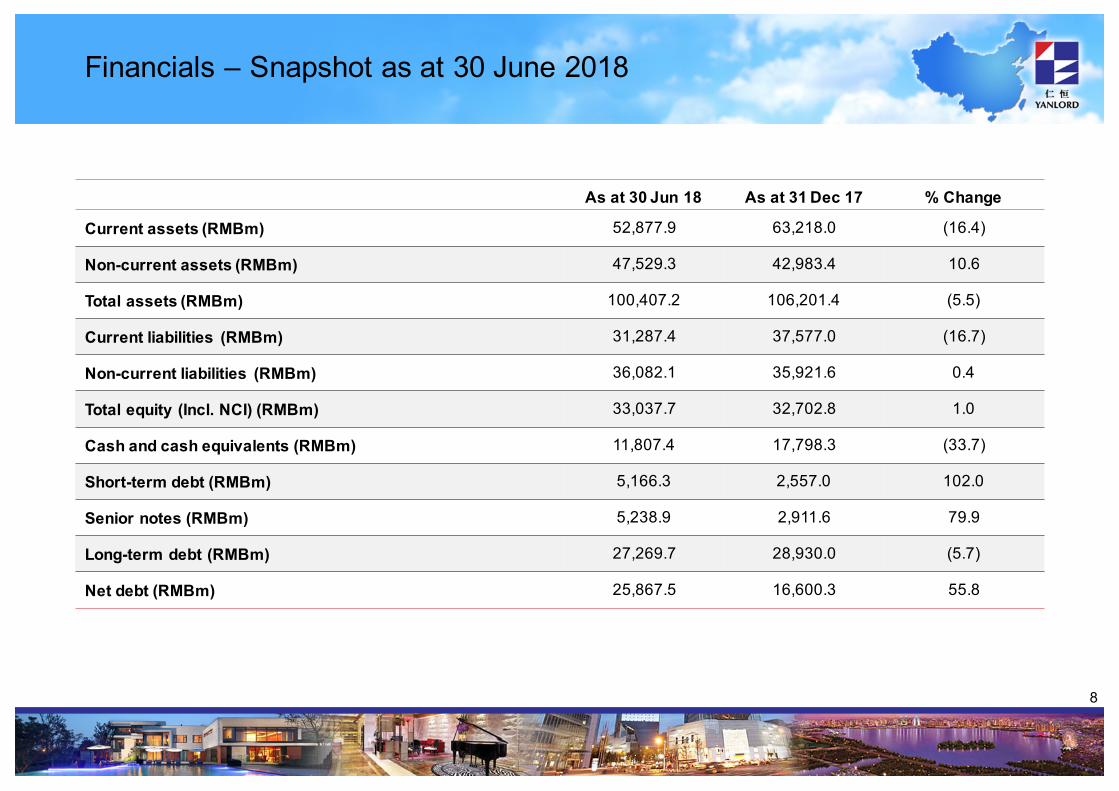
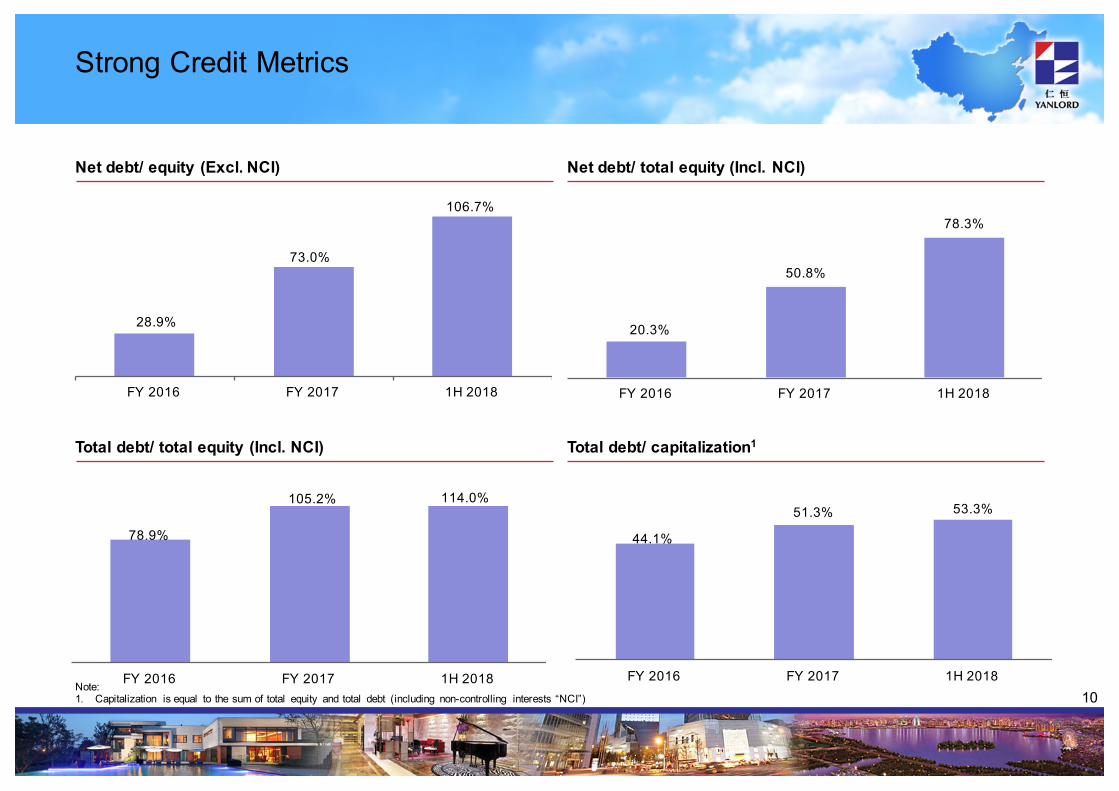
• Attributable to the Group’s prudent financial policies, Yanlord continues to maintain a healthy financialposition with cash and cash equivalents of RMB11.807 billion as at 30 June 2018. Fully dilutedearnings per share in 1H 2018 rose 63.5% to 117.80 Renminbi cents as compared to 72.05 Renminbicents in 1H 2017. Underscored by the Group’s land acquisition strategy in 1H 2018, net debt to totalequity gearing ratio stood at 78.3% as at 30 June 2018.
• Yanlord remains confident about its future performance, driven by continued sales of its developmentsand larger proportion of pre-sales recognition in subsequent periods.

Key Financial Highlights

6
Statement of Profit or Loss – 2Q 2018 VS 2Q 2017
2Q 2018 2Q 2017 % ChangeGFA delivered (sqm) 363,572 127,951 184.1
ASP (RMB/ sqm) 25,648 28,494 (10.0)
Revenue (RMBm) 9,663.1 4,277.1 125.9
Cost of sales (RMBm) (5,832.2) (2,459.9) 137.1
Gross profit (RMBm) 3,830.9 1,817.2 110.8
Gross profit margin (%) 39.6 42.5 (2.9) ppt
Profit before income tax (RMBm) 3,603.9 1,530.2 135.5
Income tax (RMBm) (1,585.2) (882.4) 79.6
Profit for the period (RMBm) 2,018.7 647.8 211.6
Net profit margin (%) 20.9 15.1 5.8 ppt
Profit attributable to owners of the Company (RMBm) 1,478.2 462.5 219.6
Net attributable profit margin (%) 15.3 10.8 4.5 ppt
Basic earnings per share1 (RMB cents) 76.53 23.88 220.5
Note:1. Based on adjusted weighted average number of shares on a fully diluted basis
7
Statement of Profit or Loss – 1H 2018 VS 1H 2017
1H 2018 1H2017 % ChangeGFA delivered (sqm) 447,438 286,329 56.3
ASP (RMB/ sqm) 35,868 33,940 5.7
Revenue (RMBm) 16,851.1 10,598.4 59.0
Cost of sales (RMBm) (9,015.7) (5,655.3) 59.4
Gross profit (RMBm) 7,835.3 4,943.1 58.5
Gross profit margin (%) 46.5 46.6 (0.1) ppt
Profit before income tax (RMBm) 7,297.4 4,515.5 61.6
Income tax (RMBm) (3,482.6) (2,400.0) 45.1
Profit for the period (RMBm) 3,814.8 2,115.5 80.3
Net profit margin (%) 22.6 20.0 2.6 ppt
Profit attributable to owners of the Company (RMBm) 2,275.3 1,396.6 62.9
Net attributable profit margin (%) 13.5 13.2 0.3 ppt
Basic earnings per share1 (RMB cents) 117.80 72.05 63.5
Note:1. Based on adjusted weighted average number of shares on a fully diluted basis
8
Financials – Snapshot as at 30 June 2018
As at 30 Jun 18 As at 31 Dec 17 % Change
Current assets (RMBm) 52,877.9 63,218.0 (16.4)
Non-current assets (RMBm) 47,529.3 42,983.4 10.6
Total assets (RMBm) 100,407.2 106,201.4 (5.5)
Current liabilities (RMBm) 31,287.4 37,577.0 (16.7)
Non-current liabilities (RMBm) 36,082.1 35,921.6 0.4
Total equity (Incl. NCI) (RMBm) 33,037.7 32,702.8 1.0
Cash and cash equivalents (RMBm) 11,807.4 17,798.3 (33.7)
Short-term debt (RMBm) 5,166.3 2,557.0 102.0
Senior notes (RMBm) 5,238.9 2,911.6 79.9
Long-term debt (RMBm) 27,269.7 28,930.0 (5.7)
Net debt (RMBm) 25,867.5 16,600.3 55.8

9
Profitability Analysis
Revenue (RMBm) Gross profit (RMBm)
Profit for the period (RMBm) Profit attributable to owners of the Company (RMBm)
10,257.0 10,598.4
16,851.1
FY 2016 FY 2017 1H 2018
25,638.425,664.4
2,314.74,943.1
7,835.3
12,043.9
FY 2016 FY 2017 1H 2018
8,019.7
1H 2H
2,874.6
900.3
2,115.5
FY 2016 FY 2017 1H 2018
3,977.2
3,814.8
584.1
1,396.6
2,275.3
FY 2016 FY 2017 1H 2018
5,620.3
3,216.4
2,697.4
10
Strong Credit Metrics
Total debt/ capitalization1Total debt/ total equity (Incl. NCI)
Net debt/ equity (Excl. NCI) Net debt/ total equity (Incl. NCI)
28.9%
73.0%
106.7%
FY 2016 FY 2017 1H 2018
50.8%
78.3%
20.3%
FY 2016 FY 2017 1H 2018
105.2%
FY 2016 FY 2017 1H 2018
78.9%
114.0%53.3%51.3%
44.1%
FY 2016 FY 2017 1H 2018Note:1. Capitalization is equal to the sum of total equity and total debt (including non-controlling interests “NCI”)

Business and Operation Overview

12
GFA/ Property Sale Contribution Analysis in 1H 2018By city, project and ASP
Major projects delivered in 1H 2018 GFA (sqm) ASP (RMB/ sqm) Property sales by project (%)
Oasis New Island Gardens (Phase 3) 72,031 34,297 15.0Sanya Hai Tang Bay - Land Parcel 9 4,584 118,242 3.3Shanghai Yanlord Eastern Gardens 3,098 64,132 2.6Shanghai Yanlord on the Park 56,201 100,135 34.2Shanghai Yanlord Western Gardens 23,869 55,589 8.2Suzhou Tang Yue Bay Gardens 9,238 29,669 1.8Tianjin Jinnan Land (Phase 3) 198,958 17,755 21.9Zhuhai Yanlord Marina Centre – Section B 8,232 54,537 2.8Zhuhai Yanlord Marina Peninsula (Phase 2) 59,445 20,583 7.4
Others 11,782 -- 2.8
Property Sale Contribution by City GFA Contribution by City
0.6%
45.4%
3.3%3.3%
15.0%
22.1%
10.3%
Chengdu Shanghai
Suzhou Sanya
Nanjing Tianjin
Zhuhai
0.8%
18.9%3.2%
16.1%
1.0%
44.6%
15.4%
3.2%

13
Pre-sales and ReceiptsResilient growth
Revenue Booked, Pre-Sales and Proceeds Collected (RMBm)
10,257.0
15,762.5
25,664.4
6,321.2
10,598.4
14,362.4
25,638.4
7,188.0
16,851.1
24,437.0
24,986.1
22,793.4
20,814.1
23,217.2
24,679.7
20,696.4
16,602.1
11,522.1
4,447.2
4,370.8
3,694.7
3,179.7
4,631.4
3,160.5
2,565.9
1,595.2
2,677.2
30-Jun-16 30-Sep-16 31-Dec-16 31-Mar-17 30-Jun-17 30-Sep-17 31-Dec-17 31-Mar-18 30-Jun-18
Revenue Booked Pre-sales receipts Pre-sales pending collection
39,141.2
45,119.4
52,152.5
30,315.0
38,447.0
42,202.6
48,900.7
25,385.3
31,050.4

14
Diversified Geographic Coverage Abundant land bank in PRC high-growth cities
Bohai Rim since 2005
Shanghai• Shanghai San Jia Gang Land Plot (35,831 sqm)• Yanlord Sunland Gardens (20,110 sqm)• Yanlord Western Gardens (32,991 sqm)• Yanlord Eastern Gardens (13,545 sqm)• Yanlord on the Park (23,333 sqm)• Shanghai Yangpu District 81 and 83 Redevelopment Project
(182,287 sqm)Nanjing• Yanlord Yangtze Riverbay Town (17,138 sqm) • Oasis New Island Gardens (22,511 sqm)• Nanjing Eco Hi-Tech Island – Land Parcel G73 (97,034 sqm)• Nanjing Daji Land Parcels (314,204 sqm)• Yanlord Taoyuan Gardens (154,254 sqm)*• Nanjing No. 2016G84 Land (534,160 sqm)*• Nanjing No. 2017G01 Land (87,123 sqm)*Suzhou • Yanlord Lakeview Bay (12,127 sqm)• Tang Yue Bay Gardens (17,894 sqm)• Riverbay Gardens (296,078 sqm)• Suzhou No.2016-WG-46 Land Parcels (74,500 sqm)• Suzhou Canal Times (52,514 sqm)Nantong • Four Seasons Gardens (136,440 sqm)• Nantong R17014 Land (236,500 sqm)*Hangzhou• Hangzhou Intelligent City Project – Medical Land Parcels
(450,773 sqm)*• Hangzhou Intelligent City Project – Commercial Land Parcels
(294,830 sqm)*
Western China since 2003
Pearl River Delta since 2005
Zhuhai• Yanlord Marina Centre (161,430 sqm)• Yanlord Marina Peninsula Gardens (284,283 sqm)• Yanlord North Shore Gardens (41,813 sqm)
As of 30 June 2018:
Yangtze River Delta since 1993*Projects being held under associate or joint venture
Shenzhen• Shenzhen Longgang District Redevelopment Project
(390,000 sqm) • Shenzhen Longgang District Economic Residential Housing
(144,064 sqm) • Shenzhen Longgang District Bantian Redevelopment Project
(169,272 sqm)• Yanlord Landmark (37,688 sqm)• Yanlord Centre (333,280 sqm)• Shenzhen Luohu Land Parcel (55,749 sqm)
Tianjin
Shanghai
Suzhou
Nanjing
Zhuhai
Chengdu
Shenzhen
Sanya
Nantong
Tangshan
Wuhan
Hainan since 2010Sanya• Sanya Hai Tang Bay - Land Parcel 9 (70,036 sqm)
Central China since 2017Wuhan• Wuhan Metropolis Project (141,379 sqm)*GFA Completed (mil sqm) 0.805
GFA Under Development (mil sqm) 2.574GFA for Future Development (mil sqm) 3.547Total Land Bank (mil sqm) 6.926
Hangzhou
Chengdu• Yanlord Landmark (157,437 sqm)• Hengye International Plaza (39,999 sqm) • Yanlord Riverbay (132,677 sqm)• Chongzhou Project Land Parcels (85,748 sqm)
Tianjin• Yanlord Riverside Plaza (134,017 sqm)• Tianjin Jinnan Land (5,163 sqm)• Tianjin Hong Qiao Land (260,638 sqm)*• The Mansion In Park (286,048 sqm)*
• Yanlord Majestive Mansion (258,305 sqm)*
• Tianjin Beichen No. 2017-188 Land (177,723 sqm)*Jinan• Jinan CBD Project - A3 Land (45,525 sqm)*• Jinan CBD Project - B5 Land (111,311 sqm)*Tangshan• Tangshan Nanhu Eco-City Land Parcels *
(212,254 sqm)
Jinan

15
Core Central Region
l TulipGardenl 557,407 sqft*l District10
Geographic Coverage Land bank in Singapore core central region
*approximate GFA based on plot ratio of 1.6x

16
Development Strategies Growth of business across high-growth cities
• Increase the market share in cities where Yanlord already has established a superior brand name• Expand into new cities within the 6 regions where Yanlord is currently in• Existing land bank sustainable for development in each of these cities for approx. 5 years• Future projects will be more diversified in terms of development type and geographical reach
Completed projects Projects under development Land bank: Future development(804,916 sqm1) (2.574 million sqm) (3.547 million sqm)
Residential and Commercial 2,413,290 sqmInvestment 160,293 sqm
Residential and Commercial 3,546,548 sqmInvestment -
Note:1. The group has completed 8.623 million sqm out of which 804,917 sqm are GFA completed and retained as investment properties, fixed assets or yet to be sold/ delivered to customers2. Contains projects being held under associate or joint venture
Shenzhen15.0%
Tianjin2
21.0%
Residential and Commercial 308,322 sqmInvestment 429,071 sqmFixed Assets 67,524 sqm
Shanghai12.8%
Suzhou4.4%
Zhuhai19.1%
Chengdu25.5%
Tianjin17.3%
Shenzhen0.6%
Sanya8.7%
Nanjing10.9%
Tangshan2
0.7%
Tangshan26.6%
Suzhou16.4%
Zhuhai13.4%
Chengdu4.9%
Tianjin218.0%
Nanjing213.1%
Nantong5.3%Jinan2
4.3%
Shenzhen18.0%
Shanghai6.2%
Nanjing223.9%
Shenzhen18.8%
Wuhan24.0%
Chengdu2.4%
Tianjin2
14.7%
Tangshan2
1.0% Nantong2
6.7%
Hangzhou2
21.0%Jinan2
1.3%

17
New Launches of Property for Sale in 3Q 2018
We expect to launch the following new projects and new batches of existing project in 3Q 2018:
• Nanjing– Daji Land Parcels (Phase 1)– Yanlord Taoyuan Gardens
• Shanghai– Yanlord Eastern Gardens
• Suzhou– Riverbay Gardens
• Tangshan– Tangshan Nanhu Eco-city – Land Parcel A8
• Tianjin– The Mansion In Park (Phase 1)

18
Project Showcase- Yanlord Eastern Gardens (Shanghai)

19
Project Showcase- Sanya Haitang Bay – Land Parcel 9 (Hainan)

20
Project Showcase- Yanlord Taoyuan Gardens (Nanjing)

21
Disclaimer
This document contains information that is commercially sensitive, subject to professional privilege and is proprietary and confidential in nature. Any professional privilege is not waived or lost by reason of mistaken delivery or transmission. If you receive a copy of this document but are not an authorized recipient, you must not use, distribute, copy, disclose or take any action in reliance on this document or its contents.
The information contained in this document has not been independently verified. No representation or warranty express or implied is made as to, and no reliance should be placed on, the fairness, accuracy, completeness or correctness of such information or opinions contained herein. The information contained in this document should be considered in the context of the circumstances prevailing at the time and has not been, and will not be, updated to reflect material developments which may occur after the date of the presentation. Neither Company nor any of its respective affiliates, advisers or representatives shall have any liability whatsoever (in negligence orotherwise) for any loss howsoever arising from any use of this document or its contents or otherwise arising in connection with this document.
The document may contain statements that reflect the Company’s beliefs and expectations about the future. These forward-lookingstatements are based on a number of assumptions about the Company’s operations and factors beyond the Company’s control, and accordingly, actual results may differ materially from these forward-looking statements. The Company does not undertake to revise forward-looking statements to reflect future events or circumstances.