yield of beet cultivars under fertigation management and ... · 2universidade estadual paulista,...
TRANSCRIPT

463
CHILEAN JOURNAL OF AGRICULTURAL RESEARCH 76(1) JANUARY-MARCH 2016CHILEAN JOURNAL OF AGRICULTURAL RESEARCH 76(4) OCTOBER-DECEMBER 2016
In a protected environment, applying excess fertilizer and using water with soluble salts cause soil salinization due to the absence of lixiviation by precipitation. Among commercial vegetables, beets (Beta vulgaris L.) have good tolerance to soil salinity, being a good option for growth under these conditions. An experimental study was carried out in the municipality of Botucatu, São Paulo, Brazil. The treatment consisted of a combination of the following factors: initial soil salinity (1, 3, 6, 9, and 12 dS m-1), fertigation management (traditional vs. control of ion concentration of the soil solution) and two beet cultivars (‘Early Wonder’ and ‘Itapuã’) in a 5 × 2 × 2 factorial design. A randomized block design with four replicates was adopted, totaling 80 experimental plots. The total fresh weight of aerial part and root, total dry weight of aerial part and root, and water use efficiency (WUE) were assessed. Significant differences were found between fertigation management practices and salinity levels proposed. ‘Itapuã’ showed better yield and WUE for electrical conductivity (EC) below 6 dS m-1. Under traditional fertigation, root yield response fits a linear model with a decrease of 11.365 g (‘Early Wonder’) and 11.025 g (‘Itapuã’) for each unit increase in EC. Under controlled fertigation, the best-fit model was quadratic, with maximum estimates of 248.83 g for ‘Early Wonder’ and 258.52 g for ‘Itapuã’. Controlling EC of the soil solution had a positive effect, while salinity levels above 6 dS m-1 must be avoided.
Key words: Beta vulgaris, electrical conductivity, soil solution.
ABSTRACT
Yield of beet cultivars under fertigation management and salinity control in a protected environmentAlexsandro O. da Silva1*, Ênio F. de F. e Silva1, and Antônio E. Klar2
RESEARCH
CHILEAN JOURNAL OF AGRICULTURAL RESEARCH 76(4) OCTOBER-DECEMBER 2016
1Universidade Federal Rural de Pernambuco, Departamento de Engenharia Agrícola, CEP:50171-900, Recife, Pernambuco, Brasil. *Corresponding author ([email protected]).2Universidade Estadual Paulista, Departamento de Engenharia Rural, Botucatu, São Paulo, Brasil.
Received: 10 March 2016.Accepted: 26 July 2016.doi:10.4067/S0718-58392016000400010
RESEARCH
INTRODUCTION
Beets (Beta vulgaris L.) represent a commercially important vegetable variety grown in Brazil representing 2.1% of the vegetable market (Nascimento, 2012), besides, they are also known as red beets or table beets. Their best parts for human consumption are the roots, with a purplish-red color and elongated shape, used in raw salads. However, despite their nutritional value, the scale of their commercial production in Brazil is lower than that of other vegetables such as tomatoes, onions, and peppers (Tivelli et al., 2011). In Brazil, according to Filgueira (2008), approximately 10 000 ha are used for beet cultivation, with average yields ranging from 20.0 to 35.0 t ha-1. ‘Early Wonder’ is the most commonly grown beet in the country, and ‘Itapuã’ is a national cultivar adapted to heat conditions. Fertigation is a process consisting of the application of fertilizer along with irrigation water to provide the nutrients required by the crop at the right time to obtain high yields and high-quality products. However, in São Paulo there is currently an emerging problem of soil salinization in protected environments caused mainly by the excessive application of fertilizers (Silva et al., 2000; Duarte et al., 2007; Silva, 2014). Among the problems caused by excess salts in the soil, a reduction in the total potential of water in the soil stands out, as well as toxic effects of specific ions on the metabolic processes of plants. Together, these processes can compromise yields and the quality of production (Droogers et al., 2001). Among the known methods to monitor soil salinity in protected environment, soil solution extractors are efficient and economically viable. The main purpose of using soil solution extractors is to control ion concentration in soil solution by means of electrical conductivity (EC) monitoring, aiming at controlling soil salinity and keeping conductivity values below the maximum tolerated by the plants and above the minimum required for their nutrition; based on decision-making concerning the fertigation time and the amount and balance of fertilizer applied in each fertigation event. Several studies have sought to find the optimal EC level for crops managed with soil solution extractors (Silva et al., 2000; Oliveira et al., 2011). Medeiros et al. (2012) found that tomato crops are sensitive to CE > 2.5 dS m-1. In studies about the effects of salinity levels and fertigation management on the characteristics of eggplants grown in protected environment, Silva et al. (2013) observed a decrease in crop production at salinities > 1.71 dS m-1.
464
CHILEAN JOURNAL OF AGRICULTURAL RESEARCH 76(1) JANUARY-MARCH 2016CHILEAN JOURNAL OF AGRICULTURAL RESEARCH 76(4) OCTOBER-DECEMBER 2016
Among commercial vegetables grown in Brazil, beets show good salinity tolerance. According to Ayers and Westcot (1985), table beets are classified as salinity-tolerant, enduring EC of up to 4 dS m-1 in the saturation extract. However, there remain some ways in which our understanding of beets’ salinity tolerance should be improved. One of these would be the planting method, because according to Farkhonder et al. (2012), who have studied the effect of saline stress on the water use of two sugar beet cultivars, this crop is very sensitive to salinity and is particularly vulnerable during germination. Considering what is already known, beets will likely be cultivated to generate income by farmers who have saline soils unsuitable for other vegetable crops. The objective of this study was to assess the effect of fertigation management and soil salinity on the yield and water use efficiency of two beet cultivars inside a protected environment.
MATERIALS AND METHODS
The experimental study was carried out in Botucatu (22°51’ S 48°26’ W), São Paulo, at the Department of Rural Engineering of the Faculty of Agricultural Sciences of Universidad Estatal Paulista “Júlio de Mesquita Filho” (UNESP). According to the Köppen classification, the climate of the region is defined as Cwa: warm temperate (mesothermal), rainy in summer and dry in winter, with the average temperature of the warmest month above 22 °C (CEPAGRI, 2011). The soil material, classified as an Oxisol (Embrapa, 2006), was extracted from the top 30 cm of surface soil. Samples of this material were used for chemical analysis (Table 1) and hydro-physical analysis (Table 2) carried out in the Soil Fertility Laboratory at the Department of Soil Science of UNESP. The soil was sifted through a 2 mm mesh sieve and stored in a granary where it was limed with dolomitic limestone (RPTN = 84%) with relative power neutralization, raising the base saturation to 80%, as recommended by Trani et al. (1998). After drying, the soil was placed in 14 L cylindrical pots, measuring 30 cm wide and 33 cm high. The pots were drilled and had their bottoms fitted with a drainage system consisting of 3 cm of #1 gravel and a polyester mat. The treatments consisted of a combination of the following factors: initial soil salinity (1, 3, 6, 9, and 12 dS m-1), fertigation management (M1 = traditional and M2 = with ion concentration control of the soil solution) and two beet cultivars (C1 = ‘Early Wonder’ and C2 = ‘Itapuã’) in a 5 × 2 × 2 factorial design. The salinization of the soil was performed according to Silva et al. (2000) through the application of specific fertilizers
and salts (Trani et al., 1998) diluted in accordance with methodology proposed by Richards (1954). A randomized block design with four replicates was adopted, totaling 80 experimental plots. The fertilizers were applied via irrigation water with the aid of a Venturi injector coupled to a drip irrigation system. The fertigation management was differentiated for the M1 and M2 treatments. For M1 treatments, the route of nutrient absorption by the crop (Grangeiro et al., 2007), was used to calculate the amount and proportion of fertilizer. The fertigation frequency for this treatment was the same as the irrigation frequency. For M2 treatments, the same recommendation as that for management M1 was employed initially, but 10 d after transplanting (DAT), neither the frequency nor the proportion of fertilizers used in this management was pre-established. Fertigation was performed only when the EC in the soil solution was on average 20% below the initial salinization levels for each treatment, and the salinization was ceased when the conductivity was on average 20% higher than that same initial level; therefore, the total ion concentration of the soil solution controlled the fertigation management. This methodology was used by Silva et al. (2000). During cultivation, the types of fertilizer used for fertigation management were potassium nitrate, potassium chloride, and monoammonium phosphate, based on the total fertilization applications for the beet crop, in accordance with Trani et al. (1998): 120 kg N ha-1; 360 kg P2O5 ha-1 and 210 kg K+ ha-1. Transplanting took place on 28 November 2011, 30 d after sowing; two uniform seedlings were placed in each pot measuring 9 cm high and with four pairs of leaves. The seedlings were purchased from a reliable producer. Thinning was performed 8 d DAT, resulting in one plant per plot. During harvest, plants were cut and fresh weight of aerial parts (FWAP) and roots (RFW) was measured on a precision scale (0.01 g). After a 1-d period, plants were placed in a drying oven at 65 °C until reaching constant weight; then DM was determined on a 0.0001 g precision scale. Irrigation was managed through the reading of the medium voltage for each treatment studied, by means of tensiometers installed in each plot. After the voltages were measured, the corresponding moisture levels were
CaCl2 dSm-1 g dm-3 mg dm-3 mmolc dm-3 %5.1 0.32 11 6 0.6 22 7 26 29 55 53
Table 1. Chemical properties determined before the salinization of the soils.pH
OM: Organic matter; H+Al: potential acidity; SB: sum of bases; CEC: cation exchange capacity; V: base saturation.
CE OM P Ca H+AI CECK Mg SB V
Table 2. Particle sizing and hydro-physical parameters of the soil.
pd: Particle density, sd: soil density; P: total porosity; θFC: soil moisture at field capacity; θPMP: soil moisture at permanent wilting point.
Sand
g kg-1 g cm-³ % g g-1
395.5 138.1 466.4 2.77 1.28 53.9 0.28 0.14
Particle sizing Hydro-physical parameters
Silt Clay pd sd P θFC θPMP
465
CHILEAN JOURNAL OF AGRICULTURAL RESEARCH 76(1) JANUARY-MARCH 2016CHILEAN JOURNAL OF AGRICULTURAL RESEARCH 76(4) OCTOBER-DECEMBER 2016
calculated based on the retention curve of water in the soil. With these water content and water content corresponding to the container capacity, net irrigation depth was calculated (Ghamarnia et al., 2012) as shown in Equation [1]. To calculate gross irrigation depth, an irrigation system efficiency (Se) of 90% (Equation [2]) was assumed. For the application of irrigation water in the pots, the gross irrigation depth (GD) was multiplied by the total area of each pot (0.062 m²). NID = (MCC – Mcurrent) × sd × Z [1] GD = NID/Se [2] V = GD × A [3] In Equations [1] through [3], NID is net irrigation depth (mm), MCC is water content in the container capacity (%), Mcurrent is current water content (%); sd is soil density (g cm-3), Z is root system depth (mm); GD is gross irrigation depth (mm), V is volume of water applied (L), and A is area of the pot (m²). The actual crop evapotranspira t ion (ETr) was determined from the water balance in the pot with the aid of tensiometers installed in all experimental plots. The components of the water balance (Köksal et al., 2011) can be described as in Equation [4]: ETc = I + P + ∆S – R –D [4]where ETc is evapotranspiration of the crop (mm), I is irrigation (mm), P is precipitation (mm), ∆S is change in water content in the soil, R is runoff, and D is deep drainage. In the conditions under which the experiment was conducted, P, ∆S, R and D were considered null (crops grown in pots, with frequent irrigation and under protected environment). The amount of water applied in each treatment as well as the ETc accumulated throughout the cycle (mm cycle-1) for the different cultivars and salinity levels studied are shown in Table 3. The water use efficiency (WUE) was calculated using the ratio of DM weight to the amount of water consumed by
the plant (Köksal et al., 2011), as determined by means of Equation [5]: WUE = DM/ETc [5]where WUE is water use efficiency (kg ha-1 mm-1), DM is dry matter weight (kg ha-1), ETc is water consumption of plants (mm). The effects of fertigation and cultivar management on the variables analyzed were quantified through ANOVA, and the effects of treatments were studied through regression analysis. In the regression analysis, linear and second-degree polynomial models were tested. The regression equations were chosen based on the significance of the regression coefficients, at a probability of 0.01 by the F test and at the highest value of the coefficient of determination (R2). Statistical tests were performed with the aid of the statistical software SISVAR version 5.0 (Ferreira, 2011). Post hoc Tukey’s tests comparing means were also carried out at 5% probability.
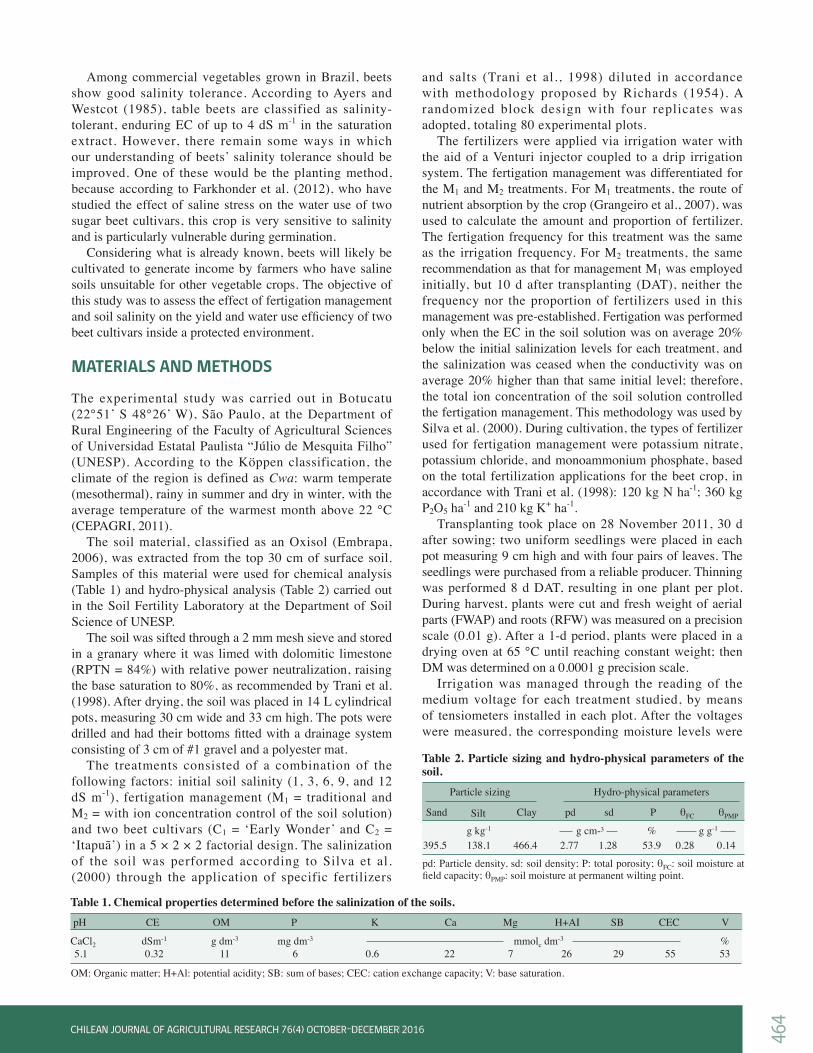
RESULTS AND DISCUSSION
Table 4 shows the mean comparison test for cultivar and fertigation management factors. Although ‘Itapuã’ showed the highest values (M2: 363.0 g plant-1 and M1: 332.0 g plant-1 to total fresh weight), the cultivars studied showed nonsignificant differences for each fertigation management proposed. The fertigation management factor showed significant differences in all response variables studied; controlled fertigation management (M2) showed higher values for RFW and total fresh weight (TFW). The traditional fertigation management (M1) showed significant effects for the ‘Early Wonder’ in FWAP variable, the values being higher than those of M2. The results obtained for the beet crop in this study contrast with those presented by Dias et al. (2006), who found nonsignificant differences in yields of melon plants subjected to different fertigation practices. Accurate estimation of the applied fertilizer as well as the EC levels in each study may have significantly contributed to this difference. Figure 1 shows the effect of soil salinity on the yield of the beet cultivars studied. Under traditional management (M1), FWAP response to conductivity is best fit by a linear model, with a reduction of 9.51 g for ‘Early Wonder’ (C1) and 8.66 g for ‘Itapuã’ (C2) for every unit increase in Treatments
mm mm S1 99.48 89.54 S1 70.15 63.14 S3 79.52 71.57 S3 88.31 79.49 S6 83.96 75.56 S6 107.62 96.85 S9 90.71 81.64 S9 78.96 71.06 S12 72.19 64.97 S12 71.44 64.29
mm mm S1 107.06 96.35 S1 91.03 81.93 S3 75.79 68.21 S3 93.93 84.54 S6 76.54 68.88 S6 113.20 101.88 S9 70.87 63.78 S9 101.57 91.42 S12 73.31 65.97 S12 80.08 72.08
Table 3. Description of irrigation application and crop evapotranspiration in the studied treatments.
S1 to S12: 1 to 12 dS m-1, ETc: crop evapotranspiration.
‘Early Wonder’
Irrigation ETcTraditional management
Treatments Irrigation ETcControlled management
Treatments
‘Itapuã’
Irrigation ETcTraditional management
Treatments Irrigation ETcControlled management Cultivars
C1 154.2Ba 145.2Aa 161.6Aa 202.0Ba 315.8Aa 347.2BaC2 151.4Aa 150.15Aa 180.7Aa 212.8Ba 332.0Aa 363.0Ba
MSD 8.14 2.87 22.6 22.6 24.4 24.4
Table 4. Comparison of means of fresh weight of the aerial part (FWAP), root fresh weight (RFW), and total fresh weight (TFW) in the beet crop.
Different and lower-case letters in the same column and different and capital letters in the same line indicate differences between means by Tukey’s test (P ≤ 0.05).MSD: Minimum significant difference.
Yield
M1 M2
FWAPM1 M2
RFWM1 M2
TFW
g plant-1
466
CHILEAN JOURNAL OF AGRICULTURAL RESEARCH 76(1) JANUARY-MARCH 2016CHILEAN JOURNAL OF AGRICULTURAL RESEARCH 76(4) OCTOBER-DECEMBER 2016
the initial soil salinity (EC) (Figure 1). Under controlled management (M2), FWAP fits a quadratic model with maximum estimate of 164.66 g (C1) and 177.02 g (C2) for salinities corresponding to 6 dS m-1. Under M1, RFW response fits a linear model with a decrease of 11.365 g (C1) and 11.025 g (C2) for each unit increase in EC (Figures 1C and 1D). Under M2, the best fit model was quadratic, with maximum estimates of 248.83 g for C1 and 258.52 g for C2 for salinities corresponding to 6 dS m-1. Such results show a tolerance of the beet crop to soil salinities up to EC 6 dS m-1, corroborating the results presented by Ferreira et al. (2006). In studies of water salinity in beet cultivation, these authors observed that the crop’s productivity was not reduced when subjected to water with EC < 6 dS m-1. The regression curve adjusted for TFW showed the same trend for the fertigation managements studied, with a reduction of 4.51 (C1) and 3.48 g (C2) for the traditional management for each unit increase in EC (Figures 1E and 1F). This result indicates a greater tolerance of ‘Itapuã’ to soil salinity, but summer climatic conditions may have helped to increase its production compared to ‘Early Wonder’, which is suitable for colder times of the year, as stated by Filgueira (2008). The controlled management fit a quadratic model with maximum TFW estimate of 424 and 432 g per plant for ‘Early Wonder’ and ‘Itapuã’, respectively, subjected to EC 6 dS m-1.
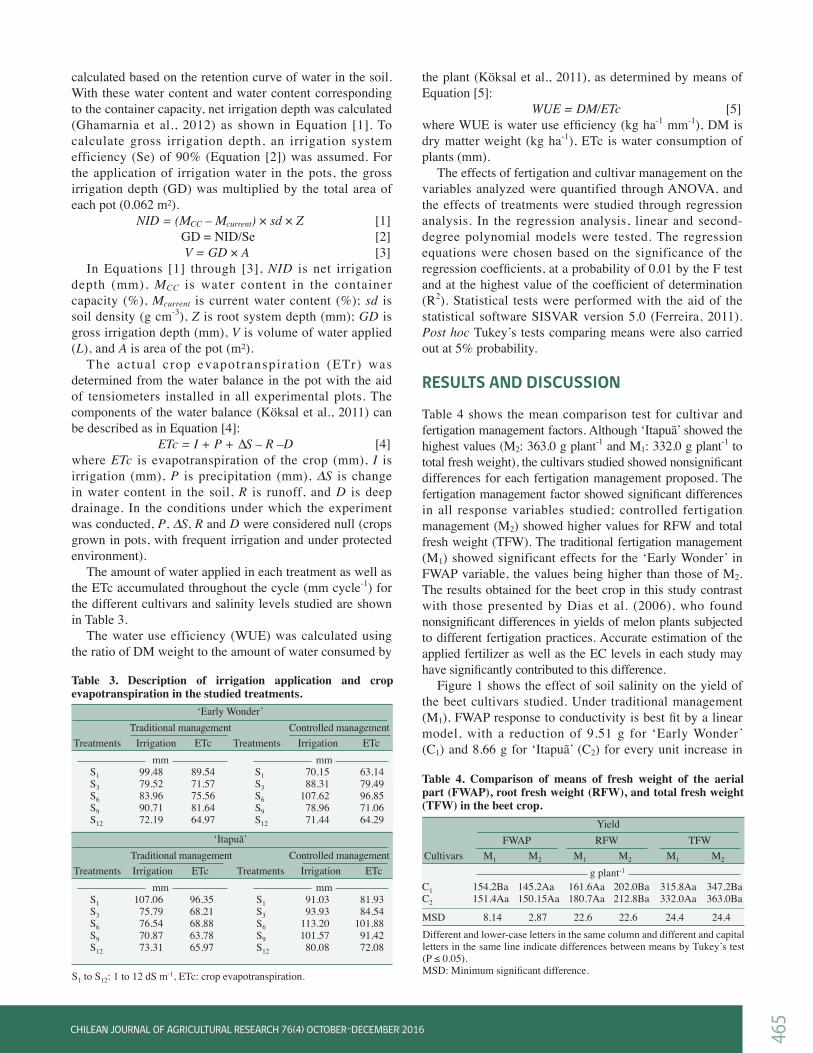
The means comparison tests for the treatments (Table 5) revealed that dry weight of aerial part (DWAP), root dry weight (RDW) and total dry weight (TDW) variables were all significantly affected (p < 0.05) by cultivars and fertigation management practices, as well as the interaction among them. In studies of fertigation management in tomato crops in saline soils, Medeiros et al. (2012) also observed a significant effect of fertigation management, while Eloi et al. (2011) found no influence of the fertigation management on the commercial yield of the tomato plant. ‘Itapuã’ showed a better response to fertigation in all the variables studied when compared to ‘Early Wonder’, showing a greater tolerance to the high concentrations
M1: Traditional fertigation; M2: controlled fertigation; EC: initial soil salinity.
Figure 1. Scatter diagrams and regressions of fresh weight of the aerial part (FWAP) for ‘Early Wonder’ (C1) (A) and ‘Itapuã’ (C2) (B); root fresh weight (RFW) for C1 (C), and C2 (D), and total fresh weight (TFW) in C1 (E) and C2 (F).
Cultivars
C1 13.7Aa 15.6Ba 16.8Aa 19.2Ba 30.6Aa 34.7BaC2 16.7Ab 20.5Bb 20.3Ab 26.2Bb 37.1Ab 46.6Bb
MSD 1.37 1.37 2.04 2.04 2.50 2.50
Table 5. Means comparison tests for dry weight of the aerial part (DWAP), root dry weight (RDM) and total dry weight (TDW).
Different and lower-case letters in the same column and different and capital letters in the same line indicate differences between the means by Tukey’s test (P ≤ 0.05).MSD: Minimum significant difference.
Yield
M1 M2
DWAPM1 M2
RDWM1 M2
TDW
g plant-1

467
CHILEAN JOURNAL OF AGRICULTURAL RESEARCH 76(1) JANUARY-MARCH 2016CHILEAN JOURNAL OF AGRICULTURAL RESEARCH 76(4) OCTOBER-DECEMBER 2016
of fertilizers provided by the traditional fertigation management (M1) as well as a better yield when the controlled management was used (M2). Figure 2 shows the effect of different fertigation managements based on soil salinity for DWAP, RDM and TDM. Under traditional fertigation management (M1), EC had a linear effect on all analyzed response variables. For ‘Early Wonder’ under traditional management, there was a reduction of 0.9774 g for DWAP, 1.782 g for RDW and 2.7056 g for TDW for each unit increase in EC. ‘Itapuã’ under M1 showed smaller reductions with values of 0.9578 g for DWAP, 1.1861 g for RDW and 2.1438 g for TDW with every unit increase in EC. Similar effects were also identified by Dias et al. (2006), who found linear reduction in the yields of melon crops subjected to different fertigation managements with increasing soil salinity. Under controlled fertigation management (M2), the analyzed responses were best fit with a quadratic polynomial model (Figure 2); showing progressive increases in the beet crop yield up to the 6 dS m-1 threshold salinity. This effect is due to the fertigation control with the aid of soil solution extractors that provided favorable conditions for the proper crop development. These results are consistent with those presented by Hajiboland et al. (2009) in studies about the influence of salinity on quality of beets. They found no
negative effect on the crop when beets were subjected to water with EC 5.5 dS m-1. However, these results do not match those presented by Resende and Cordeiro (2007), who studied beet cultivation with saline water and soil conditioners in Petrolina, Brazil. They observed a decrease in crop yield when waters had EC > 4.0 dS m-1. However, one should take into account climatic differences between regions as well as the composition of salts and the quality of the water used in the experiments performed. Table 6 shows the means of interactions between fertigation management and beet cultivars for the variables
Cultivars
C1 63.6Aa 63.6Aa 34.8Aa 42.5Ba 34.8Aa 42.5BaC2 70.2Ab 70.2Ab 38.5Aa 59.9Bb 38.5Aa 59.9Bb
SMD 5.64 5.64 4.6 4.6 4.6 4.6
Table 6. Mean values of the aerial (WUEap), root (WUEr), and total water use efficiency (tWUE) under different fertigation management methods and for different beet cultivars.
Different and lower case letters in the same column and different and capital letters in the same line indicate differences between the means by Tukey’s test (P ≤ 0.05).SMD: Significant minimum difference.
M1 M2
WUEap
M1 M2
WUEr
M1 M2
tWUE
kg mm-1 ha-1
M1: Traditional fertigation; M2: controlled fertigation; EC: initial soil salinity
Figure 2. Scatter diagrams and regression equations for analyses of aerial part (DWAP), root (RDW) and total (TDW) dry matter weight based on fertigation management and soil salinity levels for ‘Early Wonder’ (A, C, E) and ‘Itapuã’ (B, D, F).
468
CHILEAN JOURNAL OF AGRICULTURAL RESEARCH 76(1) JANUARY-MARCH 2016CHILEAN JOURNAL OF AGRICULTURAL RESEARCH 76(4) OCTOBER-DECEMBER 2016
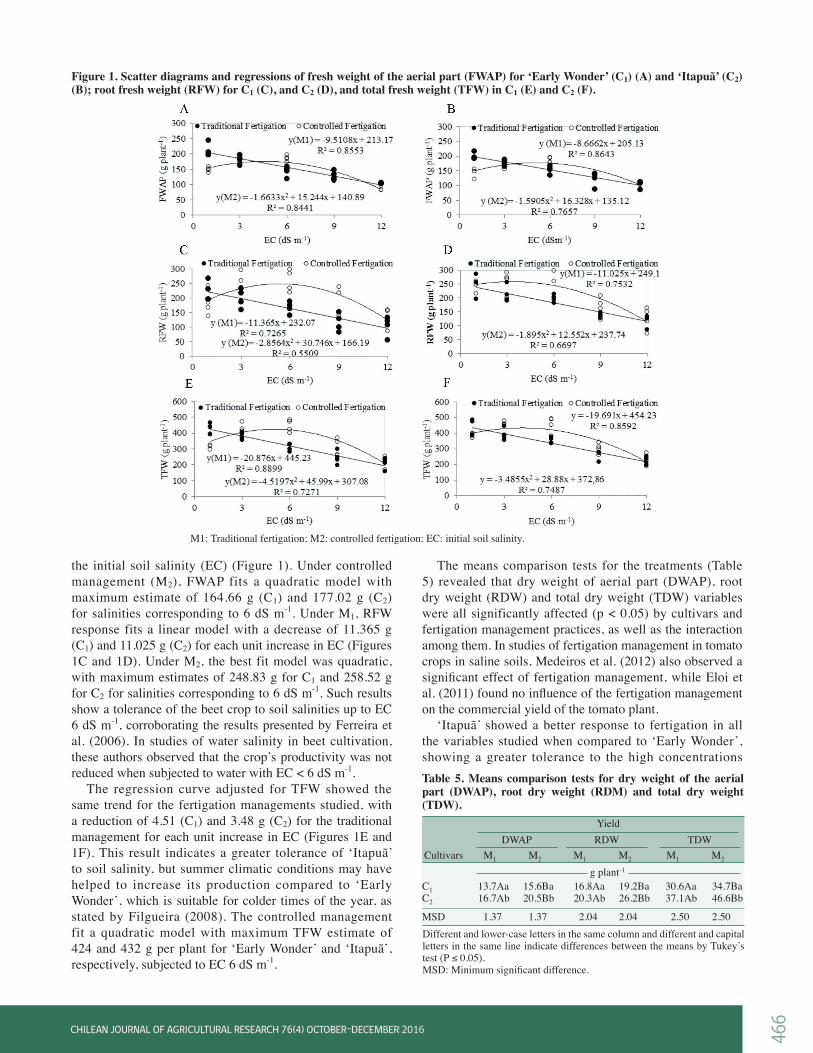
related to the plants’ WUE. For the cultivar factor, within each fertigation management level there was a significant difference for all variables studied. ‘Itapuã’ showed greater WUE in aerial part (WUEap), root (WUEr) and total WUE (tWUE). Fertigation management only significantly affected the response variables in C2, for which the controlled management (M2) had higher values for the variables studied. Figure 3 shows the regression equations for the variables concerning WUE based on the initial salinity of the soil (EC). For the traditional fertigation, management (M1) there was a linear reduction of all the variables studied. For ‘Early Wonder’ reductions were 1.577 kg mm-1 ha-1 for WUEap, 3.195 kg mm-1 ha-1 for WUEr, and 4.7487 kg mm-1 ha-1 for tWUE. ‘Itapuã’ showed reductions of 1.554 kg mm-1 ha-1 for WUEap, 2.1292 kg mm-1 ha-1 for WUEr and 3.8482 kg mm-1 ha-1 for tWUE at each unit increase of soil salinity. For the controlled management there were significant differences on the soil salinity factor, the quadratic polynomial model being the most representative one for the variables analyzed. For such adjustment, higher values were found in intermediate salinity levels near EC 6 dS m-1; for the conditions under study an osmotic adjustment of the crop close to the tolerance level of the beet crop may have occurred, a salinity level close to 7 dS m-1 (Ayers and Westcot, 1985; Chen and Jiang, 2010). In studies about
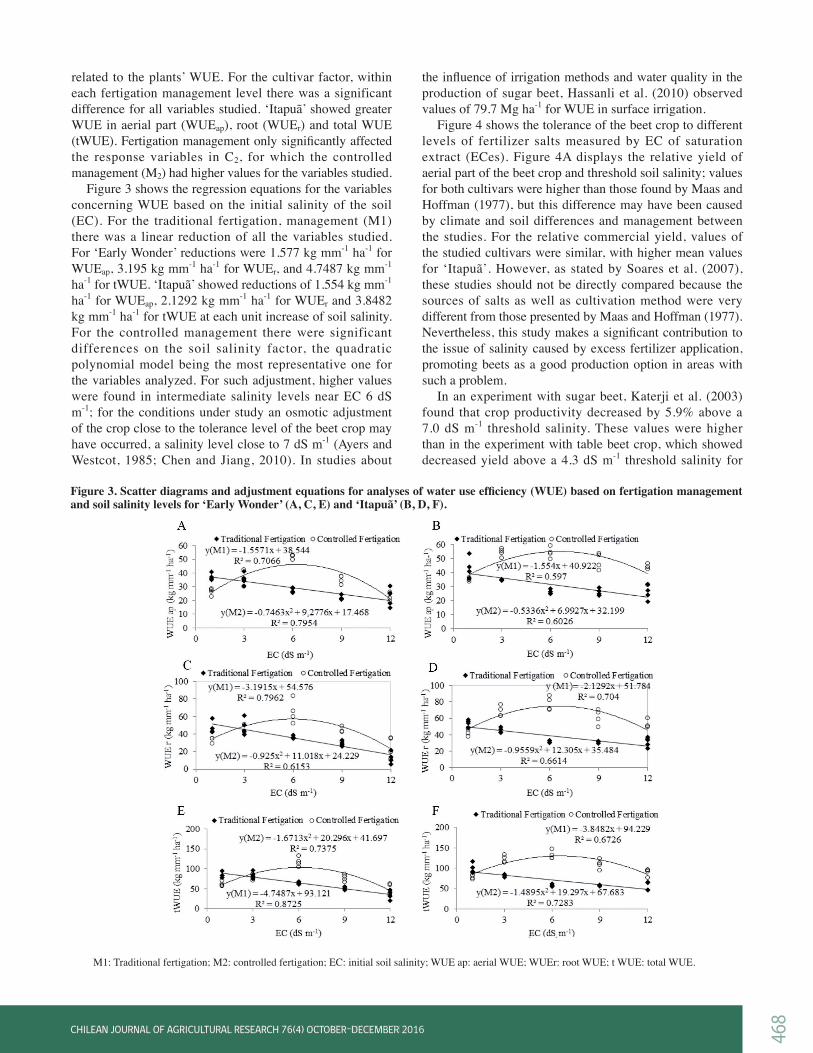
the influence of irrigation methods and water quality in the production of sugar beet, Hassanli et al. (2010) observed values of 79.7 Mg ha-1 for WUE in surface irrigation. Figure 4 shows the tolerance of the beet crop to different levels of fertilizer salts measured by EC of saturation extract (ECes). Figure 4A displays the relative yield of aerial part of the beet crop and threshold soil salinity; values for both cultivars were higher than those found by Maas and Hoffman (1977), but this difference may have been caused by climate and soil differences and management between the studies. For the relative commercial yield, values of the studied cultivars were similar, with higher mean values for ‘Itapuã’. However, as stated by Soares et al. (2007), these studies should not be directly compared because the sources of salts as well as cultivation method were very different from those presented by Maas and Hoffman (1977). Nevertheless, this study makes a significant contribution to the issue of salinity caused by excess fertilizer application, promoting beets as a good production option in areas with such a problem. In an experiment with sugar beet, Katerji et al. (2003) found that crop productivity decreased by 5.9% above a 7.0 dS m-1 threshold salinity. These values were higher than in the experiment with table beet crop, which showed decreased yield above a 4.3 dS m-1 threshold salinity for
Figure 3. Scatter diagrams and adjustment equations for analyses of water use efficiency (WUE) based on fertigation management and soil salinity levels for ‘Early Wonder’ (A, C, E) and ‘Itapuã’ (B, D, F).
M1: Traditional fertigation; M2: controlled fertigation; EC: initial soil salinity; WUE ap: aerial WUE; WUEr: root WUE; t WUE: total WUE.

469
CHILEAN JOURNAL OF AGRICULTURAL RESEARCH 76(1) JANUARY-MARCH 2016CHILEAN JOURNAL OF AGRICULTURAL RESEARCH 76(4) OCTOBER-DECEMBER 2016
both cultivars studied. Maas and Hoffman (1977) also found higher values for the relative yield and 7 dS m-1 threshold salinity for the sugar beet crop.
CONCLUSIONS
The fertigation management regime in which soil solution salinity was controlled showed better performance in low soil salinity conditions for the two studied cultivars. However, it is still necessary to develop more studies on this aspect considering more crop cycles as well as different climatic conditions during in the year. ‘Itapuã’ showed better yield and water use efficiency than ‘Early Wonder’ at electrical conductivity levels below 6 dS m-1. Monitoring and controlling salinity of soil solution afforded higher beet yields when compared to uncontrolled management and is recommended in soils with high levels of electrical conductivity.
ACKNOWLEDGEMENTS
We thank Coordenação de Aperfeiçoamento de Pessoal de Nível Superior (CAPES) for granting the Masters scholarship; Conselho Nacional de Desenvolvimento Científico e Tecnológico (CNPq), for granting productivity scholarships; and the Department of Rural Engineering of UNESP for the facility.
REFERENCES
Ayers, R.S., and D.W. Westcot. 1985. Water quality for agriculture. Irrigation and Drainage Paper 29, Revised 1. 177 p. FAO, Rome, Italy.
CEPAGRI. 2011. Clima dos municípios paulistas. Centro de Pesquisas Meteorológicas e Climáticas Aplicadas à Agricultura (CEPAGRI), Piracicaba, São Paulo, Brasil. Available at http://www.cpa.unicamp.br/outras-informacoes/clima_muni_086.html (accessed March 2011).
Chen, H., and J.G. Jiang. 2010. Osmotic adjustment and plant adaptation to environmental changes to drought and salinity. Environmental Review 18:309-319. doi:10.1139/a11-003.
Dias, N.S., S.N. Duarte, J.F. Medeiros, e J.F. Teles Filho. 2006. Salinidade e manejo da fertirrigação em ambiente protegido. II. Efeitos sobre o rendimento do meloeiro. Irriga 11:376-383.
Droogers, P., M. Torabi, M. Akbari, and E. Pazira. 2001. Field-scale modeling to explore salinity problems in irrigated agriculture. Irrigation and Drainage 50:77-90. doi:10.1002/ird.3.
Duarte, S.N., N.D. Dias, e J.F. Teles Filho. 2007. Recuperação de um solo salinizado devido a excesso de fertilizantes em ambiente protegido. Irriga 12:422-428.
Eloi, W.M., S.N. Duarte, T.M. Soares, E.F.F. Silva, e J.H. Miranda. 2011. Rendimento comercial do tomateiro em resposta à salinização ocasionada pela fertigação em ambiente protegido. Revista Brasileira de Engenharia Agrícola e Ambiental 15:471-476.
Embrapa. 2006. Sistema Brasileiro de classificação de solos. Empresa Brasileira de Pesquisa Agropecuária (EMBRAPA). Embrapa Solos, Brasília DF, Brazil. p. 306. Available at http://www.agrolink.com.br/downloads/sistema-brasileiro-de-classificacao-dos-solos2006.pdf (accessed March 2011).
Farkhonder, R., E. Nabizadeh, and N. Jalilneezhad. 2012. Effect of salinity stress on proline content, membrane stability and water relations in two sugar beet cultivars. International Journal of AgriScience 2:385-392.
Ferreira, D.F. 2011. Sisvar: a computer statistical analysis system. Ciência e Agrotecnologia 35:1039-1042. http://dx.doi.org/10.1590/S1413-70542011000600001.
Ferreira, P.A., R.F. Moura, D.B. Santo, P.C.R. Fontes, e R.F. Melo. 2006. Efeitos da lixiviação e salinidade da água sobre um solo salinizado cultivado com beterraba. Revista Brasileira de Engenharia Agrícola e Ambiental 10:570-578. http://dx.doi.org/10.1590/S1415-43662006000300006.
Fi lgueira , F.A.R. 2008. Novo manual de oler icul tura: agrotecnologia moderna na produção e 305 comercialização de hortaliças. 412 p. Universidad Federal de Viçosa (UFV), Viçosa, Brasil.
Ghamarnia, H., I. Arji, S. Sepehri, S. Norozpour, and E. Khodaei. 2012. Evaluation and comparison of drip and conventional irrigation methods on sugar beets in a semiarid region. Journal Irrigation and Drainage Engineering 138:90-97. doi:10.1061/(ASCE)IR.1943-4774.0000362.
Grangeiro, L.C., M.Z. Negreiros, B.S. Souza, P.E. Azevêdo, S.L. Oliveira, e M.A. Medeiros. 2007. Acúmulo e exportação de nutrientes em beterraba. Ciência e Agrotecnologia 31:267-273. http://dx.doi.org/10.1590/S1413-70542007000200001.
Hajiboland, R., A. Joudmand, and K. Fotouhi. 2009. Mild salinity improves sugar beet (Beta vulgaris L.) quality. Acta Scandinavica 59:295-305. doi:10.1080/09064710802154714.
Figure 4. Relative beet yield based on the electrical conductivity of the saturation extract (ECse) for the aerial part (A) and the commercial part of the crop (B).
C1: ‘Early Wonder’; C2: ‘Itapuã’.
470
CHILEAN JOURNAL OF AGRICULTURAL RESEARCH 76(1) JANUARY-MARCH 2016CHILEAN JOURNAL OF AGRICULTURAL RESEARCH 76(4) OCTOBER-DECEMBER 2016
Hassanli, A.M., D.S. Ahmadira, and S. Beecham. 2010. Evaluation of the influence of irrigation methods and water quality on sugar beet yield and water use efficiency. Agricultural Water Management 97:357-362. http://dx.doi.org/10.1016/j.agwat.2009.10.010.
Katerji, N., J.W. Van Hoorn, A. Hamdy, and M. Mastrorilli. 2003. Salinity effect on crop development and yield, analysis of salt tolerance according to several classification methods. Agricultural Water Management 62:37-66. http://dx.doi.org/10.1016/S0378-3774(03)00005-2.
Köksal, E.S., Y. Güngor, and Y.E. Yildrim. 2011. Spectral reflectance characteristics of sugar beet under different levels of irrigation water and relationships between growth parameters and spectral indexes. Irrigation and Drainage 60:187-195. doi:10.1002/ird.55.
Maas, E.V., and G.J. Hoffman. 1977. Crop salt tolerance-currents assessment. Journal of Irrigation and Drainage Division 103:115-114.
Medeiros, P.R.F., S.N. Duarte, e E.F.F. Silva. 2012. Eficiência do uso da água e de fertilizantes no manejo de fertirrigação no cultivo do tomateiro sob condições de salinidade do solo. Revista Brasileira de Ciências Agrárias 7:344-351. doi:10.5039/agraria.v7i2a1563.
Nascimento, W.M. 2012. Perspectivas de produção de sementes de beterraba no Brasil. Associação Brasileira do comércio de sementes e mudas, Campinas, São Paulo, Brazil. Available at http://www.abcsem.com.br/noticia.php?cod=2400 (accessed July 2016).
Oliveira, F.A., J.F. Medeiros, S.N. Duarte, M.J. Silva Júnior, e C.M. Campelo. 2011. Calibração de extratores providos de cápsula porosa para monitoramento da salinidade e da concentração de íons. Engenharia Agrícola 31:520-528. http://dx.doi.org/10.1590/S0100-69162011000300012.
Resende, G.M., e G.G. Cordeiro. 2007. Uso da água salina e condicionador de solo na produtividade de beterraba e cenoura no Semi-Árido do Submédio São Francisco. Comunicado Técnico 128. Maio 2007. 4 p. Petrolina, Pernambuco, Brazil. Available at http://ainfo.cnptia.embrapa.br/digital/bitstream/CPATSA/36704/1/COT128.pdf (accessed March 2011).
Richards, L.A. 1954. Diagnosis and improvement of saline and alkali soils. USDA Agriculture Handbook 60. 160 p. US Salinity Laboratory, Washington DC, USA.
Silva, A.O. 2014. A fertirrigação e o processo de salinização de solos em ambiente protegido. Nat iva 2:180-186. doi:10.14583/2318-7670.v02n03a10.
Silva, E.F.F., G.R. Anti, Q.A.C. Camello, e S.N. Duarte. 2000. Extratores de cápsulas porosas para o monitoramento da condutividade elétrica e do teor de potássio na solução do solo. Scientia Agrícola 57:785-789. http://dx.doi.org/10.1590/S0103-90162000000400030.
Silva, E.M., C.J.G.S. Lima, S.N. Duarte, F.S. Barbosa, e R. Maschio. 2013. Níveis de salinidade e manejo da fertirrigação sobre características da berinjela cultivada em ambiente protegido. Revista Ciência Agronômica 44:150-158. http://dx.doi.org/10.1590/S1806-66902013000100019.
Soares, T.M., E.F.F. Silva, S.N. Duarte, R.F. Melo, C.A. Jorge, e E.M. Bonfim-Silva. 2007. Produção de alface utilizando águas salobras em sistema hidropônico. Irriga 12:235-248. Available at http://www.ufrb.edu.br/neas/images/Artigos_NEAS/2007_14.pdf (accessed March 2011).
Tivelli, S.W., T.L. Factor, J.R.S. Teramoto, E.G. Fabri, A.R.A. Moraes, P.E. Trani, e A. May. 2011. Beterraba do plantio à comercialização. Boletim Técnico IAC 210. 51 p. Instituto Agronômico de Campinas, Campinas, Brasil.
Trani, P.E., F.A. Passos, M. Tavares, e J.A. Azevedo Filho. 1998. Hortaliças. p. 190-285. In Van Raij, B., H. Cantarella, J.A. Quaggio, A.M.C. Furlani (eds.) Recomendações de adubação e calagem para o Estado de São Paulo. Instituto Agronômico de Campinas, Campinas, São Paulo, Brasil.