yield curve estimation and prediction with …etd.lib.metu.edu.tr/upload/12605126/index.pdf ·...
TRANSCRIPT

YIELD CURVE ESTIMATION AND PREDICTION
WITH VASICEK MODEL
DERVIS BAYAZIT
JUNE 2004

YIELD CURVE ESTIMATION AND PREDICTION
WITH VASICEK MODEL
A THESIS SUBMITTED TO
THE GRADUATE SCHOOL OF APPLIED MATHEMATICS
OF
THE MIDDLE EAST TECHNICAL UNIVERSITY
BY
DERVIS BAYAZIT
INPARTIALFULFILLMENTOFTHEREQUIREMENTSFORTHEDEGREEOF
MASTER OF SCIENCE
IN
THE DEPARTMENT OF FINANCIAL MATHEMATICS
JUNE 2004

Approval of the Graduate School of Applied Mathematics
Prof.Dr. Aydın AYTUNA
Director
I certify that this thesis satisfies all the requirements as a thesis for the degree of
Master of Science.
Prof.Dr. Hayri KOREZLIOGLU
Head of Department
This is to certify that we have read this thesis and that in our opinion it is fully
adequate, in scope and quality, as a thesis for the degree of Master of Science.
Assoc.Prof.Dr. Azize HAYVAFI
Supervisor
Examining Committee Members
Prof.Dr. Hayri KOREZLIOGLU
Assoc.Prof.Dr. Azize HAYVAFI
Prof.Dr. Gerhard Wilhelm WEBER
Assoc.Prof.Dr. Yasemin SERIN
Assist.Prof.Dr. Adil ORAN

Abstract
YIELD CURVE ESTIMATION AND PREDICTION
WITH VASICEK MODEL
Bayazıt, Dervis
M.Sc., Department of Financial Mathematics
Supervisor: Assoc. Prof. Dr. Azize Hayfavi
June 2004, 82 pages
The scope of this study is to estimate the zero-coupon bond yield curve of
tomorrow by using Vasicek yield curve model with the zero-coupon bond yield
data of today. The raw data of this study is the yearly simple spot rates of the
Turkish zero-coupon bonds with different maturities of each day from July 1,
1999 to March 17, 2004. We completed the missing data by using Nelson-Siegel
yield curve model and we estimated tomorrow yield curve with the discretized
Vasicek yield curve model.
Keywords: One factor short rate models, Vasicek yield curve, Nelson-Siegel yield
curve, Monte-Carlo method
iii

Oz
VASICEK MODELI ILE VERIM EGRISININ BUGUN VE
ERTESI GUN ICIN TAHMINI
Bayazıt, Dervis
Yuksek Lisans, Finansal Matematik Bolumu
Tez Yoneticisi: Doc. Dr. Azize Hayfavi
Haziran 2004, 82 sayfa
Bu calısmanın amacı bugunun kuponsuz verim(tahvil, bono) verisini kulla-
narak, yarının kuponsuz verim egrisini tahmin etmektir. Bu calismada ham veri
olarak, 1-Temmuz-1999 ve 17-Mart-2004 tarihleri arasında gunluk olarak elde
edilmis farklı vadeli kuponsuz tahvil ve bonoların verimleri kullanılmıstır. Ek-
sik veriler Nelson-Siegel verim egrisi modeli kullanılarak tamamlanmıs ve Vasicek
modeli kullanılarak ertesi gunun verim egrisi tahmin edilmistir.
Anahtar Kelimeler: Tek faktorlu kısa donem faiz haddi modelleri, Vasicek verim
egrisi, Nelson-Siegel verim egrisi, Monte-Carlo metodu
iv

To my family
v

Acknowledgments
I would like to take this opportunity to thank Assoc. Prof. Dr. Azize Hayfavi
for patiently guiding, encouraging and motivating me throughout this study. I
would also like to thank the members of Risk Group, Hayri Korezlioglu, Azize
Hayfavi, Kasırga Yıldırak, and Yeliz Yolcu, who helped me in every step of this
study.
I would like to express my special thanks to Prof.Dr.Hayri Korezlioglu not
only for the help, but also for the shared responsibility of this study like a super-
visor.
I also would like to express my special thanks to Kasırga Yıldırak for his ad-
vices and comments on the application part of this study.
I am also grateful to Yeliz Yolcu for her unbounded support, encouragement
and invaluable friendship.
I also would like to thank Burak Akan and Ozkan Erdal who provided the
data used in this study.
I also would like to thank my university, Atılım University, for giving me en-
couragement, patience and support whenever I needed. I am also grateful to my
friend, Uygar Pekerten, for welcoming me to his house and giving me feedback
when I needed.
Last, but by no means least, to Nermin, who was always ready to offer advise,
encouragement and emotional support whenever it is needed.
vi

Table of Contents
Abstract . . . . . . . . . . . . . . . . . . . . . . . . . . . . . . . . . . . . . . . . . . . . . . . . . . . iii
Oz . . . . . . . . . . . . . . . . . . . . . . . . . . . . . . . . . . . . . . . . . . . . . . . . . . . . . . . . . . . iv
Acknowledgements . . . . . . . . . . . . . . . . . . . . . . . . . . . . . . . . . . . . . . . vi
Table of Contents . . . . . . . . . . . . . . . . . . . . . . . . . . . . . . . . . . . . . . . vii
List of Tables . . . . . . . . . . . . . . . . . . . . . . . . . . . . . . . . . . . . . . . . . . . . . ix
List of Figures . . . . . . . . . . . . . . . . . . . . . . . . . . . . . . . . . . . . . . . . . . . . x
Chapter
1 Introduction . . . . . . . . . . . . . . . . . . . . . . . . . . . . . . . . . . . . . . . . . . . 1
2 One Factor Interest Rate Models . . . . . . . . . . . . . . . . . . 7
2.1 Merton Model(1973) . . . . . . . . . . . . . . . . . . . . . . . . . 7
2.2 Vasicek Model(1977) . . . . . . . . . . . . . . . . . . . . . . . . . 8
2.3 Dothan Model (1978) . . . . . . . . . . . . . . . . . . . . . . . . . 10
2.4 Brennan-Schwartz Model (1980) . . . . . . . . . . . . . . . . . . . 11
2.5 Cox-Ingersoll-Ross (CIR) Model(1985) . . . . . . . . . . . . . . . 14
2.6 Ho-Lee Model(1986) . . . . . . . . . . . . . . . . . . . . . . . . . 14
2.7 Exponential Vasicek Model(EV) . . . . . . . . . . . . . . . . . . . 15
2.8 Black-Derman-Toy Model (1990) . . . . . . . . . . . . . . . . . . 17
2.9 Hull-White Extended Short Rate Models (1990) . . . . . . . . . . 17
2.9.1 Hull-White- Extended Vasicek Model . . . . . . . . . . . . 18
2.9.2 Hull-White Extended CIR Model . . . . . . . . . . . . . . 20
2.10 Black-Karazinsky Model (1991) . . . . . . . . . . . . . . . . . . . 20
vii

2.11 Geometric Brownian Motion (GBM) Model . . . . . . . . . . . . 21
2.12 Marsh-Rosenfeld Model(1983) . . . . . . . . . . . . . . . . . . . . 22
3 Yield Curve Modelling . . . . . . . . . . . . . . . . . . . . . . . . . . . . . . . 24
3.1 Nelson-Siegel Yield Curve Model . . . . . . . . . . . . . . . . . . 25
3.2 Vasicek Yield Curve . . . . . . . . . . . . . . . . . . . . . . . . . 26
4 Applications . . . . . . . . . . . . . . . . . . . . . . . . . . . . . . . . . . . . . . . . . . . . 35
4.1 Data Analysis . . . . . . . . . . . . . . . . . . . . . . . . . . . . . 35
4.2 Yield Curve Fitting with Nelson-Siegel Model . . . . . . . . . . . 37
4.3 Yield Curve Estimation with Vasicek Model . . . . . . . . . . . . 44
5 Conclusion . . . . . . . . . . . . . . . . . . . . . . . . . . . . . . . . . . . . . . . . . . . . . . 80
References . . . . . . . . . . . . . . . . . . . . . . . . . . . . . . . . . . . . . . . . . . . . . . . . 81
viii

List of Tables
1.1 One Factor Short-Rate Models . . . . . . . . . . . . . . . . . . . . 2
4.1 MNO: The maximum number of observations and its day for the
given data set. MINO: The minimum number of observations and
its day for the given data set. ∗: An example from several days. . 36
4.2 Estimated values of parameters for constraint set a. . . . . . . . . 47
4.3 Estimated values of parameters constraint set b. . . . . . . . . . . 51
4.4 Sum of Squared Errors-SSEs of Vasicek Yield Curve Estimations:
given for each initial i point tuple and folds. Nelson-Siegel SSEs is
5.01802205688122. . . . . . . . . . . . . . . . . . . . . . . . . . . 52
4.5 Sum of Squared Errors-SSEs of Vasicek Yield Curve Estimations:
given for each initial ii point tuple and folds. Nelson-Siegel SSEs
is 5.01802205688122. . . . . . . . . . . . . . . . . . . . . . . . . . 52
4.6 Sum of Squared Errors-SSEs of Vasicek Yield Curve Estimations:
given for each initial iii point tuple and folds. Nelson-Siegel SSEs
is 5.01802205688122. . . . . . . . . . . . . . . . . . . . . . . . . . 52
ix

List of Figures
4.1 Fit of Yield Curves . . . . . . . . . . . . . . . . . . . . . . . . . . 40
4.2 Fit of Yield Curves . . . . . . . . . . . . . . . . . . . . . . . . . . 41
4.3 Fit of Yield Curves . . . . . . . . . . . . . . . . . . . . . . . . . . 42
4.4 Fit of Yield Curves . . . . . . . . . . . . . . . . . . . . . . . . . . 43
4.5 Yield Curve Fitting with the Vasicek and Nelson-Siegel Models by
using constraint-initial point tuple set a-i. . . . . . . . . . . . . . 48
4.6 Yield Curve Fitting with the Vasicek Model by using constraint-
initial point tuple set a-ii . . . . . . . . . . . . . . . . . . . . . . 49
4.7 Yield Curve Fitting with the Vasicek Model by using constraint-
initial point tuple set a-iii . . . . . . . . . . . . . . . . . . . . . . 50
4.8 Yield Curve Fitting with the Vasicek Model by using constraint-
initial point tuple b-i . . . . . . . . . . . . . . . . . . . . . . . . . 53
4.9 Yield Curve Fitting with the Vasicek Model by using constraint-
initial point tuple b-ii . . . . . . . . . . . . . . . . . . . . . . . . 54
4.10 Yield Curve Fitting with the Vasicek Model by using constraint-
initial point tuple b-iii . . . . . . . . . . . . . . . . . . . . . . . . 55
4.11 Quantile-quantile Plot of X and March 16, 2004 yield data. . . . . 59
4.12 Quantile-quantile Plot of X and March 17, 2004 yield data. . . . . 60
4.13 Constraint initial point tuple b-ii and discretization fold2. . . . . 61
4.14 Yield Curve Estimation with the Vasicek Model by using constraint-
initial point tuple a-i and discretization fold-1 . . . . . . . . . . 62
4.15 Yield Curve Estimation with the Vasicek Model by using constraint-
initial point tuple a-i and discretization fold-2 . . . . . . . . . . 63
4.16 Yield Curve Estimation with the Vasicek Model by using constraint-
initial point tuple b-i and discretization fold-2 . . . . . . . . . . 64
4.17 Yield Curve Estimation with the Vasicek Model by using constraint-
initial point tuple a-ii and discretization fold-1 . . . . . . . . . . 65
4.18 Yield Curve Estimation with the Vasicek Model by using constraint-
initial point tuple a-ii and discretization fold-2 . . . . . . . . . . 66
x

4.19 Yield Curve Estimation with the Vasicek Model by using constraint-
initial point tuple b-ii and discretization fold-2 . . . . . . . . . . 67
4.20 Yield Curve Estimation with the Vasicek Model by using constraint-
initial point tuple a-iii and discretization fold-1 . . . . . . . . . 68
4.21 Yield Curve Estimation with the Vasicek Model by using constraint-
initial point tuple a-iii and discretization fold-2 . . . . . . . . . 69
4.22 Yield Curve Estimation with the Vasicek Model by using constraint-
initial point tuple b-iii and discretization fold-2 . . . . . . . . . 70
4.23 Nelson-Siegel Yield Curve Fitting, and Yield Curve Estimation
with the Vasicek Model by using constraint-initial point tuple a-i
and discretization fold-1 . . . . . . . . . . . . . . . . . . . . . . . 71
4.24 Nelson-Siegel Yield Curve Fitting, and Yield Curve Estimation
with the Vasicek Model by using constraint-initial point tuple a-i
and discretization fold-2 . . . . . . . . . . . . . . . . . . . . . . . 72
4.25 Nelson-Siegel Yield Curve Fitting, and Yield Curve Estimation
with the Vasicek Model by using constraint-initial point tuple b-i
and discretization fold-2 . . . . . . . . . . . . . . . . . . . . . . . 73
4.26 Nelson-Siegel Yield Curve Fitting, and Yield Curve Estimation
with the Vasicek Model by using constraint-initial point tuple a-ii
and discretization fold-1 . . . . . . . . . . . . . . . . . . . . . . . 74
4.27 Nelson-Siegel Yield Curve Fitting, and Yield Curve Estimation
with the Vasicek Model by using constraint-initial point tuple a-ii
and discretization fold-2 . . . . . . . . . . . . . . . . . . . . . . . 75
4.28 Nelson-Siegel Yield Curve Fitting, and Yield Curve Estimation
with the Vasicek Model by using constraint-initial point tuple b-ii
and discretization fold-2 . . . . . . . . . . . . . . . . . . . . . . . 76
4.29 Nelson-Siegel Yield Curve Fitting, and Yield Curve Estimation
with the Vasicek Model by using constraint-initial point tuple a-
iii and discretization fold-1 . . . . . . . . . . . . . . . . . . . . . 77
4.30 Nelson-Siegel Yield Curve Fitting, and Yield Curve Estimation
with the Vasicek Model by using constraint-initial point tuple a-
iii and discretization fold-2 . . . . . . . . . . . . . . . . . . . . . 78
xi

4.31 Nelson-Siegel Yield Curve Fitting, and Yield Curve Estimation
with the Vasicek Model by using constraint-initial point tuple b-
iii and discretization fold-2 . . . . . . . . . . . . . . . . . . . . . 79
xii

Chapter 1
Introduction
In our century the interest rate has an important place in all transactions
that include simply lending and borrowing. However, its importance has risen
with developing and slight stationary economic conditions of the world. The
desire to have foresight for the level of future interest rate has become crucial in
the sense that to know the lending and borrowing rate and not to missprice the
interest rate instruments. As a result, the modelling of interest rate has risen as
a problem. As solution to this problem there have been many models proposed.
Their common feature is that they all model a stochastic problem, i.e. they deal
with uncertainty. The first model in 1973 was proposed by Merton. However, the
pioneering one was suggested by Vasicek in 1977 and in the following years many
other models that are much more analytically untractable has come out. These
stochastic models are mainly classified with respect to the number of factors
which are assumed to have a stochastic evolution in the model.
In this study we will use Vasicek short-rate model among some of the most
fundamental one factor interest-rate models to predict the yield curve of tomorrow
by using today ’s observed yield data. The models taken into account are presented
in Table 1.1. In the second chapter of this study we will present these one factor
short rate models with their solutions. In the following chapter, we will discuss
two different yield curve models: Nelson-Siegel and Vasicek models. The explicit
solution of the Vasiek model will be presented in Section 3.2. In the last chapter,
the raw data of this study which is the yearly simple spot rates of the Turkish
zero-coupon bonds with different maturities of each day from July 1, 1999 to
1

Merton(1973) drt = α dt + σ dWt
Vasiek(1977) drt = α(β − rt) dt + σ dWt
Dothan(1978) drt = σ rt dW 0t
Brennan-Schwartz(1980) drt = (β + α rt) dt + σ rt dWt
Cox-Ingersoll-Ross(CIR)(1985) drt = α(β − rt)dt + σ√
rtdWt
Ho-Lee (1986) drt = θt dt + σ dWt
Exponential Vasicek(EV) drt = rt[ηt − a log rt] dt + σ rt dWt
Black-Derman-Toy(1990) d(log rt) = [θt +σ′
t
σtlog rt]dt + σtdWt
Hull-White- Extended Vasicek(1990) drt = (βt − αt rt) dt + σt dWt
Hull-White Extended CIR(1990) drt = [βt − αtrt]dt + σt√
rtdWt
Black-Karazinsky(1991) d(log rt) = φt[log µt − log rt]dt + σtdWt
Geometric Brownian Motion(GBM) drt = β rt dt + σ rt dWt
Marsh-Rosenfeld (1983) drt = [β r−(1−γ)t + α rt] dt + σ r
γ/2t dWt
Table 1.1: One Factor Short-Rate Models
March 17, 2004 will be analyzed. Then we will fit a Nelson-Siegel curve to each
of the day in the data set we choose. At the end of the last chapter we will predict
the yield curve of March 17, 2004 by using Vasicek yield curve model in Monte
Carlo method. Before working on these models it is necessary to introduce main
mathematical notions used in these parts of this study.
We will begin with the following assumption.
Assumption 1.1. All the random variables and the stochastic processes are de-
fined on a given complete probability space (Ω,A,P).
Definition 1.1. A filtration IF = (Ft)0≤ t≤T is an increasing sequence of sub-
sigma algebras of A such that Fs ⊆ Ft, for s<t.
IF is used to model a flow of information. As time passes, an observer knows
more and more detailed information. In mathematical sense, as t increases Ft as
partition of Ω becomes finer.
Definition 1.2. A Brownian motion (Wt)t≥ 0 is a real-valued, continuous stochas-
tic process with the following defining properties:
(1) Independent increments: ∀ s ≤ t, Wt − Ws is independent of the sub-σ
algebra generated by Ws, s ≤ t, that is denoted by Fs = σ (Wu, u ≤ s) .
2

(2) Stationary increments: ∀ s ≤ t, Wt −Ws and Wt−s −W0 have the same
probability law.
(3) Continuity of paths: Wt(ω) is a continuous function of t.[1]
Remark 1.3. Since the mathematical foundation of Brownian motion as a stochas-
tic process was discussed by N.Wiener in 1931, this process is also called Wiener
process.
Theorem 1.4. If (Wt)t≥ 0 is a Brownian motion, then Wt − W0 is a normal
random variable with mean c t and variance σ2 t, where c and σ are constant real
numbers [1].
Remark 1.5. A Wiener process is standard if
• W0 = 0,
• E(Wt) = 0,
• E[W 2t ] = t.
From now on,we will surly consider standard Brownian motion without especially
mentioning the word ”standard”.
Definition 1.6. The collection IF=Ft, t ∈ [0, T ] with Ft=σWs, s ≤ t, N,where N is the set of all P-negligible sets of ω is called the natural filtration of
W or the filtration generated by W .
Definition 1.7. A real-valued continuous stochastic process is an (Ft)-Brownian
motion if it satisfies :
• ∀ t ≥ 0, Wt is Ft-measurable.
• ∀ s ≤ t, Wt − Ws is independent of the σ-algebra Fs.
• ∀ s ≤ t, Wt − Ws and Wt−s − W0 have the probability law.
Remark 1.8. It is obvious that an Ft - Brownian motion is a Brownian motion
with respect to its natural filtration.
3

The following notion is crucial for the characterization of arbitrage-free mar-
ket, option pricing and hedging.
Definition 1.9. A stochastic process (Mt)t≥ 0 adapted to (Ft)t≥ 0 is martingale if
for any t it is integrable, i.e. E (|Mt|) < +∞ and for any s ≤ t E (Mt|Fs) = Ms
a.s.
Remark 1.10. Definition 1.9 implies E(Mt) = E(M0) for any t.
Definition 1.11. A zero coupon bond(T -bond) with maturity date T is a con-
tract which guarantees the holder 1 unit of money to be paid on the date T . The
price at time t of a bond with maturity T is denoted by P (t, T ).
Assumption 1.2. We assume the following.
• There exists a (frictionless) market for T -bonds for every T > 0.
• The relation P (t, t) = 1 holds for all t.
• For each fixed t, the bond price P (t, T ) is differentiable with respect to
maturity time T .
• For a fixed value of t, P (t, T ) is a smooth function of T .
• For a fixed maturity T , P (t, T ) is a stochastic process. This process gives
the prices, at different times, of the bond for a fixed maturity T .
Note that written payment value, equal to 1 unit, on the contract is known
as the principal value or face value.
Suppose we are standing at time t, and let us fix two other points, S and T ,
with t < S < T . Now, let us write a contract at time t which will allow us to have
a deterministic rate of return on the interval [S, T ] determined at the contract
time t. This is achieved as follows [2].
1. At time t we sell one S-bond. This will give us P (t, S) unit of money.
2. We buy with this income P (t,S)P (t,T )
T -bonds resulting a net investment zero at
time t.
4

3. At time S the S-bond matures, therefore we pay out one unit of money.
4. At time T the T -bonds mature at one unit of money a piece, thus we receiveP (t,S)P (t,T )
units of money.
The above transactions can be summarized as follows: We contracted at time
t, to make an investment of one unit of money at time S, that is guaranteing a
yield of P (t,S)P (t,T )
at time T . Therefore, we contracted a riskless rate at time t,which
is valid on the future period [S, T ]. This rate is called as a forward rate.
Definition 1.12. The following definitions are the implications of above con-
struction.
1. The simple forward rate for [S, T ] contracted at t is defined as
L(t; S, T ) = −P (t, T ) − P (t, S)
(T − S)P (t, T ).
2. The simple spot rate for [S, T ], is defined as
L(S, T ) = − P (S, T ) − 1
(T − S)P (S, T ).
3. The continuously compounded forward rate for [S, T ] contracted at t is
defined as
R(t; S, T ) = − log P (t, T ) log P (t, S)
T − S.
4. The continuously compounded spot rate, R(S, T ), for the period [S, T ] is
defined as
R(S, T ) = − log P (S, T )
T − S.
5. The instantaneous forward rate with maturity T , contracted at t, is defined
as
f(t, T ) = −∂ log P (t, T )
∂T.
6. The instantaneous short rate at time t is defined by
r(t) = f(t, t).
5

Remark 1.13. The spot rates are forward rates where the time of contracting
coincides with the start of the interval over which the interest rate is effective,i.e.
t = S.
The first hypothesis of this study is that all the work being done is in a filtered
probability space (Ω, A, P, (Ft)0≤ t≤T ), where (Ft)0≤ t≤T is the natural filtration
of a standard Brownian motion (Wt)0≤ t≤T and that FT = A.
Definition 1.14. e∫ t
0 rs ds is called as discount factor, where rt is an adapted
process of short rate satisfying∫ T
0|rt| dt < ∞, almost surely. rt, itself as being
short rate, provides a return equal to rtdt on the period (t, t + dt].
In order to guarantee that the bond market is arbitrage-free the following
fundamental hypothesis is made:
There is a probability P* equivalent to P, under which, for all real valued u ∈[0, T ], the process
(
P (t, u))
0≤t≤uwhich is defined by
P (t, u) = e−∫ t
0 rs ds P (t, u)
is a martingale.
Definition 1.15. P* called as risk neutral probability is defined by
dP* = LT dP,
with density LT = exp(∫ T
0qs dWs − 1
2
∫ t
0q2s ds) a.s., where qs is an adapted pro-
cess such that∫ T
0q2s ds < ∞ a.s..[1]
The martingale property under P* allows to obtain,
P (t, u) = E∗(
P (u, u)|Ft
)
= E∗(
e−∫ u
0 rs ds|Ft
)
and when the discounting is eliminated, the following basic equation is obtained,
P (t, u) = E∗(
e−∫ u
trs ds|Ft
)
, where E∗ denotes expectation under P*.
6

Chapter 2
One Factor Interest Rate
Models
In this chapter we will present some of the most famous one factor short-
rate models. The stochastic evolution of short-rate models is identified with the
following general stochastic differential equation;
drt = αt(βt − rt)dt + σt rγt dWt, (2.0.1)
where αt, βt, σt, are the deterministic functions of time, and W is a Brownian
motion.
2.1 Merton Model(1973)
In his work, Merton offered the following stochastic evolution
drt = α dt + σ dWt ,
where α and σ are positive constants. A simple solution is obtained for r.
7

rt = r0 +
∫ t
0
α ds +
∫ t
0
σ dWs
= r0 + αt + σWt
=⇒ rt = ru + α(t − u) + σ(Wt − Wu)
In this model r follows a Gaussian distribution which implies that there is a
positive probability that short rate r can take a negative value.
2.2 Vasicek Model(1977)
One of the earliest stochastic models of the term structure was developed by
Vasicek in 1977. His model is based on the evolution of an unspecified short-term
interest rate. He supposes that r satisfies the following stochastic differential
equation
drt = α(β − rt) dt + σ dWt (2.2.2)
where β, α and σ are non-negative constants and rt is the current level of interest
rate [1]. The parameter β is the long run normal interest rate. The model exhibits
mean reversion, which means that if the interest rate is above the long run mean
(r > β), then the drift becomes negative so that the rate will be pushed to be
closer to the level β on average. Likewise, if the rate is less than the long run
mean, (r < β), then the drift remain positive so that the rate will be pushed to
the level β. The coefficient α > 0 determines the speed of pushing the interest
rate towards its long run normal level. Such mean reversion assumption agrees
with the economic phenomenon that interest rates appear over time to be pulled
back to some long run average value.That is, when the interest rates increase, the
economy slows down, and there is less demand for loans and a natural tendency
for rates to fall([19], [14]). The opposite case can be argued in a similar way.
To obtain an explicit formulae for rt let us define a new process Xt where
Xt = rt − β. Therefore, Xt is the solution of the following stochastic differential
equation
dXt = −α Xt dt + σ dWt (2.2.3)
8

which implies that Xt is an Ornstein-Uhlenbeck process. To solve this process let
Yt = Xt eα t. By integration-by-parts formulae
Yt = x0 +
∫ t
0
Xs d(eα s) +
∫ t
0
eα s dXs+ < X, eα. >t
By differentiating both sides,
dYt = Xtα eα t dt + eα t dXt + d < X, eα. >t︸ ︷︷ ︸
0︸︷︷︸
Since eα t is a deterministic function.
= aXt eα tdt + eα t[−α Xt dt + σ dWt]
= σ eα t dWt
By integrating and doing back substitution we get
Yt = x0 +
∫ t
0
σ eα s dWs
Xt = x0e−α t + σ e−α t
∫ t
0
eα sdWs
rt − β = (r0 − β)e−α t + σ e−α t
∫ t
0
eα s dWs
Therefore,
rt = r0e−α t + β(1 − e−α t) + σ e−α t
∫ t
0
eα sdWs
For u ≤ t,
rt = r0e−α t + βα
∫ t
0
e−α(t−s)ds + σ
∫ t
0
e−α(t−s)dWs
= r0e−α t + βα
∫ t
u
e−α(t−s)ds + βα
∫ u
0
e−α(t−s)ds
+σ
∫ t
u
e−α(t−s)dWs + σ
∫ u
0
e−a(t−s)dWs (2.2.4)
9

Also,
ru = r0e−α u + βα
∫ u
0
e−α(u−s)ds + σ
∫ u
0
e−α(u−s)dWs
That is,
βα
∫ u
0
e−α(t−s)ds + σ
∫ u
0
e−α(t−s)dWs = eα(u−t)(ru − r0e−α u) (2.2.5)
By using equation (2.2.6) we get the t-u expression of rt from the equation (2.2.4).
rt = ru e−α(t−u) + αβ
∫ t
u
e−α(t−s)ds + σ
∫ t
u
e−α(t−s)dWs (2.2.6)
Vasicek model besides its advantages such as being analytically tractable, it has
several shortcomings. Since the short rate is normally distributed, for every t
there is a positive probability that r is negative and this is unreasonable from an
economic point of view. Because the nominal interest rate can not fall below zero
as long as people can hold cash; it can become stuck at zero for long periods,
however as when prices fall persistently and substantially.
Another drawback of the Vasicek model is that it assumes γ = 0. This
assumption implies the conditional volatility of changes in the interest rate to be
constant, independent on the level of r.
2.3 Dothan Model (1978)
In 1978, in the original paper of Dothan a driftless geometric Brownian motion
is proposed as short rate process under the objective probability measure P:
drt = σ rt dWt , r(0) = r0 , (2.3.7)
where r0 and σ are positive constants [9]. Then the following solutions are ob-
tained for r.
rt = r0 +
∫ t
0
σ rs dWs.
10

Let f(x) = log x. Then f ′(x) = 1x
and f′ ′
(x) = − 1x2 . By Ito Lemma,
logrt = logr0 +
∫ t
0
1
rs
rs σ dWs −1
2
∫ t
0
1
r2s
r2s σ2 ds
= logr0 +
∫ t
0
σ dWs −1
2
∫ t
0
σ2 ds
= logr0 + σ Wt −1
2σ2 t
⇒ rt = r0 exp− 1
2σ2 t + σWt
For u ≤ t,
logru = logr0 +
∫ u
0
σ dWs −1
2
∫ u
0
σ2 ds
logrt = log r0 +
∫ t
u
σ dWs +
∫ t
0
σ dWs −1
2
∫ t
u
σ2 ds − 1
2
∫ u
0
σ2 ds
= logru +
∫ t
u
σ dWs −1
2
∫ t
u
σ2 ds
= logru + σ(Wt − Wu) −1
2σ2(t − u)
⇒ rt = ru exp− 1
2σ2 (t − u) + σ(Wt − Wu)
2.4 Brennan-Schwartz Model (1980)
In their work they offered a model to analyze the convertible bonds [5]. They
proposed following stochastic differential equation,
drt = (β + α rt) dt + σ rt dWt (2.4.8)
where α,β and σ are positive constants. Equation 2.4.8 is a linear nonhomoge-
neous stochastic differential equation in the form of
11

drt = [βt + αt rt] dt + [γt + δt rt] dWt
where βt = β, αt = α, δt = 0, σt = σ. To solve this SDE first consider the
homogenous case in which β = 0.
Let,
drt = α rt dt + σ rt dWt
⇒ rt = r0 +
∫ t
0
α rs ds +
∫ t
0
σ rs dWs
Let f(x) = log x. Applying Ito formula
log rt = log r0 +
∫ t
0
α ds +
∫ t
0
σ dWs −1
2
∫ t
0
σ2 ds
= log r0 + α t + σ Wt −1
2σ2 t
Then the homogeneous solution of SDE (2.4.8) is
rt = r0 e(α− 12σ2) t+σ Wt
︸ ︷︷ ︸
φt
.
Now, let ηt = 1φt
and define ζt = ηt rt. Let f(x) = ex and define
Xt = −(α − 1
2σ2) t − σ Wt
⇒ dXt = −(α − 12σ2) dt − σ dWt
By Ito Lemma,
12

dηt = ηt dXt +1
2ηtσ
2t dt
= ηt[−(α − 1
2σ2) dt − σ dWt] +
1
2ηtσ
2 dt
= ηt[(−α + σ2) ds] − σηt dWt (2.4.9)
By integration-by-parts,
dζt = ηt drt + rt dηt + d < η, r >t
= ηt[(β + α rt) dt + σ rt dWt] + rt[ηt(−α + σ2) dt − σηt dWt]
−[σ2 rt ηt dt]
= ηt β dt (2.4.10)
By integrating both sides of equation 2.4.10
ζt = ζ0 + β
∫ t
0
ηs ds,
where ζ0 = r0.Therefore, rt is
rt = φt r0 + φtβ
∫ t
0
ηs ds
= e(α− 12σ2) t+σ Wtr0 + e(α− 1
2σ2) t+σ Wtβ
∫ t
0
ηs ds
= e(α− 12σ2) t+σ Wtr0 +
∫ t
0
e(α− 12σ2) (t−s)+σ (Wt−Ws)β ds (2.4.11)
For u ≤ t,
rt = e(α− 12σ2) (t−u)+σ (Wt−Wu)ru +
∫ t
u
e(α− 12σ2) (t−s)+σ (Wt−Ws)β ds
13

2.5 Cox-Ingersoll-Ross (CIR) Model(1985)
An intriguing case of a non-linear stochastic differential equation can be de-
fined as
dXt = (θtXt + γt)dt + υt
√
XtdWt , X0 = x0. (2.5.12)
A process following such dynamics is traditionally referred to as square-root pro-
cess. In a common sense, square-root processes are naturally linked to non-central
χ-square distributions.One of the major examples of models based on this dynam-
ics are the Cox, Ingersoll and Ross instantaneous short rate model in which short
rate process r satisfies a simplified version of equation (2.5.12) producing strictly
positive instantaneous short rate process.
The model formulation is
drt = α(β − rt)dt + σ√
rtdWt , r(0) = r0 (2.5.13)
where α, β, σ and r0 are positive constants. The condition 2αβ ≥ σ2 provides the
positivity of r. It can be shown that equation (2.5.13) admits a unique solution
that is positive, but we do not have an explicit form for it [22].
2.6 Ho-Lee Model(1986)
Ho and Lee pioneered a new approach by showing how an interest rate model
can be designed so that it is automatically consistent with any specified initial
term structure [2].
drt = θt dt + σ dWt (2.6.14)
rt = r0 +
∫ t
0
θs ds +
∫ t
0
σ dWs
= r0 +
∫ t
0
θs ds + σ Wt (2.6.15)
rt = ru +
∫ t
u
θs ds + σ[Wt − Wu] (2.6.16)
14

2.7 Exponential Vasicek Model(EV)
EV is a lognormal model in which interest rate r satisfies the following stochas-
tic differential equation
drt = rt[ηt − a log rt] dt + σrt dWt.
A natural way of obtaining a lognormal model is to assume that the logarithm
of r follows an Ornstein-Uhlenbeck process y under the the risk neutral measure
P*. Here, y is defined by the following stochastic differential equation
dyt = [Θ − ayt] dt + σ dWt (2.7.17)
where Θ, a and σ are positive constants and y0 is a real number [18]. Therefore,
to solve the 2.7.17 , it is convenient to obtain an Ornstein-Uhlenbeck process at
first hand. So, applying the Ito Lemma for f(x) = log x and putting yt = log rt,
we get
log rt = log r0 +
∫ t
0
1
rs
rs[η − a log rs] ds + σ dWs
+1
2
∫ t
0
(−1
rs
)σ2r2s ds
= log r0 +
∫ t
0
[(η − 1
2σ2) − a log rs] ds +
∫ t
0
σ dWs
that is
yt = y0 +
∫ t
0
[(η − 1
2σ2) − ays] ds +
∫ t
0
σ dWs
we get,
dyt = [(η − 1
2σ2) − ayt] dt + σ dWt (2.7.18)
We can express equation 2.7.18 as
dyt = [Θ − ayt] dt + σ dWt, (2.7.19)
15

where Θ = η − 12σ2. If we put β = Θ
a, a = α and Xt = yt − β we get
dXt = −α Xt dt + σ dWt.
The solution of this SDE is
Xt = x0e−α t + σ e−α t
∫ t
0
eα sdWs.
That is,
yt − β = (y0 − β)e−α t + σ e−α t
∫ t
0
eα s dWs
yt = y0e−α t + (1 − e−α t)β + σ e−α t
∫ t
0
eα s dWs
By replacing yt with log rt we get
rt = explog r0e−a t +
Θ
a(1 − e−a t) + σ e−a t
∫ t
0
ea s dWs
For u ≤ t,
yt = y0e−α t + βα
∫ t
0
e−α(t−s)ds + σ
∫ t
0
e−α(t−s)dWs (2.7.20)
yt = yu e−α(t−u) + αβ
∫ t
u
e−α(t−s)ds + σ
∫ t
u
e−α(t−s)dWs (2.7.21)
By replacing yt with log rt we get
rt = explog rue−α(t−u) + αβ
∫ t
u
e−α(t−s)ds + σ
∫ t
u
e−α(t−s)dWs
That is,
rt = explog rue−a(t−u) + Θ
∫ t
u
e−a(t−s)ds + σ
∫ t
u
e−a(t−s)dWs (2.7.22)
16

2.8 Black-Derman-Toy Model (1990)
In their article, Black, Derman and Toy proposed a discrete time approach of
interest rate modelling [3]. The continuous time equivalent of their model was
expressed as a stochastic differential equation which can be shown to be [10]
d(log rt) = [θt +σ
′
t
σt
log rt]dt + σtdWt. (2.8.23)
In this model log rt is mean reverting. The function σt is chosen to make the
model consistent with the term structure of spot rate volatilities and may not
give reasonable values for the future short rate volatility. The model has the
disadvantage that bond prices can not be determined analytically.
d logrt = θt dt + σ dWt (2.8.24)
When we integrate, we get the following result;
logrt = logr0 +
∫ t
0
θs ds +
∫ t
0
σ dWs
= logr0 +
∫ t
0
θs ds + σ Wt
⇒rt = r0 exp
∫ t
0
θs ds + σ Wt
For u ≤ t
rt = ru exp∫ t
u
θs ds + σ(Wt − Wu)
2.9 Hull-White Extended Short Rate Models (1990)
A number of authors have proposed one factor models of the term structure
in which the short rate, r, follows a mean reverting process of the form
drt = α(β − r)dt + σ rγdWt , (2.9.25)
17

where α, β, σ and γ are positive constants and W is the Wiener Process. In these
models, the interest rate r, is pulled toward to a long term interest rate level β
with rate α.
The condition of γ = 0 is considered by Vasicek. As we explained in section
2.2, besides being analytically tractable, this model has a fundamental drawback
that the short term interest rate, r, can become negative. On the other hand, CIR
considered an alternative where γ = 1/2 which results nonnegative r. However,
CIR case is not analytically tractable.
It is reasonable to anticipate that in some situations the market’s expectations
about future interest rates involve time dependent parameters. In other words,
the drift and diffusion terms can be defined as the functions of time as well as
being functions of r. The time dependence can arise from the cyclical nature
of the economy, expectations concerning the future impact of monetary policies,
and expected trends in other macroeconomic variables. In their article Hull and
White extend the model in (2.9.25) to reflect this time dependence. They add a
time dependent drift, θt to the process for r, and allow both the reversion rate,
α, and the volatility factor, σ, to be functions of time. This leads to the following
model for r:
dr = [θt + αt(β − rt)]dt + σtrγt dWt (2.9.26)
This can be regarded as a model in which a drift rate, θt, is imposed on a variable
that would otherwise tend to revert to a constant level β. Since (2.9.26) can be
expressed as
dr = αt[θt
αt
+ β − rt]dt + σtrγt dWt (2.9.27)
it can also be regarded as a model in which the reversion level is a function, θt
αt+β
of time.
2.9.1 Hull-White- Extended Vasicek Model
For γ = 0 and βt = θt + βαt from (2.9.26) Hull-White proposed the following
model,
drt = (βt − αt rt) dt + σt dWt ,
18

where βt, αt and σt are time dependent deterministic functions [11]. For the
solution of this stochastic differential equation we define Kt =∫ t
0αu du. That is,
K ′t = αt. Then, we multiply both sides of the equation with eKt and take the Ito
differential of both sides with respect to t.
That is,
d(eKtrt) = eKtK ′trt dt + eKt drt
= eKtαtrt dt + eKt [(βt − αtrt) dt + σt dWt]
= eKt(βt dt + σt dWt) (2.9.28)
when we integrate both sides of equation 2.9.28 we get
eKtrt = r0 +
∫ t
0
eKsβs ds +
∫ t
0
eKsσs dWs, (2.9.29)
that is,
rt = e−Ktr0 +
∫ t
0
e−(Kt−Ks)βs ds +
∫ t
0
e−(Kt−Ks)σs dWs
To generalize this result for any u ≤ t we can make the following computations:
ru = e−Kur0 +
∫ u
0
e−(Ku−Ks)βs ds +
∫ u
0
e−(Ku−Ks)σs dWs
rt = e−Ktr0 +
∫ t
0
e−(Kt−Ks)βs ds +
∫ u
0
e−(Kt−Ks)βs ds
+
∫ t
u
e−(Ku−Ks)σs dWs +
∫ u
0
e−(Kt−Ks)σs dWs
rt = e−Ktr0 +
∫ t
u
e−Kt+Ksβs ds +
∫ t
u
e−Kt+Ksσs dWs + e−Kt+Ku(ru − e−Kur0)
= e−(Kt−Ku)ru +
∫ t
u
e−(Kt−Ks)βs ds +
∫ t
u
e−(Kt−Ks)σs dWs (2.9.30)
19

2.9.2 Hull-White Extended CIR Model
For γ = 0.5 and βt = θt + βαt from (2.9.26), Hull and White in the same
article proposed [11]the extension of the CIR model based on the same idea of
considering time dependent coefficients of their Vasicek extension. The short rate
dynamics are then given by the following stochastic differential equation
drt = [βt − αtrt]dt + σt
√rtdWt , (2.9.31)
where α, β, and σ are deterministic functions of time. Such an extension is not
analytically tractable. However, a simple version of (2.9.31) that turns out to
be analytically tractable has been proposed by Jamshidian in 1995. He assumed
that, for each t, the ratio βt/σ2t is equal to a positive constant δ, which must be
greater than 1/2 to ensure that the origin is inaccessible.
2.10 Black-Karazinsky Model (1991)
In their original work, Black and Karazinsky proposed a mean reverting log-
normal short rate model,
d(log rt) = φt[log µt − log rt]dt + σtdWt , (2.10.32)
where µt is the target rate, φt is the mean reversion and σt is the local volatility
in the expression for the local change in log rt [4]. They assumed these time
dependent deterministic functions to be inputs while they looked for the yield
curve, as the output of their model. While we are solving equation (2.10.32), for
the computational and traditional purposes, we will assume that αt = φt and
βt = φt log µt.
dlogrt = (βt − αt logrt) dt + σt dWt (2.10.33)
Let Yt = logrt and define a new deterministic function Kt as
Kt =
∫ t
0
αs ds
20

and,
K ′t = αt.
Let ζt = eKtYt.
d(ζt) = eKtK ′tYt dt + eKt dYt
= eKtαtYt dt + eKt((βt − αtYt) dt + σt dWt)
= eKt(βt + σt dWt) (2.10.34)
Integrate both sides of (2.10.34)
eKtYt = Y0 +
∫ t
0
eKsβs ds +
∫ t
0
eKsσt dWs
⇒ Yt = e−KtY0 +
∫ t
0
e−(Kt−Ks)βs ds +
∫ t
0
e−(Kt−Ks)σt dWs
For u ≤ t,
Yt = e−(Kt−Ku)Yu +
∫ t
u
e−(Kt−Ks)βs ds +
∫ t
u
e−(Kt−Ks)σt dWs
If we replace logrt with Yt in the last equation
logrt = e−(Kt−Ku) logru +
∫ t
u
e−(Kt−Ks)βs ds +
∫ t
u
e−(Kt−Ks)σt dWs (2.10.35)
2.11 Geometric Brownian Motion (GBM) Model
When the noise of the interest rate process rt is introduced we enlarge the
number of multiplicative terms in the random increment dWt. That is, we scale
dWt with σ rt, so that return of interest rate has a constant standard deviation
[20]. This process is called as geometric Brownian motion and it is given with
the following stochastic differential equation.
drt = β rt dt + σ rt dWt (2.11.36)
21

rt = r0 +
∫ t
0
β rs ds +
∫ t
0
σ rs dWs (2.11.37)
The explicit solution satisfying above SDE can easily be derived by applying Ito
Lemma. Let f(x) = logx.
logrt = logr0 +
∫ t
0
1
rs
drs −1
2
∫ t
0
1
r2s
d < r, r >s
= logr0 +
∫ t
0
1
rs
β rs ds +
∫ t
0
1
rs
σ rs dWs −1
2
∫ t
0
1
r2s
r2s σ2 ds
= logr0 +
∫ t
0
β ds +
∫ t
0
σ dWs −1
2
∫ t
0
σ2 ds
= logr0 + (β− 1
2σ2)t + σWt
⇒ rt = r0e(β− 1
2σ2)t+σWt
For u ≤ t,
logrt = logru + (β − 1
2σ2)(t − u) + σ(Wt − Wu)
⇒ rt = rue(β− 1
2σ2)(t−u)+σ(Wt−Wu) (2.11.38)
2.12 Marsh-Rosenfeld Model(1983)
In 1975 constant elasticity of variance (CEV)process was studied in the stock
price context by Cox and in 1976 by Black, which can be expressed in the short
rate context as
drt = α rtdt + σ rγt dWt ,
where γ ≥ 0. The constant elasticity of variance process includes, in turn, the
square root and normal processes, and as a limiting case, the lognormal process.
In their article Marsh and Rosenfeld used a generalized case of the CEV
22

diffusion process as
drt = [β r−(1−γ)t + α rt] dt + σ r
γ/2t dWt , (2.12.39)
where γ ≥ 0. If γ = 1, (2.12.39) turns into square root process with mean
reverting drift [13]. If γ = 0, it becomes,
drt = [β
rt
+ α rt] dt + σ dWt .
Equation (2.12.39) is reducible to affine form as
dyt = [c + byt] dt +√
a′yt dWt ,
wherey = r2−γ
a′
= 0.5σ(2 − γ)2
c = (2 − γ)(β + 0.5σ(1 − γ))
b = α(2 − γ) .
Marsh and Rosenfeld estimate the model on a time series of T-bill data using
maximum likelihood. They are unable to reach strong conclusions, but notice
that the likelihood is higher when γ = 2 than when γ takes lower values [20].
23

Chapter 3
Yield Curve Modelling
There are many methods which have been used to model the zero-coupon
yield curve. We can put them into three categories; spline based models, function
based models, and lastly stochastic models. The idea of spline based models is
interpolating a spline function from the pre-known points. These points can
be given as a pair (time to maturity, yield of zero-coupon bond at that time to
maturity). The most famous models of this type are McCulloch and FNZ(Fischer,
Nychka and Zervos) [16].
The most popular function based models are Nelson-Siegel [23], and Svens-
son models [15]. In fact, Svensson model is an extension of Nelson-Siegel model.
In Nelson-Siegel model a relatively simple function is postulated for the instan-
taneous forward curve. Svensson extended this work by altering the functional
form of the instantaneous forward curve suggested by Nelson-Siegel. In this study,
however, we will be concentrated in Nelson-Siegel model, which is less complex
in the sense of number of parameters.
The stochastic modelling of zero-coupon yield curve depends on interest rate
modelling, especially on short-rate modelling. The idea is obtaining an explicit
pricing formula for the zero-coupon bond and then extracting the yield from that
formula by using the following fundamental equation:
P (t, T ) = e−(T−t)R(t,T ) ,
where R(t, T ) is the yield of zero-coupon bond on the given period [t, T ]. In
the following sections of the chapter we will obtain the explicit zero-coupon bond
24

pricing and yield curve formulas for Vasicek short-rate model.
3.1 Nelson-Siegel Yield Curve Model
Nelson and Siegel proposed the instantaneous forward rate as a solution of a
second order differential equations [15]. Thus, they give the following solution for
the instantaneous forward rate:
f(θ) = β0 + β1 e−θτ + β2
[θ
τe−
θτ
]
, (3.1.1)
where θ = T − t. Since yield on the period [t, T ] is the average of sum of the rates
which are active on the period [t, t + dt], by this simple intuition, yield R(θ) can
be defined as the integral of 3.1.1. That is,
R(t, T ) =1
T − t
∫ T
t
f(s, T )ds (3.1.2)
=1
T − t
∫ T
t
(
β0 + β1 e−(T−s)
τ + β2
[(T − s)
τe−
(T−s)τ
])
ds
= β0 + (β1 + β2)[1 − e−
T−tτ ]
T−tτ
− β2 e−T−t
τ
= β0 + (β1 + β2)[1 − e−
θτ ]
θτ
− β2 e−θτ
=1
θ
∫ θ
0
(
β0 + β1 e−sτ + β2
[s
τe−
sτ
])
ds
=1
θ
∫ θ
0
f(s)ds
= R(θ) (3.1.3)
Although it is easy to see the last equality, we showed it to be consistent for the
future notations of yield.
Now let us analyze the structure of the yield and forward curves. The limiting
25

value of R(θ) as θ approaches to infinity is β0 and as θ gets small values it is
(β0 + β1), which are necessarily the same as for the forward rate function since
R(θ) is just an averaging of f(θ). Now, let us separate the forward rate function
into three components: long-term, medium-term and lastly short-term. The
long-term component is identified by the asymptotic value, β0, of the function.
The medium-term is identified by the functional component θτe−
θτ and for the
designation of the short-term e−θτ is used.
The long term component is a constant larger than zero. Thus, it can not take
zero value in the limit. The medium-term takes zero value at the starting point
zero. This indicates that it is not short-term and since it decays to zero in the
limit, therefore it is not long-term. As it is obvious that short-term curve has the
largest negative slope resulting the fastest decay among all.It takes monotonically
and asymptotically zero value.
In the model the contributions of these three components are given by β0 for
long-term, β1 for short-term and β2 for medium-term. Here, there are also some
other features of the parameters that we should consider. If β1 is negative the
forward curve will have a positive slope and vice versa. Also, if β2, as being the
identifier of the magnitude and the direction of the hump, is positive, a hump
will occur at τ whereas, if it is negative, a U-shaped value will occur at τ . Thus,
we can conclude that parameter τ which is positive, specifies the position of
the hump or U-shape on the entire curve. As a result, Nelson and Siegel have
proposed that with appropriate choices of weights for these three components, it
is possible to generate a variety of yield curves based on forward rate curves with
monotonic and humped shapes [23].
3.2 Vasicek Yield Curve
In Vasicek model we assume that the process rt satisfies the following stochas-
tic differential equation:
drt = α(β − rt) dt + σ dWt (3.2.4)
26

Without repeating the solution for 3.2.4 that we followed in section 2.2 we will just
change the probability measure to risk neutral one because of quite crucial reason.
Unless we study with the risk neutral probability, it is not possible to make ex-
tinct the arbitrage possibilities in bond pricing and we know that the discounted
bond prices have martingale property only under the risk neutral probability,
which satisfies the non-arbitrage condition. With this aim, to change the mea-
sure we will use Girsanov Theorem. We assume a constant process q(t) = −λ,
with λ ∈ IR. Therefore, Wt = Wt +∫ t
0λ ds = Wt + λ t is a standard Brownian
motion under P*. Thus, dWt = dWt − λ dt and if we rewrite the equation 3.2.4
with respect to the new probability measure P ∗ we get the following result:
dr(t) = α (β − r(t)) dt + σ[
dWt − λ dt]
= (α β − α r(t) − λσ) dt + σ dWt
= α
(
β − λσ
α− r(t)
)
dt + σ dWt
= α (β∗ − r(t)) dt + σ dWt, (3.2.5)
where β∗ = β − λ σα
.
The main goal of this section is to obtain the Vasicek bond price formulae, there-
fore the yield curve. We will start with the fundamental equation of bond price,
27

with the short rate r given by Equation 3.2.5.
P (t, T ) = E∗(
e−∫ T
trs ds|Ft
)
= E∗(
e−∫ T
t(rs−β∗+β∗) ds|Ft
)
= e−∫ T
tβ∗ds E∗
(
e−∫ T
t(rs−β∗) ds|Ft
)
= e−β∗(T−t) E∗(
e−∫ T
tX
∗
s ds|Ft
)
(3.2.6)
where X ∗t = rt−β∗, and Ft is the natural filtration of Wt. Since (X ∗
t ) is a solution
of the diffusion equation with constant coefficients
dXt = −αXt + σ dWt , (3.2.7)
by using the homogeneity of 3.2.7 and the Markov property of the solution Xxt =
x e−α t + σ e−α t∫ t
0eα sdWs we can write
E∗(
e−∫ T
tX
∗
s ds|Ft
)
= F (T − t,X ∗t )
= F (T − t, rt − β∗) (3.2.8)
where F is the function defined by F (θ, x) = E∗(
e−∫ θ
0 Xxs ds
)
. Since (Xxt ) is
Gaussian with continuous paths, we can calculate F (θ, x), explicitly [1].
For the complete calculation of F (θ, x), consider the random variable Y =∫ θ
0Xx
s ds ∼ N(µ, σ2) with the mean µ, and the variance σ2. The Laplace trans-
form [17] of Y can be defined therefore,
LY (t) := E(e−tY
)=
∫
R
e−tY dFY (y)
The last integral turns into:
28

∫
R
e−tY dFY (y) =1√
2πσ2
∫
R
e−ty e−(y−µ)2
2σ2 dy
=1√
2πσ2
∫
R
e−2tyσ2
−y2+2µy−µ2
2σ2 dy
=1√
2πσ2
∫
R
e−[y2
−(2µ−2σ2t)y+µ2]2σ2 dy
=1√
2πσ2
∫
R
e−[y2
−(2µ−2σ2t)y+(µ−σ2t)2−(µ−σ2t)2+µ2]2σ2 dy
=1√
2πσ2
∫
R
e−(y−(µ−σ2t))2
2σ2+µ2
−2µσ2t + σ4t2−µ2
2σ2 dy
= e−µt+ σ2
2t2
∫
R
1√2πσ2
e−(y−(µ−σ2t))2
2σ2 dy
= e−µt+ σ2
2t2 . (3.2.9)
where 1√2πσ2
e−(y−(µ−σ2t))2
2σ2 is the density function of the random variable ∼ N(µ−σ2t, σ2). We need the case of t = 1.
Thus,
E∗(
e−∫ θ
0 Xxs ds
)
= E∗ (e−Y
)= e−µ+ σ2
2 = e−E∗(Y )+ 12V ar(Y )
= e−E∗(∫ θ
0 Xxs ds)+ 1
2V ar(
∫ θ
0 Xxs ds) (3.2.10)
29

We have
E∗(∫ θ
0
Xxs ds
)
=
∫ θ
0
E∗(Xxs ) ds
=
∫ θ
0
x e−αs ds
=x
α(1 − e−α θ) (3.2.11)
Therefore, when we take the expectation of Xxt we get zero for the stochastic
part,since∫ t
0eα sdWs is a continuous Ft -martingale.
V ar
(∫ θ
0
Xxs ds
)
= Cov
(∫ θ
0
Xxs ds
∫ θ
0
Xxs ds
)
For u = t = s
= E∗(∫ θ
0
Xt dt
∫ θ
0
Xu du
)
− E∗(∫ θ
0
Xt dt
)
E∗(∫ θ
0
Xu du
)
=
∫ θ
0
∫ θ
0
E∗ (Xxt Xx
u) du dt −∫ θ
0
E∗ (Xxt ) dt
∫ θ
0
E∗ (Xxu) du
=
∫ θ
0
∫ θ
0
[E∗ (Xxt Xx
u) − E∗ (Xxt ) E∗ (Xx
u)] du dt
=
∫ θ
0
∫ θ
0
Cov (Xxt Xx
u) du dt (3.2.12)
For the calculation of Cov (Xxt Xx
u) we write [17],
30

Cov (Xxt Xx
u) = E∗ [(Xxt − E (Xx
t )) (Xxu − E (Xx
u))]
= E∗[
σ2 e−α(t+u)
∫ t
0
eα s dWs
∫ u
0
eα s dWs
]
= σ2 e−α(t+u) E∗[∫ t
0
eα s dWs
∫ u
0
eα s dWs
]
= σ2 e−α(t+u)
∫ t∧u
0
e2α s ds
= σ2 e−α(t+u) e2α(t∧u) − 1
2α(3.2.13)
For the complete calculation of V ar(∫ θ
0Xx
s ds)
let us insert the result we found in
3.2.13 in 3.2.12. Let us define g(t, u) = Cov(Xxt , Xx
u). We see that g is symmetric
with respect to line u = t on the region where the integral in 3.2.12 is taken.
Therefore it is enough to evaluate the above integral only for one of the regions
31

to calculate V ar(∫ θ
0Xx
s ds)
. Let us chose the region (t , u) : 0 < u < t.
V ar
(∫ θ
0
Xxs ds
)
=
∫ θ
0
∫ θ
0
Cov (Xxt Xx
u) du dt
= 2
∫ θ
0
∫ t
0
σ2 e−α(t+u) e2α u − 1
2αdu dt
= 2
∫ θ
0
∫ t
0
σ2e−α t eα u − σ2 e−α t e−α u
2αdu dt
= 2
∫ θ
0
[σ2e−α t eα u
2α2+
σ2 e−α t e−α u
2α2
]t
0
dt
= 2
∫ θ
0
(σ2
2α2+
σ2
2α2e−2α t − σ2
2α22e−α t
)
dt
=σ2
α2
∫ θ
0
(1 + e−2α t − 2e−α t
)dt
=σ2
α2
[
t − e−2α t
2α+
2e−α t
α
]θ
0
=σ2
α2
[
θ − e−2α t
2α+
2e−α t
α− 3
2α
]
=θσ2
α2− σ2
2α3
[e−2αθ − 4 e−αθ + 3
]
=θσ2
α2− σ2
2α3
[1 − 2e−αθ + e−2αθ + 2
(1 − e−αθ
)]
=θσ2
α2− σ2
2α3
[(1 − e−αθ
)2+ 2
(1 − e−αθ
)]
=θσ2
α2− σ2
α3
(1 − e−αθ
)− σ2
2α3
(1 − e−αθ
)2(3.2.14)
By replacing 3.2.11 and 3.2.14 into 3.2.10, we get F (θ, x) explicitly. Thus,
32

F (θ, x) = E∗(
e−∫ θ
0 Xxs ds
)
= exα
(1−e−α θ)+ θσ2
α2 − σ2
α3 (1−e−αθ)− σ2
2α3 (1−e−αθ)2
(3.2.15)
Now, we can complete the calculation of bond price.
P (θ) = e−β∗θ exα
(1−e−α θ)+ θσ2
α2 − σ2
α3 (1−e−αθ)− σ2
2α3 (1−e−αθ)2
= e−β∗θ+ xα
(1−e−α θ)+ θσ2
α2 − σ2
α3 (1−e−αθ)− σ2
2α3 (1−e−αθ)2
= e−θ R(θ, r), (3.2.16)
where R(θ, r) can be seen as the average interest rate for the period [t , T ], i.e.
R(θ, r) is the yield of the bond on the given period, and it can be calculated by
inverting the price formula.
33

R(θ , r) = −−β∗θ + xα(1 − e−α θ) + θσ2
α2 − σ2
α3
(1 − e−αθ
)− σ2
2α3
(1 − e−αθ
)2
θ
= −−β∗θ + σ2θ
2α2 +(1 − e−α θ
) [
− xα− σ2
2α3 − σ2
4α3
(1 − e−α θ
)]
θ
= −[
−β∗ +σ2
2α2− 1
αθ
[(1 − e−αθ
)(
x +σ2
2α2+
σ2
4α2
(1 − e−αθ
))]]
= −[
−β∗ +σ2
2α2− 1
αθ
[(1 − e−αθ
)(
(r − β∗) +σ2
2α2+
σ2
4α2
(1 − e−αθ
))]]
= β∗ − σ2
2α2− 1
αθ
[(
β∗ − σ2
2α2− r
)(1 − e−αθ
)− σ2
4α2
(1 − e−αθ
)2]
= R∞ − 1
αθ
[
(R∞ − r)(1 − e−αθ
)− σ2
4α2
(1 − e−αθ
)2]
, (3.2.17)
where
R∞ = limθ→∞
R(θ, r) = β∗ − σ2
2α2.
34

Chapter 4
Applications
In the first section of this chapter, we are going to present and explain the
data,representing the Turkish zero-coupon bond simple spot rate, that we use
in the following sections. In the second section, we will use Nelson-Siegel yield
curve model to fit the given data. To calibrate the Nelson-Siegel model we are
going to construct a sum of squared errors. Then, we are going to minimize this
function with appropriate constraints and an initial value. After the calibration,
the performance of Nelson-Siegel yield curve will be measured by the value of the
sum of squared errors. In the last section, we are going to use the Vasicek yield
curve to predict the March 17, 2004 yield curve by using the March 16, 2004 data.
4.1 Data Analysis
The data that is used in this study is the Turkish zero-coupon bond simple
rate gathered for several maturities and days. Although the data includes yearly
simple rate information of the zero-coupon bond between July 1, 1999 and March
17, 2004, we will use a set of data starts at May 1, 2001 and ends at March 17,
2004. The reason why we use this set is two fold. Firstly, we want to exclude
the days which are effected by the harsh economic crises of the years,2000 and
2001. The most part of the data occurred during years includes daily disordered
bond simple rate of returns. The second reason is that although the data is for
a long period, it has the problem of having a very short number of bond prices
for a given day. This stems from the fact that the bond market in Turkey is not
35

MNO MINO MEAN
July 1, 1999-March 17, 2004 March 17, 2004(21) March 9, 2001(2) 10.9933
July 1, 1999-April 30, 2001 July 9, 1999∗(12) March 9, 2001(2) 7.9542
May 1, 2001-March 17, 2004 March 17, 2004(21) Jul 1, 1999∗(7) 12.8784
Table 4.1: MNO: The maximum number of observations and its day for the givendata set. MINO: The minimum number of observations and its day for the givendata set. ∗: An example from several days.
liquid. The minimum number of observations occurs in March 9, 2001 with 2
observations.The maximum number 21 among all of the daily observations has
occurred in March 17, 2004. The mean of observations for the whole data set is
10.9933. The mean of observations for the data set we have chosen is 12.8784
and the mean of the remaining data from Jul 1, 1999 to April 30, 2001 is 7.9542.
These facts are summarized in the Table 4.1. Since we will fit a yield curve to
the daily observations, we preferred to choose that data set:
· Excluding the day having the minimum number of daily observations.
· Including the day having the maximum number of daily observations.
· Having the highest mean of daily observations.
· Including the most number of days satisfying the above three conditions.
Since the data is a raw data by means of the interest rate information that it
carries out, we worked on it to obtain an appropriate rate for the model based
usage. To express the data for our purpose we used interest rate definitions given
in definition set 1.12. Let us show our calculations, explicitly. First, we used
simple spot rate definition and then the definition of continuously compounded
36

spot rate.
L(S, T ) = − P (S, T ) − 1
(T − S)P (S, T )
⇐⇒
P (S, T ) =1
1 + L(S, T )(T − S)
⇐⇒
R(S, T ) = − log P (S, T )
T − S
Since we are going to fit a yield curve, the data must be in the form of continuously
compounded spot rate. For a numerical example, let us calculate the price of the
zero coupon bond in May 1, 2001 having a yearly simple rate of return 0.7580 with
time to maturity 113 days. Thus, T − S = 113/365 and L(S, T ) = 0.7580. That
is, P (S, T ) = 0.8010 TL. This price coincide with the assumption P (t, t) = 1.
However, the exact price will be 80100 TL. We multiplied the result with 100000
which is the face value of the Turkish zero-coupon bond used in this study. To
evaluate R(S, T ) we use 0.8010. Therefore, R(S, T ) = 0.0018655. This gives a
continuously compounded rate of return of 186.55 TL over 100000 TL.
4.2 Yield Curve Fitting with Nelson-Siegel Model
In section 3.1 we studied the structure of the Nelson-Siegel yield curve model.
In this section we are going to use this model to fit yield curves to the sets of
zero-coupon bond yields for given days.
Let us recall the following yield defining equation 3.1.2:
R(t, T ) =1
T − t
∫ T
t
f(t, s)ds
37

If we replace forward rate(in fact, instantaneous forward rate) with its definition
given in 1.12 we get
R(t, T ) =1
T − t
∫ T
t
(
−∂ log P (t, s)
∂ s
)
ds
= − 1
T − t(log P (t, T ) − log P (t, t))
= − log P (t, T )
T − t(4.2.1)
Fitting implies calibration of the parameters of the given model. We will minimize
the sum of squared errors(SSEs) to calibrate the parameters of the Nelson-Siegel
model for a given day.
The Nelson-Siegel yield function obtained in Section 3.1 is as follows.
R(θ) = β0 + (β1 + β2)[1 − e−
θτ ]
θτ
− β2 e−θτ
with parameters β0, β1, β2, τ . The minimization of objective function SSE is
constructed as follows;
minB
m∑
θ=1
(
R(θ) − R(θ))2
(4.2.2)
where B = [β0, β1, β2, τ ], R(θ) is observed bond yield of time to maturity θ for a
given day and R(θ) is the theoretical bond yield of time to maturity θ for that
day. To do this minimization we use five different sets of constraints and initial
points. Now, let us introduce these sets. We denote by Rlong the yield of the
bond with longest maturity of the given day and by Rshort the yield of the bond
with shortest maturity of the given day.
(a) Binitial = [Rlong, Rshort − Rlong, 1, 50],
β0 > 0,
β0 + β1 = Rshort,
(b) Binitial = [Rlong, Rshort − Rlong, 0.9, 49.9],
β0 > 0,
38

β0 + β1 = Rshort,
(c) Binitial = [Rlong, Rshort − Rlong, 1, 50],
β0 > 0,
β0 + β1 < Rshort,
(d) Binitial = [Rlong, Rshort − Rlong, 0.9, 49.9],
β0 > 0,
β0 + β1 < Rshort,
(e) Binitial = [Rlong, Rshort − Rshort,−1, 50],
β0 > 0,
β0 + β1 < Rshort,
β2 < 0,
25 ≤ τ ≤ 800,
Note that in the initial sets first two initial values are default. However, the other
two initials are perturbed on the axis (0.9, 49.9). First, we perturbed 0.1 points in
all directions and we reached to (1, 50) and then we perturbed the axis with 0.01
points in all directions, but we remained on the same axis [24]. By using above
constraint and initial point sets we calibrated the Nelson-Siegel yield function
for all the days in our data set. That is we did 740x5 calibrations: For each of
the day in our data set we repeated the minimization procedure for each of the
constraint and initial point sets.
As a result, for each constraint-initial point set we estimated different param-
eters for a given day and we have chosen the parameters that minimize SSEs for
that day. In the Figures 4.1, 4.2, 4.3 and 4.4 we presented fits of yield curves for
some days. In most of the figures we resulted with a very fine fit. However, this
does not mean that all the yield curve fits for our data set is fine. For example,
in Figure 4.3 the days April 25 and April 26, 2002 fitted yield curves that are
S-shaped and humped, respectively, are not fine.1 Especially, the fit of April 25
is deficient which is mainly resulted from the difficulty of the data. The data
1We are describing being fine empirically since we are going to take into account all of theNelson-Siegel fitted curves obtained from the above algorithm.
39

0 200 400 600 800165
170
175
180
185
190
195
200DAY: 01−May−2001
Yie
ld
Time to Maturity0 200 400 600 800
165
170
175
180
185
190
195
200DAY: 02−May−2001
Yie
ld
Time to Maturity
0 200 400 600 800170
175
180
185
190
195
200DAY: 03−May−2001
Yie
ld
Time to Maturity0 200 400 600 800
165
170
175
180
185
190
195DAY: 04−May−2001
Yie
ld
Time to Maturity
Figure 4.1: Fit of Yield Curves
40

0 200 400 600 80060
80
100
120
140
160
180DAY: 12−Oct−2001
Yie
ld
Time to Maturity0 200 400 600 800
110
120
130
140
150
160
170
180DAY: 15−Oct−2001
Yie
ld
Time to Maturity
0 200 400 600 800120
130
140
150
160
170
180
190DAY: 16−Oct−2001
Yie
ld
Time to Maturity0 200 400 600 800
120
130
140
150
160
170
180
190DAY: 17−Oct−2001
Yie
ld
Time to Maturity
Figure 4.2: Fit of Yield Curves
41

0 200 400 600 80080
90
100
110
120
130DAY: 24−Apr−2002
Yie
ld
Time to Maturity0 200 400 600 800
110
112
114
116
118
120
122DAY: 25−Apr−2002
Yie
ld
Time to Maturity
0 200 400 600 80095
100
105
110
115
120
125DAY: 26−Apr−2002
Yie
ld
Time to Maturity0 200 400 600 800
85
90
95
100
105
110
115
120DAY: 29−Apr−2002
Yie
ld
Time to Maturity
Figure 4.3: Fit of Yield Curves
42

0 200 400 600 80090
100
110
120
130
140DAY: 14−Feb−2003
Yie
ld
Time to Maturity0 200 400 600 800
90
100
110
120
130
140DAY: 17−Feb−2003
Yie
ld
Time to Maturity
0 200 400 600 80095
100
105
110
115
120
125
130DAY: 18−Feb−2003
Yie
ld
Time to Maturity0 200 400 600 800
95
100
105
110
115
120
125
130DAY: 19−Feb−2003
Yie
ld
Time to Maturity
Figure 4.4: Fit of Yield Curves
43

with this structure, i.e. data having a U-shape and a hump, can be modelled by
using Svenson model which has two place holder parameters τ1 and τ2, and two
shape identifier parameters β2 and β3.
4.3 Yield Curve Estimation with Vasicek Model
We proved in section 3.2 that for the risk neutral probability Vasicek short
rate satisfies the below stochastic differential equation:
dr(t) = α (β∗ − r(t)) dt + σ dWt (4.3.3)
The solution of this SDE is going to be the adapted one to the solution of SDE
2.2.2 given under the objective probability in section 2.2 as:
rt = r0e−α t + β∗(1 − e−α t) + σ e−α t
∫ t
0
eα sdWs,
and for u < t, it is given as
rt = ru e−α(t−u) + β∗ (1 − e−α(t−u)
)+ σ
∫ t
u
e−α(t−s)dWs, (4.3.4)
From the last solution we see that given ru, the possible values of rt are be-
ing normally distributed. The reason is that the distribution of dWs is normal
with mean zero and variance one. Therefore, the integral itself is being nor-
mally distributed and since the remaining part of the equation other than the
stochastic part is deterministic the current distribution of the stochastic part
does not change except its mean and variance. As a result, rt is normally
distributed with mean µr(u, t) = ru e−α(t−u) + β∗(1 − e−α(t−u)
)and variance
σ2r(u, t) = E∗
[(
σ∫ t
ue−α(t−s)dWs
)2]
= σ2∫ t
ue−2 α (t−s) ds = σ2
2α
(1 − e−2 α (t−s)
).
44

The discretization of rt can now be easily done [25]. That is,
r(ti+1) = µr(ti, ti+1) + σr(ti, ti+1)Zi+1
= e−(ti+1−ti) r(ti) + β∗ (1 − e−(ti+1−ti)) + σ
√
1
2α(1 − e−2(ti+1−ti))Zi+1
(4.3.5)
where 0 = t0 < t1 < ... < tn are the time points and Zi’s, i = 1...n are the
independent random variables with distribution N(0, 1). Equation 4.3.5 is the
exact discretization of the Vasicek short-rate process. However, a slightly simpler
Euler scheme of the short-rate process can be given as
r(ti+1) = r(ti) + α (β∗ − r(ti))(ti+1 − ti) + σ√
ti+1 − tiZi+1 (4.3.6)
which entails some discretization error. In the following sections of the chapter
we will measure the performance of both equations while we are simulating the
Vasicek yield function.
In Section 3.2 we obtained the Vasicek yield function. We can rewrite it as
follows.
R(θ , rt) = R∞ − 1
αθ
[
(R∞ − rt)(1 − e−αθ
)− σ2
4α2
(1 − e−αθ
)2]
,
where R∞ = limθ→∞ R(θ, r) = β∗ − σ2
2α2 . As R(θ , rt) is a smooth function of
θ, it is a stochastic process of t and its stochastic evolution is determined by
Vasicek short-rate process. Therefore, it is possible to use R(θ , rt) for the future
estimations of yield curve.
The discretization of R(θ , rt) begins with the following stochastic differential
equation.
dR(θ , rt) =
(1 − e−αθ
)
αθdrt (4.3.7)
and we write
R(θ , rti+1) − R(θ , rti) =
(1 − e−αθ
)
αθ
[rti+1
− rti
](4.3.8)
45

The following part of the discretization procedure has two folds:
(1) Replacing rti+1− rti with
α (β∗ − rti)(ti+1 − ti) + σ√
ti+1 − tiZi+1
which is obtained by the discretization of drt.
(2) Replacing rti+1− rti with
(1 − e−α(ti+1−ti)
)(β∗ − rti) + σ
√
1
2α(1 − e−2α(ti+1−ti))Zi+1
which is obtained by the discretization of rt, the solution of equation 4.3.3.
Assume we are in March 16, 2004. We will predict the yield curve of March
17, 2004 with the Vasicek yield curve model by using the information of and
up to March 16, 2004. To make the prediction it is needed to determine the
parameters of R(θ , rt) of March 16, 2004. For this purpose we will fit R(θ , rt) to
the yield data of that day by using the same manner as we followed in Section
4.2 with a slight difference. In Section 4.2 we exactly fit the observed data, but
now we will fit the data that is generated by Nelson-Siegel model for that day.
Why we use this data has the reason that we will have a finer fit since the data
is increased from 20 to 800 and to decrease the optimization difficulty of Vasicek
model for small number of data. For the minimization procedure we proposed a
set of parameters.
This set is formed by P = [α,R∞, σ, r]. For this parameter set we will use
two sets of constraints and for each sets of constraints we will use three differ-
ent sets of initial points. After obtaining the estimated values of parameters
P = [α, R∞, σ, r] for each of the constraint-initial point tuple, we will use this
estimated parameters to predict the yield curve of March 17, 2004 by using the
Vasicek yield curve process.
Before all, let us introduce some notations used to express these constraint-
initial point tuples.
46

α R∞a-i 3121926696.79853 8.89897355073613e-017a-ii 3074582904.78327 57.5663641192539a-iii 3122613471.94644 57.5663640805259
σ ra-i 1.02702656015236e-015 -8.67535580071379e-026a-ii 1.72842316498964e-014 1.66798115571358e-007a-iii 1.75930947185959e-014 0
Table 4.2: Estimated values of parameters for constraint set a.
• r short; the time series of yield of bonds with time to maturity with 1 day.
We gathered this series in two steps:
1) We fitted the Nelson-Siegel model to each daily data of our data set.
2) We collected the yield of bond with time to maturity 1 day for each day
of data set.
• yield ns(#); the yield of bond with time to maturity # days and obtained
from the Nelson-Siegel model for the day March 16, 2004.
• µ(yield ns); the mean of the bond yield data obtained from the Nelson-
Siegel model for the day March 16, 2004.
• σ(r short); standard deviation of r short.
• β0; the parameter value estimated by the Nelson-Siegel model for March
16, 2004.
• β1; the parameter value estimated by the Nelson-Siegel model for March
16, 2004.
• yield observed long; observed yield value of the bond with the longest time
to maturity in March 16, 2004.
• yield observed short; observed yield value of the bond with the shortest
time to maturity in March 16, 2004.
The followings are the constraint-initial point sets.
47

0 100 200 300 400 500 600 700 8000
10
20
30
40
50
60
70DAY: 16−Mar−2004
Yie
ld
Time to Maturity
Nelson−Siegel Yield Curve
Vasicek Yield Curve
Figure 4.5: Yield Curve Fitting with the Vasicek and Nelson-Siegel Models byusing constraint-initial point tuple set a-i.
(a) 0 < α ; natural condition coming from the hypothesis of Vasicek short rate
model,
0 < R∞ − r ;We expect long-run bond yield to be larger than short rate.
0 < σ ;Positivity of σ comes from the assumptions of Vasicek model.
0 < r < yield ns(1) ; it is logical to put this constraint in the sense that r
is a short rate.
(i) Pinitial = [0.2, µ(yield ns), σ(r short), yield ns(1)]. The result for March
16, 2004 is given in Figure 4.5.
(ii) Pinitial = [0.2, β0, σ(yield ns), β0 + β1]. The result for March 16, 2004
is given in Figure 4.6.
(iii) Pinitial = [0.2, yield observed long, σ(r short), yield observed short].
The result for March 16, 2004 is given in Figure 4.7
48

0 100 200 300 400 500 600 700 80046
48
50
52
54
56
58
60
62DAY: 16−Mar−2004
Yie
ld
Time to Maturity
Vasicek Yield Curve
Nelson−Siegel Yield Curve
Figure 4.6: Yield Curve Fitting with the Vasicek Model by using constraint-initialpoint tuple set a-ii
49

0 100 200 300 400 500 600 700 80046
48
50
52
54
56
58
60
62DAY: 16−Mar−2004
Yie
ld
Time to Maturity
Vasicek Yield Curve
Nelson−Siegel Yield Curve
Figure 4.7: Yield Curve Fitting with the Vasicek Model by using constraint-initialpoint tuple set a-iii
50

α R∞b-i 0.12656452867452 58.0289089496322b-ii 0.126565260211965 58.0289077616854b-iii 0.126565348814999 58.0289100190384
σ rb-i 3.9547173954881e-007 48.9046368960016b-ii 2.91328054828062e-006 48.904580334028b-iii -1.34651426739607e-005 48.9045822601353
Table 4.3: Estimated values of parameters constraint set b.
Vasicek Yield Curve is constant in the Figures 4.5, 4.6, 4.7. The reason
of this situation is that for each of the tuples a-i, a-ii, a-iii the estimated
values of σ and r considerably small, and the estimated values of σ is
considerably large. The Table 4.2 summarizes the estimated parameter
values for constraint-initial point tuples, a-i, a-ii, a-iii.
(b) 0.01 < α < 1 ; We give an upper boundary 1 to α since α is the mean
reversion rate.
0.01 < R∞ − r ;
0.01 < σ ;
0.01 < r < yield ns(1).
For this constraint set we also take the below boundary of the conditions
0.01 units perturbed, which provides a different initial direction vector for
the minimization procedure.
(i) Pinitial = [0.2, µ(yield ns), σ(r short), yield ns(1)]. The result for March
16, 2004 is given in Figure 4.8.
(ii) Pinitial = [0.2, β0, σ(yield ns), β0 + β1]. The result for March 16, 2004
is given in Figure 4.9.
(iii) Pinitial = [0.2, yield observed long, σ(r short), yield observed short].
The result for March 16, 2004 is given in Figure 4.10.
After we changed the constraint-initial point tuples, we received better fits
of Vasicek yield curve to the yield data set of March 16, 2004. The Table
51

a-i b-ifold1 14.385093067632 17.6622167220191fold2 14.385093067632 17.4400854139305
Table 4.4: Sum of Squared Errors-SSEs of Vasicek Yield Curve Estimations: givenfor each initial i point tuple and folds. Nelson-Siegel SSEs is 5.01802205688122.
a-ii b-iifold1 50.7273031357703 17.6622419124489fold2 14.3850930738333 17.4401076514605
Table 4.5: Sum of Squared Errors-SSEs of Vasicek Yield Curve Estimations: givenfor each initial ii point tuple and folds. Nelson-Siegel SSEs is 5.01802205688122.
4.3 summarizes the estimated parameter values for constraint-initial point
tuples, b-i, b-ii, b-iii.
To estimate the yield curve of tomorrow we will apply Monte-Carlo Method by
using the discretized Vasicek yield function. We will produce a sample of 1000
throws. Then, we will take the mean of the sample. This is going to be our
estimator for the yield of the bond with time to maturity θ of the day March
17, 2004. For this purpose we will use two types of discretized equation as we
explained before;
R(θ , rti+1) = R(θ , rti) +
(1 − e−αθ
)
αθ
[
α (β∗ − rti)(ti+1 − ti) + σ√
ti+1 − tiZi+1
]
(4.3.9)
a-iii b-iiifold1 50.7273032551583 17.662240917152fold2 14.3850930737449 17.4401091872071
Table 4.6: Sum of Squared Errors-SSEs of Vasicek Yield Curve Estimations: givenfor each initial iii point tuple and folds. Nelson-Siegel SSEs is 5.01802205688122.
52

0 100 200 300 400 500 600 700 80046
48
50
52
54
56
58
60
62DAY: 16−Mar−2004
Yie
ld
Time to Maturity
Vasicek Yield Curve
Nelso−Siegel Yield Curve
Figure 4.8: Yield Curve Fitting with the Vasicek Model by using constraint-initialpoint tuple b-i
53

0 100 200 300 400 500 600 700 80046
48
50
52
54
56
58
60
62DAY: 16−Mar−2004
Yie
ld
Time to Maturity
Vasicek Yield Curve
Nelso−Siegel Yield Curve
Figure 4.9: Yield Curve Fitting with the Vasicek Model by using constraint-initialpoint tuple b-ii
54

0 100 200 300 400 500 600 700 80046
48
50
52
54
56
58
60
62DAY: 16−Mar−2004
Yie
ld
Time to Maturity
Vasicek Yield Curve
Nelson−Siegel Yield Curve
Figure 4.10: Yield Curve Fitting with the Vasicek Model by using constraint-initial point tuple b-iii
55

R(θ , rti+1) = R(θ , rti) +
(1 − e−αθ
)
αθ∗
[
(1 − e−α(ti+1−ti)
)(β∗ − rti) + σ
√
1
2α(1 − e−2α(ti+1−ti))Zi+1
]
(4.3.10)
When we compare the Figures 4.5 and 4.8, we see a non-zero Vasicek yield
curve fitted to the data of March 16, 2004. The reason of this improve is better
estimated parameter values. While we are estimating the parameter values with
b-i, the constraint 0.01 < α < 1 gives a better estimation(Table 4.3). As the
estimated value of α decreases the effect of exponential terms increase and the
effect of 1αθ
decreases in amount in R(θ, r). As the effect of exponential term
increases we obtain a hump in the figure. Also, we obtained the difference R∞−r
getting faraway from 0 in positive way with b-i. The Figures 4.9 and 4.10 can
be explained in a way similar to 4.8.
Moreover, when we compare the Figures 4.6 and 4.5 obtained from a-ii and
a-i, respectively, we see that the Vasicek yield curve in Figure 4.6 is a better
fit for March 16, 2004 in the sense that it is not zero. But, again, it is linear
with an approximately zero slope. When we look at the Table 4.2 we see that
this is resulted from the fact that the large value of α decreases the effect of
exponential form in R(θ, r). In the graph, we observe that initial value is al-
most equal to its asymptotic value R∞. Although this is theoretically not true
(since limθ→ 0 R(θ, r) = r), it is possible in machine size calculation: That value
on the graph is calculated by taking θ = 1. When this equality holds, the asymp-
totic value of R(θ, r) is R∞ and this result is consistent with the zero slope value.
A similar result to a-ii can be obtained for the Vasicek yield curve fit of a-iii.
The Figures 4.14 and 4.15 represent the Vasicek yield curve estimations for a-i
fold1 and a-i fold2. Although both of the graphs are obtained from the same
constraint- initial point a-i, the folds, .i.e. discretization methods of R(θ, rt),
are different. However, the sums of squared errors for each fold are same as it is
presented in Table 4.4. This result is possible for very high values of α (see Table
4.2). When we examine Figure 4.16 we see that it is a quite similar one to the
56

graph presented in Figure 4.14 and 4.15.2 However, the sum of squared errors
of the estimation with b-i fold2 is 17.4400854139305 which is 3.0549923462985
larger than b-i of both folds.
The Figures 4.17 and 4.18 represents the yield curve estimation of March
17, 2004 with a-ii fold1 and a-ii fold2, respectively. Figure 4.17 represents an
estimated yield curve which has a better fit for θ nearly larger than 108. However,
its performance is not good for the short period. It overestimates the yield of
bonds having short-term maturity. This results from the estimated parameter
set of a-ii and discretization method fold1. For the small values of θ ≥ 1, a-ii
fold1 gives a result such that
R(θ, rti+1) ≈ R(θ, rti) + R∞.
This result is not surprising since α is quite large(see Table 4.2). On the other
hand in Figure 4.18, i.e. for a-ii fold2 this approximation can not be seen
because of the term 1−eα θ
α θ. This term decreases the value for small θ ≥ 1 with the
help of the negative draws. The performance of the estimation with a-ii fold1 is
quite below the performance of the estimation with a-ii fold2 by means of SSEs.
This huge difference is represented in Table 4.5. Also, for not to be confused by
the Figures 4.17 and 4.18, we measured the performance of the estimation of both
a-ii fold1 and a-ii fold2 for θ ≥ 112 by means of SSEs. We observed that the
estimation with a-ii fold2 is again better than the estimation with a-ii fold1 in
the long-run. The measured value for fold2 is 1.87909334435726 and for fold1,
it is 2.84815794190374.
The collected information of performance of all the tuples is given in Tables
4.4, 4.5 and 4.6. We can conclude that constraint set b is much more consistent
with the all three initial points and it gives an estimated yield curve similar to
Nelson-Siegel fitted yield curve. However, when tomorrow comes out we see that
Nelson-Sigel gives a better fit of the day with 5.01802205688122.
The most important problem here is the distributions of data occurred in both
March 16, 2004 and March 17, 2004. If the both distributions are Gaussian, we
2The figures of constraint set b with fold1 are not given since they are very similar to thefigures obtained from the constraint set b with fold2.This similarity can also be seen in Tables4.4, 4.5, and 4.6.
57

expect a very well fit. In our case both of our data are not Gaussian distributed.
In Figures 4.11 and 4.12 the quantile-quantile plots of March 16 and March 17
are given. As it can be seen from these plots that the distributions of each of
the days are not Gaussian. However, for each of the days there is are parts of
the data drawn from a distribution closed to a Gaussian one. If the estimation
of yield curve for March 16 is done with this part we obtain a better fit in the
prediction of the yield curve of March 17. We will show this result for March 16 3.
Let us exclude the last three yield data of bonds with the longest maturities from
the whole data set of March 16, 2004 yield data. That is we exclude the yields
of bonds with maturities 372, 407 and 526 days since these data points are the
outliers of the data. When we apply Kolmogorov-Simirnov test to the remaining
part of the data we can not reject that the data is Gaussian distributed. In the
next step, we repeated all the procedures that we have followed before(estimation
and prediction procedures). After obtaining the estimated parameters of Vasicek
model we predict the yield curve of March 17 again with the Vasicek yield curve
model. As a result, we improved our prediction by means of fitting the observed
data of March 17, i.e. we decreased the SSEs approximately from 17.4401 to
16.3376(see also Figure 4.13).
3We repeated this procedure just for constraint-initial point tuple b-ii and for fold2 as anexample of above argument.
58

−3 −2 −1 0 1 2 3−5
−4
−3
−2
−1
0
1
2
3
4
X Quantiles
16−M
ar−2
004
Qua
ntile
s
Figure 4.11: Quantile-quantile Plot of X and March 16, 2004 yield data.
59

−3 −2 −1 0 1 2 3−4
−3
−2
−1
0
1
2
3
4
X Quantiles
17−M
ar−2
004
Qua
ntile
s
Figure 4.12: Quantile-quantile Plot of X and March 17, 2004 yield data.
60

0 100 200 300 400 500 600 700 80050
52
54
56
58
60
62
Figure 4.13: Constraint initial point tuple b-ii and discretization fold2.
61

0 100 200 300 400 500 600 700 80050
52
54
56
58
60
62DAY: 17−Mar−2004
Yie
ld
Time to Maturity
Vasicek Yield Curve
Figure 4.14: Yield Curve Estimation with the Vasicek Model by using constraint-initial point tuple a-i and discretization fold-1
62

0 100 200 300 400 500 600 700 80050
52
54
56
58
60
62DAY: 17−Mar−2004
Yie
ld
Time to Maturity
Vasicek Yield Curve
Figure 4.15: Yield Curve Estimation with the Vasicek Model by using constraint-initial point tuple a-i and discretization fold-2
63

0 100 200 300 400 500 600 700 80050
52
54
56
58
60
62DAY: 17−Mar−2004
Yie
ld
Time to Maturity
Vasicek Yield Curve
Figure 4.16: Yield Curve Estimation with the Vasicek Model by using constraint-initial point tuple b-i and discretization fold-2
64

0 100 200 300 400 500 600 700 80050
60
70
80
90
100
110DAY: 17−Mar−2004
Yie
ld
Time to Maturity
Vasicek Yield Curve
Figure 4.17: Yield Curve Estimation with the Vasicek Model by using constraint-initial point tuple a-ii and discretization fold-1
65

0 100 200 300 400 500 600 700 80050
52
54
56
58
60
62DAY: 17−Mar−2004
Yie
ld
Time to Maturity
Vasicek Yield Curve
Figure 4.18: Yield Curve Estimation with the Vasicek Model by using constraint-initial point tuple a-ii and discretization fold-2
66

0 100 200 300 400 500 600 700 80050
52
54
56
58
60
62DAY: 17−Mar−2004
Yie
ld
Time to Maturity
Vasicek Yield Curve
Figure 4.19: Yield Curve Estimation with the Vasicek Model by using constraint-initial point tuple b-ii and discretization fold-2
67

0 100 200 300 400 500 600 700 80050
60
70
80
90
100
110DAY: 17−Mar−2004
Yie
ld
Time to Maturity
Vasicek Yield Curve
Figure 4.20: Yield Curve Estimation with the Vasicek Model by using constraint-initial point tuple a-iii and discretization fold-1
68

0 100 200 300 400 500 600 700 80050
52
54
56
58
60
62DAY: 17−Mar−2004
Yie
ld
Time to Maturity
Vasicek Yiel Curve
Figure 4.21: Yield Curve Estimation with the Vasicek Model by using constraint-initial point tuple a-iii and discretization fold-2
69

0 100 200 300 400 500 600 700 80050
52
54
56
58
60
62DAY: 17−Mar−2004
Yie
ld
Time to Maturity
Vasicek Yield Curve
Figure 4.22: Yield Curve Estimation with the Vasicek Model by using constraint-initial point tuple b-iii and discretization fold-2
70

0 100 200 300 400 500 600 700 80046
48
50
52
54
56
58
60
62DAY: 17−Mar−2004
Yie
ld
Time to Maturity
Nelson−Siegel Yield Curve
Vasicek Yield Curve
Figure 4.23: Nelson-Siegel Yield Curve Fitting, and Yield Curve Estimation withthe Vasicek Model by using constraint-initial point tuple a-i and discretizationfold-1
71

0 100 200 300 400 500 600 700 80046
48
50
52
54
56
58
60
62DAY: 17−Mar−2004
Yie
ld
Time to Maturity
Vasicek Yield Curve
Nelson−Siegel Yield Curve
Figure 4.24: Nelson-Siegel Yield Curve Fitting, and Yield Curve Estimation withthe Vasicek Model by using constraint-initial point tuple a-i and discretizationfold-2
72

0 100 200 300 400 500 600 700 80046
48
50
52
54
56
58
60
62DAY: 17−Mar−2004
Yie
ld
Time to Maturity
Vasicek Yield Curve
Nelson−Siegel Yield Curve
Figure 4.25: Nelson-Siegel Yield Curve Fitting, and Yield Curve Estimation withthe Vasicek Model by using constraint-initial point tuple b-i and discretizationfold-2
73

0 100 200 300 400 500 600 700 80040
50
60
70
80
90
100
110DAY: 17−Mar−2004
Yie
ld
Time to Maturity
Vasicek Yield Curve
Nelson−Siegel Yield Curve
Figure 4.26: Nelson-Siegel Yield Curve Fitting, and Yield Curve Estimation withthe Vasicek Model by using constraint-initial point tuple a-ii and discretizationfold-1
74

0 100 200 300 400 500 600 700 80046
48
50
52
54
56
58
60
62DAY: 17−Mar−2004
Yie
ld
Time to Maturity
Vasicek Yield Curve
Nelson−Siegel Yield Curve
Figure 4.27: Nelson-Siegel Yield Curve Fitting, and Yield Curve Estimation withthe Vasicek Model by using constraint-initial point tuple a-ii and discretizationfold-2
75

0 100 200 300 400 500 600 700 80046
48
50
52
54
56
58
60
62DAY: 17−Mar−2004
Yie
ld
Time to Maturity
Vasicek Yield Curve
Nelso−Siegel Yield Curve
Figure 4.28: Nelson-Siegel Yield Curve Fitting, and Yield Curve Estimation withthe Vasicek Model by using constraint-initial point tuple b-ii and discretizationfold-2
76

0 100 200 300 400 500 600 700 80040
50
60
70
80
90
100
110DAY: 17−Mar−2004
Yie
ld
Time to Maturity
Vasicek Yield Curve Nelson−Siegel Yield Curve
Figure 4.29: Nelson-Siegel Yield Curve Fitting, and Yield Curve Estimation withthe Vasicek Model by using constraint-initial point tuple a-iii and discretizationfold-1
77
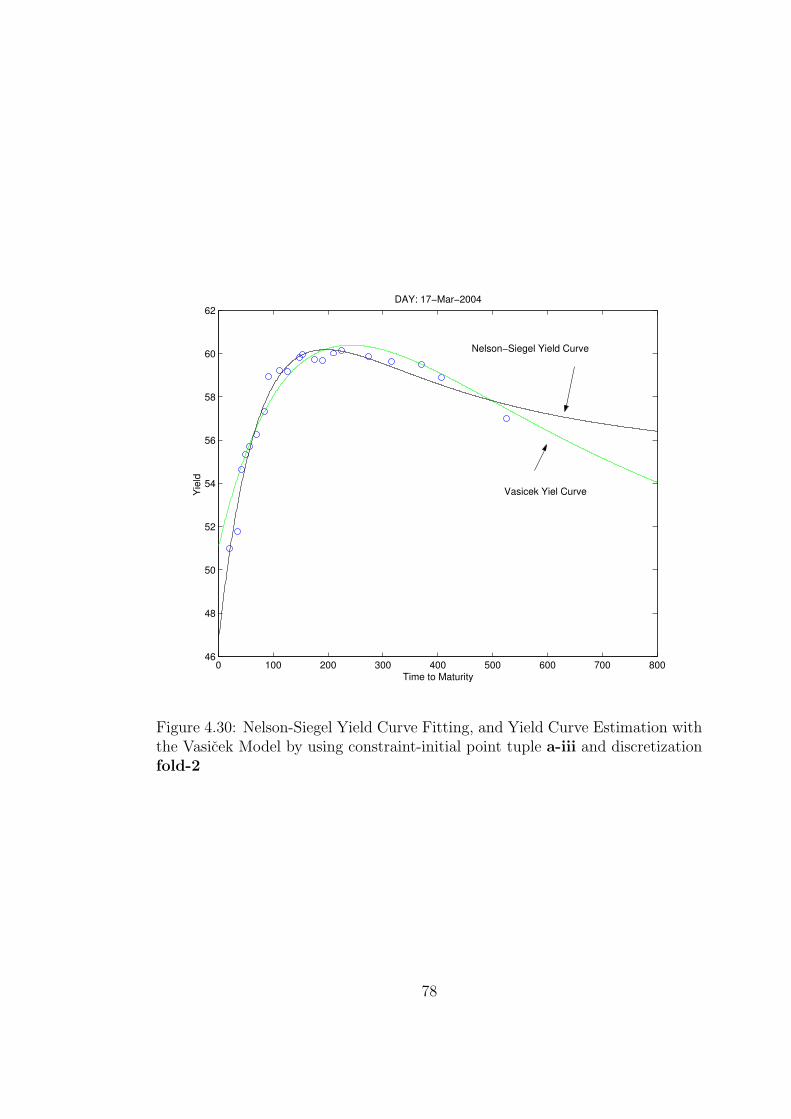
0 100 200 300 400 500 600 700 80046
48
50
52
54
56
58
60
62DAY: 17−Mar−2004
Yie
ld
Time to Maturity
Vasicek Yiel Curve
Nelson−Siegel Yield Curve
Figure 4.30: Nelson-Siegel Yield Curve Fitting, and Yield Curve Estimation withthe Vasicek Model by using constraint-initial point tuple a-iii and discretizationfold-2
78

0 100 200 300 400 500 600 700 80046
48
50
52
54
56
58
60
62DAY: 17−Mar−2004
Yie
ld
Time to Maturity
Vasicek Yield Curve
Nelson−Siegel Yield Curve
Figure 4.31: Nelson-Siegel Yield Curve Fitting, and Yield Curve Estimation withthe Vasicek Model by using constraint-initial point tuple b-iii and discretizationfold-2
79

Chapter 5
Conclusion
In this study, we presented some of the most fundamental one factor interest
rate models with their solutions. Among them, Vasicek model is used to reach the
main scope of this study: prediction of the yield curve of tomorrow. Nelson-Siegel
model which is a function base yield curve model is used to complete the missing
data which is Turkish zero coupon bond simple spot rate gathered for several
maturities from May 1, 2001 to March 17, 2004. We discretized Vasicek short rate
model, that is used in Monte Carlo method to predict the yield curve of tomorrow.
We used two different discretization methods: discretization of 4.3.3(fold1) and
discretization of 4.3.4(fold2). It is seen that discretization method fold2 results
with a better prediction of yield curve of March 17 by means of smaller SSEs. In
the last section, it is also shown that if the distribution of the data(today ’s data)
used to predict the yield curve of tomorrow is Gaussian, then we obtain a better
prediction.
Although this exploratory method followed in this study can be extended to
more elaborated methods, we conclude that by taking the Nelson-Siegel model
as a benchmark we measured the performance of Vasicek model as a predictor
and we found a considerable difference. The performance might be improved by
using different constraint initial point tuples and by developing other methods
in the optimization of SSEs. We also conclude that all the methods followed in
this study are applicable to affine models in which the solution of bond price is
explicitly obtained.
80

References
[1] D. Lamberton, B. Lapeyre, Introduction to Stochastic Calculus Applied to
Finance, First Edition, Chapmen and Hall, (1996).
[2] T. Bjork, Arbitrage Theory in Continuous Time, Oxford Uni.Press., (1998).
[3] F. Black, E. Derman, W. Toy, A One-Factor Model of Interest Rates and
Its Appliaction To Tresuary Bond Options. Financial Analysist Journal 46,
33-39 (1990).
[4] F. Black, P. Karasinski Bond and Option Pricing when Short Rates are Log-
normal., Financial Analysist Journal 47, 52-59 (1991).
[5] M.J. Brennan, E. Schwartz, A Continuous Time Approach to the Pricing of
Bonds.,Journal of Banking and Finance 3, 133-155, (1979).
[6] J.C. Cox, Notes on Option Pricing I:Constant Elasticity of Variance Diffu-
sion, Working paper Standford Uni., (1975)
[7] J.C. Cox, S.Ross, The Valuation of Options for Alternative stochastic Pro-
cesses., Journal of Financial Economics 3, 145-146, (1976).
[8] J.C. Cox,J.E. Ingersoll, S.Ross, A Theory of the Term Structure of Interest
Rates. , Econometria 53, 385-407, (1985).
[9] L.U. Dothan, On the Term Structure of Interest Rates. Journal Of Financial
Economics 6, 59-69, (1978).
[10] J. Hull, A. White, Pricing Interest Rate Derivative Securities, The Rewiev
of Financial Studies 3, 573-592, (1990).
[11] J. Hull, A. White, One-Factor Interest Rate Models and the Valuation of
Interest Rate Derivative Securities., Journal of Financial and Quantative
Analysis 28, 235-254, (1993)
81

[12] F. Jamishidian, An Exact Bond Option Pricing Formula., The Journal of
Finance, 44, 205-209, (1989).
[13] T.A. Marsh, E.R. Rosenfeld Stochastic Proceses for Interest Rates and Equi-
librium Bond Prices, The Journal Of Finace 38, no.2, 635-646, (1983).
[14] D.M. Chance, Teaching Note 97-03:The Vasicek Term Structure Model,
c:/Classes/Teaching Notes/TN97-03.doc, (2003)
[15] D. Bolder, D. Streliski, Yield Curve Modelling at the Bank of Canada, Tech-
nical Report 84, (1999).
[16] D. Bolder, S. Gusba, Exponentials, Polynomials, and Fourier Series: More
Yield Curve Modelling at the Bank of Canada, Working Paper2002-29, (2002)
[17] H. Korezlioglu, A. Hayfavi, Elements of Probability Theory Metu, (2001).
[18] D. Brigo, F. Mercurio, Interest Rate Models Theory and Practice, Springer,
(2001).
[19] Y.K. Kwok, Mathematical Models of Financial Derivatives, Springer, (1998).
[20] J. James, N. Webber, Interest Rate Modelling, Wiley, (2000).
[21] R-A. Dana, M. Jeanblanc, Financial Markets in Continuous Time, Springer,
(2003).
[22] N. Ikeda, S. Watanabe, Stochastic Differential Equations and Diffusion Pro-
cesses., North-Holland, New York, (1981).
[23] C.R. Nelson, A.F. Siegel, Parsimonious Modelling of Yield Curves., Journal
of Business 60, (1987).
[24] J.H. Mathews, K.D. Fink, Numerical Methods Using Matlab.,Prentice Hall,
Upper Sadle River, (1999).
[25] P. Glasserman, Monte-Carlo Methods In Financial Engineering., Springer,
(2004).
82