yesterday's heroes: compensation and …joses/wp/yesterday.pdf · yesterday's heroes:...
TRANSCRIPT

NBER WORKING PAPER SERIES
YESTERDAY'S HEROES:COMPENSATION AND CREATIVE RISK-TAKING
Ing-Haw ChengHarrison Hong
Jose A. Scheinkman
Working Paper 16176http://www.nber.org/papers/w16176
NATIONAL BUREAU OF ECONOMIC RESEARCH1050 Massachusetts Avenue
Cambridge, MA 02138July 2010
We thank Jeremy Stein, Rene Stulz, Luigi Zingales, Steven Kaplan, Tobias Adrian, Sule Alan, AugustinLandier, Terry Walter, Bob DeYoung, Ira Kay, Patrick Bolton and participants at the Princeton-CambridgeConference, SIFR Conference, HEC, NBER, University of Michigan, University of Technology atSydney, Chinese University of Hong Kong, CEMFI, LSE, University of Kansas Southwind Conference,Federal Reserve Bank of New York, Columbia University, ECGI-CEPR-IESE Madrid Conference,and the NBER Conference on Market Institutions and Financial Market Risk for helpful comments.The views expressed herein are those of the authors and do not necessarily reflect the views of theNational Bureau of Economic Research.
© 2010 by Ing-Haw Cheng, Harrison Hong, and Jose A. Scheinkman. All rights reserved. Short sectionsof text, not to exceed two paragraphs, may be quoted without explicit permission provided that fullcredit, including © notice, is given to the source.

Yesterday's Heroes: Compensation and Creative Risk-TakingIng-Haw Cheng, Harrison Hong, and Jose A. ScheinkmanNBER Working Paper No. 16176July 2010JEL No. G01,G21,G22,G24,G32
ABSTRACT
We investigate the link between compensation and risk-taking among finance firms during the periodof 1992-2008. First, there are substantial cross-firm differences in residual pay (defined as total executivecompensation controlling for firm size). Second, residual pay is correlated with price-based risk-takingmeasures including firm beta, return volatility, the sensitivity of firm stock price to the ABX subprimeindex, and tail cumulative return performance. Third, these risk-taking measures are correlated withshort-term pay such as bonuses and options even controlling for longer-term incentives such as insiderownership stakes. Finally, compensation and risk-taking are not related to governance variables; butthey do covary with ownership by institutional investors who tend to have short-termist preferencesand the power to influence firms’ management policies. These findings suggest that our residual paymeasure is also potentially picking up firm-wide, high-powered incentives not captured by insiderownership. They also suggest that the correlation between residual pay and firm risk-taking is dueto investors with heterogeneous short-termist preferences investing in different firms and incentivizingthem to take different levels of risks.
Ing-Haw ChengRoss School of BusinessUniversity of Michigan701 Tappan StAnn Arbor, MI [email protected]
Harrison HongDepartment of EconomicsPrinceton University26 Prospect AvenuePrinceton, NJ 08540and [email protected]
Jose A. ScheinkmanDepartment of EconomicsPrinceton UniversityPrinceton, NJ 08544-1021and [email protected]

1
I. Introduction
Are Wall Street bonuses to blame for the most significant economic crisis since the Great
Depression? Many including the Obama administration seem to think so. In his testimony (June 6,
2009) in front of Congress on the Treasury budget, Secretary Geithner argues, “I think that although
many things caused this crisis, what happened to compensation and the incentives in creative risk taking
did contribute in some institutions to the vulnerability that we saw in this financial crisis.” (emphasis
added).1 To address this issue, the Obama administration is promoting reforms to tie pay to long-term
performance and increase the say of shareholders in approving compensation and electing directors on
compensation committees. Implicit in these reforms is the view that finance firms’ short-termist
incentives reflect mis-governance or entrenchment and a misalignment with shareholder interest.
This creative risk-taking is perhaps best epitomized by the now infamous “musical chairs” quote
of Chuck Prince, then CEO of Citigroup, regarding their exposures to the subprime mortgage market. In
his interview with the Financial Times back in July 2007, Chuck Prince, in referring to his company not
backing away from risks at the beginning of the subprime crisis, remarked: “When the music stops, in
terms of liquidity, things will be complicated. But as long as the music is playing, you've got to get up
and dance. We're still dancing.” This quote is often attributed as market pressure (presumably being
fired by impatient shareholders) forcing Citi’s managers to take on such risks, whether or not they fully
understood them. In other words, the short-termism emanated not so much from mis-governance or
entrenchment as from demand on the part of investors themselves. This more nuanced perspective of a
short-term stock market forcing management to be excessively myopic also has basis in theory (see
Stein, 1989 and Stein, 2003 for a review of this large literature on the contrasting perspectives of the
source of short-termism in markets).
In this paper, we motivate our empirical analysis around a few hypotheses drawn from this short-
termism and risk-taking literature. The first is the familiar view of mis-governance and entrenchment.
The second, due to Bolton, Scheinkman and Xiong (2006), draws a parallel between banks like Bear
Stearns to dot-com stocks and growth options. In this “quant-bubble” story, over-confident and
optimistic investors incentivize otherwise long-run value maximizing managers to make investments
1 The view that short-termism contributed to the crisis is shared by other governments, particularly in the UK, where a parliamentary committee investigating the crisis “found that bonus-driven remuneration structures encouraged reckless and excessive risk-taking and that the design of bonus schemes was not aligned with the interests of shareholders and the long-term sustainability of the banks.” (UK House of Commons, 2009)

2
and take risks in subprime derivatives built from financial engineering. The rationale is that the
company can experience short-run earnings growth as a result and be quickly resold to even more
optimistic investors. The third is the “cowboy culture” story in which Bear Stearns has risk-taking in its
genes and shareholders who like such firms select to be their shareholders. While related, these three
hypotheses yield somewhat different predictions, which we exploit below.
Using panel data on financial firm executive compensation and risk-taking from 1992-2008, we
ask whether cross-sectional variation in firm compensation practices is related to heterogeneity in
subsequent risk-taking. It is worth noting at the outset that our analysis is not causal and is designed to
establish whether there is such an observed correlation and explore what factors might drive such a
relationship by exploiting the different predictions yielded by the above hypotheses. Our measure of
short-termism is the residual of total annual firm compensation (payouts to top executives) controlling
for firm size and finance sub-industry classifications. Our measure differs from the more traditional
measure of incentives---namely, insider ownership. Indeed, recent work (notably Fahlenbrach and
Stulz, 2009) finds that insider ownership does not have much predictive power for risk-taking and that
executives of finance firms tend to have high values of ownership stakes to begin with. But as we
discuss below, our residual compensation measure better picks up implicit incentives not captured by
insider ownership and as a result has more explanatory power for risk-taking.
Our empirical design is as follows. We split our sample into two periods—an early period
defined as 1992 (when we start having executive compensation data) up to 2000, which marks the end of
the dot-com era, and a late period from 2001-2008 which marks the beginning and end of the housing
boom. We then take the first three years 1992-1994 to create a ranking of executive compensation
among firms at the beginning of the early period. Specifically, we take the log of average executive
compensation from 1992-1994 and regress this on the log of a firm’s market capitalization in 1994,
allowing for heterogeneity at the sub-industry level, to come up with a residual compensation ranking
for each firm. We then take data from 1998-2000 to create a similar ranking for residual compensation
before the late period.
Then, using data from 1995-2000 and 2001-2008, we calculate various risk-taking measures for
the early and late periods, respectively. The first set consists of price-based measures including firm
beta and return volatility. For the late period, we also compute the sensitivity of a firm’s stock price to
the ABX subprime index. The second set consists of accounting-based measures including the average
holdings of mortgage-backed securities not backed by one of the government-sponsored entities (GSEs)

3
and book leverage. We also examine the cumulative return performance of our firms in each period
with the idea of relating tail performance to compensation. Our baseline analysis is to regress these
risk-taking measures on our lagged residual CEO compensation (from 1992-1994) measure along with
other firm characteristics. Similarly, we calculate risk-taking measures for the period of 2001-2008 and
regress these on our residual compensation measures constructed from 1998-2000.
We work with this stark set-up rather than panel estimation for a few reasons. The split in the
sample periods is admittedly ad-hoc and indeed even in the late nineties, banks also faced turmoil
related to the Asian, Mexican and Russian crises, though the magnitudes of their problems are dwarfed
by the recent crisis. But as we will show, residual pay levels in our two cross-sections are highly
correlated, so we are essentially capturing permanent effects. This set-up makes it clear that residual
pay in our cross-sections is very similar and allows for a simple and conservative framework to measure
our effects. Moreover, we will also work with a pooled panel set-up and cluster standard errors by firm
in the robustness section and the results are similar. In addition, this set-up best captures cumulative
returns over long horizons, which really gets at the idea behind the title of the paper. From 1995-2000,
the market did very well and the risk-takers should have had good outlier performances, but during the
period of 2001-2008, a poor time in market, the risk-takers should have had poor outlier performances.
We establish the following findings. First, there is substantial cross-sectional heterogeneity in
the permanent component of residual executive compensation. The residual compensation measures
obtained from this regression are highly correlated across the two sub-samples, and CEO turnover and
stock price performance do not drive changes in the residual compensation measures across the two sub-
periods. Firms with persistently high residual compensation include Bear Stearns, Lehman, Citicorp,
Countrywide, and AIG. Low or moderate residual compensation firms include JP Morgan, Goldman
Sachs, Wells Fargo, and Berkshire Hathaway. As such, we interpret heterogeneity of our residual
compensation measure as being due to permanent cross-firm differences.
Second, we find that our residual compensation measure is strongly correlated in both sub-
samples with our price-based measures of subsequent risk-taking. Firms with high executive
compensation have a higher CAPM beta, higher return volatility, and ABX exposure. For instance, a
one-standard deviation increase in residual compensation is associated with a 0.40-standard deviation
increase in subsequent stock price exposure to price movements in the ABX. A price-based risk score,
defined as the average of the normalized z-scores of CAPM beta, return volatility and ABX exposure, is
even more strongly related to residual compensation than any of the measures individually, suggesting

4
there is a lot of measurement error in the risk measures to begin with. Moreover, firms with high
residual compensation are more likely to be in the tails of performance, with extremely good
performance in the early period when the market did well and extremely poor performance in the late
period when the market did poorly.2 This is consistent, for example, with a story where executives are
highly-paid to take on not only more risk but also more tail risk and where the tail event was realized in
the recent crisis. For example, a one-standard deviation increase in residual compensation in 1998-2000
is associated with 24% lower returns over the market in the 2001-2008 period. These results stand in
contrast to more traditional book-based measures of risk-taking, which do less well. This is perhaps not
surprising since many of the finance firms’ exposures during the recent crisis were off balance sheet.
These findings suggest that there is substantial heterogeneity among financial firms in which
high-compensation and high risk-taking go hand in hand. As a result, the aggressive firms that were
yesterday’s heroes when the stock market did well can easily be today’s outcasts when fortunes reverse,
very much to the point of what we have experienced in the last twenty or so years. The important thing
to note here is that our price risk score measure is robust and statistically significant across all sub-
industries. Our findings are also robust to a series of other checks.
We next examine the hypothesis of short-term compensation directly in two ways. First, we
examine components of pay and find that both bonuses and equity/option compensation are especially
correlated with risk-taking (while salary is markedly less informative)---strongly suggesting an
important role of the short-term component of pay since option grants are typically viewed as a more
tax-efficient way to pay bonuses (as we discuss below). Second, we regress the risk-taking of firms on
compensation while controlling for insider ownership on the presumption that insider ownership is a
proxy for long-term incentives. If indeed compensation is capturing long-term pay incentives (as
opposed to short-term pay), then having insider ownership should mute our results and we should also
expect insider ownership to predict risk-taking with the same sign as compensation. Instead, our
baseline findings on compensation remain even after controlling for insider ownership.
We then ask whether our results are due to mis-governance or entrenchment as opposed to
heterogeneity among investors who want to invest in high risk-taking firms and hence need to set
compensation appropriately to induce such behavior. We find that standard governance measures such
2 This tail performance measure is motivated by Coval, Jurek and Stafford (2009) who suggest that banks’ CDO positions were akin to writing disaster insurance and hence standard risk metrics like market beta may be inadequate in capturing such sorts of tail risks.

5
as the Gompers, Ishii and Metrick (2003) and Bebchuk, Cohen and Ferrell (2009) measures of
entrenchment, as well as board independence, are not correlated with our results (if anything, the worst
governance score firms are associated with less risk-taking). So it appears that there is no evidence of
mis-governance using these standard metrics for mis-alignment of interest between shareholders and
management, at least in the cross-section. But this may simply be that these measures are not very good
measures of governance in finance.
In contrast, we find that residual compensation and risk-taking are positively correlated with
institutional ownership and stock turnover. The institutional ownership finding suggests that there is
heterogeneity in investor preferences with institutional investors (perhaps because of shorter-horizons
due to agency issues) wanting certain firms to take more risks and hence having to give them short-term
incentives to do so. Indeed, both anecdotal and empirical evidence suggests that institutional investors
are the ones with the power to pressure management (Froot, Perold and Stein, 1992; Graham, Harvey
and Rajgopal, 2005; and Parrino, Sias and Starks, 2003). In this interpretation, the high-powered
incentives picked up by our residual pay measure are simply the carrot needed to get the firm to take
risks desired by institutional investors. Of course, one has to be a bit careful in interpretations here since
if institutional investors are too short-termist and say always flip the shares of the company, they will
not have any influence over management. But in practice, there is plentiful evidence that institutional
investors care greatly about companies making quarterly earnings targets, presumably because the
accompanying growth in share prices helps the institutional investors’ portfolio performance.
The turnover finding makes the point of the importance of speculation as a driving motive for
short-termist investors in mediating our results even more starkly. Turnover is an important proxy for
speculative activity in financial markets (Hong and Stein, 2007). The fact that high turnover firms have
both higher residual compensation and risk-taking is consistent with short-termist investors’ speculative
preferences for certain stocks. It turns out that firms with high institutional ownership tend to be high
turnover firms and in a horse race between these two variables, institutional ownership has more
explanatory power. Nonetheless, the two findings are broadly consistent with the speculative
preferences of short-termist investors being important in understanding the relationship between
compensation and risk-taking and hence support the quant-bubble hypothesis of Bolton, Scheinkman
and Xiong (2006) and the cowboy culture alternative. In sum, these two sets of findings regarding the
mediating role of short-termist incentives of shareholders support our earlier finding that short-term pay
in the form of residual bonuses and options are especially correlated with risk-taking.

6
Finally, we attempt to distinguish between the quant-bubble and cowboy culture alternatives,
which are very similar in spirit. The quant-bubble story predicts that Bear Stearns with high residual
compensation is like a dot-com stock and hence should have high valuations as say measured by market-
to-book. But it turns out that our residual compensation variable’s explanatory power for risk-taking is
unaffected by market-to-book as a control variable, which is inconsistent with the quant-bubble story.
The only proviso is that standard metrics of like market-to-book are typically poor measures of finance
firm valuations.
In sum, our findings suggest that investors with more short-termist preferences invest in firms
with more short-term incentives and higher risk-taking. The presumption, given that institutional
investors are sophisticated, is that the incentives provided were consistent with shareholder preferences.
We have focused mostly in the narrative on short-term pay and while the bulk of the evidence is
consistent with this story, there is an alternative take involving implicit incentives and efficiency wages.
A high level of residual pay is like an efficiency wage where executives are paid more by short-term
shareholders to take on more short-term risk with the underlying threat of firings. We have focused on
total direct compensation, which is easier to measure than firing pressure, but it is likely that firing for
failure to meet quarterly targets (while more difficult to measure) is a more powerful motivator.3 These
two types of high-powered incentives are likely to be correlated across firms and may explain why
short-term pay predicts risk-taking even though very rich executives had such large stakes in their
companies. In point, the competitive pressure that Chuck Prince suggests in his musical chairs quote is
likely due to firing as much as bonuses.
Although not causal, this suggests that implicit incentives and efficiency wages are important for
risk-taking in finance. Such issues are particularly important in finance where taxpayers bear a portion
of the risk through bailouts. Our results suggest that reforms designed to strengthen the influence of
shareholders in compensation decisions may exacerbate short-term risk-taking at the expense of
taxpayers by encouraging risk-taking during speculative episodes.
3 It is difficult to statistically predict CEO turnover based on performance. The R-squared from such regressions is typically around 10% - see Kaplan and Minton (2006). However, the evidence indicates that there is a turnover-performance relationship, and that this relationship has strengthened through time. Of course, the managers that are paid above norm would be the most sensitive to the threat of losing their jobs.

7
Our paper is organized as follows. We discuss the related literature in Section II and the data in
Section III. We present the results in Section IV and conclude with some thoughts on future research in
Section V.
II. Related Literature
The literature on compensation, governance and risk-taking has, up until very recently, paid very
little attention to the financial sector. There are some exceptions. For instance, Laeven and Levine
(2008) document that risk taking among banks is higher in those with large and diversified blockholders.
Mehran and Rosenberg (2008) argue that stock option grants lead CEOs to take less borrowing and
higher capital ratios but to undertake riskier investments.
The crisis has spurred research contemporary with ours into this previously under-researched
area. Adams (2009) focuses on comparing governance at financial firms prominent in the crisis with
non-financials and concludes that, although there are substantial differences in average governance
between the two groups, governance is not an obvious culprit for the crisis. Erkens, Hung and Matos
(2009) look at international evidence on governance, CEO turnover and risk-taking for the 2006-2008
crisis period and find that stronger governance mechanisms are associated with more CEO turnover but
also more losses and bonuses are associated with ex post shareholder losses and higher book leverage.
Keys, Mukherjee, Seru and Vig (2009) look at CEO and risk-manager compensation and find that firms
with higher risk-manager compensation originated lower-quality loans. Fahlenbrach and Stulz (2009)
find that insider ownership does not have much explanatory power for which finance firms did badly in
terms of returns during the crisis.
Our contribution is to come up with our residual pay measure that can pick up other important
incentives better than the traditional measure of insider ownership. First, top executives, even if they
have high ownership stakes, face other high-powered incentives related to market pressure from short-
termist investors to out-perform rivals. The above quote from Chuck Prince and the recent firing of
John Mack of Morgan Stanley after the collapse of Lehman (both of whom were well-incentivized and
both facing pressure from impatient shareholders) are consistent with this perspective. In other words,
implicit incentives related to firing also matter greatly. Second, many rank-and-file employees that
matter for risk-taking (such as risk managers or proprietary traders) do not typically have high
ownership stakes and hence our measure might better pick up the incentives of these employees. We
would ideally like compensation data for a wide range of employees at each firm, but ExecuComp (our
data source for compensation) typically only provides data for the top five executives. Nonetheless,

8
higher annual payouts at the top level might pick up a firm culture for high-powered incentives, whether
they are bonuses or higher sensitivity of firing to short-term performance. As such, we view our
residual pay measure as being a sensible proxy of both firm-wide explicit and implicit short-termist
incentives.
Relative to this literature, we contribute a number of new findings. First, we are the first to focus
on price-based risk-taking measures rather than standard book leverage measures. Indeed, we find that
our price-based measures show up much more significantly in our regressions than do book leverage.
Second, we focus on risk-taking over long periods and establish that the relationship between risk-taking
and compensation is a persistent practice over a long time period. In particular, we not only find that
aggressive firms who did well in the 1990’s and were “yesterday’s heroes” were the largest risk-takers
and are today’s outcasts in the crisis, but we also find that these firms tend to be the high compensation
firms, and that the compensation practices at these firms tend to be persistently high even after
excluding the CEO. Here it is important to emphasize that just focusing on the crisis period would be
inadequate to nail down a fixed effects hypothesis or the tail return risk measure. Our results thus
contribute to the growing idea that risk-taking may be related to a firm-fixed effect such as firm culture
that is picked up by our compensation measure. Third, we find that both bonuses and options/equity
compensation drive risk-taking in contrast to insider ownership (which we find has limited explanatory
power similar to Fahlenbrach and Stulz, 2009). In other words, it appears that it is the shorter-term
incentives in the organization that matters. Fourth, we further expand the link between short-term
compensation and risk-taking by studying whether short-termism among investors is an alternative
explanation to mis-governance and finding that the evidence favors a clientele effect among investors.
These findings contribute to the broader literature on governance and executive compensation by
focusing on financial firms, where these issues are now recognized as especially important due to the
systemic risk the sector poses to the economy, and by offering empirical evidence that speculative
activity influences compensation and short-term risk-taking. A large literature already focuses on
whether value and risk-taking are related to shareholder rights and managerial rent-extraction (Bebchuk,
Fried and Walker, 2002; Bebchuk, Cohen and Ferrell, 2009; Gompers, Ishii and Metrick, 2003; and
Yermack, 1996, among many). Additionally, we also contribute to the literature on compensation and
performance (e.g., Edmans, Gabaix, and Landier, 2009; Kaplan, 2008) and particular components of
compensation such as bonuses contribute to short-termism (e.g., Bergstresser and Philippon, 2006;
Healy, 1985; Burns and Kedia, 2006; and Murphy, 1999).

9
III. Data and Definitions
A. Classifying Financial Firms
We start with the CRSP Monthly Stock File, 1992-2008. We limit our analysis to financial
firms, which we divide into three groups. We first construct a group of primary dealers by hand-
matching a historical list from the Federal Reserve Bank of New York with PERMCOs from our CRSP
file. When a primary dealer is a subsidiary of a larger bank holding company in CRSP, we group the
bank holding company with the primary dealers.
We then use SIC codes obtained from a current list of SIC classifications on the OSHA website
to classify firms into a second group of banks, lenders, and bank-holding companies which do not have
primary dealer subsidiaries. This group comprises firms from SIC 60 commercial banks, SIC 61 non-
deposit lenders, and SIC 6712 bank holding companies. Our third and last group of financial firms are
insurers from SIC 6331 (fire, marine and casualty insurance) and SIC 6351 (surety insurance). This
group of insurers contains firms such as AIG and monoline insurers such as MBIA.
Our data on SIC codes comes from CRSP. However, a number of the SIC codes obtained from
CRSP do not exactly match the SIC classification, particularly for bank holding companies. For
example, Countrywide (PERMCO 796) and AMBAC Financial (PERMCO 29052) have SIC 6711 and
6719, respectively. We worry that we might have omitted some financial firms. Hence, we supplement
this list by hand collecting additional financial firms from the more expansive three-digit SIC codes of
670 and 671 and then looking at company description via 10-K statements on EDGAR. Similarly, we
conduct a similar check for three-digit SIC codes 633 and 635. Finally, we hand check all the firms on
our list to make sure we have not included any non-financials. We also exclude Fannie Mae, Freddie
Mac, and Sallie Mae from our analysis.
We then link the CRSP monthly returns of these financial firms to their accounting data using the
CRSP-COMPUSTAT Quarterly file. Then we link this merged database with ExecuComp database to
retrieve their executive compensation data. Our baseline sample of financial firms has to have data from
all three of these databases.4
B. Variables
4 For comparability with Fahlenbrach and Stulz (2009), we replicate our sample construction procedure to pick out firms at the end of 2006. Our procedure picks out 95 out of 98 of their firms and includes several financial firms they have excluded.
10
The construction of our variables is as follows. We compute our residual compensation measure
as follows. We first average total compensation (including bonus, salary, equity and option grants, and
other direct annual compensation) across the top five most highly paid executives at each firm. We
aggregate across all forms of direct compensation because it is a less noisy measure of short-term pay
practices than looking at particular components. Indeed, some authors such as Michael Jensen argue that
option grants are just a cost-efficient way to pay bonuses and a large literature (Murphy, 2000; Hall and
Murphy, 2003) convincingly shows that both bonus and option grants motivate short-termist behavior.
Then we regress (cross-sectionally) total compensation on two control variables. The first is firm size
since it is well known that the best personnel work for the biggest firms (Gabaix and Landier, 2008;
Murphy, 1999). The second is heterogeneity in sub-industry classifications among financial firms
(which we break into three categories: primary dealers, banks, lenders and bank-holding companies, and
insurance companies) since primary dealers and banks may have different compensation practices than
insurance companies.5
Our baseline measure of executive compensation is total direct compensation TDC1 from
ExecuComp (Salary + Bonus + Value of Option Grants + Other Annual Compensation + Restricted
Stock Grants + Long-term Incentive Payouts + All Other Compensation), averaged across the top five
executives at the firm. Specifically, we measure top 5 executive compensation as the average
compensation of the top 5 most highly paid executives (by TDC1), always including the CEO and CFO
when available.6 We exclude pay in years associated with IPOs since pay during those periods often
involve one-time startup stock grants that are less relevant for our hypotheses. For firm variables that
overlap between CRSP and COMPUSTAT, we take the CRSP value. We compute Market
Capitalization in a year as shares outstanding (SHROUT) times price (PRC) on December 31 of that
year. The market-to-book ratio is Market Capitalization divided by book equity (stockholders equity
plus deferred taxes and investment tax credits, less the book value of preferred stock, from
COMPUSTAT).
5 Murphy (1999) documents that there is substantial heterogeneity in how pay scales with size across non-financial industries. We view our three groups as a rough split among firms that engage in investment banking and intensive trading activity, other banks that operate more as commercial banks and lenders, and, finally, financial insurers. 6 We employ this procedure because firms occasionally report the compensation of more than five people. Occasionally, firms report compensation of fewer than five people as well. Because firms who report less than five executives may not be strictly comparable to firms who report compensation of the top five (the vast majority of the sample), we also re-do our analysis using top 5 compensation only when five executives report compensation. Results are very similar.

11
We compute six measures of risk-taking and stock-price performance: 1) the beta of the firm’s
stock, 2) the firm’s stock return volatility, 3) the correlation of a firm’s daily stock returns with returns
to the ABX AAA index (ABX Exposure), 4) the cumulative return to the firm’s stock, 5) a firm’s
balance sheet holdings of non-agency mortgage backed securities (MBS Exposure), and 6) book
leverage. We follow Adrian and Shin (2009) who analyze the leverage characteristics of investment
banks by computing leverage as the ratio of book assets (ATQ) to book equity (SEQQ).
We compute a firm’s Market Beta and Return Volatility for a given period (1995-2000 in the
early period or 2001-2008 in the late period) using the CRSP Daily Returns File, and take our market
return to be the CRSP Value-Weighted Index return (including dividends). Our data on the risk-free
return comes from Ken French’s website. In computing betas and volatility, we require at least one
year’s worth of observations (252 trading days) in that period. We compute each firm’s cumulative
compounded return in a given period and subtract it from the cumulative compounded return of the
market to obtain each firm’s Cumulative Excess Return for that period. We follow Shumway (1997) in
our treatment of delisting returns.
We use the on-the-run ABX daily price index obtained from Barclays Capital Live7 to compute a
firm’s ABX Exposure. Following Longstaff (2010), we compute the ABX return as the log of the time-t
price divided by the time t-1 price, where we ignore the coupon rates of each tranche (i.e. like Longstaff,
we are assuming a coupon yield of zero). We compute a firm’s exposure to the AAA tranche by
regressing returns obtained from the CRSP Daily Returns File on returns to the ABX AAA and returns
to the market (defined as the CRSP Value-Weighted Index return, including dividends) for each firm
from 2006 (when the ABX was created) through the end of 2008. We take the coefficient on ABX
returns as the firm’s exposure to the ABX. Importantly, we also compute an average price-based risk
score measure that is an equal-weighted average of the standardized z-scores of market beta, return
volatility and, in the late period, the firm’s exposure to ABX. As we will show below, the risk measures
are noisy and hence averaging them provides a cleaner measure of firm risk-taking. This price-based
risk score is our main dependent variable of interest.8
7 Barclays Capital Live, formerly known as Lehman Live, is available at http://live.barcap.com/ . The ABX indices are compiled and maintained by MarkIt, at http://www.markit.com/ . Longstaff (2010) provides a discussion of the index. 8 Our price-based risk score is motivated by a principal components analysis of Market Beta, Return Volatility and Exposure to ABX. The first principal component explains over 70% of the variation in the three measures and has loadings very close to an equal-weighted average.

12
We obtain data on exposure to mortgage-backed securities (MBS) from the consolidated
financial statements of bank holding companies (Form FR Y-9C), available electronically from the
Federal Reserve Bank of Chicago. We define MBS exposure as total holdings of mortgage-backed
securities not issued or guaranteed by government-sponsored entities (FNMA, GNMA and FHLMC),
divided by total balance sheet size (BHCK2170). We include both pass-through securities
(BHCK1710+BHCK1713) and non-pass-through securities (BHCK1734+BHCK1736) such as
collateralized mortgage obligations (CMOs) and real-estate mortgage investment conduits (REMICs),
and include holdings on the trading-side of the balance sheet (BHCK3536 on Schedule HC-D) as well as
the securities balance sheet (aforementioned variables, on Schedule HC-B). We focus on non-GSE
guaranteed mortgage-backed securities in order to focus attention on the riskiest securities such as
subprime. We also create an analogous book based risk score measure that is the average of the
standardized z-scores of Exposure to MBS and Book Leverage.
Our baseline computations relate total compensation to risk-taking. In extended results, we will
also utilize insider ownership, which we measure as the number of shares plus the delta-weighted
number of options owned by the top five executives divided by shares outstanding, as a noisy proxy for
long-term compensation.9 We compute the delta-weights on the options using the Core and Guay
(1999) methodology.10
We also relate these measures of risk-taking and stock price performance to measures of
governance. We obtain from RiskMetrics data on corporate governance including the G index
(Gompers, Ishii and Metrick, 2003), percentage of directors that are outsiders (classified as
“Independent” by RiskMetrics), and the board size. Since the RiskMetrics data on directors goes back
to 1997, we have data on board size and independence only for our late period. We obtain data on the
Entrenchment Index (Bebchuk, Cohen and Ferrell, 2009) from Lucian Bebchuk’s website. For our
measure of speculative activity, we use monthly stock turnover data from CRSP and compute the
average 36-month stock turnover (VOL*100 / SHROUT*1000) for each period.
9 Here we follow papers such as Jensen and Murphy (1990) and Himmelberg, Hubbard and Palia (1999) in using effective percentage ownership as a measure of incentives. In results not reported, we use the market value of insider equity as our measure of insider ownership (Baker and Hall, 2004; Hall and Liebman, 1998) and find a positive relationship between the value of equity holdings and risk-taking. However, this finding is driven by the well-known fact that market value of equity scales increasingly with size: the positive relationship disappears after including a control for market capitalization. Edmans, Gabaix and Landier (2009) suggest scaling the dollar stake measure by total compensation to obtain a size-neutral proxy for how incentives appropriately scale with size. Our results on residual pay are robust to using any of these three measures. 10 Following Bergstresser and Phillipon (2006), we also run our results assuming a delta of 1 and 0.75 across all options and find qualitatively identical results.

13
We obtain data on institutional ownership from the Thomson Reuters S34 database, which
captures 13F filings by financial institutions electronically. We match 8-digit CUSIPs in Thomson to
PERMNOs in CRSP, noting that the CUSIPs in Thomson are provided for the filing date (not the
reporting date). For each PERMNO, we divide the shares held by each financial institution (SHARES)
by the shares outstanding (as reported by Thomson in SHROUT1 before 1999 and SHROUT2 after
1999) and sum up over each stock. We take care to ensure that holdings and shares outstanding both
reflect stock splits when necessary.11 We censor the percentage of shares held by institutions at 1 for a
few observations.
Lastly, we winsorize all variables except for our compensation variables and Market
Capitalization at their 1% and 99% values. We do not winsorize the G Index, E Index, board size or the
percentage of directors that are outsiders, since these are based on well-behaved count-data.
IV. Results
Our goal is to relate differences in risk-taking across finance firms to cross-sectional
heterogeneity in their compensation. To this end, we split our sample into two periods—an early period
defined as 1992 (when we start having reasonable executive compensation data) up to 2000, which
marks the end of the dot-com era and a late from 2001-2008 which marks the beginning and end of the
housing boom. We then take 1992-1994 (1998-2000) to create a ranking of executive compensation
among firms at the beginning of the early period.12 As we mentioned earlier, in our comparison of firm
compensation practices, it is important to control for two things. The first is firm size since it is well
known that better personnel work for bigger firms (Gabaix and Landier, 2008; Murphy, 1999). The
second is heterogeneity in sub-industry classifications among financial firms (described above). In other
words, we work with a residual compensation measure in which we take the residual from a cross-
sectional regression of compensation on firm size and sub-industry classifications.
11 We always divide shares held by the Thomson-provided value of shares outstanding rather than the CRSP value of shares outstanding to avoid mis-computing institutional ownership due to misalignments between when Thomson and CRSP report splits. When Thomson reports multiple filings, we always take the first filing, which corrects for the fact that shares outstanding may have changed by a later filing. There is one instance where Thomson’s value of shares outstanding (SHROUT2) does not make any sense, for Independence Community Bank (PERMNO 85876) in 1998Q3. Here we replace that value with the CRSP value of shares outstanding. 12 If a firm reports compensation for less than the full three years inside the ranking window, we take the average of the available data. Note that we are averaging (over time) top 5 executive compensation, which is itself an average. We employ this procedure because there is noise in ExecuComp. For example, if a CEO serves less than a full year, pay will be smaller for that year. Additionally, ExecuComp sometimes fails to report data on all top five executives as reported in their proxy statement, and taking the three-year average smoothes this.

14
Ideally, we would like to control for heterogeneity by allowing both slopes and intercepts to vary
across sub-industries. Unfortunately, the limited number of primary dealers per year does not allow us
to form reliable estimates of the slope and intercept within that group.13 Instead, we take the log of
average executive compensation in 1992-1994 (1998-2000 for the crisis-period) and regress it on the log
of firms’ market capitalization in 1994 (2000 for the crisis-period), allowing intercepts to vary by sub-
industry and allowing the insurers group to have a slope distinct from banks and primary dealers.14 This
specification allows for heterogeneity in the levels of pay across sub-industries and for an insurer-
specific slope (where we have enough observations to form a reliable estimate).
With these residual pay estimates in hand, we track the risk-taking of these firms from 1995-
2000 and 2001-2008, respectively. Specifically, using data from 1995-2000, we calculate various risk-
taking measures including firm beta, return volatility, average holdings of non-GSE backed mortgage-
backed securities, and average book leverage. We also form a price-based risk score based on equal-
weighted z-scores of firm beta and return volatility and a book-based risk score based on holdings of
non-GSE backed mortgage-backed securities and book leverage. We then regress these risk-taking
measures on our lagged residual CEO compensation (from 1992-1994) measure along with other firm
characteristics. We also regress the cumulative return performance of each firm on lagged residual
compensation to look at which firms have extreme performance. Similarly, we calculate risk-taking
measures and return outcomes for the period of 2001-2008 and regress these on our residual
compensation measures constructed from 1998-2000. During the late period, we can also compute the
sensitivity of a firm’s stock price to the ABX subprime index and include this in the price-based risk
score.
Our final data set comprises two cross-sections: the first containing data on pay of 153 firms (15
primary dealers, 113 banks, 25 insurers) in 1992-1994 and their risk-taking activity in 1995-2000, and
the second containing data on pay of 152 firms (11 primary dealers, 106 banks, 35 insurers) in 1998-
2000 and their risk-taking in 2001-2008, with 79 firms reporting in both periods.
13 In particular, the estimate of the slope of compensation and market capitalization fluctuates depending on the year in which the regression is run due to changes in the composition of the primary dealer group. Consistent with this, running a regression that allows for slopes and intercepts to vary across all sub-industries yields a large standard error on the slope for primary dealers. 14 We have also regressed the average compensation on not just 1994 log market capitalization but the average of the market capitalizations from 1992-1994 and obtain similar results.

15
Table 1 and Table 1 (cont) report summary statistics for log compensation, risk-taking measures
and various firm characteristics for our two periods. The figures are similar to those reported in other
studies. A couple of comments are helpful here. Since compensation and market capitalization do not
scale linearly, we find it convenient to work with log compensation and log market capitalization. For
convenience, we report here the raw compensation figures. The mean (median) executive compensation
in 1992-1994 was $1.39M ($762K) with a standard deviation of $1.77M. In the 1998-2000 sample, the
mean (median) executive compensation was $3.72M ($1.63M) with a standard deviation of $6.31M.
Mean (median) firm market capitalization was $2.79B ($1.18B) with a standard deviation of $4.27B in
1994, and was $13.0B ($3.03B) with a standard deviation of $31.0B in 2000. Our sample encompasses
a broad-cross-section of finance. It includes the top investment banks, commercial banks, and insurers
in both the early and late periods (Bear Stearns, Citigroup/Travelers, AIG, etc.), as well as smaller firms.
A. Heterogeneity in Compensation Practices
We first document that there is substantial cross-sectional heterogeneity in executive
compensation controlling for firm size and finance sub-industry classifications. The formal regression
results are presented in Panel A of Table 2. The first column shows the results for the early period and
the second shows the results for the late period. Notice in the early period that the coefficient in front of
Log Market Capitalization is positive (0.47) and very statistically significant. The coefficient in front of
the insurer specific slope is -0.31 and also significant, indicating that insurer pay increases less quickly
with firm size then for primary dealers and banks. The average level of pay also differs somewhat
across these three groups, with primary dealers having the highest pay on average. The relationship is
economically significant with an R-square above 0.6. The results for the late period in the second
column are qualitatively similar.15
Figure 1 plots the observations along with the fitted values from the regressions in Panel A of
Table 2. Each panel plots the log of average total compensation among executives in each ranking
period against log market capitalization, and highlights the relationship for our three groups. For
example, Panel A plots, for the early period, the log of executive compensation during 1992-1994
against market capitalization at the end of 1994, with three lines representing the linear fit of size to
15 In all specifications reported in this paper, heteroskedasticity is an a priori major concern since we suspect substantial heterogeneity among banks, insurers, and primary dealers. We use HC3 standard errors which are robust to heteroskedasticity but have much better small-sample properties than the usual Huber-White sandwich estimator, as documented in MacKinnon and White (1985) and Long and Ervin (2000).
16
compensation for our three sub-industries. A quick eyeball of the figure suggests that there is indeed a
strong linear relationship between log total compensation and log market capitalization, with primary
dealers having a higher-than-average level of pay relative to banks and insurers and insurers having a
lower pay-size slope compared to primary dealers and banks. Panel B of Figure 2 plots the results for
the late period. Notice that the two figures are fairly similar. This is not a coincidence as the residual
pays from these two periods are quite correlated, as we show below.
Panel B of Table 2 gives summary statistics for log compensation and log market capitalization
by sub-industry and period. Together with the regression results from Panel A of Table 2, we can
calculate the economic significance of the findings. For example, a one-standard deviation increase in
log market capitalization is associated with a 0.76-standard deviation increase in total compensation in
the early period among banks and bank holding companies. (A one-standard deviation increase in log
market capitalization in the early period for banks is associated with a 1.0850 [1 SD] x 0.4712 [slope] =
0.5112 increase in log pay, which is 0.5112 / 0.6725 = 0.76-standard deviations of log pay for banks.)
Given our small sample size and the fact that we have statistical significance, it is not surprising that the
implied economic significance from our regression in Panel A of Table 2 is quite large. More
interestingly, the residual compensation measures obtained from this regression are highly correlated
across the two sub-samples, as shown in Panel C. The correlation between residual compensation in the
two periods is 0.69 with a p-value of zero.
Table 3 lists quintile rankings of residual executive compensation (ranked within each sub-
industry) for firms prominent in the financial crisis. High residual compensation firms include Bear
Stearns, Citigroup, Countrywide, and AIG, and they tend to be high residual compensation firms even as
far back as the 1992-1994 ranking period. We emphasize this point because we believe this suggests our
residual compensation measure is a noisy proxy for firm-specific compensation practices.
To analyze this point further, we examine whether CEO turnover and stock price performance
drive changes in the residual compensation measures. The idea is that if these variables do not drive
changes in residual compensation then it is suggestive of something more fundamental about the culture
or technology of the firm. Panel A of Table 4 presents the results of an exercise where we regress
quintile rankings of residual compensation in the late period on quintile rankings of residual
compensation in the early period, cumulative returns in between the two periods (1995-1997), and
whether there was any CEO turnover in between the two periods. The first column shows that the 1992-
1994 quintile ranking is significant at the 1% level and explains 24.8% of the variance of 1998-2000
17
quintile rankings. The second column shows that introducing returns and CEO turnover between the
two periods leads to an R-squared of 26.4%. Both coefficients are statistically insignificant. Good past
price performance leads a firm to have slightly higher residual compensation in the late period and CEO
turnover leads to lower residual compensation, but the bulk of explanatory power for what a firm’s
residual compensation ranking is in the late period is provided by the ranking in the early period. Since
the theoretical directional effect of CEO turnover on rankings is unclear, in the third column, we regress
the absolute value of changes in rankings on an indicator for whether there was any CEO turnover in
1995-1997, and find a statistically insignificant coefficient of 0.08. We repeat this exercise to analyze
whether movements in and out of the highest quintile and lowest quintile are driven by returns and
turnover in Panel B and find no significant relationship.
Panel C repeats this exercise for raw residual compensation (not quintile rankings) and finds that
the coefficient on early period compensation is 0.84; returns and CEO turnover are both statistically
insignificant and provide almost no additional R-squared. We conclude that CEO turnover and stock
price performance have weak explanatory power for changes in rankings and that the bulk of
explanatory power is provided by past rankings. The economic significance of stock price performance
and CEO turnover in the interim are negligible. We note finally that a Breusch-Pagan-Godfrey test of
serial correlation in the residual compensation between the two periods rejects the null hypothesis of no
serial correlation with a p-value of zero.16 As such, we interpret our residual compensation measure as
being largely a firm fixed-effect and that there is a substantial cross-sectional variation in this residual
compensation measure.
Finally, because we are concerned that sample attrition between our early and late ranking
periods may be driving our results, we examine whether there are systematic differences between the 73
firms who are not present in both 1992-1994 and 1998-2000 samples and the 79 that are present in both.
First, we examine whether persistence among firms that are present in 1992-1994 and 1995-1997 but not
in 1998-2000 (there are 33 such firms) is different than persistence for firms that survive through 2000.17
We regress 1995-1997 residual compensation as the dependent variable on 1992-1994 residual
compensation and include an interaction with an indicator for whether a firm subsequently drops out.
We find no statistical evidence that persistence for dropouts is different than persistence for survivors: in
16 This holds regardless of whether standard-errors are clustered at the firm level or if standard errors robust to small-sample bias such as the HC3 standard error are used. 17 The remaining 40 firms in the 1998-2000 sample first appear in ExecuComp after 1994.

18
fact, the point estimate on 1992-1994 residual compensation is even higher for the 33 firms who
subsequently drop out than for those that survive, although the difference is not statistically significant.
Second, we look at CRSP delisting codes for these firms that do not survive and find that mergers
account for many of the firms that drop out. Since targets are typically smaller firms, we examine
whether there is a size bias in our results by dropping the bottom 25% of firms by market capitalization
in both the 1992-1994 and 1998-2000 samples and repeating our analysis. We find that our estimates of
persistence are if anything higher and our results on risk-taking below are virtually unchanged. We
conclude that attrition between the two samples is not driving our persistence results.
B. Compensation and Risk-Taking
We now analyze the relationship between our residual compensation measure and risk-taking
and find that residual compensation and subsequent risk-taking are strongly correlated in both sub-
samples. We start with our price-based measures. Our first set of findings is that firms with high
executive compensation have a higher CAPM beta, higher return volatility and higher ABX exposure.
Figure 2 demonstrate the results of predictive regressions where we compute beta, volatility and
ABX exposure and regress this on residual compensation in 1992-1994 (1998-2000). The formal
regressions are in Table 5, Panel A. We start our discussion with market beta (see Figure 2(a)-(b)). A
one-standard deviation increase in residual pay in the late period is associated with a 0.1317 increase in
beta (0.6428 [1 SD of residual pay] x 0.2049 [slope] = 0.1317), which is 0.40-standard deviations
(0.1317/0.3312 [1 SD of beta] = 0.40). For the early period, this number is 0.32 standard deviations.
Both estimates are economically and statistically significant.
We next consider return volatility (see Figure 2(c)-(d)). Here, a one-standard deviation increase
in residual pay in the late period is associated with an 8.23% increase in annualized volatility (0.6428 [1
SD of residual pay] x 0.1280 [slope] = 0.0823), which is 0.32-standard deviations (0.0823 / 0.2550 [1
SD of volatility] = 0.32). In the early period, this association is 0.36-standard deviations. Again, both
estimates are economically and statistically significant.
Since a portion of financial firms’ exposure to the subprime market operated through off-balance
sheet vehicles, we next consider our ABX exposure measure, which is market-based and should more
sharply capture the large risks that banks took than balance-sheet measures (see Figure 2(e)). Off-
loading risky assets into structured investment vehicles (SIVs), which finance the purchase of these
assets using short-term paper, did not off-load the risk from the sponsoring firms themselves.
19
Sponsoring firms often retained risk by granting “liquidity backstops” or credit lines to these vehicles, to
be drawn in case these SIV’s could not continue to finance themselves in the market. This is exactly
what happened, bringing enormous losses to the sponsoring firms (Brunnermeier, 2009).
Indeed, high residual compensation in 1998-2000 predicts high exposure to subprime in 2006-
2008 with a p-value of 0.012 on the slope of residual compensation. In economic terms, a one standard
deviation increase in residual compensation leads to a 0.40-standard deviation increase in ABX exposure
(0.6428 [1 SD of residual pay] x 0.1541 [slope] / 0.2483 [1 SD of ABX exposure] = 0.40). The figure
also reveals that firms prominent in the crisis and most exposed to subprime, such as Bear Stearns
(BSC), Lehman Brothers (LEH) and AIG (AIG), were high residual compensation firms in 1998-2000.
Compensation also picks out a number of other firms who had high exposure to subprime – Hartford
Financial (HIG), an insurer who received $3.4 billion in TARP money, is a high compensation firm, as
is Fremont General (FMT).18
We also consider an average price risk score measure which puts equal weight on the
standardized versions of market beta, return volatility and (when available) ABX exposure (see Figure
(f)-(g)). Here, we actually find that our results are even stronger when we use this average price risk
measure. Notice that the t-statistics are higher in each case and the economic significances are at least
as high as when we consider the risk measures separately. For example, a 1-SD increase in residual
comp is associated with a 0.49-SD increase in the price-based risk score in the late period (0.6428 [1 SD
of residual pay] x 0.6477 [slope] / 0.8467 [1 SD of the risk score]); the analogous number for the early
period is 0.41-SDs. This suggests that our individual risk measures, even though they are individually
significant, are nonetheless noisy and that this combined measure is a cleaner way to measure firm risk
taking.19 We will focus on this measure in the remaining paper.
We next consider how the cumulative returns of these firms are related to their compensation
practices. The idea is that high residual compensation firms are more likely to be in the tails of
performance, with extreme good performance pre-crisis when the market did well and extreme poor
performance during the crisis period when the market did poorly. The results are presented in Figure
(h)-(i) with the corresponding regressions in Panel B of Table 5. The results on cumulative returns are
18 Fremont General was a relatively small California bank that nevertheless managed to originate a significant volume of subprime mortgages nationally and did not stop doing so until faced with a likely cease and desist order from the FDIC in 2007. Afterwards, Fremont General became embroiled in lawsuits alleging predatory lending. 19 In particular, our results are not being driven by only the ABX, which is only available in 2006-2008. If we use a price-based risk-score based on only beta and return volatility we find remarkably similar results.

20
striking – residual compensation strongly predicts cross-sectional differences in subsequent cumulative
performance. For example, for the crisis period, a one-standard deviation increase in residual
compensation predicts a 24% decrease in returns (0.6428 [1 SD of residual pay] x -0.3722 [slope] = -
0.24), which is a 0.28-standard deviation decrease in returns in the cross-section (0.24/0.8423 [1 SD of
cumulative returns] = 0.28). In contrast, in the early period, a one-standard deviation increase in
residual compensation predicts a 54% increase in returns (0.4898 [1 SD of residual pay] x 1.1002
[slope] = 0.58), or a 0.28-standard deviation increase (0.54/1.946 [1 SD of cumulative returns] = 0.28).
Given the persistence of residual compensation, the results show that aggressive firms that were
yesterday’s heroes when the stock market did well can easily be today’s outcasts when fortunes reverse.
Bear Stearns (BSC), Citigroup/Travelers (C/TRV), and AIG (AIG) are prime examples. In other words,
there is substantial heterogeneity in financial firms in which high compensation, high risk-taking and tail
performance go hand in hand. In particular, it is important to note that this link between compensation
and risk-taking (as measured by beta, volatility, ABX exposure and returns) persists in both periods,
even before the crisis. This suggests that the persistent effect picked up by our residual compensation
measure is consistently linked to risk-taking over time.
We continue with our risk-taking analysis in Figure 2 (cont) where we also look at balance-sheet
based measures by examining holdings of non-GSE-backed MBS (as a percentage of balance sheet size)
and book leverage and their relationship with residual compensation. Figure 2 (cont) (j)-(k) and Table 5
Panel C report that holdings of non-GSE backed MBS are associated with residual compensation. As
mentioned before, these mortgage-backed securities included substantial pools of risky mortgages such
as subprime and Alt-A. High residual compensation in 1998-2000 predicts higher holdings of non-GSE
MBS in 2001-2008 (though it not statistically significant). The results imply that a one-standard
deviation increase in residual compensation is associated with a 0.15-standard deviation increase in risky
MBS holdings (0.6428 [1 SD of residual pay] x 0.0079 [slope] / 0.0344 [1 SD of MBS exposure] =
0.15). In the early period, we find less than half of that relation. Since the non-GSE backed MBS
market did not become substantially risky until the early 2000’s, when the growth in subprime lending
led to a boom in the non-GSE MBS market (Keys et al., 2009; Chomsisengphet and Pennington-Cross,
2006), we actually view this non-result in the early period as consistent with our hypothesis.
Table 5 (l)-(m) of Figure 2 (cont) and show the results for book leverage. In both periods, we
find a positive but statistically insignificant relationship. As mentioned, we are not surprised that only
the price based measures come in significantly since the book based measure are likely to miss most of
21
what is interesting when it comes to creative risk taking. As such, we will only consider price based risk
measures in the remaining portion of this paper.
In Table 6, we repeat our analysis relating risk-taking in 1995-2000 (2001-2008) to residual
compensation in 1992-1994 (1998-2000), where we successively drop different groups of financial firms
in our analysis to see how our results vary across different sub-industries. We focus on the price risk
measure since this is our least noisy measure of risk taking. First, we exclude the primary dealers from
our analysis and find consistent results across all our measures of risk-taking. Second, because we are
also concerned that the results may be driven by the insurance companies, we repeat the analysis
dropping insurers. Again, the results are similar. Finally, we run our results using only banks and bank
holding companies, excluding both insurers and the primary dealers. Although statistical significance is
a bit more limited for individual risk-taking measures (not surprising given that we are losing 25-30% of
our sample), our findings are still economically and statistically significant for the price-based risk-
taking measure, which aggregates information from the Market Beta, Return Volatility, and Exposure to
ABX. So our results are not just due to primary dealers, though the results are stronger when primary
dealers are included. This is not surprising, since these firms have more discretion to take risks (e.g.,
Bear Stearns and Citigroup). Moreover, in results not reported, the correlation between risk taking
measures and residual compensation is primarily a compositional effect in that changes in the risk-taking
measures are uncorrelated with changes in the residual compensation measure. This drives home again
the point that we are dealing with permanent cross-firm differences.
C. Robustness Checks
In Table 7, we perform a series of additional robustness checks of the above findings. First, we
re-do our analysis by calculating residual compensation using book asset values rather than market value
on the idea that asset values are more exogenous than firm size and that book asset values will reflect
both debt plus equity. This is reported in the first row. We report only the coefficient in front of
residual compensation both for the early and late period for each of the risk-taking measures, which are
given by the columns. The results are very similar to the ones before.
One may worry that residual compensation is simply a proxy for book leverage. Our results
indicating a low correlation between residual compensation and book leverage suggest this is not the
case, but we present more formal analysis in the second row of Table 7. Controlling for size and book
leverage does not significantly affect our results. To further examine this hypothesis, in results not
reported, we also include leverage on the right-hand side when computing residual compensation in the

22
first-stage and find that including leverage only marginally improves the fit between compensation and
size and does not affect our risk-taking results. In sum, our price-based risk-taking measures are not
driven by differences in book leverage.
Third, we exclude the CEO’s pay when computing our residual compensation measure and find
nearly identical results.20 Even after excluding the CEO, a one-standard deviation increase in residual
compensation is associated with a 0.48-standard deviation increase in average price risk score exposure
when using non-CEO compensation (0.6321 [1 SD of non-CEO residual pay] x 0.6372 [slope] / 0.8467
[1 SD of price-based risk] = 0.48). While ideally we would have data on compensation of other
employees at financial firms (e.g., traders), whether our result would flip if we had such data on non-
executive employees depends on whether the relative ranking order of average pay would change
substantially if we measured pay of employees lower down rather than executives. It seems a
reasonable conjecture that Bear Stearns, for example, would be in the highest quintile of payers relative
to its peers even when measuring non-executive pay. Either way, the persistence in residual
compensation and the positive association between non-CEO executive compensation and risk-taking
suggest that residual compensation is more indicative of an overall firm effect such as culture.
Fourth, we do the same exercises for manufacturing industries as an out-of-sample check since
the theory of short-termism and risk-taking should apply to non-financial industries as well. However,
one might expect these effects to be stronger for finance firms where risk is a much bigger deal, except
for our book-based risk score (which for manufacturing is simply book leverage). We find elements of
this from the results reported in the fourth row, where relationship between residual compensation and
our book-based risk-measure is statistically significant for manufacturing. Moreover, the economic
significance of the price-based risk score is much lower for manufacturing compared to finance, at 0.09-
SDs per 1-SD of residual compensation in the early period and 0.19-SDs in the late period (the
comparable numbers for finance are 0.41 and 0.49-SDs, respectively). In particular, residual
compensation has no statistical or economic explanatory power for ABX exposure among
manufacturing firms, which is also a good check that our ABX exposure results are not spurious.
Fifth, we run a pooled regression version of our analysis. More specifically, rather than just
running two cross-sectional regressions, an early period and a late period, we do the following exercise.
20 For these results, we focus only on the subsample of firms which identify a CEO through the CEOANN variable in ExecuComp (a few firms do not identify a CEO). We take the average compensation of the remaining executives (up to four) as our measure of non-CEO executive compensation.

23
For each year in 1995-2008, we calculate our individual risk measures (Beta, Return Volatility,
Exposure to ABX, Exposure to MBS, Book Leverage) at an annual frequency and use this to construct
an annual price-based risk score and book-based risk score. We include the Exposure to ABX only in
2007 and 2008 when computing the price-based-risk score. We then run a pooled regression of each
year’s risk-taking measure on lagged residual pay, which we calculate using the previous three years
worth of compensation data. The results are both statistically significant, with much larger economic
magnitudes for the price-based score compared to the book-based score. One standard deviation of
residual compensation is associated with 0.33-SDs of our price-based risk score in the following year
(0.6240 [1 SD of residual compensation in the pooled sample] * 0.4625 [slope] / 0.8736 [1 SD of price-
based risk-score]), while the relationship is only 0.18-SDs using the book-based risk score (0.6240 [1
SD of residual compensation in the pooled sample] * 0.2078 [slope] / 0.7353 [1 SD of book-based risk-
score]). The bulk of the analysis tells us that our results are not an artifact of how we cut the sub-periods
in our analysis.
D. Is it Short-Termism?
We investigate whether our residual pay measure is related to short-termist incentives in two
ways. First, in Table 8, we look at the different components of pay and find that both bonuses and
equity compensation are correlated with risk-taking, consistent with earlier empirical literature which
finds that bonuses and equity compensation motivate short-term behavior.21 Although statistical
significance in this exercise is more limited, and thus we use caution in interpreting our results, we find
that, consistent with concerns about bonuses and risk-taking, a one-standard deviation increase in
(residual) bonuses in 1998-2000 is associated with 0.21-SD increase in the price-based risk score
(0.9369 [1-SD of residual bonus] x 0.1858 [slope] / 0.8467 [1-SD of price-based risk]), corroborating
anecdotal evidence that short-termist bonus schemes are related to risk-taking.
In Table 9, we examine the hypothesis of short-term compensation explicitly by regressing risk-
taking of firms on compensation while controlling for insider ownership on the presumption that insider
ownership is a proxy for long-term incentives. If indeed compensation is capturing long-term pay
incentives (as opposed to short-term pay as we suspect), then having insider ownership should mute our
results and we should also expect insider ownership to predict risk-taking with the same sign as
21 For these results which focus on components of pay, we always use the same list of top 5 executives as we used in constructing our baseline residual compensation measure.

24
compensation. We measure insider ownership by the average percentage of shares held by the top 5 five
executives in 1992-1994 and 1998-2000 in the early and late periods, respectively.
Our baseline findings on compensation remain even after controlling for insider ownership. Our
point estimates on the association between residual compensation and our average price risk score are
remarkably similar, and the statistical and economic significance are also of similar magnitudes. We
find some evidence that insider ownership tends to mitigate risk-taking. Importantly, higher insider
ownership was qualitatively associated with higher returns in both periods, reinforcing the view that
compensation provided short-term incentives while insider ownership provided long-term incentives.
Although the effect is not statistically significant, in economic terms, a one-standard deviation increase
in 1998-2000 insider ownership is associated with a 0.20-standard deviation increase in buy-and-hold
returns in 2001-2008 ([0.0778 [1 SD of insider ownership] x 2.1423 [slope] / 0.8423 [1 SD of
cumulative returns] = 0.20), or 16.7-percentage points. Because we are concerned about how insider
ownership scales with firm size, we introduce an additional control for market capitalization and find
effects of similar statistical significance and economic magnitude (not reported). Another concern is
that the percentage of shares held does not appropriately capture explicit pay-for-performance incentives
(Hall and Liebman, 1998). Alternatively, we measure insider ownership using the dollar stake (as in
Fahlenbrach as Stulz, 2009) and we find no significant effect from ownership when including a size
control. Importantly, residual compensation predicts risk-taking regardless of which insider ownership
measure we use. This additional evidence indicates that our risk-taking results are being driven by
short-termism.
E. Is it Mis-Governance?
In Table 10, we ask whether our results are due to mis-governance or entrenchment. We relate
our average price risk score measure with various measures of governance on the right-hand side. The
measures of governance that we examine are measures of entrenchment (Gompers, Ishii and Metrick,
2003; and Bebchuk, Cohen and Ferrell, 2009), board independence (the percentage of outside directors
on the board), and board size (Yermack, 1996). We consistently find that none of these standard
measures of governance predict risk-taking, nor are they associated with our measure of residual
compensation. Specifically, entrenchment measures do not predict risk-taking, nor, surprisingly,

25
cumulative returns in either period.22 The exception is that the E Index is negatively correlated with
price-based risk-taking in the early period. The negative correlation suggests that managers who were
more entrenched (i.e., managed firms with weaker shareholder rights) are associated with less risk-
taking.
Thus, weaker shareholder rights are not associated with high residual compensation or
subsequent risk-taking in either the early or late periods. Our results on board composition and board
size reinforce this non-correlation result – neither is statistically correlated with residual compensation
or risk. The economic significance of board composition is also not significant: a one-standard
deviation (16-percent) increase in the percentage of outsiders on a board (the mean is 64% in the late
period) is actually associated with a 0.11-standard deviation increase in price risk exposure (0.1604 [1
SD of percentage outsiders] x 0.5816 [slope] / 0.8467 [1 SD of price-based risk] = 0.11). Overall, we
consistently find that the percentage of outsiders on the board does not predict subsequent risk-taking, or
even returns, during the late period when the crisis occurs.23
F. Is It Heterogeneous Investor Preferences?
Finally, we explore the idea derived from our quant-bubble and cowboy culture hypotheses, that
risk-taking and executive compensation may be related to heterogeneous shareholder preferences. We
consider two measures of shareholder preferences. The first is institutional ownership. Institutional
investors such as mutual funds are thought to have shorter-horizons due to agency problems. The idea
then is that these institutional investors want certain firms to take more risks and hence give them short-
term incentives to do so. The second is stock turnover. Turnover is an important proxy for speculative
activity in financial markets (Hong and Stein, 2007). Stocks with higher turnover can be thought of as
being traded by short-termist investors who are perhaps all too happy to let management incentivize
themselves to take risks.
Table 11 Panel A presents the formal regression results relating residual compensation, our
price-based risk score, and return outcomes to institutional ownership and share turnover. We start with
the institutional ownership results. Note that there is significant variation in average institutional
22 One concern may be that the entrenchment measures may not relate linearly to risk-taking. We repeat our analysis by analyzing risk-taking among “Democracy” firms (firms with G Index less than or equal to 5) and “Dictatorship” firms (firms with G Index greater than or equal to 14) and also find no relationship with risk-taking. 23 We do, however, acknowledge that there is endogeneity in board composition (Hermalin and Weisbach 1998), and that factors other than board independence such as financial expertise may be important.

26
ownership. Institutional ownership (averaged over the 12 quarters of 1992-1994 within firms and then
across firms) averaged 46% with a standard deviation of 17%; the corresponding numbers in 1998-2000
are a mean of 46% and standard deviation of 18%. The interquartile ranges were 25% and 26% in the
early and late periods, respectively. Institutional ownership is linked to residual compensation at the
1% level in the late period. In economic terms, a one-standard deviation increase in institutional
ownership is associated with a 0.29-standard deviation increase in residual compensation (0.1802 [1 SD
of institutional ownership] x 1.0353 [slope] / 0.6428 [1 SD of residual pay] = 0.29). This relationship is
even stronger in the early period, where the economic relationship is 0.35-standard deviations in residual
compensation for one standard deviation in institutional ownership (0.1684 [1 SD of institutional
ownership] x 1.0153 [slope] / 0.4898 [1 SD of residual pay] = 0.35). Institutional ownership and price-
based risk-taking scores also positively covary, with one standard deviation in institutional ownership
accounting for 0.19-standard deviations of price-based risk-taking in the late period. In terms of returns,
one standard deviation of institutional ownership is associated with 11% lower returns in the late period.
We next turn to share turnover results. We compute the average monthly stock turnover in the
36 months of 1992-1994 (1998-2000) and then relate this to residual compensation and subsequent risk-
taking in 1995-2000 (2001-2008). From the summary statistics for our measure of speculative activity
in Table 1 (cont), there is significant heterogeneity in share turnover – the mean monthly share turnover
among stocks in the 1998-2000 period was 8% with a standard deviation of 4%, ranging from 2% (the
minimum) to 23% (the maximum). Even in the early period, before the height of the dot-com bubble,
the standard deviation of monthly turnover was 4%, with a maximum of 19%. Residual compensation
and risk-taking are statistically and economically significantly related to stock turnover. In particular, a
one-standard deviation increase in average monthly stock turnover is associated with a 0.30-standard
deviation increase in residual compensation in the late period (0.0417 [1 SD of stock turnover] x 4.6843
[slope] / 0.6428 [1 SD of residual pay] = 0.30), an effect that is significant at the 5% level. There is also
positive link between share turnover and risk-taking. For instance, high share turnover in 1998-2000
predicts a high price-based risk score 2001-2008, with one standard deviation of share turnover being
associated with 0.42-standard deviations of price-based risk. Because we are concerned that we may be
introducing a scale effect in using share turnover (which is a ratio of volume over shares outstanding) as
a proxy for speculative activity, we add a control for market capitalization and find remarkably similar
results (not reported for brevity). For example, even after controlling for size, a one-standard deviation
increase in share turnover in the late period is associated with a 0.38-standard deviation increase in the

27
price-based risk score, and is significant at the 5% level. We repeat this exercise in controlling for size
in our institutional ownership regressions and also find similar results.
In results not reported here, when we run a horse race between institutional ownership and stock
turnover, institutional ownership emerges as the more significant variable, though both variables retain
the right sign. The only issue is that these two variables are highly correlated and so we might worry a
bit about multi-collinearity in interpreting such a multiple regression. In sum, broadly, the findings in
Panel A support the implication from the quant-bubble and cowboy culture story that heterogeneous
investor preferences for risk-taking play a key role in the observed correlation between residual
compensation and risk-taking.
These two hypotheses are similar in spirit but do differ in their predictions in subtle ways. For
instance, the quant-bubble story has an implication that high residual compensation firms ought to also
be high valuation firms similar to dot-com stocks. In Table 11 Panel B, we ask if it fact that high
residual compensation firms are like the growth firms of finance. One way to examine this hypothesis is
to see whether our compensation/risk-taking correlation is just due to growth options, proxied by a
firm’s market/book ratio. Under this hypothesis, market/book should be positively correlated with
subsequent risk-taking. Here we present results where we include in our regressions of risk-taking and
compensation a firm’s market/book and market capitalization at the end of each ranking period.
Importantly, our results for residual compensation still hold. In contrast, for our average price risk
measure, a firm’s market/book has limited explanatory power in comparison. The proviso in this
analysis is that market-to-book is typically a poor measure of finance firm valuations.
Broadly, the evidence supports a story where short-term investors incentivize management using
short-term incentives to take large bets on risky propositions. This alternative does not necessarily
imply that managers were fully aware of their risks. If shareholders in certain firms want their managers
to take risks they will offer appropriate contracts. Managers will also select themselves into these firms.
Ceteris paribus, these firms will end up with managers that have more tolerance for risks or that do not
fully perceive risks. As an example, one might think that Joseph Casano (of AIG FP) or Stanley O’Neal
were ideal managers for stockholders that wanted their firms to take a lot of risk.
We also stress that we do not view this hypothesis as incompatible with the hypothesis that
entrenchment is a significant problem that led to the crisis, but in light of the non-correlation between
shareholder rights and both risk-taking and price performance, at a minimum our results suggests that
further research should explore investor preferences as an alternative hypothesis to failures of

28
governance. Indeed, the following quote by Michael Lewis (2004) nicely sums up the viewpoint
derived from these findings:
”The investor cares about short-term gains in stock prices a lot more than he does about
the long-term viability of the company. Indeed, he does not seem to notice that the two
goals often conflict. … The investor, of course, likes to think of himself as a force for
honesty and transparency, but he has proved, in recent years, that he prefers a lucrative
lie to an expensive truth. And he’s very good at letting corporate management know it.”
V. Conclusion
It is worth restating again the lack of causal statements in this analysis. What this analysis points
to is that there is important heterogeneity across firms in risk-taking (i.e. Bear Stearns, Lehman and
Citigroup have been previously skating on the edge and have come close to failing before the most
recent events) and importantly, this is very correlated with persistent compensation practices that
emphasize short-term pay in the form of bonuses and options. While not causal, our analysis suggests a
beginning in terms of being able to quantify these issues and making perhaps more nuanced statements
regarding the relationship between short-term pay and risk-taking.
Our analysis further points to the role of heterogeneous shareholder preferences for short-
termism and risk-taking as an important determinant in the behavior of the firms. That is, our findings
indicate that heterogeneity of firm compensation and risk-taking behavior are not related to
entrenchment per se but sorting of investors with like preferences into these firms. Although our
analysis cannot point to whether the shareholders gave management or the firm the right level of short-
term incentives, they do point to the importance of short-term incentives or related efficiency wages in
bringing about higher levels of risk-taking. To the extent that risk-taking is difficult to measure ex-ante,
restrictions on pay may play a role in mitigating potential taxpayer losses from too-big-to-fail firms.
Our paper also suggests that deeper research into the nature of implicit incentives, peer effects,
and organizational structure might bear fruit as far as understanding risk-taking by finance firms. More
specifically, we have focused on cross-firm differences in risk-taking but one implication of our analysis
is the vital role of competition among finance firms and the extent to which competition led to excessive
risk-taking. Further work along these lines is likely to yield considerable insights.

29
References
Adams, R. (2009): “Governance and the Financial Crisis,” SSRN Paper 1398583. Adrian, Tobias, and H. S. Shin (2009): “Liquidity and Leverage,” Federal Reserve Bank of New York Staff Reports, January 2009. Baker, G. P., and B. J. Hall (2004): “CEO Incentives and Firm Size,” Journal of Labor Economics, 22(4), 767-798. Bebchuk, L., A. Cohen, and A. Ferrell (2009): “What Matters in Corporate Governance?,” Forthcoming RFS 2009. Bebchuk, L. A., J. M. Fried, and D. I. Walker (2002): “Managerial Power and Rent Extraction in the Design of Executive Compensation,” University of Chicago Law Review, 69(3), 751-846. Bergstresser, D., and T. Philippon (2006): “CEO Incentives and Earnings Management,” Journal of Financial Economics, 80(3), 511-529. Bolton, P., J. Scheinkman, and W. Xiong (2006): “Executive Compensation and Short-Termist Behaviour in Speculative Markets,” Review of Economic Studies, 73(3), 577-610. Burns, N., and S. Kedia (2006): “The Impact of Performance-Based Compensation on Misreporting,” Journal of Financial Economics, 79(1), 35-67. Brunnermeier, M. (2009): “Deciphering the Liquidity and Credit Crunch: 2007-2008,” Journal of Economic Perspectives, 23(1), 77-100. Chomsisengphet, S., and A. Pennington-Cross (2006): “The Evolution of the Subprime Mortgage Market,” Federal Reserve Bank of St. Louis Review, 88(1), 31-56. Core, J., and W. Guay (1999): “The Use of Equity Grants to Manage Optimal Equity Incentive Levels,” Journal of Accounting and Economics, 28(2), 151-184. Coval, J., J. Jurek, and E. Stafford (2009): “The Economics of Structured Finance,” Journal of Economic Perspectives, 23(1), 3-25. Edmans, A., X. Gabaix and A. Landier (2009): “A Multiplicative Model of CEO Incentives in Market Equilibrium,” Review of Financial Studies, 22(12), 4881-4917. Erkens, D., M. Hung, and P. Matos (2009): “Corporate Governance in the Recent Financial Crisis: Evidence from Financial Institutions Worldwide,” SSRN Paper 1397685. Fahlenbrach, Rudiger and Rene Stulz (2009): “Bank CEO Incentives and the Credit Crisis,” Ohio State Working Paper. Froot, K., A. Perold and J. Stein (1992): “Shareholder Trading Practices and Corporate Investment Horizons,” Journal of Applied Corporate Finance, 5, 42-58.
30
Gabaix, X., and A. Landier (2008): “Why Has CEO Pay Increased So Much?,” Quarterly Journal of Economics, 123(1), 49-100. Gompers, P., J. Ishii, and A. Metrick (2003): “Corporate Governance and Equity Prices,” Quarterly Journal of Economics, 116(1), 107-155. Graham, J. R., C. R. Harvey, and S. Rajgopal (2005): “The Economic Implications of Corporate Financial Reporting,” Journal of Accounting and Economics, 40(1), 3-73. Hall, B. J., and J. B. Liebman (1998): “Are CEOs Really Paid Like Bureaucrats?,” Quarterly Journal of Economics, 63(3), 653-691. Hall, B. J., and K. J. Murphy (2003): “The Trouble with Stock Options,” Journal of Economic Perspectives, 17(3), 49-70. Healy, P. M. (1985): “The Effect of Bonus Schemes on Accounting Decisions,””Journal of Accounting and Economics, 7, 85-107. Hermalin, B., and M. Weisbach (1998): “Endogenously Chosen Boards of Directors and Their Monitoring of the CEO,” American Economic Review, 88(1), 96-118. Himmelberg, C. P., R. G. Hubbard, and D. Palia (1999): “Understanding the Determinants of Managerial Ownership and the Link Between Ownership and Performance,” Journal of Financial Economics, 53(3), 353-384. Hong, Harrison and Jeremy C. Stein (2007): “Disagreement and the Stock Market,” (with Harrison Hong), Journal of Economic Perspectives, 21, pp. 109-128. Jensen, M. C., and K. J. Murphy (1990): “Performance Pay and Top-Management Incentives,” Journal of Political Economy, 98(2), 225-264. Kaplan, S.N. (2008): “Are US CEOs Overpaid?,” The Academy of Management Perspectives, 22(2), 5-20. Kaplan, S. N., and B. A. Minton (2006): “How Has CEO Turnover Changed? Increasingly Performance Sensitive Boards and Increasingly Uneasy CEOs,” Working Paper. Keys, B. J., T. Mukherjee, A. Seru, and V. Vig (2009): “Financial Regulation and Securitization: Evidence from Subprime Loans,” Forthcoming Journal of Monetary Economics. Laeven, L., and R. Levine (2008): “Corporate Governance, Regulation, and Bank Risk Taking,” Journal of Financial Economics, forthcoming. Lewis, Michael (2004): “The Irresponsible Investor,” New York Times Magazine, June 6 2004, Online at http://www.nytimes.com/2004/06/06/magazine/the-irresponsible-investor.html. Long, J. S., and L. H. Ervin (2000): “Using Heteroskedasticity-Consistent Standard Errors in the Linear Regression Model,” The American Statistician, 54(3), 217-224.
31
Longstaff, F. A. (2010): “The Subprime Credit Crisis and Contagion in Financial Markets,” Journal of Financial Economics, Forthcoming. MacKinnon, J. G., and H. White (1985): “Some Heteroskedasticity-Consistent Covariance Matrix Estimators with Improved Finite Sample Properties,” Journal of Econometrics, 29(3), 305-325. Mehran, H. and J. Rosenberg (2007): “The Effect of CEO Stock Options on Bank Investment Choice, Borrowing, and Capital,” Working paper, Federal Reserve Bank of New York. Murphy, K. J. (1999): “Executive Compensation,” in Handbook of Labor Economics, vol. 3, pp. 2485-2563. Elsevier. -------- (2000): “Performance Standards in Incentive Contracts,” Journal of Accounting and Economics, 30(3), 245-278. Parrino, R., R. W. Sias, and L. T. Starks (2003): “Voting With Their Feet: Institutional Ownership Changes Around Forced CEO Turnover,” Journal of Financial Economics, 68(1), 3-46. Shumway, T. (1997): “The Delisting Bias in CRSP Data,” Journal of Finance, 52(1), 327-340. Stein, Jeremy C. (1989): “Efficient Capital Markets, Inefficient Firms: A Model of Myopic Corporate Behavior,” Quarterly Journal of Economics, 104, 655-669. Stein, Jeremy C. (2003): “Agency, Information and Corporate Investment,” in Handbook of the Economics of Finance, edited by George Constantinides, Milt Harris and René Stulz, pp. 111-165. Elsevier. UK House of Commons, Treasury Committee (2009): “Banking Crisis: Reforming Corporate Governance and Pay in the City.” Ninth report of the session 2008-2009. http://www.publications.parliament.uk/pa/cm200809/cmselect/cmtreasy/519/519.pdf Yermack, D. (1996): “Higher Market Valuation of Companies with a Small Board of Directors,” Journal of Financial Economics, 40(2), 185-2

32
Tab
le 1
: S
um
mar
y St
atis
tics
We
repo
rt s
umm
ary
stat
isti
cs f
or o
ur m
easu
res
of e
xecu
tive
com
pens
atio
n, r
esid
ual c
ompe
nsat
ion,
mar
ket c
apit
aliz
atio
n, a
nd r
isk-
taki
ng m
easu
res
in tw
o cr
oss-
sect
ions
, th
e “e
arly
” an
d “l
ate”
per
iods
. P
anel
A r
epor
ts s
umm
ary
stat
isti
cs f
or a
vera
ge e
xecu
tive
com
pens
atio
n in
199
2-19
94 a
s w
ell
as s
umm
ary
stat
isti
cs o
f m
easu
res
of
subs
eque
nt r
isk-
taki
ng f
or th
ose
firm
s. P
anel
B r
epor
ts s
umm
ary
stat
isti
cs f
or th
e la
te p
erio
d, w
here
we
com
pute
res
idua
l com
pens
atio
n in
199
8-20
00 a
nd r
isk-
taki
ng in
20
01-2
008.
T
o ob
tain
res
idua
l ex
ecut
ive
com
pens
atio
n, w
e ta
ke r
esid
uals
fro
m a
reg
ress
ion
of l
og e
xecu
tive
com
pens
atio
n on
log
mar
ket
capi
taliz
atio
n in
the
tw
o pe
riod
s, a
s de
scri
bed
in T
able
2.
Per
iod
Var
iab
le
Mea
n S
D
Sk
ew.
Min
. M
ax.
Med
ian
IQR
O
bs.
P
anel
A:
Ear
ly P
erio
d
1992
-199
4 L
og E
xecu
tive
Com
pens
atio
n 6.
8458
0.
8007
0.
8138
5.
3425
9.
5278
6.
6358
1.
1858
15
3
1992
-199
4 R
esid
ual E
xecu
tive
Com
pens
atio
n 0.
0000
0.
4898
0.
5309
-1
.825
2 1.
8203
-0
.045
0 0.
5330
15
3
1994
L
og M
arke
t Cap
italiz
atio
n 14
.052
2 1.
2487
0.
3242
11
.747
9 17
.248
7 13
.977
0 2.
1286
15
3
1994
M
arke
t/Boo
k 1.
3531
0.
5096
1.
6648
0.
4848
3.
7748
1.
2649
0.
5136
15
0
1995
-200
0 M
arke
t Bet
a 0.
8769
0.
3337
0.
4010
0.
2467
1.
7046
0.
8396
0.
4403
14
4
1995
-200
0 D
aily
Ret
urn
Vol
atili
ty
0.31
21
0.06
76
1.21
75
0.18
86
0.60
39
0.30
36
0.08
03
144
1995
-200
0 Pr
ice-
Bas
ed R
isk
Mea
sure
0.
0000
0.
8416
0.
4721
-1
.858
0 2.
5273
-0
.037
9 1.
1032
14
4
1995
-200
0 C
umul
ativ
e E
xces
s R
etur
n 0.
9679
1.
9455
1.
2705
-2
.449
5 7.
3019
0.
5071
1.
8655
15
3
1995
-200
0 N
on-G
SE M
BS
Exp
osur
e 0.
0107
0.
0172
3.
0096
0.
0000
0.
1081
0.
0027
0.
0155
87
1995
-200
0 A
vera
ge B
ook
Lev
erag
e 11
.910
4 5.
5474
1.
1885
1.
9636
35
.681
9 12
.168
4 4.
7500
15
0
1995
-200
0 B
ook-
Bas
ed R
isk
Mea
sure
0.
0000
0.
7487
1.
8509
-1
.326
0 3.
4975
-0
.120
2 0.
7187
87
Pan
el B
: L
ate
Per
iod
1998
-200
0 L
og E
xecu
tive
Com
pens
atio
n 7.
5482
1.
0677
0.
6363
5.
5075
10
.915
6 7.
3945
1.
4058
15
2
1998
-200
0 R
esid
ual E
xecu
tive
Com
pens
atio
n 0.
0000
0.
6428
0.
3802
-2
.459
9 2.
4425
-0
.055
4 0.
7314
15
2
2000
L
og M
arke
t Cap
italiz
atio
n 14
.998
2 1.
7319
-0
.204
9 8.
4239
19
.250
8 14
.924
0 2.
3085
15
2
2000
M
arke
t/Boo
k 2.
4321
1.
3729
1.
3553
0.
0849
7.
7388
2.
0995
1.
3413
14
8
2001
-200
8 M
arke
t Bet
a 1.
1225
0.
3312
0.
5532
0.
4071
2.
0293
1.
0777
0.
4304
13
7
2001
-200
8 D
aily
Ret
urn
Vol
atili
ty
0.45
20
0.25
50
2.47
97
0.21
31
1.52
01
0.37
10
0.16
26
137
2006
-200
8 A
BX
Exp
osur
e 0.
0538
0.
2483
1.
1701
-0
.695
0 1.
0746
0.
0186
0.
2012
10
5
2001
-200
8 Pr
ice-
Bas
ed R
isk
Mea
sure
0.
0000
0.
8467
1.
5762
-1
.287
7 3.
6500
-0
.222
7 0.
8880
10
5
2001
-200
8 C
umul
ativ
e E
xces
s R
etur
n 0.
2062
0.
8423
0.
9627
-1
.252
0 3.
1201
0.
0864
1.
0546
15
1
2001
-200
8 N
on-G
SE M
BS
Exp
osur
e 0.
0227
0.
0344
2.
8727
0.
0000
0.
2111
0.
0104
0.
0243
80
2001
-200
8 A
vera
ge B
ook
Lev
erag
e 10
.964
2 5.
0982
1.
0049
1.
8274
30
.047
6 10
.951
9 5.
0491
14
5
2001
-200
8 B
ook-
Bas
ed R
isk
Mea
sure
0.
0000
0.
7564
1.
9344
-1
.651
4 3.
9772
-0
.150
7 0.
8684
79

33
Tab
le 1
: S
um
mar
y St
atis
tics
(C
onti
nu
ed)
W
e re
port
sum
mar
y st
atis
tics
for
our
mea
sure
s of
ins
ider
ow
ners
hip,
gov
erna
nce,
and
sto
ck t
urno
ver
in o
ur t
wo
cros
s-se
ctio
ns, t
he “
earl
y” a
nd “
late
” pe
riod
s.
Pan
el A
re
port
s su
mm
ary
stat
istic
s fo
r th
e ea
rly
cros
s-se
ctio
n (1
992-
1994
).
Pan
el B
rep
orts
sum
mar
y st
atis
tics
for
the
lat
e cr
oss-
sect
ion,
whe
re i
nsid
er o
wne
rshi
p, g
over
nanc
e an
d tu
rnov
er a
re c
ompu
ted
in 1
998-
2000
.
Per
iod
Var
iab
le
Mea
n S
D
Sk
ew.
Min
. M
ax.
Med
ian
IQR
O
bs.
P
anel
A:
Ear
ly P
erio
d
1992
-199
4 In
side
r O
wne
rshi
p 0.
0366
0.
0535
4.
1138
0.
0000
0.
4592
0.
0168
0.
0372
14
7
1992
-199
4 G
Ind
ex
9.89
83
2.72
50
-0.1
980
3.00
00
16.0
000
10.0
000
4.00
00
118
1992
-199
4 E
Ind
ex
2.58
82
1.37
98
-0.2
379
0.00
00
5.00
00
2.66
67
2.00
00
85
1992
-199
4 A
vera
ge M
onth
ly S
tock
Tur
nove
r 0.
0651
0.
0387
1.
1454
0.
0092
0.
1881
0.
0563
0.
0460
15
3
1992
-199
4 A
vera
ge I
nstit
utio
nal O
wne
rshi
p 0.
4647
0.
1684
-0
.140
1 0.
1087
0.
7858
0.
4899
0.
2515
15
3
Pan
el B
: L
ate
Per
iod
1998
-200
0 In
side
r O
wne
rshi
p 0.
0515
0.
0778
3.
4634
0.
0017
0.
5345
0.
0223
0.
0389
15
0
1998
-200
0 G
Ind
ex
9.40
74
2.93
78
-0.1
137
2.00
00
15.6
667
9.83
33
4.66
67
126
1998
-200
0 E
Ind
ex
2.54
68
1.50
92
0.05
95
0.00
00
6.00
00
2.33
33
2.66
67
114
2000
%
Out
side
Dir
ecto
rs
0.64
08
0.16
04
-0.4
651
0.16
67
0.92
31
0.66
41
0.24
51
128
2000
B
oard
Siz
e 13
.135
4 4.
3714
0.
4138
6.
0000
25
.000
0 13
.000
0 6.
6667
12
8
1998
-200
0 A
vera
ge M
onth
ly S
tock
Tur
nove
r 0.
0774
0.
0417
1.
3981
0.
0176
0.
2285
0.
0705
0.
0428
15
2
1998
-200
0 A
vera
ge I
nstit
utio
nal O
wne
rshi
p 0.
4558
0.
1802
0.
3477
0.
1482
0.
8730
0.
4530
0.
2588
15
2

34
Table 2: Residual Executive Compensation
Panel A reports OLS estimates of a regression where log executive compensation is the dependent variable and log market capitalization is the independent variable. We run these regressions in two periods, the “early period” (1992-1994) and “late period” (1998-2000), where we allow for primary dealer, banks/lenders/BHC, and insurer fixed effects, and for an insurer-specific slope. We compute executive compensation by averaging the total compensation of the top five executives for each firm-year and then averaging this over the three years within each window. We measure market capitalization on December 31 in the last year of each period. Panel B reports means and standard deviations for executive compensation by each sub-industry. Panel C reports the correlation between residual executive compensation from the early period and the late period. HC3-robust standard errors are reported below each coefficient. Robust standard errors are reported. * denotes significant at 10%, ** denotes significant at 5%, and *** denotes significant at 1% level.
Panel A: Executive Compensation and Firm Size
Log Executive Compensation Early Period
1992-1994 Late Period 1998-2000
Log Market Capitalization 0.4712*** 0.4730*** [0.0444] [0.0766]
Log Market Capitalization -0.3104** -0.3167** (Insurers) [0.1432] [0.1437]
Primary Dealers 0.6632** 1.0335*** [0.2687] [0.3255]
Insurers 4.2608** 4.7601** [1.9125] [2.1195]
Constant 0.1737 0.3602
[0.6150] [1.1681] Observations 153 152
R-squared 0.6259 0.6376
Panel B: Means and Standard Deviations by Industry
Early Period 1992-1994
Late Period 1998-2000
Executive Compensation
Log Market Capitalization.
Executive Compensation
Log Market Capitalization.
Primary Dealers Mean 8.1251 15.4660 9.6240 17.3993
SD 0.9153 0.9803 0.9989 1.1481 N 15 15 11 11
Banks, Lenders and BHCS
Mean 6.7105 13.8713 7.3719 14.8231 SD 0.6725 1.0850 0.9261 1.4913
N 113 113 106 106
Insurers Mean 6.6895 14.0214 7.4297 14.7738
SD 0.5719 1.5542 0.7846 2.0130 N 25 25 35 35
Panel C: Correlation of Residual Executive Compensation
Residual Executive Compensation
1992-1994
1998-2000 0.6898*** N=79
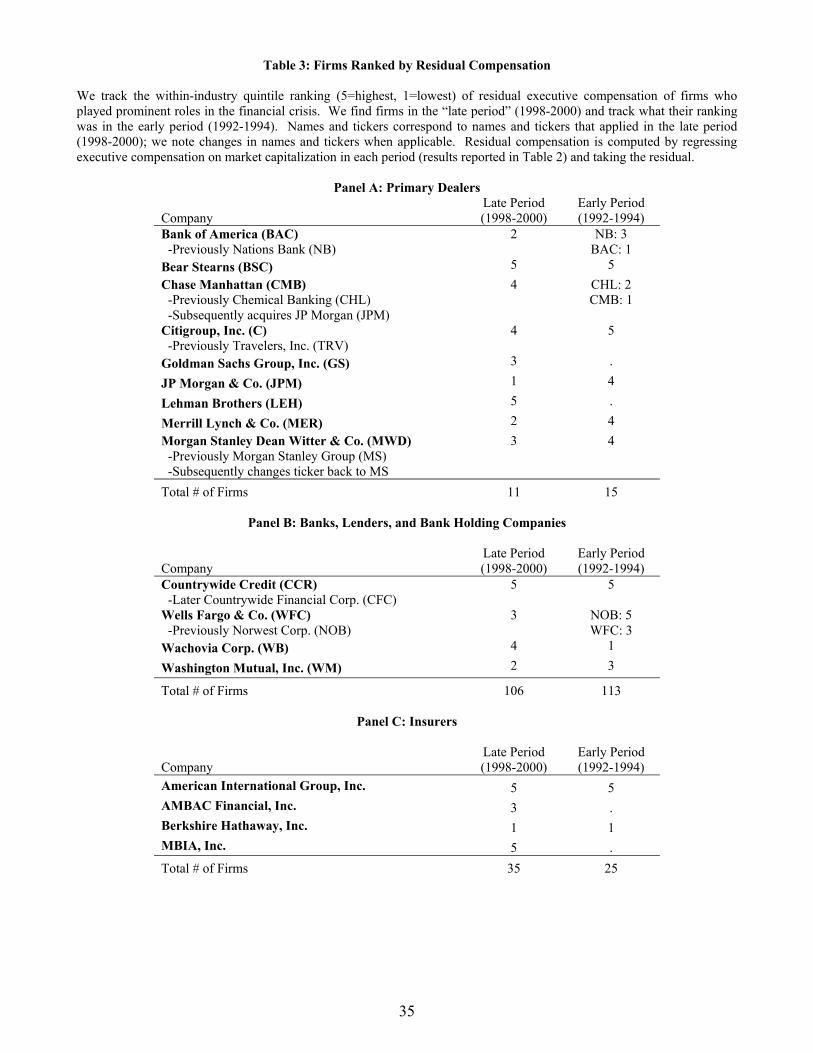
35
Table 3: Firms Ranked by Residual Compensation
We track the within-industry quintile ranking (5=highest, 1=lowest) of residual executive compensation of firms who played prominent roles in the financial crisis. We find firms in the “late period” (1998-2000) and track what their ranking was in the early period (1992-1994). Names and tickers correspond to names and tickers that applied in the late period (1998-2000); we note changes in names and tickers when applicable. Residual compensation is computed by regressing executive compensation on market capitalization in each period (results reported in Table 2) and taking the residual.
Panel A: Primary Dealers
Company Late Period (1998-2000)
Early Period (1992-1994)
Bank of America (BAC) -Previously Nations Bank (NB)
2 NB: 3 BAC: 1
Bear Stearns (BSC) 5 5
Chase Manhattan (CMB) -Previously Chemical Banking (CHL) -Subsequently acquires JP Morgan (JPM)
4 CHL: 2 CMB: 1
Citigroup, Inc. (C) -Previously Travelers, Inc. (TRV)
4 5
Goldman Sachs Group, Inc. (GS) 3 .
JP Morgan & Co. (JPM) 1 4
Lehman Brothers (LEH) 5 .
Merrill Lynch & Co. (MER) 2 4
Morgan Stanley Dean Witter & Co. (MWD) -Previously Morgan Stanley Group (MS) -Subsequently changes ticker back to MS
3 4
Total # of Firms 11 15
Panel B: Banks, Lenders, and Bank Holding Companies
Company Late Period (1998-2000)
Early Period (1992-1994)
Countrywide Credit (CCR) -Later Countrywide Financial Corp. (CFC)
5 5
Wells Fargo & Co. (WFC) -Previously Norwest Corp. (NOB)
3 NOB: 5 WFC: 3
Wachovia Corp. (WB) 4 1
Washington Mutual, Inc. (WM) 2 3
Total # of Firms 106 113
Panel C: Insurers
Company Late Period (1998-2000)
Early Period (1992-1994)
American International Group, Inc. 5 5 AMBAC Financial, Inc. 3 . Berkshire Hathaway, Inc. 1 1 MBIA, Inc. 5 .
Total # of Firms 35 25
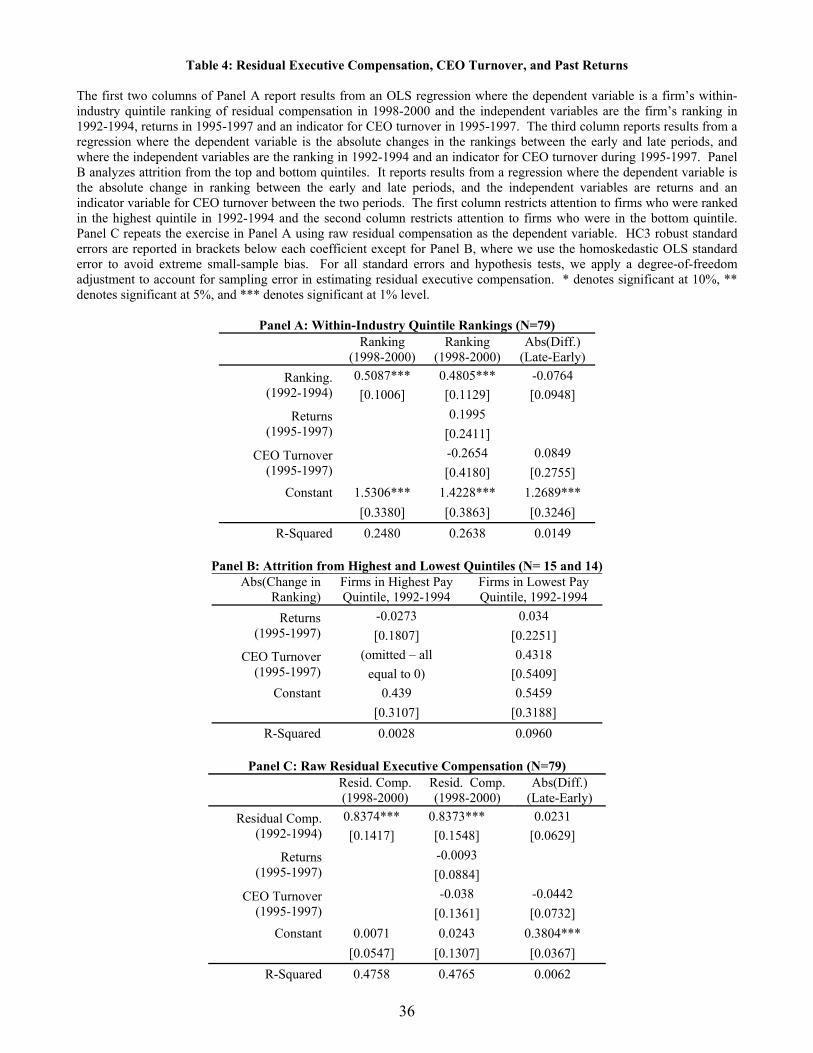
36
Table 4: Residual Executive Compensation, CEO Turnover, and Past Returns The first two columns of Panel A report results from an OLS regression where the dependent variable is a firm’s within-industry quintile ranking of residual compensation in 1998-2000 and the independent variables are the firm’s ranking in 1992-1994, returns in 1995-1997 and an indicator for CEO turnover in 1995-1997. The third column reports results from a regression where the dependent variable is the absolute changes in the rankings between the early and late periods, and where the independent variables are the ranking in 1992-1994 and an indicator for CEO turnover during 1995-1997. Panel B analyzes attrition from the top and bottom quintiles. It reports results from a regression where the dependent variable is the absolute change in ranking between the early and late periods, and the independent variables are returns and an indicator variable for CEO turnover between the two periods. The first column restricts attention to firms who were ranked in the highest quintile in 1992-1994 and the second column restricts attention to firms who were in the bottom quintile. Panel C repeats the exercise in Panel A using raw residual compensation as the dependent variable. HC3 robust standard errors are reported in brackets below each coefficient except for Panel B, where we use the homoskedastic OLS standard error to avoid extreme small-sample bias. For all standard errors and hypothesis tests, we apply a degree-of-freedom adjustment to account for sampling error in estimating residual executive compensation. * denotes significant at 10%, ** denotes significant at 5%, and *** denotes significant at 1% level.
Panel A: Within-Industry Quintile Rankings (N=79)
Ranking
(1998-2000) Ranking
(1998-2000) Abs(Diff.)
(Late-Early)
Ranking. (1992-1994)
0.5087*** 0.4805*** -0.0764
[0.1006] [0.1129] [0.0948]
Returns (1995-1997)
0.1995
[0.2411]
CEO Turnover (1995-1997)
-0.2654 0.0849
[0.4180] [0.2755]
Constant 1.5306*** 1.4228*** 1.2689***
[0.3380] [0.3863] [0.3246]
R-Squared 0.2480 0.2638 0.0149
Panel B: Attrition from Highest and Lowest Quintiles (N= 15 and 14) Abs(Change in
Ranking) Firms in Highest Pay Quintile, 1992-1994
Firms in Lowest Pay Quintile, 1992-1994
Returns (1995-1997)
-0.0273 0.034
[0.1807] [0.2251]
CEO Turnover (1995-1997)
(omitted – all 0.4318
equal to 0) [0.5409]
Constant 0.439 0.5459
[0.3107] [0.3188]
R-Squared 0.0028 0.0960
Panel C: Raw Residual Executive Compensation (N=79)
Resid. Comp. (1998-2000)
Resid. Comp. (1998-2000)
Abs(Diff.) (Late-Early)
Residual Comp. (1992-1994)
0.8374*** 0.8373*** 0.0231
[0.1417] [0.1548] [0.0629]
Returns (1995-1997)
-0.0093
[0.0884]
CEO Turnover (1995-1997)
-0.038 -0.0442
[0.1361] [0.0732]
Constant 0.0071 0.0243 0.3804***
[0.0547] [0.1307] [0.0367]
R-Squared 0.4758 0.4765 0.0062

37
Table 5: Residual Executive Compensation and Risk-Taking
We report results from OLS regressions where the dependent variables are our risk-taking measures and the independent variable is residual executive compensation. The first column reports results where we run these regressions for our early cross-section, and the second column reports results for our late cross-section. In the early cross-section, residual compensation is computed in 1992-1994 and our risk-taking measures are computed in 1995m1-2000m12. For the late cross-section, residual compensation is computed in 1998-2000 and our risk-taking measures are computed in 2001m1-2008m12, with the exception of Exposure to ABX, which is computed from 19Jan06-31Dec08. Panel A contains regressions for our price-based risk measures. The CRSP VW Beta is the beta of firm returns with returns to the CRSP value-weighted market return (including dividends), computed from daily data. Return volatility is the volatility of daily returns over the risk-free rate annualized to one trading year (252 days). Exposure to ABX is the coefficient from a regression of returns over the risk-free rate on returns to the ABX AAA tranche, controlling for the excess market return, computed using daily return data. The price-based risk-score is an equal-weighted average of the z-scores of the above three measures. Panel B contains regressions for return outcomes. Cumulative excess returns are the buy-and-hold returns in excess of the market over that period. Panel C contains regressions for our book-based risk measures. Exposure to MBS is defined as total holdings of mortgage-backed securities not issued or guaranteed by government-sponsored entities divided by total balance sheet size. Book leverage is total book assets divided by the book value of stockholder’s equity. The book-based risk-score is an equal-weighted average of the z-scores of the above two measures. HC3 robust standard errors are reported in brackets and R-squareds are reported in parentheses. For all standard errors and hypothesis tests, we apply a degree-of-freedom adjustment to account for sampling error in estimating residual executive compensation. * denotes significant at 10%, ** denotes significant at 5%, and *** denotes significant at 1% level.
OLS Coefficient on Residual Executive Compensation
Panel A: Price-Based Risk Measures
LHS Early Period Late Period
CRSP VW Beta
0.2205*** 0.2049*** [0.0573] [0.0505] N=144 N=137
(0.1054) (0.1507)
0.0503*** 0.1280*** Return [0.0107] [0.0483]
Volatility N=144 N=137 (0.1337) (0.0992)
Exposure to ABX
0.1541** [0.0603] N=105 (0.1303)
Price-Based Risk-Score
0.7025*** 0.6477*** [0.1385] [0.1425] N=144 N=105
(0.1682) (0.1980)
Panel C: Book-Sheet-Based Risk Measures LHS Early Period Late Period
Exposure to MBS
0.0026 0.0079 [0.0030] [0.0059]
N=87 N=80 (0.0034) (0.0143)
Book Leverage
1.4337 1.4289 [1.6173] [1.0969] N=150 N=145
(0.0163) (0.0331)
Book-Based Risk-Score
0.3818 0.1558 [0.3070] [0.1740]
N=87 N=79 (0.0392) (0.0116)
Panel B: Outcomes Early Period Late Period
Cumulative Excess Returns
1.1002** -0.3722*** [0.4618] [0.1052] N=153 N=151
(0.0767) (0.0809)

38
Tab
le 6
: R
esul
ts B
rok
en D
own
By
Fin
ance
Su
b-In
du
stri
es
W
e re
gres
s ou
r pr
ice-
base
d ri
sk-s
core
on
resi
dual
com
pens
atio
n fo
r va
riou
s su
b-in
dust
ries
. T
he d
epen
dent
var
iabl
es a
re o
ur p
rice
-bas
ed r
isk-
scor
e an
d cu
mul
ativ
e ex
cess
re
turn
s de
fine
d in
Tab
le 5
, and
the
ind
epen
dent
var
iabl
e is
res
idua
l ex
ecut
ive
com
pens
atio
n, d
efin
ed i
n T
able
2. W
e re
port
res
ults
fro
m s
ix s
epar
ate
regr
essi
ons:
the
ear
ly a
nd
earl
y an
d la
te p
erio
d cr
oss-
sect
ions
for
eac
h of
the
thr
ee g
roup
ings
. T
he f
irst
row
wit
hin
each
ris
k-ta
king
mea
sure
rep
orts
res
ults
exc
ludi
ng t
he p
rim
ary
deal
ers
from
the
sa
mpl
e, a
nd t
he s
econ
d ro
w e
xclu
des
the
insu
rers
. T
he t
hird
row
with
in e
ach
risk
-tak
ing
mea
sure
onl
y in
clud
es b
anks
and
ban
k-ho
ldin
g co
mpa
nies
, w
hich
are
not
pri
mar
y de
aler
s in
the
sam
ple.
T
he t
wo
colu
mns
rep
rese
nt t
he r
esul
ts o
f ru
nnin
g th
ese
exer
cise
s in
the
ear
ly a
nd l
ate
peri
od c
ross
-sec
tions
sep
arat
ely.
H
C3
robu
st s
tand
ard
erro
rs a
re
repo
rted
in
brac
kets
bel
ow e
ach
coef
fici
ent.
For
all
stan
dard
err
ors
and
hypo
thes
is t
ests
, we
appl
y a
degr
ee-o
f-fr
eedo
m a
djus
tmen
t to
acc
ount
for
sam
plin
g er
ror
in e
stim
atin
g re
sidu
al e
xecu
tive
com
pens
atio
n. *
den
otes
sig
nifi
cant
at 1
0%, *
* de
note
s si
gnif
ican
t at 5
%, a
nd *
** d
enot
es s
igni
fica
nt a
t 1%
leve
l.
OL
S C
oeff
icie
nt
on R
esid
ual
Exe
cuti
ve C
omp
ensa
tion
LH
S G
roup
ing
Ear
ly P
erio
d
Lat
e P
erio
d
Pri
ce-B
ased
R
isk
-Sco
re
Exc
ludi
ng
Pri
mar
y D
eale
rs
0.74
62**
* 0.
5400
***
[0.1
428]
[0
.113
0]
Exc
ludi
ng
Insu
rers
0.
8220
***
0.67
60**
*
[0.1
522]
[0
.229
3]
Ban
ks/B
HC
s O
nly
0.94
45**
* 0.
4312
***
[0.1
389]
[0
.148
9]
Cu
mu
lati
ve
Exc
ess
Ret
urn
s
Exc
ludi
ng
Pri
mar
y D
eale
rs
0.97
42**
-0
.371
8***
[0.4
864]
[0
.104
6]
Exc
ludi
ng
Insu
rers
1.
2361
**
-0.2
575*
*
[0.5
383]
[0
.112
8]
Ban
ks/B
HC
s O
nly
1.13
83*
-0.2
418*
*
[0.5
964]
[0
.111
7]
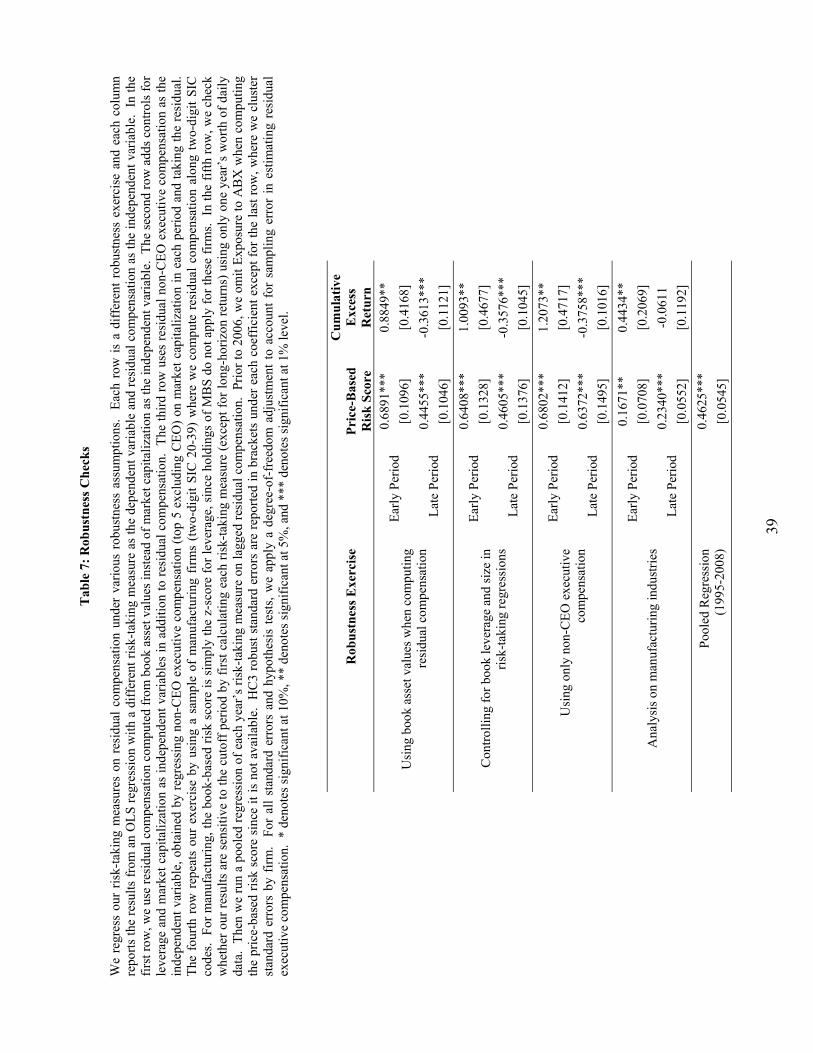
39
Tab
le 7
: R
obus
tnes
s C
hec
ks
We
regr
ess
our
risk
-tak
ing
mea
sure
s on
res
idua
l co
mpe
nsat
ion
unde
r va
riou
s ro
bust
ness
ass
umpt
ions
. E
ach
row
is
a di
ffer
ent
robu
stne
ss e
xerc
ise
and
each
col
umn
repo
rts
the
resu
lts
from
an
OL
S r
egre
ssio
n w
ith
a di
ffer
ent r
isk-
taki
ng m
easu
re a
s th
e de
pend
ent v
aria
ble
and
resi
dual
com
pens
atio
n as
the
inde
pend
ent v
aria
ble.
In
the
firs
t row
, we
use
resi
dual
com
pens
atio
n co
mpu
ted
from
boo
k as
set v
alue
s in
stea
d of
mar
ket c
apita
lizat
ion
as th
e in
depe
nden
t var
iabl
e. T
he s
econ
d ro
w a
dds
cont
rols
for
le
vera
ge a
nd m
arke
t ca
pita
liza
tion
as i
ndep
ende
nt v
aria
bles
in
addi
tion
to r
esid
ual
com
pens
atio
n.
The
thi
rd r
ow u
ses
resi
dual
non
-CE
O e
xecu
tive
com
pens
atio
n as
the
in
depe
nden
t va
riab
le, o
btai
ned
by r
egre
ssin
g no
n-C
EO
exe
cutiv
e co
mpe
nsat
ion
(top
5 e
xclu
ding
CE
O)
on m
arke
t ca
pita
lizat
ion
in e
ach
peri
od a
nd t
akin
g th
e re
sidu
al.
The
fou
rth
row
rep
eats
our
exe
rcis
e by
usi
ng a
sam
ple
of m
anuf
actu
ring
fir
ms
(tw
o-di
git
SIC
20-
39)
whe
re w
e co
mpu
te r
esid
ual
com
pens
atio
n al
ong
two-
digi
t S
IC
code
s. F
or m
anuf
actu
ring
, the
boo
k-ba
sed
risk
sco
re is
sim
ply
the
z-sc
ore
for
leve
rage
, sin
ce h
oldi
ngs
of M
BS
do
not a
pply
for
thes
e fi
rms.
In
the
fift
h ro
w, w
e ch
eck
whe
ther
our
res
ults
are
sen
sitiv
e to
the
cut
off
peri
od b
y fi
rst
calc
ulat
ing
each
ris
k-ta
king
mea
sure
(ex
cept
for
lon
g-ho
rizo
n re
turn
s) u
sing
onl
y on
e ye
ar’s
wor
th o
f da
ily
data
. T
hen
we
run
a po
oled
reg
ress
ion
of e
ach
year
’s r
isk-
taki
ng m
easu
re o
n la
gged
res
idua
l com
pens
atio
n. P
rior
to 2
006,
we
omit
Exp
osur
e to
AB
X w
hen
com
putin
g th
e pr
ice-
base
d ri
sk s
core
sin
ce i
t is
not
ava
ilab
le.
HC
3 ro
bust
sta
ndar
d er
rors
are
rep
orte
d in
bra
cket
s un
der
each
coe
ffic
ient
exc
ept
for
the
last
row
, whe
re w
e cl
uste
r st
anda
rd e
rror
s by
fir
m.
For
all
sta
ndar
d er
rors
and
hyp
othe
sis
test
s, w
e ap
ply
a de
gree
-of-
free
dom
adj
ustm
ent
to a
ccou
nt f
or s
ampl
ing
erro
r in
est
imat
ing
resi
dual
ex
ecut
ive
com
pens
atio
n. *
den
otes
sig
nifi
cant
at 1
0%, *
* de
note
s si
gnif
ican
t at 5
%, a
nd *
** d
enot
es s
igni
fica
nt a
t 1%
leve
l.
Rob
ust
nes
s E
xerc
ise
P
rice
-Bas
ed
Ris
k S
core
Cu
mu
lati
ve
Exc
ess
Ret
urn
Usi
ng b
ook
asse
t val
ues
whe
n co
mpu
ting
resi
dual
com
pens
atio
n
Ear
ly P
erio
d 0.
6891
***
0.88
49**
[0.1
096]
[0
.416
8]
Lat
e P
erio
d 0.
4455
***
-0.3
613*
**
[0.1
046]
[0
.112
1]
Con
trol
ling
for
book
leve
rage
and
siz
e in
ri
sk-t
akin
g re
gres
sion
s
Ear
ly P
erio
d 0.
6408
***
1.00
93**
[0.1
328]
[0
.467
7]
Lat
e P
erio
d 0.
4605
***
-0.3
576*
**
[0.1
376]
[0
.104
5]
Usi
ng o
nly
non-
CE
O e
xecu
tive
com
pens
atio
n
Ear
ly P
erio
d 0.
6802
***
1.20
73**
[0.1
412]
[0
.471
7]
Lat
e P
erio
d 0.
6372
***
-0.3
758*
**
[0.1
495]
[0
.101
6]
Ana
lysi
s on
man
ufac
turi
ng in
dust
ries
Ear
ly P
erio
d 0.
1671
**
0.44
34**
[0.0
708]
[0
.206
9]
Lat
e P
erio
d 0.
2340
***
-0.0
611
[0.0
552]
[0
.119
2]
Poo
led
Reg
ress
ion
(199
5-20
08)
0.
4625
***
[0.0
545]
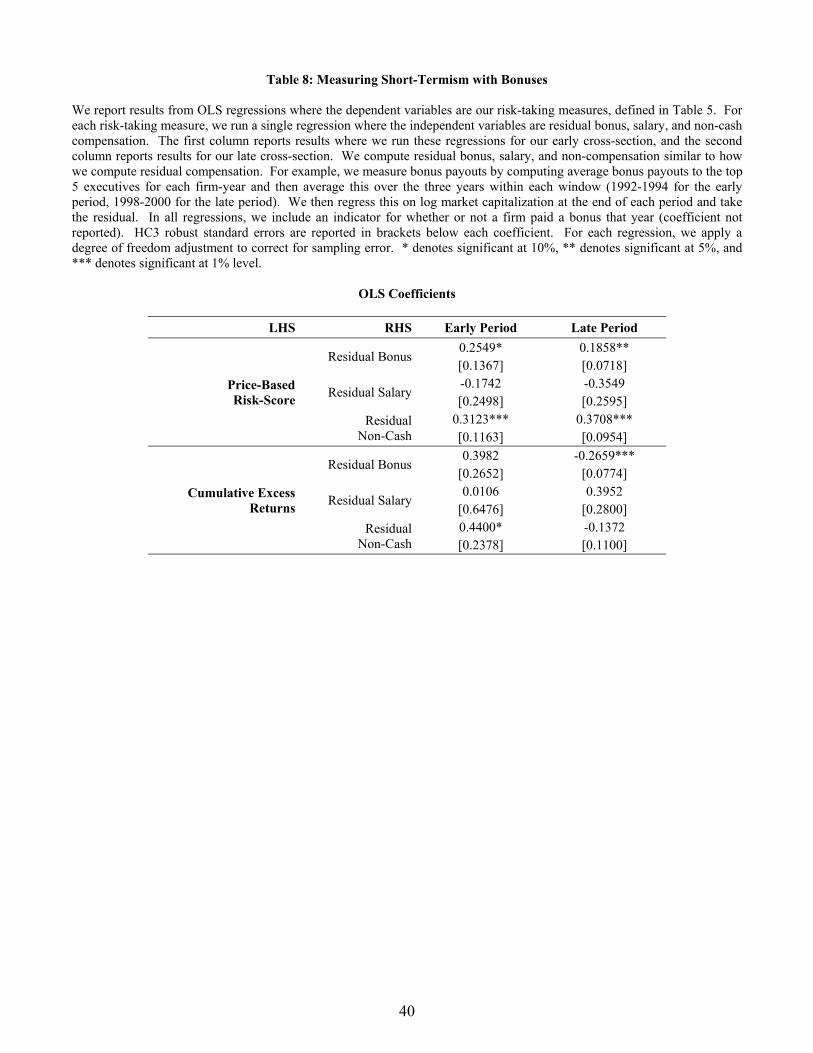
40
Table 8: Measuring Short-Termism with Bonuses
We report results from OLS regressions where the dependent variables are our risk-taking measures, defined in Table 5. For each risk-taking measure, we run a single regression where the independent variables are residual bonus, salary, and non-cash compensation. The first column reports results where we run these regressions for our early cross-section, and the second column reports results for our late cross-section. We compute residual bonus, salary, and non-compensation similar to how we compute residual compensation. For example, we measure bonus payouts by computing average bonus payouts to the top 5 executives for each firm-year and then average this over the three years within each window (1992-1994 for the early period, 1998-2000 for the late period). We then regress this on log market capitalization at the end of each period and take the residual. In all regressions, we include an indicator for whether or not a firm paid a bonus that year (coefficient not reported). HC3 robust standard errors are reported in brackets below each coefficient. For each regression, we apply a degree of freedom adjustment to correct for sampling error. * denotes significant at 10%, ** denotes significant at 5%, and *** denotes significant at 1% level.
OLS Coefficients
LHS RHS Early Period Late Period
Price-Based Risk-Score
Residual Bonus 0.2549* 0.1858** [0.1367] [0.0718]
Residual Salary -0.1742 -0.3549 [0.2498] [0.2595]
Residual Non-Cash
0.3123*** 0.3708*** [0.1163] [0.0954]
Cumulative Excess Returns
Residual Bonus 0.3982 -0.2659***
[0.2652] [0.0774]
Residual Salary 0.0106 0.3952
[0.6476] [0.2800]
Residual Non-Cash
0.4400* -0.1372 [0.2378] [0.1100]
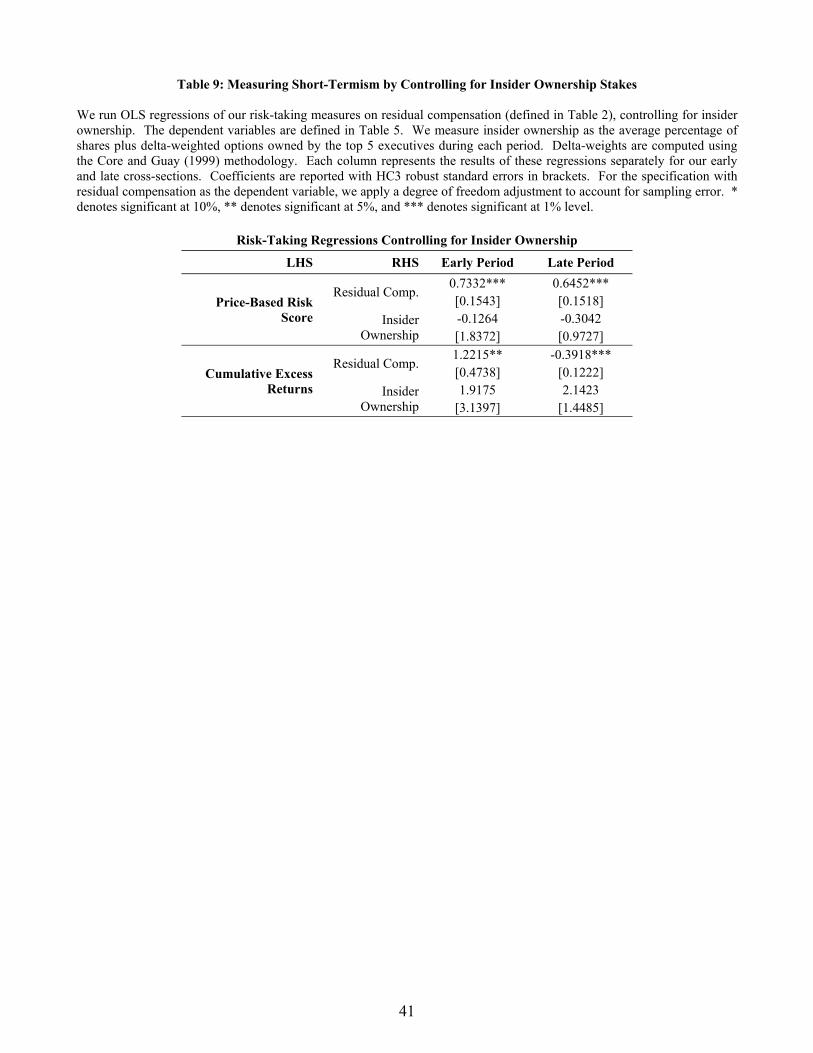
41
Table 9: Measuring Short-Termism by Controlling for Insider Ownership Stakes
We run OLS regressions of our risk-taking measures on residual compensation (defined in Table 2), controlling for insider ownership. The dependent variables are defined in Table 5. We measure insider ownership as the average percentage of shares plus delta-weighted options owned by the top 5 executives during each period. Delta-weights are computed using the Core and Guay (1999) methodology. Each column represents the results of these regressions separately for our early and late cross-sections. Coefficients are reported with HC3 robust standard errors in brackets. For the specification with residual compensation as the dependent variable, we apply a degree of freedom adjustment to account for sampling error. * denotes significant at 10%, ** denotes significant at 5%, and *** denotes significant at 1% level.
Risk-Taking Regressions Controlling for Insider Ownership
LHS RHS Early Period Late Period
Price-Based Risk Score
Residual Comp. 0.7332*** 0.6452*** [0.1543] [0.1518]
Insider Ownership
-0.1264 -0.3042 [1.8372] [0.9727]
Cumulative Excess Returns
Residual Comp. 1.2215** -0.3918*** [0.4738] [0.1222]
Insider Ownership
1.9175 2.1423 [3.1397] [1.4485]

42
Table 10: Residual Compensation and Governance In this table, we run OLS regressions of our risk-taking measures and residual compensation on governance measures. For each dependent variable, we report four rows of results corresponding to separate regressions using four different governance measures as independent variables. G-Index is the Gompers-Ishii-Metrick (2003) measure of managerial entrenchment. E-Index is the Bebchuk, Cohen and Ferrell (2008) measure of entrenchment. % Outside Directors is the percentage of outside directors who have no significant connection with the firm (classified as “Independent” by RiskMetrics). Board Size is the total number of directors in the firm. Each column represents the results of these regressions separately for our early and late cross-sections. Coefficients are reported with HC3 robust standard errors in brackets. For the specification with residual compensation as the dependent variable, we apply a degree of freedom adjustment to account for sampling error. * denotes significant at 10%, ** denotes significant at 5%, and *** denotes significant at 1% level.
Governance Regressions
LHS Governance Early Period Late Period
Residual Compensation
G-Index -0.0008 0.0122 [0.0191] [0.0202]
E-Index -0.0499 -0.0006 [0.0541] [0.0483]
% Outside Directors
0.0031 [0.4512]
Board Size -0.0238 [0.0149]
Price-Based Risk Score
G-Index -0.0090 0.0039 [0.0335] [0.0342]
E-Index -0.1490** -0.0596 [0.0593] [0.0627]
% Outside Directors
0.5816 [0.6258]
Board Size -0.0171 [0.0220]
Cumulative Excess Returns
G-Index -0.0136 0.0025 [0.0710] [0.0324]
E-Index -0.0524 0.0512 [0.1441] [0.0515]
% Outside Directors
-0.3710 [0.3911]
Board Size 0.0167 [0.0160]

43
Table 11: Compensation and Risk-Taking: Mediating Roles of Institutional Ownership and Stock Turnover
In Panel A, we regress our risk-taking measures and residual compensation on institutional ownership and stock turnover. The dependent variables are our risk-taking measures (defined in Table 5) and residual compensation (defined in Table 2). The independent variable in the first two columns is institutional ownership, where the first column is a regression for the early period and the second column for the late period. The independent variable in the third and fourth column is stock turnover in the early and late period, respectively. Institutional ownership is defined as the total shares held by institutions reporting in 13F statements divided by the number of shares outstanding averaged over the 12 quarters in 1992-1994 for the early period and 1998-2000 for the late period. Stock turnover is defined as the monthly volume divided by shares outstanding averaged over the 36 months in the early and late periods. In Panel B we run our risk-taking regressions where the dependent variable are our risk measures and outcomes and the independent variables are residual compensation with controls for market capitalization and market/book. HC3-robust standard errors are reported in brackets below each coefficient and R-squareds are reported in parentheses. For the specification with residual executive compensation as a dependent variable, we apply a degrees-of-freedom adjustment to account for sampling error. * denotes significant at 10%, ** denotes significant at 5%, and *** denotes significant at 1% level.
Panel A: Institutional Ownership and Stock Turnover
Institutional Ownership Stock Turnover
LHS Early Period Late Period Early Period Late Period
Residual Executive Compensation
1.0153*** 1.0353*** 2.2346** 4.6843** [0.2531] [0.2722] [1.1026] [1.7976] N=153 N=152 N=153 N=152
(0.1219) (0.0842) (0.0312) (0.0922)
Price-Based Risk Score
1.7654*** 0.9075** 3.8004* 8.4264** [0.3707] [0.3799] [1.9764] [3.2328] N=144 N=105 N=144 N=105
(0.1283) (0.0416) (0.0314) (0.1600)
Cumulative Excess Returns
2.7324*** -0.6353* 1.3348 -3.6020*** [0.9606] [0.3468] [3.0793] [1.2847] N=153 N=151 N=153 N=151
(0.0559) (0.0186) (0.0007) (0.0311)
Panel B: Risk-Taking and Market-Book LHS RHS Early Period Late Period
Price-Based Risk Score
Residual Compensation
0.7003*** 0.5725***
[0.1380] [0.1622]
Log Market Capitalization
0.2677*** 0.1576***
[0.0589] [0.0523]
Market/Book -0.0851 -0.0782
[0.1491] [0.0501]
N R-Squared
144 105
0.321 0.2737
Cumulative Excess Returns
Residual Compensation
1.1108** -0.3562***
[0.4624] [0.1091]
Log Market Capitalization
0.3752*** -0.0811*
[0.1278] [0.0420]
Market/Book -0.0696 -0.0701
[0.4004] [0.0428]
N R-Squared
150 148
0.132 0.1348
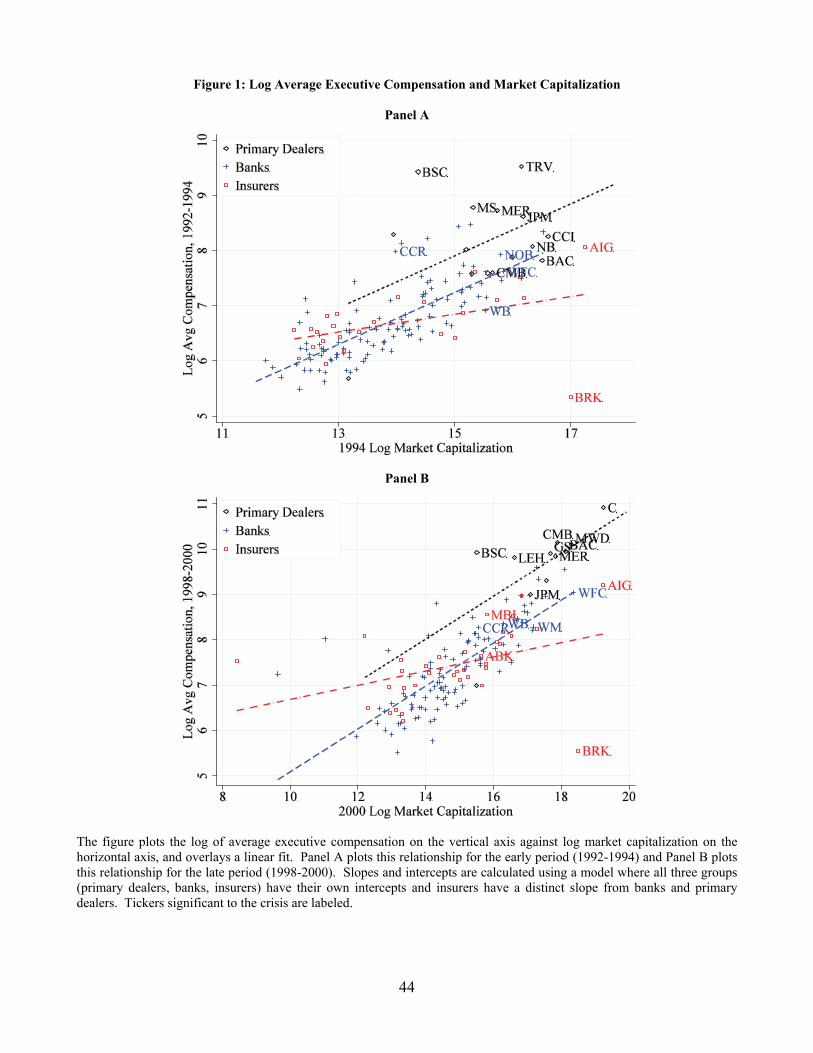
44
Figure 1: Log Average Executive Compensation and Market Capitalization
Panel A
Panel B
The figure plots the log of average executive compensation on the vertical axis against log market capitalization on the horizontal axis, and overlays a linear fit. Panel A plots this relationship for the early period (1992-1994) and Panel B plots this relationship for the late period (1998-2000). Slopes and intercepts are calculated using a model where all three groups (primary dealers, banks, insurers) have their own intercepts and insurers have a distinct slope from banks and primary dealers. Tickers significant to the crisis are labeled.

45
Figure 2: Residual Executive Compensation and Risk-Taking
We plot our measures of risk-taking on the vertical axis of each panel against residual compensation on the horizontal axis for both the early and late cross-sections. Panels A and B plot the relationship of a firm’s stock return beta with residual executive compensation. Panels C and D plot the relationship for daily return volatility (annualized using 252 trading days), and Panel E plots ABX Exposure and residual compensation. A linear fit is overlaid and we report the slopes, t-statistics, p-values, and R-squares associated with each fit. The t-statistics are calculated using HC3-robust standard errors with a degrees-of-freedom adjustment to account for sampling error in estimating residual executive compensation. Tickers significant to the crisis are labeled.

46
Figure 2 (Continued): Residual Executive Compensation and Risk-Taking
We plot our measures of risk-taking on the vertical axis of each panel against residual compensation on the horizontal axis for both the early and late cross-sections. Panels F and G plot a price-based risk-score based on beta, volatility, and ABX exposure against residual compensation. Panels H and I plot a firm’s cumulative excess return over the market in each period. Panels J and K plot the relationship for average non-GSE MBS holdings as a percentage of total balance sheet size for both periods. A linear fit is overlaid and we report the slopes, t-statistics, p-values, and R-squares associated with each fit. The t-statistics are calculated using HC3-robust standard errors with a degrees-of-freedom adjustment to account for sampling error in estimating residual executive compensation. Tickers significant to the crisis are labeled.

47
Figure 2 (Continued): Residual Executive Compensation and Risk-Taking
We plot our measures of risk-taking on the vertical axis of each panel against residual compensation on the horizontal axis for both the early and late cross-sections. Panels L and M plot book leverage against residual compensation.