yelow colored: need to be confirmed by sg33 members. … quantitatively, however, the knowledge on...
TRANSCRIPT

1
Chapter 5
Covariance Data for Cross Sections. Different Sets Used and Main Characteristics
5.1 Introduction The covariance of a nuclear data set is one of important parameters in the cross-section adjustment procedure. Generally, the covariance matrix1 of a scattered data set, xi (i=1,n), is defined as follows (Ref.1): Variance: . . . (5.1) --> Standard deviation (STD): . . . (5.2) Covariance: . . . (5.3) --> Correlation factor (C.F.): . . . (5.4) The covariance matrix must be symmetric and possess positive-definite characteristics. In this chapter, first, the current methodologies to evaluate the nuclear data covariance are briefly reviewed. Next, some of actual covariance data are illustrated and compared between JENDL-4.0 (J-4.0 hereafter, Ref.2,3), and COMMARA-2.0 (C-2.0 hereafter, Ref.4) which is to be used together with the ENDF/B-VII.0 central values (Ref.5). Finally, the effects of different covariance data on the adjusted results are surveyed and concluded. 5.2 Methodology of Covariance Evaluation The covariance data of a library should be evaluated in accordance with the methodology adopted in the library to obtain the central values of the nuclear data, which means that two covariance data of a cross-section in two libraries could be different even if the central value of the cross-section is identical, when the evaluation methodologies or the experimental data used are different with each other. Here, typical methodologies to evaluate the covariance data are briefly summarized, according to the recently published covariance data such as J-4.0, C-2.0, or ENDF/B-VII.1 (Ref.6~8). 1) Generalized least-square method If a plenty of the measured data are available to evaluate cross-sections in an energy range, the generalized least-square method with the GMA code (ANL, Ref.9) or the ZOTT code (IAEA, Ref.10) could be used to obtain the best-estimated cross-section values and their covariance data at once. The very critical issue to utilize the experimental values for the cross-section evaluation is that the systematic and statistical uncertainties of the measurements must be distinguished and known
1 Covariance matrix is sometimes called as "Variance-Covariance matrix".
Draft: November 22, 2012
)var()( iii xxstd ==σ
):( 0 valuemeanxm ii =niformxx iiiii ,1)()var( 20 =>−=<=μ
jiwithnjiformxmxxx jjiijiij ≠=>−−=<= ,1,))((),cov( 00μ
11,)()(
),cov(≤≤−
×== ij
ji
ji
jjii
ijij where
xstdxstdxx
ρμμ
μρ
Yelow colored: need to be confirmed by SG33 members. Pink colored: Typo or correction. Nov.29, 2012 M.Ishikawa

2
quantitatively, however, the knowledge on such measurement uncertainty would generally be very difficult to exactly obtain, according to D.L. Smith (Ref.7). For example, in the evaluation of JENDL-4.0 covariance for the fission cross-section of the major actinides in the high-energy range, the variances obtained with the simultaneous least-square fitting method using the SOK code (JAEA, Ref.11) were multiplied with a factor of 2 in order to take into account the hidden correlations among measurements (Ref. 3). 2) Resonance region To evaluate the covariance of the resolved resonance region for the major actinides such as U-235, 238, and Pu-239, the results of the full scale R-matrix solution using such as the SAMMY code (Ref. 12) are available. The covariance data of the resonance parameters are usually too huge to accommodate in a library, therefore, the resonance parameter errors and correlations are propagated to the cross-section covariance, i.e. File 33 in the ENDF format. As mentioned in the generalized least-square fitting case, the uncertainties of the computed cross sections by the SAMMY fitting were found to be unrealistically underestimated, although the uncertainties of resonance energies and widths seemed realistic. Therefore, in the evaluation of ENDF/B-VII.1 covariance data, systematic uncertainties of background, normalization, scattering radius and other long-range correlations have been included in the analysis bringing computed cross section uncertainties to a more plausible level (Ref.8). For the resonance region covariance of minor actinides, the structural isotopes or fission products, more simplified methods such as the kernel approximation (BNL, Ref.13), or the integral method (LANL, Ref.14) are applied, where some a priori uncertainty estimations of the resonance parameters such as those by Mughabghab (Ref. 15) are propagated to the cross-section uncertainty. 3) Kalman-filter method The basic idea of this method is to optimize the nuclear model parameters by the inclusion of the cross-section measurement information with the Bayesian parameter estimation. In several libraries, the Bayesian code KALMAN (Kyushu Univ. & JAEA, Ref.16) is adopted to be connected with the theoretical nuclear model codes such as GNASH (LANL, Ref.17), EMPIRE (BNL, Ref.18), TALYS (NRG, Ref.19) or CCONE (JAEA, Ref.20). The CONRAD code (CEA, Ref.21) also has the capability to evaluate the cross-section covariance by combining the Bayesian technique with the nuclear theoretical model parameters. The largest advantage in the KALMAN technique is that even the uncertainty of the cross section in the energy or reaction for which no experimental data are available, can be estimated by extrapolating the obtained uncertainties of nuclear model parameters through the theoretical model. On the other hand, the KALMAN tecqnique has some disadvantages such as the assumption of linearity through the model parameter sensitivities, the difficulty to take into account the deficiency of the adopted nuclear models themselves (Ref.22, 23), or the necessity of preparation for the prior covariance data of the model parameters. Since the KALMAN method utilizes the experimental information, it is also unavoidable to suffer from the unrecognized correlation problem as well as other methods. 4) Monte Carlo-based method Recent increase of computer speed and memory made the inclusion of Monte Carlo (MC) methodology possible to evaluate the covariance of nuclear data as well as the best-estimated values (NRG, Ref.24, 25). One of the advantage for the MC-based method is that it does not need the sensitivity of nuclear model parameters, which makes the method free from the assumption of linearity. The MC method, however, has not only the need of enormous computing time to obtain sufficiently small statistical errors, but the similar disadvantages with other deterministic Bayesian methods such as

3
the need of the prior model parameter uncertainty, shape and correlation for random sampling, the difficulty to take into account the deficiency of the nuclear models, and the quality and quantity of the cross-section measurements. 5.3 Comparison of JENDL-4.0 and COMMARA-2.0 Covariance The actual covariance data of J-4.0 and C-2.0 are surveyed and compared. As for the 11 isotopes treated in the SG33 exercise, that is, B-10, O-16, Na-23, Fe-56, Cr-52, Ni-58, U-235, -238, Pu-239, 240, and -241, their covariance data are found to be rather similar between the two libraries, probably due to the use of similar evaluation methodology such as the full or simplified R-matrix analysis, the Bayesian estimation connected with some theoretical nuclear model codes, or the simultaneous evaluation for fission data of major actinides, etc. Further, the cross-section measurement data to fit the nuclear model parameters are also quite common by referring the open database, that is, EXFOR (IAEA, Ref.26). However, there are some isotope-reaction-energy regions where the covariance data of the two libraries are notably different. Three examples are shown below: 1) U-235 capture data in 3~300keV energy region As seen in Fig.5.1, the standard deviation (STD) of C-2.0 is exactly ±20%, while that of J-4.0 is very small around ±2~4%. Further, the correlations of C-2.0 are almost perfect positive, but those of J-4.0 is partially. The difference of the capture cross-section center values between ENDF/B-VII.0 and J-4.0 is around -10~+5% in this energy range. From the references (Ref.4, 2), C-2.0 applied the Baysian code KALMAN with the GNASH code for the covariance evaluation, on the other hand, JENDL-4.0 used the generalized least square code GMA. It seems not probable these two methods
COMMARA-2.0JENDL-4.0
Figure 5.1 Comparison of JENDL-4.0 and COMMARA-2.0 Covariance (1/3) - U-235 Capture -
4
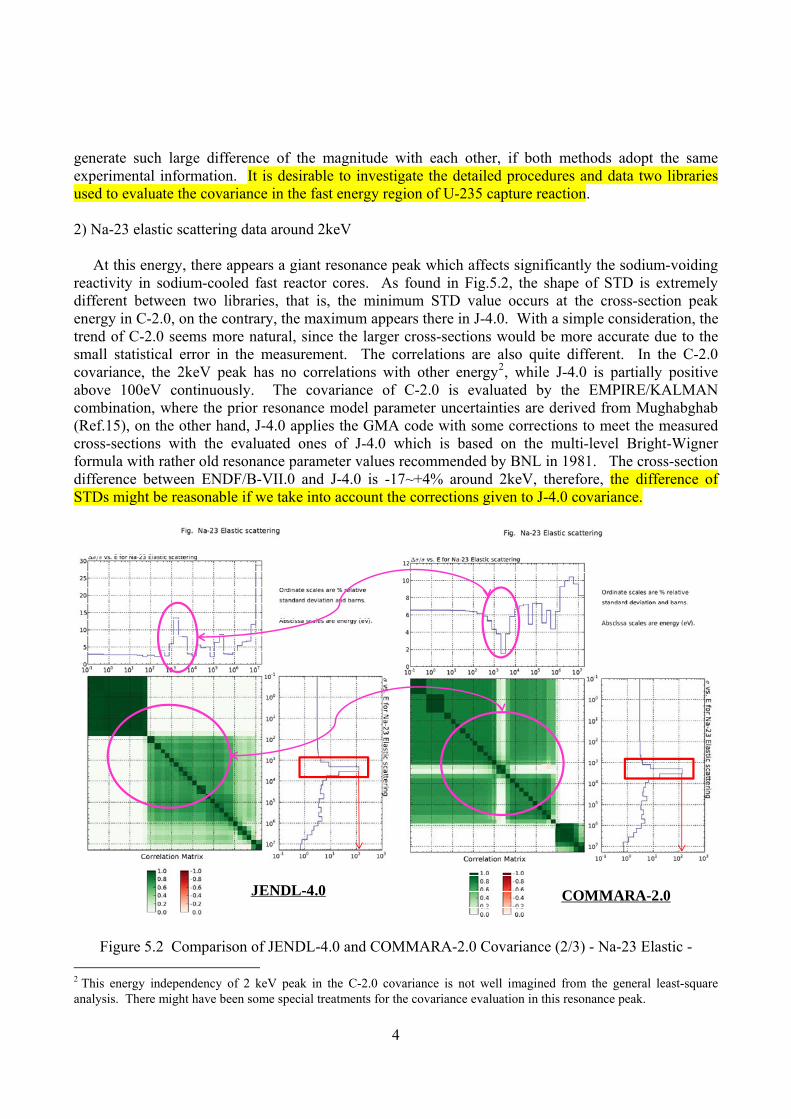
generate such large difference of the magnitude with each other, if both methods adopt the same experimental information. It is desirable to investigate the detailed procedures and data two libraries used to evaluate the covariance in the fast energy region of U-235 capture reaction. 2) Na-23 elastic scattering data around 2keV At this energy, there appears a giant resonance peak which affects significantly the sodium-voiding reactivity in sodium-cooled fast reactor cores. As found in Fig.5.2, the shape of STD is extremely different between two libraries, that is, the minimum STD value occurs at the cross-section peak energy in C-2.0, on the contrary, the maximum appears there in J-4.0. With a simple consideration, the trend of C-2.0 seems more natural, since the larger cross-sections would be more accurate due to the small statistical error in the measurement. The correlations are also quite different. In the C-2.0 covariance, the 2keV peak has no correlations with other energy2, while J-4.0 is partially positive above 100eV continuously. The covariance of C-2.0 is evaluated by the EMPIRE/KALMAN combination, where the prior resonance model parameter uncertainties are derived from Mughabghab (Ref.15), on the other hand, J-4.0 applies the GMA code with some corrections to meet the measured cross-sections with the evaluated ones of J-4.0 which is based on the multi-level Bright-Wigner formula with rather old resonance parameter values recommended by BNL in 1981. The cross-section difference between ENDF/B-VII.0 and J-4.0 is -17~+4% around 2keV, therefore, the difference of STDs might be reasonable if we take into account the corrections given to J-4.0 covariance.
JENDL-4.0 COMMARA-2.0
Figure 5.2 Comparison of JENDL-4.0 and COMMARA-2.0 Covariance (2/3) - Na-23 Elastic -
2 This energy independency of 2 keV peak in the C-2.0 covariance is not well imagined from the general least-square analysis. There might have been some special treatments for the covariance evaluation in this resonance peak.

5
3) Fe-56 elastic scattering data in 0.3~25keV The central values of Fe-56 elastic scattering cross-section in the resonance region from 1.0E-5eV through 850keV are almost identical between ENDF/B-VII.0 and JENDL-4.0, since the resonance parameters adopted in both libraries are based on a common evaluation around 1990. The covariance data of C-2.0 and J-4.0 were, however, independently evaluated. In the C-2.0 covariance, the resonance region of Fe-56 up to 850keV were evaluated with the kernel approximation and data from Mughabghab (Ref.4), on the other hand, the covariance of J-4.0 were firstly estimated from the experimental data with the GMA code, then, the estimated variances were modified by considering the difference between the average of the experimental data and that of JENDL-4 (Ref.2). The differences of the STD shapes and the correlations in Fig.5.3 might stem from these utterly different methodologies of their covariance evaluations, though the energy-averaged STD values seem rather similar with each other, that is, ±5.6% in C-2.0 and ±4.5~11% in J-4.0.
JENDL-4.0 COMMARA-2.0
Figure 5.3 Comparison of JENDL-4.0 and COMMARA-2.0 Covariance (3/3) - Fe-56 Elastic -
5.4 Effect of Different Covariance Data to Adjustment As mentioned in Section 5.2, the central cross-section values and the corresponding covariance data of a library must be consistent in principle. However, here we intentionally replace the covariance data used in the adjustment procedure with the same values of other parameters, especially the C/E values which completely depends on the central cross-sections, to depict the pure effects of the different covariance data to the adjusted results. Three adjustment cases are surveyed as follows:

6
Case J: This is the reference adjustment case. Cross-sections and covariance data are both based on
the JENDL-4.0 library (J-4.0, Ref.2, 3). Case B0: The covariance data in Case J are replaced with those of COMMARA-2.0 (C-2.0, Ref.4). As
the exception, the missing covariance data in C-2.0 below are substituted with those of J-4.0. The other adjustment parameters are identical with Case J.
- Mu-bar of U-235, -238, Pu-239, -240, -241, B-10, O-16, Cr-52, Ni-58,3 - Nu-d of U-235, -238, Pu-239, -240, -241.4 Case B2: The covariance data are only adopted from C-2.0. No J-4.0 covariance data are
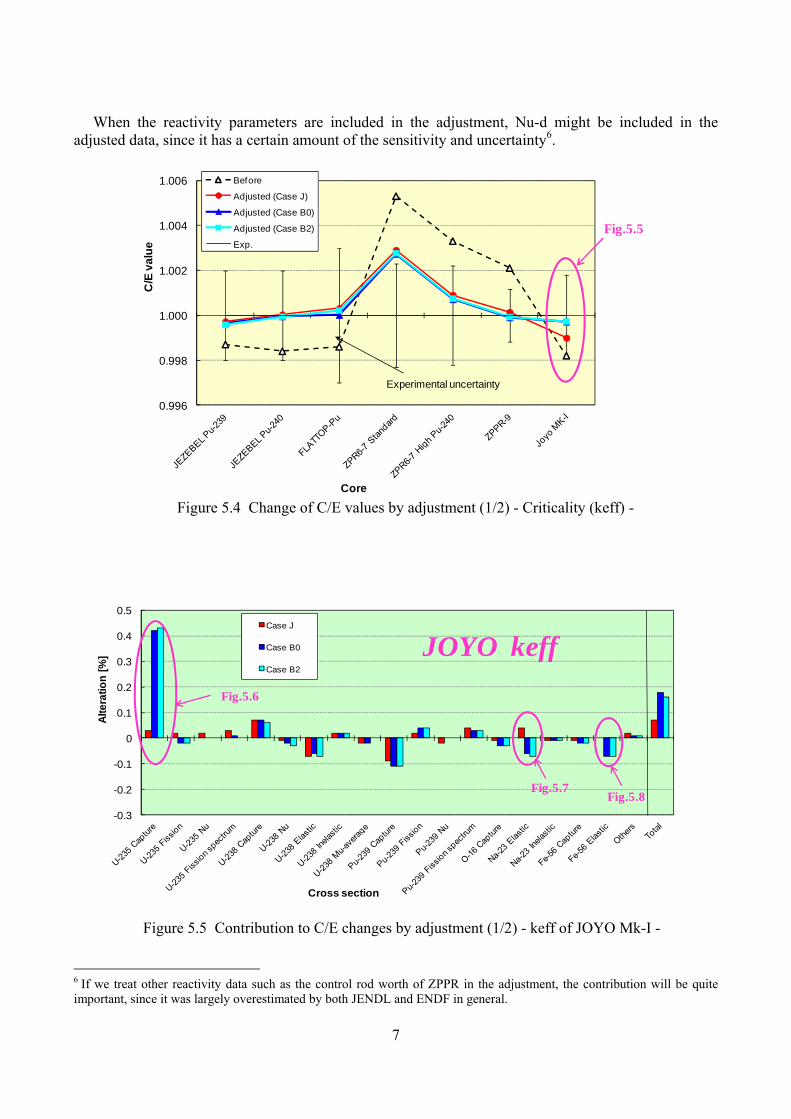
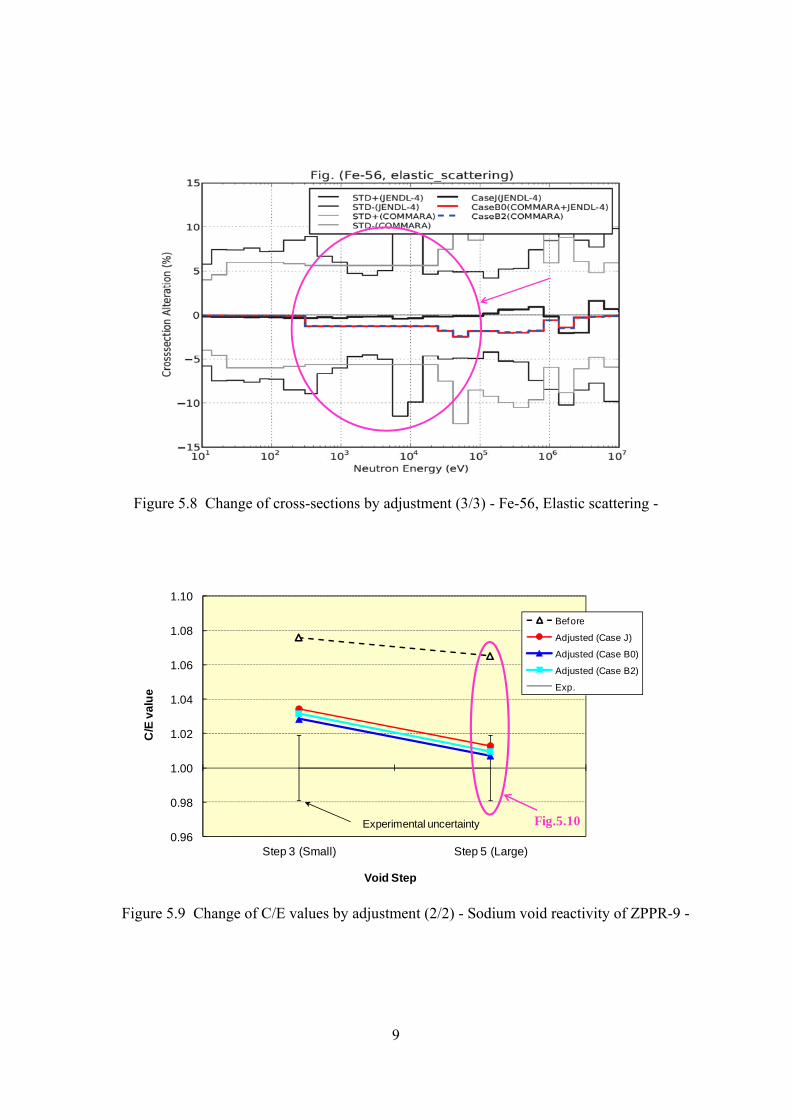
supplemented. The other adjustment parameters are identical with Case J. To investigate the effect of different covariance data and its physical mechanism, we focus on the results of the criticality and the sodium void reactivity below: 1) Criticality (keff) Figure 5.4 compares the keff C/E changes of the three cases by the adjustment. It is found that the adjusted C/E values of the three cases are almost identical for keff of small through large cores. In detail, however, there are some differences between Case J and Case B0/B2 for the keff of the JOYO Mk-I core which contains the U-235 fuel as well as plutonium, while the other cores do not include U-235 in fuel. The use of C-2.0 shows better improvement of JOYO C/E values than J-4.0. The nuclide- and reaction-wise contributions for the C/E changes of JOYO keff in the three cases are shown in Fig.5.5. As seen, the contribution of U-235 capture cross-section is significantly different by 400pcm between the J-4.0 and C-2.0 covariance data. Further, those of Na-23 and Fe-56 elastic scattering are even opposite in sign. The reasons of these contribution differences could be inferred from Fig.5.6~5.8. As for U-235 capture case, the difference of STDs between C-2.0 and J-4.0 significantly affected the changing rate of the cross-section. The small STD of J-4.0 must constrain the alteration of the cross-section by the adjustment. The large STD of C-2.0 would allow the large changing rate of the U-235 capture cross-sections to improve the C/E value of JOYO keff by the adjustment5. The decrease of Na-23 elastic cross-section in C-2.0 would result in the increase of the neutron leakage from the JOYO core, i.e., the negative reactivity, on the contrary, the increase in J-4.0 would be the positive reactivity. The effect of Fe-56 elastic contribution to JOYO keff could be explained with the same mechanism, where the changing rate of C-2.0 is constant in energy due to the strong positive correlations as seen in Fig.5.3. 2) Sodium void reactivity The adjusted C/E values of the sodium void reactivity in ZPPR-9 are shown in Fig.5.9. All three cases improve the C/E values by 4-6%. In detail, the C/E values of Case B0 seems a little better than those of Case B2, the major difference of which is to adjust the delayed neutron data (Nu-d) or not. As seen in Fig.5.10, Nu-d of U-238 and Pu-239 certainly contribute to improve the reactivity C/E values, though the amount is rather small compared with those of other cross-sections such as U-238 inelastic, capture or Na-23 inelastic cross-sections. Table 5.1 summarize the uncertainties of Nu-d and the changing rates by the adjustment for the three cases.
3 the mu-bar covariance data of Na-23, Fe-56 are adopted from C-2.0. 4 There are no nu-d covariance data in C-2.0. 5 The change of C-2.0 might be consistent with the conclusion of WPEC/SG29, that is, the possibility of the U-235 capture overestimation in the ENDF/B-VII.0 library.
7
When the reactivity parameters are included in the adjustment, Nu-d might be included in the adjusted data, since it has a certain amount of the sensitivity and uncertainty6.
0.996
0.998
1.000
1.002
1.004
1.006
C/E
val
ue
Core
Before
Adjusted (Case J)
Adjusted (Case B0)
Adjusted (Case B2)
Exp.
Experimental uncertainty
Fig.5.5
Figure 5.4 Change of C/E values by adjustment (1/2) - Criticality (keff) -
-0.3
-0.2
-0.1
0
0.1
0.2
0.3
0.4
0.5
Alte
ratio
n [%
]
Cross section
Case J
Case B0
Case B2
JOYO keffFig.5.6
Fig.5.7Fig.5.8
Figure 5.5 Contribution to C/E changes by adjustment (1/2) - keff of JOYO Mk-I -
6 If we treat other reactivity data such as the control rod worth of ZPPR in the adjustment, the contribution will be quite important, since it was largely overestimated by both JENDL and ENDF in general.

8
Figure 5.6 Change of cross-sections by adjustment (1/3) - U-235, Capture -
Figure 5.7 Change of cross-sections by adjustment (2/3) - Na-23, Elastic scattering -
9
Figure 5.8 Change of cross-sections by adjustment (3/3) - Fe-56, Elastic scattering -
0.96
0.98
1.00
1.02
1.04
1.06
1.08
1.10
Step 3 (Small) Step 5 (Large)
C/E
val
ue
Void Step
Before
Adjusted (Case J)
Adjusted (Case B0)
Adjusted (Case B2)
Exp.
Experimental uncertainty Fig.5.10
Figure 5.9 Change of C/E values by adjustment (2/2) - Sodium void reactivity of ZPPR-9 -

10
-6
-5
-4
-3
-2
-1
0
1
Alte
ratio
n [%
]
Cross section
Case J
Case B0
Case B2
ZPPR-9 Na void reactivity (Step 5)
Table 5.1
Figure 5.10 Contribution to C/E changes by adjustment (2/2) - Sodium void reactivity of ZPPR-9 (Step5) -
Table 5.1 Chang of delayed neutron data (Nu-d) by adjustment
Fission isotope
Standard deviation
(%)
Change by adjustment
Case J Case B0 Case B2
U-235 2.7 % +0.00 % +0.00 % -
U-238 3.4 % -0.49 % -0.37 % -
Pu-239 4.4 % -0.41 % -0.30 % -
Pu-240 4.9 % +0.00 % +0.00 % -
Pu-241 5.0 % +0.00 % +0.00 % -

11
5.5 Concluding Remarks From the surveys on the covariance data in this chapter, following points could be concluded. - In the past decades, the great efforts have been performed to develop the evaluation methodology of
the covariance data all over the world. The latest libraries such as JENDL-4.0, COMMARA-2.0 or ENDF/B-VII.1 supply the excellent covariance data for the users from the viewpoints of both quality and quantity. However, it is also true that there are plenty of rooms to improve the covariance data, not only the evaluation methodology but the quality of the measurement data used, for example, the precise inclusion of complicated correlations.
- From the comparison of the actual JENDL-4.0 and COMMARA-2.0 covariance data, we found both reasonable evaluation results and questionable ones among them. There seems no "golden rule of thumb" to improve the real covariance data, therefore, the persistent efforts to solve the individual problems would be the only way to reach the success of the covariance fields. The close conversation between the evaluators and the users of nuclear data could be a great help for this long and tough process.
- As the results of the trial survey to use the different covariance data in the SG33 adjustment exercise, the followings are observed: a) The adjusted C/E values were not significantly affected by the difference of covariance data between JENDL-4.0 and COMMARA-2.07. b) On the other hand, the alteration of nuclear data by the adjustment was extremely controlled by the covariance data, that is, both the standard deviation values and correlations. This difference of the changing rate of nuclear data would affect the extrapolation ability of the adjustment. c) If some nuclear data have the finite uncertainty and sensitivity to the targeted integral parameters, they should be included in the adjustment data in principle, for example, the delayed neutron data to adjust reactivity parameters.
References
1. D.L. Smith: "Probability, Statistics, and Data Uncertainties in Nuclear Science and Technology", An OECD Nuclear Energy Agency Nuclear Data Committee Series, Nuclear Physics and Nuclear Data in Science and Technology, Volume 4 (1991).
2. K. Shibata, O. Iwamoto, T. Nakagawa, N. Iwamoto, A. Ichihara, S. Kunieda, S. Chiba, K. Furutaka, N. Otuka, T. Ohsawa, T. Murata, H. Matsunobu, A. Zukeran, S. Kamada and J. Katakura: "JENDL-4.0: A New Library for Nuclear Science and Engineering", Journal of Nuclear Science and Technology, Vol.48, No.1, pp.1-30, (January 2011), and JENDL-4.0 homepage, http://wwwndc.jaea.go.jp/jendl/j40/j40.html.
3. O. Iwamoto, T. Nakagawa and S. Chiba: "Covariance Evaluation for Actinide Nuclear Data in JENDL-4.0", Journal of Korean Physical Society (Proceedings of International Conference on Nuclear Data for Science and Technology, ND2010), Vol.59, No.2, pp.1224-1229 (August 2011).
4. M. Herman, P. Obložinský, C.M. Matoon, M. Pigni, S. Hoblit, S.F. Mughabghab, A. Sonzogni, P. Talou, M.B. Chadwick, G.M. Hale, A.C. Kahler, T. Kawano, R.C. Little and P.G. Young: "COMMARA-2.0 Neutron Cross Section Covariance Library", BNL-94830-2011, U.S. Department of Energy (March 2011).
5. M.B. Chadwick, P. Oblozinsky, M. Herman, N.M. Greene, R.D. McKnight, D.L. Smith, P.G.
7 This fact could be explained with the basic equation of the adjustment, see Eq.(A.10) in Appendix A. If the prior cross-section-induced uncertainty, GMGt, is much larger than the integral uncertainty, Ve+Vm, then the posteria prior cross-section-induced uncertainty, GM'Gt, will be close to the integral uncertainty.
12
Young, R.E. MacFarlane, G.M. Hale, S.C. Frankle, A.C. Kahler, T. Kawano, R.C. Little, D.G. Madland, P. Moller, R.D. Mosteller, P.R. Page, P. Talou, H. Trellue, M.C. White, W.B. Wilson, R. Arcilla, C.L. Dunford, S.F. Mughabghab, B. Pritychenko, D. Rochman, A.A. Sonzogni, C.R. Lubitz, T.H. Trumbull, J.P. Weinman, D.A. Brown, D.E. Cullen, D.P. Heineichs, D.P. McNabb, H. Derrien, M.E. Dunn, N.M. Larson, L.C. Leal, A.D. Carlson, R.C. Block, J.B. Briggs, E.T. Cheng, H.C. Huria, M.L. Zerkle, K.S. Kozier, A. Courcelle, V. Oronyaev and S.C. van der Mark: "ENDF/B-VII.0: Next Generation Evaluated Nuclear Data Library for Nuclear Science and Technology", Nuclear Data Sheets, Volume 107, Number 12, pp.2931-3060 (December 2006).
6. M.B. Chadwick, M. Herman, P. Obložinský, M.E. Dunn, Y. Danon, A.C. Kahler, D.L. Smith, B. Pritychenko, G. Arbanas, R. Arcilla, R. Brewer, D.A. Brown, R. Capote, A.D. Carlson, Y.S. Cho, H. Derrien, K. Guber, G.M. Hale, S. Hoblit, S. Holloway, T.D. Johnson, T. Kawano, B.C. Kiedrowski, H. Kim, S. Kunieda, N.M. Larson, L. Leal, J.P. Lestone, R.C. Little, E.A. McCutchan, R.E. MacFarlane, M. MacInnes, C.M. Mattoon, R.D. McKnight, S.F. Mughabghab, G.P.A. Nobre, G. Palmiotti, A. Palumbo, M.T. Pigni, V.G. Pronyaev, R.O. Sayer, A.A. Sonzogni, N.C. Summers, P. Talou, I.J. Thompson, A. Trkov, R.L. Vogt, S.C. van der Marck, A. Wallner, M.C. White, D. Wiarda, P.G. Young: "ENDF/B-VII.1 Nuclear Data for Nuclear Science and Technology: Cross Sections, Covariances, Fission Product Yields and Decay Data", Nuclear Data Sheets, Volume 112, Number 12, pp.2887-2996 (December 2011).
7. D.L. Smith: "Evaluated Nuclear Data Covariances: The Journey From ENDF/B-VII.0 to ENDF/B-VII.1", Nuclear Data Sheets 112, pp.3037-3053 (2011).
8. M. Herman: "Development of ENDF/B-VII.1 and Its Covariance Component", Journal of Korean Physical Society (Proceedings of International Conference on Nuclear Data for Science and Technology, ND2010), Vol.59, No.2, pp.1034-1039 (August 2011).
9. W.P. Poenitz: "Data Interpretation, Objective Evaluation Procedures and Mathematical Techniques for the Evaluation of Energy-dependent Ratio, Shape and Cross Section Data", Proceedings of the Conference on Nuclear Data Evaluation Methods and Procedures, Brookhaven National Laboratory, New York, Sep. 22-25, 1980, BNL-NCS-51363, pp.249-289 (1981).
10. D.W. Muir: "ZOTT99, Data Evaluation Using Partitioned Least-Squares", Code package IAEA1371/01, NEA Computer Program Service (1999).
11. T. Kawano, H. Matsunobu, T. Murata, A. Zukeran, Y. Nakajima, M. Kawai, O. Iwamoto, K. Shibata, T. Nakagawa, T. Ohsawa, M. Baba and T. Yoshida: "Simultaneous Evaluation of Fission Cross Sections of Uranium and Plutonium Isotopes for JENDL-3.3", Journal of Nuclear Science and Technology, Vol.37, No.4, pp.327-334 (April 2000).
12. N.M. Larson: "Updated Users' Guide for SAMMY: Multilevel R-matrix Fits to Neutron Data using Bayes' Equations", Oak Ridge National Laboratory, ORNL/TM-9179/R8 (October 2008).
13. P. Obložinský, Y.-S. Cho, C.M. Mattoon, S.F. Mughabghab: " Formalism for neutron cross section covariances in the resonance region using kernel approximation", Brookhaven National Laboratory, BNL-91287-2010 (April 2010).
14. R.C. Little, T. Kawano, G.D. Hale, M.T. Pigni, M. Herman, P. Obložinský, M.L. Williams, M.E. Dunn, G. Arbanas, D. Wiarda, R.D. McKnight, J.N. McKamy, J.R. Felty: " Low-fidelity Covariance Project", Nuclear Data Sheets 109, pp.2828–2833 (2008).
15. S.F. Mughabghab: "Atlas of Neutron Resonances, Resonance Parameters and Thermal Cross Sections, Z = 1-100, 5th Edition", Elsevier, Amsterdam (2006).
16. T. Kawano and K. Shibata: "Covariance Evaluation System", Japan Atomic Energy Research Institute, JAERI-Data/Code 97-037 (September 1997).
17. P.G. Young, M.B. Chadwick, R.E. MacFarlane, P. Talou, T. Kawano, D.G. Madland, W.B. Wilson, and C.W. Wilkerson: " Evaluation of Neutron Reactions for ENDF/B-VII: 232−241U and 239Pu", Nuclear Data Sheets 108, pp.2589-2654 (2007).
13
18. M. Herman, R. Capote, B.V. Carlson, P. Obložinský, M. Sin, A. Trkov, H. Wienke, and V. Zerkin: "EMPIRE: Nuclear Reaction Model Code System for Data Evaluation", Nuclear Data Sheets 108, pp.2655–2715 (2007).
19. A.J. Koning, S. Hilaire,a, and M.C. Duijvestijn: "TALYS-1.0", Proceedings of International Conference on Nuclear Data for Science and Technology, ND2007), Session-4: Nuclear models, DOI: 10.1051/ndata:07767 (2007).
20. O. Iwamoto: " Development of a Comprehensive Code for Nuclear Data Evaluation, CCONE, and Validation Using Neutron-Induced Cross Sections for Uranium Isotopes", Journal of Nuclear Science and Technology, Vol.44, No.5, pp.687-697, (May 2007).
21. C. De Saint Jean, B. Habert, P. Archier, G. Noguere, D. Bernard, J. Tommasi and P. Blaise: " Uncertainty Evaluation of Nuclear Reaction Model Parameters Using Integral and Microscopic Measurements with the CONRAD Code", Journal of Korean Physical Society (Proceedings of International Conference on Nuclear Data for Science and Technology, ND2010), Vol.59, No.2, pp.1276-1279 (August 2011).
22. M. Herman, M.T. Pigni, P. Obložinský, S.F. Mughabghab, C.M. Mattoon, R. Capote, Young-Sik Cho, A. Trkov: " Development of Covariance Capabilities in EMPIRE Code", Nuclear Data Sheets 109, pp.2752–2761 (2008).
23. M. Herman, E. Bauge, R. Capote, U. Fisher, A.Yu. Konobeyev, P.E. Pereslavtsev, M. Herman, P. Obložinský, M.T. Pigni, T. Kawano, P. Talou, I. Kodeli, A. Trkov, A. Koning, D. Rochman, H. Leeb, D. Neudecker, and D.L. Smith: "Covariance Data in the Fast Neutron Region", Nuclear Energy Agency, International Evaluation Co-operation , Volume 24, NEA/NSC/WPEC/DOC(2010)427 (2011).
24. A.J. Koning: "New working methods for nuclear data evaluation: how to make a nuclear data library?", Proceedings of International Conference on Nuclear Data for Science and Technology, ND2007), Session-11: Evaluated files, methods and processing, DOI: 10.1051/ndata:07683 (2007).
25. D. Rochman, A. J. Koning, S. C. van der Marck, A. Hogenbirk and D. van Veen: " Nuclear Data Uncertainty Propagation: Total Monte Carlo vs. Covariances", Journal of Korean Physical Society (Proceedings of International Conference on Nuclear Data for Science and Technology, ND2010), Vol.59, No.2, pp.1236-1241 (August 2011).
26. E. Dupont, A.J. Koning and N. Otuka: " Exploratory Data Analysis of the EXFOR Database", Journal of Korean Physical Society (Proceedings of International Conference on Nuclear Data for Science and Technology, ND2010), Vol.59, No.2, pp.1333-1336 (August 2011).