year ended december 31, 2010 consolidated earnings …yen / can$) 116.34 97.97 82.30 85.18 87.00 *1:...
TRANSCRIPT
Consolidated Results (Year ended December 31, 2010)1. Consolidated Financial Highlights2. Condensed Consolidated Statements of Income Sales Breakdown for Japanese Alcoholic Beverages3. Consolidated Statements of Income: Breakdown of Key Changes4. Segment Information5. Condensed Consolidated Balance SheetsConsolidated Forecasts (Year ending December 31, 2011)6. Consolidated Results Forecast (Year ending December 31, 2011) Sales Breakdown for Japanese Alcoholic Beverages7. Consolidated Statements of Income (Year ending December 31, 2011): Breakdown of Key Changes8. Segment Information (Year ending December 31, 2011)Reference Materials9. Consolidated Management Indexes and Major Sales Volume Data10. Overview of Segmentation Changes
Securities Code: 2501 URL http://www.sapporoholdings.jp/english/
Year ended December 31, 2010Consolidated Earnings Report - Supplementary Information
February 2011
1

Consolidated Financial Highlights (billions of yen, except percentages, ratios, per-share data, and exchange rates)
Net sales 511.7 479.5 494.9 453.6 435.0 Net sales (exluding liquor tax) 340.7 320.0 333.6 308.1 294.0 Overseas net sales to total (excluding liquor tax) 1.0% 1.2% 1.2% 1.5% 1.8%
Operating income 10.9 13.3 23.6 10.3 8.6 Operating margin (including liquor tax) 2.1% 2.8% 4.8% 2.3% 2.0% Operating margin (excluding liquor tax) 3.2% 4.2% 7.1% 3.3% 2.9%Ordinary income 2.3 6.7 18.0 6.6 5.8Net income 1.1 2.4 4.6 3.6 2.3Total assets 717.4 630.6 602.1 563.8 589.5Net assets 106.5 87.3 92.2 111.4 113.5Balance of debt *1 364.3 323.3 289.8 220.7 236.0Debt-to-equity ratio (times) 3.4 3.7 3.1 2.0 2.1Capital expenditures (cash basis) 11.9 8.8 8.3 12.5 21.8Depreciation and amortization 31.4 28.4 25.3 22.0 21.9Amortization of goodwill 0.0 0.0 0.0 0.0 0.0EBITDA *2 42.4 41.7 48.9 32.3 30.5ROE (%) 1.2 2.6 5.2 3.6 2.1EPS (before goodwill amortization) 3.45 6.95 13.07 10.20 6.38EPS (after goodwill amortization) 3.45 6.95 13.07 10.20 6.38Exchange rates (Yen / US$) 119.95 107.15 104.20 118.07 119.12 (Yen / CAN$) 102.59
Net sales 449.0 414.5 387.5 389.2 482.0 Net sales (exluding liquor tax) 309.7 284.4 264.6 269.8 363.0 Overseas net sales to total (excluding liquor tax) 9.0% 8.8% 8.5% 9.4% 11.0%
Operating income 12.3 14.6 12.8 15.4 18.0 Operating margin (including liquor tax) 2.8% 3.5% 3.3% 4.0% 3.7% Operating margin (excluding liquor tax) 4.0% 5.2% 4.9% 5.7% 5.0%Ordinary income 8.1 10.5 10.7 14.3 15.5Net income 5.5 7.6 4.5 10.7 6.0Total assets 561.8 527.2 506.8 494.7Net assets 125.1 116.8 118.5 126.6Balance of debt *1 212.4 189.2 196.7 181.3 208.4Debt-to-equity ratio (times) 1.7 1.6 1.7 1.4 1.6Capital expenditures (cash basis) 19.8 27.3 21.8 19.8 20.5Depreciation and amortization 24.5 21.6 22.5 22.5 25.7Amortization of goodwill 0.8 0.8 1.0 1.1 3.5EBITDA *2 37.6 37.0 36.4 39.0 47.2ROE (%) 4.6 6.3 3.9 8.9 4.8EPS (before goodwill amortization) 16.32 21.70 14.19 30.50 24.26EPS (after goodwill amortization) 14.10 19.49 11.57 27.50 15.32Exchange rates (Yen / US$) 114.15 103.49 93.65 87.79 88.00 (Yen / CAN$) 116.34 97.97 82.30 85.18 87.00*1: The balance of debt includes commercial paper but excludes the balance of lease obligations.*2: EBITDA = Operating income + Depreciation and amortization + Amortization of goodwill*3: Exchange rates for 2007 and before are year-end rates; for 2008 and after are annual average rates.
2002 2003 2004 2005 2006
2011(forecast)20102007 2008 2009
Financial Highlights (2002 - 2011)
2

Condensed Consolidated Statements of Income (billions of yen)
Alcoholic Beverages 305.4 304.2 (1.2) (0.4) Japan 282.9 278.8 (4.0) (1.4) International 22.5 25.3 2.8 12.4Soft Drinks 30.7 34.4 3.6 12.0Restaurants 28.0 27.0 (0.9) (3.5)Real Estate 23.2 23.5 0.2 1.2
Net sales 387.5 389.2 1.7 0.4Alcoholic Beverages 8.1 9.8 1.6 19.9 Japan 7.4 9.3 1.8 24.3 International 0.6 0.5 (0.1) (27.7)Soft Drinks 0.3 0.5 0.2 74.8Restaurants (0.1) 0.1 0.2 -
Real Estate 7.5 8.0 0.4 6.4
General corporate andintercompany eliminations (2.9) (3.0) (0.1) -
Operating income 12.8 15.4 2.5 19.4Non-operating income 2.2 2.9 0.7 32.0Non-operating expenses 4.3 4.0 (0.3) (8.7)
Ordinary income 10.7 14.3 3.6 33.6Extraordinary gains 0.9 17.8 16.8 ********Extraordinary losses 2.8 14.4 11.6 411.9
8.8 17.7 8.8 100.2
Income taxes 4.3 6.9 2.6 60.8Minority interests (loss) (0.0) (0.0) 0.0 -
Net income 4.5 10.7 6.2 137.5
Sales (including liquor tax) (billions of yen)Year ended
December 31,2009
Year endedDecember 31,
2010Change Change (%)
Beer 175.5 170.9 (4.6) (2.6)Happoshu 12.2 9.2 (3.0) (24.6)New genre 63.4 69.8 6.4 10.1Total 251.2 250.0 (1.2) (0.5)
Sales (excluding liquor tax) (billions of yen)Year ended
December 31,2009
Year endedDecember 31,
2010Change Change (%)
Beer 85.4 83.3 (2.1) (2.5)Happoshu 6.8 5.2 (1.6) (23.5)New genre 44.0 48.2 4.2 9.5Total 136.3 136.9 0.5 0.4
Year endedDecember 31,
2010Change (%)
Income before income taxesand minority interests
ChangeYear ended
December 31,2009
Sales Breakdown for Japanese Alcoholic Beverages
Consolidated Results (Year ended December 31, 2010)
3

(billions of yen)
DetailsYear ended
December 31,2009
Year endedDecember 31,
2010Change
Beer and related products 5.8 7.6 1.8 Marginal profit Subtotal 2.7
Increase (decrease) in volume / Product mix 1.1 Beer -1.6Happoshu -1.0New genre +3.1Product mix +0.6
Cost of raw ingredients and materials 1.8 Decrease in cost of raw ingredients and materialsOther cost reductions (0.2) Increase in transport costs, other factors
Fixed and other costs Subtotal (0.9)New sales and logistics system (1.8) Depreciation and amortization, other factorsSales promotion costs (0.0)
Other cost reductions 0.9 Decrease in personnel expenses, decrease in repair costs, other factors
Wine and spirits 0.6 0.8 0.1Other 1.0 0.9 (0.1) Shochu business, other factors
Alcoholic Beverages (Japan) 7.4 9.3 1.8Existing Alcoholic Beverages (Internationa 0.6 0.8 0.2
Increase (decrease) in volume / Product mix / Raw ingredients 0.8 Increase in volume +0.8, other factorsExchange rates (0.1)Other (0.5) Increase in marketing costs -0.5
Business in Vietnam 0.0 (0.3) (0.3)Alcoholic Beverages (International) 0.6 0.5 (0.1)
Soft Drinks 0.8 1.2 0.4Increase (decrease) in volume / Product mix (0.4) Increase in volume +0.2, product mix -0.6
Decrease in production costs 0.5 Decrease in cost of raw ingredients and materials +0.3, decrease in production costs +0.2
Other cost reductions 0.4 Decrease in vending machine expenses +0.2, synergy with POKKA +0.2
Food business (0.5) (0.7) (0.2)Soft Drinks 0.3 0.5 0.2
Existing stores 0.1New stores / Refurbished stores 0.1
Restaurants (0.1) 0.1 0.2Rent 0.1Sales 0.3 Chikusa Garden Terrace (condominium)
Real Estate 7.5 8.0 0.4General corporate and intercompany eliminations (2.9) (3.0) (0.1)
Change in operating income 12.8 15.4 2.5Financial income (expense) (2.7) (2.6) 0.1Equity in income (losses) of affiliates 0.3 0.6 0.3Other 0.3 0.9 0.7
Non-operating income and expenses (2.1) (1.1) 1.1Change in ordinary income 10.7 14.3 3.6
Gain on sales of property, plant and equipment 0.9 16.6 15.6 Sale of former Osaka plant site, other factorsGain on sales of investment securities 0.0 0.7 0.6Reversal of removal costs - 0.6 0.6Other extraordinary gains - 0.1 0.1Loss on disposal of property, plant and equipment (1.5) (10.1) (8.6) Disposal of trust beneficiary rights in Keiyo logistics center, other factorsImpairment losses (0.9) (2.4) (1.4) Goodwill impairment at Sleeman, other factors
Business structure improvement expenses - (0.7) (0.7) Strategic restructuring of domestic wine production operations, other factors
Other extraordinary losses (0.3) (1.3) (0.9) Devaluation of investment securities, other factorsExtraordinary gains and losses (1.9) 3.4 5.3
Change in income before income taxes and minority interests 8.8 17.7 8.8Change in income taxes and minority interests (loss) (4.3) (6.9) (2.6)
Change in net income 4.5 10.7 6.2
Consolidated Statements of Income Breakdown of Key Changes
Consolidated Results (Year ended December 31, 2010)
Year endedDecember 31, 2009
Year endedDecember 31, 2010
Yen / US$ 93.65 87.79Yen / CAN$ 82.30 85.18
4

Segment Information (billions of yen)Alcoholic
Beverages(Japan)
AlcoholicBeverages
(International)Soft Drinks Restaurants Real Estate Corporate and
eliminationsConsolidated
total
Net sales 282.9 22.5 30.7 28.0 23.2 - 387.5Operating income 7.4 0.6 0.3 (0.1) 7.5 (2.9) 12.8
Operating income before goodwill amortization 7.4 1.7 0.3 (0.1) 7.5 (2.9) 13.9Sales promotion costs
Sales incentives and commissions 14.5 0.0 4.6 0.0 0.0 (0.1) 19.0Advertising and promotion expenses 14.2 0.7 0.3 1.2 0.3 (0.1) 16.7Promotional items 6.4 0.7 0.0 0.0 0.0 0.0 7.1
Depreciation and amortization 14.2 1.0 0.4 0.8 6.1 0.0 22.5Amortization of goodwill 0.0 1.0 0.0 0.0 0.0 0.0 1.0EBITDA *1 21.6 2.6 0.7 0.7 13.6 (2.9) 36.4Capital expenditures (cash basis) 7.9 1.2 0.7 0.8 11.2 0.0 21.8
AlcoholicBeverages
(Japan)
AlcoholicBeverages
(International)Soft Drinks Restaurants Real Estate Corporate and
eliminationsConsolidated
total
Net sales 278.8 25.3 34.4 27.0 23.5 - 389.2Operating income 9.3 0.5 0.5 0.1 8.0 (3.0) 15.4
Operating income before goodwill amortization 9.3 1.6 0.5 0.1 8.0 (3.0) 16.5Sales promotion cost
Sales incentives and commissions 14.3 0.0 6.1 0.0 0.0 (0.0) 20.3Advertising and promotion expenses 14.4 0.9 0.3 1.1 0.3 (0.0) 17.1Promotional items 5.8 1.1 0.0 0.0 0.0 0.0 7.0
Depreciation and amortization 14.3 1.0 0.6 0.6 5.6 0.0 22.5Amortization of goodwill 0.0 1.1 0.0 0.0 0.0 0.0 1.1EBITDA *1 23.6 2.7 1.2 0.7 13.6 (3.0) 39.0Capital expenditures (cash basis) 4.6 2.3 0.6 0.6 11.6 0.0 19.8
AlcoholicBeverages
(Japan)
AlcoholicBeverages
(International)Soft Drinks Restaurants Real Estate Corporate and
eliminationsConsolidated
total
Net sales (4.0) 2.8 3.6 (0.9) 0.2 - 1.7Operating income 1.8 (0.1) 0.2 0.2 0.4 (0.1) 2.5
Operating income before goodwill amortization 1.8 (0.1) 0.2 0.2 0.4 (0.1) 2.6Sales promotion cost
Sales incentives and commissions (0.2) 0.0 1.5 0.0 0.0 (0.0) 1.3Advertising and promotion expenses 0.2 0.1 0.0 (0.0) 0.0 (0.0) 0.4Promotional items (0.6) 0.3 0.0 0.0 0.0 (0.0) 0.0
Depreciation and amortization 0.0 0.0 0.2 (0.2) (0.4) 0.0 (0.0)Amortization of goodwill 0.0 0.0 0.0 (0.0) 0.0 0.0 0.1EBITDA *1 2.0 0.0 0.5 0.0 0.0 (0.1) 2.6Capital expenditures (cash basis) (3.3) 1.0 (0.1) (0.2) 0.4 (0.0) (2.0)*1: EBITDA = Operating income + Depreciation and amortization + Amortization of goodwill
Year ended December 31, 2009
Year ended December 31, 2010
Change
Consolidated Results (Year ended December 31, 2010)
5

Condensed Consolidated Balance Sheets (billions of yen)
Current assets 102.2 109.7 7.4Cash and cash equivalents 6.3 13.3 7.0
Notes and accounts receivable - trade 60.1 61.3 1.2
Inventories 22.9 22.1 (0.7)Other 12.8 12.8 0.0
Fixed assets 404.5 385.0 (19.5)
Property, plant and equipment 324.8 306.9 (17.8)
Goodwill 14.9 14.1 (0.7)Investments and other assets 64.8 63.9 (0.8)
Total assets 506.8 494.7 (12.0)
Current liabilities 169.2 167.0 (2.2)Notes and accounts payable - trade 20.1 24.3 4.1Short-term debt 46.7 48.0 1.3Deposits received 27.0 19.2 (7.8)Other 75.2 75.3 0.1
Long-term liabilities 219.0 201.1 (17.9)
Long-term debt 150.0 133.2 (16.8)
Employees' retirement benefits 7.4 7.1 (0.2)Other 61.4 60.6 (0.8)
Total liabilities 388.2 368.1 (20.1)Shareholders' equity 119.3 127.3 7.9
Valuation and translation adjustments (0.9) (2.2) (1.2)
Minority interests 0.2 1.5 1.3
Total net assets 118.5 126.6 8.0
Total liabilities and net assets 506.8 494.7 (12.0)
Decrease due to account transfers to currentportion of long-term debt and current portion oflong-term bank loans, other factors (excludinglease obligations)
Mainly foreign currency translationadjustmentsMainly Sapporo Vietnam Limited
Decrease in beer gift voucher, other factors
Sale of Osaka plant site, disposal of Keiyologistics center, other factors
As ofDecember 31,
2009
As ofDecember 31,
2010Change
Increase in cash on hand
Consolidated Results (Year ended December 31, 2010)
Condensed Balance Sheets by Operating Company (billions of yen)
As of December 31, 2010 SAPPOROBREWERIES LTD.
SAPPOROINTERNATIONAL
INC.
SAPPOROBEVERAGE CO.,LTD.
SAPPOROLION
LIMITED
YEBISU GARDENPLACE CO.,LTD.
Current assets 73.0 0.7 16.0 2.1 1.7 Fixed assets 147.7 32.1 4.0 10.2 163.8Total assets 220.8 32.8 20.1 12.4 165.5
Current liabilities 151.1 0.5 11.0 2.2 99.6 Long-term liabilities 33.1 3.0 6.4 1.7 20.6 (Of which, financial liabilities) 57.2 3.0 3.8 0.0 93.6Total net assets 36.5 29.3 2.6 8.5 45.2Total liabilities and net assets 220.8 32.8 20.1 12.4 165.5
6
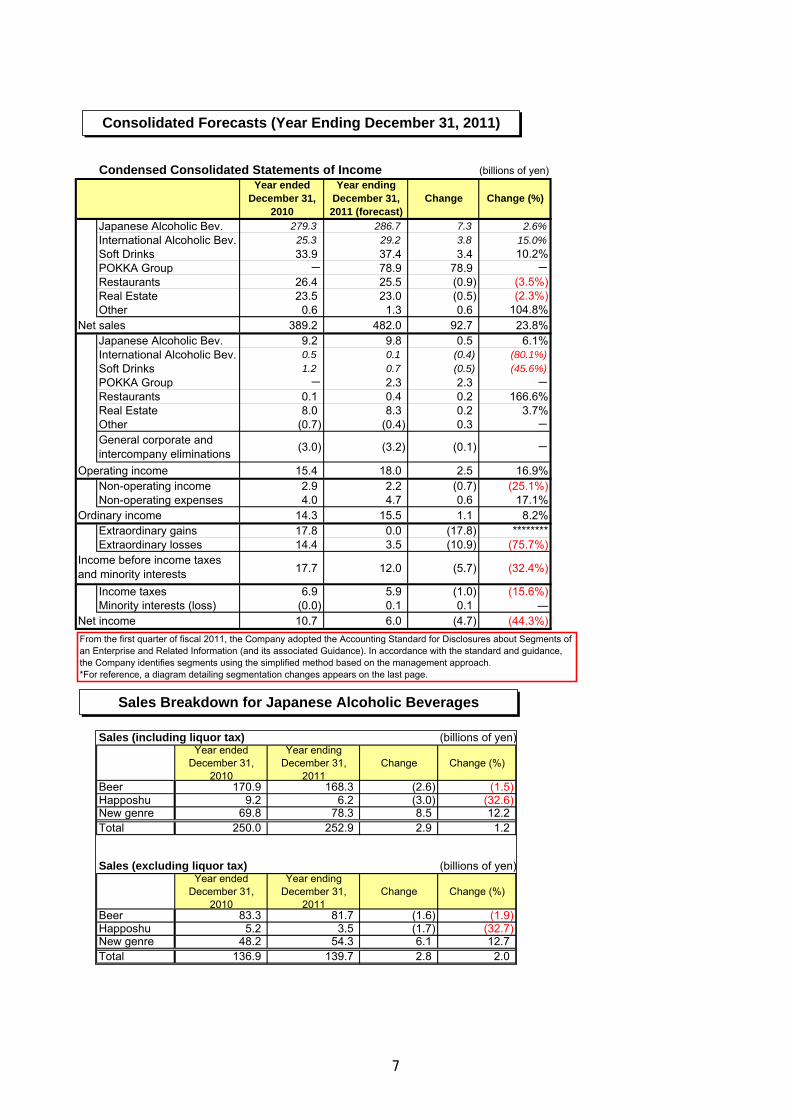
Condensed Consolidated Statements of Income (billions of yen)
Japanese Alcoholic Bev. 279.3 286.7 7.3 2.6%International Alcoholic Bev. 25.3 29.2 3.8 15.0%Soft Drinks 33.9 37.4 3.4 10.2%POKKA Group - 78.9 78.9 -Restaurants 26.4 25.5 (0.9) (3.5%)Real Estate 23.5 23.0 (0.5) (2.3%)Other 0.6 1.3 0.6 104.8%
Net sales 389.2 482.0 92.7 23.8%Japanese Alcoholic Bev. 9.2 9.8 0.5 6.1%International Alcoholic Bev. 0.5 0.1 (0.4) (80.1%)Soft Drinks 1.2 0.7 (0.5) (45.6%)POKKA Group - 2.3 2.3 -Restaurants 0.1 0.4 0.2 166.6%Real Estate 8.0 8.3 0.2 3.7%Other (0.7) (0.4) 0.3 -
General corporate andintercompany eliminations (3.0) (3.2) (0.1) -
Operating income 15.4 18.0 2.5 16.9%Non-operating income 2.9 2.2 (0.7) (25.1%)Non-operating expenses 4.0 4.7 0.6 17.1%
Ordinary income 14.3 15.5 1.1 8.2%Extraordinary gains 17.8 0.0 (17.8) ********Extraordinary losses 14.4 3.5 (10.9) (75.7%)
17.7 12.0 (5.7) (32.4%)
Income taxes 6.9 5.9 (1.0) (15.6%)Minority interests (loss) (0.0) 0.1 0.1 ―
Net income 10.7 6.0 (4.7) (44.3%)
Change (%)
Income before income taxesand minority interests
Year endedDecember 31,
2010
Year endingDecember 31,2011 (forecast)
Change
From the first quarter of fiscal 2011, the Company adopted the Accounting Standard for Disclosures about Segments ofan Enterprise and Related Information (and its associated Guidance). In accordance with the standard and guidance,the Company identifies segments using the simplified method based on the management approach.*For reference, a diagram detailing segmentation changes appears on the last page.
Sales Breakdown for Japanese Alcoholic Beverages
Consolidated Forecasts (Year Ending December 31, 2011)
Sales (including liquor tax) (billions of yen)Year ended
December 31,2010
Year endingDecember 31,
2011Change Change (%)
Beer 170.9 168.3 (2.6) (1.5)Happoshu 9.2 6.2 (3.0) (32.6)New genre 69.8 78.3 8.5 12.2Total 250.0 252.9 2.9 1.2
Sales (excluding liquor tax) (billions of yen)Year ended
December 31,2010
Year endingDecember 31,
2011Change Change (%)
Beer 83.3 81.7 (1.6) (1.9)Happoshu 5.2 3.5 (1.7) (32.7)New genre 48.2 54.3 6.1 12.7Total 136.9 139.7 2.8 2.0
7

(billions of yen)
DetailsYear ended
December 31,2010
Year endingDecember 31,
2011Change
Beer and related products 7.6 8.4 0.8 Marginal profit Subtotal 1.8
Increase (decrease) in volume / Product mix 1.5 Beer -0.7Happoshu -1.1New genre +3.3Product mix +0.0
Cost of production 0.3 Decrease in purchase prices, other factors Fixed and other costs Subtotal (1.0)
Sales promotion costs (1.0) Increase in sales promotion costsOther costs (0.0)
Wine and spirits 0.8 0.9 0.1Other 0.8 0.5 (0.3) Shochu business, logistics, other factors
Japanese Alcoholic Beverages 9.2 9.8 0.5Existing Alcoholic Beverages (International) 0.8 1.4 0.6
Increase (decrease) in volume / Product mix 0.9 Increase in volume SLEEMAN 107% SAPPORO 116%
Marketing expenses (0.3) Increase at Sleeman and elsewhereOther costs 0.0 Increase in personnel expenses, other factors
Business in Vietnam (0.3) (1.3) (1.0)International Alcoholic Beverages 0.5 0.1 (0.4)
Increase (decrease) in volume / Product mix 0.2 Increase in volume, improvement in product mix
Production costs (0.2) Increase in cost of raw ingredients and materials -0.3,decrease in production costs +0.1
Other costs 0.0Amortization of goodwill (0.6)
Soft Drinks 1.2 0.7 (0.5)
New consolidated subsidiary 2.3 Results included in consolidated P/L from Q2 2011*Operating income before goodwill amortization 3.5 bn yen
POKKA Group - 2.3 2.3Existing stores 0.3 Profit improvement due to cost reductionsNew stores / Refurbished stores (0.0)
Restaurants 0.1 0.4 0.2Rent 0.5Sales (0.2)
Real Estate 8.0 8.3 0.2Food Business 0.3Other 0.0 Insurance Business
Other Businesses (0.7) (0.4) 0.3General corporate and intercompany eliminations (3.0) (3.2) (0.1)
Change in operating income 15.4 18.0 2.5Financial income (expense) (2.6) (3.2) (0.6) Increase in balance of bank loansEquity in income (losses) of affiliates 0.6 0.3 (0.3) POKKA Group: equity-method affiliate → consolidated subsidiOther 0.9 0.4 (0.5)
Non-operating income and expenses (1.1) (2.5) (1.4)Change in ordinary income 14.3 15.5 1.2
Gain on sales of property, plant and equipment 16.6 - (16.6)Gain on sales of investment securities 0.7 - (0.7)Reversal of removal costs 0.6 - (0.6)Other extraordinary gains 0.1 - (0.1)Loss on disposal of property, plant and equipment (10.1) (1.0) 9.1Impairment losses (2.4) - 2.4Business structure improvement expenses (0.7) - 0.7
Asset retirement obligations - (1.0) (1.0) Adjustments booked as extraordinary loss in first year ofapplication
Other extraordinary losses (1.3) (1.5) (0.2)Extraordinary gains and losses 3.4 (3.5) (6.9)
Change in income before income taxes and minority interests 17.7 12.0 (5.7)Change in income taxes and minority interests (loss) (6.9) (6.0) 0.9
Change in net income 10.7 6.0 (4.7)
Consolidated Statements of Income Breakdown of Key Changes
Consolidated Forecasts (Year Ending December 31, 2011)
Year endedDecember 31, 2010
Year endingDecember 31, 2011
Yen / US$ 87.79 88.00Yen / CAN$ 85.18 87.00
8
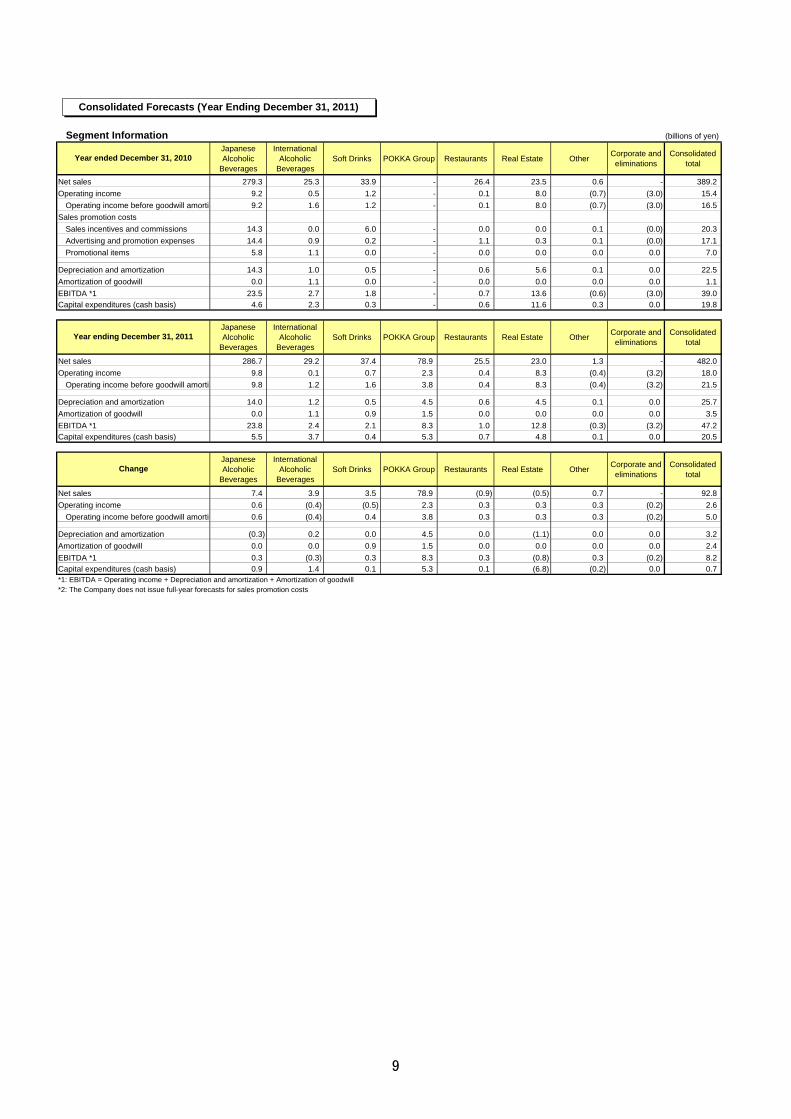
Segment Information (billions of yen)JapaneseAlcoholic
Beverages
InternationalAlcoholic
BeveragesSoft Drinks POKKA Group Restaurants Real Estate Other Corporate and
eliminationsConsolidated
total
Net sales 279.3 25.3 33.9 - 26.4 23.5 0.6 - 389.2Operating income 9.2 0.5 1.2 - 0.1 8.0 (0.7) (3.0) 15.4
Operating income before goodwill amortiz 9.2 1.6 1.2 - 0.1 8.0 (0.7) (3.0) 16.5Sales promotion costs
Sales incentives and commissions 14.3 0.0 6.0 - 0.0 0.0 0.1 (0.0) 20.3Advertising and promotion expenses 14.4 0.9 0.2 - 1.1 0.3 0.1 (0.0) 17.1Promotional items 5.8 1.1 0.0 - 0.0 0.0 0.0 0.0 7.0
Depreciation and amortization 14.3 1.0 0.5 - 0.6 5.6 0.1 0.0 22.5Amortization of goodwill 0.0 1.1 0.0 - 0.0 0.0 0.0 0.0 1.1EBITDA *1 23.5 2.7 1.8 - 0.7 13.6 (0.6) (3.0) 39.0Capital expenditures (cash basis) 4.6 2.3 0.3 - 0.6 11.6 0.3 0.0 19.8
JapaneseAlcoholic
Beverages
InternationalAlcoholic
BeveragesSoft Drinks POKKA Group Restaurants Real Estate Other Corporate and
eliminationsConsolidated
total
Net sales 286.7 29.2 37.4 78.9 25.5 23.0 1.3 - 482.0Operating income 9.8 0.1 0.7 2.3 0.4 8.3 (0.4) (3.2) 18.0
Operating income before goodwill amortiz 9.8 1.2 1.6 3.8 0.4 8.3 (0.4) (3.2) 21.5
Depreciation and amortization 14.0 1.2 0.5 4.5 0.6 4.5 0.1 0.0 25.7Amortization of goodwill 0.0 1.1 0.9 1.5 0.0 0.0 0.0 0.0 3.5EBITDA *1 23.8 2.4 2.1 8.3 1.0 12.8 (0.3) (3.2) 47.2Capital expenditures (cash basis) 5.5 3.7 0.4 5.3 0.7 4.8 0.1 0.0 20.5
JapaneseAlcoholic
Beverages
InternationalAlcoholic
BeveragesSoft Drinks POKKA Group Restaurants Real Estate Other Corporate and
eliminationsConsolidated
total
Net sales 7.4 3.9 3.5 78.9 (0.9) (0.5) 0.7 - 92.8Operating income 0.6 (0.4) (0.5) 2.3 0.3 0.3 0.3 (0.2) 2.6
Operating income before goodwill amortiz 0.6 (0.4) 0.4 3.8 0.3 0.3 0.3 (0.2) 5.0
Depreciation and amortization (0.3) 0.2 0.0 4.5 0.0 (1.1) 0.0 0.0 3.2Amortization of goodwill 0.0 0.0 0.9 1.5 0.0 0.0 0.0 0.0 2.4EBITDA *1 0.3 (0.3) 0.3 8.3 0.3 (0.8) 0.3 (0.2) 8.2Capital expenditures (cash basis) 0.9 1.4 0.1 5.3 0.1 (6.8) (0.2) 0.0 0.7*1: EBITDA = Operating income + Depreciation and amortization + Amortization of goodwill*2: The Company does not issue full-year forecasts for sales promotion costs
Year ended December 31, 2010
Year ending December 31, 2011
Change
Consolidated Forecasts (Year Ending December 31, 2011)
9

Consolidated Management Indexes
Major Sales Volume Data
Beer (Japan) (10,000 cases)
SAPPORO BLACK LABEL 1,948 1,842 94% 1,780 97%YEBISU (total) 1,060 1,091 103% 1,150 105%
1. Beer (total) 3,234 3,144 97% 3,100 99%2. Happoshu (total) 319 234 74% 155 66%3. New genre beverages 1,912 2,131 112% 2,380 112%Beer, happoshu, and new genre (total: 1 + 2 + 3) 5,465 5,510 101% 5,635 102%
Beer (International) (10,000 cases)
SLEEMAN BREWERIES LTD. *1 1,045 1,099 105% 1,175 107%SAPPORO brand 212 237 112% 275 116%
*1 Excludes contracted manufacturing for the SAPPORO brand
Wine and Spirits (billions of yen)
Domestic wines 4.5 4.3 96% 4.4 102%Imported wines 6.8 6.5 95% 6.8 105%
11.3 10.8 95% 11.2 103%1.4 1.4 106% 1.5 103%
Shochu (billions of yen)
11.4 8.6 76% 9.5 110%
Soft Drinks (SAPPORO BEVERAGE CO.,LTD.) (10,000 cases)
1,996 2,037 102% 2,050 101%
Year endingDecember31, 2011
(forecast)
Change (%)Change (%)
Year endedDecember 31,
2009
Year endedDecember 31,
2010Change (%)
Year endedDecember 31,
2009
Year endedDecember 31,
2010
Year endingDecember31, 2011
(forecast)
Change (%)
Wine (total)Wine and spirits (total)
Soft Drinks
Year endedDecember 31,
2009Change (%)
Year endedDecember 31,
2010
Shochu
Change (%)
Year endingDecember31, 2011
(forecast)
Year endedDecember 31,
2010
Change (%)
Year endingDecember31, 2011
(forecast)
Year endingDecember31, 2011
(forecast)
Change (%)
Year endedDecember 31,
2010
Year endedDecember 31,
2009
Year endedDecember 31,
2009Change (%)
Change (%)
Reference Materials
Year endedDecember 31,
2009
Year endedDecember 31,
2010Change
(%)
Year endingDecember 31,2011 (forecast)
Change(%)
Incl. liquor tax 387.5 389.2 100.4% 482.0 123.8%Excl. liquor tax 264.6 269.8 102.0% 363.0 134.5%Before goodwill amort. 13.9 16.5 119.0% 21.5 129.7%After goodwill amort. 12.8 15.4 119.4% 18.0 116.9%Before goodwill amort. 5.3% 6.1% - 5.9% -After goodwill amort. 4.9% 5.7% - 5.0% -Before goodwill amort. 4.7% 9.8% - 7.6% -After goodwill amort. 3.9% 8.9% - 4.8% -Gross 1.7 1.4 - 1.6 -Net 1.6 1.3 - 1.5 -
*1: The consolidated operating margin is based on consolidated net sales excluding liquor tax.*2: Calculation of the debt-to-equity ratio includes commercial paper but excludes the balance of lease obligations.
Debt-to-equity ratio *2
Consolidated net sales(billions of yen)Consolidated operatingincome (billions of yen)Consolidated operatingmargin *1 (%)
ROE (%)
10

Reportable segment income refers to operating income. Equity-method affiliates are therefore omitted below.
Business Consolidated subsidiaries
SAPPORO BREWERIES LTD. Beer production and sales SAPPORO BREWERIES LTD.
SAPPORO WINES LIMITED Wine production andsales SAPPORO WINES LIMITED
YEBISU WINEMART CO.,LTD. Sales of wine, spirits, etc. YEBISU WINEMART CO.,LTD.
SAPPORO LOGISTICS SYSTEMS CO.,LTD. Transport and handling ofproducts etc. SAPPORO LOGISTICS SYSTEMS CO.,LTD.
TANOSHIMARU SHUZO CO.,LTD. Production and sales ofshochu TANOSHIMARU SHUZO CO.,LTD.
SAPPORO ENGINEERING LIMITED Facilities design andmanagement SAPPORO ENGINEERING LIMITED
STARNET CO.,LTD. Sale promotion STARNET CO.,LTD.
SAPPORO INTERNATIONAL INC. Supervision of overseassubsidiaries NEW SANKO INC.
SAPPORO U.S.A.,INC. Beer sales SAPPORO INTERNATIONAL INC.
SAPPORO CANADA INC. Supervision of Canadiansubsidiaries SAPPORO U.S.A.,INC.
SLEEMAN BREWERIES LTD. Beer production and sales SAPPORO CANADA INC.
SAPPORO ASIA PRIVATE LIMITED Supervision of Asiansubsidiaries SLEEMAN BREWERIES LTD.
SAPPORO VIETNAM LIMITED Beer production and sales SAPPORO ASIA PRIVATE LIMITED
SAPPORO BEVERAGE CO.,LTD. Soft drink production andsales SAPPORO VIETNAM LIMITED
STELLA BEVERAGE SERVICES CO.,LTD. Soft drink sales SAPPORO BEVERAGE CO.,LTD.
STAR BEVERAGE SERVICE CO., LTD. Soft drink sales STELLA BEVERAGE SERVICES CO.,LTD.
SAPPORO FOODS NET CO.,LTD. Supervision of foodcompanies STAR BEVERAGE SERVICE CO., LTD.
SAPPORO FINE FOODS CO.,LTD. Production and sales ofconfectionary etc. POKKA CORPORATION
SAPPORO LION LIMITED Management ofrestaurants SUNPOKKA CO.,LTD
NEW SANKO INC. Management ofrestaurants POKKA CREATE CO., LTD.
YEBISU GARDEN PLACE CO.,LTD. Real estate leasing And another 23 companiesYGP REAL ESTATE CO.,LTD. Real estate leasing SAPPORO LION LIMITED
SAPPORO URBAN DEVELOPMENT CO.,LTD. Real estate leasing YEBISU GARDEN PLACE CO.,LTD.
TOKYO ENERGY SERVICE CO.,LTD. Energy supply YGP REAL ESTATE CO.,LTD.
SAPPORO SPORTS PLAZA CO.,LTD. Management of sportsfacilities SAPPORO URBAN DEVELOPMENT CO.,LTD.
YOKOHAMA KEIWA BUILDING CO.,LTD. Real estate leasing TOKYO ENERGY SERVICE CO.,LTD.
SAPPORO SPORTS PLAZA CO.,LTD.
YOKOHAMA KEIWA BUILDING CO.,LTD.
*SAPPORO PROASSIST LIMITED is a functional services company that serves all segments. SAPPORO FOODS NET CO.,LTD.
SAPPORO FINE FOODS CO.,LTD.
SAPPORO PROASSIST LIMITED
Soft Drinks
Restaurants
PokkaGroup
Restaurants
Real Estate
Other
Corporateandelimination
SAPPORO HOLDINGS LTD. Holding company
Corporateandeliminations
SAPPORO HOLDINGS LTD.
Real Estate
Segment Consolidated subsidiaries Segment
AlcoholicBeverages
InternationalAlcoholicBeverages
Soft Drinks
JapaneseAlcoholicBeverages
Overview of Segmentation Changes
Old segmentation New segmentation
11