year-end report 2015 - hoist financeir.hoistfinance.com/afw/files/press/hoist/201602091305-1.pdf ·...
TRANSCRIPT
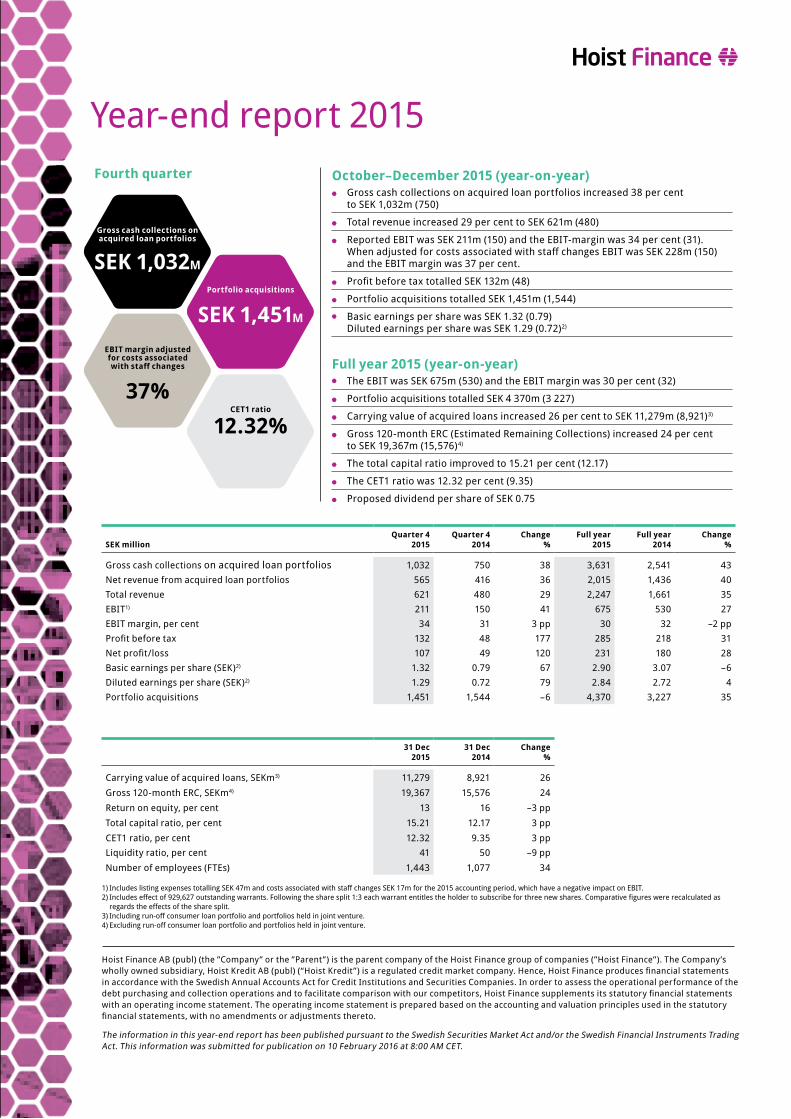
October–December 2015 (year-on-year) Gross cash collections on acquired loan portfolios increased 38 per cent
to SEK 1,032m (750)
Total revenue increased 29 per cent to SEK 621m (480)
Reported EBIT was SEK 211m (150) and the EBIT-margin was 34 per cent (31). When adjusted for costs associated with staff changes EBIT was SEK 228m (150)and the EBIT margin was 37 per cent.
Profit before tax totalled SEK 132m (48)
Portfolio acquisitions totalled SEK 1,451m (1,544)
Basic earnings per share was SEK 1.32 (0.79) Diluted earnings per share was SEK 1.29 (0.72)2)
Full year 2015 (year-on-year) The EBIT was SEK 675m (530) and the EBIT margin was 30 per cent (32)
Portfolio acquisitions totalled SEK 4 370m (3 227)
Carrying value of acquired loans increased 26 per cent to SEK 11,279m (8,921)3)
Gross 120-month ERC (Estimated Remaining Collections) increased 24 per cent to SEK 19,367m (15,576)4)
The total capital ratio improved to 15.21 per cent (12.17)
The CET1 ratio was 12.32 per cent (9.35)
Proposed dividend per share of SEK 0.75
SEK millionQuarter 4
2015Quarter 4
2014Change
%Full year
2015Full year
2014Change
%
Gross cash collections on acquired loan portfolios 1,032 750 38 3,631 2,541 43Net revenue from acquired loan portfolios 565 416 36 2,015 1,436 40Total revenue 621 480 29 2,247 1,661 35EBIT1) 211 150 41 675 530 27EBIT margin, per cent 34 31 3 pp 30 32 –2 pp Profit before tax 132 48 177 285 218 31Net profit/loss 107 49 120 231 180 28Basic earnings per share (SEK)2) 1.32 0.79 67 2.90 3.07 –6Diluted earnings per share (SEK)2) 1.29 0.72 79 2.84 2.72 4Portfolio acquisitions 1,451 1,544 –6 4,370 3,227 35
31 Dec 2015
31 Dec 2014
Change %
Carrying value of acquired loans, SEKm3) 11,279 8,921 26Gross 120-month ERC, SEKm4) 19,367 15,576 24Return on equity, per cent 13 16 –3 pp Total capital ratio, per cent 15.21 12.17 3 pp CET1 ratio, per cent 12.32 9.35 3 pp Liquidity ratio, per cent 41 50 –9 pp Number of employees (FTEs) 1,443 1,077 34
Hoist Finance AB (publ) (the ”Company” or the ”Parent”) is the parent company of the Hoist Finance group of companies (”Hoist Finance”). The Company’s wholly owned subsidiary, Hoist Kredit AB (publ) (“Hoist Kredit”) is a regulated credit market company. Hence, Hoist Finance produces financial statements in accordance with the Swedish Annual Accounts Act for Credit Institutions and Securities Companies. In order to assess the operational performance of the debt purchasing and collection operations and to facilitate comparison with our competitors, Hoist Finance supplements its statutory financial statements with an operating income statement. The operating income statement is prepared based on the accounting and valuation principles used in the statutory financial statements, with no amendments or adjustments thereto.
The information in this year-end report has been published pursuant to the Swedish Securities Market Act and/or the Swedish Financial Instruments Trading Act. This information was submitted for publication on 10 February 2016 at 8:00 AM CET.
Year-end report 2015
Gross cash collections on acquired loan portfolios
SEK 1,032M
Portfolio acquisitions
SEK 1,451M
EBIT margin adjusted for costs associated with staff changes
37%CET1 ratio
12.32%
1) Includes listing expenses totalling SEK 47m and costs associated with staff changes SEK 17m for the 2015 accounting period, which have a negative impact on EBIT.2) Includes effect of 929,627 outstanding warrants. Following the share split 1:3 each warrant entitles the holder to subscribe for three new shares. Comparative figures were recalculated as
regards the effects of the share split. 3) Including run-off consumer loan portfolio and portfolios held in joint venture. 4) Excluding run-off consumer loan portfolio and portfolios held in joint venture.
Fourth quarter
Hoist Finance AB (publ) • Year-end report 2015 2
Statement by the CEO
High acquisition rate and stable earnings
2015 was a very successful and a profitable year for Hoist Finance. All
segments increased their revenues, and total acquisition volumes and
earnings are the highest ever achieved. Several major portfolio acquisi-
tions contributed to this positive performance.
A key milestone was achieved with Hoist Finance’s listing on the
NASDAQ Stockholm Mid Cap List on 25 March. The listing broadened
our ownership base with a number of Swedish and international insti-
tutions, and the company received another external stamp of approval.
Strong earnings and several major portfolio acquisitions during Q4 Italy continued its profitable growth during the fourth quarter with
a strong operating margin, while several significant Q4 acquisitions
resulted in a record high acquisition rate.
Poland also finished the year with a high level of activity, concluding
an important transaction with an international bank. The transaction
involves the acquisition of loan portfolios and the takeover of employ-
ees. Hoist Finance will open a new office in Gdansk during the first six
months of 2016 as a result of this transaction.
In the UK, the integration of debt purchasing company Compello
Holdings Ltd. proceeded according to plan. Performance was stable in
our other markets during the quarter.
Outlook for 2016 With stricter capital adequacy requirements, European banks will con-
tinue to have a great need to divest non-performing credit portfolios to
generate return on investment capital. Return requirements cannot be
achieved with large portfolios of non-performing loans on the balance
sheet – which is the situation for many international banks. With these
continued favourable market conditions, we are confident as we enter
2016. With Hoist Finance’s strong financial position and geographic
presence, we are well positioned to capitalise on the growth potential
on the market in the years ahead.
For 2016, our goal is to grow in the same way that has been the
foundation of our success so far. This is through a continued very
disciplined portfolio acquisition approach, good cost control and a
sustained high rate of acquisition. And we will continue to actively eval-
uate opportunities to enter new geographic markets in Europe.
We will also work to further strengthen our position to ensure that
Hoist Finance is the leading partner of international banks and financial
institutions in Europe.
Our target for 2016 remains to generate acquisition volumes in line
with the previous three years.
Jörgen Olsson
CEO
Hoist Finance AB (publ)

Hoist Finance AB (publ) • Year-end report 2015 3
Fourth quarter 2015
Fourth quarter 2015
RevenueTotal revenue reached SEK 621m (480). Gross cash collections on acquired loan portfolios increased to SEK 1,032m (750) compared to
fourth quarter last year, primarily due to the large portfolio acquisi-
tions made in late 2014 and the acquisition of Compello Holding Ltd
during third quarter 2015. Revenue growth remains strong due to the
high level of acquisition activity. Portfolio acquisitions totalled SEK
1,451m (1,544) during the quarter, mainly attributable to significant
portfolio acquisitions in Italy and the UK.
Portfolio amortisation and revaluation increased 38 per cent to SEK
469m (339). The increase is mainly attributable to an increased volume
of acquired loan portfolios. Positive portfolio revaluations of SEK 5m
are also included. In line with loan amortisation, interest income from
the run-off consumer loan portfolio decreased during the period to
SEK 2m (6). Net revenue from acquired loan portfolios consequently
increased 36 per cent to SEK 565m (416).
Fee and commission income is unchanged at SEK 39m (39). The
greater part of this income is attributable to the UK operations.
Profit from participation in the joint venture in Poland decreased
22 per cent to SEK 14m (18), as no further investments are being made
within the scope of the joint venture.
Operating expensesPersonnel expenses increased 42 per cent to SEK 187m (132) and
are charged with non-recurrent expenses of SEK 17m attributable to
reorganisation activities. The remaining amount reflects the increase
in the number of Group full-time employees (FTEs) due to business
combinations. The average number of Group FTEs was 1,443 (1,077).
The increase is attributable to the expansion of Hoist Finance’s self-run
collection platforms in Italy, Poland and the UK following the acquisi-
tion of collection platforms in those regions. Other operating expenses
increased 12 per cent during Q4 2015 to SEK 211m (188). The increase
is mainly attributable to the acquisition of Compello Holding Ltd. and
Kancelaria Navi Lex Sp.z.o.o. The remaining increase is a result of
acquisitions and greater business volumes, with a higher share of legal
collection expenses included.
Depreciation and amortisation of tangible and intangible assets
totalled SEK 12m (10). The increase is attributable to production sys-
tems included in acquired companies and to continued investments in
Group IT systems.
Financial itemsFinancial items as per the Company’s segment reporting totalled SEK
–79m (–102). Due to the low interest rate level, interest income (exclu-
sive of run-off consumer loan portfolio) totalled SEK 0m (8).
Interest expense totalled SEK 86m (93) and is mainly comprised of
interest expense related to HoistSpar deposits and interest expenses
for issued bonds. Interest expense for HoistSpar deposits decreased
year-on-year to SEK 42m (53), mainly due to the decrease in interest
rate levels despite higher volumes. The interest rates Hoist Finance
offers are on a par with the prevailing market situation. Interest
expenses for Company-issued bonds decreased to SEK 26m (31),
attributable primarily to the repurchase of these bonds. Fees for the
deposit guarantee scheeme of SEK 5m (3) are also reported as interest
expense.
Net income from financial transactions, including financing costs,
totalled SEK 6m (–16), generated primarily from the hedging of curren-
cies and interest rates via derivatives. Hoist Finance hedges interest
rate risk on a continuous basis, currently in the short and medium
term.
Unless otherwise specified, all market, financial and operational comparisons refer to the fourth quarter of 2014. The analysis below follows the operating income statement.
0
45
90
135
180
225
Q42015
Q42014
Q42013
Gross cash collections
SEKm SEKm SEKm
EBIT and EBIT marginPortfolio acquisitions
SEKm
Profit before tax
0
400
800
1200
1600
2 000
Kv42015
Kv42014
Kv42013
0
200
400
600
800
1 000
1 200
Kv42015
Kv42014
Kv42013
0
45
90
135
180
225
Kv42015
Kv42014
Kv42013
0
8
16
24
32
40
0
30
60
90
120
150
Kv42015
Kv42014
Kv42013
0
400
800
1,200
1,600
2,000
Q42015
Q42014
Q42013
0
200
400
600
800
1,000
1,200
Q42015
Q42014
Q42013
0
30
60
90
120
150
Q42015
Q42014
Q42013
Portföljförvärv
MSEK MSEK MSEK % MSEK
EBIT och EBIT-marginalInkasserade belopp på förvärvade fordringsportföljer Resultat före skatt
EBIT
0
8
16
24
32
40%
EBIT margin
EBIT
EBIT-marginal

Hoist Finance AB (publ) • Year-end report 2015 4
Fourth quarter 2015
Cash flow
SEKmQuarter 4
2015Quarter 4
2014Full year
2015Full year
2014
Cash flow from operating activities –785 –25 –680 –758Cash flow from investing activities 971 345 507 –782Cash flow from financing activities –41 846 501 1,222Cash flow for the period 145 1,167 327 –318
Cash flow from operating activities totalled SEK –785m (–25). HoistSpar
deposit volumes increased SEK 47m during the fourth quarter, attribut-
able entirely to the inflow of non-fixed deposits. Cash flow from gross
cash collections on acquired loan portfolios increased to SEK 1,032m
(750) due to increased volume of loan portfolios. Portfolio acquisitions
totalled SEK 1,133m (1,170).
Cash flow from investing activities totalled SEK 971m (345). The
change is due to a reallocation of bonds and other securities in prepa-
ration for acquisitions conducted during the quarter.
Cash flow from financing activities totalled SEK –41m (846) and is
attributable to a repurchase of issued bonds by Hoist Finance and to
interest paid on additional Tier 1 capital instruments.
Total cash flow for the quarter totalled SEK 145m, as compared with
SEK 1,167m in the fourth quarter of 2014.
Balance sheetTotal assets increased 16 per cent year-on-year to SEK 17,451m
(15,062). The change is mainly relates to a SEK 2,428m (28 per cent)
increase in the loan portfolio carrying value and a SEK 762m (33 per
cent) increase in Treasury bills and Treasury bonds. These increases
are offset by a SEK –648m (–33 per cent) reduction in bonds and other
securities and a SEK –434m (–34 per cent) reduction in lending to credit
institutions. Other assets increased SEK 291m (139 per cent) due to an
unrealised position on currency forwards.
Total liabilities amount to SEK 15,163m (13,665). The change is main-
ly due to a SEK 1,804m (16 per cent) increase in deposit volumes.
Financing and capital debt
SEKm31 Dec
201531 Dec
2014Change
%
Deposits 12,791 10,987 16Subordinated liabilities 337 333 1Senior unsecured debts 1,238 1,493 –17
Total interest-bearingliabilities 14,367 12,813 12
Other liabilities 796 851 7Shareholders’ equity 2,289 1,397 64Total liabilities and share-holders’ equity 17,451 15,062 16
Cash and interest bearing securities 5,240 5,560 –6Other assets 12,212 9,501 29Total assets 17,451 15,062 16
Liquidity ratio, % 41 50 –9 ppCET1 ratio, % 12.32 9.35 3 ppTotal capital ratio, % 15.21 12.17 3 pp
Acquired loansPortfolio acquisitions 4,370 3,227 35Carrying value of acquired loans1) 11,279 8,921 26Gross 120-month ERC2) 19,367 15,576 241) Including run-off consumer loan portfolio and portfolios held in joint venture. 2) Excluding run-off consumer loan portfolio and portfolios held in joint venture.
Hoist Finance funds its operations through deposits from the public
and through the bond market. Deposits from the public totalled SEK
12,791m (10,987). Of this amount, SEK 4,564m is attributable to fixed
term deposits of 12-, 24- and 36-month durations. In line with its
funding structure diversification strategy, Hoist Finance issued a bond
denominated in EUR in Q4 2014. As at 31 December 2015, outstanding
bond debt totalled SEK 1,238m.
Group equity increased to SEK 2,289m (1,397). The capital base was
strengthened substantially through the new share issues completed in
2015; associated with the listing.
The total capital ratio improved to 15.21 per cent (12.17) and the
CET1 ratio increased to 12.32 per cent (9.35). The Company is thus well
capitalised for further expansion in the acquisition of non-performing
consumer loans.
Cash and interest-bearing securities total SEK 5,240m (5,560). The
liquidity ratio is 41 per cent (50) of deposits from the public.
Basic earnings per share total SEK 1.32 (0.79). Interest on converti-
ble debt instruments is included in the calculation.

Hoist Finance AB (publ) • Year-end report 2015 5
Fourth quarter 2015
Risk developmentThe carrying value of Hoist Finance’s acquired loans at year-end
totalled SEK 11,279m, a year-on-year increase of SEK 2,358. Loan
portfolio credit risk is deemed to have increased during the quarter
proportionally with the volume of acquired loans.
Operational risks increased (although at a lower rate than growth) due
to greater business volumes. Hoist Finance works continuously to im-
prove the quality of internal procedures to minimise operational risks.
Market risks remain low, as Hoist Finance continously hedges interest
rate and currency risks.
Hoist Finance’s capital position in terms of the CET1 ratio was 12.32
per cent (9.35) during the fourth quarter, exceeding the capital target
of 12 per cent. The company is thus well capitalised for continued
expansion.
Available liquidity totals SEK 5,243m (5,532). Because this exceeds
the target established by the Company, the liquidity risk remains low.
Other information EmployeesThe Group had 1,443 (1,077) FTEs during Q4 2015. The year-on-year
increase in mainly attributable to acquisitions in Poland (182 FTEs) and
the UK (178 FTEs).
Parent CompanyThe Parent Company reported a pre-tax profit of SEK 147m (11) for Q4
2015.
Related parties transactionsInformation about related parties transactions are specified in the
Annual Report.
Subsequent eventsNo significant events affecting the business have taken place after
the end of the reporting period.
The share and shareholdersHoist Finance was listed on the NASDAQ Stockholm Mid Cap List on
25 March 2015. The number of shares totalled 78,532,684 and the price
per share was set at SEK 58 SEK, corresponding to a market capitali-
sation of SEK 4,555m. On 30 December 2015 the share price closed at
SEK 88.50. A breakdown of the ownership structure is presented in the
table below.
Ownership structure
Name Capital and votes, %
Swedbank Robur Fonder AB 9.8Toscafund Asset Management LLP 9.1Carve Capital AB 9.0Beagle Investments S.A. 6.7Deciso AB 6.1Olympus Investment S.à r.l. 5.4Handelsbanken Fonder 4.6Costas Thoupos 4.2Carnegie Fonder 4.0Norges Bank 3.4Echiquier Fonder 2.6Brummer & Partners Fonder 2.4Skandinavkonsult 2.3Per Josefsson Invest AB 1.9Svenskt Näringsliv 1.9Other shareholders 26.6Total 100.0
Source: Modular Finance, 31 December 2015.
Pursuant to issued instructions, the Nominating Committee is to be
comprised of the three largest shareholders and the Chairman of the
Board. Should a shareholder decline to participate in the committee,
the next largest shareholder (not already a committee member) is
asked to do so. Accordingly, the Nominating Committee is comprised
of the Chair of the Board and representatives appointed by Swedbank
Robur Fonder AB, Carve Capital AB and Olympus Investment S.à.r.l.
DividendThe Board of Directors proposes that the 2016 AGM approve the distri-
bution of a dividend of SEK 0.75 per share, for a total of SEK 58.9m and
a record date of 3 May 2016.
The ex-dividend date for the share is 2 May 2016, with the dividend
payment date scheduled for 9 May 2016.
ReviewThis year-end report has not been reviewed by Hoist Finance’s audi-
tors.
Annual General MeetingThe AGM will be held on Friday, 29 April 2016 at 15:00 CET at the IVA
Conference Centre, Grev Turegatan 16, Stockholm.

Hoist Finance AB (publ) • Year-end report 2015 6
Quarterly review
Quarterly review
Segment reporting
SEK thousandQuarter 4
2015Quarter 3
2015Quarter 2
2015Quarter 1
2015Quarter 4
2014
Gross cash collections on acquired loan portfolios 1,032,221 973,978 834,098 790,735 750,218Portfolio amortisation and revaluation –469,138 –437,968 –360,477 –358,925 –339,425Interest income from run-off consumer loan portfolio 1,550 2,513 2,994 3,119 5,640
Net revenue from acquired loan portfolios 564,633 538,523 476,615 434,929 416,433Fee and commission income 39,351 37,990 41,747 47,617 39,467Profit from shares and participations in joint ventures 13,868 10,674 14,946 15,351 17,918Other income 2,751 2,894 3,439 1,545 5,904
Total revenue 620,603 590,081 536,747 499,442 479,722 Personnel expenses –186,713 –165,959 –153,016 –145,666 –132,298Other operating expenses –211,144 –223,365 –211,764 –227,743 –188,042Depreciation and amortisation of tangible and intangible assets –11,704 –13,550 –10,859 –10,753 –9,623
Total operating expenses –409,561 –402,874 –375,639 –384,162 –329,963 EBIT 211,042 187,207 161,108 115,279 149,759 Interest income excl. run-off consumer loan portfolio 23 –154 –12,111 4,745 7,526Interest expense –85,772 –90,101 –92,876 –92,621 –93,437Net income from financial transactions 6,257 –2,857 –3,779 –20,260 –16,321
Total financial items –79,492 –93,112 –108,766 –108,136 –102,232 Profit before tax 131,550 94,095 52,342 7,144 47,527
Key ratios, segment reporting
SEK thousandQuarter 4
2015Quarter 3
2015Quarter 2
2015Quarter 1
2015Quarter 4
2014
EBIT margin, % 34 32 30 23 31Portfolio acquisitions 1,451 1,982 665 273 1,544Carrying value of acquired loans1) 11,279 10,639 9,040 8,827 8,921CET1 ratio, % 12.32 12.98 12.58 14.33 9.35Gross 120-month ERC2) 19,367 18,082 15,316 15,238 15,576
1) Including run-off consumer loan portfolio and portfolios held in joint venture. 2) Excluding run-off consumer loan portfolio and portfolios held in joint venture

Hoist Finance AB (publ) • Year-end report 2015 7
Segment overview
Segment overviewHoist Finance purchases and manages receivables in eight European countries, all of which have different traditions for providing financial services, different legislative frameworks and different attitudes with respect to past due receivables and repayment patterns.
Quarter 4 2015
SEK thousandGermany and
Austria
Belgium, the Netherlands
and France UK Italy Poland
CentralFunctions and
Eliminations Group
Net revenue from acquired loan portfolios 147,433 70,561 155,860 105,752 85,027 – 564,633
Total revenue 153,834 72,231 178,709 108,136 94,995 12,698 620,603Total operating expenses –71,267 –67,228 –88,777 –61,594 –26,147 –94,548 –409,561EBIT 82,567 5,003 89,932 46,542 68,848 –81,850 211,042EBIT margin, % 54 7 50 43 72 – 34Carrying value of acquired loan portfolios1) 2,104,463 2,077,091 3,386,835 2,062,759 1,441,915 205,557 11,278,620Gross 120-day ERC,2) SEKm 3,535 3,387 6,060 3,705 2,680 – 19,367
1) Including run-off consumer loan portfolio and portfolios held in joint venture. 2) Excluding run-off consumer loan portfolio and portfolios held in joint venture.
Carrying value, acquired loan portfolios per market, 31 December 2015
Germany/Austria 19%Belgium, the Netherlands, France 18%UK 30%
Poland 13%Joint venture in Poland 2%
Italy 18%
SEK 11,279M

Hoist Finance AB (publ) • Year-end report 2015 8
Segment overview
Germany and Austria
SEK thousandQuarter 4
2015Quarter 4
2014 Change
%Full year
2015Full year
2014 Change
%
Gross cash collections on acquired loan portfolios 207,128 230,362 –10 871,315 724,044 20Portfolio amortisation and revaluation –61,245 –108,919 –44 –435,248 –348,873 25Interest income from run-off consumer loan portfolio 1,550 5,640 –73 10,176 38,180 –73
Net revenue from acquired loan portfolios 147,433 127,083 16 446,243 413,351 8Fee and commission income 3,013 3,586 –16 8,857 17,889 –50Other income 3,388 7,839 –57 11,823 14,294 –17
Total revenue 153,834 138,508 11 466,923 445,534 5
Personnel expenses –41,649 –34,872 19 –148,757 –133,245 12Other operating expenses –28,677 –25,944 11 –98,897 –85,272 16Depreciation and amortisation of tangible and intangible assets –941 –795 18 –3,583 –2,940 22
Total operating expenses –71,267 –61,611 16 –251,237 –221,457 13
EBIT 82,567 76,897 7 215,686 224,077 –4
EBIT margin, % 54 56 –2 pp 46 50 –4 ppExpenses/Gross cash collections on acquired loan portfolios, % 31 21 10 pp 26 25 1 ppCarrying value of acquired loan portfolios1) 2,104,463 2,350,392 –10 N/A N/A –Gross 120-month ERC, SEKm2) 3,535 3,817 –8 N/A N/A –
1) Including run-off consumer loan portfolio.2) Excluding run-off consumer loan portfolio.
Operating incomeFourth quarter gross cash collections on acquired loan portfolios
decreased 10 per cent to SEK 207m (230).
Portfolio amortisation and revaluation totalled SEK 61m (109)
during the quarter, with the decrease entirely attributable to positive
portfolio revaluations during Q4. Income from the run-off consumer
loan portfolio decreased to SEK 2m (6) due to the limited number of
remaining loans.
Operating expensesTotal operating expenses increased 16 per cent to SEK 71m (62) during
the fourth quarter. The increase is primarily attributable to higher
personnel expenses, SEK 5m of which refers to non-recurrent expenses
associated with the ongoing reorganisation. The remainder of the
increase is mainly due to an increased rate of collection via legal pro-
cesses and external parties.
EBITThe segment’s EBIT totalled SEK 83m (77) for the quarter with a corre-
sponding EBIT margin of 54 per cent (56). Comparative figures are im-
pacted by unusually strong Q4 earnings in 2014 and positive portfolio
revaluations in Q4 2015.
AcquisitionsAlthough the non-performing loan market remained active during
the fourth quarter, a fewer number of acquisitions were conducted.
The carrying amount of acquired loan portfolios was thus reduced to
SEK 2,104m (2,350) as at 31 December 2015. Gross ERC decreased to
SEK 3,535m (3,817) as at the same date.
OtherPositive portfolio revaluations totalling SEK 53m were conducted in
Q4 and are included in the portfolio amortisation and revaluation
amounts reported for the quarter.
The earnings trend for each operating segment (excluding Central Functions and Eliminations), based on the operating income statement, is set forth below.

Hoist Finance AB (publ) • Year-end report 2015 9
Segment overview
Belgium, the Netherlands and France
SEK thousandQuarter 4
2015Quarter 4
2014 Change
%Full year
2015Full year
2014 Change
%
Gross cash collections on acquired loan portfolios 238,455 205,796 16 891,864 733,474 22Portfolio amortisation and revaluation –167,894 –150,907 11 –575,823 –484,991 19
Net revenue from acquired loan portfolios 70,561 54,889 29 316,041 248,483 27Fee and commission income 1,660 1,860 –11 6,916 6,989 –1Other income 10 145 –93 –22 218 –110
Total revenue 72,231 56,894 27 322,935 255,690 26
Personnel expenses –20,760 –21,626 –4 –89,769 –86,886 3Other operating expenses –45,932 –24,262 89 –127,087 –102,656 24Depreciation and amortisation of tangible and intangible assets –536 –1,789 –70 –2,407 –4,679 –49
Total operating expenses –67,228 –47,677 41 –219,263 –194,221 13
EBIT 5,003 9,217 –46 103,672 61,469 69
EBIT margin, % 7 16 –9 pp 32 24 8 ppExpenses/Gross cash collections on acquired loan portfolios, % 27 22 5 pp 24 25 –1 ppCarrying value of acquired loan portfolios 2,077,091 2,194,000 –5 N/A N/A –Gross 120-month ERC, SEKm 3,387 3,512 –4 N/A N/A –
Operating incomeFourth quarter gross cash collections on acquired loan portfolios in-
creased 16 per cent to SEK 238m (206) and portfolio amortisation and
revaluation increased to SEK 168m (151). The Netherlands is responsi-
ble for a considerable portion of the increase in gross cash collections
on acquired loan portfolios. The increase in portfolio amortisation and
revaluations is attributable to portfolio revaluations in France.
Fee and commission income originated from third-party services
offered via the French operations. In light of the strategic decision to
phase out these services and redirect focus to portfolios owned by
Hoist Finance, this income will continue to decrease.
Operating expensesTotal operating expenses for the fourth quarter increased 41 per cent
to SEK 67m (48) due to an increase in Other operating expenses. Other
operating expenses totalled an SEK 46m (24) in the forth quarter
attributable mainly to the Netherlands where variable costs related to
third-party collection services are included.
EBITThe segment’s EBIT totalled SEK 5m (9) during the quarter with a corre-
sponding EBIT margin of 7 per cent (16).
AcquisitionsThe segment’s acquisitions during Q4 2015 were conducted primarily
in France, where activity increased significantly during the year, and
the Netherlands.
Overall, the segment’s acquired volumes are higher year-on-year.
The carrying value of acquired loan portfolios totalled SEK 2,077m
(2,194) as at 31 December 2015.
Gross ERC decreased to SEK 3,387m (3,512) as at the same date.
OtherThe carrying amount of acquired loan portfolios decreased SEK 49m
during the fourth quarter due to portfolio revaluations. The change is
mainly attributable to the French operations.

Hoist Finance AB (publ) • Year-end report 2015 10
Segment overview
UK
SEK thousandQuarter 4
2015Quarter 4
2014 Change
%Full year
2015Full year
2014 Change
%
Gross cash collections on acquired loan portfolios 247,724 143,110 73 813,772 527,346 54Portfolio amortisation and revaluation –91,864 –33,613 173 –204,427 –200,802 2
Net revenue from acquired loan portfolios 155,860 109,497 42 609,345 326,544 87Fee and commission income 22,939 34,021 –33 107,931 128,344 –16Other income –90 1,962 –105 1,145 2,686 –57
Total revenue 178,709 145,480 23 718,421 457,574 57
Personnel expenses –52,878 –39,023 36 –184,346 –134,502 37Other operating expenses –34,041 –37,493 –9 –275,525 –137,601 100Depreciation and amortisation of tangible and intangible assets –1,858 –773 140 –5,351 –4,588 17
Total operating expenses –88,777 –77,289 15 –465,222 –276,691 68
EBIT 89,932 68,191 32 253,199 180,883 40
EBIT margin, % 50 47 3 pp 35 40 –4 ppExpenses/Gross cash collections on acquired loan portfolios, % 27 29 –2 pp 44 28 16 ppCarrying value of acquired loan portfolios 3,386,835 1,797,520 88 N/A N/A –Gross 120-month ERC, SEKm 6,060 3,391 79 N/A N/A –
Operating incomeFourth quarter gross cash collections on acquired loan portfolios
totalled SEK 248m (143). The change is mainly attributable to the acqui-
sition of Compello Holdings Ltd. in early Q3 2015. Portfolio amortisa-
tion and revaluation totalled SEK 92m (34) during the quarter and were
mainly due to the Compello acquisition.
Fee and commission income originating from services offered to
third-parties decreased in pace with adaptation of the UK operations
to Hoist Finance’s strategy focused on acquisitions and managing an
in-house platform.
Operating expensesTotal operating expenses increased 15 per cent to SEK 89m (77) during
the fourth quarter. Increased personnel expenses are a consequence
of Hoist Finance’s takeover of personnel through the acquisition of
Compello Holdings Ltd. in Q3.
The integration of Compello Holdings Ltd, including migration of
loan portfolios and personnel, proceeded according to plan during
the fourth quarter. Some staff function and back office duplications
have been eliminated, reducing Compello’s 178 FTEs to 134 up to Q4.
Integration efforts resulted in lower Other operating expenses due to a
temporary reduction in the legal collection rate, and were also respon-
sible for the somewhat higher amortisation rate during Q4.
EBITThe segment’s EBIT totalled SEK 90m (68) for the quarter with a corre-
sponding EBIT margin of 50 per cent (47).
AcquisitionsYear-on-year acquisition activity was somewhat subdued during Q4
2015.
The carrying value of acquired loan portfolios totalled SEK 3,387m
(1,798) at 31 December 2015. Gross ERC increased to SEK 6,060m
(3,391) as at the same date.
OtherNo portfolio revaluations have been conducted during the fourth
quarter.

Hoist Finance AB (publ) • Year-end report 2015 11
Segment overview
Italy
SEK thousandQuarter 4
2015Quarter 4
2014 Change
%Full year
2015Full year
2014 Change
%
Gross cash collections on acquired loan portfolios 200,249 89,490 124 588,633 260,828 126Portfolio amortisation and revaluation –94,497 –21,915 331 –221,462 –91,324 143
Net revenue from acquired loan portfolios 105,752 67,575 56 367,171 169,504 117Fee and commission income 1,956 – – 5,891 – –Other income 428 –416 –203 1,414 311 354
Total revenue 108,136 67,159 61 374,476 169,815 121
Personnel expenses –16,851 –11,678 44 –56,842 –17,854 218Other operating expenses –43,651 –39,167 11 –126,380 –86,028 47Depreciation and amortisation of tangible and intangible assets –1,092 –2,033 –46 –5,959 –2,340 155
Total operating expenses –61,594 –52,878 16 –189,181 –106,222 78
EBIT 46,542 14,281 226 185,295 63,593 191
EBIT margin, % 43 21 22 pp 49 37 12 pp30 60 –30 pp 31 41 –10 pp
Expenses/Gross cash collections on acquired loan portfolios, % 2,062,759 1,181,210 75 N/A N/A –Carrying value of acquired loan portfolios 3,705 2,407 54 N/A N/A –Gross 120-month ERC, SEKm
Operating incomeFourth quarter gross cash collections on acquired loan portfolios in-
creased 124 per cent to SEK 200m (89). The large increase is essentially
attributable to the acquisitions of significant portfolios in December
2014 and the SME loan portfolio during Q4. Fourth quarter portfolio
amortisation and revaluations totalled SEK 94m (22), with the increase
primarily due to the above-referenced acquisitions.
Operating expensesTotal operating expenses increased 16 per cent to SEK 62m (53) and
reflect the acquisition in 2015 of substantial loan portfolios for which
Hoist Finance now carries out extensive collection activities. Other op-
erating expenses increased 11 per cent during Q4 to SEK 44m (39) and
are primarily comprised of expenses related to the major acquisition
conducted during Q4 2014. Personnel expenses totalled SEK 17m (12)
during the fourth quarter, with the increase following the increase in
FTEs during the year.
EBITThe segment’s EBIT totalled SEK 47m (14) for the quarter with a corre-
sponding EBIT margin of 43 per cent (21).
Acquisitions2015 acquisition activity was somewhat higher than the previous year’s
high level. Most loan portfolio acquisitions for the year were conduct-
ed during the fourth quarter.
The carrying value of acquired loan portfolios totalled SEK 2,063m
(1,181) at 31 December 2015. Gross ERC increased to SEK 3,705m
(2,407) as at the same date.
OtherNo portfolio revaluations have been conducted during the fourth
quarter.

Hoist Finance AB (publ) • Year-end report 2015 12
Segment overview
Poland
SEK thousandQuarter 4
2015Quarter 4
2014 Change
%Full year
2015Full year
2014 Change
%
Gross cash collections on acquired loan portfolios 138,665 81,460 70 465,448 295,619 57Portfolio amortisation and revaluation –53,638 –24,071 123 –189,548 –17,030 –
Net revenue from acquired loan portfolios 85,027 57,389 48 275,900 278,589 –1Fee and commission income 9,783 – – 37,110 – –Other income 185 – – 353 – –
Total revenue 94,995 57,389 66 313,363 278,589 12
Personnel expenses –7,258 –600 – –23,656 –2,035 –Other operating expenses –17,936 –18,387 –2 –75,005 –74,812 –Depreciation and amortisation of tangible and intangible assets –953 – – –3,612 – –
Total operating expenses –26,147 –18,987 38 –102,273 –76,847 33
EBIT 68,848 38,402 79 211,090 201,742 5
EBIT margin, % 72 67 6 pp 67 72 –5 ppExpenses/Gross cash collections on acquired loan portfolios, % 12 23 –12 pp 14 26 –12 ppCarrying value of acquired loan portfolios 1,441,915 1,182,459 22 N/A N/A –Gross 120-month ERC, SEKm 2,680 2,449 9 N/A N/A –
Operating incomeFourth quarter gross cash collections on acquired loan portfolios
increased 70 per cent to SEK 139m (81). The rate of increase in portfolio
amortisation (considerably higher than the increase in gross cash
collections) is primarily attributable to a large portfolio acquired in
2013. The amortisation rate has normalised with the increase in this
portfolio’s cash flow.
Fee and commission income is generated entirely by third-party
services offered by Navi Lex, acquired by Hoist Finance in late Q4 2014.
Operating expensesOperating expenses increased 38 per cent to SEK 26m (19) during
the fourth quarter. The increase is mainly attributable to Personnel
expenses, a result of costs associated with workforce growth stemming
from acquisitions conducted in December 2014. 89 FTEs were added
during the year in pace with the acquisition of additional portfolios
during 2015 and the takeover of portfolios previously managed exter-
nally by an in-house platform.
EBITThe segment’s EBIT totalled SEK 69m (38) for the quarter with a corre-
sponding EBIT margin of 72 per cent (67).
AcquisitionsMarket activity in Poland remained buoyant in Q4. Hoist Finance has
entered into an important transaction with an international bank.
The transaction, of a unique nature on the Polish market, involves the
acquisition of loan portfolios and Hoist Finance’s takeover of personnel
and subsequent establishment of a new office in Gdansk during the
first six months of 2016. Anticipated loan portfolio acquisitions arising
from this transaction have a minor impact on Q4 2015, and will be com-
pleted for the most part during 2016. The carrying value of acquired
loan portfolios totalled SEK 1,442m (1,182) at 31 December 2015. Gross
ERC increased to SEK 2,680m (2,449) as at the same date.
OtherNo portfolio revaluations have been conducted during the fourth
quarter.

Hoist Finance AB (publ) • Year-end report 2015 13
Financial statements
Consolidated income statement
SEK thousand NoteQuarter 4
2015Quarter 4
2014Full year
2015Full year
2014
Net revenue from acquired loan portfolios 1 563,083 410,793 2,004,524 1,398,291
Interest income 1,573 13,166 2,679 89,731
Interest expense –85,772 –93,437 –361,370 –344,969
Net interest income 478,884 330,522 1,645,833 1,143,053
Fee and commission income 39,351 39,467 166,705 153,222
Net income from financial transactions 6,257 –16,321 –15,341 –17,719
Other income 2,751 5,904 10,629 12,219
Total operating income 527,243 359,572 1,807,826 1,290,775
General administrative expenses
–Personnel expenses –186,713 –132,298 –651,354 –473,200
–Other operating expenses –211,144 –188,042 –874,016 –627,467
Depreciation and amortisation of tangible and intangible assets –11,704 –9,623 –46,866 –30,281
Total operating expenses –409,561 –329,963 –1,572,236 –1,130,948
Profit before credit losses 117,682 29,609 235,590 159,827Net credit losses – – –5,298 –
Earnings from participations in joint ventures 13,868 17,918 54,839 58,662
Profit before tax 131,550 47,527 285,131 218,489
Income tax expense –24,600 1,035 –54,609 –38,386
Profit for the period 106,950 48,562 230,522 180,103
Profit attributable to:Owners of Hoist Finance AB (publ) 106,950 48,562 230,522 180,103
Basic earnings per share1) 1.32 0.79 2.90 3.07
Diluted earnings per share1, 2) 1.29 0.72 2.84 2.72
1) Following the 1:3 share split, each warrant entitles the holder to subscribe for three new shares. Comparative figures were recalculated as regards the effects of the share split.2) Includes the effect of 929,627 outstanding warrants.
Financial statements

Hoist Finance AB (publ) • Year-end report 2015 14
Financial statements
Consolidated statement of comprehensive income
SEK thousandQuarter 4
2015Quarter 4
2014Full year
2015Full year
2014
Profit for the period 106,950 48,562 230,522 180,103
Other comprehensive incomeItems that will not be reclassified to profit or lossRevaluation of defined benefit pension plan 1,408 –1,710 1,408 –1,710
Revaluation of remuneration after terminated employment 1,606 –1,120 1,606 –1,120
Tax –781 872 –781 872
Total items that will not be reclassified to profit or loss 2,233 –1,958 2,233 –1,958
Items that may be reclassified subsequently to profit or lossCurrency translation differences on foreign operations –29,788 –50,162 –35,485 –29,093
Translation difference, joint venture –6,237 1,308 –4,948 5,939
Hedging of currency risk in foreign operations 4,762 58,289 –849 32,584
Total items that may be reclassified subsequently to profit or loss –31,263 9,435 –41,282 9,430
Other comprehensive income for the period –29,030 7,477 –39,049 7,472
Total comprehensive income for the period 77,920 56,039 191,473 187,575
Profit attributable to:Owners of Hoist Finance AB (publ) 77,920 56,039 191,473 187,575

Hoist Finance AB (publ) • Year-end report 2015 15
Financial statements
Consolidated balance sheet
SEK thousand Note31 Dec
201531 Dec
2014
ASSETSCash 281 340
Treasury bills and Treasury bonds 3,077,827 2,316,110
Lending to credit institutions 858,516 1,292,711
Lending to the public 77,994 157,232
Acquired loan portfolios 2 11,014,699 8,586,782
Bonds and other securities 1,303,214 1,951,241
Participations in joint ventures 205,557 215,347
Intangible assets 235,632 171,048
Tangible assets 41,623 32,000
Other assets 501,062 209,941
Deferred tax assets 62,688 70,885
Prepaid expenses and accrued income 72,384 58,192
Total assets 17,451,477 15,061,829
LIABILITIES AND SHAREHOLDERS’ EQUITYLiabilitiesDeposits and borrowing from the public 12,791,377 10,987,289
Tax liabilities 21,639 52,326
Other liabilities 357,284 555,186
Deferred tax liabilities 183,999 50,419
Accrued expenses and prepaid income 180,941 124,797
Provisions 52,116 68,704
Senior unsecured debt 1,238,469 1,493,122
Subordinated liabilities 336,892 332,796
Total liabilities 15,162,717 13,664,639
Shareholders’ equityShare capital 26,178 21,662
Other contributed equity 1,755,676 1,003,818
Reserves –44,094 –2,812
Retained earnings including profit for the period 551,000 374,522
Total shareholders’ equity 2,288,760 1,397,190
Total liabilities and shareholders’ equity 17,451,477 15,061,829
Pledged assets 639 1,903
Commitments 483,952 229,944

Hoist Finance AB (publ) • Year-end report 2015 16
Financial statements
Consolidated statement of changes in shareholders’ equity
SEK thousand Share capital
Other contributed
capital
Reserves Translation
reserve
Retained earnings including profit
for the period
Total shareholders’
equity
Opening balance 1 Jan 2015 21,662 1,003,818 –2,812 374,522 1,397,190
Comprehensive income for the periodProfit for the period 230,522 230,522Other comprehensive income –41,282 2,233 –39,049
Total comprehensive income for the period –41,282 232,755 191,473Transactions reported directly in equityNew share issue 4,516 745,5451) 750,061Warrants, repurchased and cancelled –842 –3,177 –4,019Interest paid on capital contribution –15,000 –15,000Acquisition of minority shareholding in subsidiary –32,584 –32,584Tax effect on items reported directly in equity 7,155 –5,516 1,639
Total transactions reported directly in equity 4,516 751,858 –56,277 700,097Closing balance 31 Dec 2015 26,178 1,755,676 –44,094 551,000 2,288,760
1) Nominal amount of SEK 778,068,000 has been reduced by transaction costs of SEK 32,523,000.
SEK thousand Share capital
Other contributed
capital
Reserves Translation
reserve
Retained earnings including profit
for the period
Total shareholders’
equity
Opening balance 1 Jan 2014 15,488 590,370 –12,242 221,826 815,442
Comprehensive income for the periodProfit for the period 180,103 180,103Other comprehensive income 9,430 –1,958 7,472
Total comprehensive income for the period 9,430 178,145 187,575Transactions reported directly in equityNew share issue 6,174 508,3102) 514,484Interest paid on capital contribution –28,750 –28,750Paid-in premium for warrants 5,138 5,138Conversion of convertible bond –100,000 –100,000Tax effect on items reported directly in equity 3,301 3,301
Total transactions reported directly in equity 6,174 413,448 –25,449 394,173Closing balance 31 Dec 2014 21,662 1,003,818 –2,812 374,522 1,397,190
2) Nominal amount of SEK 527,160,000 has been reduced by transaction costs of SEK 18,850,000.

Hoist Finance AB (publ) • Year-end report 2015 17
Financial statements
Consolidated cash flow statement
SEK thousandQuarter 4
2015Quarter 4
2014Full year
2015Full year
2014
OPERATING ACTIVITIESGross cash collections 1,032,220 750,217 3,631,031 2,541,310
Paid-in interest –1,538 13,166 35,614 89,731
Fee and commission income 39,351 39,467 166,705 153,222
Other operating income 2,750 5,905 10,629 12,220
Interest paid –156,551 –140,048 –338,950 –274,982
Operating expenses –368,520 –324,111 –1,478,721 –1,093,078
Net cash flow from financial transactions 6,257 –16,321 –15,341 –17,719
Capital gain on redemption of joint venture certificates 14,441 12,296 44,404 27,941
Income tax paid –16,572 –830 –45,453 –52,292
Total 551,838 339,741 2,009,918 1,386,353
Increase/decrease in acquired loans incl. translation differences –1,133,249 –1,770,398 –4,054,424 –3,731,866
Increase/decrease in joint venture certificates 4,737 5,478 15,277 13,544
Increase/decrease in lending to the public 12,610 44,124 73,940 171,719
Increase/decrease in deposits and borrowing from the public 46,759 1,054,678 1,781,668 1,215,800
Increase/decrease in other assets –270,466 –24,134 –290,002 –94,502
Increase/decrease in other liabilities 26,570 326,450 –277,073 307,124
Increase/decrease in provisions –4,131 –7,350 –16,588 –25,933
Change in other balance sheet items –19,325 6,738 76,967 –309
Total –1,336,495 –364,414 –2,690,235 –2,144,423
Cash flow from operating activities –784,657 –24,673 –680,317 –758,070
INVESTING ACTIVITIESInvestments in intangible assets –9,130 –15,499 –37,424 –64,286
Investments in tangible assets –8,516 –3,951 –20,529 –14,247
Investments in subsidiaries – –49,434 –50,569 –49,434
Investments in/divestments of bonds and other securities 989,120 413,834 615,093 –653,564
Cash flow from investing activities 971,474 344,950 506,571 –781,531
FINANCING ACTIVITIESNew share issue – 99,434 750,061 414,484
Paid-in premium for warrants – 3,795 – 5,138
Warrants, repurchased and cancelled – – –4,019 –
Issued bonds – 939,053 – 1,013,053
Issued bonds, repurchased and cancelled –33,858 –182,046 –229,833 –182,046
Interest paid on capital contribution –7,500 –13,750 –15,000 –28,750
Cash flow from financing activities –41,358 846,486 501,209 1,221,879
Cash flow for the period 145,459 1,166,762 327,463 –317,722
Cash at the beginning of the period 3,791,165 2,442,399 3,609,161 3,926,883
Cash at the end of the period1) 3,936,624 3,609,161 3,936,624 3,609,1611) Consists of cash, Treasury bills/bonds and lending to credit institutions.

Hoist Finance AB (publ) • Year-end report 2015 18
Financial statements
Parent Company income statement
SEK thousandQuarter 4
2015Quarter 4
2014Full year
2015Full year
2014
Net sales 38,647 51,996 148,458 171,684
Other external expenses –48,763 –41,115 –193,296 –151,509
Depreciation and amortisation –1,750 –1,733 –7,170 –6,762
Total operating expenses –50,513 –42,848 –200,466 –158,271
Operating profit –11,866 9,148 –52,008 13,413
Other interest income –470 1,440 –4,457 1,254
Interest expense –214 –280 –927 –1,315
Total income from financial items –684 1,160 –5,384 –61
Earnings from participations in Group companies 182,890 – 182,890 –
Appropriations –22,977 342 –22,977 –535
Profit/loss before tax 147,363 10,650 102,521 12,817
Income tax expense –34,026 226 –24,829 –353Profit/loss for the period1) 113,337 10,876 77,692 12,464
1) Profit/loss for the period corresponds to Comprehensive income for the period.

Hoist Finance AB (publ) • Year-end report 2015 19
Financial statements
Parent Company balance sheet
SEK thousand31 Dec
201531 Dec
2014
ASSETS
Non-current assetsLicences and software 19,475 31,871
Total intangible assets 19,475 31,871
Equipment 3,142 2,232
Total tangible assets 3,142 2,232
Shares and participations in subsidiaries 1,687,989 928,986
Total financial assets 1,687,989 928,986
Total non-current assets 1,710,606 963,089
Current assetsReceivables, Group companies 209,519 47,506
Accounts receivable 55 –
Other receivables 1,015 4,353
Prepaid expenses and accrued income 7,467 17,174
Total current receivables 218,056 69,033
Cash and bank balances 125,414 43,519
Total current assets 343,470 112,552
Total assets 2,054,076 1,075,641
SHAREHOLDERS’ EQUITY, PROVISIONS AND LIABILTIIES
Shareholders’ equityRestricted equityShare capital 26,178 21,662
Statutory reserve 3,098 3,098
Total restricted equity 29,276 24,760
Non-restricted equity Other contributed equity 1,661,136 909,278
Loss carried forward –18,775 –28,062
Profit/loss for the period 77,692 12,464
Total non-restricted equity 1,720,053 893,680
Total shareholders’ equity 1,749,329 918,440
Untaxed reserves 23,512 535
ProvisionsPension provisions 35 49
Total provisions 35 49
Non-current liabilities Intra-Group loans 40,100 40,100
Total non-current liabilities 40,100 40,100
Current liabilities Accounts payable 7,596 9,856
Tax liabilities 16,078 353Liabilities, Group companies 213,443 103,535
Accrued expenses and prepaid income 3,983 2,773
Total current liabilities 241,100 116,517
Total shareholders’ equity, provisions and liabilities 2,054,076 1,075,641
Pledged assets none none
Commitments none none

Hoist Finance AB (publ) • Year-end report 2015 20
Financial statements
Parent Company statement of changes in shareholders’ equity Restricted equity Non-restricted equity
SEK thousand Share capitalStatutory
reserveOther contrib-
uted equityLosses carried
forwardProfit /loss for
the periodTotal share-
holders’ equity
Opening balance 1 Jan 2015 21,662 3,098 909,278 –28,062 12,464 918,440
Transfer of previous year’s net profit/loss 12,464 –12,464 –
Comprehensive income for the period
Profit for the period 77,692 77,692
Total comprehensive income for the period 77,692 77,692
Transactions reported directly in equity
New share issue 4,516 745,5451) 750,061
Warrants, repurchased and cancelled –842 –3,177 –4,019
Tax effect on items reported directly in equity 7,155 7,155
Total transactions reported directly in equity 4,516 – 751,858 –3,177 – 753,197
Closing balance 31 Dec 2015 26,178 3,098 1,661,136 –18,775 77,692 1,749,329
1) Nominal amount of SEK 778,068,000 has been reduced by transaction costs of SEK 32,523,000.
Restricted equity Non-restricted equity
SEK thousand Share capitalStatutory
reserveOther contrib-
uted equityLosses carried
forwardProfit/loss for
the periodTotal share-
holders’ equity
Opening balance 1 Jan 2014 15,488 3,098 395,830 –23,111 –4,951 386,354
Transfer of previous year s net loss –4,951 4,951 –
Comprehensive income for the period
Profit for the period 12,464 12,464
Total comprehensive income for the period 12,464 12,464
Transactions reported directly in equity
New share issue 6,174 508,3102) 514,484
Paid-in premium for warrants 5,138 5,138
Total transactions reported directly in equity 6,174 – 513,448 – – 519,622
Closing balance 31 Dec 2014 21,662 3,098 909,278 –28,062 12,464 918,440
2) Nominal amount of SEK 527,160,000 has been reduced by transaction costs of SEK 18,850,000.

Hoist Finance AB (publ) • Year-end report 2015 21
Financial statements
Parent Company cash flow statement
SEK thousandQuarter 4
2015Quarter 4
2014Full year
2015Full year
2014
OPERATING ACTIVITIESPaid-in interest 1 11 10 32
Other operating income 38,648 51,996 148,458 171,684
Interest paid –213 –279 –927 –1,314
Operating expenses –48,191 –54,283 –182,379 –164,652
Net cash flow from financial transactions –472 1,428 –4,467 1,221
Income tax paid –1,826 99 –1,930 –5
Total –12,053 –1,028 –41,235 6,966
Increase/decrease in intra-group transactions 96,381 3,591 130,784 55,322
Increase/decrease in other assets 99 –2,765 3,263 –2,621
Increase/decrease in other liabilities 1,068 7,887 –2,273 –1,081
Total 97,548 8,703 131,774 51,592
Cash flow from operating activities 85,495 7,675 90,539 58,558
INVESTING ACTIVITIESInvestments in intangible assets –4,537 –1,350 –15,101 –6,622
Disposals of intangible assets 21,383 – 21,383 –
Investments in tangible assets –191 –206 –1,965 –574
Investments in subsidiaries – –99,989 –759,003 –432,952
Cash flow from investing activities 16,655 –101,545 –754,686 –440,148
FINANCING ACTIVITIESNew share issue – 99,434 750,061 414,484
Paid-in premium for warrants – 3,794 – 5,138
Warrants, repurchased and cancelled – – –4,019 –
Cash flow from financing activities – 103,228 746,042 419,622
Cash flow for the period 102,150 9,358 81,895 38,032Cash at the beginning of the period 23,264 34,161 43,519 5,487
Cash at the end of the period1) 125,414 43,519 125,414 43,519
1) Consists of cash and bank balances.

Hoist Finance AB (publ) • Year-end report 2015 22
Accounting principles
Accounting principlesHoist Finance AB (publ) 556012-8489
The interim financial statements are presented in accordance with IAS
34 Interim Financial Reporting. The Group’s consolidated accounts
have been prepared in accordance with the International Financial
Reporting Standards (IFRS) and interpretations thereof as adopted by
the European Union. The accounting follows the Swedish Annual Ac-
counts Act for Credit Institutions and Securities Companies (1995:1559)
and the regulatory code issued by the Swedish Financial Supervisory
Authority (FFFS 2008:25), on Annual Reports in Credit institutions and
Securities Companies. The Swedish Financial Board’s RFR 1, Supple-
mentary Accounting Rules for Groups, has also been applied.
The Parent Company’s accounts were prepared in accordance with
the Swedish Annual Accounts Act (1995:1554) and the regulatory code
issued by the Swedish Financial Supervisory Authority (FFFS 2008:25),
on Annual Reports in Credit institutions and Securities Companies. The
Swedish Financial Board’s RFR 2, Accounting for Legal Entities, was also
Exchange rates
1 EUR = SEKQuarter 4
2015Quarter 4
2014Full year
2015Full year
2014
Income statement (average) 9.3553 9.0930 9.3553 9.0930
Balance sheet (at end of the period) 9.1350 9.5155 9.1350 9.5155
1 GBP = SEK
Income statement (average) 12.8908 11.2794 12.8908 11.2794
Balance sheet (at end of the period) 12.3785 12.1388 12.3785 12.1388
1 PLN = SEK
Income statement (average) 2.2372 2.1737 2.2372 2.1737
Balance sheet (at end of the period) 2.1545 2.2124 2.1545 2.2124
applied. The same accounting policies and methods of computation are
followed as compared to the Annual report 2014.
IFRIC 21 Levies is to be applied as from financial year 2015. The
interpretation is effective for financial years beginning on or after
17 June 2014. The interpretation includes guidance on debt accounting
within IAS 37 Provisions, Contingent Liabilities and Contingent Assets
and clarifies that the company should recognise a liability for the levy
at the end of the year, provided that the company conducts banking
activities at the end of the year. The new interpretation is not deemed
to have any significant impact on the Group’s financial statements or
capital adequacy.
No other IFRCs or IFRIC Interpretations that are not yet effective
are expected to have any significant impact on the Group.

Hoist Finance AB (publ) • Year-end report 2015 23
Notes
NotesNote 1 Segment reporting
Consolidated income statement
SEK thousandQuarter 4
2015Quarter 4
2014Full year
2015Full year
2014
Revenues from acquired loan portfolios 563,083 410,793 2,004,524 1,398,291of which, gross cash collections 1,032,221 750,218 3,631,032 2,541,311of which, portfolio amortisation and revaluation –469,138 –339,425 –1,626,508 –1,143,020Interest income 1,573 13,166 2,679 89,731 of which, interest income from run-off consumer loan portfolio 1,550 5,640 10,176 38,180 of which, interest income excl. run-off consumer loan portfolio 23 7,526 –7,497 51,551Interest expense –85,772 –93,437 –361,370 –344,969
Net interest income 478,884 330,522 1,645,833 1,143,053 Fee and commission income 39,351 39,467 166,705 153,222Net income from financial transactions 6,257 –16,321 –15,341 –17,719Other income 2,751 5,904 10,629 12,219
Total operating income 527,243 359,572 1,807,826 1,290,775 General administrative expensesPersonnel expenses –186,713 –132,298 –651,354 –473,200Other operating expenses –211,144 –188,042 –874,016 –627,467Depreciation and amortisation of tangible and intangible assets –11,704 –9,623 –46,866 –30,281
Total operating expenses –409,561 –329,963 –1,572,236 –1,130,948 Profit before loan losses 117,682 29,609 235,590 159,827
Net loan losses – – –5,298 –Profit from shares and participations in joint ventures 13,868 17,918 54,839 58,662
Profit before tax 131,550 47,527 285,131 218,489
Operating income statement based on segment reporting
SEK thousandQuarter 4
2015Quarter 4
2014Full year
2015Full year
2014
Gross cash collections on acquired loan portfolios 1,032,221 750,218 3,631,032 2,541,311Portfolio amortisation and revaluation –469,138 –339,425 –1,626,508 –1,143,020Interest income from run-off consumer loan portfolio 1,550 5,640 10,176 38,180
Net revenue from acquired loan portfolios 564,633 416,433 2,014,700 1,436,471Fee and commission income 39,351 39,467 166,705 153,222Profit from shares and participations in joint ventures 13,868 17,918 54,839 58,662Other income 2,751 5,904 10,629 12,219
Total revenue 620,603 479,722 2,246,873 1,660,574
Personnel expenses –186,713 –132,298 –651,354 –473,200Other operating expenses –211,144 –188,042 –874,016 –627,467Depreciation and amortisation of tangible and intangible assets –11,704 –9,623 –46,866 –30,281
Total operating expenses –409,561 –329,963 –1,572,236 –1,130,948 EBIT 211,042 149,759 674,637 529,626
Interest income excl. run-off consumer loan portfolio 23 7,526 –7,497 51,551Interest expense –85,772 –93,437 –361,370 –344,969Net income from financial transactions incl. financing costs 6,257 –16,321 –20,639 –17,719
Total financial items –79,492 –102,232 –389,506 –311,137
Profit before tax 131,550 47,527 285,131 218,489
Segment reporting has been prepared based on the manner in which executive management monitors operations. This differs from statutory account preparation; the material differences are as follows:• Revenueincludesincomefrom
– acquired loan portfolios – run-off consumer loan portfolio
– fee and commission income from third parties – profit from shares and participations in joint ventures – other income
• Totalfinancialitemsincludeinterestincomefromsourcesotherthan acquired loan portfolios, interest expense and net income from financial transactions.

Hoist Finance AB (publ) • Year-end report 2015 24
Notes
Note 1 Segment reporting, cont.
Income statement Quarter 4 2015
SEK thousandGermany and
Austria1)
Belgium, Nether-
lands andFrance2) UK Italy Poland
Central Functions/
Eliminations Group
Gross cash collections on acquired loan portfolios 207,128 238,455 247,724 200,249 138,665 – 1,032,221Portfolio amortisation and revaluation –61,245 –167,894 –91,864 –94,497 –53,638 – –469,138Interest income from run-off consumer loan portfolio 1,550 – – – – – 1,550
Net revenue from acquired loan portfolios 147,433 70,561 155,860 105,752 85,027 – 564,633Fee and commission income 3,013 1,660 22,939 1,956 9,783 – 39,351Profit from shares and participations in joint ventures – – – – – 13,868 13,868Other income 3,388 10 –90 428 185 –1,170 2,751
Total revenue 153,834 72,231 178,709 108,136 94,995 12,698 620,603
Personnel expenses –41,649 –20,760 –52,878 –16,851 –7,258 –47,317 –186,713Other operating expenses –28,677 –45,932 –34,041 –43,651 –17,936 –40,907 –211,144Depreciation and amortisation of tangible and intan-gible assets –941 –536 –1,858 –1,092 –953 –6,324 –11,704
Total operating expenses –71,267 –67,228 –88,777 –61,594 –26,147 –94,548 –409,561
EBIT 82,567 5,003 89,932 46,542 68,848 –81,850 211,042
Interest income excl. run-off consumer loan portfolio 133 40 92 1 373 –616 23Interest expense –1,476 –23 – – –9 –84,264 –85,772Net income from financial transactions incl. financing costs –26,741 –26,533 –44,131 –21,894 –18,491 144,047 6,257
Total financial items –28,084 –26,516 –44,039 –21,893 –18,127 59,167 –79,492
Profit/-loss before tax 54,483 –21,513 45,893 24,649 50,721 –22,683 131,550
1) Total revenue for Germany of SEK 150,580,000 is included in the revenue for Germany and Austria.2) Total revenue for the Netherlands of SEK 93,182,000 is included in the revenue for Belgium, the Netherlands and France.
Income statement Quarter 4 2014
SEK thousandGermany and
Austria1)
Belgium, Nether-
lands andFrance2) UK Italy Poland
Central Functions/
Eliminations Group
Gross cash collections on acquired loan portfolios 230,362 205,796 143,110 89,490 81,460 – 750,218Portfolio amortisation and revaluation –108,919 –150,907 –33,613 –21,915 –24,071 – –339,425Interest income from run-off consumer loan portfolio 5 640 – – – – – 5,640
Net revenue from acquired loan portfolios 127,083 54,889 109,497 67,575 57,389 – 416,433Fee and commission income 3,586 1,860 34,021 – – – 39,467Profit from shares and participations in joint ventures – – – – – 17,918 17,918Other income 7,839 145 1,962 –416 – –3,626 5,904
Total revenue 138,508 56,894 145,480 67,159 57,389 14,292 479,722
Personnel expenses –34,872 –21,626 –39,023 –11,678 –600 –24,499 –132,298Other operating expenses –25,944 –24,262 –37,493 –39,167 –18,387 –42,789 –188,042Depreciation and amortisation of tangible and intangible assets –795 –1,789 –773 –2,033 – –4,233 –9,623
Total operating expenses –61,611 –47,677 –77,289 –52,878 –18,987 –71,521 –329,963
EBIT 76,897 9,217 68,191 14,281 38,402 –57,229 149,759
Interest income excl. run-off consumer loan portfolio 76 113 3 – – 7,334 7,526Interest expense –730 –18 –86 – – –92,603 –93,437Net income from financial transactions incl. financing costs –28,574 –26,829 –21,426 –8,915 –15,470 84,893 –16,321
Total financial items –29,228 –26,734 –21,509 –8,915 –15,470 –376 –102,232
Profit/-loss before tax 47,669 –17,517 46,682 5,366 22,932 –57,605 47,527
1) Total revenue for Germany of SEK 137,845,000 is included in the revenue for Germany and Austria.2) Total revenue for the Netherlands of SEK 79,279,000 is included in the revenue for Belgium, the Netherlands and France.
Group costs for central and supporting functions are not allocated to the operating segments but are reported as Central Functions and Eliminations.
A financing cost is allocated to the operating segments based on the acquired loan portfolio assets. The difference between the actual
financing cost and the standardised cost is included in Central Func-tions and Eliminations.
With respect to the balance sheet, only acquired loan portfolios are monitored. Other assets and liabilities are not monitored on a segment-by-segment basis .

Hoist Finance AB (publ) • Year-end report 2015 25
Notes
Income statement Full-year 2015
SEK thousandGermany and
Austria1)
Belgium, the Nether-
lands andFrance2) UK Italy Poland
Central Functions/
Eliminations Group
Gross cash collections on acquired loan portfolios 871,315 891,864 813,772 588,633 465,448 – 3,631,032Portfolio amortisation and revaluation –435,248 –575,823 –204,427 –221,462 –189,548 – –1,626,508Interest income from run-off consumer loan portfolio 10,176 – – – – – 10,176
Net revenue from acquired loan portfolios 446,243 316,041 609,345 367,171 275,900 – 2,014,700Fee and commission income 8,857 6,916 107,931 5,891 37,110 – 166,705Profit from shares and participations in joint ventures – – – – – 54,839 54,839Other income 11,823 –22 1,145 1,414 353 –4,084 10,629
Total revenue 466,923 322,935 718,421 374,476 313,363 50,755 2,246,873
Personnel expenses –148,757 –89,769 –184,346 –56,842 –23,656 –147,984 –651,354Other operating expenses –98,897 –127,087 –275,525 –126,380 –75,005 –171,122 –874,016Depreciation and amortisation of tangible and intangible assets –3,583 –2,407 –5,351 –5,959 –3,612 –25,954 –46,866
Total operating expenses –251,237 –219,263 –465,222 –189,181 –102,273 –345,060 –1,572,236
EBIT 215,686 103,672 253,199 185,295 211,090 –294,305 674,637
Interest income excl. run-off consumer loan portfolio 521 84 117 1 1,599 –9,819 –7,497Interest expense –1,476 –76 76 –8 –121 –359,765 –361,370Net income from financial transactions incl. financing costs –111,204 –105,635 –133,690 –66,290 –68,106 464,286 –20,639
Total financial items –112,159 –105,627 –133,497 –66,297 –66,628 94,702 –389,506
Profit/-loss before tax 103,527 –1,955 119,702 118,998 144,462 –199,603 285,131
1) Total revenue for Germany of SEK 453,307,000 is included in the revenue for Germany and Austria.2) Total revenue for the Netherlands of SEK 287,181,000 is included in the revenue for Belgium, the Netherlands and France.
Income statement Full-year 2014
SEK thousandGermany and
Austria1)
Belgium, the Nether-
lands andFrance2) UK Italy Poland
Central Functions/
Eliminations Group
Gross cash collections on acquired loan portfolios 724,044 733,474 527,346 260,828 295,619 – 2,541,311Portfolio amortisation and revaluation –348,873 –484,991 –200,802 –91,324 –17,030 – –1,143,020Interest income from run-off consumer loan portfolio 38,180 – – – – – 38,180
Net revenue from acquired loan portfolios 413,351 248,483 326,544 169,504 278,589 – 1,436,471Fee and commission income 17,889 6,989 128,344 – – – 153,222Profit from shares and participations in joint ventures – – – – – 58,662 58,662Other income 14 294 218 2 686 311 – –5,290 12,219
Total revenue 445,534 255,690 457,574 169,815 278,589 53,372 1,660,574
Personnel expenses –133,245 –86,886 –134,502 –17,854 –2,035 –98,678 –473,200Other operating expenses –85,272 –102,656 –137,601 –86,028 –74,812 –141,098 –627,467Depreciation and amortisation of tangible and intangible assets –2,940 –4,679 –4,588 –2,340 – –15,734 –30,281
Total operating expenses –221,457 –194,221 –276,691 –106,222 –76,847 –255,510 –1,130,948
EBIT 224,077 61,469 180,883 63,593 201,742 –202,138 529,626
Interest income excl. run-off consumer loan portfolio 96 170 241 – – 51,044 51,551Interest expense –678 –90 –179 –2 – –344,020 –344,969Net income from financial transactions incl. financing costs –105,135 –100,481 –72,627 –25,292 –52,232 338,048 –17,719
Total financial items –105,717 –100,401 –72,565 –25,294 –52,232 45,072 –311,137
Profit/-loss before tax 118,360 –38,932 108,318 38,299 149,510 –157,066 218,489
1) Total revenue for Germany of SEK 437,105,000 is included in the revenue for Germany and Austria.2) Total revenue for the Netherlands of SEK 199,747,000 is included in the revenue for Belgium, the Netherlands and France.
Note 1 Segment reporting, cont.

Hoist Finance AB (publ) • Year-end report 2015 26
Notes
Acquired loans at 31 Dec 2015
SEK thousandGermany and
Austria1)
Belgium, the Nether-
lands andFrance2) UK Italy Poland
Central Functions/
Eliminations Group
Run-off consumer loan portfolio 58,364 – – – – – 58 ,364Acquired loan portfolios 2,046,099 2,077,091 3,386,835 2,062,759 1,441,915 – 11,014,699Shares and participations in joint ventures – – – – – 205,557 205,557Acquired loans 2,104,463 2,077,091 3,386,835 2,062,759 1,441,915 205,557 11,278,620
Acquired loans at 31 Dec 2014
SEK thousandGermany and
Austria1)
Belgium, the Nether-
lands andFrance2) UK Italy Poland
Central Functions/
Eliminations Group
Run-off consumer loan portfolio 118,799 – – – – – 118,799Acquired loan portfolios 2,231,593 2,194,000 1,797,520 1,181,210 1,182,459 – 8,586,782Shares and participations in joint ventures – – – – – 215,347 215,347Acquired loans 2,350,392 2,194,000 1,797,520 1,181,210 1,182,459 215,347 8,920,928
Note 1 Segment reporting, cont.

Hoist Finance AB (publ) • Year-end report 2015 27
Notes
GROUP
SEK thousand 31 Dec 2015 31 Dec 2014
Opening balance 8,586,782 5,997,935Acquisitions 4,370,259 3,226,795Translation differences –315,835 505,071
Changes in valueBased on opening balance forecast (amortisation) –1,587,651 –1,128,103Based on revised estimates (revaluation) –38,856 –14,916
Carrying value 11,014,699 8,586,782Changes in carrying value reported in the income statement –1,626,507 –1,143,020
Note 2 Financial instruments
Sensitivity analysisWhile Hoist Finance considers the assumptions made in assessing fair value to be reasonable, the application of other methods and assumptions
may produce a different fair value. For Level 3 fair value, a reasonable change in one or several assumptions would have the following impact on
earnings:
GROUP
SEK thousand 31 Dec 2015 31 Dec 2014
Carrying value of loan portfolios 11,014,699 8,586,782A 5% increase in estimated cash flow over the forecast period (10 years) would increase the carrying value by 540,638 424,369of which, valued at fair value 58,890 72,804A 5% decrease in estimated cash flow over the forecast period would reduce the carrying value by –540,638 –424,369of which, valued at fair value –58,890 –72,804
Carrying value of loan portfolios acquired prior to 1 July 2011 (fair value) 1,177,808 1,460,229A 1% decrease in the market rate of interest would increase the carrying value by 34,774 46,058A 1% increase in the market rate of interest would reduce the carrying value by –32,880 –43,483Shortening the forecast period by 1 year would reduce the carrying value by –33,073 –48,622Lengthening the forecast period by 1 year would increase the carrying value by 21,424 43,413
Of which, designated at fair valueGROUP
SEK thousand 31 Dec 2015 31 Dec 2014
Opening balance 1,460,229 1,607,061Translation differences –53,671 94,594
Changes in valueBased on opening balance forecast (amortisation) –167,331 –188,953Based on revised estimates (revaluation) –61,419 –52,473
Carrying value 1,177,808 1,460,229Changes in carrying value reported in the income statement –228,750 –241,426
Portfolios valued at fair value through profit or loss The Group has chosen to categorise portfolios acquired prior to
1 July 2011 as designated at fair value through profit or loss, as these
financial assets are managed and their performance is evaluated on
a fair value basis in accordance with the Group’s risk management
policies. Portfolios acquired after that date are valued at amortised
cost. Information on the portfolios is provided internally to Group
Management on this basis. The underlying concept for valuation at
fair value is to assess the carrying value of an asset by using the best
available price for the asset. Loan portfolios are typically not traded
publicly and, consequently, there are no market prices available. Most
participants in the industry, however, apply similar pricing methods for
portfolio acquisitions and calculate the present value of cash flows that
correspond to the market value of a portfolio.
The primary influencing factors in assessing fair value are:
•thegrosscollectionsforecast
•thecostlevel
•themarketdiscountrate
The Group monitors and evaluates its valuation methods on a regular
basis in order to adequately track fluctuations in portfolio value.
The Group monitors the coming ten years’ net collection forecasts
for all portfolios on a monthly basis and discounts the forecasts
accordingly. The portfolio forecast curve initially used in fair value
calculations is the portfolio’s acquisition curve. These forecast curves
serve as the basis for calculating the fair value for each portfolio. The
result then represents the portfolio’s new fair value.

Hoist Finance AB (publ) • Year-end report 2015 28
Notes
Note 2 Financial instruments, cont.
The discount rate corresponding to the market rate of return is
updated regularly and reflects actual rates of return on relevant and
comparable market transactions. The portfolios are valued at a 12 per
cent IRR (Internal Rate of Return) over a ten-year period, which is in
line with prevailing and relevant market transactions.
Fair value measurements The Group uses observable data to the greatest possible extent when
assessing the fair value of an asset or a liability. Fair values are catego-
rised in different levels based on the input data used in the valuation
approach, as per the following:
Level 1) Quoted prices (unadjusted) on active markets for identical
instruments.
Level 2) Based on directly or indirectly observable market inputs not
included in Level 1. This category includes instruments valued
based on quoted prices on active markets for similar instru-
ments, quoted prices for identical or similar instruments
traded on markets that are not active, or other valuation
techniques in which all important input data is directly or
indirectly observable in the market.
Level 3) According to inputs that are not based on observable market
data. This category includes all instruments for which the
valuation technique is based on data that is not observable
and has a substantial impact upon the valuation.
The following table presents the financial instruments referenced in
the balance sheet for informational purposes and thus measured at
fair value:
Group, 31 Dec 2015
SEK thousand Loan portfolios Financing Carrying value Fair value Level 1 Level 2 Level 3
Treasury bills and Treasury bonds 3,077,827 3,077,827 3,077,827 3,077,827Acquired loan portfolios
of which, carried at fair value 1,177,808 1,177,808 1,177,808 1,177,808of which, carried at amortised cost 9,836,891 9,836,891 10,014,382 10,014,382
Bonds and other securities1) 1,278,214 1,278,214 1,278,214 1,278,214Derivatives 314,680 314,680 314,680 314,680Total assets 11,014,699 4,670,721 15,685,420 15,862,911 4,356,041 314,680 11,192,190
Additional purchase price liability 66,489 66,489 66,489 66,489Derivatives 1,651 1,651 1,651 1,651Senior unsecured debt 1,238,469 1,238,469 1,268,327 1,268,327Subordinated liabilities 336,892 336,892 407,558 407,558Total liabilities 1,643,501 1,643,501 1,744,025 1,677,536 66,489
1) Bonds and other securities include SEK 25m in shares. The shares are reported at acquisition cost as there are no quoted market prices, and it has not been possible to estimate a reliable fair value using accepted valuation methods.
Group, 31 Dec 2014
SEK thousand Loan portfolios Financing Carrying value Fair value Level 1 Level 2 Level 3
Treasury bills and Treasury bonds 2,316,110 2,316,110 2,316,110 2,316,110Acquired loan portfolios
of which, carried at fair value 1,460,229 1,460,229 1,460,229 1,460,229
of which, carried at amortised cost 7,126,553 7,126,553 7,311,207 7,311,207
Bonds and other securities1) 1,926,241 1,926,241 1,926,241 1,926,241Total assets 8,586,782 4,242,351 12,829,133 13,013,787 4,242,351 8,771,436
Derivatives 246,724 246,724 246,724 246,724Senior unsecured debt 1,493,122 1,493,122 1,681,899 1,681,899Subordinated liabilities 332,796 332,796 386,750 386,750Total liabilities 2,072,642 2,072,642 2,315,373 2,315,373
1) Bonds and other securities include SEK 25m in shares. The shares are reported at acquisition cost as there are no quoted market prices, and it has not been possible to estimate a reliable fair value using accepted valuation methods.

Hoist Finance AB (publ) • Year-end report 2015 29
Notes
Note 2 Financial instruments, cont.
For acquired loan portfolios, the valuation approach, key input data
and valuation sensitivity for material changes thereto are described in
the same note.
Derivatives used for hedging have been model-valued using
interest and currency market rates as input data. Treasury bills and
Treasury bonds as well as Bonds and other securities are valued based
on quoted rates. Fair value of financing of senior unsecured debt
and other subordinated liabilities was determined with reference to
amortised cost. Obsewable market rates quoted by external market
players. In cases where more than one market price observation are
available the fair value is determined at arithmetic mean of the market
quotes. Carrying value for accounts receivable and accounts payable
are deemed approximations of fair value. The fair value of current
loans corresponds to their carrying value due to the limited impact of
discounting.
No transfers between any of the levels took place during the
period.
On 1 July 2015 Hoist Finance acquired a substantial, diversified loan
portfolio in the UK by acquiring all shares in Compello Holdings Ltd,
a debt restructuring company with self-owned portfolios operating
in the UK and headquartered in Milton Keynes. The acquisition will
further strengthen Hoist Finance’s market position. The total purchase
price of SEK 1.256 billion was paid in cash upon completion of the ac-
quisition. The acquisition is from a cash flow point of view regarded as
a portfolio acquisition. The portfolio value at acquisition was SEK 1.502
billion and the outstanding capital claim totalled SEK 33 billion.
Acquired company’s net assets at acquisition date:
SEK thousand
Cash and cash equivalents 23,306Tangible assets 3,965Accounts receivable and other receivables 1,506,716Accounts payable and other liabilities –131,159Non-current liabilities to Group companies –146,419Total identifiable net assets 1,256,408
The acquisition balance sheet included SEK 1.256 billion in net assets,
including SEK 23.3 million in cash and cash equivalents. Acquisition-
related expenses are estimated at SEK 17.8 million and include a stamp
duty of approximately SEK 6.2 million. Compello Holdings Ltd. had
SEK 104.3 million in income during the first six months of 2015 and an
operating profit of SEK 26.2 million. The acquisition will not give rise to
any acquisition goodwill, as the entire purchase price is related to the
debt portfolios and other current receivables. Compello Holdings Ltd
has been consolidated into Hoist Finance Group as of July 2015. The
acquisition calculation is preliminary.
Note 3 Business combinations
In December 2014 Hoist Kredit acquired 100 per cent of the shares
in Kancelaria Navi Lex. As at 31 December 2014, SEK 8.5 million of the
purchase price remained unsettled. The amount was paid during the
first quarter of 2015.
Since the acquisition took place as late as 30 December 2014, addi-
tional purchase price was not included in the acquisition analysis. The
analysis was adjusted during Q1 2015 to take into account additional
purchase price, which may range between SEK 0 million and SEK 83
million until 2018. Management’s assessment is that the maximum
additional purchase price will be payable, which is why SEK 81.4 million
is referenced in the acquisition analysis. The discount effect of the
additional purchase price totals SEK 5 million and gives rise to an
additional surplus value of SEK 76.4 million. Of the additional purchase
price, SEK 9.4 million has been paid. The entire amount is attributable
to goodwill. During the forth quarter an adjustment to the acquisition
calsulation of SEK 1.8 million against goodwill has been made due to
new assumptions. Goodwill is primarily attributable to the Group’s
base and organisation being well suited for further expansion on the
Polish NPL market. Navi Lex has an experienced management team
and an efficient organisation with excellent market knowledge and a
network of contacts for acquiring portfolios and managing collection
operations. The Navi Lex collection system and call centre infrastruc-
ture is also well invested. External collection agencies were used for
the Polish portfolios prior to the acquisition; this is now done internally
via Navi Lex, which significantly reduces collection costs.
Hoist Kredit acquired Cruz’s 10 per cent minority shareholding in
Hoist Kredit ’s subsidiary Hoist Finance UK Ltd for a total purchase price
of SEK 40.1 million, of which SEK 32.6 million was cash-based.

Hoist Finance AB (publ) • Year-end report 2015 30
Notes
This note provides information required to be disclosed under the pro-
visions of FFFS 2008:25 regarding annual accounts for credit institutions
and FFFS 2014:12 regarding prudential requirements and capital buff-
ers. The information relates to Hoist Finance on a consolidated basis
(“Hoist Finance”) and Hoist Kredit AB (“Hoist Kredit”), the regulated
entity. The only difference between the consolidated accounts and the
consolidated situation for capital adequacy purposes is that the equity
method is applied in the consolidated accounts whereas the propor-
tional method is applied for the joint venture in relation to capital
adequacy reporting. When establishing the company’s statutory capital
requirements the following laws and regulations apply: EU regulation
No 575/2013 on prudential requirements for credit institutions and
investment firms; Swedish law 2014:968, Special supervision of credit
Note 4 Capital adequacy
institutions and securities companies; and Swedish law 2014:966 on
capital buffers. These laws and regulations are aimed at ensuring that
the licensed institution and its consolidated situation manage their
risks and that customers are protected. The regulations specify that
the capital base shall cover capital requirements, including minimum
capital requirements (capital requirements for credit risk, market risk
and operational risk), and capital requirements for all other essential
risks i.e. Pillar 2 risks.
Own fundsThe table below shows own funds for Hoist Finance and for the regulat-
ed entity Hoist Kredit that are used to meet capital adequacy require-
ments.
Capital adequacy assessment
Hoist Finance consolidated situation
Hoist Kredit AB (publ)
Own funds, SEK thousand 31 Dec 2015 31 Dec 2014 31 Dec 2015 31 Dec 2014
Capital instruments and the related share premium accounts 1,286,805 529,971 482,963 482,963Retained earnings 316,687 194,909 192,023 390,695Accumulated comprehensive income and other reserves 361,363 399,206 1,062,749 304,267Independently reviewed interim profits net of foreseeable charge or dividend1) 161,366 175,103 231,102 4,734Intangible assets (net of related tax liabilities) –235,632 –171,048 –42,278 –45,273Deferred tax assets that rely on future profitability –62,688 –70,885 –2,224 –1,249
Common Equity Tier 1 1,827,901 1,057,257 1,924,335 1,136,136
Capital instruments and the related share premium accounts 93,000 93,000 93,000 93,000
Additional Tier 1 capital 93,000 93,000 93,000 93,000
Tier 1 capital 1,920,901 1,150,257 2,017,335 1,229,136
Capital instruments and the related share premium accounts 336,892 332,796 336,892 332,796Regulatory adjustments – –106,655 – –111,815
Tier 2 capital 336,892 226,141 336,892 220,981
Total own funds for capital adequacy purposes 2,257,793 1,376,398 2,354,227 1,450,118
1) Regulatory dividend deduction is calculated at 30% of net profit for the year, the maximum dividend allowed under the Group’s internal dividend policy.
Capital requirementsThe tables below shows the risk exposure amounts and minimum capital requirements per risk category for Hoist Finance and the regulated
entity Hoist Kredit.
Hoist Finance consolidated situation
Hoist Kredit AB (publ)
Risk exposure amounts, SEK thousand 31 Dec 2015 31 Dec 2014 31 Dec 2015 31 Dec 2014
Exposures to central governments or central banks 0 0 0 0Exposures to regional governments or local authorities 0 0 0 0Exposures to institutions 339,617 489,562 195,897 116,172 of which, counterparty credit risk 89,598 21,268 89,598 21,268
Exposures to corporates 136,601 146,279 8,789,030 5,316,830Retail exposures 43,774 102,772 43,774 98,109Exposures in default 11,244,739 8,837,997 2,646,612 2,925,471Exposures in the form of covered bonds 126,821 192,624 126,821 192,624Other items 320,316 233,012 707,979 1,749,196
Credit risk (standardised approach) 12,211,868 10,002,246 12,510,113 10,398,402
Market risk (foreign exchange risk - standardised approach) 26,573 137,565 26,573 137,565
Operational risk (basic indicator approach) 2,600,728 1,167,241 755,709 513,107
Credit valutaion adjustment (standardised approach) 664 – 664 –
Total risk exposure amount 14,839,833 11,307,052 13,293,059 11,049,074

Hoist Finance AB (publ) • Year-end report 2015 31
Notes
Own funds requirements, SEK thousandHoist Finance consolidated
situationHoist Kredit AB (publ)
Pillar 1 31 Dec 2015 31 Dec 2014 31 Dec 2015 31 Dec 2014
Exposures to central governments or central banks 0 0 0 0Exposures to regional governments or local authorities 0 0 0 0Exposures to institutions 27,169 39,165 15,672 9,294 of which, counterparty credit risk 7,168 1,701 7,168 1,701Exposures to corporates 10,928 11,702 703,122 425,346Retail exposures 3,502 8,222 3,502 7,849Exposures in default 899,579 707,039 211,729 234,038Exposures in the form of covered bonds 10,146 15,410 10,146 15,410Other items 25,625 18,643 56,637 139,935
Credit risk (standardised approach) 976,950 800,181 1,000,808 831,872
Market risk (foreign exchange risk-standardised approach) 2,126 11,005 2,126 11,005
Operational risk (basic indicator approach) 208,058 93,379 60,457 41,049
Credit valuation adjustment (standardised approach) 53 – 53 –
Total own funds requirement – Pillar 1 1,187,188 904,564 1,063,445 883,926
Pillar 2
Concentration risk 82,671 9,360 82,671 9,360Interest rate risk in the banking book 71,453 37,550 71,453 37,550Pension risk 5,358 – – – Other Pillar 2 risks 23,656 21,541 24,421 21,541
Total own funds requirement – Pillar 2 183,138 68,451 178,546 68,451
Capital buffers
Capital conservation buffer 370,996 282,676 332,326 276,227Countercyclical buffer 2,456 – 5,876 –
Total own funds requirement – Capital buffers 373,452 282,676 338,202 276,227
Total own funds requirements 1,743,777 1,255,691 1,580,193 1,228,604
Note 4 Capital adequacy, cont.

Hoist Finance AB (publ) • Year-end report 2015 32
Notes
Capital requirements and capital buffersRegulation (EU) 575/2013 of the European Parliament and the Council,
which took effect on 1 January 2014, requires credit institutions to
maintain Common Equity Tier 1 capital of at least 4.5 per cent, Tier 1
capital of at least 6 per cent, and a total capital ratio (capital in relation
to risk-weighted exposure amount) of 8 per cent. On 2 August 2014,
when Swedish implementation of the Capital Requirements Directive
entered into force, credit institutions became required to maintain
specific capital buffers. Hoist Finance is currently required to maintain
a capital conservation buffer of 2.5 per cent of the total risk exposure
amount and an institution-specific countercyclical buffer of 0.02 per
cent of the total risk exposure amount. The table below shows CET1
capital, Tier 1 capital and the total capital ratio for Hoist Finance and
for the regulated entity Hoist Kredit. The table also shows the total
regulatory requirements for each Pillar.
All capital ratios exceed the minimum requirements and capital
buffer requirements by a good margin of safety.
Hoist Finance consolidated situation
Hoist Kredit AB (publ)
Capital ratios and capital buffers, % 31 Dec 2015 31 Dec 2014 31 Dec 2015 31 Dec 2014
Common Equity Tier 1 capital ratio 12.32 9.35 14.48 10.28Tier 1 capital ratio 12.94 10.17 15.18 11.12Total capital ratio 15.21 12.17 17.71 13.12
Institution-specific buffer requirements for CET1 capital 7.02 7.00 7.04 7.00of which, capital conservation buffer requirement 2.50 2.50 2.50 2.50of which, countercyclical capital buffer requirement 0.02 – 0.04 –
Common Equity Tier 1 capital available to meet buffers1) 6.94 4.17 9.18 5.12
1) CET1 ratio as reported, less minimum requirement of 4.5 per cent (excluding buffer requirements) and less any CET1 items used to meet the Tier 1 and total capital requirements.
Internally assessed capital requirement The internally assessed capital requirement for Hoist Finance consol-
idated situation totalled SEK 1,370m (973) at 31 December 2015, of
which SEK 183m (68) is attributable to Pillar 2. The capital requirement
was increased following the adjustment of methods for assessing
capital requirements.
Note 4 Capital adequacy, cont.

Hoist Finance AB (publ) • Year-end report 2015 33
Notes
Liquidity riskLiquidity risk is the risk of being unable to meet payment obligations
due to insufficient liquidity. Liquidity risk for Hoist Finance is associ-
ated primarily with the Group’s financing, which is based on depos-
its from the public and outflows of deposits on short notice. Hoist
Finance’s liquidity risk is low due to the fact that
•depositsfromthepublicarewelldiversified
•morethan99percentofdepositsarecoveredbystate-provided
deposit insurance
•theamountofdepositsismanagedbyadjustingreferenceinterest
rates, and
•fixed-ratefinancingcoversover80percentofHoistFinance’s
non-current assets (acquired loan portfolios)
Pursuant to Swedish Financial Supervisory Authority regulations
regarding management of liquidity risks in credit institutions and
investment firms (FFFS 2010:7), Hoist Kredit and Hoist Finance consoli-
dated situation shall maintain a separate reserve of high-quality liquid
assets to secure their short-term capacity to meet payment obligations
in the event of lost or impaired access to regularly available funding
sources. The liquidity reserve of Hoist Finance is comprised of unen-
cumbered assets that enable rapid liquidity creation at foreseeable
values, including:
•cashatcreditinstitutions
•depositswithothercreditinstitutionsavailablethefollowingday,and
•otherassetsthatarebothliquidonprivatemarketsandeligiblefor
refinancing by central banks.
Hoist Finance consolidated
situationHoist Kredit AB (publ)
Liquidity position, SEK thousand 31 Dec 2015 31 Dec 2014 31 Dec 2015 31 Dec 2014
Deposits and borrowing from the public 12,791,377 10,987,289 12,791,377 10,987,289Liquidity reserve1) 5,232,891 5,348,625 4,337,343 4,394,508Available liquidity, minimum of SEK 2,544m2) 5,243,464 5,531,632 4,347,916 4,577,515Liquidity reserve/deposits and borrowing from the public, % 40.91 48.68 33.91 40.00Available liquidity/deposits and borrowing from the public, % 40.99 50.35 33.99 41.66
1) Defined as cash at credit institutions available the next day and liquid interest-bearing instruments eligible for refinancing via the Swedish Central Bank.2) Defined as liquidity available within three days.
Hoist Finance consolidated
situationHoist Kredit AB (publ)
Liquidity funding, SEK thousand 31 dec 2015 31 dec 2014 31 dec 2015 31 dec 2014
Deposits and borrowing from the public, flexible 8,226,925 7,559,043 8,226,925 7,559,043Deposits and borrowing from the public, fixed 4,564,452 3,428,246 4,564,452 3,428,246Senior unsecured debt 1,238,469 1,493,122 1,238,469 1,493,122Convertible debt instruments 93,000 93,000 93,000 93,000Subordinated liabilities 336,892 332,796 336,892 332,796Shareholders’ equity 2,195,760 1,304,190 2,037,994 1,182,658Other 795,980 851,432 555,408 503,268Balance sheet total 17,451,477 15,061,829 17,053,139 14,592,133
Note 4 Capital adequacy, cont.

Hoist Finance AB (publ) • Year-end report 2015 34
Assurance
Assurance
The Board of Directors and the CEO hereby give their assurance that the interim financial statements provide a true and fair view of the business
activities, financial position and results of operations of the Group and the Parent Company, and describes the significant risks and uncertainties
to which the Parent Company and Group companies are exposed.
Stockholm, 10 February 2016
Jörgen Olsson
CEO
Board member
Ingrid Bonde
Chair of the Board
Annika Poutiainen
Board member
Costas Thoupos
Board member
Liselotte Hjorth
Board member
Per-Eric Skotthag
Board member
Gunilla Wikman
Board member

Hoist Finance AB (publ) • Year-end report 2015 35
Definitions
Acquired loans The total of acquired loan portfolios, run-off consumer loan portfolios and shares and participations in joint ventures.
Acquired loan portfolios An acquired loan portfolio consists of a number of defaulted consumer loans or debts that arise from the same originator.
Common Equity Tier 1 ratio The ratio numerator is the sum of shares issued by the company, share premium re-serve, retained earnings, other income, and other reserves after deductions for primary deferred tax assets, intangible fixed assets and goodwill. The ratio denominator is the company’s risk-weighted exposure amount.
Cost/Gross cash collections on acquired loan portfolios
Operating expenses less fee and commission income and other income, divided by the sum of gross cash collections and income from the run-off consumer loan portfolios.
Earnings per share Profit for the period attributable to parent company shareholders in relation to the aver-age number of outstanding shares.
EBIT Earnings Before Interest and Tax.
EBIT margin EBIT (operating earnings) divided by total revenue.
Fee and commission income Commission generated from third-party collection services.
Gross cash collections Gross cash flow from the Group’s customers on loans included in the Group’s acquired loan portfolios.
Gross 120-month ERC ”Estimated Remaining Collections” - i.e. the estimated remaining gross collection amount on acquired loan portfolios for the coming 120 months.
Liquidity ratio Cash in bank accounts and high-grade liquid bonds that can be made liquid within three days, divided by total deposits from the public.
Net revenue from acquired loans The sum of gross cash collections from acquired loan portfolios and income from the run-off consumer loan portfolio, less portfolio amortisation and revaluation.
Non-performing loans An originator's loan is non-performing as at the balance sheet date if it is past due or will be due shortly.
Portfolio amortisation The share of gross cash collections that will be used for amortising the carrying value of acquired loan portfolios.
Portfolio revaluation Changes in the portfolio value based on revised estimated remaining collections for the portfolio.
Return on assets Net profit for the period divided by average total assets.
Return on shareholders’ equity Net profit for the period divided by average shareholders’ equity during the period.
Total capital ratio The company’s CET1 capital, additional Tier 1 capital and Tier 2 capital divided by the company’s risk-weighted exposure amount.
Total revenue Total of net revenue from acquired loan, fee and commission income, profit from joint ventures and other income.
Definitions

Financial calendar 2016The annual report will be published on our homepage at the latest
4 April 2016Annual General Meeting
29 April 2016Interim report Q1
29 April 2016Interim report Q2
28 July 2016Interim report Q3
28 October 2016
Contact
Investor Relations Anne Rhenman-Eklund Group Head of Communications and IR Ph: +46 (0) 8-555 177 45 Email: [email protected]
Hoist Finance AB (publ) Corp. ID no. 556012-8489 Box 7848, 103 99 Stockholm Ph: +46 (0) 8-555 177 90
The year-end report and investor presentation are available at www.hoistfinance.com
Hoist Finance is a leading debt restructuring partner to interna-tional banks. Present in eight countries across Europe, we offer a broad spectrum of flexible and tailored solutions for the acquisi-tion and management of non-performing unsecured consumer loans. In Sweden, we offer the HoistSpar retail deposit service with approximately 85,000 active accounts.
Our Mission – Your Trust
Our strategies
Strengthen and expand position in current markets and grow in selected new markets
Maintain acquisition model and focus on core assets Build on our status as a regulated credit institution Develop debt management models focused on amicable in-house collections
Leverage existing economies of scale Maintain and develop unique funding base and leverage on solid capital and liquidity positions
Our business model
Specialisation, experience and a data- driven acquisition strategy allow Hoist Finance to acquire attractive portfolios of non-performing unsecured consumer loans.
Our proven model for amicable set-tlements generates stable, predicta-ble and long-dated cash flows.
Our medium-term financial targets
Information
Every care has been taken in the translation of this report. In the event of any discrepancy, the Swedish original will supersede the English translation.
Dividend as percentage of net income
25–30%EBIT margin
40%CET1 ratio
12%