yass: yet another su x stripper - ernetpabitra/paper/acmtois.pdf · yass: yet another su x stripper...
TRANSCRIPT

For Peer Review
YASS: Yet Another Suffix Stripper
P. Majumder, M. Mitra, S. Parui, G. Kole
Computer Vision and Pattern Recognition Unit
Indian Statistical Institute, Kolkata
P. Mitra
Computer Science and Engineering Department
Indian Institute of Technology
Kharagpur
K. Datta
Electrical Engineering Department
Jadavpur University, Kolkata
November 1, 2006
Abstract
Stemmers attempt to reduce a word to its stem or root form and are used widely in information
retrieval tasks to increase the recall rate. Most popular stemmers encode a large number of language
specific rules built over a length of time. Such stemmers with comprehensive rules are available only
for a few languages. In the absence of extensive linguistic resources for certain languages, statistical
language processing tools have been successfully used to improve the performance of IR systems. In this
paper, we describe a clustering-based approach to discover equivalence classes of root words and their
morphological variants. A set of string distance measures are defined, and the lexicon for a given text
collection is clustered using the distance measures to identify these equivalence classes. The proposed
approach is compared with Porter’s and Lovin’s stemmers on the AP and WSJ sub-collections of the
TIPSTER data set using 200 queries. Its performance is comparable to that of Porter’s and Lovin’s
1
Page 12 of 36Transactions on Information Systems
123456789101112131415161718192021222324252627282930313233343536373839404142434445464748495051525354555657585960

For Peer Review
stemmers, both in terms of average precision and the total number of relevant documents retrieved. The
proposed stemming algorithm also provides consistent improvements in retrieval performance for French
and Bengali, which is currently resource-poor.
1 Introduction
In the Cross Language Information Retrieval (CLIR) road map, discussed by Gey [5] at SIGIR 2002, our
attention was drawn towards the challenge of retrieval from languages with poor resources. It was mentioned
that the languages of the Indian subcontinent have received very little attention in terms of language specific
resource building, although Indian languages are widely spoken in South Asian countries and the population
in this part of the world is considerably large. Of the Indic languages, Bengali covers the largest share of
Eastern India and is also the state language of Bangladesh. With the proliferation of the Internet in India
and Bangladesh over the last decade, the presence of the Bengali community on the World Wide Web has
become substantial and significant on-line resources, such as newspapers, webzines, etc have been created.
Thus there arises a need for information retrieval from Bengali language documents.
The IR task is generally divided into two major components, indexing and retrieval. While standard
indexing and retrieval approaches that have been developed and studied in the context of English language
IR may be easily adopted for Bengali, certain language specific components need investigation. The indexing
process typically represents the documents as a collection of keywords and their corresponding weights and
usually consists of the following steps: (a) tokenization, (b) stopword removal, (c) stemming, (d) phrase
recognition and (e) term weighting. Of the above, stopword detection and stemming are language dependent
modules.
The words in any natural language text are inflected according to some linguistic rules of that language.
Inflection may occur by adding a suffix/affix to the terms or in some cases the entire term may be changed.
Stemming aims to identify the morphological classes that share common roots. Most of the existing stemmers
use an extensive set of linguistic rules for this purpose. Rule based stemmers for most resource poor languages
are either unavailable or lack comprehensive coverage. In this paper, we look at the problem of stemming
for such resource poor languages (in particular, for Bengali). Purely unsupervised statistical clustering
techniques which do not assume any language specific information are proposed for this purpose.
Bengali is a highly inflectional language where one root may have more than 20 morphological variants.
In most cases, variants are generated by adding suffixes to the root word. There also exists a large set
2
Page 13 of 36 Transactions on Information Systems
123456789101112131415161718192021222324252627282930313233343536373839404142434445464748495051525354555657585960

For Peer Review
of compound words where two roots can join together to form a compound word, and that compound
may also have some morphological variants. For example, the word dhan means wealth and haran means
looting or robbing. These two roots combine to form dhanaharan, which means robbing of wealth. Now
dhanaharan can produce morphological variants like dhanaharankari, dhanaharankarider where kari and
der are standard suffixes.
It may be possible to formulate a set of stemming rules for Bengali that would convert a given word to
its stem. However, in view of the nature of the language, this is likely to be a difficult and time consuming
process. Further, since a similar task may be needed for other Indic languages, our goal is to eliminate
the use of linguistic information, and use a purely corpus based approach instead. We therefore propose a
stemming scheme where no linguistic input is considered. We believe this scheme can be adopted for other
Indian languages like Hindi, Gujarati etc., as well as English and French, all of which are also primarily
suffixing in nature.
We start with a lexicon, extracted from a Bengali news corpus of 50,000 documents. The lexicon contains
more than 300,000 terms. A set of string distance measures is defined, and complete linkage clustering is used
to discover the equivalence classes from the lexicon. Some infrequent cases arise where clusters correspond
to multiple roots and their morphological variants. To choose the most representative canonical form from
these multi-root clusters we use some post processing for each cluster. In order to evaluate the effectiveness of
the proposed stemming algorithm, we tested its performance on English and French using standard datasets
used at TREC and CLEF. The performance of the proposed stemmer was comparable to that of traditional
rule-based stemmers, viz. Porter’s/Lovin’s. Some preliminary experiments with Bengali also yield promising
results.
In the following section, we give a brief background on statistical stemming. Sections 3 and 4 present
the distance measures we used and the lexicon clustering based approach. Experimental results in support
of our approach are given in Section 5. In the last section, we discuss some issues arising out of our work
and outline some directions for further study.
2 Background
Stemming is generally considered as a recall-enhancing device. For languages with relatively simple mor-
phology, the influence of stemming is less than for those with a more complex morphology. Most of the
stemming experiments done so far are for English and other west European languages ([14], [9]) .
3
Page 14 of 36Transactions on Information Systems
123456789101112131415161718192021222324252627282930313233343536373839404142434445464748495051525354555657585960

For Peer Review
In TREC-4, Buckley [3] demonstrated that a simple stemmer could be easily constructed for Spanish
without knowledge of the language by examining lexicographically similar words to discover common suffixes.
Goldsmith ([7], [6]) did suffix discovery, employing auto-morphology, a minimum-description-length-based
algorithm that determines the suffixes present in a language-sample with no prior knowledge of the language.
The frequency of stems and suffixes that would result from every possible breakpoint in each term in a
collection was examined. An optimal breakpoint for each token is then selected by applying the constraint
that every instance of a token must have the same breakpoint, and then choosing breakpoints for each
unique token that minimize the number of bits needed to encode the collection. This “minimum description
length” criterion captures the intuition that breakpoints should be chosen in such a way that each token
is partitioned into a relatively common stem and a relatively common suffix. Both Buckley and Goldsmith
demonstrate the effectiveness of statistical suffix discovery in information retrieval; however, Goldsmith’s
approach appears to be highly computationally intensive, with execution times for an initial implementation
running into days for moderately sized datasets. Very recently, Bacchin et al. [2] validate that the stemmers
generated by a probabilistic model are as effective as the ones based on linguistic knowledge.
Oard [13] did suffix discovery statistically from a text collection and eliminated them from the word
endings to get the stemmed output. In this experiment, the frequency of end n-grams of the strings was
counted (where n = 1,2,3,4) for the first 500,000 words of the text collection. Each instance of every word
was considered to get these frequencies. Then, the frequency of the most common subsuming n-gram suffix
was subtracted from the frequency of the corresponding (n-1)-gram. For example, the frequency of “ing”
was subtracted from the frequency of “ng”, as in most cases “ng” occurred as a part of “ing”. With these
revised frequencies, all n-gram suffixes (n=2,3,4) were sorted in decreasing order. It was observed that the
count verses rank plot was convex for English and so the rank at which the second derivative was maximum
was chosen as the cutoff limit for the number of suffixes for each length.
Xu et. al. [19] analyzed the co-occurrence of word variants in a corpus to build a stemmer. They refined
Porter’s stemmer using knowledge from the text collection and observed interesting improvements. This
shows that corpus based analysis of word variants can be used to enhance the performance of stemming
algorithms. They extended their approach to Spanish and reported improvements in recall. Xu et al. used a
variant of expected mutual information to measure the significance of the association of words. Their basic
consideration was that word variants that should be conflated will occur in the same documents or in the
same text windows (100 words). Their approach split up stem classes created by aggressive stemmers like
Porter. The stem classes are re-clustered based on a co-occurrence measure, which is language independent
4
Page 15 of 36 Transactions on Information Systems
123456789101112131415161718192021222324252627282930313233343536373839404142434445464748495051525354555657585960

For Peer Review
in that it can be applied to any set of stem classes.
In this context, we note that Arabic IR has been receiving increasing attention since TREC 2001. The
availability of a test collection has provided a major boost to research and has enabled the formulation of
large scale experiments and the investigation of the effects of stemming in quantitative terms. Language
resources for Arabic are scarce and applying linguistic knowledge is expensive. Rule based stemmers like
Porter’s [14] are difficult to customize for this language. This is true for Indian languages also. In order to
include these languages in information retrieval services, a generic solution is strongly needed. Statistical
approaches have the potential of providing an acceptable solution in this scenario. Statistical techniques
exploit word (co-) occurrence patterns in a corpus. Alternatively, related words can be grouped based on
various string-similarity measures to infer stemming rules. N-gram based string similarity measures are
often used for grouping related words. In Arabic stemming experiments, Roeck [16] used the dice coefficient
to measure string distance and clustered them to generate equivalence classes of words in Arabic. Initially
affixes were removed using some linguistic knowledge and then terms were clustered. Significant improvement
over Adamson’s [1] algorithm was observed for the data set considered. Rogati [17] used a machine-learning
approach to build an Arabic stemmer. Their scheme is statistical machine translation based, where an English
stemmer and a parallel corpus of 10,000 sentences was used for training. Later, monolingual, un-annotated
text was used for further improvement. This semi-supervised suffix stripper gives notable improvement for
Arabic information retrieval in terms of precision. Larkey [10] extended the approach of Xu and Croft for
Arabic stemming.
Ramanathan and Rao [15] report the only work on Indian language (Hindi) stemming. They use a
hand crafted suffix list. The suffixes are eliminated from word endings based on some rules. No recall /
precision based evaluation of the work has been reported; thus the effectiveness of this stemming procedure
is difficult to estimate. In Hindi CLIR experiments done for TIDES (Translation, Detection, Extraction,
Summarization) 2003, Larkey et. al. identified a list of 27 suffixes and stripped them from word endings
to get the stemming effect. In the surprise language evaluation, they compared both the stemmers and
observed that stemming improves the retrieval performance on unexpanded monolingual queries. For the
cross-lingual run using query expansion for both English and Hindi, the retrieval performance was poorer
than the baseline run.
5
Page 16 of 36Transactions on Information Systems
123456789101112131415161718192021222324252627282930313233343536373839404142434445464748495051525354555657585960

For Peer Review
3 String Distance Measures
Distance functions map a pair of strings s and t to a real number r, where a smaller value of r indicates
greater similarity between s and t. We define a set of string distance measures {D1, D2, D3, D4} for clustering
the lexicon. The main intuition behind defining these distances was to reward long matching prefixes, and
to penalize an early mismatch.
Given two strings X = x0x1 . . . xn and Y = y0y1 . . . yn′ , we first define a Boolean function pi (for penalty)
as follows:
pi =
0 if xi = yi 0 ≤ i ≤ min(n, n′)
1 otherwise
Thus, pi is 1 if there is a mismatch in the i-th position of X and Y . If X and Y are of unequal length, we
pad the shorter string with null characters to make the string lengths equal. Let the length of the strings be
n + 1. We now define D1 as follows:
D1(X, Y ) =
n∑
i=0
1
2ipi (1)
Our initial investigations suggested that a more effective distance measure could be formulated by consid-
ering matches only upto the first mismatch, and penalizing all subsequent character positions. Accordingly,
we define D2, D3, and D4 as follows. In the equations below, m denotes the position of the first mismatch
between X and Y (i.e. x0 = y0, x1 = y1, . . . , xm−1 = ym−1, but xm 6= ym).
D2(X, Y ) =1
m×
n∑
i=m
1
2i−mif m > 0, ∞ otherwise (2)
D3(X, Y ) =n − m + 1
m×
n∑
i=m
1
2i−mif m > 0, ∞ otherwise (3)
D4(X, Y ) =n − m + 1
n + 1×
n∑
i=m
1
2i−m(4)
Note that, unlike D1, the remaining distances do not consider any match after the first mismatch occurs.
The actual distances are obtained by multiplying the total penalty by a factor which is intended to reward
a long matching prefix, or penalize significant mismatches (or both).
Besides these distances, we also considered the well-known Levenstein or edit distance between strings
[11]. This distance counts the minimum number of edit operations (inserting, deleting, or substituting a
6
Page 17 of 36 Transactions on Information Systems
123456789101112131415161718192021222324252627282930313233343536373839404142434445464748495051525354555657585960

For Peer Review
letter) required to transform one string to the other.
0 1 2 3 4 5 6 7 8 9 10 11 12 13
a s t r o n o m i c a l l y
a s t r o n o m e r x x x x
D1 = 1
28 + 1
29 + . . . + 1
213 = 0.0077
D2 = 1
8× ( 1
20 + . . . + 1
213−8 ) = 0.2461
D3 = 6
8× ( 1
20 + . . . + 1
213−8 ) = 1.4766
D4 = 6
14× ( 1
20 + . . . + 1
213−8 ) = 0.8438
Edit distance = 6
0 1 2 3 4 5 6 7 8 9
a s t o n i s h x x
a s t r o n o m e r
D1 = 1
23 + . . . + 1
29 = 0.2480
D2 = 1
3× ( 1
20 + . . . + 1
29−3 ) = 0.6615
D3 = 7
3× ( 1
20 + . . . + 1
29−3 ) = 4.6302
D4 = 7
10× ( 1
20 + . . . + 1
29−3 ) = 1.3891
Edit distance = 5
Figure 1: Calculation of various distance measures
In Figure 1, we consider two pairs of strings 〈astronomer, astronomically〉 and 〈astronomer, astonish〉 as
examples. The values of the various distance measures for these pairs are shown in the figure. According to
D1, D2, D3, and D4, astronomer and astonish are farther apart than astronomer and astronomically. This
agrees with our intuition. However, the edit distance is lower for the second pair. This example suggests
that the new distance measures may be more suitable for our purpose than the traditional edit distance.
4 Lexicon Clustering
The distance functions defined above are used to cluster words into homogeneous groups. Each group is
expected to represent an equivalence class consisting of morphological variants of a single root word. The
words within a cluster are stemmed to the ‘central’ word in that cluster. Since the number of natural
clusters is unknown a priori, partitional clustering algorithms like k-means are not suitable for our task.
Graph-theoretic clustering algorithms appear to be the natural choice in this situation because of their
ability to detect natural clusters in the data.
Three variants of graph theoretic clustering are popular in literature, namely, single-linkage, average-
linkage, and complete-linkage [8]. Each of these algorithms is of hierarchical (agglomerative or divisive)
nature. In their agglomerative form, the cluster tree (often referred to as a dendrogram) consists of individual
data points as leaves which are merged to form groups of points at higher levels. The groupings at each
level represent a clustering of the data. In all the above three algorithms, two most ‘similar’ groups of points
(possibly singletons) are merged at each level. The algorithms differ in the way the similarity between the
groups is defined.
7
Page 18 of 36Transactions on Information Systems
123456789101112131415161718192021222324252627282930313233343536373839404142434445464748495051525354555657585960

For Peer Review
In the single-linkage method, the similarity between two groups is defined as the maximum similarity
between any member of one group and any member of the other group. The groups only need to be similar
in a single pair of members in order to be merged. Single linkage clusters can be long and branched in high-
dimensional space and the merging criterion often causes “chaining”, where a single element is continually
added to the tail of the biggest cluster. Single linkage clustering can be obtained by constructing a minimal
spanning tree of the data points and recursively deleting the heaviest edges to obtain the desired number of
clusters.
In the average linkage method, the similarity between two groups of points is defined by the mean
similarity between points in one cluster and those of the other cluster. In contrast to single linkage, each
element needs to be relatively similar to all the members of the other cluster, rather than just one. Average
linkage clusters tend to be relatively round or ellipsoid. Average linkage can be approximately computed
quite cheaply by considering the similarity between the means of each cluster (if they can be computed).
In the complete-linkage algorithm, the similarity of two clusters is calculated as the minimum similarity
between any member of one cluster and any member of the other cluster. Like single-linkage, the probability
of an element merging with a cluster is determined by a single member of the cluster. But in this case,
the least similar member is considered instead of the most similar. In other words, the merged cluster has
the smallest possible diameter. Consequently complete linkage clusters tend to be very compact. Complete-
linkage clustering can also be described in terms of a clique. Let dn be the diameter of the cluster created
in step n of complete-linkage clustering. Define graph G(n) as the graph that links all data points with a
distance of at most dn. Then the clusters after step n are the cliques of G(n). The nature of the lexicon
suggests that the most compact clusters would be useful. Thus, we choose the compete-linkage algorithm
for our experiments.
Determining the Number of Clusters
As mentioned above, in graph theoretic clustering methods, the clusters are obtained by deleting the heaviest
edges of the cluster tree. In other words, all edges above some threshold may be deleted to obtain the desired
number of clusters. There is an inverse relation between the chosen threshold and the number of clusters
generated. A high threshold results in a small number of clusters, each of which is relatively large. Conversely,
a low threshold results in a larger number of relatively small clusters.
Obviously, the choice of threshold is an important issue. If a high threshold is chosen, we get an aggressive
stemmer, which forms larger-than-actual stem classes, where semantically unrelated forms are conflated
8
Page 19 of 36 Transactions on Information Systems
123456789101112131415161718192021222324252627282930313233343536373839404142434445464748495051525354555657585960

For Peer Review
erroneously. If the chosen threshold is too low, we get a lenient stemmer, which fails to conflate related
forms that should be grouped together. Thus, choosing a threshold which results in clusters that accurately
represent the true stem groups is the basic challenge in case of cluster based stemming.
In our experiments (see the next section), we find a suitable edge-weight threshold empirically. Given
a lexicon, we first compute the number of clusters generated at various threshold values. This gives us a
number-of-clusters vs. threshold curve. Next, we look for step-like regions in this curve. A step is a region
where the curve flattens out, i.e. the number of clusters does not change much as the threshold value is
changed. A threshold θ is then chosen from such a region as a candidate threshold for generating the desired
stem classes.
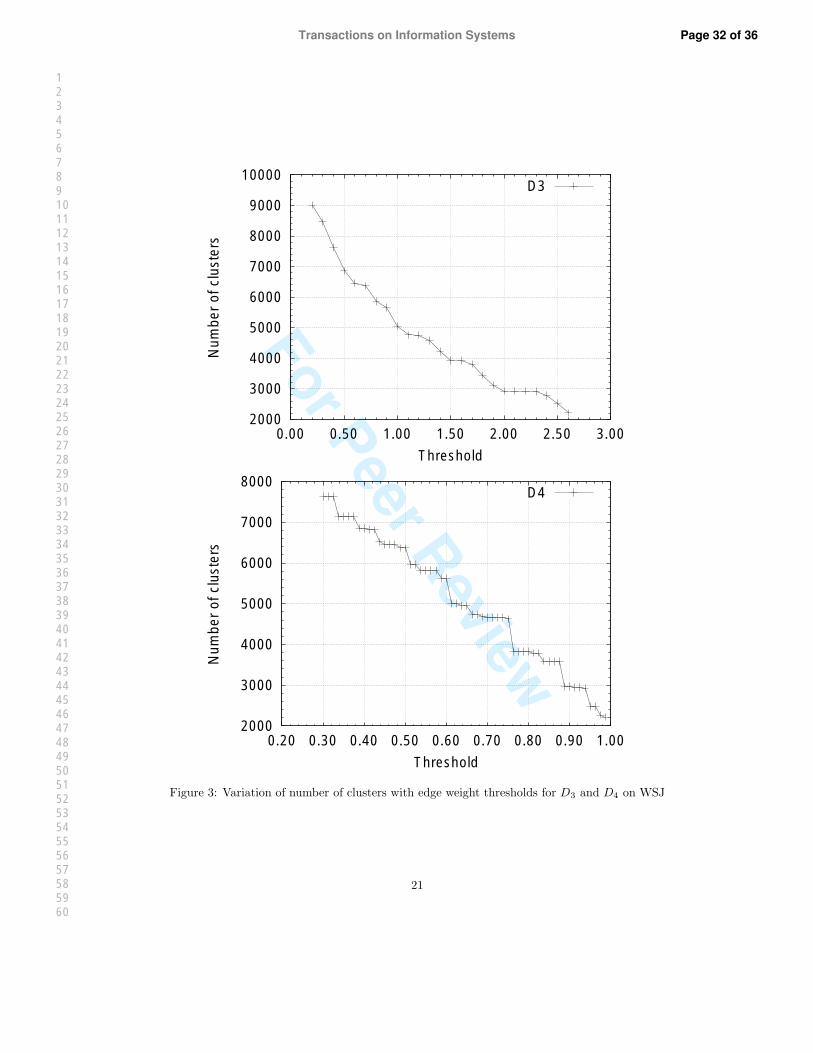
Figures 2 and 3 show the variation in the number of clusters with threshold value using the string
distances D1, D2, D3, D4 defined previously. The lexicon used to generate these graphs was constructed
from the WSJ documents on TIPSTER disks 1 and 2. If the number of clusters changes by less than 10 for
2 successive threshold points on the x-axis, we regard this portion of the curve as a step. It turns out that
these curves have multiple steps and therefore, multiple candidate threshold values may be obtained from
each curve. These candidate values are used in our experiments reported in the next section.
5 Experiments
The primary goals of our experiments were the following:
Expt. 1. to choose the most effective distance measure from D1, D2, D3, D4, and to determine a threshold
value θ that results in good retrieval performance when used with this measure in the clustering
step;
Expt. 2. to verify that the proposed stemming method does indeed yield improvements in retrieval perfor-
mance;
Expt. 3. to compare the performance of the proposed stemmer with traditional algorithms such as Porter’s
for the English language; and
Expt. 4. to study how well the method works for other languages, viz. French and Bengali.
For these experiments, a test collection is needed. While standard test collections are available for English,
no such test collection is available for Bengali. Motivated by the nature of test corpora commonly used
for IR experiments, we have recently constructed a corpus of about 50,000 news articles taken from the
9
Page 20 of 36Transactions on Information Systems
123456789101112131415161718192021222324252627282930313233343536373839404142434445464748495051525354555657585960
For Peer Review
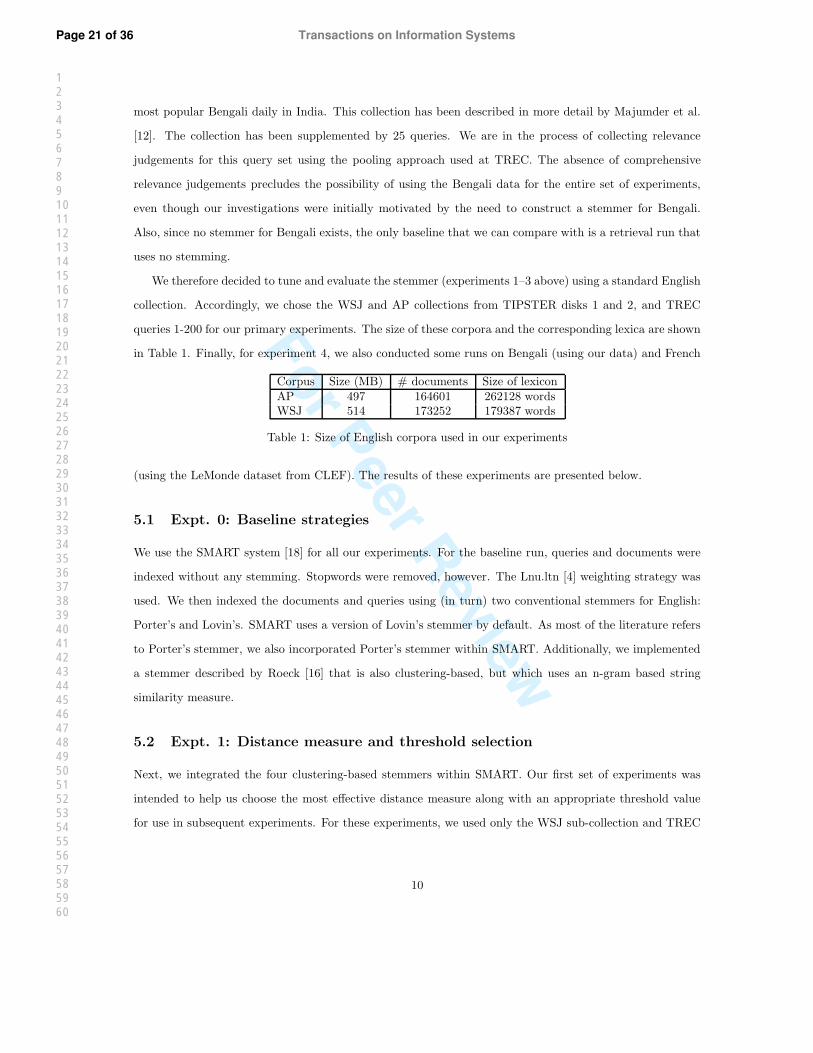
most popular Bengali daily in India. This collection has been described in more detail by Majumder et al.
[12]. The collection has been supplemented by 25 queries. We are in the process of collecting relevance
judgements for this query set using the pooling approach used at TREC. The absence of comprehensive
relevance judgements precludes the possibility of using the Bengali data for the entire set of experiments,
even though our investigations were initially motivated by the need to construct a stemmer for Bengali.
Also, since no stemmer for Bengali exists, the only baseline that we can compare with is a retrieval run that
uses no stemming.
We therefore decided to tune and evaluate the stemmer (experiments 1–3 above) using a standard English
collection. Accordingly, we chose the WSJ and AP collections from TIPSTER disks 1 and 2, and TREC
queries 1-200 for our primary experiments. The size of these corpora and the corresponding lexica are shown
in Table 1. Finally, for experiment 4, we also conducted some runs on Bengali (using our data) and French
Corpus Size (MB) # documents Size of lexiconAP 497 164601 262128 wordsWSJ 514 173252 179387 words
Table 1: Size of English corpora used in our experiments
(using the LeMonde dataset from CLEF). The results of these experiments are presented below.
5.1 Expt. 0: Baseline strategies
We use the SMART system [18] for all our experiments. For the baseline run, queries and documents were
indexed without any stemming. Stopwords were removed, however. The Lnu.ltn [4] weighting strategy was
used. We then indexed the documents and queries using (in turn) two conventional stemmers for English:
Porter’s and Lovin’s. SMART uses a version of Lovin’s stemmer by default. As most of the literature refers
to Porter’s stemmer, we also incorporated Porter’s stemmer within SMART. Additionally, we implemented
a stemmer described by Roeck [16] that is also clustering-based, but which uses an n-gram based string
similarity measure.
5.2 Expt. 1: Distance measure and threshold selection
Next, we integrated the four clustering-based stemmers within SMART. Our first set of experiments was
intended to help us choose the most effective distance measure along with an appropriate threshold value
for use in subsequent experiments. For these experiments, we used only the WSJ sub-collection and TREC
10
Page 21 of 36 Transactions on Information Systems
123456789101112131415161718192021222324252627282930313233343536373839404142434445464748495051525354555657585960

For Peer Review
D1
θ 0.023 0.046 0.069∗ 0.104 0.138∗
AvgP 0.3634 0.3732 0.3677 0.3469 0.3367
D2
θ 0.21 0.31 0.41∗ 0.54∗ 0.61∗
AvgP 0.3675 0.3721 0.3600 0.3403 0.3401
D3
θ 1.15∗ 1.35 1.55∗ 1.75 2.15∗
AvgP 0.3748 0.3787 0.3796 0.3785 0.3727
D4
θ 0.56∗ 0.71∗ 0.86∗ 1.01 1.16AvgP 0.3650 0.3662 0.3775 0.3726 0.3396
Table 2: Retrieval results for various distance measures and thresholds on (WSJ, queries 151-200)
queries 151-200, with the hope that a threshold value learned from this dataset would be stable enough to
be used on other datasets as well (see the end of this section for verification).
For each of the distances D1, D2, D3 and D4, we considered 5 different clustering thresholds for a total
of 20 retrieval runs. Table 2 shows the mean average precision obtained for each of these retrieval runs. The
initial set of threshold values that we tried corresponds to the mid-points of step-like regions in Figures 2
and 3. These have been marked with a ∗ in Table 2. The remaining threshold values were added at roughly
equal intervals before, in between, or after the initially chosen values.
The results for each distance measure were analyzed using the Tukey HSD test. Based on this test, the
results can be roughly separated into two categories for D1, D2 and D4. For example, when using D2, setting
θ to 0.21, 0.31 or 0.41 yields significant improvements compared to using the other two values of θ. However,
the differences between these three runs were not found to be significant. Likewise, for D4, results obtained
using θ = 0.56, 0.71, 0.86, 1.01 were not significantly different, but setting θ = 1.16 caused a signficant
degradation in performance. Interestingly, for D3, no significant differences in retrieval performance were
found for the range of threshold values used.
Table 3 presents a comparison of the various distance measures. A suitable threshold value is chosen for
No stemming D1 − 0.046 D2 − 0.31 D3 − 1.55 D4 − 0.86 Lovins Porter n-gramRel ret 3082 3235 3249 3268 3265 3318 3290 3171
P20 0.4920 0.5020 0.4960 0.5090 0.5130 0.5030 0.5060 0.4960Avg.P 0.3505 0.3732 0.3721 0.3796 0.3775 0.3746 0.3746 0.3595
Table 3: Retrieval results for various stemmers on (WSJ, queries 151-200)
11
Page 22 of 36Transactions on Information Systems
123456789101112131415161718192021222324252627282930313233343536373839404142434445464748495051525354555657585960

For Peer Review
θ → No-Stem 1.35 1.55 2.15Rel Ret 3887 4140 4133 4130
P20 0.4740 0.4940 0.4900 0.4960Avg.P 0.3514 0.3762 0.3776 0.3771
Table 4: Performance of D3-based stemmer at different clustering thresholds on (AP, queries 151-200)
each measure based on the results in Table 2. The results of the baseline (no stemming), Porter, Lovins and
n-gram based runs are also included for comparison. The differences in the effectiveness of the 4 distance
measures were not found to be significant, but since D3 seems to be the least sensitive with respect to
variations in the threshold value, we choose this measure for our subsequent experiments.
Our next goal is to study the stability of the threshold chosen above. We therefore test the D3-based
stemmer using a different collection, viz. the AP articles from TIPSTER disks 1 and 2 (the query set remains
the same). Table 4 summarizes the results obtained using the D3 based stemmer at various clustering
thresholds for the AP dataset. Once again, the performance of the stemmer is not significantly affected by
the choice of threshold; in particular, θ = 1.55 appears to be an acceptable choice for this dataset also. An
examination of the number-of-clusters vs. threshold curve for the AP lexicon (see Figure 4), shows that
there is a “step” between θ = 2.00 and 2.25. From Table 4, it is clear that a threshold value chosen from
this step would also be acceptable for this dataset.
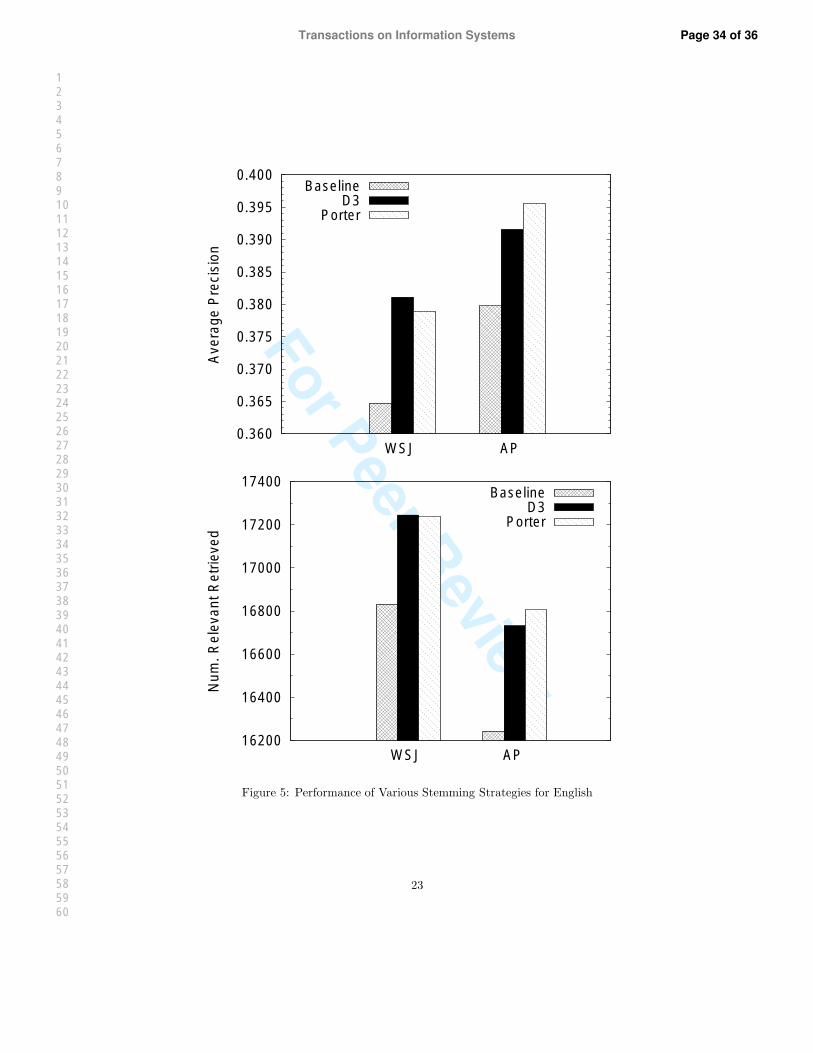
5.3 Expts. 2 and 3: Comparison with baseline strategies
The next set of experiments compares the performance of the D3-based stemmer with the baseline strategies
(no stemming, and Porter’s stemmer). For this comparison, we use TREC queries 1-200 with both the AP
and WSJ collections from TIPSTER disks 1 and 2. The results are summarized in Table 5. Figure 5 shows
the same comparison graphically.
WSJ
No stemming D3 PorterRel ret 16831 17245 (+2.5%) 17236 (+2.4%)
P20 0.5293 0.5368 (+1.4%) 0.5340 (+0.9%)Avg.P 0.3647 0.3811 (+4.5%) 0.3789 (+3.9%)
AP
No stemming D3 PorterRel ret 16241 16732 (+3.0%) 16805 (+3.5%)
P20 0.4732 0.4857 (+2.6%) 0.4895 (+3.4%)Avg.P 0.3799 0.3916 (+3.1%) 0.3956 (+4.1%)
Table 5: Performance of D3-based stemmer for TREC queries 1–200
12
Page 23 of 36 Transactions on Information Systems
123456789101112131415161718192021222324252627282930313233343536373839404142434445464748495051525354555657585960

For Peer Review
In terms of overall performance, our stemmer and Porter’s both yield comparable improvements over the
baseline (no stemming). The difference in mean average precision for the baseline and D3 runs was found
to be statistically significant (paired t-test, 200 observations, P = 0.0026 for AP, P = 1.2 × 10⁻⁶ for WSJ).
In contrast, the difference in performance between the D3-based and Porter’s stemmers was not significant
(paired t-test, P = 0.23 for AP, P = 0.27 for WSJ). We repeated the tests of significance using the number
of relevant documents retrieved for each query (instead of the average precision), and reached the same
conclusions.
5.3.1 Query-wise analysis of results
To better understand the difference between the two stemmers, we do a query-by-query analysis of the
results. Table 6 shows the number of queries for which each method outperforms the other (in terms of
average precision). The numbers in parentheses indicate the number of queries for which the performance
of the two stemmers differs by more than 5%.
WSJ AP
D3 better Porter better D3 better Porter better98 (40) 102 (36) 89 (26) 103 (41)
Table 6: Queries for which performance differs by > 5%
We manually examined some of these queries where the performance variation was large. Query no 128
(Privatization of State Assets) is an example where the D3 stemmer achieves an average precision of 0.3381,
and retrieves 211 relevant documents. The corresponding figures for Porter’s stemmer are 0.2296 and 175.
The total number of relevant documents for this query is 296. The key to the performance difference lies in
that fact that Porter’s stemmer conflates both the query terms “privatization” and “private” to “privat”.
Because of such aggressive stemming, a specific term like “privatization” (which happens to be important for
this particular query) is conflated to a more general term, and gets a low idf (inverse document frequency)
value. In contrast, D3 assigns these words to different clusters. As a result, the query is indexed using
the more specific term “privatization”. Of course, it is possible to construct examples where conflating
“privatization” and “private” would be beneficial. In such cases, Porter’s stemmer would perform better
than D3.
Query 26 (Tracking Influential Players in Multimedia) is one such example. This query contains the word
“develop”. At θ = 1.55, D3 places “develop” and “development” in two separate clusters, whereas Porter
correctly places them in the same equivalence class. As expected, relevant documents containing the word
13
Page 24 of 36Transactions on Information Systems
123456789101112131415161718192021222324252627282930313233343536373839404142434445464748495051525354555657585960

For Peer Review
“development” are ranked more highly by Porter’s stemmer than D3. Likewise, for query 75 (Automation),
Porter’s stemmer converts “automation”, “automate”, and “automated” to “autom”, while D3 places these
words in two separate clusters.
One general problem with Porter’s stemmer (as far as retrieval is concerned) is that it does not seem to
strip the possessive marker ’s from the end of words1. Likewise, words like “largest” and “strongest” are not
converted to “large”, “strong”.
Overall, the table above shows that in a large set of sample queries, the honours are about equally divided
between the two methods. This is also in keeping with the results of the t-tests reported above.
5.4 Expt. 4: Performance on French and Bengali data
5.4.1 French Run
For these experiments, we used the LeMonde94 text collection, along with 50 French topics (41 to 90)
designed for this corpus. This data is available as a part of the CLEF dataset. We conduct three retrieval
runs: the first does not use stemming, the second uses the French version of Porter’s stemmer available from
http://snowball.tartarus.org/, and the third uses the D3 based stemmer.
As in the case of English, the issue of threshold selection has to be addressed. In accordance with the
strategy suggested in Section 4, we first plot the number-of-clusters vs. threshold curve (Figure 6) to identify
a suitable threshold for clustering the lexicon. Three prominent steps are observed around θ = 1.15, 1.55, 2.10.
The results for all the runs are shown in Table 7.
No stemming D3(1.15) D3(1.55) D3(2.10) PorterRel ret 516 540 538 538 540
P20 0.2222 0.2611 0.2578 0.2522 0.2467Avg.P 0.3987 0.4301 0.4334 0.4153 0.4284
Table 7: Performance of D3-based stemmer on the French LeMonde corpus
We first observe that a threshold of 1.55 works well for this collection as well. As in the case of English,
the D3 based method yields significant improvements in performance over the baseline (paired t-test, 45
observations2, P = 0.03). Also, its performance is comparable to that obtained using the Porter’s stemmer
(paired t-test, 45 observations, P = 0.73).
1The version of Porter’s stemmer that is available from http://snowball.tartarus.org/ does not do this.2Since there were no relevant documents for 5 queries, the evaluation was based on 45 (rather than 50) queries.
14
Page 25 of 36 Transactions on Information Systems
123456789101112131415161718192021222324252627282930313233343536373839404142434445464748495051525354555657585960

For Peer Review
5.4.2 Bengali Run
Unlike English and French there is no available relevance judged corpus for Bengali. In general there are
few available language resources for the Indian languages. We constructed a corpus containing news articles
from the most popular printed Bengali daily in India, Anandabazar Patrika (ABP). The Bengali alphabet
set is larger than English and it has about 49 characters. The size of the Bengali lexicon extracted from the
ABP corpus was 301562 words. The Bengali lexicon is then clustered using complete-linkage agglomerative
clustering. Once again, for clustering the Bengali lexicon, we choose D3 as our distance measure.
A stopword list for Bengali was constructed by taking the 500 most frequent terms from the lexicon and
then manually identifying a list of 354 words from the whole set. The stopwords thus selected were mostly
articles and indeclinables, prepositions and conjunctions. Interestingly, nouns like Budhbar (Wednesday)
and Kolkata (Calcutta) were among the top 500 terms, although we did not include them in the stopword
list. For all the runs the stopwords were removed first. We constructed 25 topics in Bengali with Title and
Narration fields and retrieved 20 documents using the title only. The average title length in terms of words is
4.4. Since comprehensive relevance judgements were unavailable, we manually judged the top 20 documents
per query and measured the precision for this set (P20).
We start by adopting the same threshold value (1.55) that works well for English and French. For further
clues, we examine the number-of-clusters vs. threshold curve for Bengali (see Figure 7). The curve has
several step-like regions, with a fairly long step around 0.55. We also perform a retrieval run with this
threshold. We could have chosen points from the remaining steps also, but this was skipped since precision
has to be manually measured for every point. The results for these runs are shown in the table below.
Unstemmed-run [email protected] [email protected] ret 178 216 (+38) 248 (+70)
P20 0.3560 0.4320 (+21.3%) 0.4960 (+39.3%)
Table 8: No of Relevant documents and P20 in Bengali runs
The unstemmed and stemmed runs at 1.55 and 0.55 retrieve 178, 216 and 248 relevant documents
respectively. The stemmed runs thus retrieve 39 and 70 more relevant documents (an average of 1.3 and
2.33 more relevant documents per query). The relative improvement observed using stemming for Bengali is
21.3% and 39.3% respectively. These improvements were found to be statistically significant (paired t-test,
25 observations, P -value (1-tail) = 0.010 and 0.004 respectively). Thus, for a highly inflected language like
Bengali, stemming substantially improves the retrieval effectiveness.
15
Page 26 of 36Transactions on Information Systems
123456789101112131415161718192021222324252627282930313233343536373839404142434445464748495051525354555657585960

For Peer Review
The table also suggests that, while θ = 1.55 works well for both English and French, better results may
be achievable for Bengali with a lower threshold. This is not entirely surprising since Bengali and English
orthography are different by nature. However, a detailed investigation of this issue — threshold selection for
Bengali and related languages (e.g. Assamese, Oriya) — will have to wait until comprehensive datasets are
available in these languages.
6 Conclusions and Future Work
With the worldwide proliferation of the Internet, increasing amounts of information are becoming available
online in languages that have not received much attention from the IR/NLP community and for which
language resources are scarce. For this available information to be useful, it has to be indexed and made
searchable by an IR system. Stemming is one of the basic steps in the indexing process. In this paper,
we have proposed a stemming algorithm that is corpus-based, and does not rely on linguistic expertise.
Retrieval experiments on English, French and Bengali datasets show that the proposed approach is effective
for languages that are primarily suffixing in nature. More specifically, we conclude that (i) stemming
improves recall for Indian languages like Bengali; and (ii) the performance of a stemmer generated by
clustering a lexicon without any linguistic input is comparable to that obtained using standard, rule-based
stemmers such as Porter’s. Our experiments have, however, raised some issues that need further investigation
in future work.
Using a corpus sample for stemmer generation. The clustering step is computationally the most
expensive step in our approach. One way to cut down on the amount of time needed for this step would
be to use a smaller lexicon, constructed from a sub-sample of a given corpus. As the sample size decreases,
the possibility of covering most morphological variants will also decrease. Naturally, this would result in a
stemmer with poorer coverage. The nature of the corpus from which the lexicon is generated also determines
the coverage of the final stemmer. A corpus that includes documents besides news articles may enrich
the lexicon. In future work, we intend to study the effect of corpus size and nature on building language
independent stemmers.
Handling excessive conflation. For the Bengali lexicon, we have observed a few instances where two
semantically different terms fall in the same cluster due to their string similarity. For example, Akram
(the name of a cricketer from Pakistan) and akraman (to attack) fall in the same cluster, as they share a
16
Page 27 of 36 Transactions on Information Systems
123456789101112131415161718192021222324252627282930313233343536373839404142434445464748495051525354555657585960

For Peer Review
significant prefix. This problem cannot be addressed by tuning the clustering threshold, since a threshold
that separates these strings would also separate pairs such as akramankarider (the attackers’) and akraman,
which rightfully belong to a single cluster.
To handle such cases in Bengali, the following strategy may help. Clusters containing two or more roots
and their morphological variants are generally bigger than average. We could build a TRIE from the strings
in these clusters, and check the fan-outs at each node. If the fan out exceeds a certain limit at a particular
node, we may hypothesize that the word formed by the alphabet sequence from the root to that node forms
a separate root word. Figure 8 shows how this approach would work for the particular example cited above.
Further experimentation, using a much larger set of real-life queries, is needed to estimate the seriousness of
this problem, and the effectiveness of the trie-based approach outlined above.
Acknowledgement
We would like to acknowledge Sumit Saha for preparing 25 Bengali topics for the ABP corpus.
References
[1] G. Adamson and J. Boreham. The use of an association measure based on character structure to identify
semantically related pairs of words and document titles. Information Storage and Retrieval, 10:253–260,
1974.
[2] Michela Bacchin, Nicola Ferro, and Massimo Melucci. A probabilistic model for stemmer generation.
Inf. Process. Manage., 41(1):121–137, 2005.
[3] Chris Buckley, Amit Singhal, and Mandar Mitra. New retrieval approaches using SMART: TREC 4. In
The Fourth Text Retrieval Conference, 1995.
[4] Chris Buckley, Amit Singhal, and Mandar Mitra. Using query zoning and correlation within SMART:
TREC 5. In The Fifth Text Retrieval Conference, 1996.
[5] F. Gey, N. Kando, and C. Peters. Cross language information retrieval: A research roadmap. SIGIR
Forum, 37(1):76–84, 2002.
[6] John Goldsmith. Unsupervised learning of the morphology of a natural language. Comput. Linguist.,
27(2):153–198, 2001.
17
Page 28 of 36Transactions on Information Systems
123456789101112131415161718192021222324252627282930313233343536373839404142434445464748495051525354555657585960

For Peer Review
[7] John A. Goldsmith, Derrick Higgins, and Svetlana Soglasnova. Automatic language-specific stemming
in information retrieval. In CLEF, pages 273–284, 2000.
[8] A. K. Jain, M. N. Murty, and P. J. Flynn. Data clustering: A review. ACM Comput. Surv., 31(3):264–
323, 1999.
[9] Robert Krovetz. Viewing morphology as an inference process. Artificial Intelligence, 118:277–294, 2000.
[10] Leah S. Larkey, Lisa Ballesteros, and Margaret E. Connell. Improving stemming for Arabic information
retrieval: light stemming and co-occurrence analysis. In SIGIR ’02: Proceedings of the 25th annual
international ACM SIGIR conference on Research and development in information retrieval, pages
275–282, New York, NY, USA, 2002. ACM Press.
[11] V. I. Levenstein. Binary codes capable of correcting deletions, insertions and reversals. In Cybernetics
and Control Theory, 1966.
[12] P. Majumder, M. Mitra, and B.B. Chaudhuri. Construction and Statistical Analysis Of An
Indic Language Corpus For Applied Language Research. Computing Science Technical Report
TR/ISI/CVPR/01/2004, CVPR Unit, Indian Statistical Institute, Kolkata, 2004.
[13] Douglas W. Oard, Gina-Anne Levow, and Clara I. Cabezas. CLEF Experiments at Maryland: Statistical
Stemming and Backoff Translation. In CLEF ’00: Revised Papers from the Workshop of Cross-Language
Evaluation Forum on Cross-Language Information Retrieval and Evaluation, pages 176–187, London,
UK, 2001. Springer-Verlag.
[14] M. F. Porter. An algorithm for suffix stripping. Program, 14(3):130–137, 1980.
[15] A. Ramanathan and D. Rao. A Lightweight Stemmer for Hindi. In Proc. EACL Workshop, 2003.
[16] A. Roeck and W. Al-Fares. A morphologically sensitive clustering algorithm for identifying Arabic roots.
In Proceedings of the 38th Annual Meeting of the Association for Computational Linguistics, 2000.
[17] Monica Rogati, Scott McCarley, and Yiming Yang. Unsupervised learning of Arabic stemming using a
parallel corpus. In Erhard Hinrichs and Dan Roth, editors, Proceedings of the 41st Annual Meeting of
the Association for Computational Linguistics, pages 391–398, 2003.
[18] Gerard Salton, editor. The SMART Retrieval System—Experiments in Automatic Document Retrieval.
Prentice Hall Inc., Englewood Cliffs, NJ, 1971.
18
Page 29 of 36 Transactions on Information Systems
123456789101112131415161718192021222324252627282930313233343536373839404142434445464748495051525354555657585960

For Peer Review
[19] Jinxi Xu and W. Bruce Croft. Corpus-based stemming using cooccurrence of word variants. ACM
Trans. Inf. Syst., 16(1):61–81, 1998.
19
Page 30 of 36Transactions on Information Systems
123456789101112131415161718192021222324252627282930313233343536373839404142434445464748495051525354555657585960

For Peer Review
0
1000
2000
3000
4000
5000
6000
7000
8000
9000
0.00 0.05 0.10 0.15 0.20 0.25 0.30 0.35 0.40 0.45
Num
ber
of c
lust
ers
Threshold
D1
0
1000
2000
3000
4000
5000
6000
7000
8000
9000
10000
11000
0.00 0.10 0.20 0.30 0.40 0.50 0.60 0.70 0.80 0.90
Num
ber
of c
lust
ers
Threshold
D2
Figure 2: Variation of number of clusters with edge weight thresholds for D1 and D2 on WSJ
20
Page 31 of 36 Transactions on Information Systems
123456789101112131415161718192021222324252627282930313233343536373839404142434445464748495051525354555657585960
For Peer Review
2000
3000
4000
5000
6000
7000
8000
9000
10000
0.00 0.50 1.00 1.50 2.00 2.50 3.00
Num
ber
of c
lust
ers
Threshold
D3
2000
3000
4000
5000
6000
7000
8000
0.20 0.30 0.40 0.50 0.60 0.70 0.80 0.90 1.00
Num
ber
of c
lust
ers
Threshold
D4
Figure 3: Variation of number of clusters with edge weight thresholds for D3 and D4 on WSJ
21
Page 32 of 36Transactions on Information Systems
123456789101112131415161718192021222324252627282930313233343536373839404142434445464748495051525354555657585960

For Peer Review
0
2000
4000
6000
8000
10000
12000
14000
0.00 0.50 1.00 1.50 2.00 2.50 3.00 3.50 4.00
Num
ber
of c
lust
ers
Threshold
Figure 4: Number-of-clusters vs. threshold curve for AP
22
Page 33 of 36 Transactions on Information Systems
123456789101112131415161718192021222324252627282930313233343536373839404142434445464748495051525354555657585960
For Peer Review
0.360
0.365
0.370
0.375
0.380
0.385
0.390
0.395
0.400
WSJ AP
Ave
rage
Pre
cisi
on
BaselineD3
Porter
16200
16400
16600
16800
17000
17200
17400
WSJ AP
Num
. Rel
evan
t Ret
rieve
d
BaselineD3
Porter
Figure 5: Performance of Various Stemming Strategies for English
23
Page 34 of 36Transactions on Information Systems
123456789101112131415161718192021222324252627282930313233343536373839404142434445464748495051525354555657585960

For Peer Review 1000
2000
3000
4000
5000
6000
7000
8000
9000
10000
11000
12000
0.00 0.50 1.00 1.50 2.00 2.50 3.00 3.50 4.00
Num
ber
of c
lust
ers
Threshold
Figure 6: Number-of-clusters vs. threshold curve for the LeMonde Corpus
4500
5000
5500
6000
6500
7000
7500
0.20 0.30 0.40 0.50 0.60 0.70 0.80 0.90 1.00 1.10
Num
ber
of c
lust
ers
Threshold
Figure 7: Number-of-clusters vs. threshold curve for the ABP corpus
24
Page 35 of 36 Transactions on Information Systems
123456789101112131415161718192021222324252627282930313233343536373839404142434445464748495051525354555657585960

For Peer ReviewFigure 8: Trie Structure Implemented on a Cluster
25
Page 36 of 36Transactions on Information Systems
123456789101112131415161718192021222324252627282930313233343536373839404142434445464748495051525354555657585960