yara improvement program · 2018-03-15 · yara productivity system (yps): a significant part of...
TRANSCRIPT

Yara Improvement
Program
Investor and analyst visit to Sluiskil
12 December 2017

2
Agenda
Agenda Timing
Welcome & introductions 08:00 AM – 08:15 AM
Introduction to Model Factory 08:15 AM – 08:30 AM
Model Factory: Round One 08:30 AM – 09:15 AM
YPS Overall (inc. debrief of model factory) 09:15 AM – 09:55 AM
BREAK 09:55 AM – 10:10 AM
Model Factory: Round Two 10:45 AM – 11:35 AM
10:40 AM – 10:45 AM
Training: Performance Management 10:10 AM – 10:30 AM
YPS round up and Q&A 11:35 AM – 12:15 PM
10:30 AM – 10:40 AM Union perspective on YPS
Yara Sluiskil & YPS status 12:15 PM – 12:45 PM
Presenter
LUNCH 12:45 PM – 13:15 PM
Thor Giæver / Svein Tore Holsether
Hannah Paulson
Kristin Kaggerud
O.J. Siljan
Geir O. Sundbø / Tom de Smit
Preparation for Model Factory: Round Two
Kristin Kaggerud / O.J. Siljan
Jon Sletten
Bus to Sluiskil 13:15 PM – 13:30 PM
Site visit: Yara Sluiskil 13:30 PM – 15:30 PM
Wrap up and Q&A 15:30 PM – 16:00 PM
Jon Sletten
All presenters including Kvidal

Personal protective
equipment (PPE) expectations
Evacuation meeting point
Emergency exit
Safety station location
Safety

Productivity video

Context
• JLW Industries is a mid-size producer of beverages within the JLW group
• Its main products are different variations of lemonade and cola which require different additional
ingredients, e.g. vanilla essence
• These goods are produced in one batch production line with both manual and automated processes
• The site has been operating at a loss for some time, mainly due to high costs and low production
volumes (even though there is demand for the products)
• If we do not become profitable again, our parent company may reduce our volumes or even
shut us down!
Your role
• You are working as production operators on the batch production line
• Also, we will have an experienced control room operator and a production supervisor
• It is your job to produce product based on the production demand created by the supply
chain department
• There are genuine safety risks associated with the production processes and therefore our
highest priority is on safety
How this is going to happen
• We will simulate a shift of 45 minutes
• The production team will receive its production plan at the beginning of the shift and are required to
fulfill it by the end of the shift
• All raw materials will be delivered to production at the start of the shift
v02
Overview of JLW Industries
• We need eight volunteers to run the
factories.
• In each factory, there will be three
operators and one supervisor.
• Please put on the coats and PPE
provided if you are operating in the
factory.
• Those who are not operating the
factory will need to act as
observers.
Participants for JLW Industries

Mining video

Review of the first shift
From your observation and/or
experience in the last shift
What went well? 1
What challenges did you observe? 2
Which improvement ideas do
you have?
3
How would you go about
implementing them?
4

Yara Productivity System (YPS): A significant part of
overall Yara Improvement Program target
9
~30%
500
~450
2018
~150
2020
~15%
~25%
Production volume
Consumption factor
Fixed cost
Variable unit cost
~30%
2019 2017
~300
USD million, vs. 2015 baseline and 2015 prices
Sustained
EBITDA
improve-
ment
= YPS expected to deliver 100% of target = YPS expected to deliver parts of target
Note: In addition, YPS expected deliver sustained CAPEX benefits (target under development)

10
Yara Productivity System: Six interdependent and
interlinked improvement workstreams
Strategic
response
Sustainable
portfolio
PoF 2
BCF 3
Learning
org. 4
YPS Rollout
PRO2 5
1
6
Description
Enable new world class plants and take relevant action for non-profitable ones
Develop a portfolio of short and long term technology projects with the aim of
zero emissions and low capex and opex
Ensure we build Better, Cheaper and Faster than anyone else
Improve our leadership and competence development at all levels
Professionalize Production by reducing complexity and improving governance
Address safety, customer responsiveness, reliability, cost, productivity and
quality on our sites as well as the ability to assess and integrate acquired assets -Focus today-

11
Selected highlights from the YPS roll-out
YPS roll-out will have reached 50% of the sites by
year end
• YPS will be rolled out at 27 sites by completion
• YPS roll-out completed at seven sites, eight sites are
currently being transformed
• First mining site being transformed
• Diagnostic completed at all sites
Diagnostics has identified a base potential that far
exceeds the initial expectations
• Higher potential mainly driven by opportunities in
higher production volumes
The program is starting to deliver results
• CRC improvements observed for all rolled-out sites
• New production records in UKI and BPU
• Reduced contractor spend
• Introduction of a new/upgraded six step maintenance
tool has given improved wrench time and reliability

12
Yara Productivity System:
Results being delivered in practice
Note: Initial rollout of YPS completed at seven plants, with a further eight plants currently in middle of rollout.
UKI record much larger if adjusted for more complex NPK grades in 2017 than previous years
In addition, several monthly production
records in November’18
Five out of seven plants since initial rollout completed, with 12MR
production RECORDS either in September or October ’17
UKI
TOTAL VOLUMES 12 month rolling - adjusted for
Planned Shutdowns and UKI Expansion (Mkt)
1,684 +2%
1,597 1,650
+37% 1,690
1,237 1,397
2,069
Oct ’17
+11% 2,044
Dec ’16
1,864
Dec ’15
1,828 1,839 2,021 +10%
BPU
TET
BRB
+2% 2,925 2,891 2,865 RSK BRB
GLO
SVI
Monthly record in Urea
production (65 172 t)
Monthly record in NPK
production (57 500 t)
Monthly record in Phosphoric
acid production (28 900 t)

13
YPS: One of the largest operational transformations in
Norwegian industrial history
By the time rollout complete … To date …
3,700 man-days of rollout support
1040 hours of bootcamps and
leadership training
800 man-days of
diagnostics to identify
potential
15,180 bottles
capped …and
uncapped
350 change
leaders trained and active
1,000 managers directly involved
7,000 employees with new way of
working
27 plants and mines in 14 countries transformed
14
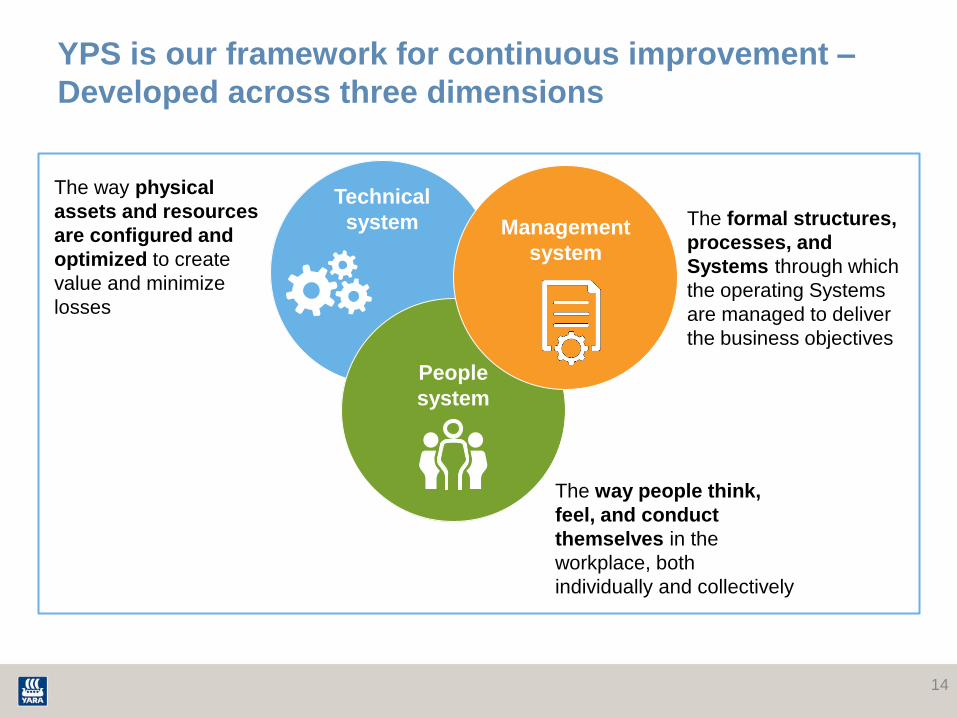
YPS is our framework for continuous improvement –
Developed across three dimensions
Technical
system
People
system
Management
system
The way physical
assets and resources
are configured and
optimized to create
value and minimize
losses
The formal structures,
processes, and
Systems through which
the operating Systems
are managed to deliver
the business objectives
The way people think,
feel, and conduct
themselves in the
workplace, both
individually and collectively
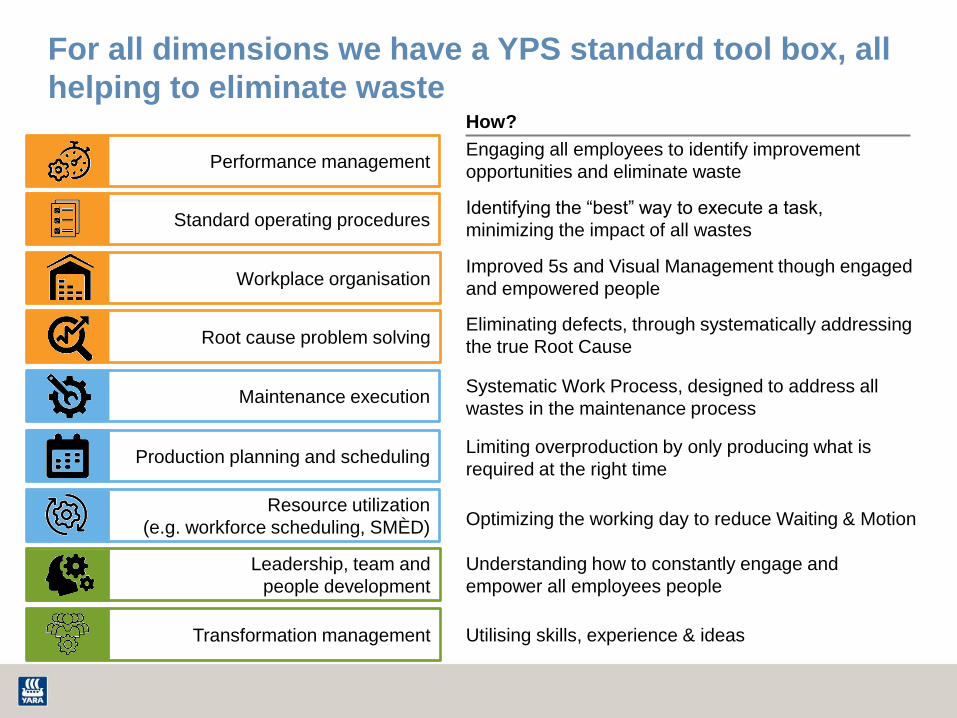
For all dimensions we have a YPS standard tool box, all
helping to eliminate waste
Transformation management
Leadership, team and
people development
Resource utilization
(e.g. workforce scheduling, SMÈD)
Production planning and scheduling
Root cause problem solving
Workplace organisation
Standard operating procedures
Performance management
Maintenance execution
Identifying the “best” way to execute a task,
minimizing the impact of all wastes
Improved 5s and Visual Management though engaged
and empowered people
Optimizing the working day to reduce Waiting & Motion
Engaging all employees to identify improvement
opportunities and eliminate waste
Eliminating defects, through systematically addressing
the true Root Cause
Systematic Work Process, designed to address all
wastes in the maintenance process
Understanding how to constantly engage and
empower all employees people
How?
Limiting overproduction by only producing what is
required at the right time
Utilising skills, experience & ideas
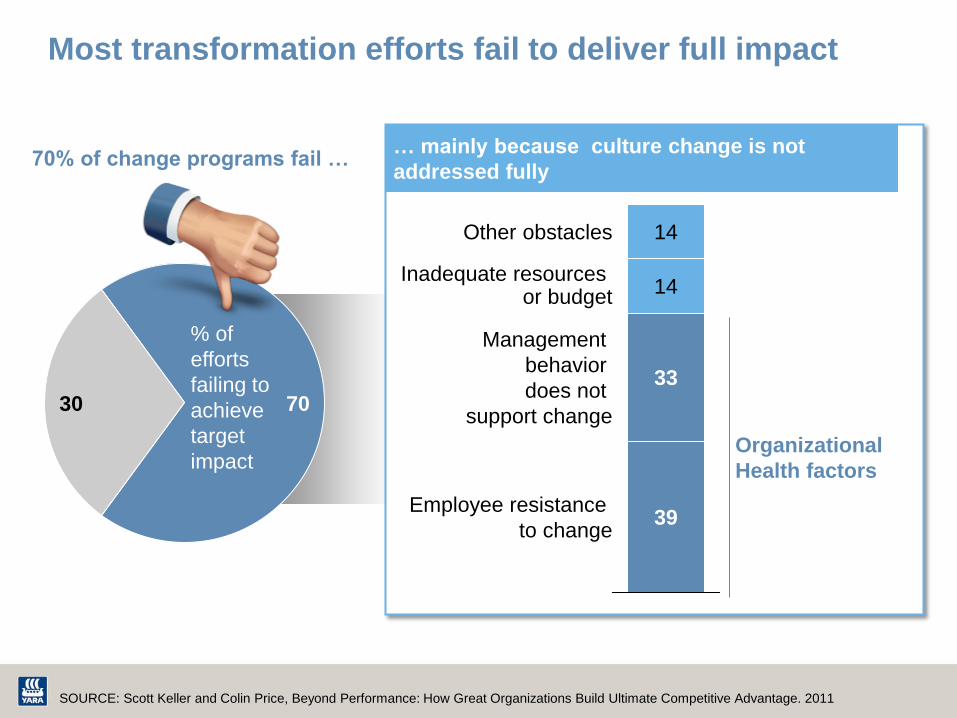
… mainly because culture change is not
addressed fully
Organizational
Health factors
Most transformation efforts fail to deliver full impact
70 30
14
14
33
Other obstacles
Employee resistance
to change 39
Management
behavior
does not
support change
Inadequate resources or budget
% of
efforts
failing to
achieve
target
impact
70% of change programs fail …
SOURCE: Scott Keller and Colin Price, Beyond Performance: How Great Organizations Build Ultimate Competitive Advantage. 2011
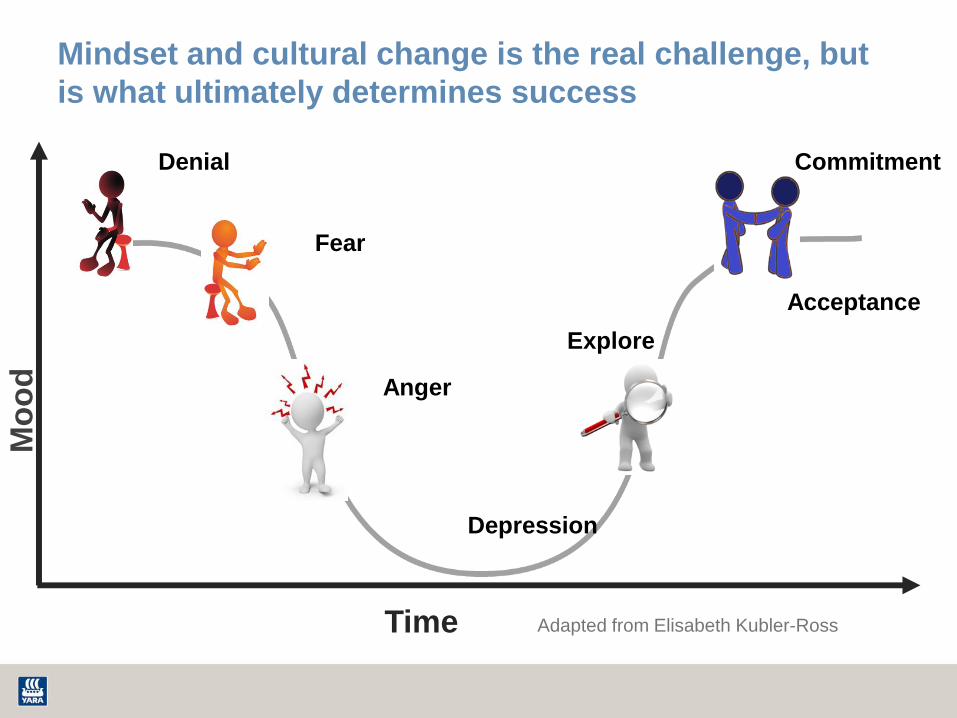
Mindset and cultural change is the real challenge, but
is what ultimately determines success
Denial
Fear
Anger
Depression
Explore
Acceptance
Commitment
Mo
od
Time Adapted from Elisabeth Kubler-Ross

18
YPS roll-out Updated December 2017
Oct
‘17
Apr
‘18 Jun
‘18
Mar
‘17 Jul
‘17
May
‘17
Jan
‘17
Sep
‘16
Dec
‘16
Mar
‘17
Sm
all
/me
diu
m s
ite
s f
oru
m &
fie
ld
tran
sfo
rma
tio
ns
Big
sit
es
tran
sfo
rma
tio
ns
Rio Grande
Trinidad & Tringen I + II
Pilbara
Porsgrunn
Note: Hull and Marsa el Brega,
not yet reflected in roadmap.
Rostock
Tertre
Brünsbuttel
Siilinjärvi
Kokkola
SVI
Mining
Min
ing
sit
es
tran
sfo
rma
tio
ns
Sluiskil
Salitre
(Galvani)
Glomfjord
Köping
Belle Plaine
Uusikaupunki
Ambes
LeHavre
Montoir
Ferrara
Ravenna
QAFCO
Cartagena
Angico
(Galvani)
Ponta Grossa
Luis E
(Galvani)
Galvani - Paulina
Jan
‘18
Dec
‘17
Aug
‘18
Oct
‘18 Dec
‘18

19
Belle Plaine Performance Review Video

Performance management cycle
“How we
operate” Standards
“What we
need to do” Schedule
“Brainstorm ideas
to improve”
“Take action on
ideas to improve
production”
“Discuss how
well we did”
“Produce the
product”
Do
Check
Plan
Act

21
An effective performance management system is driven
by 3 interlinked elements
Effective
performance
management
Measure
performance
(KPI)
1
Visualize
performance
Review
performance
3
2

Frontline performance reporting is visibly displayed and
easy to maintain
Accessible
Clear
Target driven
Simple
Recordable
Pilbara
Kokkola

Performance is reviewed with the mindset of continuous
improvement
Review Are any KPIs off target? 1
Implement
Who will do it? 4
When will
they complete it by? 5
Improve
What is causing this? 2
How can we fix this? 3
Brunsbuttel
Pilbara

24
Silinjarvi: Taking a step back prior to standard
operating procedure definition cuts time to cool down
of hot electrostatic precipitator by up to 65%
Performance board at Silinjarvi Sulphuric Acid plant

25
BCF-in-a-box video

Review of the second shift
From your observation and/or
experience in the last shift
What went well? 1
What challenges did you observe? 2
Which improvement ideas do
you have?
3

For all dimensions we have a YPS standard tool
box – All helping to eliminate waste
Transformation management
Leadership, team and
people development
Resource utilization
(e.g. workforce scheduling, SMÈD)
Production planning and scheduling
Root cause problem solving
Workplace organisation
Standard operating procedures
Performance management
Maintenance execution
Identifying the “best” way to execute a task,
minimizing the impact of all wastes
Management system
Technical system
People system
Improved 5s and Visual Management though engaged
and empowered people
Optimizing the working day to reduce Waiting & Motion
Engaging all employees to identify improvement
opportunities and eliminate waste
Eliminating defects, through systematically addressing
the true Root Cause
Systematic Work Process, designed to address all
wastes in the maintenance process
Understanding how to constantly engage and
empower all employees people
How?
Limiting overproduction by only producing what is
required at the right time
Utilising skills, experience & ideas

Yara Sluiskil
General presentation

History
A company with a rich history,
rooted in the region

1929 Start production Ammoniumsulphate
1940 During World War II huge destructions by bombings. Restart 1950
1966 Switch from cokes gas to natural gas
1979 Development and practice of fluidized bed granulator technology
1979 Aquisition by Norsk Hydro
’80 –’90 Big investments
2011 Start of Urea 7 plant
2017 Commissioning of Urea 8 granulation plant and loading building
30
Yara Sluiskil 1929 - 2016

Key-indicators
Knowledge grows…
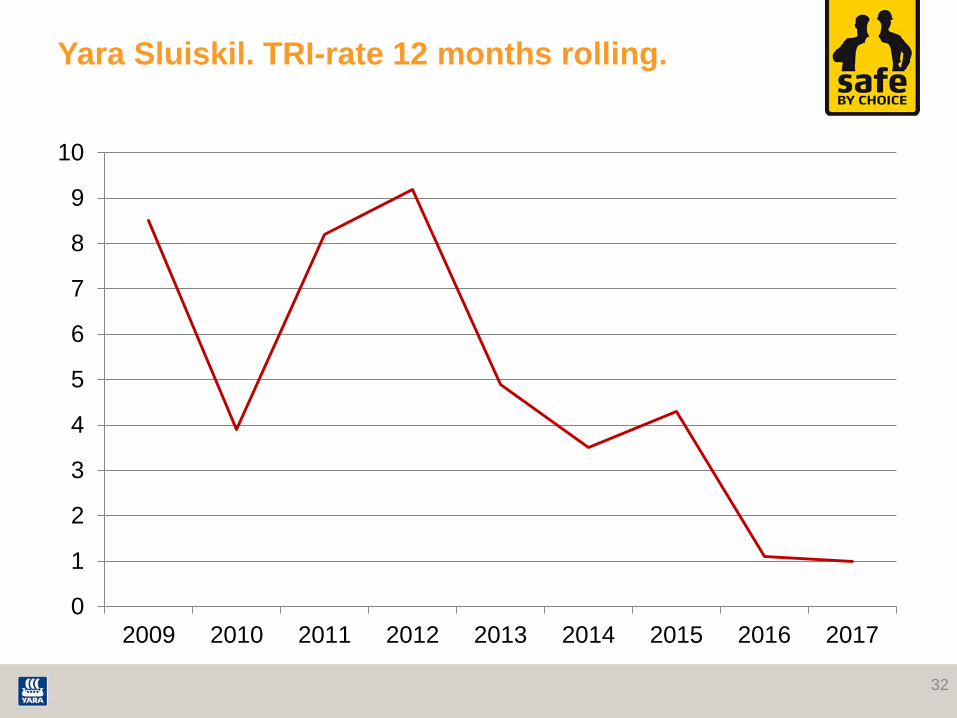
Yara Sluiskil. TRI-rate 12 months rolling.
0
1
2
3
4
5
6
7
8
9
10
2009 2010 2011 2012 2013 2014 2015 2016 2017
32

Key-indicators
million euro
Turnover in 2016
677
15% TOTAL PRODUCTION VOLUME OF YARA
5,027 575 in Yara
Ammonia
Nitrates
Industrial products
kiloton product
loaded in 2016
World record in
reliability
FTE
2.0 BCM
natural gas/yr
80% as feedstock

Products and processes

35
Our production system at Yara Sluiskil

Modal split (2016)
36
Seagoing vessels
2.990.579 ton (59%)
Barges 1.145.626 ton (23%)
Rail 91.837 ton (2%)
Truck 799.186 ton (16%)
947 barges
627 seagoing vessels
1.232 rail wagons
31.087 trucks

Innovation and sustainability

38
WarmCO2
-55.000.000 Nm3 natural gas/yr
-135.000 ton CO2/yr
1.000 New jobs created
Smart Delta Resources (SDR)
Cooperation DOW, ICL, national
authorities and Yara
40.000 ton CO2 reduction
Strong industrial clustering
Algae Biocleaning
Pilot installation for cleaning of
waste water. Cooperation with local
authorities
39
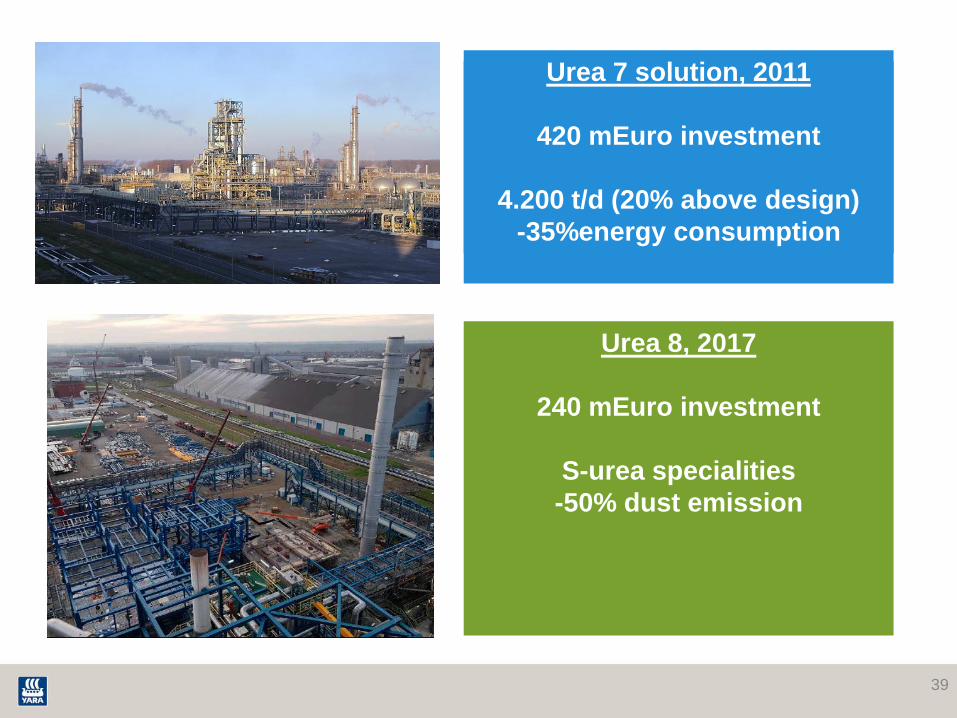
Urea 7 solution, 2011
420 mEuro investment
4.200 t/d (20% above design)
-35%energy consumption
Urea 8, 2017
240 mEuro investment
S-urea specialities
-50% dust emission
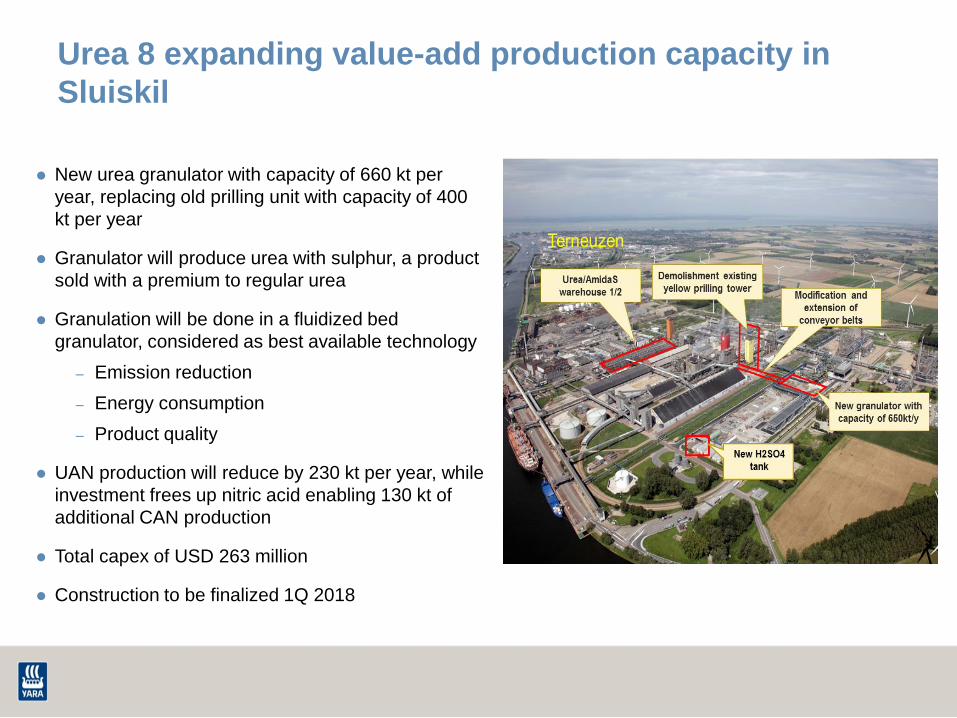
New urea granulator with capacity of 660 kt per
year, replacing old prilling unit with capacity of 400
kt per year
Granulator will produce urea with sulphur, a product
sold with a premium to regular urea
Granulation will be done in a fluidized bed
granulator, considered as best available technology
– Emission reduction
– Energy consumption
– Product quality
UAN production will reduce by 230 kt per year, while
investment frees up nitric acid enabling 130 kt of
additional CAN production
Total capex of USD 263 million
Construction to be finalized 1Q 2018
Urea 8 expanding value-add production capacity in
Sluiskil

YPS implementation and status
Plant visit
Safety introduction for visitors

Do’s and don'ts
43
(where indicated) (only allowed in
specific smoking
room/area)
Obligated on whole plant area
(wear also long sleeves)
Extra PPE needed when pass by
production zones indicated by ‘blue lines’
Extra during works

Alarm
• Be calm and stay with
your yara guide
• Tuesday 10:00 o’clock
weekly test
44
Many thanks for your attention
More information: www.yara.com or www.yara.nl