yakima river pesticides and pcbs total maximum daily load · yakima river pesticides and pcbs total...
TRANSCRIPT

Yakima River Pesticides and PCBs Total Maximum Daily Load
Volume 1. Water Quality Study Findings April 2010
Publication No. 10-03-018

Publication and Contact Information This report is available on the Department of Ecology’s website at www.ecy.wa.gov/biblio/1003018.html
For more information contact:
Publications Coordinator Environmental Assessment Program P.O. Box 47600 Olympia, WA 98504-7600 Phone: 360-407-6764
Washington State Department of Ecology - www.ecy.wa.gov/
o Headquarters, Olympia 360-407-6000 o Northwest Regional Office, Bellevue 425-649-7000 o Southwest Regional Office, Olympia 360-407-6300 o Central Regional Office, Yakima 509-575-2490 o Eastern Regional Office, Spokane 509-329-3400
Project Codes Data for this project are available at Ecology’s Environmental Information Management (EIM) website www.ecy.wa.gov/eim/index.htm. Search User Study ID AJOH0055.
Ecology’s Activity Tracker Code for this study is 07-078-02. TMDL Study Code (Water Quality Program) is YakR99TX. Cover photo: Upper Yakima River near Thorp (Jane Creech)
Any use of product or firm names in this publication is for descriptive purposes only and does not imply endorsement by the author or the Department of Ecology.
To ask about the availability of this document in a format for the visually impaired,
call 360-407-6764. Persons with hearing loss can call 711 for Washington Relay Service.
Persons with a speech disability can call 877-833-6341.

Yakima River Pesticides and PCBs
Total Maximum Daily Load
Volume 1. Water Quality Study Findings
by Art Johnson,
Kristin Carmack Brandee Era-Miller
Brandi Lubliner Steve Golding Randy Coots
Environmental Assessment Program Washington State Department of Ecology
Olympia, Washington 98504-7710
Waterbody Numbers
Upper Yakima River (39-1010, 39-1030, 39-1060, 39-1070) and tributaries Lower Yakima River (37-1010, 37-1020, 37-1040) and tributaries
Naches River (38-1010, 38-1030, 38-1040) and tributaries

This page is purposely left blank

Yakima Pesticides/PCBs TMDL: Vol 1, WQ Study Findings Page i
Table of Contents
Page
List of Figures ......................................................................................................................v
List of Tables ..................................................................................................................... ix
Abstract ............................................................................................................................ xiii
Acknowledgements .......................................................................................................... xiv
Executive Summary ...........................................................................................................xv Total Maximum Daily Loads .......................................................................................xv Watershed Description .................................................................................................xv Yakima River 303(d) Listings .................................................................................. xvii Existing TMDLs ...................................................................................................... xviii 2006 Fish Tissue Survey ............................................................................................ xix 2007-08 Water Quality Study ......................................................................................xx Water Quality Study Findings ................................................................................... xxi Pollutants for Which a TMDL or Other Pollution Control Plan is Needed ............. xxiii Numeric TMDL Targets and Loading Capacity ...................................................... xxiv Recommendations .................................................................................................... xxiv
What is a Total Maximum Daily Load (TMDL)? ...............................................................1 Federal Clean Water Act Requirements ........................................................................1 TMDL Process Overview ..............................................................................................1 Elements Required in a TMDL ......................................................................................2
Why is Ecology Conducting a TMDL Study in This Watershed? ......................................3 Overview ........................................................................................................................3 Study Area .....................................................................................................................4 Yakima Basin Waterbodies on Ecology’s 303(d) List of Impaired Waters ..................5 Pollutants Addressed by This TMDL ............................................................................7
Water Quality Standards ......................................................................................................9 Designated Uses .............................................................................................................9 Toxics .............................................................................................................................9
Aquatic Life .........................................................................................................10 Human Health ......................................................................................................10
Turbidity ......................................................................................................................11
Watershed Description .......................................................................................................13 Yakima River Basin .....................................................................................................13 Yakama Nation ............................................................................................................15 Streamflow and the Irrigation System .........................................................................15 Previous Water Quality Studies ...................................................................................19
Existing Yakima River TMDLs .........................................................................................21 Lower Yakima River Suspended Sediment and DDT TMDL .....................................21 Upper Yakima River Suspended Sediment and Organochlorine Pesticide TMDL .....22
2006 Yakima River Fish Tissue Survey ............................................................................23

Yakima Pesticides/PCBs TMDL: Vol 1, WQ Study Findings Page ii
Goals and Objectives of the 2007-08 Water Quality Study ..............................................27 Goals ............................................................................................................................27 Objectives ....................................................................................................................27
Study Design ......................................................................................................................29 Surface Water ...............................................................................................................31
Pesticides, Suspended Sediment, and Turbidity ..................................................31 PCBs and Toxaphene ..........................................................................................36
Permitted Discharges ...................................................................................................41 Municipal Wastewater Treatment Plants .............................................................41 Fruit Packers and Vegetable Processors ..............................................................44 Urban Stormwater Runoff ...................................................................................45
Number of Samples......................................................................................................49 Other Sources of Contamination ..................................................................................49
Field Procedures .................................................................................................................51 Surface Water ...............................................................................................................51
Routine Monitoring and Screening Survey .........................................................51 Semipermeable Membrane Devices ....................................................................52
Wastewater Treatment Plants ......................................................................................52 Fruit Packers and Vegetable Processors ......................................................................53 Stormwater ...................................................................................................................53
Laboratory Methods ...........................................................................................................54
Data Quality Assessment ...................................................................................................55 Data Review and Verification ......................................................................................55 Field Blanks .................................................................................................................56 Replicate Samples ........................................................................................................56
Results of the 2007-08 Water Quality Study .....................................................................59 Water Supply ...............................................................................................................59 Surface Water Quality ..................................................................................................61
Pesticides .............................................................................................................61 PCBs and Toxaphene ........................................................................................102 Suspended Sediment ..........................................................................................108 Turbidity ............................................................................................................116
Permitted Discharges .................................................................................................128 Municipal Wastewater Treatment Plants ...........................................................128 Fruit Packers and Vegetable Processors ............................................................135 Urban Stormwater Runoff .................................................................................139
Point and Nonpoint Sources Compared .....................................................................148
Status of 303(d) Listed Chemicals and Toxaphene in the Yakima River ........................154
Pollutants for which a TMDL or Other Control Plan is Needed ....................................157
PCBs, Dioxin, Chlorpyrifos, and Chlordane ...................................................................159 PCBs ..........................................................................................................................159 Dioxin ........................................................................................................................159 Chlorpyrifos ...............................................................................................................160 Chlordane ...................................................................................................................161

Yakima Pesticides/PCBs TMDL: Vol 1, WQ Study Findings Page iii
Pollutants Not Exceeding Standards ................................................................................162
Numeric TMDL Targets ..................................................................................................163 Pesticide and PCB Targets .........................................................................................163 Suspended Sediment and Turbidity Targets ..............................................................163
Loading Capacity .............................................................................................................173
Pollutant Reductions Needed ...........................................................................................177 Turbidity ....................................................................................................................177 Pesticides and PCBs ...................................................................................................177
Conclusions ......................................................................................................................179
Recommendations ............................................................................................................181 303(d) Listings/TMDL...............................................................................................181 Source Tracing ...........................................................................................................181 Monitoring .................................................................................................................181
References ........................................................................................................................183
Appendices .......................................................................................................................191 Appendix A. Yakima Basin 303(d) Listings Based on Edible Fish Tissue Samples (2008 list) ...................................................................................................................193 Appendix B. Yakima Basin 303(d) Listings Based on Water Samples (2008 list) ..195 Appendix C. Use Designations for WRIA 37- Lower Yakima River, WRIA 38-Naches River, and WRIA 39-Upper Yakima River .................................197 Appendix D. 2006 Fish Tissue Data .........................................................................205 Appendix E. Pesticides Analyzed in Surface Water and in Effluents from Fruit Packers and Vegetable Processors during the 2007-08 Yakima River Water Quality Study .............................................................................................................215 Appendix F. Deployment Dates and PRC Recovery for SPMDs .............................217 Appendix G. Ancillary Water Quality Data for SPMD Deployments ......................219 Appendix H. SPMD Calculations .............................................................................223 Appendix I. Pesticides Analyzed in Wastewater Treatment Plant Effluents and Urban Stormwater Runoff during the 2007-08 Yakima River Water Quality Study 224 Appendix J. Routine Monitoring Data for Surface Water, 2007-08 .........................225 Appendix K. Screening Survey Data for Surface Water, 2007-08 ...........................261 Appendix L. Washington State Department of Health Fish Consumption Advisory .....................................................................................................................285 Appendix M. SPMD Data, 2007-08 .........................................................................287 Appendix N. Wastewater Treatment Plant Effluent Data, 2007-08 .........................289 Appendix O. Fruit Packer and Vegetable Processor Effluent Data, 2007-08 ...........301 Appendix P. Stormwater Data, 2007-08 ...................................................................307 Appendix Q. Values of Potential Use for Calculating Stormwater Loads to the Yakima River from Sunnyside and Richland (using the Simple Method) ................321 Appendix R. Glossary, Acronyms, and Abbreviations .............................................323

Yakima Pesticides/PCBs TMDL: Vol 1, WQ Study Findings Page iv
This page is purposely left blank

Yakima Pesticides/PCBs TMDL: Vol 1, WQ Study Findings Page v
List of Figures
Page
Figure 1. Water Resource Inventory Areas for Yakima River Pesticides and PCBs TMDL. .................................................................................................................................4
Figure 2. Yakima River Basin. .........................................................................................14
Figure 3. Monthly Average Flow in the Yakima River, Sulphur Creek Wasteway, and Granger Drain. .............................................................................................................16
Figure 4. Relative Position of Selected Tributaries, Diversions, Irrigation Returns, and Other Features on the Yakima River. ..........................................................................17
Figure 5. Mean DDE Concentrations in Yakima River Fish Fillets Collected in 2006 ....25
Figure 6. Mean Total PCB Concentrations in Yakima River Fish Fillets Collected in 2006. ..............................................................................................................................25
Figure 7. Routine Monitoring Stations in the Lower Yakima River for 2007-08. ...........32
Figure 8. Lower Yakima River Tributaries and Irrigation Returns Screened for Pesticides during 2007-08. .................................................................................................34
Figure 9. SPMD Membrane Mounted on a Spider Carrier. ..............................................36
Figure 10. Sites Where SPMDs Were Deployed in the Upper Yakima River during 2007. .......................................................................................................................38
Figure 11. Sites Where SPMDs Were Deployed in the Lower Yakima River during 2007. .......................................................................................................................39
Figure 12. Monthly Average Flow near Selected SPMD Sites during 2007. ...................40
Figure 13. Wastewater Treatment Plants in the Lower Yakima River Basin. ..................43
Figure 14. Fruit Packers and Vegetable Processors Monitored in the Lower Yakima River Basin during 2007-08. ..............................................................................................45
Figure 15. Location of Yakima and Union Gap Storm Drains Sampled during 2007-08. .............................................................................................................................47
Figure 16. Location of Ellensburg Storm Drains Sampled during 2007-08. ....................48
Figure 17. Historical Flow in the Yakima River vs. Flow during the 2007-08 Water Quality Study. ....................................................................................................................59
Figure 18. Annual Mean Flow in the Yakima River at Kiona, 1994-2007. .....................60
Figure 19. Detection Frequency of Selected 303(d) Listed Pesticides in the Mainstem Lower Yakima River and Naches River during 2007-08 ..................................................63
Figure 20. Percent of Un-degraded DDT in Water Samples From Four Major Irrigation Returns to the Lower Yakima River during 2007-08: Moxee Drain, Granger Drain, Sulfur Creek Wasteway, and Spring Creek. .............................................65

Yakima Pesticides/PCBs TMDL: Vol 1, WQ Study Findings Page vi
Figure 21. Detection Frequency of Selected 303(d) Listed Pesticides in Four Major Irrigation Returns to the Lower Yakima River during 2007-08 ........................................66
Figure 22. Percent of Samples Exceeding Human Health Criteria for DDE, DDT, and Dieldrin in Four Major Irrigation Returns to the Lower Yakima River during 2007-08. .69
Figure 23. Average Total DDT Concentrations in the Lower Yakima River during the 2007 Irrigation Season. ................................................................................................72
Figure 24. Average Dieldrin Concentrations in the Lower Yakima River during the 2007 Irrigation Season. ......................................................................................................73
Figure 25. Seasonal Patterns in DDE and Total DDT at Two Sites in the Lower Mainstem Yakima River ....................................................................................................74
Figure 26. Seasonal Patterns in Dieldrin Concentrations at Two Sites in the Lower Mainstem Yakima River ....................................................................................................75
Figure 27. Seasonal Patterns in Endosulfan and Chlorpyrifos Concentrations at Two Sites in the Lower Mainstem Yakima River. .....................................................................76
Figure 28. Endosulfan Concentrations in the Lower Yakima River on April 4-5, 2007....................................................................................................................................77
Figure 29. Chlorpyrifos Concentrations in the Lower Yakima River on April 4-5, 2007....................................................................................................................................78
Figure 30. DDT Compounds and Dieldrin in Moxee Drain during 2007-08. ..................79
Figure 31. DDT Compounds and Dieldrin in Granger Drain during 2007-08. ................80
Figure 32. DDT Compounds and Dieldrin in Sulphur Creek Wasteway during 2007-08. .............................................................................................................................81
Figure 33. DDT Compounds and Dieldrin in Spring Creek during 2007-08. ..................82
Figure 34. Endosulfan and Chlorpyrifos in Four Major Irrigation Returns to the Yakima River during 2007-08. ..........................................................................................83
Figure 35. Chlorpyrifos Concentrations in Sulphur Creek Wasteway and Spring Creek Compared to Results from the SWMP...............................................................................85
Figure 36. Average Loads of Selected 303(d) Pesticides during the 2007 Irrigation Season (grams per day). ....................................................................................................87
Figure 37. Average Combined Pesticide Loading from Moxee Drain, Granger Drain, Sulphur Creek Wasteway, and Spring Creek as a Percentage of the Average Load in the Yakima River @ Kiona during 2007-08. ....................................................................89
Figure 38. Concentration:Criteria Ratios for DDT compounds and Dieldrin in 23 Tributaries and Irrigation Returns to the Lower Yakima River ....................................91
Figure 39. Percent of Samples Exceeding Human Health or Chronic Aquatic Life Criteria ...............................................................................................................................93
Figure 40. Chlorpyrifos Concentrations Measured in Marion Drain Compared to Results from the SWMP. ...................................................................................................94

Yakima Pesticides/PCBs TMDL: Vol 1, WQ Study Findings Page vii
Figure 41. Results from Monitoring Dieldrin and Endosulfan in Wide Hollow Creek in 2005-06 ..........................................................................................................................95
Figure 42. Pesticide Levels in the Lower Yakima River Drainage, 1988-2008 ...............97
Figure 43. DDE and Dieldrin in Fillets from Lower Yakima River Fish: 1995, 1998, and 2006 ...........................................................................................................................101
Figure 44. Estimated PCB and Toxaphene Concentrations in the Mainstem Yakima River, Tributaries, and Irrigation Returns during and after the 2007 Irrigation Season ..104
Figure 45. Estimates of PCB and Toxaphene Loads in the Yakima River during May-June, 2007................................................................................................................107
Figure 46. Total Suspended Solids Concentrations in the Mainstem Lower Yakima River during 2007-08, Showing the Flow at Kiona. ........................................................109
Figure 47. Average Total Suspended Solids Concentrations in the Lower Yakima River during the 2007 Irrigation Season ..........................................................................110
Figure 48. Average Total Suspended Solids Concentrations in the Lower Yakima River on June 6-7, 2007 ...................................................................................................111
Figure 49. Total Suspended Solids and Flow in Major Lower Yakima River Irrigation Returns during 2007-08. ..................................................................................112
Figure 50. Estimates of Suspended Sediment Loads in the Lower Yakima River during the 2007 Irrigation Season. ...................................................................................114
Figure 51. Turbidity in the Lower Yakima River during 2007-08 Compared to the State Turbidity Criteria and 2002 TMDL Target. ............................................................118
Figure 52. Compliance with the 90th Percentile 25 NTU Turbidity Target in Four Major Irrigation Returns to the Lower Yakima River during the 2007 Irrigation Season ..............................................................................................................................119
Figure 53. Turbidity and Flow in Four Major Lower Yakima River Irrigation Returns during 2007-08. ..................................................................................................120
Figure 54. Comparison of Turbidity Data Collected by Ecology and the Roza-Sunnyside Board of Joint Control during 2007-08 ................................................122
Figure 55. Turbidity in Screening Survey Samples from 23 Other Tributaries and Irrigation Returns to the Lower Yakima River during 2007-08. .....................................124
Figure 56. 90th Percentile Turbidity in Four Major Returns to the Lower Yakima River during the 1995, 2003, and 2007 Irrigation Seasons. .............................................125
Figure 57. Trend Analysis of Ecology’s Ambient Monitoring Data on Turbidity in the Yakima River at Kiona ..............................................................................................127
Figure 58. PCB Concentrations in Final Effluents from WWTPs in the Yakima Basin during 2007-08 Compared to Human Health Criterion .........................................130
Figure 59. Total PCB Concentrations in Final Effluents from Yakima Basin WWTPs during 2007-08. ................................................................................................................131

Yakima Pesticides/PCBs TMDL: Vol 1, WQ Study Findings Page viii
Figure 60. PCB Concentrations in Yakima Basin WWTP Effluents by Month of Sample Collection, 2007-08.............................................................................................131
Figure 61. WWTP Effluent Flow during Monitoring Periods in 2007-08 vs. Design Flow. ................................................................................................................................134
Figure 62. Percent of Fruit Packer and Vegetable Processor Effluent Samples Exceeding Human Health Criteria (DDT compounds and dieldrin) or Chronic Aquatic Life Criteria (total DDT) ....................................................................................137
Figure 63. Correlation between Total DDT and Total Suspended Solids in Fruit Packer and Vegetable Processor Effluents. .....................................................................138
Figure 64. Precipitation in Yakima during the 2007-08 Water Quality Study, Showing When Stormwater Samples Were Collected (Yakima airport). ........................139
Figure 65. Percent of Yakima/Union Gap Stormwater Samples Exceeding Human Health Criteria for 303(d) Listed Pesticides and PCBs during 2007-08. .........................142
Figure 66. Median Concentrations of Selected Pollutants in the Lower Yakima River Drainage during 2007-08 .......................................................................................149
Figure 67. Loading Comparison for Selected Pollutants Analyzed in 2007-08. ............150
Figure 68. Total DDT:TSS Correlation in the Lower Yakima River Drainage: 1988-1995 vs. 2007 Irrigation Seasons. ...........................................................................165
Figure 69. Total DDT:TSS Correlation in the Lower Yakima River Drainage, April 2007-March 2008. ..................................................................................................166
Figure 70. Relationship between Turbidity and Total Suspended Solids in the Lower Yakima River Drainage during 2007-08 ..............................................................166
Figure 71. Total DDT:TSS Correlation in Moxee Drain and Spring Creek during April 2007-March 2008. ..................................................................................................167
Figure 72. Total DDT:TSS Correlation in Sulphur Creek Wasteway during April 2007-March 2008. ..................................................................................................168
Figure 73. Total DDT:TSS Correlation in Granger Drain during April 2007- March 2008. .....................................................................................................................169
Figure 74. Relationship Between DDE and Total DDT in the Yakima River, Tributaries, and Irrigation Returns during 2007-08 .........................................................169
Figure 75. Total DDT vs. Turbidity in Selected Tributaries and Irrigation Returns from the 2007-08 Screening Survey, Highlighting Low Turbidity Samples that Exceeded the 1 ng/L Total DDT Criterion. .....................................................................170

Yakima Pesticides/PCBs TMDL: Vol 1, WQ Study Findings Page ix
List of Tables
Page
Table 1. Summary of 303(d) Listings for Chemical Contaminants in the Yakima River Basin (2008 list). ........................................................................................................6
Table 2. Pollutants Being Addressed in This TMDL. ........................................................7
Table 3. Washington State Water Quality Criteria for 303(d) Listed Pesticides, PCBs, and Toxaphene in the Yakima River Basin ..............................................................9
Table 4. Freshwater Edible Fish Tissue Criteria for 303(d) Listed Pesticides, Toxaphene, PCBs, and Dioxin in Yakima River Fish. ......................................................11
Table 5. Summary of Lower Yakima River TMDL Schedule. .........................................21
Table 6. Summary of Upper Yakima River TMDL Schedule. .........................................22
Table 7. Mean Concentrations of Selected 303(d) Listed Compounds and Toxaphene in Composite Fillet Samples from Yakima River Fish Collected in 2006. .......................24
Table 8. Summary of Sampling Design for the 2007-08 Water Quality Study. ...............30
Table 9. Routine Monitoring Stations in the Lower Yakima River Drainage during 2007-08. .............................................................................................................................31
Table 10. Lower Yakima River Tributaries and Irrigation Returns Screened for Pesticides during 2007-08. .................................................................................................33
Table 11. Sites Where SPMDs Were Deployed in the Yakima River Drainage during 2007. .......................................................................................................................37
Table 12. Wastewater Treatment Plants in the Yakima Basin. .........................................42
Table 13. Fruit Packers and Vegetable Processors Monitored during 2007-08. ..............44
Table 14. Number of Samples Collected for the 2007-08 Water Quality Study. .............49
Table 15. Field Procedures for Water Samples. ...............................................................51
Table 16. Laboratory Methods.for Water Samples ...........................................................54
Table 17. Mean Relative Percent Difference Between Replicate Field Samples Analyzed during the 2007-08 Water Quality Study. .........................................................57
Table 18. Summary of Results from Monitoring 303(d) Listed Pesticides at Four Locations in the Mainstem Lower Yakima River and in the Naches River during 2007-08: Yakima River at Harrison Bridge, Naches River at mouth, Yakima River at Parker Bridge, Yakima River at Euclid Bridge, Yakima River at Kiona Bridge. ...........62
Table 19. Summary of Results from Monitoring 303(d) Listed Pesticides in Four Major Irrigation Returns to the Lower Yakima River during 2007-08: Moxee Drain, Granger Drain, Sulphur Creek Wasteway, Spring Creek. .................................................64

Yakima Pesticides/PCBs TMDL: Vol 1, WQ Study Findings Page x
Table 20. Percent of Samples Exceeding Human Health Criteria for 303(d) Listed Pesticides in the Mainstem Lower Yakima River and Naches River during 2007-08. .....67
Table 21. Percent of Samples Exceeding Human Health Criteria for 303(d) Listed Pesticides in Four Major Irrigation Returns to the Lower Yakima River during 2007-08. ...........................................................................................................................68
Table 22. Percent of Samples Exceeding Chronic Aquatic Life Criteria for 303(d) Listed Pesticides in the Mainstem Lower Yakima River and Naches River during 2007-08. .............................................................................................................................70
Table 23. Percent of Samples Exceeding Chronic Aquatic Life Criteria for 303(d) Listed Pesticides in Four Major Irrigation Returns to the Lower Yakima River during 2007-08. ............................................................................................................................71
Table 24. Summary of Chlorpyrifos Data Reported for Sulphur Creek Wasteway and Spring Creek by SWMP. .............................................................................................86
Table 25. Average Loads of Selected 303(d) Pesticides during the 2007 Irrigation Season. ...............................................................................................................................86
Table 26. Summary of Results from Screening for 303(d) Listed Pesticides in 23 Tributaries and Irrigation Returns to the Lower Yakima River during 2007-08. .........90
Table 27. Lower Yakima River Irrigation Returns that Substantially Exceeded Human Health or Chronic Aquatic Life Criteria in Screening Samples Collected during 2007-08. ..................................................................................................................92
Table 28. Instances Where a High Proportion of Un-degraded DDT was Found in 2007-08 Screening Survey Samples. .............................................................................92
Table 29. Pesticide Loads from 23 Screening Survey Tributaries and Irrigation Returns Compared to Loads from the Four Major Returns: Moxee Drain, Granger Drain, Sulfur Creek Wasteway, and Spring Creek. ...........................................................96
Table 30. Estimated PCB and Toxaphene Concentrations in the Yakima River, Tributaries, and Irrigation Returns during Spring and Fall 2007. ....................................103
Table 31. Estimates of PCB and Toxaphene Loads during May-June 2007. .................106
Table 32. Summary of Results from Monitoring Total Suspended Sediment (TSS) in the Lower Yakima River during the 2007 Irrigation Season. ......................................108
Table 33. Estimates of Suspended Sediment Loads in the Mainstem Yakima River, Naches River, and Major Irrigation Returns during the 2007 Irrigation Season. ............113
Table 34. Volatile Solids as Percent of Total Suspended Solids in the Yakima River, Naches River, and Four Major Irrigation Returns, 2007-08. ...........................................115
Table 35. Summary of Results from Monitoring Turbidity in the Lower Yakima River during the 2007 Irrigation Season. .........................................................................116
Table 36. Background Turbidity (90th percentile) in the Lower Yakima River: Previous TMDL, Effectiveness Monitoring, and Present Study. .....................................117

Yakima Pesticides/PCBs TMDL: Vol 1, WQ Study Findings Page xi
Table 37. Percent of Samples Exceeding the Existing TMDL Turbidity Target in the Mainstem Lower Yakima River during 2007-08. ......................................................119
Table 38. Comparison of Turbidity Data Collected by Ecology and the Roza- Sunnyside Board of Joint Control during the 2007 Irrigation Season. ...........................123
Table 39. Compliance with Turbidity Criteria and TMDL Targets in the Lower Yakima River Drainage during 2007-08. .........................................................................124
Table 40. Summary of Results from Monitoring 303(d) Listed Pesticides, PCBs, TSS, and Turbidity in Final Effluents from Wastewater Treatment Plants in the Yakima Basin during 2007-08. ........................................................................................129
Table 41. Summary of Low-Level PCB, DDT, and Dieldrin Data for Eastern Washington WWTP Effluents. ........................................................................................132
Table 42. Summary of Total PCB Loads Measured in Final Effluents from Yakima Basin WWTPs during 2007-08. .......................................................................................133
Table 43. Summary of Results from Monitoring 303(d) Listed Pesticides and Toxaphene in Effluents from Six Fruit and Vegetable Processors in the Lower Yakima Basin during 2007-08. ........................................................................................135
Table 44. Percent of Fruit Packer and Vegetable Processor Effluent Samples Exceeding Water Quality Criteria for 303(d) Listed Pesticides during 2007-08. ............136
Table 45. Summary of Pesticide Loads Measured in Combined Final Effluents from Fruit Packers and Vegetable Processors that Discharge to Surface Water in the Lower Yakima River Drainage during 2007-08. ............................................................137
Table 46. Summary of Results from Monitoring TSS and Turbidity in Effluents from Six Fruit Packers and Vegetable Processors in the Lower Yakima Basin during 2007-08. ................................................................................................................138
Table 47. Rainfall Prior To and During Stormwater Sampling in Yakima/Union Gap During 2007-08. ...............................................................................................................140
Table 48. Summary of Results from Analyzing 303(d) Listed Pesticides and Toxaphene in Yakima/Union Gap Stormwater during 2007-08. .....................................140
Table 49. Summary of Results from Analyzing PCBs in Yakima/Union Gap and Ellensburg Stormwater during 2007-08. (ng/L, parts per trillion) .................................141
Table 50. Summary of Results from Analyzing TSS and Turbidity in Yakima/Union Gap and Ellensburg Stormwater during 2007-08. ...........................................................143
Table 51. Comparison of 303(d) Pesticide, PCB, and TSS Levels Measured in Urban Stormwater Samples in Eastern Washington. (Median values) ...........................144
Table 52. Values Used to Calculate Stormwater Loads from Yakima/Union Gap and Ellensburg. ................................................................................................................146
Table 53. Estimated Loading of 303(d) Listed Pesticides and PCBs in Stormwater Runoff from Yakima/Union Gap and Ellensburg. ...........................................................147

Yakima Pesticides/PCBs TMDL: Vol 1, WQ Study Findings Page xii
Table 54. Estimated TSS Loading in Stormwater from Yakima/Union Gap and Ellensburg. .......................................................................................................................147
Table 55. Relative Importance of Point and Nonpoint Loads to Lower Yakima River. 153
Table 56. Summary of Water Quality Exceedances in Yakima River Storage Reservoirs, Mainstem Yakima River, and Naches River for 303(d) Listed Chemicals and Toxaphene during Ecology’s 2006-08 Fish Tissue and Water Quality Studies. ......155
Table 57. Summary of Water Quality Exceedances in Tributaries and Irrigation Returns of the Yakima and Naches Rivers for 303(d) Listed Chemicals and Toxaphene. .......................................................................................................................156
Table 58. Yakima Basin WRIAs Where a TMDL or Other Pollution Control Plan is Needed. .........................................................................................................................157
Table 59. Potential Unlisted Waterbody Impairments in the Yakima River Drainage ..158
Table 60. Locations and Pollutants Where a TMDL is No Longer Required. ...............162
Table 61. Numeric TMDL Targets (Water Quality Criteria) for Pesticides and PCBs That Currently Exceed Standards in the Yakima River, Tributaries, or Irrigation Returns. ............................................................................................................163
Table 62. Existing TMDL Targets for Turbidity and Total Suspended Solids in the Yakima River. ..................................................................................................................164
Table 63. Revised TMDL Targets Proposed for Turbidity in the Lower Yakima River. ................................................................................................................................171
Table 64. Loading Capacity Estimates for Meeting Human Health Criteria for DDT Compounds, Dieldrin, Chlordane, Toxaphene, and PCBs in the Yakima River. ............174
Table 65. Loading Capacity Estimates for Meeting Chronic Aquatic Life Criteria for Total DDT and Toxaphene in the Yakima River. ......................................................175
Table 66. Loading Capacity Estimates for Meeting Chronic Aquatic Life Criterion for Chlorpyrifos in the Yakima River. .............................................................................176
Table 67. Loading Capacity Estimates for Meeting Acute Aquatic Life Criterion for Chlorpyrifos in the Yakima River. .............................................................................176
Table 68. Percent Reductions Needed to Meet the Existing TMDL Turbidity Target in the Lower Yakima River Mainstem during the 2007 Irrigation Season. .....................177
Table 69. Estimates of Loading Reductions Needed in the Mainstem Lower Yakima River to Meet Human Health Criteria of DDE, Dieldrin, Chlordane, Toxaphene, and Total PCBs. ...............................................................................................................178

Yakima Pesticides/PCBs TMDL: Vol 1, WQ Study Findings Page xiii
Abstract
The Yakima River, along with several of its tributaries and irrigation returns, is on the federal Clean Water Act 303(d) list for not meeting Washington State water quality standards for a range of chemical contaminants. The chemicals include six legacy pesticides or breakdown products (DDT, DDE, DDD, dieldrin, chlordane, and alpha-BHC), two current use insecticides (endosulfan and chlorpyrifos), polychlorinated biphenyls (PCBs), and dioxin (2,3,7,8-TCDD). All of these chemicals have exceeded Washington State water quality criteria for protection of human health for fish consumption or criteria for protection of aquatic life. Except for endosulfan and chlorpyrifos, these legacy pollutants are no longer produced or used in the United States. The Clean Water Act requires a Total Maximum Daily Load (TMDL) be developed for every waterbody and pollutant on the 303(d) list. A TMDL is a written, quantitative assessment of water quality problems and pollutant sources that cause the problems. The TMDL determines the amount (load) of a pollutant that can be discharged to the waterbody and allocates the load among sources. The Washington State Department of Ecology conducted a fish tissue survey in 2006 and a water quality study in 2007-08 (present report) in the Yakima River basin to aid in developing a TMDL for the 303(d) listed chemicals. Dioxin was excluded from the water quality study due to budget constraints and because the fish tissue survey showed human health criteria were very close to being met. The water quality study analyzed 303(d) pesticides, PCBs, suspended sediment, and turbidity in surface waters, municipal wastewater treatment plant effluents, fruit packer and vegetable processor effluents, and urban stormwater runoff. The chemical analysis was expanded to include toxaphene, an unlisted legacy pesticide detected in the fish tissue survey. This report describes how the study was conducted and analyzes the data in terms of compliance with water quality criteria, temporal and seasonal patterns, trends, pollutant loading, and the relative importance of sources. Numeric water quality targets are described for bringing the Yakima River into compliance with water quality standards for DDT compounds, dieldrin, chlordane, chlorpyrifos, PCBs, toxaphene, and turbidity. The river’s loading capacity is calculated for these pollutants. Endosulfan, chlordane (upper Yakima River only), alpha-BHC, and dioxin (Keechelus Reservoir only) are now meeting standards and should be removed from the 303(d) list during the next listing cycle. The report concludes with additional recommendations for the TMDL, 303(d) listing, source tracing, and monitoring.

Yakima Pesticides/PCBs TMDL: Vol 1, WQ Study Findings Page xiv
Acknowledgements
The authors thank the following people for their contribution to this study:
The Yakama Nation for giving permission to collect samples on the Yakama Reservation.
Elaine Brouillard of the Roza-Sunnyside Board of Joint Control, Marie Zuroske of the South Yakima Conservation District, Kathleen Satnik of the Kittitas County Water Purveyors, and Roger Satnik of the Kittitas Reclamation District for advice on study design, access to sampling sites, and sharing data.
U.S. Bureau of Reclamation, Kittitas Reclamation District, Kennewick Irrigation District, Sunnyside Valley Irrigation District and Board of Control, and Columbia Irrigation District for access to diversion dams.
Yakima basin wastewater treatment plant operators for their cooperation in obtaining effluent samples.
Andrus & Roberts, Apple King, ConAgra Foods – Lamb Weston, Gilbert Orchards, Snokist, and Zirkle Fruit for their cooperation in obtaining effluent samples.
JD Zimny, John Akers, and Irma Grogan of the City of Ellensburg, and Brett Sheffield and Randy Meloy of the City of Yakima, for advice on stormwater sampling.
The Bunnel family for access to Spring Creek.
Sandra Embrey, U.S. Geological Survey, for providing water quality data.
Helen Rueda, U.S. Environmental Protection Agency, Region 10, for review comments on the final report.
Staff with the Washington State Department of Ecology
o Mark Peterschmidt, Jane Creech, Ryan Anderson, and Greg Bohn of the Central Regional Office Yakima River TMDL Team for project guidance, help with field work, and review comments on the final report
o Chris Coffin, Jenna Durkee, Dan Dugger, and others for assistance with field work.
o Manchester Environmental Laboratory for analyzing project samples and reviewing the laboratory data.
o Dale Norton, Toxics Studies Unit supervisor, for project support and guidance.
o Joe Joy for advice on study design and data analysis.
o Dave Hallock for trend analysis of turbidity data.
o Harriet Beale, Helen Bresler, and Melissa Gildersleeve, Water Quality Program, for advice on stormwater issues.
o Mike Woodall, Geographic Information System (GIS) Technical Services, for preparing Figure 1.
o Dale Norton, Paul Pickett, Cheryl Niemi, Melissa Gildersleeve, and Helen Bresler for review comments on the draft report.
o Joan LeTourneau, Cindy Cook, and Gayla Lord for formatting and proofreading the final report.

Yakima Pesticides/PCBs TMDL: Vol 1, WQ Study Findings Page xv
Executive Summary
Total Maximum Daily Loads Section 303(d) of the federal Clean Water Act requires states to prepare a list every two years of waterbodies that do not meet water quality standards. In Washington, the 303(d) list is compiled by the Washington State Department of Ecology (Ecology). The Clean Water Act requires that a Total Maximum Daily Load (TMDL) be developed for every waterbody and pollutant on the list. TMDLs must be approved by the U.S. Environmental Protection Agency (EPA). A TMDL includes a written, quantitative assessment of water quality problems and pollutant sources that cause the problems. The TMDL determines the amount of a pollutant that can be discharged to the waterbody and still meet standards (the loading capacity) and allocates that pollutant load among the various sources. If the pollutant comes from a discrete (point) source such as a municipal or industrial facility’s discharge pipe, that facility’s share of the loading capacity is called a wasteload allocation. If the pollutant comes from a set of diffuse (nonpoint) sources such as farm runoff, the cumulative share is called a load allocation. The goal of a TMDL is to achieve clean water. Ecology works with the local community to develop (1) a strategy to control the pollution and (2) a monitoring plan to assess effectiveness of the water quality improvement activities. The water quality study described in this report was conducted to aid in developing a TMDL for 303(d) listed pesticides and PCBs in the Yakima River. Load and wasteload allocations for the chemicals of concern will be addressed in a separate TMDL Water Quality Improvement Report to EPA, to be prepared by the Ecology Water Quality Program at a later date. While this study provides information on waters throughout the watershed, the TMDL that will be derived from this report will focus on those waters of Washington State within the Yakima basin.
Watershed Description The Yakima River flows 215 miles out of Keechelus Lake in the Cascade Mountains to the Columbia River near Richland, draining an area of 6,155 square miles (Figure ES-1). The major population centers are, in downstream order, Ellensburg (16,542), Yakima (79,480), Toppenish (9,000), Sunnyside (14,710), and West Richland (10,210). The upper Yakima basin includes the Kittitas Valley, an area around Ellensburg devoted primarily to hay, cereal crops, and irrigated pasture. The lower Yakima basin is the region downstream of the Naches River confluence at the city of Yakima. The lower Yakima Valley produces fruit, vegetables, grapes, other specialty crops such as hops and mint, dairy products, and beef. The lower Yakima basin is one of the most intensively irrigated and agriculturally diverse areas in the United States. Irrigation delivery is primarily managed by the U.S. Bureau of Reclamation. Diversions to the irrigation canals begin in mid-March and end in mid-October, depending on the water supply available and the district.

Yakima Pesticides/PCBs TMDL: Vol 1, WQ Study Findings Page xvi
Figure ES-1. Yakima River Basin.

Yakima Pesticides/PCBs TMDL: Vol 1, WQ Study Findings Page xvii
For many water quality parameters, the quality of irrigation return flows largely determines the quality of water in the lower Yakima River. Agricultural drains in the mid and lower valleys have been found to be significant sources of nutrients, suspended sediment, fecal coliform bacteria, and pesticides. The highest detection frequencies and concentrations of pesticides generally occur during irrigation season. Pesticides that persist in soil, such as DDT, continue to be transported in streams and drains throughout the year, especially during storm runoff or snowmelt. In 1993, the Washington State Department of Health (WDOH) issued an advisory that recommended limiting consumption of bottom fish from the lower Yakima River due to the high levels of the legacy pesticide DDT and its breakdown products DDE and DDD. Much of the land that lies to the south of the lower Yakima River is within the Yakama Reservation. The 1.2 million acre reservation occupies about 15% of the basin. A number of the tributaries and irrigation returns that enter the lower Yakima River flow through or originate on the reservation. Land within the Yakama Reservation is under the sovereign jurisdiction of the Yakama Nation. The Yakima River forms the reservation’s boundary from Ahtanum Creek in Union Gap to the Mabton-Sunnyside Bridge. Water quality scientists, technicians, and educators from the Yakama Nation, Ecology, U.S. Geological Survey (USGS), and other agencies have maintained a cooperative partnership to monitor conditions and promote appropriate water management practices.
Yakima River 303(d) Listings The Yakima River, along with several of its tributaries and irrigation returns, are 303(d) listed for exceeding water quality standards for a range of chemical contaminants. The include six legacy pesticides or breakdown products (DDT, DDE, DDD, dieldrin, chlordane, and alpha-BHC), two current-use insecticides (endosulfan and chlorpyrifos), polychlorinated biphenyls (PCBs), and dioxin (2,3,7,8-TCDD) (Table ES-1). Historical data collected by Ecology, USGS, and EPA have shown these pollutants exceed Washington State human health criteria for fish consumption or water quality criteria for protecting aquatic life. Washington’s human health criteria are adopted from the EPA National Toxics Rule and are intended to protect the average fish consumer among the general public. Most of these chemicals bioaccumulate in fish, wildlife, and humans. The DDT breakdown product DDE, PCBs, and dioxin, in particular, are highly bioaccumulative due to their stability and solubility in lipids (fat). Concentrations in fish tissues can be tens of thousands of times higher than in the surrounding water. DDT, dieldrin, chlordane, alpha-BHC, and PCBs are legacy pollutants no longer produced or used in the United States. PCBs had numerous industrial applications as insulating fluids, plasticizers, in inks, and carbonless paper, and as heat transfer and hydraulic fluids. Dioxin is an unintended by-product of combustion and certain industrial processes. EPA has classed these compounds as probable human carcinogens. Endosulfan and chlorpyrifos are currently approved for use as insecticides on a variety of crops. They have adverse human health and aquatic life effects but are not carcinogens. Their bioaccumulation potential is low.

Yakima Pesticides/PCBs TMDL: Vol 1, WQ Study Findings Page xviii
Table ES-1. 303(d) Listed Pollutants in the Yakima River Basin (2008 list).
Pollutant Upper
Yakima River (WRIA 39)
Lower Yakima River
(WRIA 37)
Naches River†
(WRIA 38) Pesticides
DDT X DDE* X X DDD* X Dieldrin X Endosulfan X Chlordane X X Alpha-BHC X Chlorpyrifos X
PCBs (polychlorinated biphenyls)
X X X
Dioxin (2,3,7,8-TCDD) X X
*DDT breakdown product. WRIA = Water Resources Inventory Area. †listings are for Cowiche Creek.
In addition to the toxic chemicals shown above, the Yakima River basin also has 303(d) listings for dissolved oxygen, pH, temperature, and fecal coliform bacteria.
Existing TMDLs Two related TMDLs are already in place for the Yakima River. The Lower Yakima River Suspended Sediment and DDT TMDL was established in 1998. The Upper Yakima River Suspended Sediment and Organochlorine Pesticide TMDL was established in 2002. These TMDLs set numeric water quality targets to be achieved for DDT compounds, dieldrin, suspended sediment, and turbidity, and schedules for meeting the targets. The basic premise behind both TMDLs is that DDT and other pesticides attached to farm soils are being washed into the river at levels that adversely affect aquatic life and cause an increased health risk to people consuming fish. Suspended sediments – measured as total suspended solids (TSS) – also cause excessive turbidity. The combined effects of elevated TSS, turbidity, and pesticides degrade fish and wildlife habitat. Threatened and endangered salmonids are a particular concern. The present study builds on results of these efforts. While the Lower Yakima River TMDL was approved by EPA for meeting aquatic life criteria, it was not approved for achieving compliance with the more restrictive human health criteria. Therefore, the lower Yakima River remains 303(d) listed for DDT compounds and dieldrin, in addition to other chemicals listed after the TMDL was completed. The Upper Yakima River TMDL was approved as a plan for meeting both aquatic life and human health criteria, and the listings for DDT compounds and dieldrin

Yakima Pesticides/PCBs TMDL: Vol 1, WQ Study Findings Page xix
were subsequently moved from Category 5 (TMDL required) to Category 4 (has an approved TMDL).
2006 Fish Tissue Survey In view of the 303(d) listings, Ecology surveyed pesticide, PCB, and dioxin levels in resident fish species throughout the Yakima River in 2006. Fifty-six composite fillet samples and 30 composite whole fish samples were analyzed from the Keechelus Lake storage reservoir to the mouth of the Yakima River, representing approximately 300 individual fish. Findings showed that the primary human health concerns for fish consumption in the Yakima River were the DDT breakdown product DDE, PCBs, dieldrin, and toxaphene, an unlisted legacy pesticide. Except for PCBs, the concern was primarily restricted to the lower river. The DDE, PCB, dieldrin, and toxaphene results are summarized in Figures ES-2 and ES-3. Although still not meeting water quality standards, the levels of DDT compounds and dieldrin in Yakima River fish had decreased substantially since the suspended sediment and pesticide TMDLs were first initiated. WDOH has concluded that the levels are now low enough to lift the 1993 fish consumption advisory for DDT compounds. An advisory was retained to limit consumption of lower river carp due to PCBs.
Figure ES-2. DDE and PCB Levels in Yakima River Fish Collected in 2006.
0
20
40
60
80
100
120
0
100
200
300
400
500
600
Tota
l PC
Bs
(par
ts p
er b
illio
n)
DD
E (p
arts
per
bill
ion)
DDE PCBs
DDE human health criterion = 32 ppbPCB human health criterion = 5.3 ppb

Yakima Pesticides/PCBs TMDL: Vol 1, WQ Study Findings Page xx
Figure ES-3. Dieldrin and Toxaphene Levels in Yakima River Fish Collected in 2006.
2007-08 Water Quality Study Based on results of the 2006 fish survey, Ecology initiated a year-long water quality study in the Yakima River basin in 2007 to aid in developing a TMDL for the 303(d) listed pesticides, PCBs, and toxaphene. Dioxin was excluded from the study due to budget constraints and because the fish samples showed the human health criterion was met or very close to being met, depending on location. The sampling effort was weighted toward the lower Yakima River due to the greater number of 303(d) listings and because of the existing TMDL for suspended sediment and pesticides in the upper river. The study analyzed 303(d) pesticides, PCBs, toxaphene, suspended sediment, and turbidity in surface waters, municipal wastewater treatment plant (WWTP) effluents, fruit packer and vegetable processor effluents (lower river only), and urban stormwater runoff. Chemical analysis for the upper river was limited to PCBs and toxaphene. Field work was initiated in April 2007 and completed in June 2008. Over 400 samples were analyzed. The present report describes how the water quality study was conducted and analyzes the data in terms of compliance with water quality criteria, temporal and seasonal patterns, trends, pollutant loading, and relative importance of sources. Examples are provided of significant water quality improvements already realized due to farmers reducing soil erosion and associated pesticide inputs to surface waters to meet TMDL water quality targets.
0
10
20
30
40
50
60
0.0
0.5
1.0
1.5
2.0
2.5
3.0
Tox
aphe
ne (
part
s pe
r bi
llion
)
Die
ldrin
(pa
rts
per
billi
on)
Dieldrin Toxaphene
Dieldrin human health criterion = 0.65 ppbToxaphene human health criterion = 9.6 ppb

Yakima Pesticides/PCBs TMDL: Vol 1, WQ Study Findings Page xxi
Water Quality Study Findings Key findings of the water quality study include the following: Despite significant, recent reductions in soil erosion, lower Yakima River irrigation returns
continue to discharge elevated levels of suspended sediment that contribute to exceedances of turbidity and pesticide criteria and TMDL targets, particularly during the first half of the irrigation season. Figure ES-4 shows turbidity levels during the 2007 irrigation season in the lower mainstem compared to the existing TMDL target.
Figure ES-4. Turbidity in the Lower Mainstem Yakima River during the 2007 Irrigation Season.
Although much reduced over historical levels, the lower Yakima River and a number of its
tributaries and irrigation returns still exceed human health or aquatic life criteria for DDT, DDT breakdown products, and dieldrin (Figure ES-5).
A first-time effort to characterize chemical contaminants in urban stormwater discharges to the Yakima River found high levels of pesticides, PCBs, TSS, and turbidity in runoff from the cities of Yakima, Union Gap, and Ellensburg (pesticides not analyzed in Ellensburg samples) (Figure ES-6).
Several irrigation returns to the lower Yakima River exceed human health or aquatic life criteria for toxaphene and PCBs. Exceedances of the toxaphene aquatic life criteria were observed in the lower Yakima mainstem during the irrigation season.
Peak chlorpyrifos concentrations in some of the same returns exceed aquatic life criteria during the spring and fall when this insecticide is being applied.
0
5
10
15
20
25
30
35
Turbidity Units (NTU
)
TMDL Target
Euclid
Kiona
Parker
Irrigation Season

Yakima Pesticides/PCBs TMDL: Vol 1, WQ Study Findings Page xxii
Figure ES-5. Lower Yakima River Tributaries and Irrigation Returns that Exceeded Water Quality Criteria for DDT Compounds and Dieldrin in 2007-08.
Figure ES-6. Comparison of Pesticide and PCB Levels in Surface Water and Permitted Discharges (median values, log scale).
0.01
0.1
1
10
Par
ts p
er t
rillio
n
Yakima Area Stormwater
Major Returns
Other Tribs & Returns
Fruit & Vegetable
WWTPs
Mainstem & Naches R.

Yakima Pesticides/PCBs TMDL: Vol 1, WQ Study Findings Page xxiii
In terms of loading, irrigation returns continue to be the predominant cause of degraded water quality in the lower Yakima River. These are the most significant sources needing control to reduce the adverse effects of elevated turbidity, pesticides, and PCBs. Urban stormwater runoff appears to be a significant source of these same pollutants and warrants additional monitoring of spatial and temporal variability to better identify and control sources. This study found that reductions are also needed for PCBs in WWTP effluents and dieldrin in fruit packer and vegetable processor effluents, if they are to meet water quality criteria at the point of discharge. However, these are relatively low volume discharges. Due to chemical interferences, legacy pesticides could not be analyzed down to water quality criteria levels in WWTP effluent.
Pollutants for Which a TMDL or Other Pollution Control Plan is Needed The combined results from Ecology’s fish tissue and water quality studies show that DDT compounds, dieldrin, chlordane, chlorpyrifos, toxaphene, and PCBs currently exceed standards in the Yakima River basin at the locations indicated in Table ES-2. Thus, 303(d) listing continues to be warranted for these pollutants, and a TMDL or other pollution control plan should be implemented. Dioxin marginally exceeds standards and should therefore continue to be listed. The chlordane exceedance is also marginal and limited to fish near Prosser.
Table ES-2. Locations and Pollutants Where a TMDL or Other Pollution Control Plan is Needed.
Reservoirs (WRIA 39)
Upper Yakima River (WRIA 39)
Lower Yakima River (WRIA 37)
Naches River (WRIA 38)
Keechelus Lake Kachess Lake
Mainstem Wilson Creek
Mainstem Tributaries & Returns
Mainstem Cowiche
Creek
PCBs PCBs Toxaphene* PCBs PCBs PCBs PCBs Dioxin Toxaphene* Toxaphene* DDE
DDE DDE Total DDT Total DDT† DDT
Dieldrin Total DDT Dioxin Chlorpyrifos
WRIA = Water Resources Inventory Area. *new finding, not currently 303(d) listed. †total DDT = DDT+DDE+DDD.
The low-level occurrence of PCBs is widespread in Washington rivers and lakes, and is the reason for many 303(d) listings. Targeted cleanups of PCB contaminated sites may be more effective for reducing PCB levels in the Yakima River than the traditional TMDL approach of setting load and wasteload allocations.

Yakima Pesticides/PCBs TMDL: Vol 1, WQ Study Findings Page xxiv
Because of limited Ecology resources, which extend beyond costs and include staffing levels, dioxin will not be included in this TMDL. Dioxin will remain on the 303(d) list of contaminants to be addressed in the Yakima basin in the future. Ecology plans to address dioxins on a larger scale (possibly region- or state-wide) in the future. Additionally, because dioxins are often carried via air and can pollute sizeable areas not necessarily limited to watersheds, a larger TMDL footprint will likely be more effective and efficient.
Numeric TMDL Targets and Loading Capacity This report proposes numeric water quality targets for the TMDL. The targets identify the specific instream goals or criteria for the TMDL, which equate to attainment of water quality standards. The targets include: (1) a partial revision to the existing TMDL turbidity targets for the lower Yakima River; (2) a subset of the water quality criteria for pesticides and PCBs; and (3) equivalent human health criteria-based targets for edible fish tissue. Similar targets for pesticides and turbidity are already in effect as part of the Upper Yakima River TMDL. The loading capacity (grams per day) of the Yakima River was calculated for total DDT, DDE, dieldrin, chlordane, chlorpyrifos, toxaphene, and PCBs. Reductions in the concentrations and loads of these compounds will be needed to meet the water quality targets and not exceed loading capacity.
Recommendations The report concludes with recommendations for the TMDL, 303(d) list, source tracing, and further monitoring. These include:
Develop TMDLs or other pollution control plans for DDT compounds, dieldrin, chlordane, chlorpyrifos, toxaphene, and PCBs for those areas indicated in Table ES-2.
Remove the 303(d) listings for endosulfan, chlordane (upper Yakima River only), alpha-BHC, and dioxin (Keechelus Reservoir only).
Improve current understanding of variability in concentrations and loads of pesticides, PCBs, suspended solids, and turbidity in Yakima area urban stormwater runoff, with the ultimate aim of identifying and controlling sources.
Identify sources of toxaphene and PCBs in selected irrigation returns.
Characterize dry weather discharge of pesticides, PCBs, suspended solids, and turbidity from Yakima area urban storm drains.
Continue turbidity monitoring of irrigation returns and expand where appropriate.
Periodically monitor Yakima River fish for the contaminants of concern to assess progress toward meeting human health criteria and TMDL targets.

Yakima Pesticides/PCBs TMDL: Vol 1, WQ Study Findings Page 1
What is a Total Maximum Daily Load (TMDL)?
Federal Clean Water Act Requirements The Clean Water Act established a process to identify and clean up polluted waters. Under the Act, each state is required to have its own water quality standards designed to protect, restore, and preserve water quality. Water quality standards consist of designated uses for protection, such as cold water biota and drinking water supply, as well as criteria, usually numeric criteria, to achieve those uses. Every two years, states are required to prepare a list of waterbodies – lakes, rivers, streams, or marine waters – that do not meet water quality standards. This list is called the 303(d) list. To develop the list, the Washington State Department of Ecology (Ecology) compiles its own water quality data along with data submitted by local, state, and federal governments, tribes, industries, and citizen monitoring groups. All data are reviewed to ensure that they were collected using appropriate scientific methods before being used to develop the 303(d) list. The 303(d) list is part of the larger Water Quality Assessment. The Water Quality Assessment is a list that tells a more complete story about the condition of Washington’s water. This list divides waterbodies into five categories:
Category 1 – Meets standards for parameter(s) for which it has been tested.
Category 2 – Waters of concern.
Category 3 – Waters with no data available.
Category 4 – Polluted waters that do not require a TMDL because:
4a. Has an approved TMDL and it is being implemented. 4b. Has a pollution control plan in place that should solve the problem. 4c. Is impaired by a non-pollutant such as low water flow, dams, culverts.
Category 5 – Polluted waters that require a TMDL – the 303(d) list.
TMDL Process Overview The Clean Water Act requires that a TMDL be developed for each of the waterbodies on the 303(d) list. A TMDL identifies how much pollution needs to be reduced or eliminated to achieve clean water. Ecology then works with the local community to develop (1) a strategy to control the pollution and (2) a monitoring plan to assess effectiveness of the water quality improvement activities. TMDLs must be approved by EPA.

Yakima Pesticides/PCBs TMDL: Vol 1, WQ Study Findings Page 2
Elements Required in a TMDL The goal of a TMDL is to ensure the impaired water will attain water quality standards. A TMDL includes a written, quantitative assessment of water quality problems and pollutant sources that cause the problem. The TMDL determines the amount of a given pollutant that can be discharged to the waterbody and still meet standards (the loading capacity) and allocates that load among the various sources. Identification of a waterbody’s loading capacity for a pollutant is an important step in developing a TMDL. EPA defines loading capacity as “the greatest amount of loading that a waterbody can receive without violating water quality standards” (www.epa.gov/owow/tmdl/glossary.html). The loading capacity provides a reference for calculating the amount of pollution reduction needed to bring a waterbody into compliance with standards. By definition, a TMDL is the sum of the allocations, which must not exceed the loading capacity. The portion of the receiving water’s loading capacity assigned to a particular source is a load or wasteload allocation. If the pollutant comes from a discrete (point) source such as a municipal or industrial facility’s discharge pipe, that facility’s share of the loading capacity is called a wasteload allocation. If the pollutant comes from a set of diffuse (nonpoint) sources such as farm runoff, the cumulative share is called a load allocation. The TMDL must also consider seasonal variations and include a margin of safety that takes into account any lack of knowledge about the causes of the water quality problem or its loading capacity. A reserve capacity for future loads from growth pressures is sometimes included as well. The sum of the wasteload and load allocations, the margin of safety, and any reserve capacity must be equal to or less than the loading capacity. TMDL = Loading Capacity = sum of all wasteload allocations + sum of all load allocations + margin of safety.

Yakima Pesticides/PCBs TMDL: Vol 1, WQ Study Findings Page 3
Why is Ecology Conducting a TMDL Study in This Watershed?
Overview This TMDL project will incorporate and update the DDT and suspended sediments water quality improvement plans already in place in the Yakima basin, while capturing previously unaddressed water quality impairments due to other toxics pollutants. While this study provides information on waters throughout the watershed, the TMDL derived from this report will focus on those waters of Washington State within the Yakima basin. In 1994 Ecology began to seriously address polluted runoff in the Yakima River watershed when it initiated the Yakima River Suspended Sediment and DDT TMDL study. That project concluded that reducing polluted runoff from irrigated agricultural activities was a priority for reducing DDT and its breakdown products. The 1997 publication of the TMDL included goals for controlling sediment runoff reaching the Yakima River through irrigation drains and a schedule for re-evaluating contaminant loading to the river. An Ecology TMDL study in the upper Yakima River conducted in 1999 also showed that DDT, its breakdown products, and other organochlorine pesticides could be reduced if suspended sediment loading from agricultural areas were reduced. The current study answers the TMDL requirement to check the progress of the earlier work on suspended sediments and DDT while expanding the study to capture other toxics in the watershed. After a decade of implementation activities that reduce suspended sediment loading to the Yakima River and its tributaries, Ecology began this study to:
Assess progress toward meeting TMDL targets for reducing DDT and dieldrin levels in Yakima River fish.
Verify accuracy of the current 303(d) listings for chemical contaminants in Yakima River fish and water.
Provide data to the Washington State Department of Health to update the 1993 fish consumption advisory on DDT.
Set or adjust pollution reduction goals from a broad range of sources – stormwater, irrigated agriculture, wastewater treatment plants, and other sources – for meeting human health and aquatic life criteria for toxic compounds in the Yakima River.
Due to the size of the Yakima basin and the number and complexity of toxics issues, Ecology decided to split the TMDL into two parts: a Water Quality Study Findings Report (the present study) and a future TMDL Water Quality Improvement Report. This Water Quality Study Findings Report assesses the current status of toxics pollution problems and sources in the Yakima basin and calculates the river’s loading capacity for the chemicals of concern. The

Yakima Pesticides/PCBs TMDL: Vol 1, WQ Study Findings Page 4
Water Quality Improvement Report will include the overall approach to control the pollution (Implementation Strategy) and a monitoring plan to assess the effectiveness of the water quality improvement activities undertaken (Effectiveness Monitoring). Load and wasteload allocations for the chemicals of concern will be addressed in the Water Quality Improvement Report, to be prepared by the Ecology Water Quality Program at a later date and submitted to EPA.
Study Area The study area for this TMDL includes the Yakima River, its tributaries, and irrigation returns. This area extends from the headwaters of Keechelus Lake to the Yakima River confluence with the Columbia River. It includes Water Resource Inventory Areas (WRIA) 39: Upper Yakima River, WRIA 38: Naches River, and WRIA 37: Lower Yakima River (Figure 1).
Figure 1. Water Resource Inventory Areas for Yakima River Pesticides and PCBs TMDL.

Yakima Pesticides/PCBs TMDL: Vol 1, WQ Study Findings Page 5
Yakima Basin Waterbodies on Ecology’s 303(d) List of Impaired Waters Washington’s 2008 303(d) list includes numerous Category 5 listings in the Yakima River watershed for a range of chemical contaminants (www.ecy.wa.gov/programs/wq/303d/index.html). The include six legacy pesticides or breakdown products (DDT, DDE, DDD, dieldrin, chlordane, and alpha-BHC), two current use insecticides (endosulfan and chlorpyrifos), polychlorinated biphenyls (PCBs), and dioxin (2,3,7,8-TCDD). Waterbodies in Category 5 require a TMDL. The individual Category 5 listings for chemicals that have failed to meet (exceeded) human health criteria in edible fish tissue samples from the Yakima River are in Appendix A. The listings for chemicals that have exceeded human health and aquatic life criteria in water samples are in Appendix B. Both sets of listings are summarized in Table 1. Ninety-five percent of the current Category 5 listings in the Yakima basin are for the lower river (89 out of 94). Although EPA approved the Lower Yakima River Suspended Sediment and DDT TMDL for meeting aquatic life and turbidity criteria, it was not approved for achieving compliance with the more restrictive human health pesticide criteria. Therefore, the lower river continues to have Category 5 listings for DDT, DDE, DDD, and dieldrin. The Upper Yakima River Suspended Sediment and Organochlorine Pesticide TMDL was approved for meeting human health criteria, and the listings for DDT compounds and dieldrin were subsequently moved to Category 4a (waterbodies that have an approved TMDL). The 2008 303(d) list had a number of new Yakima River listings for organochlorine compounds including PCBs, dioxin, and the pesticides endosulfan, chlorpyrifos, chlordane, and alpha-BHC. These listings were based on fish and water samples analyzed by Ecology and EPA since 1995. Most of these chemicals bioaccumulate in fish, wildlife, and humans. DDE, PCBs, and dioxin, in particular, are highly bioaccumulative due to their stability and solubility in lipids (fat). Concentrations in fish tissues, for example, can be tens of thousands of times higher than in the surrounding water. PCBs and most chlorinated pesticides are legacy pollutants no longer produced or used in the United States. They were banned by EPA in the 1970s and 1980s for ecological and human health concerns, but they persist in soil, lakes, rivers, and streams. Endosulfan, a chlorinated insecticide, and chlorpyrifos, an organophosphorus insecticide, are currently approved for a variety of crops. Their bioaccumulation potential is low. The 303(d) listings for endosulfan and chlorpyrifos are for exceeding aquatic life criteria in water samples. PCBs were once widely used in industrial applications as insulating fluids, plasticizers, in inks and carbonless paper, and as heat transfer and hydraulic fluids. Dioxin is an unintended by-product of combustion and certain industrial processes. These chemicals are routinely detected in Washington rivers and streams and are the cause of many 303(d) listings.

Yakima Pesticides/PCBs TMDL: Vol 1, WQ Study Findings Page 6
Table 1. Summary of 303(d) Listings for Chemical Contaminants in the Yakima River Basin (2008 list).
Reach Number
of Listings
Parameter Applies
To
Upper Yakima River (WRIA 39)
Keechelus Lake 2 PCBs, Dioxin Fish tissue
Yakima R. Canyon 3 PCBs, Dioxin, Chlordane Fish tissue
Naches River (WRIA 38)
Cowiche Creek 2 PCBs, DDE Fish tissue
Lower Yakima River (WRIA 37)
Yakima R. near Union Gap 5 DDT, DDE, DDD, alpha-BHC, PCBs Fish tissue
7 DDT, DDE, DDD, Chlorpyrifos, Endosulfan Water
Yakima R. near Zillah 3 DDT, DDD, Dieldrin Fish tissue
Yakima R. near Granger 8 DDT, DDE, PCBs, Dioxin Fish tissue
2 DDT, Dieldrin Water
Yakima R. near Grandview 1 DDE Fish tissue
2 DDE, DDD Water
Yakima R. near Prosser 4 DDT, DDE, Chlordane, Dioxin Fish tissue
1 DDT Water
Yakima R. near Benton City 8 DDT, DDE, DDD, alpha-BHC, PCBs Fish tissue
5 DDT, DDE, DDD, Dieldrin, Endosulfan Water
Yakima R. near Horn Rapids 6 1
DDT, DDE, DDD, Dieldrin, alpha-BHC, PCBs Fish tissue
DDE Water
Yakima R. near mouth 2 DDT, DDE Fish tissue
Yakima Tributaries: Wide Hollow Creek, Moxee Drain, Marion Drain, Granger Drain, Sulphur Creek Wasteway, Snipes Creek, Spring Creek
32 DDT, DDE, DDD, Dieldrin, Endosulfan, Chlorpyrifos
Water
44 Total Fish Tissue Listings
50 Total Water Column Listings
94 Total Listings
*Water Resources Inventory Area.

Yakima Pesticides/PCBs TMDL: Vol 1, WQ Study Findings Page 7
Toxaphene, a chlorinated pesticide, is among the pollutants being addressed in this TMDL. All uses of this chemical were banned in 1990. Toxaphene is not currently 303(d) listed but was recently identified as a contaminant of potential concern in Yakima River fish (Johnson et al., 2007). The report of this finding did not come in time for the 2008 303(d) list. Toxaphene shares many of the characteristics of other bioaccumulative pesticides and PCBs. Detailed profiles including use, regulations, environmental occurrence, and health effects of these chemicals have been prepared by the Agency for Toxic Substances & Disease Registry and are available at www.atsdr.cdc.gov/toxpro2.html. In addition to the toxic chemicals mentioned above, the Yakima River basin has 303(d) listings for dissolved oxygen, pH, temperature, and fecal coliform bacteria.
Pollutants Addressed by This TMDL This TMDL project addresses the pollutants listed in Table 2.
Table 2. Pollutants Being Addressed in This TMDL.
Pollutant Upper
Yakima Basin (WRIA 39)
Lower Yakima Basin
(WRIA 37)
Naches River (WRIA 38)
Chlorinated Pesticides
DDT (dichlorodiphenyltrichloroethane) X
DDE (dichlorodiphenyldichloroethylene)* X X
DDD (dichlorodiphenyldichloroethane)* X
Dieldrin X
Endosulfan X
Chlordane X X
Alpha-BHC (benzenehexachloride) X
Toxaphene† X X
Organophosphorus Pesticides
Chlorpyrifos X
PCBs (polychlorinated biphenyls) X X X *DDT breakdown product.
†Not currently 303(d) listed.
Suspended sediment and turbidity are also a focus of this study. The previous TMDLs correlated these parameters with the occurrence of chlorinated pesticides and adverse effects on fish and other aquatic life. The TMDLs established numeric water quality targets and schedules to bring the Yakima River into compliance with the turbidity standards and certain of the pesticide criteria.

Yakima Pesticides/PCBs TMDL: Vol 1, WQ Study Findings Page 8
Washington State standards do not provide numeric criteria for suspended sediment. However, elevated levels of suspended sediment increase turbidity, and turbidity is addressed in the standards. Exceedances of dioxin criteria in the Yakima River are minimal. For this reason and because of limited Ecology resources, which extend beyond costs and include staffing levels, dioxin will not be addressed in this TMDL. Dioxin will remain on the 303(d) list of contaminants to be addressed in the Yakima basin in the future. Ecology plans to address dioxins on a larger scale, possibly region- or state-wide. Because dioxins are often carried via air and can pollute sizeable areas not necessarily limited to watersheds, a larger TMDL footprint will likely be more effective and efficient.

Yakima Pesticides/PCBs TMDL: Vol 1, WQ Study Findings Page 9
Water Quality Standards
Designated Uses Designated uses in Washington State include public water supply, protection for fish, shellfish, and wildlife, as well as recreational, agricultural, industrial, navigational, and aesthetic purposes. Water quality criteria are designed to protect the designated uses and are used to assess the general health of Washington surface waters and set permit limits. Use designations for the upper Yakima River, lower Yakima River, Naches River, and their tributaries are listed in Appendix C.
Toxics Washington State’s aquatic life and human health criteria for the toxic pollutants being addressed in this TMDL are shown in Table 3.
Table 3. Washington State Water Quality Criteria for 303(d) Listed Pesticides, PCBs, and Toxaphene in the Yakima River Basin (ng/L; parts per trillion).
Chemical
Criteria for Protection Criteria for Protection of Aquatic Life
(WAC 173-201A) of Human Health
(EPA National Toxics Rule) Freshwater Freshwater Fish Fish & Water
Chronic Acute Consumption Consumption
DDT - - - - 0.59 0.59
DDE - - - - 0.59 0.59
DDD - - - - 0.84 0.83 DDT and metabolites*
1.0 1,100 - - - -
Dieldrin 1.9 2,500 0.14 0.14
Chlordane 4.3 2,400 0.59 0.57
alpha-BHC - - - - 13 3.9
Endosulfan 56 220 2,000 930
Chlorpyrifos 41 83 - - - -
Toxaphene 0.2 730 0.75 0.73
PCBs 14 2,000 0.17 0.17
*The sum of DDT and metabolites DDE and DDD (i.e., total DDT). - - = no criteria.

Yakima Pesticides/PCBs TMDL: Vol 1, WQ Study Findings Page 10
Aquatic Life The aquatic life criteria are designed to protect for both short term (acute) and long term (chronic) effects of chemical exposure. The criteria are primarily intended to avoid direct lethality to fish and other aquatic life within the specified exposure periods. The chronic criteria for PCBs and a number of the chlorinated pesticides are to protect fish-eating wildlife from adverse effects due to bioaccumulation. The exposure periods assigned to the acute criteria are expressed as: (1) an instantaneous concentration not to be exceeded at any time, or (2) a 1-hour average concentration not to be exceeded more than once every three years on the average. The exposure periods for the chronic criteria are either: (1) a 24-hour average not to be exceeded at any time, or (2) a 4-day average concentration not to be exceeded more than once every three years on the average. For 303(d) listing purposes, measurements of instantaneous concentrations are assumed to represent the averaging periods specified in the water quality standards for both acute and chronic criteria, unless additional measurements are available to calculate averages (Ecology, 2006). As indicated in Table 3, there are no aquatic life criteria specifically for DDT, its breakdown products DDE and DDE, or alpha-BHC. The “DDT and metabolites” criteria apply to DDT, DDE, and DDD individually or in combination. In the present report, the sum of detected concentrations of DDT, DDE, and DDD is referred to as total DDT. Human Health Criteria for the protection of human health are applied to the states through the EPA National Toxics Rule (NTR) (40 CFR 131.36(14). In freshwater, the criteria take into account the combined exposure of drinking the water and eating fish that live in the water. In marine waters, human health criteria only consider the effect of eating fish. The criteria protect against non-carcinogenic illness and keep the risk of developing cancer to a pre-specified level. In Washington, the cancer risk is set such that no more than 1 in 1,000,000 people with full exposure would be likely to develop cancer in response to that exposure. Full exposure is defined by a set of assumptions on body weight, fish and water consumption, and the number of years exposed. The risk is correlated to an average-weight adult consuming 6.5 grams per day of fish (approximately 5 pounds per year), drinking 2 liters of water per day (if freshwater), and continuing this pattern for 70 years. For the chemicals of concern in the Yakima River, essentially all of the cancer risk is from fish consumption. People with higher or lower body weight and exposure patterns would face higher or lower risks. This basic exposure pattern is the same for both cancer-causing and non-cancer-causing chemicals. EPA has classed the pollutants of concern in this TMDL as probable human carcinogens, except for endosulfan and chlorpyrifos. The human health criteria for endosulfan are based on a reference dose that is unlikely to have appreciable health risk. There are no human health criteria for chlorpyrifos.

Yakima Pesticides/PCBs TMDL: Vol 1, WQ Study Findings Page 11
The edible fish tissue criteria that apply to the Yakima River are shown in Table 4. These values are derived from the human health water quality criteria in Table 3 (fish and water consumption) and EPA bioconcentration factors (BCFs). BCF= Ct/Cw, where Ct is the contaminant concentration in fish tissue (wet weight) and Cw is the concentration in water. The BCFs are taken from the EPA 1980 Ambient Water Quality Criteria documents (www.epa.gov/waterscience/criteria/1980docs.htm). The BCF predicts the chemical concentration in fish tissue that would be expected to result for a given concentration in the water column. In essence, the 303(d) fish tissue criteria are the human health water quality criteria expressed in tissue form.
Table 4. Freshwater Edible Fish Tissue Criteria for 303(d) Listed Pesticides, Toxaphene, PCBs, and Dioxin in Yakima River Fish (based on EPA National Toxics Rule; ug/Kg wet weight, parts per billion).
Chemical Fish Tissue
Criteria DDT 32 DDE 32
DDD 45 Dieldrin 0.65 Chlordane 8.0
alpha-BHC 0.51 Endosulfan 251 Chlorpyrifos - -
Toxaphene 9.6 PCBs 5.3 Dioxin 0.00007
Turbidity Turbidity is a measure of light refraction in water and can be used to estimate the amount of suspended sediment and other solids. Fish and other aquatic life are affected by suspended matter in the water column and sediments that settle out on the bottom. The effects of suspended sediment on fish and other aquatic life can be divided into five categories:
1. Acting directly on swimming ability.
2. Causing mortality or reducing their growth rate, resistance to disease, etc.
3. Preventing the successful development of eggs and larvae.
4. Modifying natural movements and migrations.
5. Reducing the abundance of available food.

Yakima Pesticides/PCBs TMDL: Vol 1, WQ Study Findings Page 12
Suspended sediment may also serve to transmit attached chemical and biological contaminants to waterbodies where they can be taken up in the tissues of fish. This can affect the health of humans or wildlife that eat the fish. Turbid waters also interfere with the treatment and use of water as potable water supplies, and can interfere with the recreational use and aesthetic enjoyment of the water. Turbidity is a focus of the existing Yakima River suspended sediment TMDLs. The criteria state that: Turbidity shall not exceed 5 NTUa over background turbidity when the background turbidity is 50 NTU or less, or have more than a 10 % increase in turbidity when the background is more than 50 NTU. The criteria do not set a maximum acceptable turbidity level based on beneficial use considerations, but they do limit the effect of an identified source on raising the turbidity in the receiving water. Background conditions are defined as … the biological, chemical, and physical conditions of the water body, outside the area of influence of the discharge under consideration. [WAC 173-201A-200; 2006 edition]
a nephelometric turbidity units

Yakima Pesticides/PCBs TMDL: Vol 1, WQ Study Findings Page 13
Watershed Description
Yakima River Basin The Yakima River flows 215 miles out of Keechelus Lake in the Cascade Mountains to the Columbia River near Richland, draining an area of 6,155 square miles (Figure 2). The major population centers are, in downstream order, Ellensburg (16,542), Yakima (79,480), Toppenish (9,000), Sunnyside (14,710), and West Richland (10,210). Much of the land that lies to the south of the lower Yakima River is within the Yakama Nation Reservation. The reservation occupies about 15% of the basin. Most of the Yakima basin is in the Cascade rain shadow. Mean annual precipitation ranges from 140 inches in the mountains to less than 10 inches in the eastern regions. The western part is mostly forested, while the eastern uplands are dominated by sagebrush and grass. The lowlands are farmed and intensively irrigated. The upper basin includes the Kittitas Valley, an area around Ellensburg devoted primarily to hay, cereal crops, and irrigated pasture. The lower basin is downstream of the Naches River confluence at river mile (r.m.) 116.3 in the city of Yakima. The lower Yakima Valley produces fruit, vegetables, grapes, other specialty crops such as hops and mint, dairy products, and beef. The lower Yakima River basin is one of the most intensively irrigated and agriculturally diverse areas in the United States. The Kittitas and Yakima Valleys are separated by the Yakima River Canyon, an arid 20-mile reach between Ellensburg and Yakima. The canyon is generally considered to be part of the upper Yakima River. Approximately one-half million acres are irrigated in the drainage. Most of the water is managed by the U.S. Bureau of Reclamation (USBR). Snowmelt and precipitation are held in six reservoirs on the upper Yakima and Naches Rivers and delivered to growers via rivers, creeks, and man-made canals. Water distribution from canals to farms is primarily managed by irrigation districts. USBR also manages the system for flood control, power generation, and fishery management. Irrigation is by one of three general methods: furrow, sprinkler, or drip. Of these methods, furrow typically results in the most surface runoff from agricultural lands. Excess water is collected at the lower ends of fields and flows into drains that ultimately reach the Yakima River. Over the last several decades, irrigated land has been converted to sprinkler or drip irrigation, but rill and furrow is still used by many agricultural producers.

Yakima Pesticides/PCBs TMDL: Vol 1, WQ Study Findings Page 14
Figure 2. Yakima River Basin.

Yakima Pesticides/PCBs TMDL: Vol 1, WQ Study Findings Page 15
During the summer, return flows downstream from the city of Yakima account for 50 to 70% of the flow in the Yakima River (Fuhrer et al., 2004). Thus, for many water quality parameters, the quality of the irrigation returns largely determines the quality of water in the lower Yakima River. While most of the drinking water in the Yakima basin comes from wells, surface water provides drinking water for some cities such as Yakima (Naches River) and Cle Elum (upper Yakima River).
Yakama Nation The 1.2-million-acre Yakama Reservation lies between the lower Yakima River and the Cascade Range. A number of the tributaries and irrigation returns that enter the Yakima River flow through or originate on the reservation. Land within the Yakama Reservation is under the sovereign jurisdiction of the Yakama Nation. The Yakima River forms the reservation’s northern boundary from Ahtanum Creek at r.m. 106.9 in Union Gap to the Mabton-Sunnyside Bridge at r.m. 59.8. Since the Yakima River was on the 303(d) list of threatened or impaired waterbodies, the state acted to improve and protect water quality by developing the existing TMDLs. Water quality scientists, technicians, and educators from the Yakama Nation, Ecology, the U.S. Geological Survey (USGS), and other agencies have maintained a cooperative partnership to monitor conditions and promote appropriate water management practices. The approval and cooperation of the Yakama Nation is important to the success of continuing efforts to clean up the river.
Streamflow and the Irrigation System Peak runoff in the Yakima River normally occurs during snowmelt in April and May (Figure 3). Diversions to the irrigation canals begin in mid-March and end in mid-October, depending on water supply. Because of diversions, flow regulation in the headwaters, and dry summers, some reaches of the Yakima have a low-flow period during summer. Most irrigation returns have their low-flow periods in the winter, while many natural tributaries have low-flow periods in the late summer or fall. Streamflow varies from year to year depending on snowfall. The snowpack is thought of as the "sixth reservoir" and is an integral part of the total water supply. "Storage control" is a term used to define the time when natural, unregulated flow in the river has ended and water supply is controlled by releases from the reservoirs. In a year with normal snowmelt and runoff, the system goes on storage control around June 20.
There are seven divisions in the USBR Yakima Project: Storage, Kittitas, Tieton, Roza, Wapato, Sunnyside, and Kennewick. The Wapato Division is operated by the Bureau of Indian Affairs. Storage dams and reservoirs in the project are Keechelus, Kachess, and Cle Elum on the upper Yakima River, and Bumping Lake, Clear Lake, and Tieton Reservoir (Rimrock Lake) in the Naches River drainage. Other project features are five diversion dams, canals, laterals, pumping plants, drains, two power plants, and transmission lines.

Yakima Pesticides/PCBs TMDL: Vol 1, WQ Study Findings Page 16
Figure 3. Monthly Average Flow in the Yakima River, Sulphur Creek Wasteway, and Granger Drain.
(USGS data: Yakima @ Umtanum 1933-1977; Yakima @ Kiona 1933-2007; Sulphur Creek 1976-90; Granger Drain 1991-2003; http://waterdata.usgs.gov/wa/nwis/sw.)
0
50
100
150
200
250
300
350
0
1000
2000
3000
4000
5000
6000
Irrig
atio
n R
etur
ns (
cfs)
Mai
nste
m (
cfs)
Yakima @ Kiona Yakima @ Umtanum
Sulphur Creek Wasteway Granger Drain

Yakima Pesticides/PCBs TMDL: Vol 1, WQ Study Findings Page 17
Figure 4 is a schematic of the drainage, showing the relative position of selected tributaries, diversions, return flows, and other features of interest in the present study.
Figure 4. Relative Position of Selected Tributaries, Diversions, Irrigation Returns, and Other Features on the Yakima River.
Feature Inflow or Outflow River Mile
Keechelus Lake 214.5 Kachess Lake 203.5
Cle Elum Lake 185.6 Wilson Creek 147.0
Umtanum Stream-gaging Station ‐‐ 140.5 Roza Diversion Dam 127.9
Naches River 116.3 Roza Power Return 113.3 Wide Hollow Creek 107.4
Moxee Drain 107.3 Ahtanum Creek 106.9
Wapato Canal 106.7 Sunnyside Diversion Dam 103.8
Parker Stream-gaging Station ‐‐ 103.7 Marion Drain 83.2
Granger Drain 82.8 Toppenish Creek 80.4
Satus Creek 69.6 Sulphur Creek Wasteway 61.0
Euclid Stream-gaging Station ‐‐ 55.0 Chandler Diversion Dam @ Prosser 47.2
Spring Creek/Snipes Creek 41.8 Chandler Power Return 35.8
Kiona Stream-gaging Station ‐‐ 29.9 Horn Rapids Diversion Dam 18.0 Columbia River Confluence ‐‐ 0

Yakima Pesticides/PCBs TMDL: Vol 1, WQ Study Findings Page 18
Four hydrologic points of particular importanceb are: 1. Roza Diversion Dam (r.m. 127.9) Located at the bottom of the Yakima River Canyon about 10 miles north of the city of Yakima, the Roza Diversion serves approximately 72,500 acres of irrigated land on the northeast side of the lower valley. About half of the water diverted to Roza Canal is used for hydropower generation and returned to the river with little change in pollutant loading at r.m. 113.3 in Yakima. 2. Naches River Confluence (r.m. 116.3) The Naches River is a major tributary to the lower Yakima River. It meets the Yakima about 12 miles downstream of Roza Dam in Yakima. There are several major tributaries and irrigation returns in the reach between the Naches confluence and Union Gap including Wide Hollow Creek, Ahtanum Creek, and Moxee Drain. The Naches River supplies fairly high-quality water. Since 1981, the contribution of the Naches and Yakima Rivers to the lower basin has been manipulated during the irrigation season to accommodate the needs of irrigators and fishery managers. In general, upper Yakima River reservoirs are used to meet June to August irrigation needs, while Naches River reservoirs are used for September and October. The “flip-flop” allows flow regimes in the upper Yakima River for spring chinook salmon egg survival. 3. Wapato and Sunnyside Valley District Diversions (r.m. 103.8 and 106.7) Located near Parker (r.m. 103.7), these two irrigation districts divert half to three-fourths of the water available below the city of Yakima. The Wapato Irrigation Project diverts up to 2,000 cubic feet per second (cfs) to serve 136,000 acres of irrigated land on the Yakama Reservation. The Sunnyside Valley Irrigation District (SVID) diverts up to 1,280 cfs to serve 103,500 acres between the river and Roza Irrigation District lands. In many past years, nearly all of the water in the Yakima River mainstem was diverted for irrigation by the time it passed the SVID diversion, leaving the reach immediately downstream dewatered and nearly dry. This became a concern among fishery and water resource managers. Instream flow limits were established in 1994, setting a minimum target of 300 cfs that would remain in the river and maintain flow through fish ladders and around irrigation diversions. The remaining 103 miles of Yakima River in the lower basin slowly recover some of the water diverted for irrigation through surface and subsurface returns. The most numerous and largest tributaries and irrigation returns are located between Parker and the Euclid streamflow gauge near Grandview (r.m. 55.0). Major inflows to this reach are: Granger Drain, Marion Drain, Toppenish Creek, Satus Creek, and Sulphur Creek Wasteway. One additional large return, Spring Creek, is located downstream of Euclid below Prosser.
b This information taken from Joy and Patterson (1997), USBR Hydromet website www.usbr.gov/dataweb/html/yakima.html, Coffin et al. (2006), and Morace et al. (1999).

Yakima Pesticides/PCBs TMDL: Vol 1, WQ Study Findings Page 19
Chandler Diversion is a significant control point at Prosser. It creates the Prosser pool, a major change point in river morphology and hydrology. The Chandler Power Return is a large input of water between Spring Creek and Kiona. 4. Kiona (r.m. 29.9) There is a long-term stream-gaging station at Kiona (Benton City). Upstream of this point, the majority of the large irrigation diversions and returns have occurred. The Yakima River from Kiona to the mouth has a few additional diversions and returns, but no gaging station is located in the final 30-mile reach. The Columbia and Richland Canals are the most significant diversions. They occur at Horn Rapids (Wanawish) Dam (r.m. 18.0). The last significant irrigation return is Amon Wasteway at r.m. 2.1.
Previous Water Quality Studies Yakima River water quality was investigated in the 1970s, with several studies evaluating sediment loading (CH2M Hill, 1975; Boucher, 1975; Soil Conservation Service, 1978; Corps of Engineers, 1978; Ecology, 1979; Nelson, 1979; Boucher and Fretwell, 1982; and Molenaar, 1985). This work showed irrigation practices directly affected suspended sediment in the river. Peak concentrations occurred in April through June when streamflows were high and freshly tilled fields were being irrigated. Suspended sediment loads began to increase rapidly below the confluence of Moxee Drain (r.m. 107), a major irrigation return in Union Gap near Yakima. In 1986, the Yakima River basin was selected as one of four surface-water pilot studies for the USGS National Water-Quality Assessment (NAWQA) Program. Data collected from 1987-1991 provide a baseline characterization of suspended sediment, pesticides, nutrients, trace elements, and aquatic life in Yakima River streams. A special NAWQA study was conducted in the Yakima during 1999-2000 to monitor water quality trends and evaluate transport of agricultural chemicals and their effects on stream ecosystems. NAWQA results are reported by McKenzie and Curtiss (1989), Rinella et al. (1999), Morace et al. (1999), Ebbert and Embrey (2002), Ebbert et al. (2002), Fuhrer et al. (2004), and others. USGS concluded that “agricultural drains in the mid and lower valleys were found to be significant sources of nutrients, suspended sediment, pesticides, and fecal indicator bacteria.” NAWQA showed the highest detection frequencies and concentrations of pesticides generally occur during irrigation season. Their findings indicated pesticides that persist in soil, such as DDT, continue to be transported in streams and drains throughout the year, especially during storm runoff or snowmelt. Groundwater inputs are also potential pesticide sources, including chlorinated pesticides normally associated with suspended sediment. DDT compounds, for example, have been detected in wells in the Toppenish and Sulphur subbasins of the lower Yakima River (Rinella et al., 1999). A recent Ecology study found the highest dieldrin levels in Wide Hollow Creek near Union Gap occurred after the irrigation season. Dieldrin was inversely correlated with

Yakima Pesticides/PCBs TMDL: Vol 1, WQ Study Findings Page 20
discharge and positively correlated with conductivity, suggesting subsurface flow is a source in this area (Johnson and Burke, 2006). The U.S. Fish and Wildlife Service began routine monitoring of organochlorine compounds in Yakima River fish in the 1970s (see Schmitt et al., 1990). They found high concentrations of several chlorinated pesticides including DDT and dieldrin. PCBs were also detected. Ecology followed up on the pesticide findings in 1985 (Johnson et al., 1986, 1988). A number of creeks and irrigation returns were identified as pesticide sources. These include Wilson Creek in the upper Yakima basin and Moxee Drain, Granger Drain, Sulphur Creek Wasteway, and Spring Creek in the lower Yakima basin. NAWQA confirmed continued high concentrations of total DDT in resident lower Yakima River fish (Rinella et al., 1993). Fish communities were characterized as being severely impaired “associated with high levels of pesticides in fish tissues and the presence of external anomalies on fish.” In 1993 the Washington State Department of Health (WDOH) issued an advisory that recommended limiting consumption of bottom fish from the lower Yakima River due to the high levels of total DDT (WDOH, 1993; www.doh.wa.gov/ehp/oehas/fish). Because of the NAWQA studies and WDOH advisory, Ecology prioritized suspended sediment TMDLs to reduce DDT and other pesticide loading to the Yakima River.

Yakima Pesticides/PCBs TMDL: Vol 1, WQ Study Findings Page 21
Existing Yakima River TMDLs
A number of TMDLs have been approved or are underway in the Yakima River basin including TMDLs for fecal coliform bacteria, temperature, ammonia, chlorine, suspended sediment, and chlorinated pesticides (www.ecy.wa.gov/programs/wq/tmdl/watershed/index.html). The present 2007-08 study builds on results achieved through the two suspended sediment and chlorinated pesticide TMDLs, described below.
Lower Yakima River Suspended Sediment and DDT TMDL In 1998, a TMDL was established for suspended sediment in the lower Yakima River to bring it into compliance with water quality criteria for turbidity and DDT. The basic premise behind this TMDL was that suspended sediment from erosion of farm soils was the primary source of DDT and other chlorinated pesticides introduced to the river at levels that adversely affected aquatic life and cause an increased health risk to people consuming fish. Suspended sediments – measured as total suspended solids (TSS) – also cause excessive turbidity in the Yakima River, its tributaries, and irrigation returns. The combined effects of high TSS, turbidity, and pesticides degrade fish and wildlife habitat. Threatened and endangered salmonids are a particular concern. The field study for the Lower Yakima River Suspended Sediment and DDT TMDL was conducted by Ecology during 1994-1995 (Joy and Patterson, 1997). The schedule adopted for meeting water quality targets developed through the TMDL is shown in Table 5.
Table 5. Summary of Lower Yakima River TMDL Schedule.
Year Target Applies To
2002 < 5 NTU* increase above background Mainstem 25 NTU Mouths of all tributaries and drains
2007 25 NTU All points within tributaries and drains Develop strategy to meet DDT human health criteria
All tributaries, drains, and the mainstem 2012† 7 mg/L TSS (to meet chronic aquatic life criterion) 2015 DDT human health criteria to be met in fish and water
*nephelometric turbidity units. †target to be re-evaluated in 2007.
According to the schedule, the lower Yakima River mainstem was to be in compliance with the Washington State turbidity standard by 2002. Tributaries and irrigation returns to the lower river were expected to meet a turbidity target of 25 NTU by 2007. A strategy to further reduce DDT levels in the river and meet human health criteria was to be developed the same year. By 2012, the mainstem and tributaries are to comply with a 7 mg/L target for TSS, which correlated with meeting the chronic aquatic life criterion for total DDT, 1 ng/L. This target was scheduled to be re-evaluated in 2007. By 2015 the human health criteria for DDT compounds are to be achieved in fish and water.

Yakima Pesticides/PCBs TMDL: Vol 1, WQ Study Findings Page 22
Upper Yakima River Suspended Sediment and Organochlorine Pesticide TMDL Ecology conducted a similar TMDL addressing suspended sediment and organochlorine pesticides in the upper Yakima River in 1999 (Joy, 2002; Creech and Joy, 2002). In this context, the upper river is the reach from the headwaters to r.m. 121.7, just above the confluence with the Naches River. The major water quality impacts to the upper Yakima River are from Wilson Creek, which drains the Kittitas Valley. The TMDL schedule for the upper Yakima set goals for meeting DDT, dieldrin, and turbidity criteria in 2006 and 2011 (Table 6).
Table 6. Summary of Upper Yakima River TMDL Schedule.
Year Target Applies To
2006
DDT compounds and dieldrin to meet aquatic life criteria
Cherry Creek and Wipple Wasteway
DDT compounds to meet human health criteria in fish fillets
Mainstem
Monitor dieldrin in fish fillets to gauge progress toward meeting human health criteria
Mainstem
90th percentile turbidity < 10 NTU over background
Mainstem (r.m. 121.7 – 139.8) and mouths of selected tributaries
2011
DDT compounds and dieldrin to meet human health criteria in water
Mouths of Cherry Creek and Wipple Wasteway
Substantial progress made toward meeting human health target for dieldrin in fish fillets
Upper Yakima Basin
90th percentile turbidity < 5 NTU over background
Mainstem (r.m. 121.7 – 139.8) and mouths of selected tributaries

Yakima Pesticides/PCBs TMDL: Vol 1, WQ Study Findings Page 23
2006 Yakima River Fish Tissue Survey
In view of the existing TMDL schedules and 2004 303(d) listings, Ecology surveyed chlorinated pesticide, PCB, and dioxin levels in resident fish species throughout the Yakima River in 2006 (Johnson et al., 2007). The objectives were to verify that human health criteria were not met (exceeded), assess progress toward the TMDL fish tissue targets, and help determine how to address the 303(d) listings. Fifty-six composite fillet samples and 30 composite whole fish samples were analyzed, representing approximately 300 individual fish. Results for the chemicals of primary concern in the fish fillets are summarized in Table 7 and compared to the human health criteria for fish consumption used for 303(d) listing (from the EPA National Toxics Rule). Concentrations that exceeded criteria are highlighted in bold font. DDT, DDD, and endosulfan concentrations were low and did not approach criteria (data not shown). Most of the DDT residues have broken down to DDE. Chlorpyrifos was not analyzed due to limited potential for bioaccumulation. The complete edible tissue data from the fish tissue survey are in Appendix D. There was a strong downstream trend in increasing concentrations of DDE, which is illustrated in Figure 5. Total PCB concentrations also increased going downstream, but the trend appeared less pronounced than seen for DDE (Figure 6). High concentrations of both DDE and PCBs were found in lower river carp, a species not encountered in the upper river. Dieldrin and toxaphene were primarily or exclusively detected in the lower river. Chlordane, alpha-BHC, and dioxin concentrations were low to undetectable in all areas.

Yakima Pesticides/PCBs TMDL: Vol 1, WQ Study Findings Page 24
Table 7. Mean Concentrations of Selected 303(d) Listed Compounds and Toxaphene in Composite Fillet Samples* from Yakima River Fish Collected in 2006 (ug/Kg wet weight, parts per billion; except ng/Kg, parts per trillion, for dioxin).
Reach Species N = DDE Dieldrin Chlordane Alpha-BHC Total PCBs Toxaphene Dioxin†
Upper Yakima River
Kachess Lake Sucker 3 0.83 0.40 U 0.40 U 0.40 U 2.0 U NA 0.030 UJ
Pike Minnow 3 3.7 0.40 U 0.40 U 0.40 U 16 J NA 0.030 UJ
Keechelus Lake
Sucker 3 2.2 0.38 U 0.38 U 0.40 U 13 J NA 0.030
Pike Minnow 2 2.6 0.40 U 0.40 U 0.40 U 17 J NA 0.030 UJKokanee 3 2.2 0.40 UJ 0.70 J 0.40 U 15 J NA 0.030 UJCutthroat 3 0.61 0.39 U 0.23 J 0.40 U 5.6 J 2.0 U 0.030 UJWhitefish 2 0.73 0.39 U 0.39 U 0.40 U 9.6 J NA 0.030 UJ
Cle Elum Sucker 2 7.1 0.39 U 0.41 J 0.40 U 9.5 J 5.0 U 0.030 UJ
Pike Minnow 3 11 0.39 U 0.57 J 0.40 U 4.9 J 5.0 U 0.030 UJWhitefish 3 10 0.40 UJ 2.0 J 0.40 U 16 2.0 U 0.15
Yakima Canyon Sucker 3 12 0.93 1.1 J 0.40 U 9.4 J 5.0 U 0.030 UJ
Pike Minnow 3 31 0.77 2.3 J 0.40 U 24 2.0 U 0.030 UJWhitefish 3 34 0.35 J 2.9 J 0.40 U 24 2.0 U 0.030 UJ
Lower Yakima River
Toppenish Sucker 3 63 0.99 J 0.59 J 0.40 U 13 5.0 U 0.03 UJ
Pike Minnow 3 113 0.81 0.74 J 0.40 U 16 7.0 0.03 UJWhitefish 3 100 1.3 J 2.0 J 0.40 U 28 11 0.24
Prosser Sucker 3 100 2.3 J 0.68 J 0.39 U 16 J 14 J 0.03 J
Smallmouth Bass 2 38 0.74 J 0.39 U 0.39 U 4.0 J 8.4 J 0.03 UJCarp 3 500 0.59 J 10 0.39 U 88 56 J 0.03 UJ
Horn Rapids
Sucker 3 82 0.95 1.8 J 0.40 U 34 10 J 0.03 UJPike Minnow 3 78 2.7 J 0.56 U 0.40 U 7.9 J 17 J 0.10 J
Smallmouth Bass 3 54 0.79 0.99 U 0.39 U 18 1.9 U 0.03 UJCarp 3 520 1.3 J 5.3 J 0.40 U 96 55 J 0.03 UJ
303(d) Human Health Criteria 32 0.65 8.0 0.51 5.3 9.6 0.07Bold values exceed human health criteria. U = not detected. J = estimated value. UJ = not detected; detection limit is an estimate. NA = not analyzed. *4-5 fish per composite, except 8-15 for dioxin. †Dioxin analyzed in one composite per species per location.
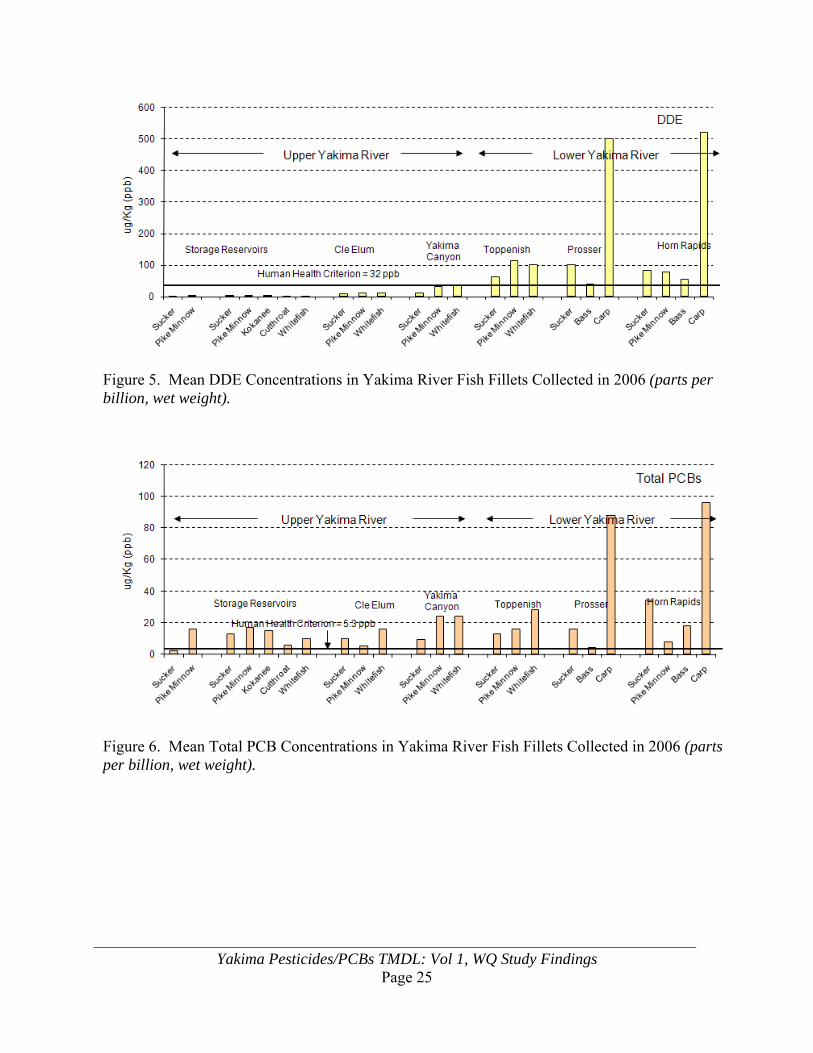
Yakima Pesticides/PCBs TMDL: Vol 1, WQ Study Findings Page 25
Figure 5. Mean DDE Concentrations in Yakima River Fish Fillets Collected in 2006 (parts per billion, wet weight).
Figure 6. Mean Total PCB Concentrations in Yakima River Fish Fillets Collected in 2006 (parts per billion, wet weight).

Yakima Pesticides/PCBs TMDL: Vol 1, WQ Study Findings Page 26
Overall, results of the 2006 fish tissue survey demonstrated the following:
Upper Yakima River fish are meeting or very close to meeting human health criteria for DDT, DDE, DDD, dieldrin, chlordane, alpha-BHC, endosulfan, toxaphene, and dioxin.
PCBs exceed human health criteria in the Keechelus and Kachess storage reservoirs and throughout the Yakima River, with slightly to substantially higher levels in the lower river, depending on species and location.
Most lower Yakima River fish species exceed human health criteria by factors of 2 to 4 for DDE and dieldrin, and factors of 2 to 6 for PCBs. Carp are more contaminated than other lower river species. This is likely due to their greater fat content and age of the fish analyzed.
Chlordane, alpha-BHC, and endosulfan are meeting human health criteria in lower river fish, except for carp which marginally exceed the chlordane criterion in the Prosser area.
Dioxin levels are low throughout the river, slightly exceeding human health criteria in a few cases.
Some lower river fish species exceed human health criteria for toxaphene. Toxaphene, a legacy chlorinated pesticide, is difficult to analyze and has probably been under-reported in the past.
Based on these findings, Ecology concluded that the TMDL effort to address the current Yakima River 303(d) listings should focus on pesticides and PCBs in the lower Yakima River, but include some PCB and toxaphene work in the upper river as well. A one-year field study was initiated in 2007 to obtain water quality data on these chemicals. In view of the low dioxin concentrations in Yakima River fish and due to budget constraints, dioxin was not analyzed in the water quality study. Ecology plans to address dioxins on a larger scale (possibly region- or state-wide) in the future. Additionally, because dioxins are often carried via air and can pollute sizeable areas not necessarily limited to watersheds, a larger TMDL footprint will likely be more effective and efficient.

Yakima Pesticides/PCBs TMDL: Vol 1, WQ Study Findings Page 27
Goals and Objectives of the 2007-08 Water Quality Study
Goals The water quality study was conducted to aid in developing a Pesticides and PCBs TMDL for the Yakima River. The goals of the study were to:
1. Identify current sources and quantify loadings of 303(d) listed pesticides, PCBs, toxaphene, suspended sediment, and turbidity to the Yakima River.
2. Recommend numeric water quality targets that will result in the Yakima River and its tributaries and irrigation returns meeting Washington State water quality standards for the pollutants of concern.
3. Determine the Yakima River’s loading capacity for these pollutants.
4. Compare existing water quality conditions to targets set by the Upper Yakima River Suspended Sediment and Organochlorine Pesticide TMDL and the Lower Yakima River Suspended Sediment and DDT TMDL.
Objectives Specific objectives of the water quality study were to: 1. Monitor 303(d) listed pesticides, suspended sediment, and turbidity in the lower Yakima
River, Naches River, and major lower river irrigation returns.
2. Obtain screening-level data on 303(d) listed pesticides, suspended sediment, and turbidity in other lower Yakima River tributaries and returns.
3. Estimate background concentrations of PCBs and toxaphene in the upper and lower Yakima River and identify source areas.
4. Investigate municipal wastewater treatment plant effluent as a potential source of 303(d) listed pesticides and PCBs.
5. Determine if wastewater from fruit packers and vegetable processors is a source of 303(d) listed pesticides.
6. Characterize 303(d) listed pesticide, PCB, suspended sediment, and turbidity levels in urban stormwater runoff.

Yakima Pesticides/PCBs TMDL: Vol 1, WQ Study Findings Page 28
This page is purposely left blank

Yakima Pesticides/PCBs TMDL: Vol 1, WQ Study Findings Page 29
Study Design
The water quality study area included the Yakima River and selected tributaries and irrigation returns from Easton (r.m. 202.5) to the Columbia River confluence. Most of the effort was concentrated in the lower Yakima River due to the greater number of 303(d) listings and because a TMDL for suspended sediment and chlorinated pesticides had already been approved for the upper Yakima River. Table 8 gives an overview of the sampling design, showing the types of samples collected, general locations, sampling frequency, and how the samples were analyzed. Field work was initiated in April 2007 and completed in June 2008. Over 400 surface water and wastewater samples were collected. The samples were analyzed for all chlorinated pesticides and PCBs that have been reported in water, fish, or sediment samples from the Yakima River drainage. The chlorinated pesticide analysis was expanded to include chlorpyrifos, an organophosphorus insecticide. Suspended sediment (measured as total suspended solids) and turbidity were analyzed in all samples. The study was conducted by the Ecology Environmental Assessment Program and Central Regional Office (CRO) Yakima River TMDL Team. Samples were analyzed by the Ecology Manchester Environmental Laboratory or an accredited laboratory selected by Manchester. The study followed a Quality Assurance Project Plan (Johnson, 2007a) prepared according to the Ecology guidance in Lombard and Kirchmer (2004).

Yakima Pesticides/PCBs TMDL: Vol 1, WQ Study Findings Page 30
Table 8. Summary of Sampling Design for the 2007-08 Water Quality Study.
Task Lower River
Upper River
Location (Number of Sites)
Frequency
Pes
tici
des
PC
Bs
Sus
p. S
edim
ent
Tur
bidi
ty
Con
duct
ivity
Org
anic
Car
bon
Surface Water Routine Monitoring x Mainstem (4) Naches R. (1) Returns (4) 1-2 per Month
Screening Survey x Other Tributaries and Returns (23) Quarterly
SPMD Deployments† x x Mainstem (6) Naches R. (1) Returns (5) Twice
Permitted Discharges
Wastewater Treatment Plants x x Cle Elum to West Richland (18) Quarterly *
Fruit & Vegetable Processors x Selah, Yakima, Sunnyside, Prosser (6) Quarterly
Urban Stormwater Runoff x x Yakima (5) Ellensburg (4) 4-6 Storms *
* Pesticides not analyzed for upper river effluent or stormwater samples. †Semipermeable Membrane Device: a passive sampler used in this study for detecting PCBs and toxaphene.

Yakima Pesticides/PCBs TMDL: Vol 1, WQ Study Findings Page 31
Surface Water Pesticides, Suspended Sediment, and Turbidity A two-tiered approach was used for measuring 303(d) pesticides, suspended sediment, and turbidity levels in surface waters of the lower Yakima River. Routine monitoring was conducted at mainstem stations, tributaries, and irrigation returns that were the focus of monitoring efforts for the earlier Suspended Sediment and DDT TMDL. A more limited screening survey was conducted for other tributaries and returns deemed to have potential for contamination. Due to the high cost of detecting PCBs and toxaphene in whole water samples, these compounds were addressed in a separate effort (see PCBs and Toxaphene, page 36). Routine Monitoring Four mainstem stations, the Naches River, and four major irrigation returns to the lower Yakima River were monitored intensively, twice a month during the irrigation season (April – October 2007 samples) and monthly during the winter (November 2007 – March 2008 samples). Table 9 lists the monitoring sites. Sampling locations are shown in Figure 7.
Table 9. Routine Monitoring Stations in the Lower Yakima River Drainage during 2007-08.
Name and Location River Mile Bank*
Yakima River at Harrison Bridge 121.7 - - Naches River at mouth 116.3 RB Moxee Drain at Birchfield Road 107.3 LB
Yakima River at Parker Bridge 104.6 - - Granger Drain at sheep barns in Granger 82.8 LB Sulphur Creek Wasteway at Holaday Road 61.0 LB
Yakima River at Euclid Bridge 55.0 -- Spring Creek near mouth 41.8 LB
Yakima River at Kiona-Benton City Bridge 29.8 -- *signifies a right or left bank tributary, as seen facing downstream.
The Yakima River at Harrison Bridge and the Naches River represent background water quality conditions for the lower Yakima. The Naches River supplies fairly high-quality water to the irrigation system and has relatively few point sources. The Naches is the larger source of water to the lower Yakima River during the September - October flip-flop when flows in the upper Yakima are reduced to prevent de-watering of salmon redds (nests). The mainstem Yakima River stations at Harrison, Parker, Euclid, and Kiona bracket the major irrigation returns and urban centers.

Yakima Pesticides/PCBs TMDL: Vol 1, WQ Study Findings Page 32
Figure 7. Routine Monitoring Stations in the Lower Yakima River for 2007-08.
The four irrigation returns monitored – Moxee Drain, Granger Drain, Sulphur Creek Wasteway, and Spring Creek – were selected in the previous TMDL as representative of irrigation return water that enters the lower Yakima River. They are specifically identified as priority returns in the TMDL five-year targets. Snipes Creek, also on the 303(d) list, is a tributary to Spring Creek. The routine monitoring effort provided 14 sets of results for the irrigation season and five sets of results for the non-irrigation season. Extra weight was given to the irrigation season because pesticides are most frequently detected during this period. The previous TMDLs had concluded that the irrigation season was the “critical period.” An extra set of samples was collected from the four returns in late March at the start of the 2008 irrigation season.

Yakima Pesticides/PCBs TMDL: Vol 1, WQ Study Findings Page 33
Screening Survey Numerous other tributaries and irrigation returns enter the lower Yakima River but have either never been sampled for pesticides or the samples have not been analyzed down to human health criteria levels. Twenty-three of these discharges were sampled on a quarterly basis for the present study, starting in May 2007 and ending in February 2008 (Table 10). Figure 8 shows their locations. This screening survey provided two sets of results each for the irrigation and non-irrigation seasons.
Table 10. Lower Yakima River Tributaries and Irrigation Returns Screened for Pesticides during 2007-08.
Name and Location River Mile Bank*
Selah Creek at Canyon Road 123.7 LB
Wenas Creek at Wenas Road 122.4 RB
Selah Ditch at confluence with Taylor Ditch 117.1 RB
Taylor Ditch at confluence with Selah Ditch 117.1 RB
Cowiche Creek (Naches tributary) at Powerhouse Road - - - -
Wide Hollow Creek at Main Street 107.4 RB
Ahtanum Creek at Fullbright Park† 106.9 RB
Zillah Drain at 1st Street, Zillah (Joint Drain 14.6) ~89 LB
East Toppenish Drain at Annahat & Blue Heron Road† 86.0 RB
Subdrain 35 at Connie Road† 83.2 RB
Marion Drain at Indian Church Road† 82.6 RB
Toppenish Creek at Indian Church Road† 80.4 RB
Coulee Drain at Satus Longhouse Road† 77.0 RB
Satus Creek at Satus Longhouse Road† 60.2 RB
South Drain at Highway 22† 69.3 RB
DID #7 at Green Valley Road 65.1 LB
Satus Drain #302 at Highway 22† 60.2 RB
Satus Drain #303 at Highway 22† ~60 RB
Drain #31 at Sunnyside-Mabton Highway 58.0 LB
Grandview Drain at Chase Road 55.8 LB
Wauna Ditch (Drain 52.8) at Wamba Road 47.2 LB
Corral Canyon Creek at Old Inland Empire Highway 33.5 LB
Amon Creek Wasteway near mouth 2.1 RB
*signifies a right or left bank tributary, as seen facing downstream. †Yakama Reservation.

Yakima Pesticides/PCBs TMDL: Vol 1, WQ Study Findings Page 34
Figure 8. Lower Yakima River Tributaries and Irrigation Returns Screened for Pesticides during 2007-08.
A large number of tributaries and returns were screened to avoid overlooking significant sources of contamination. The sites selected for sampling were recommended by Joe Joy, Ecology’s lead investigator for the previous TMDL; the CRO Yakima River TMDL Team; and Marie Zuroske of the South Yakima Conservation District. Two of the creeks – Cowiche and Wide Hollow – are currently 303(d) listed for several pesticides. The same parameters were analyzed in the screening survey as in the routine monitoring effort. Ecology obtained permission to collect samples from tributaries and returns on the Yakama Reservation. Sample Collection and Analysis Routine monitoring and screening survey samples were analyzed for pesticides at detection limits of sub-parts per trillion, much lower than in previous Yakima River studies. The depth-integrating samplers often used in the past are not designed for low-level analyses. They are difficult to clean adequately and have an increased chance of introducing contamination in an agricultural setting. The surface water pesticide samples for the present study were composites from quarter-point transects collected directly into appropriately cleaned glass bottles.

Yakima Pesticides/PCBs TMDL: Vol 1, WQ Study Findings Page 35
The bottles were raised and lowered through the water column to approximate the width-depth integrated method, either by hand or by placing a sample bottle in a weighted holder. This same technique is being used by Ecology to monitor current-use pesticides in lower Yakima River irrigation returns (Burke et al., 2006). Suspended sediment and turbidity samples were collected using these same procedures, except for routine monitoring samples during the irrigation season (see Effectiveness Monitoring below). Studies conducted in the Yakima River have shown that both sampling techniques produce similar results. Hallock (2005) compared TSS, turbidity, and other water quality data obtained for the Yakima River at Kiona using Ecology collected single-point surface grabs vs. USGS collected width-depth integrated samples. Only sediment measures were significantly different overall, and even for this constituent the difference was small. Hallock pointed out that some of the difference in sediment results was attributable to the analytical method. The SSC analysis method used by USGS yields significantly higher results than the TSS method used by Ecology, even when collection methods are the same. A similar comparison was conducted for a range of sites sampled during the Lower Yakima River Suspended Sediment and DDT TMDL. There were no significant differences between TSS or other results from simple grabs and integrated samples (Joy and Patterson, 1997). The routine and screening survey samples from 2007-08 were analyzed for 303(d) pesticides, TSS, turbidity, and conductivity. To differentiate between suspended matter derived from plant material vs. other sources, a total non-volatile suspended solids (TNVSS) analysis was included. Pesticides analysis was by gas chromatography/electron capture detection (GC/ECD). A large volume injection (LVI) technique was used to achieve low detection limits for comparison with human health criteria. Target compounds for pesticide analysis of surface water are listed in Appendix E. Effectiveness Monitoring The routine monitoring task also provided data for effectiveness monitoring that was required in 2007 by the current TMDLs. The objective of effectiveness monitoring is to determine if Best Management Practices (BMPs) implemented in response to the TMDL are achieving the required water quality improvements. Effectiveness monitoring for the Lower Yakima River Suspended Sediment and DDT TMDL was first conducted in 2003 and consisted of twice-a-month samples for TSS and turbidity throughout the irrigation season in the mainstem and priority irrigation returns (Coffin et al., 2006). A similar set of samples was collected in 2007. A depth-integrating sampler was used to be consistent with 2003 procedures. The schedule for the Upper Yakima River Suspended Sediment and Organochlorine Pesticide TMDL called for effectiveness monitoring during the 2006 irrigation season. Suspended sediment and chlorinated pesticide inputs from the Wilson Creek drainage are the focus of that effort. The Kittitas County Water Purveyors, Kittitas County Conservation District, and Ecology conducted the required suspended sediment and turbidity monitoring in 2006 (Anderson, 2008), but postponed pesticide monitoring to 2007. These pesticide samples were collected during field work for the present study and employed the same methods as in the lower river (Coffin and Johnson, 2007).

Yakima Pesticides/PCBs TMDL: Vol 1, WQ Study Findings Page 36
Ecology’s Freshwater Monitoring Unit (FMU) conducted the 2007 effectiveness monitoring while assisting with the routine monitoring task. All of the data from the 2007 irrigation season that apply to effectiveness monitoring can be found in Appendix J. Reports evaluating the effectiveness of the existing TMDLs will be prepared separately by Ecology’s EAP Eastern Operations Section and CRO Yakima River TMDL Team. PCBs and Toxaphene PCBs and toxaphene are complex mixtures of hundreds of individual compounds which are difficult and expensive to analyze at low levels. The project budget did not allow enough water samples to be analyzed to give representative results for surface water. Although toxaphene was analyzed in the routine monitoring and screening survey samples, detection limits were high. Therefore, a passive sampling technique using a semipermeable membrane device (SPMD) was employed to provide estimates of PCB and toxaphene concentrations in surface water. A SPMD is composed of a thin-walled, layflat polyethylene tube filled with triolein, a neutral lipid material (Figure 9). When placed in water, dissolved lipophilic (fat soluble) compounds like PCBs and toxaphene diffuse through the membrane and are concentrated over time. The large chemical residues accumulated in a SPMD translate into detection limits down to parts per quadrillion in water. Because SPMDs measure the long-term average concentration of a chemical, random fluctuations are smoothed and representativeness of the data improved. Studies have shown that chemical concentrations derived from SPMDs are comparable to other more complex low-level sampling methods such as solid-phase and liquid-liquid extraction, generally agreeing within a factor of 2 (Ellis et al., 1995; Rantalainen et al., 1998; Hyne et al., 2004).
Figure 9. SPMD Membrane Mounted on a Spider Carrier.
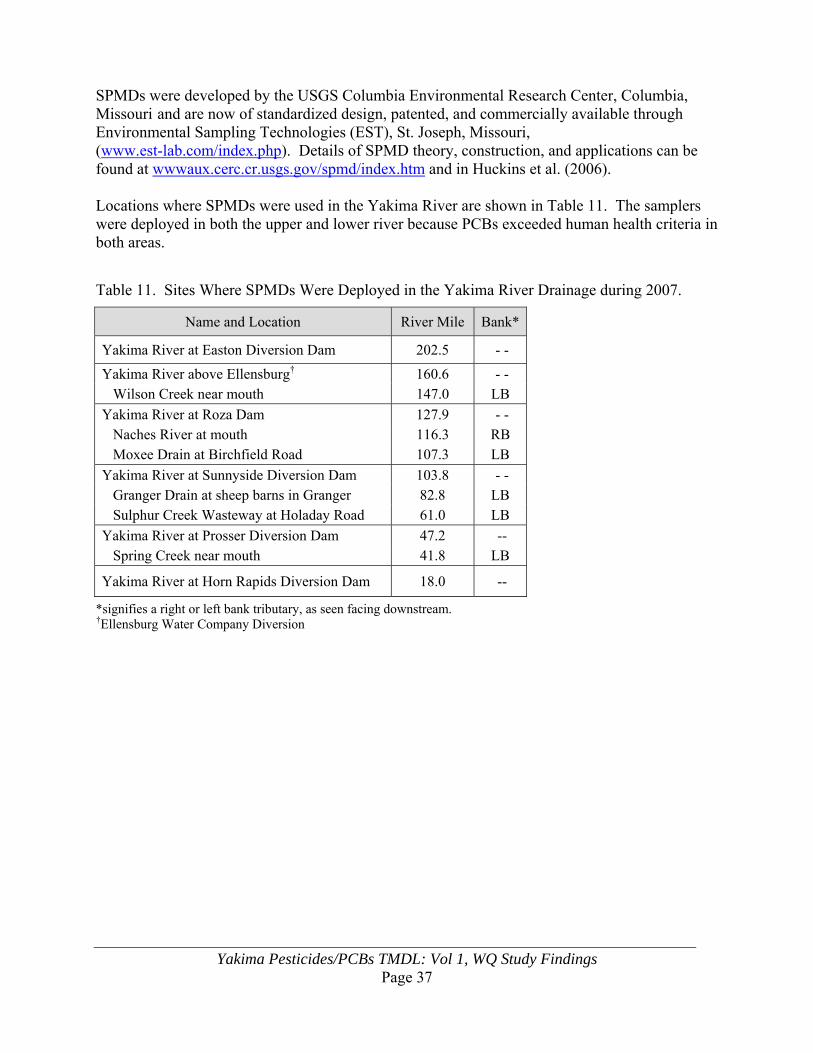
Yakima Pesticides/PCBs TMDL: Vol 1, WQ Study Findings Page 37
SPMDs were developed by the USGS Columbia Environmental Research Center, Columbia, Missouri and are now of standardized design, patented, and commercially available through Environmental Sampling Technologies (EST), St. Joseph, Missouri, (www.est-lab.com/index.php). Details of SPMD theory, construction, and applications can be found at wwwaux.cerc.cr.usgs.gov/spmd/index.htm and in Huckins et al. (2006). Locations where SPMDs were used in the Yakima River are shown in Table 11. The samplers were deployed in both the upper and lower river because PCBs exceeded human health criteria in both areas.
Table 11. Sites Where SPMDs Were Deployed in the Yakima River Drainage during 2007.
Name and Location River Mile Bank*
Yakima River at Easton Diversion Dam 202.5 - -
Yakima River above Ellensburg† 160.6 - - Wilson Creek near mouth 147.0 LB
Yakima River at Roza Dam 127.9 - - Naches River at mouth 116.3 RB Moxee Drain at Birchfield Road 107.3 LB
Yakima River at Sunnyside Diversion Dam 103.8 - - Granger Drain at sheep barns in Granger 82.8 LB Sulphur Creek Wasteway at Holaday Road 61.0 LB
Yakima River at Prosser Diversion Dam 47.2 -- Spring Creek near mouth 41.8 LB
Yakima River at Horn Rapids Diversion Dam 18.0 --
*signifies a right or left bank tributary, as seen facing downstream. †Ellensburg Water Company Diversion

Yakima Pesticides/PCBs TMDL: Vol 1, WQ Study Findings Page 38
SPMDs were placed at three upper river sites (Figure 10). The Easton Diversion Dam site below Keechelus Lake and Kachess Lake was intended to provide an estimate of the PCB and toxaphene background in the upper mainstem. The other two upper river SPMDs were placed in a mainstem diversion above Ellensburg (Ellensburg Water Company diversion) and at the mouth of Wilson Creek. Wilson Creek drains the Ellensburg area and Kittitas Valley. This is the most developed urban/agricultural area in the upper river and, thus, has the greatest potential to be a source of contamination.
Figure 10. Sites Where SPMDs Were Deployed in the Upper Yakima River during 2007.

Yakima Pesticides/PCBs TMDL: Vol 1, WQ Study Findings Page 39
The lower river SPMD sites were the same as or close to the routine monitoring stations (Figure 11). SPMDs were deployed at the Roza, Sunnyside, Prosser, and Horn Rapids diversion dams rather than the Harrison, Parker, Euclid, and Kiona bridges, because these were not secure locations to leave the samplers. In all cases, the SPMDs were placed above the dams.
Figure 11. Sites Where SPMDs Were Deployed in the Lower Yakima River during 2007.

Yakima Pesticides/PCBs TMDL: Vol 1, WQ Study Findings Page 40
SPMDs were deployed during the first part of the 2007 irrigation season (approximately May 8 – June 5) and again after the end of the irrigation season (approximately October 30 –November 26). Figure 12 shows the flow regime during these periods. The May-June deployment occurred while flows were decreasing in the Yakima River and increasing or near maximum in the tributaries and returns. The reverse was true during October-November after irrigation water had been turned off.
Figure 12. Monthly Average Flow near Selected SPMD Sites during 2007. (USBR Yakima Hydromet data www.usbr.gov/pn/hydromet/yakima)
Each deployment lasted approximately one month. Water samples were taken at the beginning, middle, and end of each deployment and analyzed for total and dissolved organic carbon (TOC and DOC). The organic carbon data were used to calculate total water column concentrations for the chemicals of interest. Start and end dates for each site are in Appendix F. The ancillary water quality data are in Appendix G. The Wilson Creek SPMD extract for PCB analysis from May-June 2007 was lost in a laboratory accident and re-deployed in 2008 during the same time period. Toxaphene analysis was not affected. A review of water quality data for Wilson Creek, provided by the Kittitas County Water Purveyors, showed slightly higher turbidity during the 2008 deployment, averaging 21 NTU vs. 15 NTU in 2007 (N= 4-5; Kathleen Satnik personal communication). Discharge compared closely between the two periods, averaging 545 vs. 556 cfs. The SPMDs extracts were analyzed for PCBs using high resolution gas chromatography/mass spectrometry (HRGC/MS) to achieve low detection limits. Toxaphene was analyzed by GC/ECD. The methods used to derive water column concentrations from the PCB and toxaphene residues accumulated in the SPMDs are described in Appendix H.
0
50
100
150
200
250
300
350
400
450
0
1000
2000
3000
4000
5000
6000
7000
8000
9000
10000
Jan Feb Mar Apr May Jun Jul Aug Sep Oct Nov Dec
Trib
utar
ies
(cfs
)
Yak
ima
Riv
er (
cfs)
Yakima nr Umtanum Yakima nr. Parker Yakima @ Kiona
Wilson Cr. Moxee Drain Sulphur Cr.
Spring Deployment Fall Deployment

Yakima Pesticides/PCBs TMDL: Vol 1, WQ Study Findings Page 41
Permitted Discharges One of the mechanisms for achieving goals of the Clean Water Act is the National Pollutant Discharge Elimination System (NPDES). EPA has authorized Washington State to administer the NPDES permit program in Washington. Chapter 90.48 RCW defines Ecology's authority and obligations in issuing wastewater discharge permits. An NPDES permit must be issued before discharge of wastewater to waters of the state is allowed. The permits establish effluent limits, monitoring schedules, and other requirements. Three types of municipal/industrial wastewater discharges that come under NPDES are potential sources of pesticides and PCBs to the Yakima River: municipal wastewater treatment plants, fruit packers and vegetable processors, and urban stormwater runoff. Municipal Wastewater Treatment Plants Wastewater treatment plant (WWTP) effluent is not often analyzed for pesticides or PCBs at levels approaching human health criteria. In the several instances where this has been done in other parts of Eastern Washington, results have shown water quality criteria are often not met (exceeded) for PCBs, but infrequently or not substantially exceeded for pesticides (e.g., Lubliner, 2009; Johnson et al., 2004; Serdar, 2003). In August 1999, USGS analyzed pesticides and PCBs in seven municipal WWTPs that discharge to the Yakima River between Cle Elum and Prosser (Ebbert and Embrey, 2002). Except for trace amounts of lindane, chlorinated pesticides were not found at detection limits down to 1-4 ng/L (parts per trillion). PCBs were not detected at or above 100 ng/L. The human health criteria are considerably lower than the levels analyzed: <1 ng/L for most pesticides and 0.17 ng/L for PCBs. Twenty-onec municipal WWTPs currently discharge to the Yakima River or its tributaries (Table 12, Figure 13). Final effluents from 18 of these facilities were monitored on a quarterly basis for the 2007-08 water quality study. The three remaining WWTPs — Wapato, Harrah, and Toppenish — are on the Yakama Reservation and under EPA jurisdiction. These facilities were not sampled. The effluent samples were collected as composites taken over a two-day period. Effluent data obtained by Ecology at other WWTPs have shown little variation in PCB concentrations over two days (Golding, 2002). Each composite consisted of four grabs: two in the morning and two in the afternoon. Effluent flow is greater in the morning, but the effluent is more concentrated in the afternoon. The grabs were hand collected to avoid contamination that could occur with an automatic sampler.
c Moxee WWTP ceased operating on June 26, 2008; the wastewater now goes to the Yakima WWTP.

Yakima Pesticides/PCBs TMDL: Vol 1, WQ Study Findings Page 42
Table 12. Wastewater Treatment Plants in the Yakima Basin.
Permit No. Facility Name NPDES Permit Expires
Receiving Water
Average Flow Maximum
Month (MGD)
Upper Yakima River
WA002193-8 Cle Elum 31-Aug-11 Yakima River at ~ r.m. 183 3.6 WA-002125-3 Kittitas 29-Feb-12 Cooke Creek to Wilson Creek 0.45 WA-002434-1 Ellensburg 30-Nov-10 Yakima River at r.m. 151.6 8.0
Lower Yakima River
WA0021032C Selah 29-Feb-12 Selah Ditch to Yakima R. at r.m. 117.1 2.0 WA0022586C Naches 30-Nov-12 Naches River 0.17 WA0052396A Cowiche 31-Mar-13 North Fork Cowiche Creek 0.44 WA0024023C Yakima 30-Jun-11 Yakima River at r.m. 110.1 21.5 WA0022501C Moxee† 31-Oct-07 DID #11 to Moxee Drain 0.15 WA0050229 Wapato* 31-Mar-10 Drainage Way #2 to Yakima River NA WA0052132C Buena 31-Aug-11 Unnamed trib to Yakima R. at r.m. 91.7 0.12 WA0022705 Harrah* 30-Sep-11 Harah Drain to Yakima River 0.055 WA0020168C Zillah 31-Oct-11 Yakima River at r.m. 89.5 0.49 WA0026123 Toppenish* 25-Nov-08 Toppenish Drain to Yakima River 1.9 WA0022691C Granger 31-Oct-13 Yakima River at r.m. 82.8 0.32 WA0020991C Sunnyside 30-Sep-13 Sulphur Cr. via Tributary 3.0 WA0052426A Port of Sunnyside** 28-Feb-10 Joint Control Drain 33.4 to Sulphur Cr. 0.55 WA0020648C Mabton 30-Apr-12 Yakima River at r.m. 59.7 0.19 WA0052205B Grandview 30-Nov-08 Yakima River at r.m. 55.2 5.0 WA0020800D Prosser 31-Oct-11 Yakima River at r.m. 46.5 1.8 WA0051349C Benton City†† 30-Nov-13 Yakima River ~r.m. 19 0.32 WA0051063C West Richland 31-Oct-12 Yakima River ~r.m. 9 0.75
*Yakama Indian Reservation; not sampled for present study. MGD = million gallons per day. †ceased operating in June 2008. NA = not available. **can land apply February through October. ††discharges to Yakima River only during cold weather months.

Yakima Pesticides/PCBs TMDL: Vol 1, WQ Study Findings Page 43
Figure 13. Wastewater Treatment Plants in the Lower Yakima River Basin.
The LVI procedure used for pesticides in surface water works poorly on WWTP effluent due to the presence of numerous interfering substances. Therefore, pesticides were analyzed in the effluent samples using solid phase extraction (SPE), a less sensitive technique. Reporting limits were approximately 2-5 ng/L for 303(d) pesticides and approximately 25 ng/L for toxaphene, higher than some of the water quality criteria. As a result, this effort constitutes a screening-level assessment of 303(d) pesticides and toxaphene in WWTP discharges to the Yakima River. Because data from other WWTPs suggest PCBs are a greater concern than pesticides, PCBs were analyzed by HRGC/MS to achieve detection limits consistent with the human health criteria. Effluent samples from the Cle Elum, Ellensburg, and Kittitas WWTPs were not analyzed for pesticides, since a TMDL has already been established for these compounds in the upper Yakima River, Target compounds for WWTP effluent are listed in Appendix I. Ancillary parameters included TSS, turbidity, and conductivity. Flow data were obtained from WWTP records.

Yakima Pesticides/PCBs TMDL: Vol 1, WQ Study Findings Page 44
Fruit Packers and Vegetable Processors Process water discharged from fruit packers and vegetable processors is a potential link between agricultural land that harbors pesticide residues and the Yakima River. Dust and soils that may contain pesticides are washed or otherwise removed from fruits, vegetables, and transport containers during processing and washed into wastewater systems. DDT, for example, has been detected in process water at fruit packing facilities in the Okanogan area (Gary Struthers Associates, 2005) Of the many fruit packers and vegetable processors in the lower Yakima Valley, only six discharge directly to surface waters (Table 13, Figure 14). This excludes those which discharge non-contact cooling water. All other facilities route their effluent to WWTPs or land apply. Process water from the six facilities listed below was collected quarterly using the same techniques as for the WWTPs. The samples were analyzed for pesticides (Appendix E), TSS, turbidity, and conductivity. Because of the increased potential for pesticides being present in these effluents, the samples were analyzed by LVI to achieve low detection limits. These types of facilities are not known to be PCB sources. Therefore, PCBs were not analyzed. Flow data were obtained from each facility.
Table 13. Fruit Packers and Vegetable Processors Monitored during 2007-08.
Permit No. Company / Facility Name Location Receiving Water
WAG 43-5126 Zirkle Fruit / Harrison Plant Selah Ditch to Taylor Ditch to Yakima River
WAG 43-5160 Apple King LLC / Apple King Facility Yakima
Gleed Ditch to Naches River WAG 43-5074 Gilbert Orchards Ditch to Stock Watering Pond WA-000056-6 Snokist Growers / Terrace Heights Cannery Yakima River at r.m. 113.0
WAG 43-5054 Andrus & Roberts Produce Sunnyside SVID Ditch to Yakima River
WA-002175-0 ConAgra Foods – Lamb Weston* Prosser Yakima River at r.m. 47.0
*Scheduled to close in May 2010; formerly Twin City Foods.

Yakima Pesticides/PCBs TMDL: Vol 1, WQ Study Findings Page 45
Figure 14. Fruit Packers and Vegetable Processors Monitored in the Lower Yakima River Basin during 2007-08.
Urban Stormwater Runoff In 2006, Ecology issued a draft version of the Phase II Municipal Stormwater Permit for Eastern Washington for public comment. The final permit became effective February 16, 2007. By EPA mandate in November 2002, a TMDL must address the pollutant loads from NPDES permitted stormwater discharge. Stormwater runoff can accumulate and transport pollutants such as pesticides, PCBs, and sediment via the stormwater conveyance system to receiving waters and thereby degrade water quality. The occurrence of these types of contaminants has been documented in several stormwater studies in other parts of Eastern Washington (Lubliner et al., 2006; Serdar et al., 2006; Parsons, 2007). Some of these data are presented later in this report. Phase II communities are identified under the rule as jurisdictions that: (1) own and operate a municipal separate storm sewer system (MS4), (2) discharge to surface waters, (3) are located in urbanized areas, and (4) have a population of greater than 10,000 and less than 100,000. Yakima basin cities that come under Phase II are Ellensburg, Selah, Yakima, Union Gap, urbanized portions of Yakima County, Sunnyside, West Richland, and Richland. Richland has one or two storm drains that run to the Yakima River and others that connect to Amon Creek Wasteway, but West Richland discharges to an irrigation canal that goes to the Columbia River near Finley.

Yakima Pesticides/PCBs TMDL: Vol 1, WQ Study Findings Page 46
Within the limited wet-weather season covered by the water quality study, it was impractical to obtain stormwater samples from all these cities. Eastern Washington storms usually have very little onset rainfall and a short duration single peak. The storms are also geographically sporadic. Low rainfall in Sunnyside and Richland, for example, makes it extremely difficult to catch storms. Therefore, stormwater sampling for the water quality study focused on characterizing pollutant levels in runoff from the Yakima/Union Gap and Ellensburg urban areas, with the intent of applying the results to other Phase II stormwater communities in the TMDL. Eight storm events were captured during the winter and spring of 2007-08. Two to five storm drains were sampled each time in Yakima/Union Gap and Ellensburg (Figures 15 and 16). To the extent possible, the drains sampled represented typical urban, commercial, and residential land uses. The field study for the Yakima Area Creeks Fecal Coliform TMDL identified a number of potential sampling sites around Yakima (Joy, 2005). The drains sampled in the present study were selected in consultation with the cities of Yakima and Ellensburg. Storm duration and intensity are likely the greatest factors in generating pollution. However, logistical restrictions effectively reduce most sampling efforts to grabs or manual composites at any given period during a storm. The stormwater samples for the present study consisted of either single grabs or a composite of two grabs collected 10-40 minutes apart, depending on the anticipated duration of stormwater influx. Many of these drains flow year-round, with base flows likely supplied by groundwater input. Sampling was delayed until turbid water began to flow. The stormwater samples were analyzed for pesticides (SPE, Appendix I), PCBs (HR GC/MS), TSS, turbidity, and conductivity. The Ellensburg samples were not analyzed for pesticides due to the existing TMDL for these compounds. Stormwater comes under NPDES regulation in three additional areas: Washington State Department of Transportation (DOT), construction projects, and industrial facilities. DOT highways and facilities are required to be covered under a MS4 permit. DOT controls the major roads and highways through the urbanized areas of the Yakima basin (e.g., U.S. Highways 97 and 12, Interstate 82, and State Route 24). Highway surfaces are significant contributors to stormwater runoff volume, but are not known to be significant sources of any of the 303(d) listed pesticides or PCBs. The NPDES Construction Stormwater General Permit covers soil disturbance for projects of one acre or more. These types of activities are potential sources of pesticides or PCBs when building on farm land or ground that has been otherwise contaminated. While no specific sampling was conducted for construction sites, the stormwater samples would include contributions from ongoing construction within the urban areas being monitored. Fifteen industries in the Yakima basin fall under the NPDES Industrial General Stormwater Permit. These include fruit packers, vegetable processors, manufacturing companies, industrial parks, log yards, air carriers, and transit. Selected fruit packers and vegetable processors were monitored through their wastewater. The other types of industries are not known as sources of pesticides or PCBs and thus were not monitored.
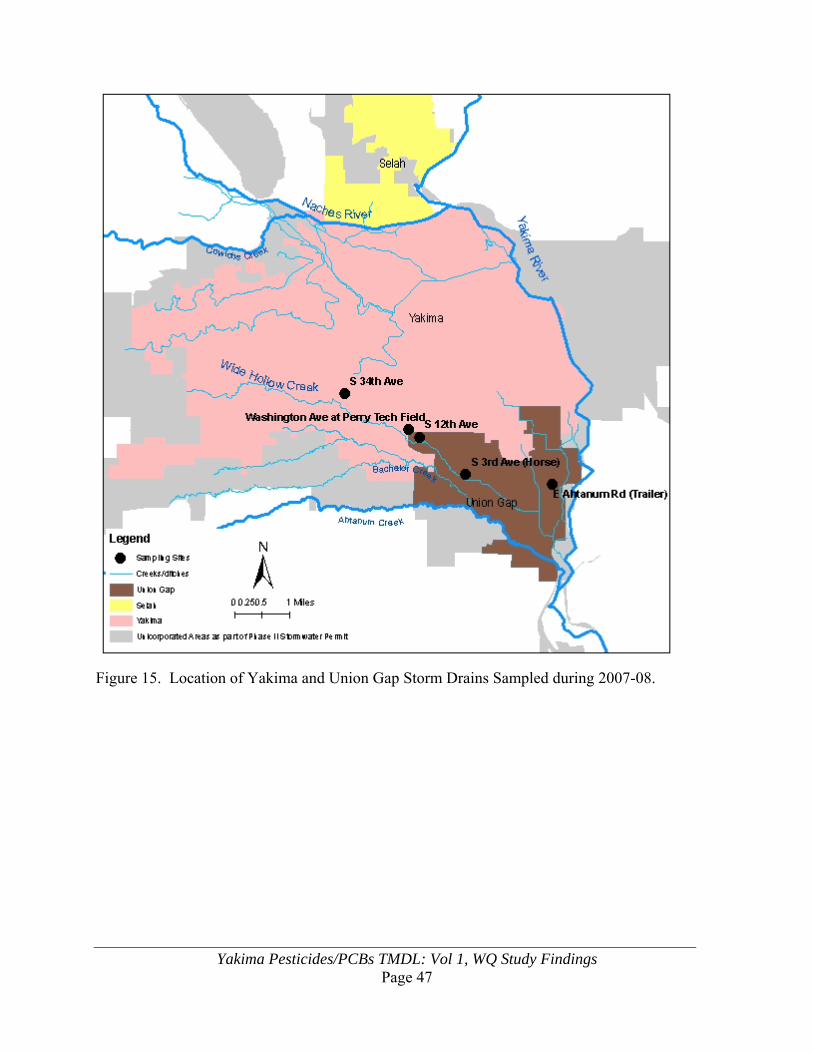
Yakima Pesticides/PCBs TMDL: Vol 1, WQ Study Findings Page 47
Figure 15. Location of Yakima and Union Gap Storm Drains Sampled during 2007-08.

Yakima Pesticides/PCBs TMDL: Vol 1, WQ Study Findings Page 48
Figure 16. Location of Ellensburg Storm Drains Sampled during 2007-08.

Yakima Pesticides/PCBs TMDL: Vol 1, WQ Study Findings Page 49
Number of Samples The approximate number and timing of samples collected for each task in the Yakima River pesticides and PCBs water quality study is shown in Table 14.
Table 14. Number of Samples Collected for the 2007-08 Water Quality Study.
Task
Approximate Number of Samples A
pril
May
June
July
Aug
ust
Sep
tem
ber
Oct
ober
Nov
embe
r
Dec
embe
r
Janu
ary
Feb
ruar
y
Mar
ch
Apr
il
May
June
Sub-Total
Surface Water
Routine Monitoring 18 18 18 18 18 18 9 9 9 9 9 13 166
Screening Survey 22 22 22 22 88
SPMD Deployments 12 12 24
Permitted Discharges
Wastewater Treatment Plants 18 18 18 18 72
Fruit & Vegetable Processors 6 6 6 6 18
Urban Stormwater Runoff 5 8 7 5 3 28
Total = 396
Other Sources of Contamination A variety of other potential sources of 303(d) listed pesticides and PCBs exist within the Yakima River basin. These include, but are not limited to, landfills, illegal dumpsites, hazardous waste sites, toxic cleanup sites, and pesticide handling facilities that will fall under regulations other than the Water Quality Laws to investigate and stop discharge if and when they are identified as potential sources of water pollution. It was beyond the scope of this water quality study to investigate all of these sources. For purposes of the TMDL, they will be considered part of the nonpoint load.

Yakima Pesticides/PCBs TMDL: Vol 1, WQ Study Findings Page 50
This page is purposely left blank

Yakima Pesticides/PCBs TMDL: Vol 1, WQ Study Findings Page 51
Field Procedures
Sample containers, preservation, and holding times for the water samples collected during this project are shown in Table 15. A detailed description of procedures for collecting each type of sample follows.
Table 15. Field Procedures for Water Samples.
Parameter Minimum
Sample Size Container Preservation
Holding Time
Pesticides (LVI) 1 gallon 1 gal. glass; Teflon lid Cool to 4oC 7 days
Pesticides (SPE) 1 liter 1 L amber glass; Teflon lid Cool to 4oC 7 days
PCBs 1 liter 1 L amber glass; Teflon lid Cool to 4oC 1 year
TSS/TNVSS 1,000 mL 1 L poly bottle Cool to 4oC 7 days
Turbidity 100 mL 500 mL poly bottle Cool to 4oC 48 hours
Organic Carbon 50 mL 60 mL poly bottle HCl to pH<2, 4oC 28 days
Conductivity 300 mL 500 mL poly bottle Cool to 4oC 28 days
LVI = large volume injection (low detection limits). SPE = solid phase extraction (routine detection limits).
Surface Water Routine Monitoring and Screening Survey The routine monitoring and screening survey samples were collected by hand in one-liter, amber glass, narrow-mouth bottles, cleaned to EPA (1990) quality assurance/quality control (QA/QC) specifications. Bridge samples were taken by placing the bottle in a metal holder that orients the mouth of the bottle upstream and lowering the sampler on a line. Wadeable streams were sampled by hand. The samples were taken as composites from a quarter-point transect across the width of the stream. The sample bottle was lowered and raised through the water column to obtain a depth integrated sample. Grabs from each transect were composited into appropriate sample containers for pesticides, TSS, turbidity, and conductivity. A new bottle was used for each sample site. A number of the TSS and turbidity samples collected during the irrigation season were also intended for TMDL effectiveness monitoring. These samples were taken using depth- and width-integrating procedures consistent with the previous effectiveness monitoring effort (Coffin et al., 2006). Deepwater sites were sampled with a US-DH-59 or a US-DH-76 attached to a rope. A US-DH-81 sampler was used for wadeable streams. Three verticals representing equal widths of the stream cross-section were sampled.

Yakima Pesticides/PCBs TMDL: Vol 1, WQ Study Findings Page 52
Where required, streamflow was measured using a Swoffer Model 2100 or Marsh-McBirney Model 201 meter and top-setting rod. The latitude and longitude of each sampling site was recorded from a global positioning system (GPS) receiver. All water samples were placed on ice, returned to Ecology Headquarters (HQ), and held in a secure cooler for later transport with chain-of-custody record to the Ecology Manchester Environmental Laboratory. Semipermeable Membrane Devices Deployment and retrieval procedures for SPMDs followed standard operating procedures of the Ecology EA Program (Johnson, 2007b). Standard SPMDs (91 x 2.5 cm membrane containing 1 mL triolein) and the stainless steel canisters (16.5 x 29 cm) and spindle devices that hold the membranes during deployment were obtained from Environmental Sampling Technologies (EST). The SPMDs were preloaded onto the spindles by EST in a clean room and shipped in solvent-rinsed metal cans under argon atmosphere. The SPMDs were kept frozen until deployed. , to await On arriving at the sampling site, the cans were pried open, spindles slid into perforated stainless steel canisters, and the device anchored and tethered in the stream. Field personnel wore nitrile gloves and did not touch the membranes. Water samples for total and dissolved organic carbon (TOC, DOC) were collected at the beginning, midpoint, and end of each deployment. The SPMDs were deployed for approximately one month, as recommended by USGS and EST. The retrieval procedure was essentially the opposite of deployment. The cans holding the SPMDs were carefully sealed and the SPMDs maintained at or near freezing for next day shipment to EST for extraction. Chain-of-custody was maintained.
Wastewater Treatment Plants The WWTP samples were composites of the final effluent. Each composite consisted of two grabs per day (morning and afternoon) for two days. The grabs were taken with 1-liter amber glass bottles, cleaned to EPA (1990) QA/QC specifications, and split into appropriate sample containers (Table 13). A new 1-liter bottle was used for each sample. The samples were kept on ice and in the dark during the compositing period. The effluent samples were returned to Ecology HQ and held in a secure cooler for later transport with chain-of-custody record to Manchester Laboratory. Manchester packaged the PCB samples and shipped them to an accredited contract laboratory for HR GC/MS analysis. The remaining samples were analyzed at Manchester.

Yakima Pesticides/PCBs TMDL: Vol 1, WQ Study Findings Page 53
Fruit Packers and Vegetable Processors Sample collection and handling for fruit packer and vegetable processor effluents followed the same procedures used for WWTPs, except PCB samples were not taken.
Stormwater Pesticide, PCB, TSS, turbidity, and conductivity samples were collected as simple grabs or composites of two grabs collected over a 15-minute period during the early part of the storm. Pesticide samples were not collected for Ellensburg. Samples were taken directly into the appropriate container (Table 15) and kept on ice at all times. The stormwater samples were returned to Ecology HQ and held in a secure cooler for later transport with chain-of-custody record to Manchester Laboratory. Manchester packaged the PCB samples and shipped them to an accredited contract laboratory for HR GC/MS analysis. The remaining samples were analyzed at Manchester.

Yakima Pesticides/PCBs TMDL: Vol 1, WQ Study Findings Page 54
Laboratory Methods
Table 16 shows sample preparation, analysis methods, and laboratories used in this study.
Table 16. Laboratory Methods for Water Samples.
Analysis Sample
Preparation Method
Analytical Method
Laboratory
Surface Water Pesticides EPA 3510M LVI*/EPA 8081 Manchester TSS N/A EPA 160.2 Manchester TNVSS N/A SM 2540E Manchester Turbidity N/A EPA 180.1 Manchester Conductivity N/A EPA 120.1 Manchester TOC/DOC N/A EPA 415.1 Manchester
SPMDs
Toxaphene dialysis/GPC† EPA 8081 EST/Manchester
PCBs dialysis/GPC† EPA 1668A Pace
WWTP Effluent Pesticides EPA 3535M (SPE**) EPA 8081M Manchester
PCBs EPA 1668A EPA 1668A Pace, Test America,
Pacific Rim TSS N/A EPA 160.2 Manchester Turbidity N/A EPA 180.1 Manchester Conductivity N/A EPA 120.1 Manchester
Fruit &Vegetable Effluents Pesticides EPA 3510M LVI/EPA 8081 Manchester TSS N/A EPA 160.2 Manchester Turbidity N/A EPA 180.1 Manchester Conductivity N/A EPA 120.1 Manchester
Stormwater Pesticides EPA 3535M (SPE) EPA 8081M Manchester PCBs EPA 1668A EPA 1668A Pace, Pacific Rim TSS N/A EPA 160.2 Manchester Turbidity N/A EPA 180.1 Manchester Conductivity N/A EPA 120.1 Manchester
*large volume injection. †EST SOPs E14, E15, E19, E21, E33, E44, E48. **solid phase extraction.

Yakima Pesticides/PCBs TMDL: Vol 1, WQ Study Findings Page 55
Data Quality Assessment
Data Review and Verification The Ecology Manchester Laboratory reviewed the chemical data for this project. For results generated by Manchester, final data review was performed by the unit supervisor or an analyst experienced with the method. Chemists on the Manchester Laboratory staff performed the review for analytical work sub-contracted to commercial laboratories. Quality assurance and quality control at Manchester are described in the Lab Users Manual (Ecology intranet: http://aww.ecologydev/programs/eap/forms/labmanual.pdf). Manchester prepared written case narratives assessing the quality of all data collected. These reviews include a description of analytical methods and an assessment of holding times, initial and continuing calibration and degradation checks, method blanks, surrogate recoveries, internal standard recoveries, matrix spike recoveries, laboratory control samples, and laboratory duplicates. The reviews and the complete Manchester data reports are available from the author on request. A Quality Assurance Project Plan (Johnson, 2007a) established measurement quality objectives (MQOs) for accuracy, bias, and reporting limits. To determine if MQOs were met, the project lead compared results on field and laboratory quality control samples to the MQOs. To evaluate whether the reporting limit targets were met, the results were examined for non-detects and to determine if any values exceeded the lowest concentration of interest. Based on these assessments and a review of the laboratory data packages and Manchester’s data verification reports, the data were either accepted, accepted with appropriate qualifications, or rejected and re-analyzed or re-sampled where possible. In the present report, qualified data are flagged as follows:
U = The analyte was not detected at or above the reported sample quantitation limit.
UJ = The analyte was not detected at or above the reported sample quantitation limit. However, the reported quantitation limit is approximate and may or may not represent the actual limit of quantitation necessary to accurately measure the analyte in the sample.
J = The analyte was positively identified; the associated numerical value is the approximate concentration of the analyte in the sample.
N = The analysis indicates the presence of an analyte for which there is presumptive evidence to make a tentative identification.
NJ = The analysis indicates the presence of an analyte that has been tentatively identified, and the associated numerical value represents its approximate concentration.
E = Reported result is an estimate because it exceeds the calibration range.
REJ = The sample results are rejected due to serious deficiencies in the ability to analyze the sample and meet quality control criteria. The presence or absence of the analyte cannot be verified.

Yakima Pesticides/PCBs TMDL: Vol 1, WQ Study Findings Page 56
Field Blanks Transfer blanks and bottle blanks were analyzed to detect contamination arising from sampling procedures. The blanks were prepared in the field using sample bottles filled with blank water at the analyzing laboratories. The transfer blanks were prepared by pouring the blank water into new sample containers. The bottle blanks were carried through the survey unopened. All field blank results are included in the data appendices. Pesticides were not detected in any of the field blanks, except for one instance of a trace of endosulfan sulfate. Endosulfan sulfate has never been shown to be a chemical of concern in the Yakima River. PCBs were detected in the field blanks associated with WWTP effluent and stormwater sampling. The levels were similar in both the bottle and transfer blank indicating the sampling method was not contributing additional PCBs to the samples. Because the blank water is not used in analyzing the samples, the field blanks do not indicate contamination at the laboratory, which is assessed with method blanks. Only those PCB compounds detected at greater than 10 times the method blank were included in the PCB concentrations reported here for effluent, stormwater, and SPMD samples. Because SPMDs sample vapors while being exposed to air, field blanks were needed to assess chemical accumulation during deployment and retrieval. The SPMD field blank consisted of five membranes in an argon-filled stainless steel can. It was exposed to the air for the average amount of time it took to open and place the SPMDs in the water, typically one to three minutes. The blank was then resealed and refrozen. It was taken back into the field and opened and closed again to mimic the retrieval process. The blank was prepared, processed, and analyzed the same as deployed SPMDs. There were two field blanks for each sampling period, one in the upper reaches of the Yakima River at Easton and one in the lower Yakima River at Sulphur Creek Wasteway. A PCB background was present in the SPMD field blanks. It appeared to have originated at EST laboratory where the membranes were prepared. Because the PCB levels agreed closely among the field and laboratory blanks (i.e., within 4%), the average of the field blank values was subtracted from the samples before calculating final water column PCB concentrations. Toxaphene was not detected in the blanks. The results for the SPMD field blanks are in the data appendices.
Replicate Samples Field replicate samples were collected to provide estimates of the total variability (field + laboratory) associated with the data generated in this study. The replicates were collected in pairs within a few minutes of each other. For SPMDs, the replicates consisted of separate samplers deployed in the same vicinity. Sites for replication were rotated through the study area to cover a range of analytes and concentrations. One or two sets of replicates were analyzed with every sample collection, except every few months for routine pesticide monitoring. The results are in the data appendices.

Yakima Pesticides/PCBs TMDL: Vol 1, WQ Study Findings Page 57
The relative percent difference between replicates for the constituents of primary interest in this study is summarized in Table 17. For pesticides, TSS, and turbidity, the replicates agreed within 30% or better in most cases. Greater variability was encountered for PCBs, 33-66%. In terms of PCB concentrations, this translates into a difference of about a factor of 2 or less. Overall, the most variable results were obtained on organic compounds in stormwater. The complete results on replicate samples are in the data appendices.
Table 17. Mean Relative Percent Difference* Between Replicate Field Samples Analyzed during the 2007-08 Water Quality Study.
Sample Type N= DDE Dieldrin Chlorpyrifos Endosulfan
Surface water (routine monitoring) 12 6% 12% 10% 7%
Surface water (screening survey) 8 11% 8% 34% 29%
SPMDs 3 31% 17% 12% 11%
WWTP effluent 6-8 ND ND 18% 4%
Fruit and Vegetable effluent 4 2% 19% 32% 22%
Stormwater 4-6 19% 22% 47% 25%
Sample Type N= Total PCBs Toxaphene TSS Turbidity
Surface water (routine monitoring) 12 NA ND 11% 10%
Surface water (screening survey) 8 NA ND 25% 14%
SPMDs 3 35% 6% NA NA
WWTP effluent 6-8 42% ND 2% 14%
Fruit and Vegetable effluent 4 NA ND 7% 16%
Stormwater 4-6 66% 4% 18% 8% *difference between replicates as percent of replicate average. NA = not analyzed. ND = not detected.

Yakima Pesticides/PCBs TMDL: Vol 1, WQ Study Findings Page 58
This page is purposely left blank

Yakima Pesticides/PCBs TMDL: Vol 1, WQ Study Findings Page 59
Results of the 2007-08 Water Quality Study
Water Supply In describing conditions in the Yakima River, Fuhrer et al. (2004) cautioned that water availability and dilution effects must be considered when comparing water quality between years or examining findings from a particular year. Streamflows in the basin vary from year to year depending on snowfall, snowmelt, and how the irrigation system is operated. Figure 17 shows the flow in the lower Yakima River at Kiona while the 2007-08 water quality study was being conducted. Kiona is located at Benton City, about 30 miles upstream of the Columbia River. The 2007-08 data are compared to the average daily flow at this site from 1933 to 2007. This period dates back to when the last of the six storage dams at the headwaters of the Yakima and Naches Rivers was completed.
Figure 17. Historical Flow in the Yakima River vs. Flow during the 2007-08 Water Quality Study. (USGS 12510500, Yakima River at Kiona http://waterdata.usgs.gov/wa/nwis/sw)
Mainstem flows tracked historical averages fairly closely during most of the 2007 irrigation season (April to October). Note that peak high and low flows in the historical data are smoothed out by averaging.
0
1,000
2,000
3,000
4,000
5,000
6,000
7,000
8,000
9,000
10,000
Apr May Jun Jul Aug Sep Oct Nov Dec Jan Feb Mar
Flo
w (c
fs)
1933-2007 2007-2008

Yakima Pesticides/PCBs TMDL: Vol 1, WQ Study Findings Page 60
Streamflow departed from the historical average in several instances. There was a large snowmelt event in March 2007 with the bulk of the runoff extending into April. A series of four storms also brought rain and increased runoff in April. Much of the snow that would normally have melted in June melted in March and April. The last part of December through the middle of February was characterized by cold temperatures and heavy snowfall in the mountains, and thus lower flows. (www.wrh.noaa.gov/pdt/climate/monthInReview/index.php?wfo=pdt). The average annual flow at Kiona since the TMDL effort was initiated is plotted in Figure 18. The first year of sampling for the Lower Yakima River Suspended Sediment and DDT TMDL was 1994, a drought year. A period of higher than average runoff occurred over the next six years, followed by another drought in 2001. Flows have been lower than average over the past several years. Water supplies since about 1994 have generally been less than the historical mean would indicate they should have been over the last decade and a half (Coffin, 2008). The average flow during 2007 was close to the long-term mean − 3,813 cfs vs. 3,516 cfs, respectively. Most of the surface water samples for the water quality study (80%) were collected during this period. Therefore, the results reported here should be representative of the typical flow regime in the Yakima River basin, at least to the extent that they do not reflect a particularly low- or high-flow year.
Figure 18. Annual Mean Flow in the Yakima River at Kiona, 1994-2007.
(USGS 12510500, http://waterdata.usgs.gov/wa/nwis/sw)
0
1,000
2,000
3,000
4,000
5,000
6,000
7,000
1994 1995 1996 1997 1998 1999 2000 2001 2002 2003 2004 2005 2006 2007
Flo
w (
cfs)
1933-2007 Mean Flow

Yakima Pesticides/PCBs TMDL: Vol 1, WQ Study Findings Page 61
Surface Water Quality Pesticides Four stations on the lower Yakima River mainstem, the Naches River, and four major left-bank irrigation returns were monitored for chlorinated pesticides, the organophosphate insecticide chlorpyrifos, suspended sediment, and turbidity from April 2007 through March 2008. Samples were collected twice-a-month during the irrigation season and monthly during the non-irrigation season, providing results for approximately 170 samples, 18-19 samples per site. Sampling locations were shown previously in Figure 7. Pesticides other than those on the 303(d) list were infrequently detected and, when present, the levels were low. These results are not discussed further. All of the data obtained on pesticides and ancillary water quality parameters in surface water samples can be found in Appendices J and K. The complete project data are also available through Ecology’s Environmental Information Management (EIM) website www.ecy.wa.gov/eim/index.htm; search User Study ID AJOH0055. Detection Frequency and Concentration Ranges Lower Mainstem and Naches River Results for 303(d) listed pesticidesd in the lower Yakima mainstem and Naches River are summarized in Table 18. Concentrations are in units of ng/L (nanograms per liter) which is equivalent to parts per trillion. The reporting limit was used to calculate summary statistics when a pesticide was not detected.e The same convention is followed throughout the report, unless stated otherwise. The pesticides or breakdown products most frequently detected in the Yakima mainstem and Naches River were DDE, chlorpyrifos, and endosulfan: 76%, 61%, and 49% of samples, respectively. DDD and dieldrin were detected less frequently: 26% and 22% of samples. DDT was reported in only 18% of the samples, most of it having broken down to DDE and DDD. The other two 303(d) pesticides analyzed, chlordane and alpha-BHC, were below the limits of detection. The reporting limit for these compounds was 0.061-0.067 ng/L. Toxaphene was not detected at or above 3 ng/L (data not shown). Low detection limits could not be achieved for toxaphene in these samples due to interferences. Better toxaphene data were obtained through the use of SPMD passive samplers (see PCBs and Toxaphene, page 102). d In this report, the terms DDT, DDE, and DDD refer to the 4,4’ isomers. The 2,2’ isomers are also present but at insignificant levels. Endosulfan is the sum of detected concentrations of endosulfan I and endosulfan II. Chlordane is the sum of detected concentrations of cis & trans chlordane, cis & trans nonachlor, and oxychlordane. e The detection limit is the lowest concentration where there is evidence of the analyte being present. The reporting limit is the lowest concentration that can reliably be reported, based on method blanks, instrument calibration, and other factors.

Yakima Pesticides/PCBs TMDL: Vol 1, WQ Study Findings Page 62
Table 18. Summary of Results from Monitoring 303(d) Listed Pesticides at Four Locations in the Mainstem Lower Yakima River and in the Naches River during 2007-08: Yakima River at Harrison Bridge, Naches River at mouth, Yakima River at Parker Bridge, Yakima River at Euclid Bridge, Yakima River at Kiona Bridge (concentrations in ng/L, parts per trillion).
DDT DDE DDD Dieldrin
No. of Samples 90 90 90 90 Detection Frequency (%) 18% 76% 26% 22% Median Concentration 0.063 U 0.15 0.063 U 0.065 U Mean Concentration 0.077 0.21 0.072 0.091 90th Percentile Concentration 0.10 0.43 0.094 0.15 Maximum Concentration 0.44 J 1.3 0.22 0.29
Endosulfan Chlorpyrifos Chlordane Alpha-BHC
No. of Samples 90 90 90 90 Detection Frequency (%) 49% 61% 0% 0% Median Concentration 0.066 U 0.18 0.063 U 0.063 U Mean Concentration 0.24 1.7 0.063 U 0.063 U 90th Percentile Concentration 0.48 4.1 0.065 U 0.065 U Maximum Concentration 2.4 20 0.067 U 0.067 U U = not detected at or above reported value. J = estimated.
The highest concentrations recorded were 20 ng/L for chlorpyrifos and 2.4 ng/L for endosulfan. Both of these insecticides are currently used in the Yakima basin. The maximum DDE concentration was 1.3 ng/L. Dieldrin reached 0.29 ng/L. DDT, dieldrin, chlordane, and alpha-BHC were all banned in the 1970s and 1980s and are no longer used. Figure 19 compares the detections of DDE, dieldrin, endosulfan, and chlorpyrifos at each of the mainstem and Naches River monitoring sites. Results are arranged in downstream order from the Yakima River at Harrison Bridge (r.m. 121.7, above the city of Yakima) to the Yakima River at Kiona (r.m. 29.8, above the Columbia River confluence). DDE was always below detection limits in the Yakima River at Harrison Bridge, but was routinely detectable in the Naches River and all downstream locations (89-100% of samples). DDE, dieldrin, endosulfan, and chlorpyrifos all showed a consistent increase in detection frequency moving downriver from Harrison Bridge. These results point to the Naches River as being a larger contributor of DDT compounds than the upper Yakima River. Dieldrin was rarely detected at Harrison Bridge and never detected in the Naches River. The major dieldrin sources appear to lie downstream of Parker.

Yakima Pesticides/PCBs TMDL: Vol 1, WQ Study Findings Page 63
Figure 19. Detection Frequency of Selected 303(d) Listed Pesticides in the Mainstem Lower Yakima River and Naches River during 2007-08 (percent of samples detected, N=18).
0%
20%
40%
60%
80%
100%
HARRISON NACHES PARKER EUCLID KIONA
Detection Frequen
cy
DDE
0%
20%
40%
60%
80%
100%
HARRISON NACHES PARKER EUCLID KIONADetection Frequen
cy
Dieldrin
0%
20%
40%
60%
80%
100%
HARRISON NACHES PARKER EUCLID KIONADetection Frequen
cy
Endosulfan
0%
20%
40%
60%
80%
100%
HARRISON NACHES PARKER EUCLID KIONADetection Frequen
cy
Chlorpyrifos

Yakima Pesticides/PCBs TMDL: Vol 1, WQ Study Findings Page 64
Major Irrigation Returns Table 19 summarizes the pesticide data for the four major lower river irrigation returns monitored in conjunction with mainstem: Moxee Drain (r.m. 107.3 near Union Gap), Granger Drain (r.m. 82.8 at Granger), Sulphur Creek Wasteway (r.m. 61.0 at Sunnyside), and Spring Creek (r.m. 41.8 below Prosser). The initial TMDL investigation identified these returns as priority discharges for monitoring (Joy and Patterson, 1997).
Table 19. Summary of Results from Monitoring 303(d) Listed Pesticides in Four Major Irrigation Returns to the Lower Yakima River during 2007-08: Moxee Drain, Granger Drain, Sulphur Creek Wasteway, Spring Creek (concentrations in ng/L, parts per trillion).
DDT DDE DDD Dieldrin
No. of Samples 76 76 76 76 Detection Frequency (%) 82% 100% 97% 71% Median Concentration 0.19 1.2 0.22 0.16 Mean Concentration 0.87 1.4 0.24 0.22 90th Percentile Concentration 0.64 2.6 0.42 0.47 Maximum Concentration 44 5.5 0.89 0.92
Endosulfan Chlorpyrifos Chlordane Alpha-BHC
No. of Samples 76 76 76 76 Detection Frequency (%) 88% 87% 3% 0% Median Concentration 0.36 0.54 0.063 U 0.063 U Mean Concentration 1.2 8.1 0.063 U 0.063 U 90th Percentile Concentration 3.2 15 0.065 U 0.065 U Maximum Concentration 15 211 0.082 0.095 UJ U = not detected at or above reported value. J = estimated.
DDT compounds, dieldrin, endosulfan, and chlorpyrifos were detected much more frequently in the irrigation returns than in the mainstem: 71-100% vs. 18-76%. The maximum concentrations observed were higher in the returns by factors of 4 to 10. Chlordane was reported in only 3% of the return samples and alpha-BHC was never detected, which is consistent with findings for the mainstem. Despite elevated reporting limits, toxaphene was detected in four samples (5% detection frequency) from the major irrigation returns, two each from Moxee Drain and Sulphur Creek Wasteway. Estimated concentrations were in the range of 3.5 – 7.0 ng/L. Low-level data for toxaphene for the mainstem and major irrigation returns is discussed later this report.

Yakima Pesticides/PCBs TMDL: Vol 1, WQ Study Findings Page 65
The term “total DDT” refers to the summed concentrations of the insecticide DDT and its breakdown products DDE and DDD. A particularly high total DDT concentration of 50 ng/L was recorded in Granger Drain on 1/1/08. This sample was comprised of 86% un-degraded DDT (Figure 20). A large amount of the DDT parent compound (52%) was also found in Spring Creek on 4/5/07 (5.6 ng/L total DDT). Studies done elsewhere have attributed similar findings to disturbance of subsurface farm soils, rather than recent use of DDT (e.g., Risebrough et al., 1984). DDT degrades more slowly when buried than when near the surface and exposed to light and greater biological activity (Callahan et al., 1979). The un-degraded DDT residual in 95% of the samples analyzed from the returns in the present study was less than 30% of the total, indicating the source is historical application.
Figure 20. Percent of Un-degraded DDT in Water Samples From Four Major Irrigation Returns to the Lower Yakima River during 2007-08: Moxee Drain, Granger Drain, Sulfur Creek Wasteway, and Spring Creek.
Pesticide detection frequency was similar among the four returns, except for dieldrin in Moxee Drain (Figure 21). Dieldrin was reported in only 26% of the Moxee samples, compared to 84-89% in the three other discharges.
0
10
20
30
40
50
60
70
80
90
100
Per
cent
DD
T
0.0 0.1 0.2 0.3 0.4 0.5 0.6 0.7 0.8 0.9 1.0Fraction of Data
Granger Drain 1/10/08
Spring Creek 4/5/07
Granger Drain 6/7/07
Fraction of Samples (N=76)

Yakima Pesticides/PCBs TMDL: Vol 1, WQ Study Findings Page 66
Figure 21. Detection Frequency of Selected 303(d) Listed Pesticides in Four Major Irrigation Returns to the Lower Yakima River during 2007-08 (percent of samples, N=19).
0%
20%
40%
60%
80%
100%
MOXEE GRANGER SULPHUR SPRINGDetection Frequen
cy
DDE
0%
20%
40%
60%
80%
100%
MOXEE GRANGER SULPHUR SPRING
Detection Frequen
cy
Dieldrin
0%
20%
40%
60%
80%
100%
MOXEE GRANGER SULPHUR SPRING
Detection Frequen
cy
Endosulfan
0%
20%
40%
60%
80%
100%
MOXEE GRANGER SULPHUR SPRING
Dection Frequen
cy
Chlorpyrifos

Yakima Pesticides/PCBs TMDL: Vol 1, WQ Study Findings Page 67
Comparison with Water Quality Criteria Human Health The human health criteria are intended to protect the average consumer from excess cancer and other health risks incurred from exposure to contaminated fish and water. People with higher or lower body weights and fish or water consumption rates than used to calculate the criteria would face higher or lower risks. As previously noted, the human health criteria were promulgated on the states through the EPA National Toxics Rule. Washington State does not have human health criteria for chlorpyrifos, none having been proposed by EPA. The water quality criteria are described in more detail starting on page 9. Lower Mainstem and Naches River The percentage of Yakima and Naches River water samples that exceeded Washington State human health criteria for pesticides is shown in Table 20. The criteria shown are for consumption of both fish and water. In the case of DDT compounds, dieldrin, and chlordane, these criteria are the same as or only slightly lower than the criteria for fish consumption only (see Table 3).
Table 20. Percent of Samples Exceeding Human Health Criteria for 303(d) Listed Pesticides in the Mainstem Lower Yakima River and Naches River during 2007-08. (N=18)
Location DDT DDE DDD Dieldrin
Human Health Criteria (ng/L): 0.59 0.59 0.83 0.14
Yakima River at Harrison 0% 0% 0% 0% Naches River at mouth 0% 0% 0% 0% Yakima River at Parker 0% 0% 0% 0% Yakima River at Euclid 0% 17% 0% 22% Yakima River at Kiona 0% 6% 0% 28%
Location Endosulfan Chlorpyrifos Chlordane Alpha BHC
Human Health Criteria (ng/L): 930 NA 0.57 3.9
Yakima River at Harrison 0% NA 0% 0% Naches River at mouth 0% NA 0% 0% Yakima River at Parker 0% NA 0% 0% Yakima River at Euclid 0% NA 0% 0% Yakima River at Kiona 0% NA 0% 0% NA = not applicable (criteria have not been adopted).
Instances where human health criteria were exceeded in the Yakima mainstem were limited to DDE and dieldrin and were observed at Euclid and Kiona, but not further upstream. 17-22% of samples exceeded at Euclid and 6-28% of samples exceeded at Kiona. Other 303(d) listed pesticides were always within human health criteria in the mainstem. The Naches River never exceeded criteria.

Yakima Pesticides/PCBs TMDL: Vol 1, WQ Study Findings Page 68
Major Irrigation Returns Table 21 shows how the four major lower river returns compared to human health criteria. Comparing the returns directly with human health criteria is appropriate for several reasons. First, both state and federal opinions have concluded that waters within the Columbia Basin, including irrigation returns, are waters of the state and therefore subject to the water quality standards (AGO 1969 No. 4 www.atg.wa.gov/opinion.aspx?section=archive&id=9166; Levigne, 1997; Ryan, 1997). Second, as demonstrated in Ecology’s 2006 fish tissue survey and confirmed in the 2007-08 water quality study, the Yakima River is often at or above criteria for several of these compounds, and thus does not have additional assimilative capacity. Third, some segments of the local population are known to catch fish out of irrigation returns on a routine basis.
Table 21. Percent of Samples Exceeding Human Health Criteria for 303(d) Listed Pesticides in Four Major Irrigation Returns to the Lower Yakima River during 2007-08. (N=19)
Location DDT DDE DDD Dieldrin
Human Health Criteria (ng/L): 0.59 0.59 0.83 0.14
Moxee Drain 0% 74% 0% 26% Granger Drain 47% 100% 5% 53% Sulphur Creek Wasteway 0% 100% 0% 89% Spring Creek 11% 32% 0% 58%
Location Endosulfan Chlorpyrifos Chlordane Alpha BHC
Human Health Criteria (ng/L): 930 NA 0.57 3.9
Moxee Drain 0% NA 0% 0% Granger Drain 0% NA 0% 0% Sulphur Creek Wasteway 0% NA 0% 0% Spring Creek 0% NA 0% 0%
NA = not applicable (criteria have not been adopted for chlorpyrifos).
The returns exceeded human health criteria for DDT, DDE, and dieldrin much more frequently than the mainstem. Endosulfan, chlordane, and alpha-BHC, however, always remained within criteria. As illustrated in Figure 22, DDE and dieldrin typically exceeded human health criteria 50% of the time or more, with 100% exceedance of the DDE criterion in Granger Drain and Sulphur Creek Wasteway. Exceptions were DDE in Spring Creek, which exceeded 32% of the time, and dieldrin in Moxee Drain, which exceeded 26% of the time. Granger Drain and Spring Creek were the only returns where the DDT human health criterion was exceeded. As previously noted, these discharges had an unusually high percentage of un-degraded DDT in several instances.

Yakima Pesticides/PCBs TMDL: Vol 1, WQ Study Findings Page 69
Figure 22. Percent of Samples Exceeding Human Health Criteria for DDE, DDT, and Dieldrin in Four Major Irrigation Returns to the Lower Yakima River during 2007-08. (N=19)
0%
20%
40%
60%
80%
100%
MOXEE GRANGER SULPHUR SPRING
Exc
eeda
nce
Fre
quen
cyDDE
0%
20%
40%
60%
80%
100%
MOXEE GRANGER SULPHUR SPRING
Exc
eeda
nce
Fre
quen
cy
DDT
0%
20%
40%
60%
80%
100%
MOXEE GRANGER SULPHUR SPRING
Exc
eeda
nce
Fre
quen
cy
Dieldrin

Yakima Pesticides/PCBs TMDL: Vol 1, WQ Study Findings Page 70
Aquatic Life Water quality criteria to protect aquatic life are typically less restrictive than the human health criteria, i.e., higher concentrations are considered to be protective. The aquatic life criteria for DDT compounds apply to total DDT, rather than the individual concentrations of DDT, DDE, or DDD. Human health criteria have not been proposed for total DDT. Lower Mainstem and Naches River Washington State’s aquatic life criteria for chronic (long-term) exposure to 303(d) pesticides were rarely exceeded in the mainstem Yakima River and never exceeded in the Naches River during 2007-08 (Table 22). The acute criteria (short-term exposure) were always being met. The chronic total DDT criterion was exceeded in 6% of the samples collected in the mainstem at Euclid and 6% of samples at Kiona (1 out of 18). Other pesticides were always within chronic criteria.
Table 22. Percent of Samples Exceeding Chronic Aquatic Life Criteria for 303(d) Listed Pesticides in the Mainstem Lower Yakima River and Naches River during 2007-08. (N=18)
Location Total DDT* Dieldrin Endosulfan
Aquatic Life Criteria (ng/L): 1.0 1.9 56
Yakima River at Harrison 0% 0% 0% Naches River at mouth 0% 0% 0% Yakima River at Parker 0% 0% 0% Yakima River at Euclid 6% 0% 0% Yakima River at Kiona 6% 0% 0%
Location Chlorpyrifos Chlordane Alpha BHC
Aquatic Life Criteria (ng/L): 41 4.3 NA
Yakima River at Harrison 0% 0% NA Naches River at mouth 0% 0% NA Yakima River at Parker 0% 0% NA Yakima River at Euclid 0% 0% NA Yakima River at Kiona 0% 0% NA NA = not applicable (criteria have not been adopted). *Total DDT = DDT+DDE+DDD.
Major Irrigation Returns Tributaries and irrigation returns to the lower Yakima River provide habitat for salmonids and other fish species (Joy and Patterson, 1997). They also discharge to reaches of the mainstem with important fish habitat. The presence of chinook, coho, and steelhead has been documented in Moxee Drain, Sulphur Creek Wasteway, and Spring Creek, with coho spawning observed in Sulphur and Spring (http://wdfw.wa.gov/mapping/salmonscape/index.html). Rearing and migration are specifically identified as designated uses for Sulphur Creek Wasteway in the water

Yakima Pesticides/PCBs TMDL: Vol 1, WQ Study Findings Page 71
quality standards.f It is therefore important that these discharges comply with aquatic life criteria. Total DDT commonly exceeded the chronic aquatic life criterion in all four returns, with Granger Drain and Sulphur Creek Wasteway exceeding throughout the year (Table 23). Chlorpyrifos was occasionally above the chronic criterion in Moxee Drain, Sulphur Creek Wasteway, and Spring Creek (5-11% of samples). Dieldrin, endosulfan, and chlordane were always within aquatic life criteria. There are no aquatic life criteria for alpha-BHC.
Table 23. Percent of Samples Exceeding Chronic Aquatic Life Criteria for 303(d) Listed Pesticides in Four Major Irrigation Returns to the Lower Yakima River during 2007-08. (N=19)
Location Total DDT* Dieldrin Endosulfan
Aquatic Life Criteria (ng/L): 1.0 1.9 56 Moxee Drain 68% 0% 0% Granger Drain 100% 0% 0% Sulphur Creek Wasteway 100% 0% 0% Spring Creek 26% 0% 0%
Location Chlorpyrifos Chlordane Alpha BHC Aquatic Life Criteria (ng/L): 41 4.3 NA
Moxee Drain 5% 0% NA Granger Drain 0% 0% NA Sulphur Creek Wasteway 11% 0% NA Spring Creek 11% 0% NA *DDT+DDE+DDD. NA = not applicable (criteria have not been adopted).
Spatial and Seasonal Patterns Lower Mainstem Figures 23 and 24 illustrate how the average total DDT and dieldrin concentrations increased in the Yakima mainstem moving downstream from Harrison Bridge to Kiona during the 2007 irrigation season. The highest levels of these compounds were generally observed during irrigation. Previous studies have had similar findings (Joy and Patterson, 1997; Rinella et al., 1999; Ebbert and Embrey, 2002). On average, total DDT concentrations increased by a factor of 2 or more between Harrison and Parker. This was due, at least in part, to the Naches River and Moxee Drain. The greatest impacts occurred between Parker and Euclid where concentrations increased by a factor of 4. Granger Drain, Sulphur Creek Wasteway, and a large number of right bank tributaries and returns discharge to this reach. Total DDT levels at Kiona averaged about two-thirds of those at Euclid due to dilution and sedimentation. f The Roza-Sunnyside Board of Joint Control installed an adult fish barrier in lower Sulphur Creek Wasteway during the winter of 2007-08.

Yakima Pesticides/PCBs TMDL: Vol 1, WQ Study Findings Page 72
Dieldrin was at or below detection limits from Harrison to Parker, including in the Naches River and, in most cases, Moxee Drain. There did not appear to be large dieldrin sources in this reach of the river. Dieldrin increased by a factor of at least 2 at Euclid and then decreased slightly by Kiona.
Figure 23. Average Total DDT Concentrations in the Lower Yakima River during the 2007 Irrigation Season (ng/L = parts per trillion, concentration proportional to circle area, non-detects shown as less than ½ detection limit).

Yakima Pesticides/PCBs TMDL: Vol 1, WQ Study Findings Page 73
Figure 24. Average Dieldrin Concentrations in the Lower Yakima River during the 2007 Irrigation Season (ng/L = parts per trillion, concentration proportional to circle area, non-detects shown as less than ½ detection limit).
Figure 25 shows how DDE and total DDT levels varied at Euclid and Kiona from April 2007 through March 2008. These are the two mainstem locations where water quality criteria were not being met consistently. The daily flow at Kiona is also shown (USGS station 12510500 http://waterdata.usgs.gov/wa/nwis/sw). DDE and total DDT varied directly with discharge. The pattern corresponded to changes in suspended sediment and reflects the affinity these compounds have for soil particles and other suspended matter. The suspended sediment data are discussed later in this report. Concentrations of DDT compounds were similar at both locations, except during the second half of the irrigation season (July- October) when much lower levels were measured at Kiona. This can be partly attributed to dilution. Due to irrigation withdrawals, the flow at Euclid was about 80% of the flow at Kiona during this period. Lower river velocities also cause suspended sediments to settle out, thereby reducing concentrations of DDT compounds in the water column. The low gradient reach from above Sunnyside (approximately r.m. 70) to Prosser Dam (r.m. 47.2) is an area where deposition is known to occur (Zuroske, 2008). USGS has characterized this reach as a “slow-moving meandering pool” (Morace et al., 1999).

Yakima Pesticides/PCBs TMDL: Vol 1, WQ Study Findings Page 74
Figure 25. Seasonal Patterns in DDE and Total DDT at Two Sites in the Lower Mainstem Yakima River (ng/L= parts per trillion; non-detects plotted at the reporting limit).
The highest DDE and total DDT concentrations were recorded during a storm event in December (12/4/08). Ebbert and Embrey (2002) and others have demonstrated that pesticides like DDT that persist in soil continue to be transported in Yakima River streams and drains throughout the year, especially during storm runoff or snowmelt. DDE was meeting the human health criterion (0.59 ng/L) at Euclid and Kiona throughout most the irrigation season. However, it was at or close to the criterion in June and September and exceeded the criterion at Euclid in early October. Concentrations fluctuated widely during the
0
1,000
2,000
3,000
4,000
5,000
6,000
7,000
8,000
9,000
10,000
0
0.2
0.4
0.6
0.8
1
1.2
1.4
cubic feet per second
ng/L (parts per trillion)
DDE
EUCLID
KIONA
Kiona Flow
Human Health Criterion
0
1,000
2,000
3,000
4,000
5,000
6,000
7,000
8,000
9,000
10,000
0
0.2
0.4
0.6
0.8
1
1.2
1.4
1.6
1.8
2
cubic feet per second
ng/L (parts per trillion)
T‐DDT
EUCLID
KIONA
Kiona Flow
AquaticLife Criterion

Yakima Pesticides/PCBs TMDL: Vol 1, WQ Study Findings Page 75
winter, at which time the human health criterion was exceeded on two occasions. The river was at or above the chronic aquatic life criterion for total DDT (1.0 ng/L) on three occasions, once during irrigation and twice during the winter. A different pattern was observed for dieldrin, which showed an inverse relationship with flow (Figure 26). Concentrations increased substantially at Euclid and Kiona as flows decreased during the second half of the irrigation season; dieldrin then dropped to levels at or below detection in the fall and winter. Unlike DDT compounds, dieldrin was little affected by the December storm event. Thus, dieldrin appears to fluctuate primarily with the amount of available dilution.
Figure 26. Seasonal Patterns in Dieldrin Concentrations at Two Sites in the Lower Mainstem Yakima River (ng/L= parts per trillion; non-detects plotted at the reporting limit).
The contrasting behavior of dieldrin vs. DDT compounds is likely due to dieldrin’s greater solubility and lower affinity for suspended matter. Estimates obtained from the SPMD deployments indicate that more than 90% of the dieldrin is in dissolved form and not associated with particulates. The inverse relationship with flow suggests a potential groundwater contribution. A similar pattern was not observed in any of the four major irrigation returns, but has been reported for Wide Hollow Creek and attributed to subsurface flows (Johnson and Burke, 2006). The human health criterion for dieldrin (0.14 ng/L) was exceeded at Euclid at the start of the irrigation season and from July through September. Kiona had lower concentrations, but was at or slightly above the criterion on a number of occasions during the second half of the irrigation season and substantially exceeded it once. Dieldrin never approached the chronic aquatic life criterion (1.9 ng/L) at either location. Endosulfan and chlorpyrifos exhibited several distinct peaks associated with their application during the growing season (Figure 27). Concentrations were uniformly low during the winter.
0
1,000
2,000
3,000
4,000
5,000
6,000
7,000
8,000
9,000
10,000
0
0.05
0.1
0.15
0.2
0.25
0.3
0.35
cubic feet per second
ng/L (parts per trillion)
Dieldrin
EUCLID
KIONA
Kiona Flow
Human Health Criterion

Yakima Pesticides/PCBs TMDL: Vol 1, WQ Study Findings Page 76
Figures 28 and 29 give a snapshot of the concentrations observed during the initial spike detected on April 4-5, 2007. At this time, concentrations in the lower river increased by more than a factor of 3 for endosulfan and by a factor of 10 or more for chlorpyrifos. Although neither of these insecticides approached water quality criteria, the timing of the maximum concentrations may have been missed due to the twice-a-month sampling schedule.
Figure 27. Seasonal Patterns in Endosulfan and Chlorpyrifos Concentrations at Two Sites in the Lower Mainstem Yakima River (ng/L= parts per trillion; non-detects plotted at the reporting limit).
0
1,000
2,000
3,000
4,000
5,000
6,000
7,000
8,000
9,000
10,000
0
0.5
1
1.5
2
2.5
3
cubic feet per second
ng/L (parts per trillion)
Endosulfan
EUCLID
KIONA
Kiona Flow
[Water quality criteria not exceeded]
0
1000
2000
3000
4000
5000
6000
7000
8000
9000
10000
0
5
10
15
20
25
cubic feet per second
ng/L (parts per trillion)
Chlorpyrifos
EUCLID
KIONA
Kiona Flow
[Water quality criteria not exceeded]

Yakima Pesticides/PCBs TMDL: Vol 1, WQ Study Findings Page 77
Figure 28. Endosulfan Concentrations in the Lower Yakima River on April 4-5, 2007 (ng/L = parts per trillion, concentration proportional to circle area, non-detects shown as less than ½ detection limit).

Yakima Pesticides/PCBs TMDL: Vol 1, WQ Study Findings Page 78
Figure 29. Chlorpyrifos Concentrations in the Lower Yakima River on April 4-5, 2007 (ng/L = parts per trillion, concentration proportional to circle area).
Major Irrigation Returns Time-series plots for DDE, total DDT, and dieldrin in Moxee Drain, Granger Drain, Sulphur Creek Wasteway, and Spring Creek are displayed in Figures 30-33. Flow data were obtained from USGS (http://waterdata.usgs.gov/wa/nwis) or gauged in the field (Spring Creek). In general, concentrations increased in the early part of the irrigation season, followed by a decrease into fall and winter. Sulphur Creek Wasteway showed a second period of elevated concentrations during winter that corresponded to increases in TSS and turbidity. In Moxee Drain and Spring Creek, water quality criteria violations for DDT compounds and dieldrin were primarily limited to the irrigation season. Granger Drain and Sulphur Creek Wasteway had exceedances throughout the year.

Yakima Pesticides/PCBs TMDL: Vol 1, WQ Study Findings Page 79
Figure 30. DDT Compounds and Dieldrin in Moxee Drain during 2007-08.
0
20
40
60
80
100
120
140
0
0.2
0.4
0.6
0.8
1
1.2
1.4
1.6
1.8
2
CF
S
ng/L
Moxee
DDE
Flowhuman health criterion
0
20
40
60
80
100
120
140
0
0.5
1
1.5
2
2.5
3
CF
S
ng/L
Moxee
T-DDT
Flow
aquatic life criterion
0
20
40
60
80
100
120
140
0
0.02
0.04
0.06
0.08
0.1
0.12
0.14
0.16
CF
S
ng/L
Moxee
Dieldrin
Flow
human health criterion

Yakima Pesticides/PCBs TMDL: Vol 1, WQ Study Findings Page 80
Figure 31. DDT Compounds and Dieldrin in Granger Drain during 2007-08.
0
10
20
30
40
50
60
0
1
2
3
4
5
6
CF
S
ng/L
Granger
DDE
Flow
human health criterion
0
10
20
30
40
50
60
0
2
4
6
8
10
12
CF
S
ng/L
Granger
T-DDT
Flow
(50 ng/L)
aquatic life criterion
0
10
20
30
40
50
60
0
0.1
0.2
0.3
0.4
0.5
0.6
0.7
CF
S
ng/L
Granger
Dieldrin
Flowhuman health criterion

Yakima Pesticides/PCBs TMDL: Vol 1, WQ Study Findings Page 81
Figure 32. DDT Compounds and Dieldrin in Sulphur Creek Wasteway during 2007-08.
0
100
200
300
400
500
600
700
0
0.5
1
1.5
2
2.5
3
CF
S
ng/L
Sulphur
DDE
Flowhuman health criterion
0
100
200
300
400
500
600
700
0
0.5
1
1.5
2
2.5
3
3.5
CF
S
ng/L
Sulphur
T-DDT
Flowaquatic life criterion
0
100
200
300
400
500
600
700
00.10.20.30.40.50.60.70.80.9
1
CF
S
ng/L
Sulphur
Dieldrin
Flowhuman health criterion

Yakima Pesticides/PCBs TMDL: Vol 1, WQ Study Findings Page 82
Figure 33. DDT Compounds and Dieldrin in Spring Creek during 2007-08.
0
20
40
60
80
100
120
0
0.5
1
1.5
2
2.5
CF
S
ng/L
Spring
DDE
Flowhuman health criterion
0
20
40
60
80
100
120
0
1
2
3
4
5
6
CF
S
ng/L
Spring
T-DDT
Flowaquatic life criterion
0
20
40
60
80
100
120
0
0.05
0.1
0.15
0.2
0.25
0.3
0.35
CF
S
ng/L
Spring
Dieldrin
Flow
human healthcriterion

Yakima Pesticides/PCBs TMDL: Vol 1, WQ Study Findings Page 83
Endosulfan exhibited the same peaks seen in the mainstem, demonstrating that the returns were contributing sources (Figure 34). No mainstem samples were collected that corresponded to the late March 2008 peak seen in all four returns (3/28/08). The maximum endosulfan concentrations observed in the returns were always well within water quality criteria.
Figure 34. Endosulfan and Chlorpyrifos in Four Major Irrigation Returns to the Yakima River during 2007-08.
0
2
4
6
8
10
12
14
16
ng/L
Endosulfan
MOXEE
GRANGER
SULFUR
SPRING
[water quality criteria not exceeded]
0
50
100
150
200
250
ng/L
Chlorpyrifos
MOXEE
GRANGER
SULFUR
SPRING
chronic aquatic life criterion
acute aquatic life criterion

Yakima Pesticides/PCBs TMDL: Vol 1, WQ Study Findings Page 84
The returns and the mainstem showed corresponding chlorpyrifos peaks in April. The mainstem peaks of August and October, however, were not seen in any of the returns, indicating there were other sources. The highest chlorpyrifos levels were recorded at the start of irrigation in both 2007 and 2008, at which time the acute aquatic life criterion was exceeded in Spring Creek and, marginally, in Moxee Drain. Endosulfan and chlorpyrifos are applied during certain windows over the growing season. Again, peak concentrations were potentially missed with a twice-a month sampling regime. Ecology conducted more intensive pesticides monitoring in Sulphur Creek Wasteway and Spring Creek during 2007 as part of the Surface Water Monitoring Program for Pesticides in Salmonid- Bearing Streams (SWMP; Dugger et al., 2008). Samples were collected weekly from February through October. Current-use pesticides are the focus of this ongoing effort. SWMP’s chlorpyrifos data are compared to results from twice-a-month sampling in Figure 35. Although the present study detected the approximate timing of the chlorpyrifos peaks, it did not record the highest concentrations, which substantially exceeded criteria. During the remainder of the year, concentrations were below the SWMP reporting limit of 33 ng/L and thus not comparable to the present study (0.06 ng/L reporting limit). SWMP also monitored Sulphur Creek Wasteway and Spring Creek in previous years. Although chlorpyrifos levels appeared to be lower, acute or chronic aquatic life criteria were still exceeded during peak usage periods (Table 24). SWMP’s reporting limit for endosulfan is 50 ng/L. Endosulfan has not been detected at or above this level in either of these returns. Reporting limits for DDT compounds, dieldrin, and other 303(d) listed pesticides analyzed by SWMP are not low enough to compare to water quality criteria.

Yakima Pesticides/PCBs TMDL: Vol 1, WQ Study Findings Page 85
Figure 35. Chlorpyrifos Concentrations in Sulphur Creek Wasteway and Spring Creek Compared to Results from the SWMP (Dugger et al., 2008; non-detects plotted at the reporting limit).
0
50
100
150
200
250
300
ng/L
Chlorpyrifos in Spring Creek
SWMP
Present Studyacute aquatic life criterion
chronic aquatic life criterion
0
20
40
60
80
100
120
140
160
180
ng/L
Chlorpyrifos in Sulphur Creek
SWMP
Present Study
acute aquatic life criterion
chronic aquatic life criterion

Yakima Pesticides/PCBs TMDL: Vol 1, WQ Study Findings Page 86
Table 24. Summary of Chlorpyrifos Data Reported for Sulphur Creek Wasteway and Spring Creek by SWMP (ng/L; parts per trillion).
Year: 2007 2006 2005 2004 2003
Monitoring Period: Feb.-Sept. March-Oct. March-Oct. April-Oct. April-Dec.
Sulphur Creek Wasteway No. of Samples 31 24 29 31 18 Detection Frequency 13% 29% 21% 19% 19% Median Concentration 100 13 19 11 8 Maximum Concentration 170 100 37 47 13
Spring Creek No. of Samples 31 36 29 31 18 Detection Frequency 19% 31% 24% 19% 24% Median Concentration 30 15 28 11 4 Maximum Concentration 270 60 89 77 9
Source: Burke et al. (2006); Dugger et al. (2008).
Pesticide Loads The routine monitoring data were used to calculate average loads of total DDT, dieldrin, endosulfan, and chlorpyrifos in the Yakima River, Naches River, and major returns during the 2007 irrigation season (Table 25). A concentration equal to half the reporting limit was assumed where a pesticide was not detected.
Table 25. Average Loads of Selected 303(d) Pesticides during the 2007 Irrigation Season (grams per day).
Location Mean Flow
(cfs) Total DDT Dieldrin Endosulfan Chlorpyrifos
Yakima River at Harrison 1,646 ~0.1 ~0.2 ~0.4 ~0.9 Naches River at mouth 1,843 0.8 ~0.1 1.0 ~4.0 Yakima River at Parker 2,081 0.7 ~0.2 2.2 6.4 Yakima River at Euclid 2,657 3.2 0.6 5.2 27 Yakima River at Kiona 3,227 3.6 0.6 4.3 36
Moxee Drain 62 0.3 0.01 0.2 1.3 Granger Drain 37 0.3 0.03 0.1 0.2 Sulfur Creek Wasteway 293 1.3 0.3 1.2 2.3 Spring Creek 46 0.2 0.02 0.1 1.0
Note: Half the reporting limit used for non-detects. "~" indicates >50% of samples were below reporting limit.

Yakima Pesticides/PCBs TMDL: Vol 1, WQ Study Findings Page 87
Figure 36 shows the loads in downstream order. A substantial increase in loading is evident between Harrison Bridge and Euclid for all four pesticides, with most of the increase occurring between Parker and Euclid. Total DDT, dieldrin, and endosulfan loads remained about the same between Euclid and Kiona indicating an absence of large sources in this reach. There was increased chlorpyrifos loading downstream of Euclid.
Figure 36. Average Loads of Selected 303(d) Pesticides during the 2007 Irrigation Season (grams per day).
0.1
0.7
3.23.6
0.8
0.3 0.3
1.3
0.2
0.0
0.5
1.0
1.5
2.0
2.5
3.0
3.5
4.0
gram
s pe
r da
y
Total DDT
Mainstem
Tributaries/Returns

Yakima Pesticides/PCBs TMDL: Vol 1, WQ Study Findings Page 88
Figure 36. Average Loads of Selected 303(d) Pesticides (continued).
0.2 0.2
0.60.6
0.1
0.01 0.03
0.3
0.020.0
0.1
0.2
0.3
0.4
0.5
0.6
0.7
gram
s pe
r da
yDieldrin
Mainstem
Tributaries/Returns
0.4
2.2
5.2
4.3
1.0
0.2 0.1
1.2
0.10.0
1.0
2.0
3.0
4.0
5.0
6.0
gram
s pe
r da
y
Endosulfan
Mainstem
Tributaries/Returns
0.9
6.4
27
36
4.01.3 0.2
2.3 1.00
5
10
15
20
25
30
35
40
gram
s pe
r da
y
Chlorpryrifos
Mainstem
Tributaries/Returns
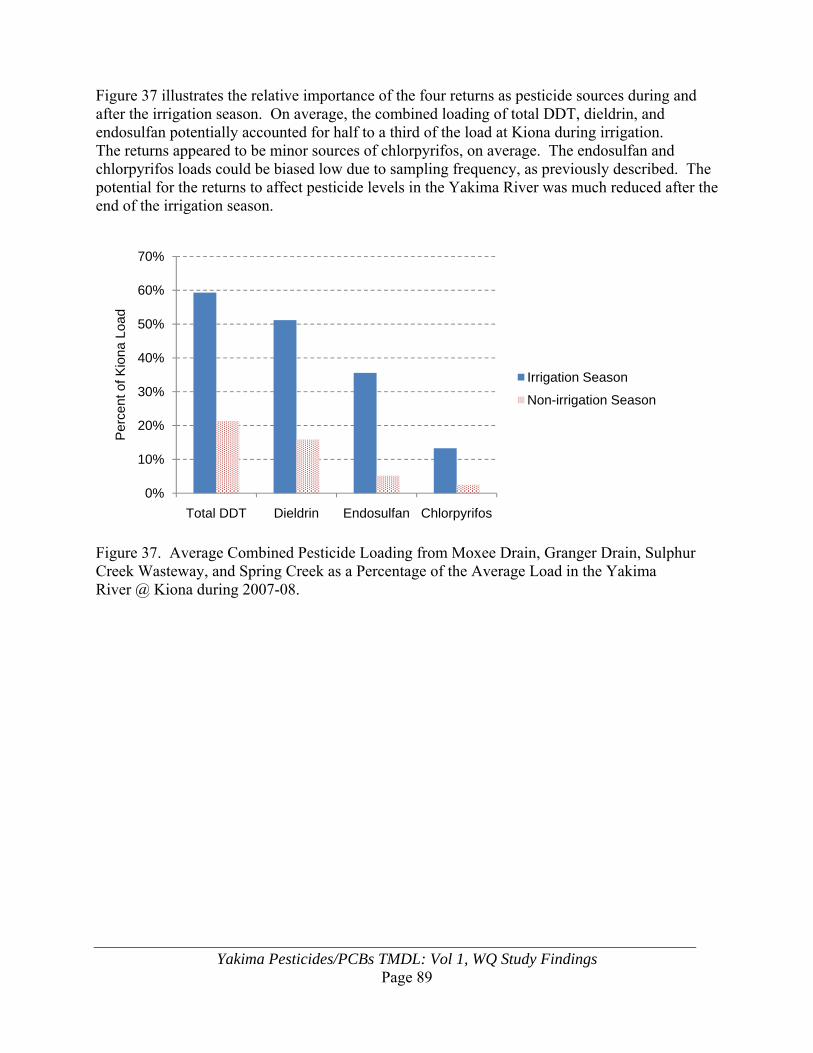
Yakima Pesticides/PCBs TMDL: Vol 1, WQ Study Findings Page 89
Figure 37 illustrates the relative importance of the four returns as pesticide sources during and after the irrigation season. On average, the combined loading of total DDT, dieldrin, and endosulfan potentially accounted for half to a third of the load at Kiona during irrigation. The returns appeared to be minor sources of chlorpyrifos, on average. The endosulfan and chlorpyrifos loads could be biased low due to sampling frequency, as previously described. The potential for the returns to affect pesticide levels in the Yakima River was much reduced after the end of the irrigation season.
Figure 37. Average Combined Pesticide Loading from Moxee Drain, Granger Drain, Sulphur Creek Wasteway, and Spring Creek as a Percentage of the Average Load in the Yakima River @ Kiona during 2007-08.
0%
10%
20%
30%
40%
50%
60%
70%
Total DDT Dieldrin Endosulfan Chlorpyrifos
Per
cent
of K
iona
Loa
d
Irrigation Season
Non-irrigation Season

Yakima Pesticides/PCBs TMDL: Vol 1, WQ Study Findings Page 90
Other Lower River Tributaries and Returns Twenty-three additional tributaries and irrigation returns to the lower Yakima River were screened for pesticides, suspended sediment, and turbidity during 2007-08. Most of these discharges had either never been sampled for pesticides or the samples had not been analyzed down to human health criteria levels. Quarterly monitoring provided results for 85 samples. The sampling locations were previously shown in Figure 8. A summary of the data for 303(d) listed pesticides is provided in Table 26. Reporting limits were the same as for the routine monitoring stations (0.061-0.067 ng/L, 3 ng/L for toxaphene). Once again, pesticides not on the 303(d) list were infrequently detected or present at low levels. The complete results from the screening survey are in Appendix K.
Table 26. Summary of Results from Screening for 303(d) Listed Pesticides in 23 Tributaries and Irrigation Returns to the Lower Yakima River during 2007-08 (concentrations in ng/L, parts per trillion).
DDT DDE DDD Dieldrin
No. of Samples 85 85 85 84 Detection Frequency (%) 44% 93% 65% 46% Median Concentration 0.066 U 0.56 0.11 U 0.11 U Mean Concentration 0.24 1.0 0.21 0.25 90th Percentile Concentration 0.63 2.8 0.48 0.55 Maximum Concentration 1.3 6.1 1.3 1.9
Endosulfan Chlorpyrifos Chlordane Alpha-BHC
No. of Samples 84 84 85 85 Detection Frequency (%) 79% 83% 7% 2% Median Concentration 0.33 0.65 0.063 U 0.063 U Mean Concentration 0.66 2.2 0.064 U 0.064 U 90th Percentile Concentration 1.3 7.3 0.065 U 0.065 U Maximum Concentration 12 21 0.14 0.14 U = not detected at or above reported value.
Pesticide detection frequencies and concentration levels were generally similar to findings for Moxee Drain, Granger Drain, Sulphur Creek Wasteway, and Spring Creek. DDT and dieldrin, however, tended to be detected less frequently. DDE, total DDT, and dieldrin exceeded water quality criteria in a number of the screening survey discharges. Endosulfan, chlorpyrifos, chlordane, and alpha-BHC were always meeting criteria. Toxaphene was not detected at or above 3 ng/L. Figure 38 plots the DDE, total DDT, and dieldrin concentrations as a ratio of the applicable water quality criterion (concentration divided by criterion). Values greater than 1.0 exceed the criterion. The results are arranged in downstream order, starting with Selah Creek above the city of Yakima (r.m. 123.7) and ending with Amon Wasteway near Richland (r.m. 2.1).

Yakima Pesticides/PCBs TMDL: Vol 1, WQ Study Findings Page 91
Figure 38. Concentration:Criteria Ratios for DDT compounds and Dieldrin in 23 Tributaries and Irrigation Returns to the Lower Yakima River (ratios >1 exceed criterion).
SELAH CK
WENAS
SELAH DCH
TAYLOR D
COWICHEE
WIDE H
OL
AHTANUM
ZILLAH
EAST TOP
SUB 35
MARION
TOPP CK
COULEE
SATUS CK
SOUTH DRDID
7
SATUS 302
SATUS 303
DRAIN 31
GRANDVIEW
WAUNA
CORRAL
AMON02468
1012
DD
E:H
H C
r ite
rio n
DDE
SELAH CK
WENAS
SELAH DCH
TAYLOR D
COWICHEE
WIDE HOL
AHTANUM
ZILLAH
EAST TOP
SUB 35
MARION
TOPP CK
COULEE
SATUS CK
SOUTH DR
DID 7
SATUS 302
SATUS 303
DRAIN 31
GRANDVIEW
WAUNA
CORRAL
AMON0
5
10
15
Die
ldri
n:H
H C
rite
rio n
Dieldrin
SELAH CK
WENAS
SELAH DCH
TAYLOR D
COWICHEE
WIDE H
OL
AHTANUM
ZILLAH
EAST TOP
SUB 35
MARION
TOPP CK
COULEE
SATUS CK
SOUTH DR
DID 7
SATUS 302
SATUS 303
DRAIN 31
GRANDVIEW
WAUNA
CORRAL
AMON012345678
T-D
DT
:Aqu
atic
Lif
e C
rit.
T-DDT

Yakima Pesticides/PCBs TMDL: Vol 1, WQ Study Findings Page 92
Table 27 highlights those discharges where human health or chronic aquatic life criteria were exceeded by a factor of 2 or more in at least half of the quarterly screening samples. Ten discharges fall into this category. All are irrigation return or have a significant agricultural return flow component (Wide Hollow Creek). Because sample size for the screening survey was small, these results may over or underestimate the true extent of water quality criteria violations in individual discharges.
Table 27. Lower Yakima River Irrigation Returns that Substantially Exceeded Human Health or Chronic Aquatic Life Criteria in Screening Samples Collected during 2007-08. (N=4)
Irrigation Return Human Health Criteria
Exceeded
Chronic Aquatic Life Criteria
Exceeded DDE Dieldrin Total DDT
Grandview Drain
Satus Drain #302
Drain #31
Selah Ditch
Zillah Drain
Satus Drain #303 South Drain
Subdrain 35
Wide Hollow Creek
East Toppenish Drain
There was evidence of substantial amounts of un-degraded DDT in several of these returns (Table 28). As discussed elsewhere in this report, the source is assumed to be disturbance of subsurface soils rather than recent use. All other tributaries and drains in the screening survey consistently had 35% or less DDT.
Table 28. Instances Where a High Proportion of Un-degraded DDT was Found in 2007-08 Screening Survey Samples (DDT as percent of total DDT).
Irrigation Return Collection Period
May-07 Aug-07 Nov-07 Feb-08
Satus 302 65% 65% ---- not flowing ---- South Drain 63% 40% 3% 3% Subdrain 35 60% 29% 3% 14% Grandview Drain 24% 32% 15% 55%

Yakima Pesticides/PCBs TMDL: Vol 1, WQ Study Findings Page 93
Overall, the screening survey showed water quality criteria for DDE and total DDT were exceeded more frequently during the irrigation season (Figure 39). Dieldrin exceeded at a similar rate both during and after irrigation.
Figure 39. Percent of Samples Exceeding Human Health or Chronic Aquatic Life Criteria (T-DDT) in 23 Tributaries and Irrigation Returns to the Lower Yakima River during (May/August) and after (November/February) the 2007 Season (quarterly samples).
0%
10%
20%
30%
40%
50%
60%
DDE DDT DDD Dieldrin T-DDT
Per
cent
of S
ampl
es E
xcee
ding
Crit
erio
n
May/Aug
Nov/Feb

Yakima Pesticides/PCBs TMDL: Vol 1, WQ Study Findings Page 94
Ecology’s SWMP has done intensive pesticide monitoring in Marion Drain, located on the Yakama Reservation (Dugger et al., 2008). The results for 2007 show two large chlorpyrifos peaks that were missed in the quarterly screening survey samples (Figure 40). The acute aquatic life criterion was exceeded on both occasions. Endosulfan was not detected in these samples at or above 50 ng/L. SWMP reporting limits for other 303(d) listed pesticides were not low enough to compare to water quality criteria.
Figure 40. Chlorpyrifos Concentrations Measured in Marion Drain Compared to Results from the SWMP (Dugger et al., 2008; non-detects plotted at the reporting limit).
In a 2005-06 study, Ecology conducted twice-a-month monitoring for dieldrin and endosulfan in Wide Hollow Creek which flows through Union Gap (Johnson and Burke, 2006). As in 2007-08, Wide Hollow consistently exceeded the human health criterion for dieldrin (Figure 41). The chronic aquatic life criterion was also exceeded on two occasions. Peak dieldrin concentrations occurred after the irrigation season and showed an inverse relationship with flow and positive correlation with conductivity. This was attributed to subsurface drainage in the watershed. Endosulfan showed a spring peak in Wide Hollow associated with the treatment window in local orchards. Water quality criteria were not exceeded, which is consistent with the quarterly samples collected in 2007-08.
0
50
100
150
200
250
300
ng/L
Chlorpyrifos in Marion Drain
SWMP
Present Studyacute aquatic life criterion
chronic aquatic life criterion

Yakima Pesticides/PCBs TMDL: Vol 1, WQ Study Findings Page 95
Figure 41. Results from Monitoring Dieldrin and Endosulfan in Wide Hollow Creek in 2005-06 (Johnson and Burke, 2006).
0.0
5.0
10.0
15.0
20.0
25.0
30.0
35.0
40.0
0
0.5
1
1.5
2
2.5
CF
S
ng/L
Dieldrin
Flow
human health criterion
chronic aquatic life criterion
0.0
5.0
10.0
15.0
20.0
25.0
30.0
35.0
40.0
0
5
10
15
20
25
30
35
CF
S
ng/L
Endosulfan
Flow
[water quality criteria not exceeded]

Yakima Pesticides/PCBs TMDL: Vol 1, WQ Study Findings Page 96
The screening survey data from May and August were used to provide a rough estimate of the average combined loads of total DDT, dieldrin, endosulfan, and chlorpyrifos during the 2007 irrigation season (Table 29). The loads are compared to the loads measured through more intensive monitoring of the four major returns. The screening survey results, although limited, suggest these discharges may have a comparable impact on the river.
Table 29. Pesticide Loads from 23 Screening Survey Tributaries and Irrigation Returns Compared to Loads from the Four Major Returns: Moxee Drain, Granger Drain, Sulfur Creek Wasteway, and Spring Creek (average combined load during the 2007 irrigation season (grams per day).)
Source Total DDT Dieldrin Endosulfan Chlorpyrifos Screening Survey Tributaries & Returns*
2.1 0.30 1.1 8.7
Major Returns† 2.1 0.33 1.5 4.8
*May and August samples. †April through October samples.
Comparison with Historical Pesticide Data Surface Water Pesticide levels in the lower Yakima River before and after the Suspended Sediment and DDT TMDL have been documented for 1988-89 (Rinella et al., 1993, 1999), 1992-96 (Davis, 1993; Davis and Johnson, 1994; Davis, 1996; Davis et al., 1998a; Joy and Patterson, 1997; Johnson and Burke, 2006), and 1999-2000 (Ebbert and Embrey, 2002). The analytical methods employed in these studies have been adequate to consistently quantify concentrations of DDT compounds, dieldrin, and endosulfan at a number of locations. Chlorpyrifos has been analyzed, but detections were sporadic. Chlordane and alpha-BHC are rarely seen in the historical water quality data. Figure 42 shows the total DDT, dieldrin, and endosulfan concentrations recorded between 1988 and 2008 for Moxee Drain, Granger Drain, Sulphur Creek Wasteway, Wide Hollow Creek, and the Yakima River at Euclid and Kiona. These sites are where the most significant contamination has been documented. Historical detections of dieldrin and endosulfan have primarily been confined to irrigation returns. As first reported for total DDT by Fuhrer et al. (2004), there has been a significant drop in pesticide levels in Yakima surface water over the past 10 years. Since the TMDL effort was initiated, concentrations of DDT compounds, dieldrin, and endosulfan have decreased by one-to-two orders of magnitude (factors of 10). This can be attributed to the combined effects of reduced soil erosion, pesticide degradation, and, in the case of endosulfan, improved application practices.

Yakima Pesticides/PCBs TMDL: Vol 1, WQ Study Findings Page 97
Figure 42. Pesticide Levels in the Lower Yakima River Drainage, 1988-2008 (nondetects plotted as unfilled symbols).
0
10
20
30
40
50
60
70
80T
otal
DD
T (
ng/L
)Moxee Drain
1988-89
1992-93
1999-2000
2007-08
020406080
100120140160180200
Tot
al D
DT
(ng
/L)
Granger Drain
1988-89
1995
1999-2000
2007-08
(357 ng/L)
0
10
20
30
40
50
60
Tot
al D
DT
(ng
/L)
Sulphur Creek
1988-89
1995
2007-08

Yakima Pesticides/PCBs TMDL: Vol 1, WQ Study Findings Page 98
Figure 42. Historical Pesticide Data (continued).
0
1
2
3
4
5
6
7
8
9T
otal
DD
T (
ng/L
)Yakima River @ Euclid
1988
1995
2007-08
0
1
2
3
4
5
6
Tot
al D
DT
(ng
/L)
Yakima River @ Kiona
1988-89
1999-2000
2007-08
0
2
4
6
8
10
12
Die
ldrin
(ng
/L)
Granger Drain
1988-89
1999-2000
2007-08
(24 ng/L)

Yakima Pesticides/PCBs TMDL: Vol 1, WQ Study Findings Page 99
Figure 42. Historical Pesticide Data (continued).
0
2
4
6
8
10
12
14
16D
ield
rin (
ng/L
)Sulphur Creek
1988-89
2007-08
0102030405060708090
100
En
dosu
lfan
(ng
/L)
Wide Hollow Creek
1988-89
2005-06
2007-08
0
10
20
30
40
50
60
End
osul
fan
(ng
/L)
Moxee Drain
1988-89
2007-08
(141 ng/L)

Yakima Pesticides/PCBs TMDL: Vol 1, WQ Study Findings Page 100
DDT compounds break down extremely slowly. DDT’s half-life in soil has been reported to reach 15-30 years (Makay et al., 1997; Edwards, 1973). Investigations in California have led to the conclusion that DDT is “preserved” in agricultural soils statewide (Agee, 1986; Mischke et al., 1985). Once discharged to surface water, the DDE breakdown product is essentially stable (Callahan et al., 1979). Thus, water quality improvements for DDT in the Yakima River can largely be attributed to soil conservation efforts initiated as a result of the TMDLs. This conclusion is bolstered by the accompanying decreases seen in TSS and turbidity, described later in this report. Fish Tissue Legacy chlorinated pesticide residues have also decreased in Yakima River fish in recent years. The trends, however, are not as clear-cut as in water samples. This is because of differences between studies in analytical methods; when and where fish were collected; the age, sex, tissues, and species analyzed; and fish movements within the river and its tributaries. Yakima River fish have been analyzed for pesticide residues by the U.S. Fish and Wildlife Service, USGS, EPA, and Ecology; the data are tabulated in Johnson et al. (2007). Results on edible tissue samples collected from the lower river since 1995 were examined for comparable data with respect to species, sampling location, and tissues analyzed. Data comparable to results from Ecology’s 2006 survey are limited to two studies which analyzed fillets in four species from the Toppenish-Prosser reach and one species in the Kiona-Horn Rapids reach (Davis et al., 1998b; EPA, 2002a). One or two composite samples were analyzed for each species, with five or more individual fish per composite. These data show a large decrease in DDE and dieldrin residues in lower Yakima River fish between 1995 and 2006 (Figure 43). Fish Consumption Advisories In 1993, the Washington State Department of Health (WDOH) issued an advisory that recommended limiting consumption of bottom fish from the lower Yakima River due to the high levels of DDT compounds. WDOH evaluated Ecology’s 2006 fish tissue data and observed that DDT levels had dropped substantially. They determined that “the fish advisories based on DDT levels were no longer needed.” A news release was issued on April 30, 2009 lifting the fish consumption advisory due to the lower DDT levels
In the same news release, WDOH concluded that PCB levels in carp from the lower Yakima River were above background levels for Washington State freshwater fish, indicating the need for consumers to reduce their exposure. WDOH advised that people limit consumption of common carp in the lower section of the river to one meal per week. The advisory applies to carp taken from the city of Prosser to the Yakima River mouth near Richland.
The full text of WDOH’s news release is in Appendix L.

Yakima Pesticides/PCBs TMDL: Vol 1, WQ Study Findings Page 101
Figure 43. DDE and Dieldrin in Fillets from Lower Yakima River Fish: 1995, 1998, and 2006 (ug/Kg = parts per billion; error bars are minimum and maximum values). Data from the present study on PCBs in surface water and permitted discharges in the Yakima basin is discussed in sections of this report that follow.
0
200
400
600
800
1000
1200
1400
1995 2006 1998 2006 1998 2006 1995 2006 1998 2006
DD
E (
ug/K
g, w
et)
Toppenish - Prosser ReachKiona - Horn-Rapids Reach
Carp Whitefish
Sucker
Bass
Bass
0
2
4
6
8
10
12
14
16
18
20
1995 2006 1998 2006 1998 2006 1995 2006 1998 2006
Die
ldrin
(ug
/Kg,
wet
)
Toppenish-Prosser Reach Kiona - Horn Rapids Reach
Carp
Whitefish
Sucker Bass
Bass

Yakima Pesticides/PCBs TMDL: Vol 1, WQ Study Findings Page 102
PCBs and Toxaphene Unlike other samples collected for this study, the surface water data on PCBs and toxaphene were obtained by a passive sampling technique using a semipermeable membrane device (SPMD). This was done due to the expense and difficulty of analyzing these compounds directly in whole water samples. Whole surface water samples were screened for toxaphene, but at high detection limits. Although chemical concentrations derived from SPMDs usually agree closely with other types of more complex low-level sampling techniques, the results are calculated values based on experimental uptake rates and partitioning theory and should therefore be considered estimates. The calculation procedures are outlined in Appendix H. The SPMDs were deployed for approximately 30 days each during the irrigation season (May-June) and after the end of irrigation (October-November) at six sites on the mainstem and in six major tributaries and irrigation returns. In view of the 303(d) listings for PCBs in fish from Keechelus Lake and the Yakima Canyon, the sampling effort was extended into the upper Yakima River, with SPMDs placed in the mainstem at Easton, above Ellensburg, and in Wilson Creek. The deployment sites were previously shown in Figures 10 and 11. Concentrations The concentration estimates obtained for total PCBsg and toxaphene are shown in Table 30. The results are the total concentrations (dissolved + particulate fractions) and represent a 30-day, time-weighted average. Figure 44 plots the data in downstream order to illustrate spatial and temporal patterns; non-detects were plotted at zero. The residue and dissolved concentration data on which the totals are based are in Appendix M. During the irrigation season, PCB concentrations were two-to-four times higher in the mainstem lower Yakima River compared to the upper mainstem. The lower river approached the human health criterion (0.14 vs. 0.17 ng/L). The Naches River had elevated PCB levels compared to the upper Yakima River at Roza Dam, but during the irrigation season only. Granger Drain and Sulphur Creek Wasteway both appeared to be significant PCB sources, substantially exceeding the human health criterion during the irrigation season. The Naches River was at the human health criterion in the spring. Lower PCB concentrations were observed in most areas after the end of irrigation. The chronic aquatic life criterion for PCBs (14 ng/L) was never approached in any of these samples. PCBs are associated with urban/industrial applications more so than agriculture. They were used in closed applications (e.g., capacitor, transformers, heat transfer and hydraulic fluids) and, to a lesser extent, open-end applications (e.g., flame retardants, inks, adhesives, carbonless paper, paints, pesticide extenders, and plasticizers) (ATSDR, 2000).
g Total PCBs is the sum of detected concentrations of the 209 individual PCB compounds analyzed.

Yakima Pesticides/PCBs TMDL: Vol 1, WQ Study Findings Page 103
In contrast to other chemicals in this study, toxaphene’s chronic aquatic life criterion is more restrictive than its human health criterion (0.2 ng/L vs. 0.73-0.75 ng/L). The acute aquatic life criterion for toxaphene, however, is relatively high at 730 ng/L.
Table 30. Estimated PCB and Toxaphene Concentrations in the Yakima River, Tributaries, and Irrigation Returns during Spring and Fall 2007 (ng/L, parts per trillion).
Location Total PCBs Toxaphene
May-June Oct.-Nov. May-June Oct.-Nov.
Mainstem Easton Dam 0.12 UJ 0.034 J 0.08 UJ 0.08 UJ
Ellensburg Water Co. Diversion
0.026 J 0.057 J 0.10 UJ 0.08 UJ
Roza Dam 0.050 J 0.019 J 0.19 J 0.08 UJ Sunnyside Dam 0.057 J 0.011 J 0.23 J 0.10 J Prosser Dam 0.14 J 0.070 J 0.31 J 0.13 J Horn Rapids Dam 0.14 J 0.020 J 0.37 J 0.10 J
Tributaries/Returns Wilson Creek* 0.041 J 0.039 J 0.52 J 0.13 J Naches River 0.18 J 0.016 J 0.12 J 0.09 UJ Moxee Drain 0.078 J 0.080 J 0.73 J 0.15 J Granger Drain 0.49 J 0.27 J 0.87 J 0.30 J Sulphur Creek 0.80 J 0.12 J 2.9 J 0.70 J Spring Creek 0.11 J 0.086 J 0.43 J 0.19 J
*Wilson Creek PCB data for May-June are from a sample collected during same time frame in 2008. U = not detected at or above reported value. J = estimated value.

Yakima Pesticides/PCBs TMDL: Vol 1, WQ Study Findings Page 104
Figure 44. Estimated PCB and Toxaphene Concentrations in the Mainstem Yakima River, Tributaries, and Irrigation Returns during and after the 2007 Irrigation Season (non-detects plotted at zero).
0.0
0.1
0.2
0.3
0.4
0.5
0.6
0.7
0.8
0.9ng
/L (p
arts
per
tril
lion)
May-June Oct.-Nov. Total PCBs
Human Health Criterion
Upper Yakima River Lower Yakima River
0
0.5
1
1.5
2
2.5
3
3.5
ng/L
(par
ts p
er t
rillio
n)
May-June Oct.-Nov. Toxaphene
Human Health Criterion
Aquatic Life Criterion
Upper Yakima River Lower Yakima River

Yakima Pesticides/PCBs TMDL: Vol 1, WQ Study Findings Page 105
Toxaphene levels gradually increased in the mainstem Yakima River moving downstream from Easton to Horn Rapids Dam below Kiona. During the irrigation season, toxaphene was below detection limits down to at least Ellensburg (Ellensburg Water Co. Diversion). Wilson Creek, which enters the Yakima at Ellensburg, had an elevated toxaphene concentration of 0.52 ng/L. Further downstream, levels rose to 0.19 ng/L at Roza Dam, and 0.23 ng/L by Sunnyside Dam just below the city of Yakima, slightly exceeding the chronic aquatic life criterion. Between Sunnyside Dam and Horn Rapids, toxaphene nearly doubled to 0.37 ng/L. After the end of the irrigation season, toxaphene continued to exhibit increased concentrations in the lower river, but remained within criteria. Toxaphene substantially exceeded the chronic aquatic life criterion in Wilson Creek, Moxee Drain, Granger Drain, and especially Sulphur Creek Wasteway. This occurred primarily during the irrigation season, at which time the 0.2 ng/L criterion was exceeded by a factor of 2-4 in Wilson Creek, Moxee Drain, and Granger Drain, and by more than a factor of 10 in Sulphur Creek Wasteway (2.9 ng/L). Concentrations decreased markedly in all the four drains after the end of irrigation, but remained elevated in Sulphur Creek, exceeding the criterion by a factor of 3. Toxaphene was at or above the human health criterion in three of these returns. As previously noted, toxaphene was also detected in whole water samples from Moxee Drain and Sulphur Creek Wasteway during routine monitoring water quality monitoring. The Moxee Drain detections were estimated at 3.5 and 7.0 ng/L on 5/2/07 and 5/23/07, respectively. The Sulphur Creek Wasteway detections were estimated at 4.3 and 4.1 ng/L on 5/24/07 and 7/24/07, respectively. These concentrations are much higher than the average values seen in the SPMDs. All other whole water samples from these drains were below the reporting limit of 3 ng/L. Toxaphene is primarily an agricultural chemical, once used on cotton, fruit, vegetables, small grains, and livestock (ATSDR, 1996). 80-85% of the toxaphene produced in the U.S. was used on cotton or soybeans in the southeast U.S. Its secondary major use for parasite control on livestock may be noteworthy in connection with the high toxaphene levels in Sulphur Creek Wasteway. The Sulfur Creek drainage has a particularly high concentration of dairies and feedlots, with approximately 150 confined animal feeding operations (Carmack, 2008). Many of these were in existence prior to the ban on toxaphene in 1990. No low-level data were obtained on PCB or toxaphene levels in the Yakima basin surface water from December through April. Results from stormwater sampling, described later in this report, suggest there is potential for elevated concentrations during this period. Due to the expense and difficulty of analyzing these chemicals, there are no useful data on historical levels of PCBs or toxaphene in Yakima surface water. The PCB and toxaphene concentrations measured in the Yakima mainstem were lower than would be predicted from the fish samples Ecology collected the previous year. Total PCBs exceeded the human health criterion in most of the fish species analyzed in 2006. Toxaphene exceeded the human health criterion in some lower river species. In the two sets of SPMD samples analyzed in 2007, several tributaries exceeded human health criteria for PCBs and toxaphene, but the mainstem did not exceed for human health.

Yakima Pesticides/PCBs TMDL: Vol 1, WQ Study Findings Page 106
Several factors contribute to this apparent discrepancy. First, 2007 was preceded by several years of lower than average streamflows which affords less dilution for PCBs and toxaphene discharges. Second, the 2007 results do not include the winter or early spring when there is potential for elevated PCB and toxaphene levels. Third, the EPA bioconcentration factors (BCFs) used to calculate the human heath criteria are based on fish uptake from water only. Food is known to be an especially important pathway for PCBs (Mackay and Fraser, 2000). Finally, the EPA BCFs are national averages that do not necessarily correspond closely to the BCF for every fish species and location. Loads Table 31 has estimates of PCB and toxaphene loads in the Yakima River during the first part of the irrigation season (May-June SPMD data). The calculations are based on the average flow during the deployment period. Flow data were obtained from the USBR Yakima Hydromet website (www.usbr.gov/pn/hydromet/yakima/yakwebarcread.html), USGS website (http://waterdata.usgs.gov/wa/nwis), or gauged in the field (Spring Creek). Half the reporting limit was used where a chemical was not detected. Figure 45 shows the loads plotted in downstream order from Easton to Horn Rapids.
Table 31. Estimates of PCB and Toxaphene Loads during May-June 2007 (grams per day).
Location Average Flow Total
PCBs Toxaphene
(cfs)
Mainstem Easton Dam 936 ~0.14† ~0.09† Ellensburg Water Co. Diversion 4,290 0.28 ~0.50† Roza Dam 2,676 0.33 1.2 Sunnyside Dam 5,143 0.72 2.9 Prosser Dam 4,465 1.5 3.4 Horn Rapids Dam 5,519 1.9 5.0
Tributaries/Returns Wilson Creek 545/556* 0.06 0.70 Naches River 3,590 1.6 1.1 Moxee Drain 76 0.01 0.14 Granger Drain 26 0.03 0.06 Sulphur Cr. Wasteway 247 0.48 1.8 Spring Creek 56 0.02 0.05
*In Wilson Creek, PCB data are for 2008 (556 cfs); toxaphene data are for 2007 (545 cfs). †Not detected; load calculated at half the reporting limit.

Yakima Pesticides/PCBs TMDL: Vol 1, WQ Study Findings Page 107
Figure 45. Estimates of PCB and Toxaphene Loads in the Yakima River during May-June, 2007 (nondetects plotted at half the detection limit, see Table 31).
Mainstem loads of PCBs and toxaphene increased substantially in the lower river. The PCB loads from the Naches River and Sulphur Creek Wasteway stand out among lower river sources. Sulphur Creek also carried a large toxaphene load compared to the mainstem. The toxaphene load in the Naches River was comparable to the load from the upper Yakima River. The relatively high PCB and toxaphene loads in the Naches are more by virtue of flow than concentration.
0.140.28 0.33
0.72
1.5
1.9
0.06
1.6
0.01 0.03
0.48
0.020.0
0.4
0.8
1.2
1.6
2.0gr
ams
per
day
Mainstem Tributaries/Returns
Total PCBs
0.090.50
1.2
2.93.4
5.0
0.70 1.10.14 0.06
1.8
0.050.0
1.0
2.0
3.0
4.0
5.0
6.0
gram
s pe
r da
y
Mainstem Tributaries/Returns
Toxaphene

Yakima Pesticides/PCBs TMDL: Vol 1, WQ Study Findings Page 108
Suspended Sediment Concentrations This study analyzed suspended sediment as TSS. Routine monitoring results for TSS in surface water are summarized in Table 32 for the 2007 irrigation season, which was the focus of sampling effort. The complete data are in Appendix J.
Table 32. Summary of Results from Monitoring Suspended Sediment (TSS) in the Lower Yakima River during the 2007 Irrigation Season (mg/L, parts per million; N=13).
Location Median Mean 90th
Percentile Maximum
Mainstem Yakima River at Harrison 10 11 17 24 Yakima River at Parker 10 12 16 27 Yakima River at Euclid 14 23 54 67 Yakima River at Kiona 11 19 42 76
Tributaries Naches River 7 9 14 29 Moxee Drain 61 73 124 139 Granger Drain 27 67 163 180 Sulphur Creek Wasteway 26 35 73 80 Spring Creek 14 37 85 218
Figure 46 plots the individual TSS results for the lower Yakima mainstem for April 2007 through March 2008. TSS varied directly with flow. Except for the December storm event, the highest concentrations occurred during the first half of the irrigation season. Numerous other studies have shown that suspended sediment in the Yakima River is linked to the irrigation cycle. After irrigation, TSS levels were generally low in the mainstem, except for the December storm when a concentration of 342 mg/L was recorded at Euclid. The storm samples were taken over a two-day period (12/4-5/08) and not timed to make the results directly comparable among sites. The Harrison TSS sample (6 mg/L) was collected before the storm began to affect the river.

Yakima Pesticides/PCBs TMDL: Vol 1, WQ Study Findings Page 109
Figure 46. Total Suspended Solids Concentrations in the Mainstem Lower Yakima River during 2007-08, Showing the Flow at Kiona.
0
1000
2000
3000
4000
5000
6000
7000
8000
9000
10000
0
50
100
150
200
250
300
350
400
Flo
w (
cfs)
TS
S (
mg/
L)
Parker
Euclid
Kiona
Harrison
Kiona Flow
Irrigation Season (see detail below)
0
1000
2000
3000
4000
5000
6000
7000
8000
9000
10000
0
10
20
30
40
50
60
70
80
Flo
w (c
fs)
TSS
(m
g/L
)
Parker
Euclid
Kiona
Harrison
Kiona Flow
Irrigation Season

Yakima Pesticides/PCBs TMDL: Vol 1, WQ Study Findings Page 110
Figure 47 illustrates the average TSS concentrations during the 2007 irrigation season. TSS levels at Harrison and the Naches River were generally similar and increased only slightly by Parker. As with other water quality parameters, the major TSS impacts to the river occurred between Parker and Euclid. On average, TSS concentrations in the Yakima River at Euclid (23 mg/L) and at Kiona (19 mg/L) were higher than Harrison (11 mg/L) by about a factor of 2. Maximum TSS levels were recorded on June 6-7, at which time the downstream increase in TSS was by about a factor of 3 (from 24 mg/L to 76 mg/L) (Figure 48 ).
Figure 47. Average Total Suspended Solids Concentrations in the Lower Yakima River during the 2007 Irrigation Season (mg/L = parts per million; concentrations proportional to circle area).

Yakima Pesticides/PCBs TMDL: Vol 1, WQ Study Findings Page 111
Figure 48. Average Total Suspended Solids Concentrations in the Lower Yakima River on June 6-7, 2007 (mg/L = parts per million; concentrations proportional to circle area).
The TSS concentrations measured in the four major returns during 2007-08 are plotted in Figure 49. The highest levels, approaching or exceeding 100 mg/L, occurred when water was being applied to fields early in the irrigation season. Concentrations decreased substantially as the growing season progressed, often dropping to levels at or below those seen during the winter. TSS was elevated in Granger Drain and Sulphur Creek Wasteway on several occasions during the winter, even though flows were low. Weather records and field notes indicate snow or rain around the time these samples were collected.

Yakima Pesticides/PCBs TMDL: Vol 1, WQ Study Findings Page 112
Figure 49. Total Suspended Solids and Flow in Major Lower Yakima River Irrigation Returns during 2007-08.
020406080100120140
020406080
100120140160
Flo
w (
cfs)
TS
S (
mg/
L)
TSS
Flow
Moxee
0102030405060
0
50
100
150
200
Flo
w (
cfs)
TS
S (
mg/
L)
TSS
Flow
Granger
0100200300400500600700
0102030405060708090
Flo
w (
cfs)
TS
S (
mg/
L)
TSS
Flow
Sulphur
020406080100120
0
50
100
150
200
250
Flo
w (
cfs)
TS
S (
mg/
L)
TSS
Flow
Spring

Yakima Pesticides/PCBs TMDL: Vol 1, WQ Study Findings Page 113
Loads Beales ratio estimator (Dolan et al., 1981) was used to calculate suspended sediment loads for the 2007 irrigation season (Table 33, Figure 50). The Beales method uses the ratio of the load to the flow on sampled days, adjusted by the mean flow for that time period (from continuous flow data) to estimate the mean load over the period of interest. This weighting approach avoids missing major components of the load during times when TSS was not measured. Flow data for the calculations were obtained from the USBR (www.usbr.gov/pn/hydromet/) and USGS (http://waterdata.usgs.gov/wa/nwis/sw) websites. The Beales method was used in the two previous Yakima River suspended sediment and pesticide TMDLs. Beales estimator is not appropriate for the pesticide data because it was not always closely correlated with flow. Suspended sediment data were not obtained on the Roza Power Return (from the diversion at Roza Dam above Harrison), the Wapato Canal Diversion, or the Sunnyside Canal Diversion, all of which are located between the Naches River and Parker. A significant portion of the mainstem flow is diverted into the Wapato and Sunnyside canals (up to 1,000 to 2,000 cfs, respectively). Therefore the suspended sediment load calculated for Parker cannot be directly compared to the combined load from the Yakima River at Harrison and the Naches River. Previous studies concluded the load from the Roza Return was a third to half the load in the Naches River (Joy and Patterson, 1997; Morace et al., 1999).
Table 33. Estimates of Suspended Sediment Loads in the Mainstem Yakima River, Naches River, and Major Irrigation Returns during the 2007 Irrigation Season.
Location Average Flow
(cfs) Tons
per Day Tons
per Season
Yakima River at Harrison 1,566 58 12,320 Naches River at mouth 1,818 66 14,072 Yakima River at Parker 1,945 89 18,886 Yakima River at Euclid 2,603 263 55,718 Yakima River at Kiona 2,906 236 49,974
Moxee Drain 63 13 2,810 Granger Drain 37 5 1,149 Sulphur Creek Wasteway 306 30 6,449 Spring Creek 46 5 1,161

Yakima Pesticides/PCBs TMDL: Vol 1, WQ Study Findings Page 114
Figure 50. Estimates of Suspended Sediment Loads in the Lower Yakima River during the 2007 Irrigation Season.
The suspended sediment load in Moxee Drain (13 tons per day) was 15% of the Parker load (89 tons per day). Loading between Parker and Euclid increased three-fold, from 89 tons per day to 263 tons per day (18, 886 vs. 55,718 tons over the entire irrigation season). The combined loading from Granger Drain (5 tons per day) and Sulphur Creek Wasteway (30 tons per day) accounted for 35 tons per day to this reach (7,598 tons for the season). Therefore, roughly 20% of the increased loading can be attributed to Granger Drain and Sulphur Creek Wasteway. The remaining 80% was from other sources. USGS attributed a large portion of the suspended sediment load to right-bank tributaries and returns that flow through the Yakama Reservation (Morace et al., 1999). There was a net suspended sediment loss of approximately 10% between Euclid and Kiona (27 tons per day; 5,700 tons per season). Earlier studies estimated losses of 50-150 tons per day to this reach (Joy and Patterson, 1997; Morace, 1999) and attributed it to sedimentation brought about by the reduced channel velocities between Sunnyside and Prosser. A small portion of the loss can also be attributed to the Kennewick Irrigation District and Kiona Canal diversions (<300 cfs) above Kiona. The Yakima River at Kiona was transporting approximately 240 tons of suspended sediment per day or about 50,000 tons over the 2007 irrigation season. Under similar conditions of water supply during the 1995 irrigation season, the suspended sediment load at Kiona was estimated to have been more than twice that at 574 tons per day (Joy and Patterson, 1997). Only two sets of samples (May and August) were collected from other lower Yakima River tributaries and returns during the 2007 irrigation season (Appendix K). Based on these limited data, the average combined TSS load was 48 pounds per day, which is comparable to the combined load of 53 pounds per day from Moxee Drain, Granger Drain, Sulphur Creek
5889
263236
66
13 530
50
50
100
150
200
250
300T
ons
per
Day
Mainstem Tributaries/Returns

Yakima Pesticides/PCBs TMDL: Vol 1, WQ Study Findings Page 115
Wasteway, and Spring Creek. Thus, these other discharges appear to contribute a significant share of the sediment load. These results give an incomplete picture of suspended sediment sources and transport in the lower Yakima River drainage. Detailed mass balances for sediment can be found in the above referenced reports and in Ebbert et al. (2002). Volatile Suspended Solids Improved water clarity in the lower Yakima River has led to increased growth of algae and aquatic plants in recent years. Algae and plant fragments form part of the TSS load. A large contribution could potentially lead to the wrong conclusion about suspended sediment sources and reasons for noncompliance with turbidity criteria and TMDL targets. An analysis for total non-volatile suspended solids (TNVSS) was therefore included in the 2007-08 water quality study to assess the relative importance of plant-derived material in the lower mainstem. Volatile solids (TSS minus TNVSS) were assumed to represent algae and plant fragments. The results are summarized as percent volatile solids in Table 34.
Table 34. Volatile Solids as Percent of Total Suspended Solids in the Yakima River, Naches River, and Four Major Irrigation Returns, 2007-08.
Location N= Mean
Yakima River at Harrison 18 25% Naches River 18 21% Yakima River at Parker 18 18% Yakima River at Euclid 18 16% Yakima River at Kiona 18 16%
Granger Drain 19 11% Moxee Drain 19 17% Sulfur Creek Wasteway 19 12% Spring Creek 19 18%
On average, there was a decrease in relative amounts of volatile solids moving downstream from Harrison Bridge to Kiona, suggesting that algae and plant fragments were a progressively less important part of the suspended sediment load. The volatile solids fraction in the four major irrigation returns was similar to or slightly less than the mainstem at Parker, Euclid, and Kiona. There were no significant differences among sites (Kruskal-Wallis test). Thus, aquatic growths did not appear to be an important factor to take into account in assessing suspended sediment sources and impacts to the Yakima River.

Yakima Pesticides/PCBs TMDL: Vol 1, WQ Study Findings Page 116
Turbidity Turbidity was analyzed in conjunction with TSS. The turbidity results for the 2007 irrigation season are summarized in Table 35. As with TSS, turbidity levels were generally low after the end of irrigation. The individual turbidity data are in Appendix J and K.
Table 35. Summary of Results from Monitoring Turbidity in the Lower Yakima River during the 2007 Irrigation Season (NTU, nephelometric turbidity units; N=13).
Location Median Mean 90th
Percentile Maximum
Mainstem Yakima River at Harrison 4.2 5.1 7.6 12 Yakima River at Parker 5.3 6.6 11 17 Yakima River at Euclid 7.4 10 22 27 Yakima River at Kiona 4.2 8.7 19 32
Tributaries/Returns Naches River 6.6 7.6 12 17 Moxee Drain 16 17 22 33 Granger Drain 12 22 41 60 Sulphur Creek Wasteway 9.4 12 18 25 Spring Creek 5.4 12 31 50
Turbidity Criteria and TMDL Targets The adverse effects of suspended sediment on fish and wildlife, water supplies, and aesthetic enjoyment are addressed through Washington State’s turbidity criteria. Turbidity is caused by the presence of suspended matter such as clay, silt, finely divided organic and inorganic matter, and microscopic organisms. As previously described, the Lower Yakima River Suspended Sediment and DDT TMDL set a schedule for meeting numeric turbidity targets in the mainstem, tributaries, and irrigation returns. Milestones to be achieved by 2007 include the following:
By 2002: “The Yakima River mainstem will comply with the turbidity target of not more than a 5 NTU increase between the confluence of the Yakima and Naches Rivers and the Van Giesan Road bridge at West Richland (RM 8.4).”
By 2007: “The mouths of all tributaries and drains, and all points within all basin tributaries and drains, will comply with the 90th percentile turbidity target of 25 NTU.”
The mainstem turbidity target was based on the criteria in the state standards. The criteria state that turbidity shall not exceed 5 NTU over background when turbidities are 50 NTU or less. When background turbidity is more the 50 NTU, no more than a 10% increase is allowed. The 25 NTU target for tributaries and drains was intended to protect fish and other aquatic organisms, and to assist in compliance with the turbidity target for the mainstem. 25 NTU was

Yakima Pesticides/PCBs TMDL: Vol 1, WQ Study Findings Page 117
derived from a review of EPA guidance, recommendations by the National Academy of Sciences, Idaho’s turbidity criteria, and the scientific literature. The 90th percentile is the concentration exceeded by no more than 10% of samples. The 25 NTU target was to be applied to the irrigation season. Joy and Patterson (1997) assessed the turbidity background in the lower Yakima River during the 1994 and 1995 irrigation seasons by calculating the 90th percentile below the confluence of the Yakima and Naches Rivers. The 90th percentile allows for seasonal variability, supports full beneficial use protection under EPA policy (EPA, 1995), and is adequate for background definition under Ecology policy (Ecology, 1996). Background turbidity was calculated in the same way for the 2007-08 water quality study. Coffin et al. (2006) reported background turbidity during TMDL effectiveness monitoring over the 2003 irrigation season, but based it on samples collected at Terrace Heights Bridge below the Naches River confluence. These four separate determinations of the turbidity background for the lower Yakima River are compared in Table 36.
Table 36. Background Turbidity (90th percentile) in the Lower Yakima River: Previous TMDL, Effectiveness Monitoring, and Present Study.
Year Background
Turbidity Background
+5 NTU Data Source
1994 irrigation season* 5 NTU 10 NTU Joy & Patterson (1997)
1995 irrigation season* 9 NTU 14 NTU Joy & Patterson (1997)
2003 irrigation season† 10 NTU 15 NTU Coffin et al. (2006)
2007 irrigation season** 10 NTU 15 NTU present study *June-October samples. †4/16/03 - 10/15/03 samples. **4/4/07 - 10/3/07 samples.
During the irrigation season, background turbidity in the lower Yakima River was 5 NTU in 1994, 9 NTU in 1995, and 10 NTU in 2003 and 2007. Less turbidity was experienced in 1994 because river flows were down due to low water supply. Turbidity was essentially the same (9 -10 NTU) during the 1995, 2003, and 2007 irrigation seasons, when flows were comparable and closer to normal. The 1994 and 1995 results might have been higher if the turbidity measurements had included April and May, as in 2003 and 2007. Figure 51 shows the individual turbidity measurements in the lower Yakima River at Parker, Euclid, and Kiona during 2007-08. The results are compared to the 5 NTU increase over background allowed in the turbidity criteria and set as the TMDL target. Because background turbidity exceeded 50 NTU during the December storm event, the criterion for those results was set for a 10% increase above background.

Yakima Pesticides/PCBs TMDL: Vol 1, WQ Study Findings Page 118
Figure 51. Turbidity in the Lower Yakima River during 2007-08 Compared to the State Turbidity Criteria and 2002 TMDL Target. Failure to meet the turbidity target in 2007-08 was primarily confined to the first half of the irrigation season and limited to the Yakima River at Euclid and Kiona. The Yakima was always meeting the target at Parker. As with suspended sediment, the area where most of the turbidity increase occurred was between Parker and Euclid. Table 37 summarizes how often turbidity exceeded the TMDL target in the lower Yakima River during 2007-08.
0
20
40
60
80
100
120
140
160
180
NTU
TMDL Target
Euclid
Kiona
Parker
Irrigation Season (see detail below)
0
5
10
15
20
25
30
35
NTU
TMDL Target
Euclid
Kiona
Parker
Irrigation Season

Yakima Pesticides/PCBs TMDL: Vol 1, WQ Study Findings Page 119
Table 37. Percent of Samples Exceeding the Existing TMDL Turbidity Target in the Mainstem Lower Yakima River during 2007-08.
Time Period Percent of Samples
Exceeding Parker Euclid Kiona
2007 Irrigation Season (n=13) 0% 23% 23%
November 07-March 08 (n=5) 0% 40% 20%
2007-08 overall (n=18) 0% 28% 22%
The 40% exceedance of the turbidity target at Euclid during the winter may overstate the extent of the problem. The two samples in question were only marginally above the target (7.7 vs. 6.0 NTU in February and 11 vs. 9.0 NTU in March). Note, however, that sample size during the winter months was small (N=5) and turbidity events may have been missed. Compliance of the four major returns with the TMDL 90th percentile 25 NTU target for lower Yakima River tributaries and drains is illustrated in Figure 52. During the 2007 irrigation season, the 90th percentile turbidities in Moxee Drain and Sulphur Creek Wasteway were well within the target (22 and 18 NTU, respectively). Granger Drain and, to a lesser extent, Spring Creek exceeded the target (41 and 31 NTU, respectively). Additional turbidity data on these returns for 2007 is discussed starting on page 121.
Figure 52. Compliance with the 90th Percentile 25 NTU Turbidity Target in Four Major Irrigation Returns to the Lower Yakima River during the 2007 Irrigation Season. (N=13)
The March 2008 results are not included in Figure 52. A turbidity reading of 90 NTU was recorded in Granger Drain on March 28 at the start of the 2008 irrigation season, substantially exceeding the 25 NTU TMDL target. Turbidity in the three other returns ranged from 13-28 NTU on that date.
0
5
10
15
20
25
30
35
40
45
Moxee Drain
Granger Drain
Sulphur Creek
Spring Creek
Tur
bidi
ty (
NT
U)
Median
90th Percentile
2007 TMDL Target
2007 Irrigation Season(4/4-10/4 samples)

Yakima Pesticides/PCBs TMDL: Vol 1, WQ Study Findings Page 120
One significant difference between Sulphur Creek Wasteway and Granger Drain is that Sulphur Creek receives major operational spills from both the Roza and Sunnyside canals, while Granger receives only minor spills from laterals and individual deliveries (Zuroske, 2004). Spill water is unused canal water, typically low in suspended sediment. Spring Creek also receives occasional operational spills (Joy and Patterson, 1997). Figure 53 shows how turbidity levels fluctuated in the four returns over the course of the 2007 irrigation season into March 2008. Exceedances of 25 NTU were associated with periods of increasing flow, most notably during the early irrigation season. The results for Granger Drain suggest the 25 NTU target was chronically exceeded from April through June, whereas the exceedances appeared to be more sporadic in the other returns.
Figure 53. Turbidity and Flow in Four Major Lower Yakima River Irrigation Returns during 2007-08.
0
20
40
60
80
100
120
140
0
5
10
15
20
25
30
35
Flo
w (
cfs)
Tur
bidi
ty (
NT
U)
Turbidity
Flow
Moxee
2007 Turbidity Target
0
10
20
30
40
50
60
0102030405060708090
100
Flo
w (
cfs)
Tur
bidi
ty (
NT
U)
Turbidity
Flow
Granger
2007 Turbidity Target

Yakima Pesticides/PCBs TMDL: Vol 1, WQ Study Findings Page 121
Figure 53. (continued).
Consistent with TSS, turbidity was elevated in Sulphur Creek Wasteway on several occasions during the winter, even though flows were low. A similar but more modest turbidity increase was also seen in Granger Drain. As previously noted, there was snow or rain around the time these samples were collected. The Roza-Sunnyside Board of Joint Control (RSBOJC) also monitored turbidity in Granger Drain, Sulphur Creek Wasteway, Spring Creek, and Snipes Creek (a Spring Creek tributary) during 2007-08. The RSBOJC Water Quality Laboratory has been collecting samples at these locations since 1997, twice a month during the irrigation season and monthly during the non-irrigation season.
0100200300400500600700
0
5
10
15
20
25
30
Flo
w (
cfs)
Tur
bidi
ty (
NT
U)
Turbidity
Flow
Sulphur2007 Turbidity Target
0
20
40
60
80
100
120
0
10
20
30
40
50
60
Flo
w (
cfs)
Tur
bidi
ty (
NT
U)
Turbidity
Flow
Spring
Turbidity Target for 2007

Yakima Pesticides/PCBs TMDL: Vol 1, WQ Study Findings Page 122
The RSBOJC turbidity data that correspond to the monitoring Ecology did in Granger Drain and Sulphur Creek Wasteway during the 2007-08 water quality study are plotted in Figure 54. The data on all five returns for the 2007 irrigation season are compared in Table 38.
Figure 54. Comparison of Turbidity Data Collected by Ecology and the Roza-Sunnyside Board of Joint Control during 2007-08 (unpublished RSBOJC data provided by Elaine Brouillard).
0
10
20
30
40
50
60
70
Turbidity (NTU
)
Ecology RSBOJC
Granger Drain
0
5
10
15
20
25
30
35
40
Turbidity (NTU
)
Ecology RSBOJC
Sulphur Creek Wasteway

Yakima Pesticides/PCBs TMDL: Vol 1, WQ Study Findings Page 123
Table 38. Comparison of Turbidity Data Collected by Ecology and the Roza-Sunnyside Board of Joint Control during the 2007 Irrigation Season (NTU).
Granger Drain Sulphur Cr. Wasteway
Spring Cr. at mouth
Spring Cr. ab. Snipes
Snipes Cr.
Ecology RSBOJC RSBOJC Ecology RSBOJC Ecology RSBOJC
N = 14 14 14 13 14 14 14 Minimum 5.2 6.8 3.9 6.1 2.9 2.9 1.5 Median 12 15 9.4 11 5.4 6.8 4.4 Mean 22 25 12 12 12 8.9 9.6 90th 41 48 18 20 31 15 21 Maximum 60 56 25 25 50 21 58
(Unpublished RSBOJC data provided by Elaine Brouillard.)
Except for a few instances when peak turbidity levels occurred on different days, the results for Granger Drain and Sulphur Creek Wasteway are in good agreement and not significantly different (K-S two sample test, p>0.3). For the 2007 irrigation season, both data sets concur in finding that Granger Drain exceeded the 90th percentile TMDL turbidity target of 25 NTU and that Sulphur Creek Wasteway was meeting the target. Ecology’s monitoring site for Spring Creek was near its point of discharge to the Yakima River and below its confluence with Snipes Creek. RSBOJC monitors Spring and Snipes Creeks separately. Ecology recorded two elevated turbidity readings (50 and 33 NTU) for lower Spring Creek in late May (5/24) and early June (6/7) of 2007. These two values were sufficiently high to raise the 90th percentile in Ecology’s data set to 31 NTU, which exceeds the 25 NTU target. RSBOJC sampled Spring and Snipes Creeks two days earlier (5/22 and 6/05). Turbidity was low in Spring Creek on both days, but high in Snipes Creek on 6/05 (58 NTU). The 90th percentile turbidities in RSBOJC’s data for the 2007 irrigation season were 15 and 21 NTU, respectively, for Spring and Snipes Creeks. Thus, based on RSBOJC’s results both returns were meeting the TMDL turbidity target. Taken in their entirety, the combined Ecology and RSBOJC data indicate the Spring Creek discharge to the Yakima River was meeting the 25 NTU turbidity target during the 2007 irrigation season. Table 39 summarizes Ecology’s turbidity findings and TMDL target compliance for 2007-08 for the lower Yakima River, incorporating RSBOJC’s findings for Spring and Snipes Creeks in the conclusions. The turbidity data for the 23 other lower river tributaries and returns from Ecology’s 2007-08 screening survey are plotted in Figure 55. Only one set of samples was collected during the spring when turbidity is typically the highest. Satus 302 (42 and 80 NTU), South Drain (39 NTU), and DID #7 (35 NTU) exceeded the 25 NTU target during the irrigation season. Elevated turbidity was also recorded in the winter in Selah Creek and, marginally, in Selah Ditch. Selah Creek is an intermittent stream. The single sample collected here was taken during a period of snowmelt.

Yakima Pesticides/PCBs TMDL: Vol 1, WQ Study Findings Page 124
Table 39. Compliance with Turbidity Criteria and TMDL Targets in the Lower Yakima River Drainage during 2007-08.
Waterbody Meeting
Criteria/Target? Yakima at Parker Yes Yakima at Euclid No Yakima at Kiona No Naches River Yes
Moxee Drain Yes Granger Drain No Sulphur Creek Wasteway Yes Spring Creek Yes
Figure 55. Turbidity in Screening Survey Samples from 23 Other Tributaries and Irrigation Returns to the Lower Yakima River during 2007-08.
Additional turbidity data for a number of the tributaries and returns from the screening survey have been collected by the Yakama Nation, Conservation Districts, Yakima Area Creeks Bacteria TMDL, and USGS. These data were not reviewed for the present report.
0
10
20
30
40
50
60
70
80
90
Tur
bidi
ty (
NT
U)
0.0 0.1 0.2 0.3 0.4 0.5 0.6 0.7 0.8 0.9 1.0Percent of Samples (n=85)
Satus 302 5/17/07
Satus 302 8/15/07South Dr. 5/17/07 Selah Cr. 2/11/08
DID 7 5/16/07
Selah Ditch 11/26/072007 TMDL Target
Fraction of Samples (n=85)

Yakima Pesticides/PCBs TMDL: Vol 1, WQ Study Findings Page 125
Comparison with Historical Turbidity Data Many farmers along the Yakima River have adopted contemporary soil erosion Best Management Practices (BMPs) to meet the 5- and 10-year targets in the Lower Yakima River Suspended Sediment and DDT TMDL. The effectiveness of these measures in reducing turbidity was assessed by Coffin et al. (2006) for the period between 1995 and 2003 and has been widely reported. While it is beyond the scope of the present report to do a comparable assessment, two examples illustrate the magnitude of the water quality improvements that have been realized. A detailed TMDL effectiveness monitoring report drawing on the 2007-08 data will be prepared separately by Ecology. 1. Figure 56 shows the 90th percentile turbidity in the four major irrigation returns to the lower
Yakima River during the 1995, 2003, and 2007 irrigation seasons, based on Ecology’s monitoring programs.
Substantial turbidity reductions occurred in all of these returns between 1995 and 2003. By 2003, Moxee Drain, Sulphur Creek Wasteway, and Spring Creek were meeting the 25 NTU target at least 90% of the time. Although falling short of the target, the largest improvement was seen in Granger Drain. Data showing declining turbidity and TSS levels in lower Yakima River irrigation returns are also reported by Ebbert et al. (2002), Zuroske (2004), and Fuhrer et al. (2004).
Figure 56. 90th Percentile Turbidity in Four Major Returns to the Lower Yakima River during the 1995, 2003, and 2007 Irrigation Seasons.
0
20
40
60
80
100
120
140
Moxee Granger Sulphur Spring
Tur
bidi
ty (
NT
U)
1995
2003
2007
(335 NTU)
TMDL Target

Yakima Pesticides/PCBs TMDL: Vol 1, WQ Study Findings Page 126
2. The Ecology Freshwater Monitoring Unit (FMU) examined trends in the 1995-2008 turbidity data for their ambient monitoring station on the Yakima River at Kiona, using a Seasonal Kendall test (Hallock, 2007). The analysis focused on the irrigation season and only included data from April through October. These data can be found at www.ecy.wa.gov/programs/eap/fw_riv/rv_main.html.
FMU concluded that:
For the whole period there is a strong (p<0.01)h decreasing trend in turbidity (Figure 57). This trend is a result of a strong decline in turbidity from the beginning of the period through August 2005.
Visually, there was a moderate decrease prior to 2000 and a strong decrease in 2000-2005.
The higher turbidities have been back up since August 2005. In months when turbidity is down, it is still fairly low compared to pre-2001.
Peak turbidities are highest in April and May and lowest in August through October.
There is a decreasing trend in flow for the whole period (p=0.02).
Adjusted for flow, there is still a downward trend in turbidity for the full period (p=0.06).
There is significant seasonality in the trend. After adjusting for flow, there is a significant increasing trend in April (p=0.01). Flow-adjusted turbidity declined in all other months, though the decline was not always significant.
h The p-value is the probability that the observed relationship among samples occurred by pure chance. For example, a p-value of .05 (i.e., 1 in 20) indicates there is a 5% probability that the relation is by chance alone.

Yakima Pesticides/PCBs TMDL: Vol 1, WQ Study Findings Page 127
Figure 57. Trend Analysis of Ecology’s Ambient Monitoring Data on Turbidity in the Yakima River at Kiona (Dave Hallock, Ecology FMU).

Yakima Pesticides/PCBs TMDL: Vol 1, WQ Study Findings Page 128
Permitted Discharges Municipal Wastewater Treatment Plants Eighteen municipal wastewater treatment plants (WWTPs) that discharge to surface waters in the Yakima River basin were monitored quarterly for pesticides, PCBs, TSS, and turbidity between June 2007 and March 2008. Seventy-two sets of samples were analyzed in all. Facility locations were previously shown in Figure 13. The three Yakama Reservation WWTPs – Wapato, Harrah, and Toppenish – were not sampled as these are under EPA jurisdiction. Ecology lacks regulatory authority to impose wasteload allocations and NPDES discharge limitations on Yakama Nation lands. Pesticides were not analyzed for the three upper river facilities – Cle Elum, Ellensburg, and Kittitas – due to the existing TMDL for these compounds. Monitoring results for WWTP effluent are summarized in Table 40. The complete data are in Appendix N. WWTP effluent contains numerous substances that interfere with a pesticide analysis, making it difficult to achieve low detection limits. As a result, pesticide reporting limits in the effluent samples were typically in the range of 2.0 – 5.5 ng/L vs. less than 0.1 ng/L in surface water. The reporting limit for toxaphene in WWTP effluent was 25 – 27 ng/L compared to 3 ng/L for whole surface water samples and about 0.1 ng/L in SPMDs. The only 303(d) listed pesticides detected in WWTP effluent were the current-use insecticides chlorpyrifos and endosulfan, 33% and 12% of samples, respectively. Toxaphene was also not detected. Chlorpyrifos was most frequently reported in effluent from the Cowiche, Yakima, Sunnyside, and Mabton WWTPs (75% of samples). Cowiche and Yakima were also the only facilities where endosulfan was detected (100% and 50% of samples, respectively). These details can be seen in Appendix N. The maximum concentrations recorded were 11 ng/L for chlorpyrifos and 46 ng/L for endosulfan. These concentrations are within human health and aquatic life criteria. The analytical method employed for PCBs has greater specificity and is less subject to interferences. PCBs were detected in almost every effluent sample (96%). The overall median and average total PCB concentrations were 0.37 and 0.58 ng/L, respectively. Figure 58 plots the PCB data and compares the data with the human health criterion of 0.17 ng/L. Because the Yakima River approaches or exceeds human health criteria for PCBs it has no excess loading capacity. Therefore the effluent data are compared directly to the criterion, rather than allowing for dilution in the receiving waters.

Yakima Pesticides/PCBs TMDL: Vol 1, WQ Study Findings Page 129
Table 40. Summary of Results from Monitoring 303(d) Listed Pesticides, PCBs, TSS, and Turbidity in Final Effluents from Wastewater Treatment Plants in the Yakima Basin during 2007-08 (quarterly samples from 18 facilities).
DDT DDE DDD Dieldrin (ng/L) (ng/L) (ng/L) (ng/L)
No. of Samples 60 60 60 60 Detection Frequency (%) 0% 0% 0% 0% Median Concentration 2.6 U 2.6 U 2.6 U 2.6 U Mean Concentration 3.1 U 3.1 U 3.1 U 3.1 U 90th Percentile Concentration 5.1 U 5.1 U 5.1 U 5.1 U Maximum Concentration 5.5 U 5.5 U 5.5 U 5.5 U
Chlorpyrifos Endosulfan Chlordane Alpha-BHC (ng/L) (ng/L) (ng/L) (ng/L)
No. of Samples 60 60 60 60 Detection Frequency (%) 33% 12% 0% 0% Median Concentration 3.2 U 2.6 U 2.6 U 2.6 U Mean Concentration 3.9 U 5.6 U 3.1 U 3.1 U 90th Percentile Concentration 5.7 J 5.4 J 5.1 U 5.1 U Maximum Concentration 11 J 46 J 5.5 U 5.5 U
Total PCBs* Toxaphene TSS Turbidity (ng/L) (ng/L) (mg/L) (NTU)
No. of Samples 72 60 72 72 Detection Frequency (%) 96% 0% 96% 100% Median Concentration 0.37 J 26 U 4 2.2 Mean Concentration 0.58 J 26 U 20 6.0 90th Percentile Concentration 0.96 J 27 U 25 6.0 Maximum Concentration 7.4 J 27 U 555 190
*Total PCBs is the sum of detected concentrations of the 209 PCB compounds analyzed. U = not detected at or above reported value. J = estimated.

Yakima Pesticides/PCBs TMDL: Vol 1, WQ Study Findings Page 130
Figure 58. PCB Concentrations in Final Effluents from WWTPs in the Yakima Basin during 2007-08 Compared to Human Health Criterion (quarterly samples from 18 facilities, ng/L = parts per trillion). Eighty-two percent of the effluent samples (59 out of 72) exceeded the PCB human health criterion. Approximately half (52%) exceeded by more than a factor of 2. Substantially elevated concentrations greater than 1.0 ng/L (1.1-7.4 ng/L) were observed sporadically. Except for the occasional spike in concentration, most facilities were discharging a similar level of PCBs (Figure 59)i. The June 2007 sample from the Selah WWTP had an unusually high concentration of total PCBs at 7.4 ng/L. PCB levels in subsequent samples were similar to WWTPs in other parts of the basin. Aquatic life criteria for PCBs are relatively high: 14 ng/L for chronic exposure and 2,000 ng/L for acute exposure. These levels were not approached in any of the WWTP effluents.
i In box and whisker plots of this type, 50% of the results fall within the box, the horizontal line representing the median. The whiskers show the range of values that are within a factor of 1.5 of the spread of the box. Asterisks and empty circles (next figure) are outside and far outside values, respectively.

Yakima Pesticides/PCBs TMDL: Vol 1, WQ Study Findings Page 131
Figure 59. Total PCB Concentrations in Final Effluents from Yakima Basin WWTPs during 2007-08 (ng/L = parts per trillion). The effluents tended to have higher PCB concentrations during the winter compared to the irrigation season (Figure 60). Total PCBs gradually increased from early summer to late winter, with median concentrations going from 0.20 to 0.26 to 0.34 to 0.70 ng/L between June and March. The differences between sampling periods were statistically significant (p<0.05, Kruskal-Wallis test). Higher winter concentrations could be due to more surface runoff entering the collection systems. Stormwater samples for the present study showed that urban runoff has elevated PCBs levels (see Urban Stormwater Runoff). Dilution by infiltration of irrigation water during the growing season could be an equally important factor.
Figure 60. PCB Concentrations in Yakima Basin WWTP Effluents by Month of Sample Collection, 2007-08 (one outlier excluded: Selah WWTP 7,360 pg/L in June).
CLE ELUM
ELENSBURG
KITTITAS
SELAH
NACHES
COWICHE
YAKIMA
MOXEE
BUENA
ZILLAH
GRANGER
SUNNYSIDE
SS PORT
MABTON
GRANDVIEW
PROSSER
BENTON CITY
W RICHLAND
012345678
Tot
al P
CB
s (n
g /L
)
June September December March0
1
2
3
To
tal P
CB
s (n
g/L
)

Yakima Pesticides/PCBs TMDL: Vol 1, WQ Study Findings Page 132
Table 41 summarizes the PCBs, DDT, and dieldrin data that have been reported for WWTP effluents in other parts of Eastern Washington. These results indicate that the PCB concentrations measured at Yakima basin facilities are typical of WWTP effluent. The pesticide data are more limited, but suggest DDT compounds and dieldrin are characteristically low in WWTP effluent, including facilities located in agricultural areas such as the Palouse, Okanogan, and Walla Walla.
Table 41. Summary of Low-Level PCB, DDT, and Dieldrin Data for Eastern Washington WWTP Effluents (ng/L; parts per trillion; mean values).
Receiving Water/ Year N= Total PCBs Total DDT Dieldrin Reference
WWTP
Palouse River
Lubliner (2009) Pullman 2007-08 3 1.4 NA 0.27 Colfax 2007-08 3 0.33 NA 0.20 Albion 2007-08 1 1.5 NA <0.03
Okanogan River
Serdar (2006) Oroville 2001-02 2-3 <.65 0.9 NA Omak 2001-02 2-3 <.65 <1.6 NA Okanogan 2001-02 2-3 <.65 1.6 NA
Walla Walla River
Johnson et al. (2004) Lubliner (2007)
Walla Walla 2002-03 4 0.79 0.23 <0.25 2006-07 3 0.38 NA NA
College Place 2002-03 4 1.3 0.08 <0.21
2006-07 3 0.30 NA NA
Spokane River Golding (2002) Spokane 2001 2 1.8 NA NA
Liberty Lake 2001 2 1.7 NA NA
Yakima River present study
18 facility mean 2007-08 72 0.58 <2 <2 NA = not analyzed.

Yakima Pesticides/PCBs TMDL: Vol 1, WQ Study Findings Page 133
Estimates of PCB loading from Yakima basin WWTPs are shown in Table 42. Because pesticides were either not detected or were meeting water quality criteria, loads were not calculated.
Table 42. Summary of Total PCB Loads Measured in Final Effluents from Yakima Basin WWTPs during 2007-08.
Jun-07 Sep-07 Dec-07 Mar-08 Overall Mean
Per WWTP Mean Flow (mgd) 1.3 1.3 1.1 1.1 1.2 Mean PCB Concentration (ng/L) 0.67 0.31 0.52 0.81 0.58 Mean PCB Load (mg/day) 4.2 3.0 4.0 3.8 3.7
WWTPs Combined Total Flow (mgd) 24 24 20 19 22 Total PCB Load (mg/day) 76 54 71 68 67 mgd = million gallons per day.
The flow reported by each facility was used to calculate the total PCB load for each of the quarterly sampling events. The average facility was discharging approximately 0.6 ng/L total PCBs at a loading rate to the receiving waters of about 4 mg/day. The combined loading from all facilities averaged 67 mg/day. The loading rates measured during the four monitoring periods were similar. Decreasing effluent flow rates from June through March acted to maintain a similar level of PCB loading even though concentrations were on the increase. TSS and turbidity levels in Yakima basin WWTP effluents were almost always low, indicating the treatment systems were operating properly. Overall median concentrations were 4 mg/L TSS and 2.2 NTU turbidity at the times these samples were collected (Table 40). Although PCBs have an affinity for particulate matter, there was no evidence of a correlation between total PCBs and TSS (R2=0.19)j. In most instances, TSS concentrations were in compliance with the weekly average limit set by the NPDES permit (typically 45 mg/L). Three of the four effluent samples from the Port of Sunnyside WWTP represent upset conditions with elevated TSS (Appendix N), but the facility was not discharging to surface water at those times. NPDES permits for Yakima basin WWTPs do not contain discharge limits for pesticides or PCBs.
j R2 indicates the percent of the PCB data that is explained by TSS (coefficient of determination).

Yakima Pesticides/PCBs TMDL: Vol 1, WQ Study Findings Page 134
Figure 61 compares the average effluent flow rate on days of sample collection at each WWTP with the design flow. The NPDES permits state that design flows are not to be exceeded. Most facilities were operating at lower than design flow and thus may have additional treatment capacity. Cases where the sampled flow was at or above design flow were primarily limited to Moxee WWTP (wastewater now goes to Yakima WWTP) and the Port of Sunnyside WWTP (discharge was going to a sprayfield). The larger facilities were always operating well below design flow (10-70% of design).
Figure 61. WWTP Effluent Flow during Monitoring Periods in 2007-08 vs. Design Flow (million gallons per day).
0.0
0.5
1.0
1.5
0.0 0.5 1.0
Sam
pled
Flo
w (
mgd
)
Design Flow (mgd)
Sampled Flow =Design Flow
<1 MGD Facilities
0
5
10
15
20
25
0 5 10 15 20 25
Sam
pled
Flo
w (
mgd
)
Design Flow (mgd)
Sampled Flow =Design Flow
>1 MGDFacilities

Yakima Pesticides/PCBs TMDL: Vol 1, WQ Study Findings Page 135
Fruit Packers and Vegetable Processors Quarterly monitoring was also conducted at the six fruit packers and vegetable processors that discharge to surface water in the lower Yakima basin. Facility locations were previously shown in Figure 14. Final effluents were analyzed for pesticides, TSS, and turbidity. Table 43 summarizes the results for 303(d) listed pesticides. Other pesticides were infrequently detected and concentrations were low (Appendix O). PCBs were not analyzed because these types of facilities are not known to be sources of PCBs.
Table 43. Summary of Results from Monitoring 303(d) Listed Pesticides and Toxaphene in Effluents from Six Fruit and Vegetable Processors in the Lower Yakima Basin during 2007-08 (quarterly samples; concentrations in ng/L, parts per trillion).
DDT DDE DDD
No. of Samples 24 24 24Detection Frequency (%) 46% 67% 67%Median Concentration 0.064 U 0.37 J 0.18 J Mean Concentration 0.51 J 1.0 J 0.40 J 90th Percentile Conc. 1.6 J 2.9 J 1.0 J Maximum Concentration 4.6 J 6.8 1.7
Dieldrin Endosulfan Chlorpyrifos
No. of Samples 24 24 24Detection Frequency (%) 50% 96% 58%Median Concentration 0.57 J 2.9 J 1.5 J Mean Concentration 0.73 J 11 J 2.7 J 90th Percentile Conc. 1.7 J 18 J 5.7 J Maximum Concentration 2.6 J 93 J 19 J
Chlordane Alpha-BHC Toxaphene
No. of Samples 24 24 24Detection Frequency (%) 13% 25% 0%Median Concentration 0.063 U 0.063 U 3.1 U Mean Concentration 0.14 J 0.10 J 6.4 U 90th Percentile Conc. 0.2 J 0.18 16 U Maximum Concentration 1.3 J 0.35 30 U U = not detected at or above reported value. J = estimated concentration.
Because of the likelihood that pesticides were present in these effluents, the samples were analyzed using low-level detection (0.061 – 1.2 ng/L, to 3.1 ng/L for toxaphene). DDT compounds, dieldrin, endosulfan, and chlorpyrifos were routinely detected at most of the facilities (46-96% of samples). Chlordane and alpha-BHC were only occasionally reported (13-25% of samples).

Yakima Pesticides/PCBs TMDL: Vol 1, WQ Study Findings Page 136
Toxaphene was not detected at reporting limits ranging from 3.1 to 30 ng/L. The higher reporting limits for toxaphene were due to heavy interferences encountered in certain samples. At the time these samples were collected, the plants were primarily processing apples, potatoes, or their products. Nectarines, peaches, and pears were being processed in a few instances. There was no obvious relationship between what was being processed and pesticide concentrations. The percentage of effluent samples that exceeded water quality criteria is shown in Table 44 and Figure 62. The results are compared directly to criteria given the exceedances observed in the receiving waters. Fruit packer and vegetable processor effluent exceeded human health water quality criteria for DDT compounds and dieldrin in 17% and 38% of the samples, respectively. Human health criteria for endosulfan, chlordane, and alpha-BHC were never exceeded. The chronic aquatic life criterion for total DDT was exceeded in 29% of the effluent samples. Other pesticides were consistently meeting chronic criteria. Acute aquatic life criteria were never exceeded.
Table 44. Percent of Fruit Packer and Vegetable Processor Effluent Samples Exceeding Water Quality Criteria for 303(d) Listed Pesticides during 2007-08. (N=24)
DDT DDE DDD Dieldrin
Human Health Criteria (ng/L) 0.59 0.59 0.83 0.14 Percent of Samples Exceeding 17% 38% 13% 38%
Endosulfan Chlorpyrifos Chlordane Alpha BHC
Human Health Criteria (ng/L) 930 NA 0.57 3.9 Percent of Samples Exceeding 0% - - 0% 0%
Total DDT* Dieldrin Endosulfan
Chronic Aquatic Life Criteria (ng/L) 1.0 1.9 220 Percent of Samples Exceeding 29% 0% 0%
Chlorpyrifos Chlordane Alpha BHC
Chronic Aquatic Life Criteria (ng/L) 41 4.3 NA Percent of Samples Exceeding 0% 0% 0%
* DDT+DDE+DDD. NA = not applicable (human health criteria have not been adopted for chlorpyrifos).

Yakima Pesticides/PCBs TMDL: Vol 1, WQ Study Findings Page 137
Figure 62. Percent of Fruit Packer and Vegetable Processor Effluent Samples Exceeding Human Health Criteria (DDT compounds and dieldrin) or Chronic Aquatic Life Criteria (total DDT) (quarterly samples, N=24). Effluent flow rates for most of these facilities are less than 0.3 mgd. The combined flow from all six plants ranged from 0.6 – 1.5 mgd (0.9-2.3 cfs) during the four monitoring periods. As a result, pesticide loading to surface water was relatively low, as summarized in Table 45. One of the six facilities, Gilbert Orchards, discharges to ground and was not included in the load calculation. A second, Andrus & Roberts, only discharges to surface water during the winter when the ground is frozen. As noted previously, the Prosser ConAgra plant is scheduled to close in May 2010.
Table 45. Summary of Pesticide Loads Measured in Combined Final Effluents from Fruit Packers and Vegetable Processors that Discharge to Surface Water in the Lower Yakima River Drainage during 2007-08 (half the detection limit used for non-detects; Gilbert Orchards excluded).
T-DDT Dieldrin Endosulfan Chlorpyrifos
Mean Load (mg/day, facilities combined)
1.1 1.3 9.0 5.2
The TSS and turbidity data obtained on the effluents are summarized in Table 46.
0.38 0.38
0.29
0.17
0.13
0%
5%
10%
15%
20%
25%
30%
35%
40%P
erce
nt o
f Sam
ples
[WQ criteria not exceeded]

Yakima Pesticides/PCBs TMDL: Vol 1, WQ Study Findings Page 138
Table 46. Summary of Results from Monitoring TSS and Turbidity in Effluents from Six Fruit Packers and Vegetable Processors in the Lower Yakima Basin during 2007-08 (quarterly samples).
Parameter N= Median Mean 90th
Percentile Maximum
Total Suspended Solids (mg/L)
24 7.5 26 63 242
Turbidity (NTU)
24 11 20 32 110
The NPDES permits that apply to these facilities stipulate a maximum daily TSS discharge of 30 mg/L (General Permit for the Fresh Fruit Packing Industry) to 180 mg/L (Snokist Growers, Terrace Heights). The effluents were meeting this requirement in most cases. Two facilities exceeded TSS permit limits: Andrus & Roberts (242 and 86 mg/L on 7/26/07 and 10/10/07) and Gilbert Orchards (51 and 68 mg/L on 9/5/07 and 12/18/07). Visual observations recorded during sample collection indicated effluent turbidity was highly variable at these plants, ranging from cloudy to clear. Andrus & Roberts was discharging to their sprayfield; Gilbert Orchards was discharging to ground. Where DDT compounds were detectable in fruit processor and vegetable packer effluents, there was a positive relationship between total DDT and TSS (R2= 0.54, Figure 63). This suggests that the levels of DDT compounds in these effluents could be lowered by reducing TSS.
Figure 63. Correlation between Total DDT and Total Suspended Solids in Fruit Packer and Vegetable Processor Effluents.
y = 0.1779x0.6449
R2 = 0.54
0.01
0.1
1
10
1 10 100 1000
Tota
l DD
T (n
g/L
)
TSS (mg/L)

Yakima Pesticides/PCBs TMDL: Vol 1, WQ Study Findings Page 139
Urban Stormwater Runoff Within the Yakima basin, stormwater discharges from the cities of Ellensburg, Selah, Yakima, Union Gap, Sunnyside, West Richland, and Richland come under NPDES requirements of the Phase II Municipal Stormwater Permit for Eastern Washington. Runoff samples were obtained during six rain storms in Yakima and Union Gap, and four storms in Ellensburg, during the winter of 2007-08. For each storm, between two to five storm drains were sampled in each of these two areas (see Figures 15 and 16). Twenty-three samples were analyzed overall, 13 from Yakima/Union Gap and 10 from Ellensburg. As previously noted, similar sampling was not attempted for the other Phase II cities due to infrequent rainfall. West Richland’s stormwater goes to the Columbia River. The stormwater samples were either single grabs or composites of two grabs collected early in the storm once turbid water began to flow in the drains. The Yakima/Union Gap samples were analyzed for pesticides, PCBs, TSS, and turbidity. The same analyses were conducted for Ellensburg except pesticides were not analyzed due to the existing TMDL. The average annual precipitation in Yakima and Ellensburg is 8 and 10 inches, respectively, with slightly more than half of it falling between November and February. Samples for the water quality study were collected between October and June when 90% of the precipitation occurs. Precipitation in Yakima during the water quality study is shown in Figure 64, indicating which rain events were sampled. The amount of rainfall preceding sample collection in Yakima is shown in Table 47.
Figure 64. Precipitation in Yakima during the 2007-08 Water Quality Study, Showing When Stormwater Samples Were Collected (Yakima airport). (www-k12.atmos.washington.edu/k12/grayskies/nw_weather.html)
0.00000
0.05000
0.10000
0.15000
0.20000
0.25000
0.30000
0.35000
0.40000
0.45000
0.50000
4/1/07 5/1/07 6/1/07 7/1/07 8/1/07 9/1/07 10/1/07 11/1/07 12/1/07 1/1/08 2/1/08 3/1/08 4/1/08 5/1/08 6/1/08
Pre
cipi
tatio
n (in
ches
)
10/18 11/17
12/2
3/13 3/28 6/3

Yakima Pesticides/PCBs TMDL: Vol 1, WQ Study Findings Page 140
Table 47. Rainfall Prior To and During Stormwater Sampling in Yakima/Union Gap during 2007-08 (inches).
Sampling Date
Rainfall During Previous 24 hours
Rainfall During Previous Week
Total Rainfall For Storm Event
Sampled 10/18/2007 0.03 0.16 0.39 11/17/2007 0 0.02 0.25 12/2/2007 0 0.49 0.57 3/13/2008 0 0.010 0.10 3/28/2008 0 0 0.13 6/3/2008 0 0.01 0.27
Concentrations Results for 303(d) listed pesticides in Yakima/Union Gap stormwater runoff are summarized in Table 48. Most of the results are qualified as estimates due to interferences.
Table 48. Summary of Results from Analyzing 303(d) Listed Pesticides and Toxaphene in Yakima/Union Gap Stormwater during 2007-08 (ng/L, parts per trillion).
DDT DDE DDD No. of Samples 13 13 13Detection Frequency (%) 77% 92% 38%Median Concentration 9.9 J 13 J 2.5 U Mean Concentration 13 J 17 J 2.8 J 90th Percentile Concentration 28 J 45 J 3.6 J Maximum Concentration 33 J 54 J 4.1 J
Dieldrin Endosulfan ChlorpyrifosNo. of Samples 13 13 13Detection Frequency (%) 38% 85% 62%Median Concentration 2.8 J 17 4.1 J Mean Concentration 3.7 J 32 33 J 90th Percentile Concentration 6.2 J 87 129 J Maximum Concentration 7.4 J 107 222 J
Chlordane Alpha-BHC Toxaphene No. of Samples 13 13 13Detection Frequency (%) 23% 0% 8%Median Concentration 2.5 UJ 2.5 UJ 25 UJMean Concentration 3.4 UJ 3 UJ 26 UJ90th Percentile Concentration 3.5 J 3 UJ 27 UJMaximum Concentration 13 J 3.6 UJ 30 J U = not detected at or above reported value. J = estimated.

Yakima Pesticides/PCBs TMDL: Vol 1, WQ Study Findings Page 141
DDT compounds, dieldrin, endosulfan, and chlorpyrifos were routinely detected (38-92% of samples). Chlordane and toxaphene were infrequently detected. Alpha-BHC was not detected. For detected compounds, the concentrations found were far above those recorded in water samples from other NPDES discharges or in surface water samples, by one-to-two orders of magnitude in most cases. Several additional pesticides or breakdown products were also detected in stormwater. These included endosulfan sulfate, aldrin, heptachlor epoxide, and hexachlorobenzene (Appendix P). Table 49 has a summary of the PCB data for Yakima/Union Gap and Ellensburg. PCBs were detected in all samples. The levels were generally similar between the two urban areas. As with pesticides, PCB concentrations were high compared to other types of samples collected for the water quality study. The pesticide and PCB concentrations measured in stormwater are compared to other sources later in this report.
Table 49. Summary of Results from Analyzing PCBs in Yakima/Union Gap and Ellensburg Stormwater during 2007-08 (ng/L, parts per trillion).
Total PCBs
Yakima/Union Gap No. of Samples 12 Detection Frequency (%) 100% Median Concentration 9.9 J Mean Concentration 9.8 J 90th Percentile Concentration 19 J Maximum Concentration 28 J
Ellensburg No. of Samples 10 Detection Frequency (%) 100% Median Concentration 2.1 J Mean Concentration 6.4 J 90th Percentile Concentration 13 J Maximum Concentration 33 JJ = estimated.

Yakima Pesticides/PCBs TMDL: Vol 1, WQ Study Findings Page 142
Figure 65 shows the percentage of Yakima/Union Gap stormwater samples that exceeded human health criteria for the primary compounds of concern in this study. Because most of these chemicals bioaccumulate, even short-term discharge during storms has the potential to contribute to fish consumption concerns. It should be noted that many of these storm drains flow year-round, although at reduced rates.
Figure 65. Percent of Yakima/Union Gap Stormwater Samples Exceeding Human Health Criteria for 303(d) Listed Pesticides and PCBs during 2007-08. (N=13)
Stormwater exceeded human health criteria for DDE and PCBs in almost all samples and for DDT, DDD, and dieldrin in slightly less than half the samples. The chlordane and toxaphene criteria were also occasionally exceeded. The exceedances were routinely by one-to-two orders of magnitude. Being short-term phenomena, stormwater discharges are more appropriately compared to acute rather than chronic aquatic life criteria. The acute criteria apply to either an instantaneous or 1-hour average concentrations, while the chronic criteria are for 24-hour or 4-day average concentrations. The stormwater samples did not exceed acute criteria for pesticides or PCBs. Chlorpyrifos was recorded at the acute criterion of 220 ng/L in one instance (Appendix P). Toxaphene was detected at a very high concentration in one of the Yakima area storm drain samples (29 and 32 ng/L in replicate samples; Appendix P). This concentration substantially exceeds the human health criterion (0.73 ng/L), but not the acute aquatic life criterion (730 ng/L). The detection limit in the other stormwater samples (25-27 ng/L) was too high to assess compliance with water quality criteria.
92%
38% 38% 38%
23%
8%0% 0%
100%
0%
20%
40%
60%
80%
100%

Yakima Pesticides/PCBs TMDL: Vol 1, WQ Study Findings Page 143
Several other pesticides or breakdown products also exceeded human health criteria in stormwater but not aquatic life criteria. These included heptachlor epoxide (5 of 13 samples), aldrin (1 of 13 samples), and hexachlorobenzene (1 of 13 samples). These data are also in Appendix P. A summary of the TSS and turbidity data obtained on stormwater is provided in Table 50. As with other parameters, TSS and turbidity levels were high.
Table 50. Summary of Results from Analyzing TSS and Turbidity in Yakima/Union Gap and Ellensburg Stormwater during 2007-08.
TSS Turbidity (mg/L) (NTU)
Yakima/Union Gap No. of Samples 15 15 Detection Frequency (%) 93% 100% Median Concentration 111 230 J Mean Concentration 225 223 J 90th Percentile Concentration 547 420 J Maximum Concentration 654 475
Ellensburg No. of Samples 13 13 Detection Frequency (%) 100% 100% Median Concentration 64 120 Mean Concentration 85 132 90th Percentile Concentration 151 230 Maximum Concentration 206 280
mg/L = parts per million. NTU = nephelometric turbidity units.

Yakima Pesticides/PCBs TMDL: Vol 1, WQ Study Findings Page 144
Comparison with Other Data Several other studies have analyzed pesticides and PCBs in stormwater samples from Eastern Washington cities, all in connection with TMDLs. As in the present study, these efforts relied on simple grabs or composite samples from a few grabs. The data are summarized as median values in Table 51.
Table 51. Comparison of 303(d) Pesticide, PCB, and TSS Levels Measured in Urban Stormwater Samples in Eastern Washington (median values).
City: Pullman Yakima/
Union Gap Ellensburg Spokane
Sampling Period: 2005-06 2007-08 2007-08 2007 2005
Reference: Lubliner et al.
(2006) present study
present study
Parsons (2007)
Serdar et al. (2006)
Number of Storms 3 6 4 3 1 Number of Drains 3 up to 5 up to 5 14 4 Number of Samples 9 12 10 37-39 4
Total DDT (ng/L) 3.0 23 na na na Dieldrin (ng/L) 0.53 2.8 na na na Endosulfan (ng/L) 0.74 17 na na na Chlorpyrifos (ng/L) na 4.1 na na na Chlordane (ng/L) 2.1 U 2.5 UJ na na na Alpha-BHC (ng/L) 0.20 2.5 UJ na na na Total PCBs (ng/L) 17 9.9 2.1 6.3 41 TSS (mg/L) 60 111 64 30 75
na = not analyzed. U = not detected. J = estimated.
Pesticide data were only available for Pullman. That study found much lower concentrations of total DDT and endosulfan than present study results for Yakima/Union Gap stormwater. Results for other 303(d) listed pesticides were similar between these two areas. PCBs have been analyzed in both Pullman and Spokane runoff. The PCB levels measured for Yakima/Union Gap and Ellensburg are at the lower end of the concentrations reported for these two cities. Yakima/Union Gap stormwater samples had much higher TSS levels than Ellensburg, Pullman, or Spokane.

Yakima Pesticides/PCBs TMDL: Vol 1, WQ Study Findings Page 145
Loads The Simple Method (Schueler, 1987) was used to estimate the pollutant loads carried by Yakima/Union Gap and Ellensburg stormwater. This unit area model estimates loads of chemical constituents as a product of annual runoff volume and pollutant concentration, according to the formula:
L = 0.226 * R * C * A Where: L = Annual load (lbs) R = Annual runoff (inches) C = Pollutant concentration (mg/L) A = Area (acres) 0.226 = Unit conversion factor Annual runoff (R) is estimated as the product of rainfall, fraction of events that yield runoff, and a runoff coefficient:
R = P * Pj * Rv Where: R = Annual runoff (inches) P = Annual rainfall (inches) Pj = Fraction of annual rainfall events that produce runoff (usually 0.9) Rv = Runoff coefficient
Rv = 0.05+(0.91*Impervious Fraction)

Yakima Pesticides/PCBs TMDL: Vol 1, WQ Study Findings Page 146
The values used for Yakima/Union Gap and Ellensburg in the above equations are given in Table 52. Appendix Q has values for the same parameters for Sunnyside and for that portion of Richland that discharges stormwater to the Yakima River.
Table 52. Values Used to Calculate Stormwater Loads from Yakima/Union Gap and Ellensburg.
Yakima/Union Gap Yakima City Limit (acres) 17,486 Union Gap City Limit (acres) 3,224 Selah City Limit (acres) 2,858 Moxee City Limit (acres) 1,020 All City Limit Areas (acres) 24,587
Annual Rainfall (inches) 8.0 Fraction of Runoff 0.90 Impervious Fraction 0.22 Runoff coefficient 0.25 Annual Runoff (inches) 1.79
Ellensburg City Limit (acres) 4,279 Annual Rainfall (inches) 10.0 Fraction of Runoff 0.90 Impervious Fraction 0.22 Runoff coefficient 0.25 Annual Runoff (inches) 1.79
The urban areas shown above were the city limits, obtained through Phase I-II stormwater permit area maps www.ecy.wa.gov/programs/wq/stormwater/municipal/maps.html. The area applied to the Yakima/Union Gap stormwater data included Union Gap, Selah, and Moxee. Annual runoff was based on Figure 4.3.1 in the Stormwater Management Manual for Eastern Washington (Ecology, 2004). The average annual precipitation is 10 inches in Ellensburg and 8 inches in Yakima (1961-1990 data). In the absence of other information, the fraction of annual rainfall events that produce runoff (Pj) is usually assumed to be 0.9. This value has a strong effect on the results and is a potential source of bias in the load estimates. The equation for Rv is the best fit line for the relationship between the storm runoff coefficient and watershed imperviousness (Schueler, 1987). An impervious fraction of 22% was used to calculate Rv. This value was taken from similar stormwater studies that evaluated land use in the cities of Spokane (Rv=22%) and Pullman (Rv=25%) (Serdar et al., 2006; Lubliner et al., 2006).

Yakima Pesticides/PCBs TMDL: Vol 1, WQ Study Findings Page 147
Results of the stormwater load calculations are summarized in Tables 53 and 54 for the primary contaminants of concern. Pollutant loads were based on the median concentration among the samples collected. The median was used rather than the mean due to variability in the data.
Table 53. Estimated Loading of 303(d) Listed Pesticides and PCBs in Stormwater Runoff from Yakima/Union Gap and Ellensburg.
Location/ Pollutant
Median Concentration
(ng/L)
Daily Load (grams/day)
Yakima/Union Gap DDT 9.9 J 0.12 DDD 2.5 U <0.03 DDE 13 J 0.16 Total DDT 23 J 0.28
Dieldrin 2.8 J 0.03 Chlorpyrifos 4.1 J 0.05 Endosulfan 17 J 0.21 Total PCBs 9.9 J 0.12
Ellensburg Total PCBs 2.1 J 0.01
U = not detected at or above reported value J = estimated value
Table 54. Estimated TSS Loading in Stormwater from Yakima/Union Gap and Ellensburg.
Location Median
Concentration (mg/L)
Daily Load (tons/day)
Annual Load (tons)
Yakima/Union Gap 111 1.5 550 Ellensburg 64 0.19 69
The advantage of using the Simple Method is that it requires a modest amount of information and is considered to provide reasonable estimates of pollutant export from urban areas (www.stormwatercenter.net). It is important, however, not to over emphasize the precision of the results obtained. In addition, the Simple Method only estimates pollutant loads generated during storm events. It does not consider pollutants associated with baseflow volume. The present study is one of the larger efforts to characterize toxics in stormwater from urban areas in Washington. However, urban stormwater runoff is inherently variable in both quality and quantity. Although a consistently elevated level of contamination was observed in Yakima/Union Gap and Ellensburg stormwater, it should be recognized that spatial and temporal variability in these discharges is still poorly known.

Yakima Pesticides/PCBs TMDL: Vol 1, WQ Study Findings Page 148
Point and Nonpoint Sources Compared The results from analyzing 303(d) pesticides, PCBs, TSS, and turbidity in the lower Yakima River basin during 2007-08 are compared as medians in Figure 66. Note that the concentrations are on a log scale (factors of 10). The following sources stand out in terms of concentrations:
303(d) pesticides, PCBs, TSS, and turbidity were higher in Yakima/Union Gap stormwater runoff than in other sources, typically by an order of magnitude or more. Similar levels of PCBs, TSS, and turbidity were found in Ellensburg stormwater.
Sources that ranked second behind stormwater included irrigation returns (DDT compounds and TSS), fruit packer and vegetable processor effluents (dieldrin, chlorpyrifos, and endosulfan), and WWTP effluents (PCBs).
Comparable data were not obtained on toxaphene. Results point to at least some irrigation returns as having elevated concentrations. A high toxaphene concentration was recorded in one instance in a Yakima area stormwater sample. Reporting limits were not low enough to rule out the presence of significant concentrations in other stormwater samples.
The impacts of these sources on the Yakima River are a function of pollutant concentration and flow (loads), as well as dilution at the point of discharge. The amount of available dilution varies with location and season. However, a general sense of the relative importance of sources can be gained by a simple comparison of loads. The load estimates for point and nonpoint sources, calculated earlier in this report, are compared in Figure 67. The loads in the lower Yakima River at Kiona and Horn Rapids provide a point of reference. Reporting limits were high for most pesticides in WWTP effluent and for toxaphene in NPDES discharges in general. To avoid the perception that concentrations were zero, half the reporting limit was used to calculate a load for these chemicals in Figure 67. The true loads are unknown. In all cases, the largest loads are from the irrigation returns and tributaries, followed by stormwater. When averaged over the entire year, the stormwater loads are only about 1/10 of those calculated for the returns. While the other sources evaluated in this study are continuous discharges, stormwater is released in a series of relatively brief, concentrated pulses. For this reason, stormwater has a greater potential for adverse water quality impacts than the load estimates might suggest. Pollutant concentrations in the storm drains during baseflow conditions are unknown.

Yakima Pesticides/PCBs TMDL: Vol 1, WQ Study Findings Page 149
Figure 66. Median Concentrations of Selected Pollutants in the Lower Yakima River Drainage during 2007-08 (log scale).
0.01
0.1
1
10
100
Total DDT Dieldrin Chlorpyrifos Endosulfan
ng/L (parts per trillion)
Selected 303(d) Pesticides
Mainstem & Naches R.
Major Returns
Screening Survey Tribs.
Fruit & Vegetable
Stormwater
0.01
0.1
1
10
Mainstem & Naches R.
Major Returns Screening Survey Tribs.
WWTPs Fruit & Vegetable
Stormwater
ng/L (parts per trillion)
Total PCBs
NA NA
0
50
100
150
200
250
1
10
100
1000
Turbidity (NTU
)
TSS (m
g/L)
TSS
Turbidity

Yakima Pesticides/PCBs TMDL: Vol 1, WQ Study Findings Page 150
Figure 67. Loading Comparison for Selected Pollutants Analyzed in 2007-08 (unfilled bars are estimated loads based on half the reporting limit).
<0.10
0.001
~0.10
0.28
0.80
2.1
2.1
3.6
0.0 1.0 2.0 3.0 4.0
WWTP
Fruit & Vegetable
Upper Yakima (@ Harrison)
Yakima Stormwater
Naches River
Other Tribs & Returns
Major Returns
Yakima @ Kiona
Total DDT (grams per day)
sum=5.5
<0.10
0.001
0.03
~0.10
~0.20
0.30
0.36
0.60
0.0 0.1 0.2 0.3 0.4 0.5 0.6 0.7
WWTP
Fruit & Vegetable
Yakima Stormwater
Naches River
Upper Yakima (@ Harrison)
Other Tribs & Returns
Major Returns
Yakima @ Kiona
Dieldrin (grams per day)
sum=1.1

Yakima Pesticides/PCBs TMDL: Vol 1, WQ Study Findings Page 151
Figure 67. Loading Comparison (continued).
0.23
0.005
0.41
~0.90
~4.0
4.8
8.7
36
0 10 20 30 40
WWTP
Fruit & Vegetable
Yakima Stormwater
Upper Yakima (@ Harrison)
Naches River
Major Returns
Other Tribs & Returns
Yakima @ Kiona
Chlorpyrifos (grams per day)
sum=19
NA
NA
0.01
0.06
0.07
0.12
1.6
1.9
1.6
1.9
0.0 0.5 1.0 1.5 2.0 2.5
Other Tribs & Returns
Fruit & Vegetable
Ellensburg Stormwater
Wilson Creek
WWTP
Yakima Stormwater
Upper Yakima (@ Roza)
Major Returns
Naches River
Yakima @ Horn Rapids
grams per day
Total PCBs (grams per day)
sum=2.7

Yakima Pesticides/PCBs TMDL: Vol 1, WQ Study Findings Page 152
Figure 67. Load Comparison (continued).
Comparing the summed loads in Figure 67 with the downstream loads in the Yakima River at Kiona and Horn Rapids provides a means of gauging how well the water quality study accounted for pollutant loads to the Yakima River. It was impractical to obtain synoptic data on all these discharges. It is therefore not surprising that the estimates of the incoming and outgoing loads are not always in close correspondence. Overall however, the water quality study does appear to have accounted for the major sources of total DDT, dieldrin, PCBs, toxaphene, and TSS. The study accounted for only about half of the chlorpyrifos loading to the river. This can probably be attributed to the difficulty of defining the short-term spikes in concentrations that occur during application periods.
<0.001
<0.6
<0.8 <4.9
0.7
1.1
1.2
2.1
5.0
0 1 2 3 4 5 6
Fruit & Vegetable
Yakima Stormwater
WWTP
Other Tribs & Returns
Wilson Creek
Naches River
Upper Yakima (@ Roza)
Major Returns
Yakima @ Horn Rapids
Toxaphene (grams per day)
sum=5.1
sum=11
0.01
0.19
0.80
1.5
48
53
58
66
236
0 50 100 150 200 250
Fruit & Vegetable
Ellensburg Stormwater
WWTP
Yakima Stormwater
Other Tribs & Returns
Major Returns
Upper Yakima (@ Harrison)
Naches River
Yakima @ Kiona
TSS (tons per day)
sum=228

Yakima Pesticides/PCBs TMDL: Vol 1, WQ Study Findings Page 153
Table 55 shows the relative importance of the point and nonpoint sources assessed in the water quality study, in terms of percent of the summed load (from Figure 67). Chlordane was detected too infrequently to compare source loadings.
Table 55. Relative Importance of Point and Nonpoint Loads to Lower Yakima River (based on loads shown in Figure 67).
Source Total DDT Dieldrin Chlorpyrifos Total PCBs Toxaphene TSS
(g/day) (g/day) (g/day) (g/day) (g/day) (tons/day) Total Point/ Nonpoint Load
5.5 1.1 19 2.7 5.1 - 11 228
Upper Yakima and Naches Rivers
~17% ~30% 26% 73% 20-45% 54%
Tributaries and Returns
78% 66% 71% 20%* 55-67% 44%
Yakima Area Stormwater
5% 3% 2% 5% <5% - <12% 1%
Ellensburg Stormwater
NA NA NA <1% NA <1%
WWTPs <2% <9% 1% 3%† <7% - <16% <1%
Fruit & Vegetable <1% <1% <1% NA NA <1%
NA = not analyzed. *Wilson Creek, Moxee Drain, Granger Drain, Sulphur Creek Wasteway, and Spring Creek only. †includes Ellensburg, Cle Elum, and Kittitas WWTPs.

Yakima Pesticides/PCBs TMDL: Vol 1, WQ Study Findings Page 154
Status of 303(d) Listed Chemicals and Toxaphene in the Yakima River
The water quality status of the Yakima River basin with respect to 303(d) listed chemicals and toxaphene is summarized in Tables 56 (reservoirs and mainstem) and 57 (tributaries and returns), based on results from Ecology’s 2007-08 water quality study and 2006 fish tissue survey. The determination as to whether a particular waterbody segment did or did not exceed criteria generally follows Ecology’s sample size requirements for 303(d) listing (Ecology, 2006): Water column data: A segment will be placed in Category 5 (i.e., the 303(d) list) due to a toxic pollutant in the water column when two or more samples within a three-year period exceed the applicable criteria. Tissue data: A segment will be placed in Category 5 if either the mean of three single-fish samples with the highest concentration of a given pollutant or one composite sample made up of at least five fish exceed the applicable criteria. In some instances, PCBs and toxaphene are highlighted as exceeding water quality criteria based on results from one or two SPMD passive samples (from the data in Table 30). It should be noted that Ecology policy does not address using SPMD data for 303(d) listing purposes. Also, a single sample does not strictly meet the two-sample-per-segment minimum for listing under Category 5. However, as previously discussed, chemical concentrations derived from SPMDs are comparable to other types of low-level water samples. And, because SPMDs measure the long-term average concentration of a chemical, the results should be considered to carry at least as much weight as two separate grab samples.

Yakima Pesticides/PCBs TMDL: Vol 1, WQ Study Findings Page 155
Table 56. Summary of Water Quality Exceedances in Yakima River Storage Reservoirs, Mainstem Yakima River and Naches River for 303(d) Listed Chemicals and Toxaphene during Ecology’s 2006-08 Fish Tissue and Water Quality Studies. ( = Criteria were exceeded in at least one composite edible fish tissue sample, two whole water samples, or one SPMD passive sample at one or more sampling sites per waterbody. = Criteria were not exceeded.)
Waterbody/ Chemical
Human Health Criterion
Chronic Aquatic Life
Criterion
Acute Aquatic Life
Criterion
Fish Tissue Water Column Water Column
Keechelus Lake (WRIA 39)
PCBs NA NA NA
Kachess Lake (WRIA 39)
PCBs NA NA NA
Upper Mainstem (WRIA 39)
PCBs
Dioxin NA NA/** NA/**
Naches River (WRIA 38)
PCBs NA
Lower Mainstem (WRIA 37)
DDT ** **
DDE ** **
DDD ** **
Total DDT ** **
Dieldrin
Chlorpyrifos ** **
Chlordane
PCBs
Toxaphene
Dioxin NA NA/** NA/** NA = not analyzed. ** Human health criteria have not been established for total DDT or chlorpyrifos; aquatic life criteria for DDT compounds apply to total DDT only; aquatic life criteria have not been established for dioxin.
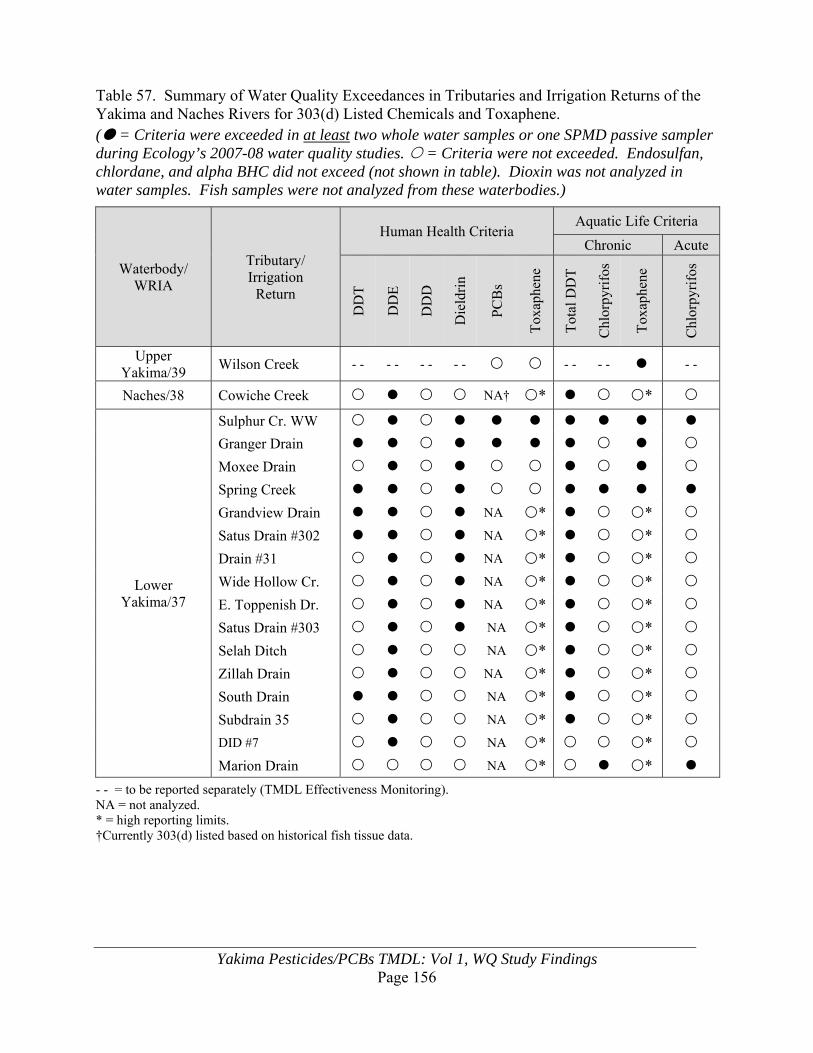
Yakima Pesticides/PCBs TMDL: Vol 1, WQ Study Findings Page 156
Table 57. Summary of Water Quality Exceedances in Tributaries and Irrigation Returns of the Yakima and Naches Rivers for 303(d) Listed Chemicals and Toxaphene. ( = Criteria were exceeded in at least two whole water samples or one SPMD passive sampler during Ecology’s 2007-08 water quality studies. = Criteria were not exceeded. Endosulfan, chlordane, and alpha BHC did not exceed (not shown in table). Dioxin was not analyzed in water samples. Fish samples were not analyzed from these waterbodies.)
Waterbody/ WRIA
Tributary/ Irrigation
Return
Human Health Criteria Aquatic Life Criteria
Chronic Acute
DD
T
DD
E
DD
D
Die
ldri
n
PC
Bs
Tox
aphe
ne
Tot
al D
DT
Chl
orpy
rifo
s
Tox
aphe
ne
Chl
orpy
rifo
s
Upper Yakima/39
Wilson Creek - - - - - - - - - - - - - -
Naches/38 Cowiche Creek NA† * *
Lower Yakima/37
Sulphur Cr. WW
Granger Drain
Moxee Drain
Spring Creek
Grandview Drain NA * *
Satus Drain #302 NA * *
Drain #31 NA * *
Wide Hollow Cr. NA * *
E. Toppenish Dr. NA * *
Satus Drain #303 NA * *
Selah Ditch NA * *
Zillah Drain NA * *
South Drain NA * *
Subdrain 35 NA * *
DID #7 NA * *
Marion Drain NA * *
- - = to be reported separately (TMDL Effectiveness Monitoring). NA = not analyzed. * = high reporting limits. †Currently 303(d) listed based on historical fish tissue data.

Yakima Pesticides/PCBs TMDL: Vol 1, WQ Study Findings Page 157
Pollutants for which a TMDL or Other Control Plan is Needed
The Clean Water Act requires that a TMDL or other pollution control plan be developed for each 303(d) listed pollutant in a waterbody. Findings from Ecology’s 2006-08 studies show 303(d) listings are appropriate for the locations and pollutants shown in Table 58, either due to previously listed chemicals continuing to exceed criteria or new findings. The toxaphene TMDL recommendation for the Lower Yakima River and the PCB recommendation for the Naches River (except for the Cowiche Creek fish tissue listing, Appendix A) are based on SPMD passive samplers, and thus do not strictly meet listing requirements for 303(d).
Table 58. Yakima Basin WRIAs Where a TMDL or Other Pollution Control Plan is Needed.
Keechelus Lake Kachess Lake (WRIA 39)
Upper Yakima River
(WRIA 39)
Lower Yakima River
(WRIA 37)
Naches River (WRIA 38)
PCBshh PCBshh
Toxapheneaq*
(Wilson Creek) Dioxinhh
PCBshh
Toxaphenehh,aq*
DDEhh
Total DDT aq
Chlordanehh
Dieldrinhh
Chlorpyrifosaq
(returns/tributaries)
Dioxinhh
PCBshh
DDEhh
(Cowiche Creek)
Total DDTaq*
(Cowiche Creek)
Number of 2008 303(d) Listings Addressed
1 2 78 2
hh = human health criteria at issue. aq = aquatic life criteria at issue.
*not currently listed.
Previously unlisted impairments identified within these WRIAs are itemized below in Table 59.

Yakima Pesticides/PCBs TMDL: Vol 1, WQ Study Findings Page 158
Table 59. Potential Unlisted Waterbody Impairments in the Yakima River Drainage
WRIA Water Body Name Parameter Medium
37 Lower Yakima
DID 7 DDE Water
Drain #31 DDE Water
Dieldrin Water T-DDT Water
East Toppenish Drain DDE Water
Dieldrin Water T-DDT Water
Grandview Drain DDE Water
T-DDT Water Dieldrin Water
Granger Drain PCBs Water*
Toxaphene Water* Moxee Drain Toxaphene Water*
Satus Drain #302 DDE Water
T-DDT Water Dieldrin Water
Satus Drain #303 DDE Water
T-DDT Water Dieldrin Water
South Drain DDE Water
T-DDT Water
Spring Creek Dieldrin Water
Toxaphene Water*
Sub Drain #35 DDE Water
T-DDT Water
Sulphur Creek Wasteway PCBs Water*
Toxaphene Water* Yakima River @ Sunnyside Dam
Toxaphene Water*
Yakima River nr. Prosser Toxaphene Water* &
Fish Tissue Yakima River nr.
Horn Rapids Toxaphene
Water* & Fish Tissue
Zillah Drain DDE Water
T-DDT Water 38
Naches Naches River PCBs Water*
Cowiche Creek T-DDT Water
39 Upper Yakima
Kachess Lake PCBs Water
Selah Ditch DDE Fish Tissue
T-DDT Water Wilson Creek Toxaphene Water*
*based on SPMD samples.

Yakima Pesticides/PCBs TMDL: Vol 1, WQ Study Findings Page 159
PCBs, Dioxin, Chlorpyrifos, and Chlordane
Some additional discussion on the occurrence and significance of PCBs, dioxin, chlorpyrifos, and chlordane in the Yakima River follows:
PCBs Currently, there are 92 individual 303(d) listings in Washington State for PCBs exceeding human health criteria in surface waters. Many of these listings are from lakes and rivers with no obvious local sources of these compounds, Keechelus Lake and Kachess Lake being examples in the Yakima basin. The PCB analyses in the present water quality study are an integral part of Ecology’ plans to address 303(d) water quality concerns in the Yakima River. The PCB assessment identified several opportunities to approach water quality improvements through a direct implementation approach for a contaminant that may not be addressed effectively through a traditional TMDL track. The assessment provides opportunities for direct implementation while working through statewide issues associated with the widespread presence of PCBs in Washington’s waterways. Additionally, an updated and thorough assessment of PCBs provides a current benchmark for long-term assessment of implementation actions, even for those not directly targeted at PCB levels, such as efforts to reduce TSS levels in runoff to the Yakima River. Sulphur Creek Wasteway, Granger Drain, and Yakima area stormwater are examples of elevated PCB contamination where potential sources should be considered and opportunities for targeted cleanups may exist (e.g., transformer storage yards, natural gas drilling, old landfills, or illegal dumpsites existing in the area).
Dioxin In view of the low dioxin concentrations in Yakima River fish and due to budget constraints, dioxin was not analyzed in the 2007-08 water quality study. Although only a few fish samples from the 2006 survey exceeded human health criteria, 303(d) policy requires listing in instances where even a single composite sample is above criteria. (www.ecy.wa.gov/programs/wq/303d/wqp01-11-ch1Final2006.pdf). Dioxin is an unintentional byproduct of combustion and certain industrial processes. It has been the subject of source controls locally and nationally, including a TMDL for the Columbia River basin (EPA, 1991a). Dioxin levels are expected to decrease in the Yakima River in the future. Dioxin will remain on the 303(d) list of contaminants to be addressed in the Yakima basin. Additional water quality work on Yakima River dioxins will be prioritized along with other water quality concerns in the Central Region through Ecology’s annual watershed scoping process. Ecology is currently evaluating low-level dioxin contamination through a statewide

Yakima Pesticides/PCBs TMDL: Vol 1, WQ Study Findings Page 160
study on the dioxin and PCB background in fish from Washington rivers and lakes (Johnson et al., 2010). Findings from this study are likely to have implications for addressing 303(d) listings for dioxins and PCBs in the Yakima River. Ecology plans to address dioxins on a larger scale (possibly region- or state-wide) in the future. Additionally, because dioxins are often carried via air and can pollute sizeable areas not necessarily limited to watersheds, a larger TMDL footprint will likely be more effective and efficient.
Chlorpyrifos Unlike legacy pesticides, chlorpyrifos is a water quality concern in the Yakima drainage only during the growing season, in and around the times it is applied. Chlorpyrifos and other organophosphorus insecticides have faster breakdown rates, lower affinity for sorption and bioaccumulation, and greater solubility. Aquatic life criteria are the primary concern with chlorpyrifos, rather than human health concerns prominently associated with legacy pollutants. The Federal Insecticide, Fungicide, and Rodenticide Act (FIFRA) governs the sale and use of chlorpyrifos by directing EPA to regulate pesticides through a registration process. A pesticide may not be sold or used in the U.S. unless it is registered by EPA and has an approved label authorizing a given use. Additionally, FIFRA requires product labels to specify where and how pesticide products may be used and applied. EPA must periodically review the registration to ensure compliance with FIFRA and other federal laws. The Washington State Department of Agriculture (WSDA) has legal authority to impose any of these restrictions. The National Oceanic and Atmospheric Administration (NOAA, 2008) recently issued findings that chlorpyrifos jeopardizes the survival of Pacific salmon listed as threatened or endangered in the West. A recent decision in a lawsuit brought by environmental and commercial fishing groups expanded buffers to 1,000 feet from streams for aerial spraying, 500 feet for ground spraying, plus a 20-foot strip of grass or brush. Chlorpyrifos cannot be sprayed when the wind is blowing or when a major storm might wash it into rivers and streams. The old buffers were 300 feet for aerial spraying and 60 feet for ground spraying, with no vegetation strip required. EPA has one year to implement these findings. When put into effect, the new requirements will be considered an implementation activity for chlorpyrifos under the TMDL statute. Inclusion of chlorpyrifos in the TMDL will provide assurance that that they will be implemented and their effectiveness monitored. Chlorpyrifos should remain part of this TMDL. Actions by other Federal and State agencies may create the implementation requirements to bring about water quality compliance, but could be aimed at some other regulatory criteria. Inclusion in the TMDL provides the ability to track the implementation of the developing rules and the application and compliance with those rules to determine if they succeed in achieving and assuring compliance with water quality standards.

Yakima Pesticides/PCBs TMDL: Vol 1, WQ Study Findings Page 161
Ecology has an ongoing monitoring program for current-use pesticides in the lower Yakima basin that includes chlorpyrifos (the previously mentioned Surface Water Monitoring Program for Pesticides in Salmonid-Bearing Streams www.ecy.wa.gov/programs/eap/toxics/pesticides.htm). WSDA and Ecology are engaging growers in the watershed for help in determining less toxic and less mobile pesticides through a series of presentations. Application methods, integrated pest management, and meteorological planning are included to help prevent off-site transport.
Chlordane Ecology’s 2006 fish tissue study showed human health criteria exceedances for chlordane were limited to carp analyzed in the vicinity of Prosser and that the exceedances were marginal. This is the same general location for the existing 303(d) listing on edible fish tissue (whitefish samples from 1998, reported in EPA (2002a)). Extensive water sampling in 2007-08 failed to identify a single instance of chlordane exceeding either human health or aquatic life criteria in the Yakima mainstem, tributaries, or irrigation returns. One of the Yakima/Union Gap stormwater samples did however substantially exceed human health criteria for chlordane. The evidence suggests chlordane has been reduced to low levels in the Yakima system and is now an insignificant concern for human health and aquatic life in almost all areas.

Yakima Pesticides/PCBs TMDL: Vol 1, WQ Study Findings Page 162
Pollutants Not Exceeding Standards
If it is determined that water quality standards are being met for a particular pollutant throughout the year, taking into account seasonal variations and critical conditions, and are not expected to be exceeded by the next 303(d) listing cycle, then a TMDL is not required. The Yakima River was listed for alpha-BHC, endosulfan, chlordane, and dioxin based on older data. The 2006-08 studies show that alpha-BHC and endosulfan are now meeting water quality criteria. Chlordane is meeting criteria in all but one area. Dioxin is now meeting criteria in Keechelus Lake. Chlordane and alpha-BHC are no longer used, having been banned by EPA in the 1970s and 80s. Extensive monitoring of endosulfan in the lower Yakima River drainage has failed to detect a single recent violation of water quality criteria. The use of endosulfan is governed by FIFRA, EPA, and the WSDA. Chlordane, alpha-BHC, and endosulfan levels are not expected to exceed standards in the Yakima River in the future. A similar conclusion applies to dioxin, as previously discussed. For these reasons, TMDLs are no longer required for these chemicals for the WRIAs shown in Table 60.
Table 60. Locations and Pollutants Where a TMDL is No Longer Required.
Keechelus Lake
(WRIA 39
Upper Yakima River
(WRIA 39)
Lower Yakima River
(WRIA 37)
Dioxin Chlordane Endosulfan Alpha-BHC
Number of 2008 303(d) Listings Removed
1 1 8

Yakima Pesticides/PCBs TMDL: Vol 1, WQ Study Findings Page 163
Numeric TMDL Targets
Numeric water quality targets must be identified in a TMDL. The targets identify the specific instream goals or criteria for the TMDL, which equate to attainment of water quality standards. In most cases targets are set equal to the water quality criteria.
Pesticide and PCB Targets Applicable water quality criteria for all 303(d) listed chemicals in the Yakima basin were previously listed in Table 3. Compliance with a subset of these criteria has been identified as a major water quality issue. These criteria provide numeric targets for the Pesticides and PCBs TMDL (Table 61).
Table 61. Numeric TMDL Targets (Water Quality Criteria) for Pesticides and PCBs That Currently Exceed Standards in the Yakima River, Tributaries, or Irrigation Returns (ng/L = parts per trillion).
Pollutant Numeric Target
(ng/L) Protective of:
DDT 0.59 Human health for the average fish consumer
DDE 0.59 Human health for the average fish consumer
DDD 0.83 Human health for the average fish consumer
Total DDT 1.0 Aquatic life for chronic exposure
Dieldrin 0.14 Human health for the average fish consumer
Chlordane 0.57 Human health for the average fish consumer
Chlorpyrifos 41 Aquatic life for chronic exposure
83 Aquatic life for acute exposure
Total PCBs 0.17 Human health for the average fish consumer
Toxaphene 0.20 Aquatic life for chronic exposure
0.73 Human health for the average fish consumer
Suspended Sediment and Turbidity Targets Numeric targets for turbidity and TSS have been set by the existing Yakima River suspended sediment and pesticide TMDLs (Table 62). The 7 mg/L TSS target for the lower Yakima River was intended to meet the 1 ng/L chronic aquatic life criterion for total DDT. Seven mg/L was derived by correlating total DDT concentrations with the corresponding TSS concentrations, using data collected during the

Yakima Pesticides/PCBs TMDL: Vol 1, WQ Study Findings Page 164
irrigation season from 1988-1995. Recognizing that the relationship between DDT and TSS was likely to change as soil erosion was brought under control, the TMDL stipulated the target should be re-evaluated in 2007. A TSS target of 7 mg/L equates to less than 4 NTU, which is below background for the lower Yakima River.
Table 62. Existing TMDL Targets for Turbidity and Total Suspended Solids in the Yakima River.
Pollutant Numeric Target Applies To: Intent
Upper Yakima River
Turbidity
< 10 NTU over background
Mainstem and selected tributaries (2006 target) Compliance with
state turbidity standards <5 NTU over background
Mainstem and selected tributaries (2011 target)
Lower Yakima River
Turbidity
<5 NTU over background
Mainstem (2002 target; extended to 2003)
Compliance with state turbidity standards
25 NTU (90th percentile)
All points within all tributaries and drains
(2007 target)
Protect fish and other aquatic organisms; assist with turbidity
compliance in mainstem
Total Suspended Solids
7 mg/L (1 ng/L total DDT)
Mainstem, tributaries, and drains (2012 target;
re-evaluate in 2007)
Achieve total DDT chronic aquatic life criterion
A USGS study in 1999-2000 found the amount of total DDT associated with suspended sediment had indeed decreased in the lower Yakima River compared to the pre-TMDL period (Fuhrer et al., 2004). Fuhrer suggests several possible reasons for the decline: (1) degradation of total DDT in soils and bed sediments; (2) dilution of suspended sediment with uncontaminated eroded soils; or (3) use of PAM (polyacrylamide) in the flocculation and sedimentation of fine-grained, organically enriched soil particles that tend to sorb total DDT. The report concluded that “…the total DDT criterion could be met when concentrations of suspended sediment are well above 7 mg/L”. The total DDT:TSS correlation observed in 1988-1995 is shown in Figure 68 and compared to similar data from the 2007 irrigation season. The original correlation was based on pooled data for the mainstem, tributaries, and irrigation returns (N= 71). The same or similar locations were used to assess the correlation for 2007 (N= 95).
As shown in this figure, total DDT and TSS concentrations had shifted downward by an order of magnitude in 2007 compared to 1988-1995. Total DDT had commonly been seen in the range of 10-100 ng/L, but now rarely exceeds 5 ng/L. Whereas TSS once approached 1,000 mg/L, current levels are below 200 mg/L. Total DDT and suspended sediment concentrations have obviously decreased to a substantial extent.

Yakima Pesticides/PCBs TMDL: Vol 1, WQ Study Findings Page 165
Figure 68. Total DDT:TSS Correlation in the Lower Yakima River Drainage: 1988-1995 vs. 2007 Irrigation Seasons. The R2 values in these relationships indicate the percent of the DDT data that is explained by TSS (coefficient of determination). The correlation was not as strong in 2007 because the data now cover a much narrower range of concentrations, with many of the results being close to the detection limit and thus more scatter in the data. A stronger correlation (R2 = 0.50) results when the 2007 and 2008 data are pooled (Figure 69, N= 144). The mainstem data for the December 2007 storm were excluded here because the TSS concentrations were extreme outliers that had an undue influence on the correlation. Yakima at Harrison Bridge data were not used because DDT compounds were never detected. Solving this regression equation for 1 ng/L total DDT gives 32 mg/L TSS, a value four times higher than the original 7 mg/L target. While there is more uncertainty associated with this new value, the 2007-08 data represent an improvement over what was available in 1988-95 with respect to sample size and equitable distribution across the study area. Based on the TSS and turbidity data collected in 2007-08, 32 mg/L equates to 13 NTU (Figure 70). The existing TMDL target for meeting the state turbidity criteria in the lower Yakima mainstem is background + 5 NTU. Background is typically at or below 10 NTU (see Table 36). Thus, the target would normally be 15 NTU or less. Therefore, the existing TMDL turbidity target of background + 5 NTU should be effective for the mainstem in both meeting a total DDT-based TSS target of 32 mg/L and in achieving compliance with the turbidity criteria.
y = 0.1513x0.953
R² = 0.75
y = 0.0598x0.7868
R² = 0.43
0.01
0.1
1
10
100
1000
1 10 100 1000
Total D
DT (ng/L)
TSS (mg/L)
1988‐1995
2007

Yakima Pesticides/PCBs TMDL: Vol 1, WQ Study Findings Page 166
Figure 69. Total DDT:TSS Correlation in the Lower Yakima River Drainage, April 2007-March 2008.
Figure 70. Relationship between Turbidity and Total Suspended Solids in the Lower Yakima River Drainage during 2007-08 (pooled results from monthly monitoring of the Yakima mainstem, Naches River, and the four major irrigation returns, N = 167).
y = 0.0617x0.7997
R² = 0.50
0.01
0.1
1
10
100
0.1 1 10 100 1000
Tot
al D
DT
(ng
/L)
TSS (mg/L)
y = 0.8375x0.7933
R² = 0.89
0.1
1
10
100
1000
1 10 100 1000
Tur
bidi
ty (
NT
U)
TSS (mg/L)

Yakima Pesticides/PCBs TMDL: Vol 1, WQ Study Findings Page 167
A 32 mg/L target would be under-protective for irrigation returns since these sometimes exceed the total DDT criterion at lower TSS levels. There was a good correlation between total DDT and TSS in Moxee Drain (R2=0.76) and in Spring Creek (R2= 0.59) during 2007-08 (Figure 71). The data indicate that TSS concentrations of 29 and 19 mg/L, respectively, correspond to the 1 ng/L total DDT criterion. These concentrations equate to turbidities of 11 and 8 NTU, respectively. Thus, a turbidity target of 10 NTU appears to be appropriate for these discharges.
Figure 71. Total DDT:TSS Correlation in Moxee Drain and Spring Creek during April 2007-March 2008.
y = 0.1406x0.5815
R² = 0.76
0.01
0.1
1
10
1 10 100 1000
Tot
al D
DT
(ng
/L)
TSS (mg/L)
Moxee Drain
Aquatic Life Criterion
y = 0.2959x0.4135
R² = 0.59
0.1
1
10
0.1 1 10 100 1000
Tot
al D
DT
(ng
/L)
TSS (mg/L)
Spring Creek
Aquatic Life Criterion

Yakima Pesticides/PCBs TMDL: Vol 1, WQ Study Findings Page 168
Total DDT also increased with TSS in Sulphur Creek Wasteway, although concentrations varied widely at higher TSS levels, reducing the strength of the correlation (Figure 72). Under conditions of 10 NTU (~25 mg/L TSS) total DDT concentrations were always less than 2 ng/L. Therefore, a 10 NTU target for Sulphur Creek also looks reasonable at the present time.
Figure 72. Total DDT:TSS Correlation in Sulphur Creek Wasteway during April 2007-March 2008. Granger Drain consistently exceeded the 1 ng/L criterion by factors of 2 to 4 or more, and there was no clear relationship between total DDT and TSS (Figure 73). The absence of even a modest correlation suggests that source areas within the drainage have substantially different total DDT:TSS signatures and that these areas are active at different times of the year. It is uncertain what reductions in TSS would be required to meet the total DDT criterion in Granger Drain. Turbidity exceeded 10 NTU most of the time during 2007-08 (74% of samples). Therefore, a 10 NTU target for Granger Drain would be a useful interim goal for improving water quality and bringing this discharge closer into compliance with the total DDT criterion. The DDE human health criterion is 40% lower than the total DDT aquatic life criterion (0.59 vs. 1.0 ng/L). There was a consistent relationship between DDE and total DDT across the study area (Figure 74). This correlation indicates that when the total DDT concentration is 1 ng/L, DDE should be in the neighborhood of 0.7 ng/L. In other words, when the aquatic life criterion is being achieved (< 1 ng/L), the human health criterion should be achieved or close to being achieved as well (<0.7 ng/L vs. 0.59 ng/L). Therefore the turbidity targets proposed here should be adequate to gauge progress toward meeting both criteria. A similar conclusion applies to the human health criterion specific to DDT since it is the same as the DDE criterion and ambient concentrations of DDT are lower than DDE.
y = 0.8138x0.237
R² = 0.34
1
10
1 10 100
Tot
al D
DT
(ng
/L)
TSS (mg/L)
Sulphur Creek
Aquatic Life Criterion

Yakima Pesticides/PCBs TMDL: Vol 1, WQ Study Findings Page 169
Figure 73. Total DDT:TSS Correlation in Granger Drain during April 2007-March 2008.
Figure 74. Relationship Between DDE and Total DDT in the Yakima River, Tributaries, and Irrigation Returns during 2007-08 [excluded data: Yakima River at Harrison Bridge and high DDT outliers for Granger Drain (1/10/08) and Spring Creek (4/5/07)].
y = 1.9772x0.1492
R² = 0.04
1
10
100
1 10 100 1000
Tot
al D
DT
(ng
/L)
TSS (mg/L)
Granger Drain
Aquatic Life Criterion
y = 0.7354x + 0.0191R² = 0.98
0
0.5
1
1.5
2
2.5
3
3.5
4
4.5
0 1 2 3 4 5 6
DD
E (
ng/L
)
Total DDT (ng/L)

Yakima Pesticides/PCBs TMDL: Vol 1, WQ Study Findings Page 170
Not enough samples were collected from other lower Yakima River tributaries and irrigation returns to have confidence in determining appropriate turbidity targets to meet water quality criteria for DDT compounds. The amount of total DDT associated with suspended matter is relatively high in some of these discharges. Figure 75 shows how total DDT compares to a turbidity target of 10 NTU at the 12 screening survey sites where the 1 ng/L was exceeded on at least one occasion. Approximately 30% of the samples exceeded 1 ng/L at 10 NTU or less. Under current conditions, turbidities less than 5 NTU might be required to meet the criterion. For sake of consistency, an interim TMDL target of 10 NTU is proposed for irrigation returns basin-wide, recognizing that the total DDT:TSS ratio will decrease over time as erosion is brought under further control.
Figure 75. Total DDT vs. Turbidity in Selected Tributaries and Irrigation Returns from the 2007-08 Screening Survey, Highlighting Low Turbidity Samples that Exceeded the 1 ng/L Total DDT Criterion. Based on the preceding analysis, a revised set of TMDL targets is proposed for turbidity in the lower Yakima River (Table 63). They include a significant easing of restrictions put in place by the previous TMDL. In keeping with the previous TMDL, the turbidity targets for tributaries and irrigation returns would be applied to the 90th percentile. In this way, only 10% of the turbidities should exceed the target, and the average turbidity should be below the target. Compliance could be assessed separately for the irrigation season and non-irrigation season.
0.1
1
10
0.1 1 10 100
Tot
al D
DT
(ng
/L)
Turbidity (NTU)
Other Tributaries and Returns
> 1 ng/L @ <10 NTU

Yakima Pesticides/PCBs TMDL: Vol 1, WQ Study Findings Page 171
Table 63. Revised TMDL Targets Proposed for Turbidity in the Lower Yakima River.
Existing Target Revised Target Applies To: Intent
<5 NTU over background
(no change)
Mainstem Compliance with state turbidity standards
25 NTU (90th percentile)
All points within all tributaries
and drains
Protect fish and other aquatic organisms; assist with turbidity compliance in mainstem
7 mg/L TSS (~4 NTU)
Increase to <5 NTU over background
Mainstem Compliance with total DDT chronic aquatic life criterion and DDT/DDE human health criteria Increase to
10 NTU (90th percentile)
Mouths of all tributaries
and drains
Similar targets could not be derived or are not appropriate for the other 303(d) listed chemicals or for toxaphene. Except for Spring Creek (R2 = 0.58), dieldrin was weakly correlated or inversely correlated with TSS and appears to occur primarily in dissolved form. The previous TMDL concluded that establishing TSS or turbidity goals for dieldrin would not be suitable (Joy and Patterson, 1997). Endosulfan and chlorpyrifos concentrations are a function of how and when they are used. The levels encountered in surface water are unrelated to TSS. The PCB and toxaphene data obtained on surface water were limited to measuring long-term average concentrations which cannot be correlated with TSS. PCBs, however, have an affinity for suspended matter that is equal to or greater than DDT compounds. Thus, achieving the turbidity targets could also be an effective control measure for PCBs. Toxaphene does not sorb as strongly to suspended matter. The toxaphene problem in the lower Yakima River drainage could be the result of localized contamination rather than wide-spread soil contamination as with DDT and dieldrin. Thus, source investigation is indicated as a first step toward reducing toxaphene levels.

Yakima Pesticides/PCBs TMDL: Vol 1, WQ Study Findings Page 172
This page is purposely left blank

Yakima Pesticides/PCBs TMDL: Vol 1, WQ Study Findings Page 173
Loading Capacity
Determining a waterbody’s loading capacity for a pollutant is the basis for developing a TMDL. Loading capacity is the maximum amount of a pollutant that can be delivered to a waterbody and still achieve water quality standards. The portion of a receiving water’s loading capacity assigned to a particular source is a load (nonpoint sources) or wasteload (point sources) allocation. By definition, a TMDL is the sum of the allocations, which must not exceed the loading capacity. Load and wasteload allocations for the chemicals of concern in this TMDL will be addressed in a separate Water Quality Improvement Report to EPA, to be prepared by the Ecology Water Quality Program at a later date. Loading capacity can be calculated by multiplying streamflow by the pollutant’s water quality criterion. For carcinogens, EPA recommends using the long-term harmonic mean flow, since the adverse impacts to fish consumers are realized over a lifetime of exposure (EPA, 1991). Harmonic mean is the appropriate measure of central tendency when dealing with rates, in this case rates of flow. The harmonic mean is less than the arithmetic mean and is expressed as Qhm = n/∑(1/Qi), where n is the number of recorded flows and ∑(1/Qi) is the sum of the reciprocals of the flows. As noted by EPA (1991a), the harmonic mean “provides a more reasonable estimate than the arithmetic mean to represent long-term average river flow. Flood periods in rivers bias the arithmetic mean above the flows typically measured. This overstates available dilution. The calculation of the harmonic mean, however, dampens the effect of peak flows. As a result, bias is reduced. The harmonic mean is also an appropriate conservative estimate of long-term average flow in highly regulated river basins, such as the Columbia. In a regulated river basin, the harmonic mean and the arithmetic average are often much closer numerically.” Loading capacities to meet human health criteria in the mainstem Yakima River are calculated for DDE, dieldrin, chlordane toxaphene, and total PCBs in Table 64. The formula is: loading capacity (grams per day) = harmonic mean flow (cfs) x concentration (ng/L) x .00245. The human health criteria apply individually to DDT, DDE, and DDD (there is no human health criterion for total DDT). Among these, DDE is the primary concern for fish consumption. Loading capacity was assessed for four points in the system: Keechelus Lake, Kachess Lake, the upper Yakima River near Umtanum (Yakima Canyon above the city of Yakima), and the lower Yakima River at Kiona. Keechelus Lake has a separate 303(d) listing for PCBs. Kachess Lake qualifies for a PCB listing based on results of Ecology’s 2006 fish tissue survey. Umtanum represents the loading capacity of the Yakima River as it enters the lower Yakima basin. Kiona is the mainstem site with a long-term record of flow that is furthest downstream from the major pesticide and PCB inputs to the lower river.

Yakima Pesticides/PCBs TMDL: Vol 1, WQ Study Findings Page 174
Table 64. Loading Capacity Estimates for Meeting Human Health Criteria for DDT Compounds, Dieldrin, Chlordane, Toxaphene, and PCBs in the Yakima River.
Waterbody and Location
Mean Flow (cfs)
Loading Capacity (grams per day)
Pollutant: DDE Dieldrin Chlordane Toxaphene Total PCBs
Criterion (ng/L):
0.59 0.14 0.57 0.73 0.17
Keechelus Lake 338†
* * * * 0.14
Kachess Lake 292†
* * * * 0.12
Yakima River near Umtanum (r.m. 140.5)
1,548††
2.2 0.53 2.2 2.8 0.64
Yakima River at Kiona (r.m. 29.9)
2,279†† 3.3 0.78 3.2 4.2 0.95
*Human health criterion not exceeded in Keechelus or Kachess Lakes. †Arithmetic mean (Yakima River at Martin, 1994-2007 and Kachess Lake Reservoir).
††Harmonic mean (1994-2007).
Loading capacity was not calculated for DDT compounds, dieldrin, or toxaphene in Keechelus or Kachess Lakes because water quality criteria are currently being met. The previous TMDLs calculated loading capacities for TSS in the upper and lower Yakima River. Flow data were obtained from the USBR Yakima Project Hydromet website (www.usbr.gov/pn/hydromet/yakima.html). 1994-2007 was selected as the period of interest. Instream flow limits for the lower Yakima River were established in 1994. Complete flow data were available through 2007, as of this writing. The loading capacity for PCBs in Keechelus Lake and Kachess Lake was based on the flow at the outlet (Yakima River at Martin and Kachess Lake Reservoir). Outflow was assumed equal to inflow. This ignores loss of PCBs due to evaporation and sedimentation, resulting in a conservative estimate of loading capacity. The arithmetic rather than harmonic mean was used here because mixing of inflows within a lake is an averaging process. The loading capacity of the Yakima River for DDE and dieldrin is estimated at 2.2 and 0.53 grams per day, respectively, at Umtanum, increasing to 3.3 and 0.78 grams per day by Kiona. For chlordane, loading capacities at these points are 2.2 and 3.2 grams per day. The estimates for total PCBs range from 0.12 grams per day in Kachess Lake to 0.95 grams per day at Kiona. Loading capacities of 2.8 – 4.2 grams per day were estimated for toxaphene. Loading capacity for meeting the chronic aquatic life criteria for total DDT and toxaphene was calculated in a similar fashion (Table 65). While minimums are often used as the design flow for aquatic life criteria, low flow is not the critical period for these chemicals. During 2007-08, the lower river approached or exceeded the total DDT criterion only when flows and TSS were up,

Yakima Pesticides/PCBs TMDL: Vol 1, WQ Study Findings Page 175
either in the first part of the irrigation season or during the winter. Higher toxaphene concentrations were recorded early in the irrigation season than after the end of irrigation. Therefore, loading capacities for compliance with the chronic aquatic life criteria for total DDT and toxaphene were based on the long-term harmonic mean flow, for additional reasons explained above.
Table 65. Loading Capacity Estimates for Meeting Chronic Aquatic Life Criteria for Total DDT and Toxaphene in the Yakima River.
Waterbody and Location
Mean Flow (cfs)
Loading Capacity (grams per day)
Pollutant: Total DDT Toxaphene
Criterion (ng/L):
1.0 0.2
Yakima River near Umtanum (r.m. 140.5)
1,548†
3.8 0.76
Yakima River at Kiona (r.m. 29.9)
2,279† 5.6 1.1
†Harmonic mean (1994-2007).
Because of its lower persistence and minimal bioaccumulation potential, chlorpyrifos is a water quality concern only during the growing season, in and around the times it is applied. In contrast to total DDT and toxaphene, the Yakima River is most vulnerable to the adverse impacts of chlorpyrifos during the minimum flows of late summer and fall. For toxic wasteload allocation studies in which the hydrologically-based method is used, EPA recommends 7Q10 (seven-day, 10-year, low flow) as the design flow for the chronic criteria and the 1Q10 (one-day, 10-year, low flow) as the design flow for the acute criteria (EPA, 1991b). Therefore, loading capacities for chlorpyrifos were based on the 7Q10 and 1Q10. Flow statistics were calculated using EPA’s DFLO 3.1 tool http://epa.gov/waterscience/models/dflow/. Flow data for 1994-2007 were downloaded from the USGS website http://waterdata.usgs.gov/wa/nwis/sw . Results are shown in Tables 66 and 67. Loading capacity estimates for chlorpyrifos range from 54 – 112 grams per day.

Yakima Pesticides/PCBs TMDL: Vol 1, WQ Study Findings Page 176
Table 66. Loading Capacity Estimates for Meeting Chronic Aquatic Life Criterion for Chlorpyrifos in the Yakima River.
Waterbody and Location
7Q10 Flow* (cfs)
Loading Capacity (grams per day)
Pollutant: Chlorpyrifos Criterion
(ng/L):41
Yakima River near Umtanum (r.m. 140.5)
538
54
Yakima River at Kiona (r.m. 29.9)
636
64
*Seven-day, 10-year low flow, 1994-2007.
Table 67. Loading Capacity Estimates for Meeting Acute Aquatic Life Criterion for Chlorpyrifos in the Yakima River.
Waterbody and Location
1Q10 Flow* (cfs)
Loading Capacity (grams per day)
Pollutant: Chlorpyrifos Criterion
(ng/L):83
Yakima River near Umtanum (r.m. 140.5)
514
105
Yakima River at Kiona (r.m. 29.9)
551
112
*One-day, 10-year low flow, 1994-2007. The loading capacity for chemicals of concern in the Naches River, lower Yakima River, and their tributaries and irrigation returns will be determined in the Water Quality Improvement Report scheduled to be completed by the Ecology Water Quality Program at a later date.

Yakima Pesticides/PCBs TMDL: Vol 1, WQ Study Findings Page 177
Pollutant Reductions Needed
Reductions in pollutant levels will be needed to meet water quality standards and TMDL targets for turbidity, pesticides, and PCBs in the Yakima River. Estimates of the percent reductions needed for the mainstem are provided below. The reductions required for point and nonpoint discharges to the Yakima River will be addressed in the TMDL Water Quality Improvement Report to EPA.
Turbidity The turbidity reductions needed in the lower Yakima River mainstem to meet the target set by the existing TMDL are shown in Table 68. During the first part of the 2007 irrigation season, the higher turbidities recorded for the Yakima River at Euclid and at Kiona exceeded the TMDL target by 4-12 NTU. These turbidity levels would need to be reduced by 26-39% to meet the target. The river was consistently meeting the turbidity target further upstream at Parker.
Table 68. Percent Reductions Needed to Meet the Existing TMDL Turbidity Target in the Lower Yakima River Mainstem during the 2007 Irrigation Season.
Location/ Waterbody
Existing TMDL Target
Range of Values Exceeding Target During
2007 Irrigation Season
Percent Reduction
Needed
Yakima R. at Euclid Background
+ 5 NTU
15-27 NTU 26-39%
Yakima R. at Kiona
16-32 NTU 26-37%
Pesticides and PCBs Because of variability in the water quality data, the pesticide and PCB reductions needed for the lower mainstem (Table 68) were based on water column concentrations estimated from the 2006 fish tissue survey and EPA bioconcentration factors. Fish integrate pollutant levels in the water over time and, thus, can provide a more representative estimate of ambient concentrations. Median concentrations for the edible fish tissue samples collected from Toppenish to Horn Rapids were used in the estimates (N=29, see Table 7). The reduction for chlordane is for Prosser carp, the only location and species that exceeded criteria. Reductions needed to meet human health criteria in lower Yakima River fish are estimated to be in the range of 31-68% for DDE, dieldrin, and total PCBs. 10% and 19% reductions are indicated for toxaphene and chlordane, respectively. Greater or lesser reductions than those indicated in Table 69 would be required depending on species and location. Year-to-year differences in water supply, which affects dilution, will also influence pesticide and PCB residues in Yakima River fish.

Yakima Pesticides/PCBs TMDL: Vol 1, WQ Study Findings Page 178
Table 69. Estimates of Loading Reductions Needed in the Mainstem Lower Yakima River to Meet Human Health Criteria of DDE, Dieldrin, Chlordane, Toxaphene, and Total PCBs [Based on edible fish tissue data in Johnson et al. (2007).]
Pollutant
Median Fish
Tissue Concen-tration
(ug/Kg)
EPA Bioconcen-
tration Factor (L/Kg)
Estimated Water
Column Concen- tration (ng/L)
Estimated Load
@ Kiona* (grams/day)
Loading Capacity
(grams/day)
Difference (grams/day)
Percent Reduction
Needed
DDE 91 53,600 1.7 9.5 3.3 6.2 65%
Dieldrin 1.0 4,670 0.21 1.2 0.78 0.4 33%
Chlordane 10 14,100 0.71 4.0 3.2 0.8 19%
Toxaphene 11 13,100 0.84 4.7 4.2 0.5 10%
Total PCBs 17 31,200 0.54 3.0 0.95 2.1 69%
*at 2,279 cfs (1994-2007 harmonic mean flow). PCBs also exceed human health criteria in the mainstem upper Yakima River, as well as the Keechelus and Kachess reservoirs. By the same calculation as above, a 60% reduction in the load appears to be needed for PCBs in the upper mainstem. A similar reduction (59%) applies to PCB levels in fish in the storage reservoirs. DDE, dieldrin, chlordane, and toxaphene were either meeting or close to meeting water quality criteria in both the upper river and storage reservoirs (Table 7). Chlorpyrifos is not a human health concern in Yakima River fish tissue. Although substantial increases in chlorpyrifos concentrations were observed in water samples from the mainstem lower Yakima River during the 2007 irrigation season, exceedances of aquatic life criteria were only observed in irrigation returns. Reductions needed for chlorpyrifos will be addressed in the TMDL Water Quality Improvement Report.

Yakima Pesticides/PCBs TMDL: Vol 1, WQ Study Findings Page 179
Conclusions
Results of this 2007-08 study support the following conclusions: Despite significant reductions in soil erosion, irrigation returns continue to discharge elevated
levels of suspended sediment that contribute to exceedances of Washington State turbidity and pesticide criteria in the lower Yakima River.
A first-time effort to characterize chemical contaminants in urban stormwater discharges to
the Yakima River found high levels of pesticides, PCBs, TSS, and turbidity in runoff from the cities of Yakima, Union Gap, and Ellensburg (pesticides not analyzed).
The lower Yakima River and some of its tributaries and irrigation returns fail to meet
(exceed) Washington State human health criteria for fish consumption for DDE, dieldrin, toxaphene, PCBs, and, marginally, chlordane.
Toxaphene sometimes exceeds aquatic life criteria in the lower Yakima River and certain of
its tributaries, and irrigation returns. Peak chlorpyrifos concentrations in some of the same returns exceed aquatic life criteria
during the spring and fall when this insecticide is being applied. Irrigation returns are the predominant cause of degraded water quality in the Yakima River. These are the most important sources to control for reducing the adverse effects of elevated turbidity, pesticides, and PCBs. Urban stormwater runoff also appears to be a significant source of these same pollutants and follows in the priority of sources that need to be reduced. This study found that reductions are also needed for PCBs in wastewater treatment plant (WWTP) effluent and several pesticides in fruit packer and vegetable processor effluent, if these facilities are to meet water quality criteria at the point of discharge. However, these are relatively low volume discharges. Except for the current use insecticides chlorpyrifos and endosulfan, pesticides were not analyzed to a low enough level in WWTP effluent to rule out exceedances of water quality criteria. Thus, some further reductions could ultimately be needed.

Yakima Pesticides/PCBs TMDL: Vol 1, WQ Study Findings Page 180
This page is purposely left blank

Yakima Pesticides/PCBs TMDL: Vol 1, WQ Study Findings Page 181
Recommendations
303(d) Listings/TMDL 1. The current (2008) Water Quality Assessment 303(d) listings are appropriate for total DDT,
DDE, dieldrin, chlordane, chlorpyrifos, PCBs, and dioxin for those areas indicated in Table 58.
2. DDT compounds, dieldrin, chlordane chlorpyrifos, toxaphene, and PCBs should be addressed
in the TMDL Water Quality Improvement Report to EPA. 3. Following approval of the TMDL, toxaphene should be added to the Category 4A (has an
approved TMDL) listings for the Yakima River watershed.
4. The next water quality assessment process should remove endosulfan and alpha-BHC from the 303(d) list for the lower Yakima River (WRIA 37) and placed them in Category 1 (Meets Standards).
5. The 303(d) listing for chlordane in the upper Yakima River (WRIA 39) should be removed
and placed in Category 1.
6. The 303(d) listing for dioxin in Keechelus Lake (WRIA 39) should be removed and placed in Category 1.
Source Tracing 7. Work with city and county officials to identify sources of pesticides, PCBs, suspended
sediment, and turbidity in stormwater from Yakima, Union Gap, Selah, and Ellensburg (PCBs only). Improving current understanding of spatial and temporal variability should be among the first steps in this effort.
8. Identify sources of toxaphene to Wilson Creek, Moxee Drain, Granger Drain, and, especially, Sulphur Creek Wasteway. Screen other tributaries and irrigation returns for the presence of toxaphene.
9. Identify PCB sources to Sulphur Creek Wasteway and Granger Drain.
Monitoring 10. Characterize dry weather discharge (winter and irrigation season) of pesticides, PCBs,
suspended sediment, and turbidity from Yakima area storm drains.

Yakima Pesticides/PCBs TMDL: Vol 1, WQ Study Findings Page 182
11. Work with the U.S. Bureau of Reclamation, the Yakama Nation, irrigation districts, conservation districts, and other interested parties to continue and, where appropriate, expand turbidity monitoring of priority irrigation returns identified through the present study.
12. Explore the possibility of installing a continuous turbidity monitor in the Yakima River at
Kiona. 13. Continue chlorpyrifos monitoring in Sulphur Creek Wasteway, Spring Creek, and Marion
Drain through Ecology’s Surface Water Monitoring Program for Pesticides in Salmonid-Bearing Streams.
14. Periodically monitor lower Yakima River fish for DDE, dieldrin, chlordane, toxaphene,
PCBs, and dioxin to assess progress toward meeting human health criteria and the need to continue the fish consumption advisory for PCBs.

Yakima Pesticides/PCBs TMDL: Vol 1, WQ Study Findings Page 183
References
Agee, B. 1985. Toxics Substances Monitoring Program. California Water Resources Control Board, Water Quality Monitoring Report No. 85-1-WQ, Sacramento, CA.
Anderson, R. 2008. Evaluation of the Effectiveness of Establishing Total Maximum Daily Load Targets on the Reduction in the Levels of Suspended Sediment and Turbidity in the Upper Yakima River. M.S. Thesis, Washington State University, Pullman, WA.
ATSDR. 1996. Toxicological Profile for Toxaphene. Agency for Toxic Substances & Disease Registry, Department of Human and Health Services, Atlanta, Georgia. www.atsdr.cdc.gov/toxprofiles/tp94.html.
ATSDR. 2000. Toxicological Profile for Polychlorinated Biphenyls (PCBs). Agency for Toxic Substances & Disease Registry, Department of Human and Health Services, Atlanta, Georgia. www.atsdr.cdc.gov/toxprofiles/tp17.html.
Boucher, P.R. 1975. Sediment Transport by Irrigation Return Flows in Four Small Drains within the DID-18 Drainage of the Sulphur Creek Basin, Yakima County, Washington, April 1979 to October 1981. Water Resources Investigations Report 83-4167, U.S. Geological Survey, Tacoma, WA. 149 pp.
Boucher, P.R. and M.O. Fretwell. 1982. Irrigation-water Quality in the Sulphur Creek Basin, Yakima and Benton Counties, Washington, April 1976 through March 1977. Open File Report 81-1008. U.S. Geological Survey, Tacoma, WA. 68 pp.
Burke, C., P. Anderson, D. Dugger, and J. Cowles. 2006. Surface Water Monitoring Program for Pesticides in Salmonid-Bearing Streams, 2003-2005. Washington State Department of Ecology and Washington State Department of Agriculture, Olympia, WA. Ecology Publication No. 06-03-036. www.ecy.wa.gov/biblio/0603036.html.
Callahan, M.A. et al. 1979. Water-related Environmental Fate of 129 Priority Pollutants. EPA-440/4-79-029a.
Carmack, K. 2008. Personal communication. Washington State Department of Ecology, Central Regional Office, Yakima, WA.
CH2M Hill. 1975. Characterization of Present Water-quality Conditions in the Yakima Basin. Report to the Washington State Department of Ecology, Olympia, WA. Technical Bulletin 10. 47 pp.
Coffin, C. 2008. Personal communication, 9/05/08 email. Washington State Department of Ecology, Central Regional Office, Yakima, WA.
Coffin, C. and A. Johnson. 2007 Draft. Quality Assurance Project Plan: TMDL Effectiveness Monitoring for the Upper Yakima River Suspended Sediment and Organochlorine Pesticide TMDL - An Addendum to the Yakima River Chlorinated Pesticide and PCB QAPP. Washington State Department of Ecology, Olympia, WA.

Yakima Pesticides/PCBs TMDL: Vol 1, WQ Study Findings Page 184
Coffin, C., R. Plotnikoff, and R. Anderson. 2006. Lower Yakima River Suspended Sediment Total Maximum Daily Load Study Water Quality Effectiveness Monitoring Report. Washington State Department of Ecology, Yakima, WA. Publication No. 06-03-014. www.ecy.wa.gov/biblio/0603014.html.
Corps of Engineers. 1978. Yakima Valley Regional Water Management Study Volumes 1-4. U.S. Army Corps of Engineers, Seattle District, Seattle, WA.
Creech, J. and J. Joy. 2002. Upper Yakima River Basin Suspended Sediment, Turbidity, and Organochlorine Pesticide Total Maximum Daily Load: Submittal Report. Washington State Department of Ecology, Olympia, WA. Publication No. 02-10-047-WQ. www.ecy.wa.gov/biblio/0210047.html.
CRITFC. 1994. A Fish Consumption Survey of the Umatilla, Nez Perce, Yakama, and Warm Springs Tribes of the Columbia River Basin. Tech. Rept. 94-3. Columbia River Inter-Tribal Fish Commission, Portland, OR.
Davis, D. 1993. Washington State Pesticide Monitoring Program – Reconnaissance Sampling of Surface Waters (1992). Washington State Department of Ecology, Olympia, WA. Publication No. 93-e09. www.ecy.wa.gov/biblio/93e09.html.
Davis, D. 1996. Washington State Pesticide Monitoring Program – 1994 Surface Water Sampling Report. Washington State Department of Ecology, Olympia, WA. Publication No. 96-305. www.ecy.wa.gov/biblio/96305.html.
Davis, D. and A. Johnson. 1994. Washington State Pesticide Monitoring Program – 1993 Surface Water Sampling Report. Washington State Department of Ecology, Olympia, WA. Publication No. 94-164. www.ecy.wa.gov/biblio/94164.html.
Davis, D., A. Johnson, and D. Serdar. 1998a. Washington State Pesticide Monitoring Program – 1995 Surface Water Sampling Report. Washington State Department of Ecology, Olympia, WA. Publication No. 98-300. www.ecy.wa.gov/biblio/98300.html.
Davis, D., D. Serdar, and A. Johnson. 1998b. Washington State Pesticide Monitoring Program – 1995 Fish Tissue Sampling Report. Washington State Department of Ecology, Olympia, WA. Publication No. 98-312. www.ecy.wa.gov/biblio/98312.html.
Dolan, D.M., A.K. Yui, and R.D. Geist. 1981. Evaluation of River Load Estimation Methods for Total Phosphorus. J. Great Lakes Research 7(3):207-214.
Dugger, D., C. Burke, J. Jorden, P. Anderson, D. Norton, and J. Cowles. 2008. Pesticides in Salmonid-Bearing Streams: Intensive Sampling in an Agricultural Drain, A Cooperative Study by the Washington State Department of Ecology and the Washington State Department of Agriculture. Ecology Publication No. 08-03-020. www.ecy.wa.gov/biblio/0803020.html.
Ebbert, J.C. and S.S. Embrey. 2002. Pesticides in Surface Water of the Yakima River Basin, Washington, 1999–2000—Their Occurrence and an Assessment of Factors Affecting Concentrations and Loads. U.S. Geological Survey Water-Resources Investigations Report 01–4211. http://or.water.usgs.gov/pubs/WRIR01-4211/index.html

Yakima Pesticides/PCBs TMDL: Vol 1, WQ Study Findings Page 185
Ebbert, J.C., S.S. Embrey, and J.A. Kelley. 2002b. Concentrations and Loads of Suspended Sediment and Nutrients in Surface Water of the Yakima River Basin, Washington, 1999-2000 – With an Analysis of Trends in Concentrations. U.S. Geological Survey Water-Resources Investigations Report 03–4026. http://pubs.usgs.gov/wri/wri034026/
Edwards, C.A. 1973. Persistent Pesticides in the Environment. CRC Press, Cleveland, OH.
Ecology. 1979. Irrigated Agriculture Water Quality Management Plan Section 208, P.L. 95-217. Washington State Department of Ecology, Water Quality Program, Olympia, WA. Report 79-5b. 55 pp.
Ecology. 1996. Total Maximum Daily Load Guidelines. Washington State Department of Ecology, Olympia, WA. Publication No. 97-315. www.ecy.wa.gov/biblio/97315.html.
Ecology, 2004. Stormwater Management Manual for Eastern Washington. Washington State Department of Ecology, Water Quality Program, Olympia, WA. Publication No. 04-10-076. www.ecy.wa.gov/biblio/0410076.html.
Ecology. 2006. Assessment of Water Quality for the Clean Water Act Sections 303(d) and 305(b) Integrated Report. WQP Policy 1-11, Revised: September, 2006. Water Quality Program, Washington State Department of Ecology.
Ellis, G.S., J.N. Huckins, C.E. Rostad, C.J. Schmitt, J.D. Petty, and P. MacCarthy. 1995. Evaluation of Lipid-Containing Semipermeable Membrane Devices (SPMDs) for Monitoring Organochlorine Contaminants in the Upper Mississippi River. Environmental Toxicology Chemistry 14:1875-1884.
EPA. 1990. Specifications and Guidance for Obtaining Contaminant-Free Sample Containers. U.S. Environmental Protection Agency. OSWER Directive #93240.0-05.
EPA. 1991a. Total Maximum Daily Loading (TMDL) to Limit Discharges of 2,3,7,8-TCDD (Dioxin) to the Columbia River Basin. U.S. Environmental Protection Agency, Region 10, Seattle, WA.
EPA. 1991b. Technical Support Document for Water Quality-based Toxics Control. U.S. Environmental Protection Agency. EPA/505/2-90-001.
EPA. 1995. Guidelines for Preparation of the 1996 State Water Quality Assessment (305(b) reports). U.S. Environmental Protection Agency. EPA-841B-95-001.
EPA. 2002a. Columbia River Basin Fish Contaminant Survey, 1996-1998. U.S. Environmental Protection Agency, Region 10, Seattle, WA. EPA-910/R-02-006.
EPA. 2002b. Estimated Per Capita Fish Consumption in the United States. U.S. Environmental Protection Agency. EPA-821-R-00-025.
Fuhrer, G., J. Morace, H.M. Johnson, J.F. Rinella, J.C. Ebbert, S.S. Embrey, I.R. Waite, K.D. Carpenter, D.R. Wise, and C.A. Hughes. 2004. Water Quality in the Yakima River Basin, Washington 1999-2000. U.S. Geological Survey Circular 1237, 34 p. http://pubs.usgs.gov/circ/2004/1237/pdf/circular1237.pdf

Yakima Pesticides/PCBs TMDL: Vol 1, WQ Study Findings Page 186
Gary Struthers Associates, Inc. 2005. Okanogan Sewer Investigation Report: Lower Okanogan Sewer Investigation for PCBs and DDT. Prepared for Washington State Department of Ecology.
Golding, S. 2002. Spokane Area Point Source PCB Survey, May 2001. Washington State Department of Ecology, Olympia, WA. Publication No. 02-03-009. www.ecy.wa.gov/biblio/0203009.html
Hallock, D. 2005. A Comparison of Water Quality Data Collected from Two Washington Rivers by the Department of Ecology and the U.S. Geological Survey. Washington State Department of Ecology, Olympia, WA. Publication No. 05-03-009. www.ecy.wa.gov/biblio/0503009.html
Hallock, D. 2007. Personal communication, 11/6/2008 email. Freshwater Monitoring Unit, Washington State Department of Ecology, Olympia, WA.
Huckins, J.N., J.D. Petty, and K. Booij. 2006. Monitors of Organic Chemicals in the Environment: Semipermeable Membrane Devices. Springer Science and Business Media, New York, NY. 223 pp.
Huckins, J.N., J.D. Petty, H.F. Prest, R.C. Clark, D.A. Alvarez, C.E. Orazio, J.A. Lebo, W.L. Cranor, and B.T. Johnson. 2000. A Guide to the Use of Semipermeable Membrane Devices (SPMDs) as Samplers of Waterborne Hydrophobic Organic Contaminants. U.S. Geological Survey, Columbia Environmental Research Center, Columbia MO.
Hyne, R., F. Pablo, M. Aistrope, A.W. Leonard, and N. Ahmad. 2004. Comparison of Time-Integrated Pesticide Concentrations Determined from Field-Deployed Passive Samplers with Daily River-Water Extractions. Environmental Toxicology Chemistry. 23(9):2090-2098.
Johnson, A. 2007a. Quality Assurance Project Plan: Yakima River Chlorinated Pesticides, PCBs, Suspended Sediment, and Turbidity Total Maximum Daily Load Study. Washington State Department of Ecology, Olympia, Washington. Publication No. 07-03-107. www.ecy.wa.gov/biblio/0703107.html.
Johnson, A. 2007b. Standard Operating Procedure for Using Semipermeable Membrane Devices to Monitor Hydrophobic Organic Compounds in Surface Water. Washington State Department of Ecology, Olympia, WA.
Johnson, A., K. Seiders, and D. Norton. 2010. An Assessment of the PCB and Dioxin Background in Washington Freshwater Fish, with Recommendations for Prioritizing 303(d) Listings. Washington State Department of Ecology, Publication No. 10-03-007. www.ecy.wa.gov/biblio/0803102.html
Johnson, A, B. Era-Miller, and R. Coots. 2007. Chlorinated Pesticides, PCBs, and Dioxins in Yakima River Fish in 2006: Data Summary and Comparison to Human Health Criteria. Washington State Department of Ecology, Olympia, WA. Publication No. 07-03-036. www.ecy.wa.gov/biblio/0703036.html
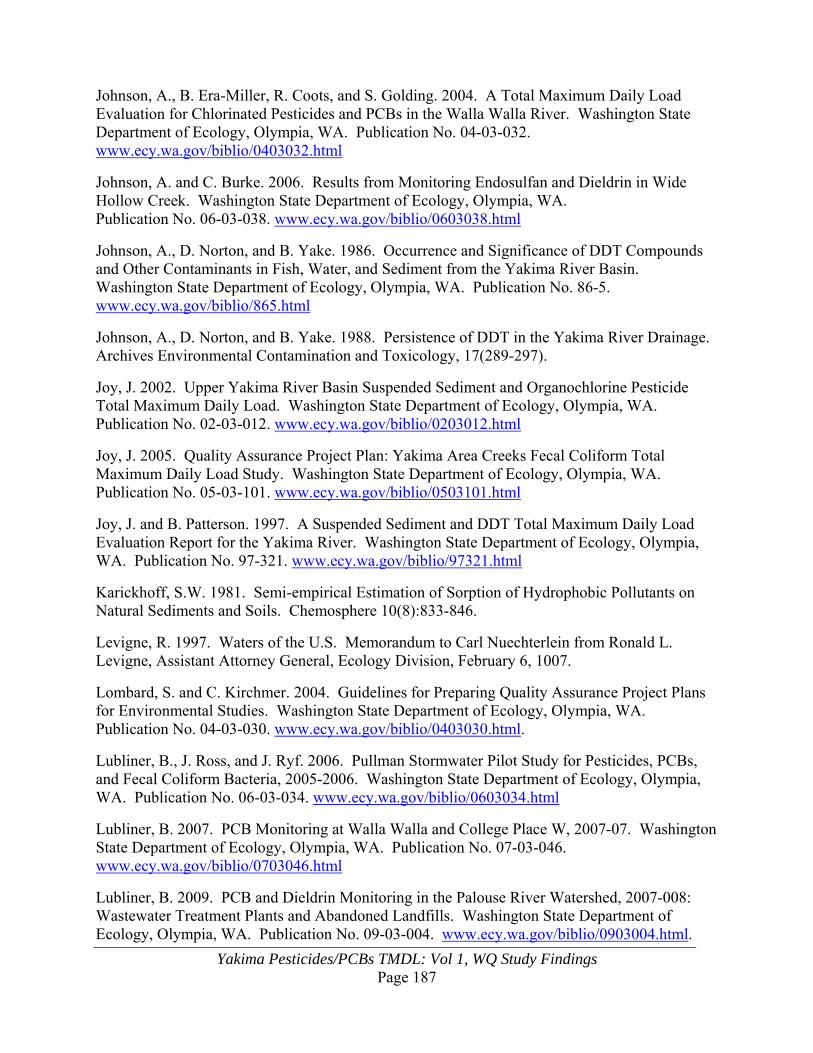
Yakima Pesticides/PCBs TMDL: Vol 1, WQ Study Findings Page 187
Johnson, A., B. Era-Miller, R. Coots, and S. Golding. 2004. A Total Maximum Daily Load Evaluation for Chlorinated Pesticides and PCBs in the Walla Walla River. Washington State Department of Ecology, Olympia, WA. Publication No. 04-03-032. www.ecy.wa.gov/biblio/0403032.html
Johnson, A. and C. Burke. 2006. Results from Monitoring Endosulfan and Dieldrin in Wide Hollow Creek. Washington State Department of Ecology, Olympia, WA. Publication No. 06-03-038. www.ecy.wa.gov/biblio/0603038.html
Johnson, A., D. Norton, and B. Yake. 1986. Occurrence and Significance of DDT Compounds and Other Contaminants in Fish, Water, and Sediment from the Yakima River Basin. Washington State Department of Ecology, Olympia, WA. Publication No. 86-5. www.ecy.wa.gov/biblio/865.html
Johnson, A., D. Norton, and B. Yake. 1988. Persistence of DDT in the Yakima River Drainage. Archives Environmental Contamination and Toxicology, 17(289-297).
Joy, J. 2002. Upper Yakima River Basin Suspended Sediment and Organochlorine Pesticide Total Maximum Daily Load. Washington State Department of Ecology, Olympia, WA. Publication No. 02-03-012. www.ecy.wa.gov/biblio/0203012.html
Joy, J. 2005. Quality Assurance Project Plan: Yakima Area Creeks Fecal Coliform Total Maximum Daily Load Study. Washington State Department of Ecology, Olympia, WA. Publication No. 05-03-101. www.ecy.wa.gov/biblio/0503101.html
Joy, J. and B. Patterson. 1997. A Suspended Sediment and DDT Total Maximum Daily Load Evaluation Report for the Yakima River. Washington State Department of Ecology, Olympia, WA. Publication No. 97-321. www.ecy.wa.gov/biblio/97321.html
Karickhoff, S.W. 1981. Semi-empirical Estimation of Sorption of Hydrophobic Pollutants on Natural Sediments and Soils. Chemosphere 10(8):833-846.
Levigne, R. 1997. Waters of the U.S. Memorandum to Carl Nuechterlein from Ronald L. Levigne, Assistant Attorney General, Ecology Division, February 6, 1007.
Lombard, S. and C. Kirchmer. 2004. Guidelines for Preparing Quality Assurance Project Plans for Environmental Studies. Washington State Department of Ecology, Olympia, WA. Publication No. 04-03-030. www.ecy.wa.gov/biblio/0403030.html.
Lubliner, B., J. Ross, and J. Ryf. 2006. Pullman Stormwater Pilot Study for Pesticides, PCBs, and Fecal Coliform Bacteria, 2005-2006. Washington State Department of Ecology, Olympia, WA. Publication No. 06-03-034. www.ecy.wa.gov/biblio/0603034.html
Lubliner, B. 2007. PCB Monitoring at Walla Walla and College Place W, 2007-07. Washington State Department of Ecology, Olympia, WA. Publication No. 07-03-046. www.ecy.wa.gov/biblio/0703046.html
Lubliner, B. 2009. PCB and Dieldrin Monitoring in the Palouse River Watershed, 2007-008: Wastewater Treatment Plants and Abandoned Landfills. Washington State Department of Ecology, Olympia, WA. Publication No. 09-03-004. www.ecy.wa.gov/biblio/0903004.html.

Yakima Pesticides/PCBs TMDL: Vol 1, WQ Study Findings Page 188
Mackay, D. and A. Fraser. 2000. Bioaccumulation of Persistent Organic Chemicals: Mechanisms and Models. Environmental Pollution 110:375-391.
Mackay, D., W-Y Shiu, and K-C Ma. 1997. Illustrated Handbook of Physical-Chemical Properties and Environmental Fate of Organic Compounds, Volume V: Pesticide Chemicals. Lewis Publishers, Boca Raton, NY.
McKenzie, S. and D. Curtiss. 1989. Surface-water-quality Assessment of the Yakima River basin, Washington: A Pilot Study. U.S. Geological Survey Open-File Report 89-60.
Meadows, J.C., K.R. Echols, J.N. Huckins, F.A. Borsuk, R.F. Carline, and D.E. Tillitt. 1998. Estimation of Uptake Rates for PCB Congeners Accumulated by Semipermeable Membrane Devices and Brown Trout (Salmo trutta). Environ. Sci. Tech. 32:1847-1852.
Mischke, T., K. Brunetti, V. Acosta, D. Weater, and M. Brown. 1985. Agricultural Sources of DDT Residues in California’s Environment. California Department of Food and Agriculture, Sacramento, CA.
Molenaar, D. 1985. Water in the Lower Yakima River Basin, Washington. Water Supply Bulletin 53. Washington State Department of Ecology and U.S. Geological Survey, Olympia, WA. 159 pp.
Morace, J.L., Fuhrer, G.J., Rinella, J.F., S.W. McKenzie, and others. 1999. Surface-water-quality Assessment of the Yakima River Basin in Washington: An Overview of Major Findings, 1987091. U.S. Geological Survey Water-Resources Investigations Report 98-4113.
Nelson, L.M. 1979. Sediment Transport by Irrigation Return Flows in the Lower Yakima River Basin, Washington, 1975 and 1976 Irrigation Seasons. Open File Report 78-946. U.S. Geological Survey, Tacoma, WA. 76 pp.
NOAA. 2008. Endangered Species Act Section 7 Consultation: Final Biological Opinion, Environmental Protection Agency Registration of Pesticides Containing Chlorpyrifos, Diazinon, and Malathion. National Oceanic and Atmospheric Administration, National Marine Fisheries Service, Silver Springs, MD.
Parsons, Inc, 2007. Spokane River PCB TMDL Stormwater Loading Analysis Final Technical Report. Prepared by Parsons for U.S. Environmental Protection Agency Region 10 and Washington State Department of Ecology, Olympia, WA. www.ecy.wa.gov/biblio/0703055.html
Rantalainen, A.L., M.G. Ikonomou, and I.H. Rogers. 1998. Lipid-Containing Semipermeable Membrane Devices (SPMDs) as Concentrators of Toxic Chemicals in the Lower Fraser River, British Columbia. Chemosphere 37:1119-1138.
Rinella, J.F., S.W. McKenzie, J.K. Crawford, W.T. Foreman, G.J. Fuhrer, and J.L. Morace. 1999. Surface-Water-Quality Assessment of the Yakima River Basin, Washington: Distribution of Pesticides and Other Organic Compounds in Water, Sediment, and Aquatic Biota, 1987–91: U.S. Geological Survey Water-Supply Paper 2354–B, 180 p.

Yakima Pesticides/PCBs TMDL: Vol 1, WQ Study Findings Page 189
Rinella, Joseph F., P.A. Hamilton, and S.W. McKenzie. 1993. Persistence of the DDT Pesticide in the Yakima River Basin. U.S. Geological Survey Circular 1090.
Risebrough, R.W., W.M. Jarman, and W. Walker. 1984. Evidence for Recent Mobilization of DDT in California. A report to the State Water Resources Control Board, Sacramento, CA. 39 pp.
Ryan, J.W. 1997. Irrigation Water is “Water of the U.S.” Memorandum to Ronald L. Levigne from Joseph W. Ryan, Assistant Regional Counsel, U.S. Environmental Protection Agency, Seattle, WA.
Schmitt, C.J., J.L. Zajicek, and P.H. Peterman. 1990. National Contaminant Monitoring Program: Residues of Organochlorine Chemicals in U.S. Freshwater Fish, 1976 - 84. Arch. Environ. Contam. Toxicol. 19:748-781.
Serdar, D. 2003. TMDL Technical Assessment of DDT and PCBs in the Lower Okanogan River Basin Washington State Department of Ecology, Olympia, WA. Publication No. 03-03-013. www.ecy.wa.gov/biblio/0303013.html
Serdar, D., K. Kinney, and P. Hallinan. 2006 (draft). Spokane River PCBs Total Maximum Daily Load Water Quality Improvement Report. Washington State Department of Ecology, Olympia, Washington. Publication No. 06-03-024. www.ecy.wa.gov/biblio/0603024.html
Shueler, T.R., 1987. Controlling Urban Runoff: A Practical Manual for Planning and Designing Urban BMPs. Metropolitan Washington Council of Governments, Washington, DC. Publication No. 87703.
Soil Conservation Service. 1978. Yakima Co-operative River Basin Study, Draft December 1978. U.S. Department of Agriculture, Soil Conservation Service, and Forest Service, Spokane, WA.
WDOH. 1993. DDT in Bottom Fish from the Yakima River. Washington State Department of Health, Office of Toxic Substances, Olympia, WA.
Zuroske, M. 2004. Conservation Practices and Water Quality Trends in Sulphur Creek Wasteway and Granger Drain Watersheds, 1997-2002. South Yakima Conservation District and Roza-Sunnyside Board of Joint Control.
Zuroske, M. 2008. Lower Yakima River Eutrophication Study: Preliminary Highlights. April 30, 2008 presentation at the Washington State Department of Ecology, Central Regional Office, Yakima, WA.

Yakima Pesticides/PCBs TMDL: Vol 1, WQ Study Findings Page 190
This page is purposely left blank

Yakima Pesticides/PCBs TMDL: Vol 1, WQ Study Findings Page 191
Appendices

Yakima Pesticides/PCBs TMDL: Vol 1, WQ Study Findings Page 192
This page is purposely left blank

Yakima Pesticides/PCBs TMDL: Vol 1, WQ Study Findings Page 193
Appendix A. Yakima Basin 303(d) Listings Based on Edible Fish Tissue Samples (2008 list)
Water Body Approximate
Location Listing
ID Parameter
Upper Yakima River (WRIA* 39)
Keechelus Lake Near inlet 43146 Total PCBs Keechelus Lake Near inlet 43128 Dioxin
Yakima River Umtanum 20182 Chlordane Yakima River Umtanum 20219 Total PCBs Yakima River Umtanum 34889 Dioxin
Naches River (WRIA 38)
Cowiche Creek Cowiche Creek
Near mouth Near mouth
1721452833
4,4'-DDE Total PCBs
Lower Yakima River (WRIA 37)
Yakima River Union Gap 14253 4,4'-DDT Yakima River Union Gap 14257 4,4'-DDE Yakima River Union Gap 14255 4,4'-DDD Yakima River Union Gap 14259 Alpha-BHC Yakima River Union Gap 14261 Total PCBs
Yakima River Zillah 7351 4,4'-DDT Yakima River Zillah 8874 4,4'-DDE Yakima River Zillah 8875 Dieldrin
Yakima River Granger 19595 4,4'-DDE Yakima River Granger 19597 4,4'-DDE Yakima River Granger 19616 4,4'-DDT Yakima River Granger 19618 4,4'-DDT Yakima River Granger 20047 Total PCBs Yakima River Yakima River Yakima River
Granger Granger Granger
2004534905 34913
Total PCBs Dioxin Dioxin
Yakima River Grandview 16430 4,4'-DDD
Yakima River Prosser 19598 4,4'-DDE Yakima River Prosser 19619 4,4'-DDT Yakima River Prosser 19705 Chlordane Yakima River Prosser 34887 Dioxin
Yakima River Benton City 8897 4,4'-DDT Yakima River Benton City 14252 4,4'-DDT Yakima River Benton City 19602 4,4'-DDE Yakima River Benton City 14256 4,4'-DDE Yakima River Benton City 8893 4,4'-DDE

Yakima Pesticides/PCBs TMDL: Vol 1, WQ Study Findings Page 194
Water Body Approximate
Location Listing
ID Parameter
Yakima River Benton City 14254 4,4'-DDD Yakima River Benton City 14258 Alpha-BHC Yakima River Benton City 7350 Total PCBs
Yakima River Horn Rapids 19622 4,4'-DDT Yakima River Horn Rapids 19601 4,4'-DDE Yakima River Horn Rapids 8861 4,4'-DDE Yakima River Horn Rapids 8902 Dieldrin Yakima River Horn Rapids 8864 Total PCBs Yakima River Horn Rapids 8863 Total PCBs
Yakima River Near mouth 19614 4,4'-DDT Yakima River Near mouth 19592 4,4'-DDE
*Water Resource Inventory Area.

Yakima Pesticides/PCBs TMDL: Vol 1, WQ Study Findings Page 195
Appendix B. Yakima Basin 303(d) Listings Based on Water Samples (2008 list)
Waterbody Listing
ID Parameter
Lower Yakima River (WRIA* 37)
Yakima River @ Union Gap 8876 DDT Yakima River @ Union Gap 8877 4,4'-DDE
Yakima River, Blue Slough Yakima River, Blue Slough Yakima River, Blue Slough Yakima River, Blue Slough Yakima River, Blue Slough
7377 7376 7378 7380 7383
4,4'-DDD 4,4’-DDE
Chlorpyrifos DDT
Endosulfan
Yakima River bw. Granger 8854 Dieldrin Yakima River bw. Granger 8873 DDT
Yakima River nr. Grandview 8889 4,4'-DDD Yakima River nr. Grandview 8891 4,4'-DDE
Yakima River bw. Spring Cr. 8896 DDT
Yakima River @ Kiona 8860 DDT Yakima River @ Kiona 8862 4,4'-DDD Yakima River @ Kiona 8865 Endosulfan Yakima River @ Kiona 8871 Dieldrin Yakima River @ Kiona 8890 4,4'-DDE
Yakima River bw. Kiona 12868 4,4’-DDE
Wide Hollow Creek 8849 4,4'-DDD Wide Hollow Creek 8848 4,4'-DDE Wide Hollow Creek 8855 DDT Wide Hollow Creek 8856 Dieldrin Wide Hollow Creek 8857 Endosulfan
Marion Drain 52838 Chlorpyrifos
Moxee (Birchfield) Drain 7373 DDT Moxee (Birchfield) Drain 7374 Dieldrin Moxee (Birchfield) Drain 7375 Endosulfan
Granger Drain 7362 4,4'-DDD Granger Drain 7361 4,4'-DDE Granger Drain 7360 DDT Granger Drain 7363 Dieldrin Granger Drain 7364 Endosulfan
Sulphur Creek Wasteway 8906 4,4'-DDD Sulphur Creek Wasteway 7385 4,4'-DDE Sulphur Creek Wasteway 8909 DDT

Yakima Pesticides/PCBs TMDL: Vol 1, WQ Study Findings Page 196
Waterbody Listing
ID Parameter
Sulphur Creek Wasteway 7384 DDT Sulphur Creek Wasteway 8911 Dieldrin Sulphur Creek Wasteway Sulphur Creek Wasteway
890852842
Endosulfan Chlorpyrifos
Snipes Creek 7369 4,4'-DDD Snipes Creek 7367 4,4'-DDD Snipes Creek 7370 4,4'-DDE Snipes Creek 7366 4,4'-DDE Snipes Creek 7365 DDT
Spring Creek 7355 4,4'-DDD Spring Creek 7357 4,4'-DDD Spring Creek 7354 4,4'-DDE Spring Creek 7358 4,4'-DDE Spring Creek Spring Creek
735352841
DDT Chlorpyrifos
*Water Resource Inventory Area.

Yakima Pesticides/PCBs TMDL: Vol 1, WQ Study Findings Page 197
Appendix C. Use Designations for WRIA 37- Lower Yakima River, WRIA 38-Naches River, and WRIA 39-Upper Yakima River (www.ecy.wa.gov/programs/wq/swqs/reference_files/table-602.pdf.)

Yakima Pesticides/PCBs TMDL: Vol 1, WQ Study Findings Page 198
This page is purposely left blank

TABLE 602 Aquatic Life Uses Recreation Uses
Water Supply Uses Misc. Uses
Use Designations for Fresh Waters by Water Resource Inventory Area (WRIA)
Cha
r Spa
wni
ng /R
earin
g C
ore
Sum
mer
Hab
itat
Spaw
ning
/Rea
ring
Rea
ring/
Mig
ratio
n O
nly
Red
band
Tro
ut
Indu
stria
l Wat
er
Agr
icul
tura
l Wat
er
Stoc
k W
ater
W
ildlif
e H
abita
t H
arve
stin
g C
omm
erce
/Nav
igat
ion
Boa
ting
Aes
thet
ics
War
m W
ater
Spe
cies
Ex
Prim
ary
Con
t
Dom
estic
Wat
er
Seco
ndar
y C
ont
Prim
ary
Con
t
1. Temperature shall not exceed a 1-DMax of 20.0°C due to human activities. When natural conditions exceed a 1-DMax of 20.0°C, no temperature increase will be allowed which will raise the receiving water temperature by greater than 0.3°C; nor shall such temperature increases, at any time, exceed t = 34/(T + 9). 2. The following two notes apply: (a) Below Clearwater River (river mile 139.3). Temperature shall not exceed a 1-DMax of 20.0°C due to human activities. When natural conditions exceed a 1-DMax of 20.0°C, no temperature increase will be allowed which will raise the receiving water temperature by greater than 0.3°C; nor shall such temperature increases, at any time, exceed t = 34/(T + 9). Special condition - special fish passage exemption as described in WAC 173-201A-200 (1) (f). (b) Above Clearwater River (river mile 139.3). Temperature shall not exceed a 1-DMax of 20.0°C due to human activities. When natural conditions exceed a 1-DMax of 20.0°C, no temperature increases will be allowed which will raise the receiving water temperature by greater than 0.3°C; nor shall such temperature increases, at any time, exceed 0.3°C due to any single source or 1.1°C due to all such activities combined. WRIA 36 Esquatzel Coulee
There are no specific waterbody entries for this WRIA WRIA 37 Lower Yakima
Ahtanum Creek North Fork's unnamed tributaries at latitude 46.5465 longitude -120.8857
Ahtanum Creek North Fork's unnamed tributaries at latitude 46.5395 longitude -120.9851
Ahtanum Creek, between junction with South Fork and junction of North and Middle Forks (including tributaries) except where designated Char.
Ahtanum Creek, North Fork, and Middle Fork Ahtanum Creek: All waters (including tributaries) above the junction.
Ahtanum Creek, South Fork, and all tributaries
Carpenter Gulch and all tributaries
Page 199

TABLE 602 Aquatic Life Uses Recreation Uses
Water Supply Uses Misc. Uses
Use Designations for Fresh Waters by Water Resource Inventory Area (WRIA)
Cha
r Spa
wni
ng /R
earin
g C
ore
Sum
mer
Hab
itat
Spaw
ning
/Rea
ring
Rea
ring/
Mig
ratio
n O
nly
Red
band
Tro
ut
War
m W
ater
Spe
cies
Ex
Prim
ary
Con
t
Dom
estic
Wat
er
Seco
ndar
y C
ont
Prim
ary
Con
t
Indu
stria
l Wat
er
Agr
icul
tura
l Wat
er
Stoc
k W
ater
W
ildlif
e H
abita
t H
arve
stin
g C
omm
erce
/Nav
igat
ion
Boa
ting
Aes
thet
ics
Foundation Creek and all tributaries
Nasty Creek and all tributaries
Sulphur Creek
Yakima River from mouth to Cle Elum River (river mile 185.6) except where specifically designated otherwise in Table 602.1
Notes for WRIA 37: 1. Temperature shall not exceed a 1-DMax of 21.0°C due to human activities. When natural conditions exceed a 1-DMax of 21.0°C, no temperature increase will be allowed which will raise the receiving water temperature by greater than 0.3°C; nor shall such temperature increases, at any time, exceed t = 34/(T + 9). WRIA 38 Naches
American River and all tributaries
Barton Creek and all tributaries
Bumping Lake's unnamed tributaries at latitude 46.8850 longitude -121.2779
Bumping River's unnamed tributaries at latitude 46.9317 longitude -121.2067(outlet of Flat Iron Lake).
Bumping River and tributaries downstream of the upper end of Bumping Lake (except where designated Char)
Bumping River (and tributaries) upstream of Bumping Lake.
Cedar Creek and all tributaries
Clear Creek and tributaries (including Clear Lake)
Crow Creek and all tributaries
Deep Creek and all tributaries
Page 200

TABLE 602 Aquatic Life Uses Recreation Uses
Water Supply Uses Misc. Uses
Use Designations for Fresh Waters by Water Resource Inventory Area (WRIA)
Cha
r Spa
wni
ng /R
earin
g C
ore
Sum
mer
Hab
itat
Spaw
ning
/Rea
ring
Rea
ring/
Mig
ratio
n O
nly
Red
band
Tro
ut
War
m W
ater
Spe
cies
Ex
Prim
ary
Con
t Pr
imar
y C
ont
Seco
ndar
y C
ont
Dom
estic
Wat
er
Indu
stria
l Wat
er
Agr
icul
tura
l Wat
er
Stoc
k W
ater
W
ildlif
e H
abita
t H
arve
stin
g C
omm
erce
/Nav
igat
ion
Boa
ting
Aes
thet
ics
Goat Creek and all tributaries
Granite Creek and all tributaries
Indian Creek and all tributaries
Little Naches River and Bear Creek: All waters (including tributaries) above the junction
Little Naches River, South Fork and all tributaries
Naches River and tributaries from latitude 46.7640 longitude -120.8286 (just upstream of Cougar Canyon) to Snoqualmie National Forest boundary (river mile 35.7) (except where designated Char).
Naches River from Snoqualmie National Forest boundary (river mile 35.7) to headwaters (except where designated Char).
Pileup Creek and all tributaries
Quartz Creek and all tributaries
Rattlesnake Creek: All waters above the junction with North Fork Rattlesnake Creek
Rattlesnake Creek, North Fork, all waters above latitude 46.8107 longitude 121.0694 (from and including the unnamed tributary just above junction with mainstem).
Sand Creek and all tributaries
Sunrise Creek (latitude 46.9042 longitude -121.2431) and all tributaries.
Tieton River and tributaries (except where otherwise designated).
Tieton River, North Fork (including tributaries) above the junction at Clear Lake
Page 201

TABLE 602 Aquatic Life Uses Recreation Uses
Water Supply Uses Misc. Uses
Use Designations for Fresh Waters by Water Resource Inventory Area (WRIA)
Cha
r Spa
wni
ng /R
earin
g C
ore
Sum
mer
Hab
itat
Spaw
ning
/Rea
ring
Rea
ring/
Mig
ratio
n O
nly
Red
band
Tro
ut
War
m W
ater
Spe
cies
Ex
Prim
ary
Con
t Pr
imar
y C
ont
Seco
ndar
y C
ont
Dom
estic
Wat
er
Indu
stria
l Wat
er
Agr
icul
tura
l Wat
er
Stoc
k W
ater
W
ildlif
e H
abita
t H
arve
stin
g C
omm
erce
/Nav
igat
ion
Boa
ting
Aes
thet
ics
Tieton River, South Fork, and all tributaries
WRIA 39 Upper Yakima
Cle Elum River from mouth to latitude 47.3805 longitude -121.0983 (above Little Salmon la Sac Creek)
Cle Elum River and all tributaries from junction with unnamed tributary at and latitude 47.3805 longitude -121.0983 to headwaters.
Indian Creek and tributaries downstream of Wenatchee National Forest boundary below
Indian Creek and tributaries in or above national forest boundary
Jack Creek and tributaries downstream of Wenatchee National Forest boundary below
Jack Creek and tributaries in or above national forest boundary
Little Kachess Lake (narrowest point dividing Kachess Lake from Little Kachess Lake) and all tributaries
Manastash Creek: All waters above the Junction of the North and South Forks that are downstream of the Wenatchee National Forest boundary.
Manastash Creek: All waters above the Junction of the North and South Forks that are in or above the Wenatchee National Forest.
Manastash Creek mainstem from mouth to junction of North and South Forks
Manastash Creek, tributaries to mainstem, between the mouth and the junction of North and South Forks
Swauk Creek mainstem from mouth to junction with First Creek
Page 202

TABLE 602 Aquatic Life Uses Recreation Uses
Water Supply Uses Misc. Uses
Use Designations for Fresh Waters by Water Resource Inventory Area (WRIA)
Cha
r Spa
wni
ng /R
earin
g C
ore
Sum
mer
Hab
itat
Spaw
ning
/Rea
ring
Rea
ring/
Mig
ratio
n O
nly
Red
band
Tro
ut
War
m W
ater
Spe
cies
Ex
Prim
ary
Con
t Pr
imar
y C
ont
Seco
ndar
y C
ont
Dom
estic
Wat
er
Indu
stria
l Wat
er
Agr
icul
tura
l Wat
er
Stoc
k W
ater
W
ildlif
e H
abita
t H
arve
stin
g C
omm
erce
/Nav
igat
ion
Boa
ting
Aes
thet
ics
Swauk Creek from junction with First Creek to Wenatchee National Forest (including tributaries)
Taneum Creek, tributaries to mainstem, from mouth to Wenatchee National Forest boundary
Taneum Creek mainstem from mouth to Wenatchee National Forest boundary
Teanaway River mainstem from mouth to West Fork Teanaway River
Teanaway River, tributaries to mainstem, from mouth to West Fork Teanaway River
Teanaway River, West Fork, and tributaries downstream of the Wenatchee National Forest
Teanaway River, West Fork, and tributaries upstream of the Wenatchee National Forest
Teanaway River, North Fork, and tributaries from junction with West Fork to Jungle Creek that are downstream of the Wenatchee National Forest boundary (except where designated otherwise).
Teanaway River, North Fork, and tributaries from junction with West Fork to Jungle Creek that are in or above the Wenatchee National Forest boundary (except where designated otherwise).
Teanaway River, North Fork, and all tributaries above and including Jungle Creek
Yakima River mainstem from mouth to Cle Elum River (river mile 185.6) except where specifically designated otherwise in Table 602.1
Yakima River and tributaries from Cle Elum River (river mile 185.6) to headwaters (except where designated otherwise).
Page 203

TABLE 602 Aquatic Life Uses Recreation Uses
Water Supply Uses Misc. Uses
Use Designations for Fresh Waters by Water Resource Inventory Area (WRIA)
Cha
r Spa
wni
ng /R
earin
g C
ore
Sum
mer
Hab
itat
Spaw
ning
/Rea
ring
Rea
ring/
Mig
ratio
n O
nly
Red
band
Tro
ut
War
m W
ater
Spe
cies
Ex
Prim
ary
Con
t Pr
imar
y C
ont
Seco
ndar
y C
ont
Dom
estic
Wat
er
Indu
stria
l Wat
er
Agr
icul
tura
l Wat
er
Stoc
k W
ater
W
ildlif
e H
abita
t H
arve
stin
g C
omm
erce
/Nav
igat
ion
Boa
ting
Aes
thet
ics
Yakima River and tributaries above the unnamed tributary (latitude 47.2927 longitude -121.2971) entering the Yakima River in Sect.25 T21NR12E.
Notes for WRIA 39: 1. Temperature shall not exceed a 1-DMax of 21.0°C due to human activities. When natural conditions exceed a 1-DMax of 21.0°C, no temperature increase will be allowed which will raise the receiving water temperature by greater than 0.3°C; nor shall such temperature increases, at any time, exceed t = 34/(T + 9). WRIA 40 Alkaki-Squilchuck
There are no specific waterbody entries for this WRIA WRIA 41 Lower Crab
Crab Creek and tributaries
WRIA 42 Grand Coulee
Crab Creek and tributaries
WRIA 43 Upper Crab-Wilson
Crab Creek and tributaries
WRIA 44 Moses Coulee
There are no specific waterbody entries for this WRIA WRIA 45 Wenatchee
Chiwaukum Creek from junction with Skinney Creek to headwaters (including tributaries)
Chiwawa River from mouth to Chickamin Creek (including tributaries)
Chiwawa River (and all tributaries) above and including Chickamin Creek
Page 204

Yakima Pesticides/PCBs TMDL: Vol 1, WQ Study Findings Page 205
Appendix D. 2006 Fish Tissue Data

Yakima Pesticides/PCBs TMDL: Vol 1, WQ Study Findings Page 206
Table D-1. Chlorinated Pesticide Concentrations in Yakima River Fish Fillet Samples, 2006 (ug/Kg, wet weight; parts per billion).
Reach Sample No. Species Lip
ids
(%)
Keechelus Lake 6394088 LSS 2.08 0.37 U 2.8 0.5 3.3 0.37 U 0.83 UJ 0.37 U 0.37 U 0.37 U 0.37 U 0.37 UJ 0.37 U 0.37 U 0.37 UJ 0.37 U 0.37 U 0.37 U 0.37 UKeechelus Lake 6394089 LSS 1.56 0.38 U 2.4 0.4 2.8 0.38 U 0.74 UJ 0.38 U 0.38 U 0.38 U 0.38 U 0.38 UJ 0.38 U 0.38 U 0.38 UJ 0.38 U 0.38 U 0.38 U 0.38 UKeechelus Lake 6394090 LSS 1.6 0.38 U 1.3 0.38 U 1.3 0.38 U 0.38 U 0.38 U 0.38 U 0.38 U 0.38 U 0.38 UJ 0.38 U 0.38 U 0.38 UJ 0.38 U 0.38 U 0.38 U 0.38 UKeechelus Lake 6394092 NPM 1.13 0.4 U 1.8 0.4 U 1.8 0.4 U 0.88 UJ 0.4 U 0.4 U 0.4 U 0.4 U 0.4 UJ 0.4 U 0.4 U 0.4 UJ 0.4 U 0.4 U 0.4 U 0.4 UKeechelus Lake 6394093 NPM 1.09 0.37 U 3.3 0.37 U 3.3 0.37 U 1.1 UJ 0.37 U 0.37 U 0.37 U 0.37 U 0.37 UJ 0.37 U 0.37 U 0.37 UJ 0.37 U 0.37 U 0.37 U 0.37 UKeechelus Lake 6394095 KOK 2.54 0.41 2.4 0.83 3.6 0.37 U 0.49 UJ 0.37 U 0.37 U 0.72 0.72 0.37 UJ 0.37 U 0.37 U 0.37 UJ 0.37 U 0.37 U 0.37 U 0.37 UKeechelus Lake 6394096 KOK 2.78 0.4 U 2 0.79 2.8 0.4 U 0.42 UJ 0.4 U 0.4 U 0.6 0.6 0.4 UJ 0.4 U 0.4 U 0.4 UJ 0.4 U 0.4 U 0.4 UJ 0.4 UJKeechelus Lake 6394097 KOK 3.33 0.47 2.1 0.87 3.4 0.39 U 0.5 UJ 0.39 U 0.39 U 0.78 0.78 0.39 UJ 0.39 U 0.39 U 0.39 UJ 0.39 U 0.39 U 0.39 U 0.39 UKeechelus Lake 6394099 CTT 1.86 0.39 U 0.77 0.28 J 1.1 J 0.39 U 0.23 J 0.39 U 0.39 U 0.39 U 0.23 J 0.39 U 0.39 U 0.39 U 0.39 UJ 0.39 U 0.39 U 0.39 U 0.39 UKeechelus Lake 6394100 CTT 1.36 0.39 U 0.61 0.39 U 0.6 0.39 U 0.39 U 0.39 U 0.39 U 0.39 U 0.39 U 0.39 U 0.39 U 0.39 U 0.39 UJ 0.39 U 0.39 U 0.39 U 0.39 UKeechelus Lake 6394101 CTT 1.09 0.39 U 0.44 0.39 U 0.4 0.39 U 0.39 U 0.39 U 0.39 U 0.39 U 0.39 U 0.39 U 0.39 U 0.39 U 0.39 UJ 0.39 U 0.39 U 0.39 U 0.39 UKeechelus Lake 6394103 MWF 2.55 0.39 U 0.59 0.39 U 0.6 0.39 U 0.39 U 0.39 U 0.39 U 0.39 U 0.39 U 0.39 UJ 0.39 U 0.39 U 0.39 UJ 0.39 U 0.39 U 0.39 U 0.39 UKeechelus Lake 6394104 MWF 2.96 0.39 U 0.87 0.39 U 0.9 0.39 U 0.39 U 0.39 U 0.39 U 0.39 U 0.39 U 0.39 UJ 0.39 U 0.39 U 0.39 UJ 0.39 U 0.39 U 0.39 U 0.39 U
Kachess Lake 6394080 LSS 0.69 0.4 U 0.76 0.4 U 0.76 0.4 U 0.4 U 0.4 U 0.4 U 0.4 U 0.4 U 0.4 U 0.4 U 0.4 U 0.4 UJ 0.4 U 0.4 U 0.4 U 0.4 UKachess Lake 6394081 LSS 0.48 0.4 U 0.87 0.4 U 0.87 0.4 U 0.4 U 0.4 U 0.4 U 0.4 U 0.4 U 0.4 U 0.4 U 0.4 U 0.4 UJ 0.4 U 0.4 U 0.4 U 0.4 UKachess Lake 6394082 LSS 0.55 0.39 U 0.86 0.39 U 0.86 0.39 U 0.39 U 0.39 U 0.39 U 0.39 U 0.39 U 0.39 UJ 0.39 U 0.39 U 0.39 UJ 0.39 U 0.39 U 0.39 UJ 0.39 UJKachess Lake 6394084 NPM 0.58 0.4 U 2.7 0.4 U 2.7 0.4 U 0.57 UJ 0.4 U 0.4 U 0.4 U 0.4 U 0.4 U 0.4 U 0.4 U 0.4 UJ 0.4 U 0.4 U 0.4 U 0.4 UKachess Lake 6394085 NPM 0.86 0.37 U 4.2 0.37 U 4.2 0.37 U 0.92 UJ 0.37 U 0.37 U 0.63 0.63 0.37 U 0.37 U 0.37 U 0.37 UJ 0.37 U 0.37 U 0.37 U 0.37 UKachess Lake 6394086 NPM 0.6 0.39 U 4.2 0.39 U 4.2 0.39 U 0.98 UJ 0.39 U 0.39 U 0.39 U 0.39 U 0.39 U 0.39 U 0.39 U 0.39 UJ 0.39 U 0.39 U 0.39 U 0.39 U
Cle Elum 6414068 MWF 4.24 0.27 J 6.6 0.8 8 J 0.39 U 0.56 0.39 U 0.39 U 0.37 J 0.93 J 0.39 UJ 0.39 U 0.39 U 0.39 UJ 0.39 U 0.39 U 0.39 UJ 0.39 UJCle Elum 6414069 MWF 5.09 0.54 5.7 3.1 9 0.32 J 0.96 0.21 J 0.39 U 1.6 3.09 J 0.39 UJ 0.39 U 0.39 U 0.39 UJ 0.39 U 0.39 U 0.39 UJ 0.39 UJCle Elum 6414070 MWF 4.42 0.49 18 2 20 0.21 J 0.74 0.4 U 0.4 U 1.1 2.05 J 0.4 UJ 0.4 U 0.4 U 0.4 UJ 0.4 U 0.4 U 0.29 J 0.4 UJCle Elum 6414072 BLS 4.03 0.45 9.1 1.4 11 0.38 U 0.38 0.38 U 0.38 U 0.28 0.66 0.38 UJ 0.38 U 0.38 U 0.38 UJ 0.38 U 0.38 UJ 0.38 UJ 0.38 UJCle Elum 6414073 BLS 2.8 0.3 J 5.1 0.77 6 J 0.39 U 0.28 J 0.39 U 0.39 U 0.29 J 0.57 J 0.39 U 0.39 U 0.39 U 0.39 UJ 0.39 U 0.39 U 0.39 U 0.39 U Cle Elum 6414074 BLS 2.51 0.81 9.4 1.2 11 0.4 U 0.4 U 0.4 U 0.4 U 0.4 U 0.4 U 0.4 UJ 0.4 U 0.4 U 0.4 U 0.4 U 0.4 UJ 0.4 UJ 0.4 UJCle Elum 6414076 NPM 1.98 0.71 12 0.39 U 13 0.39 U 0.41 UJ 0.39 U 0.39 U 0.57 0.57 0.39 UJ 0.39 U 0.39 U 0.39 U 0.39 U 0.39 UJ 0.24 J 0.39 UJCle Elum 6414077 NPM 1.73 0.43 12 0.38 U 12 0.38 U 0.38 U 0.38 U 0.38 U 0.53 0.53 0.38 UJ 0.38 U 0.38 U 0.38 U 0.38 U 0.38 UJ 0.29 J 0.38 UJCle Elum 6414078 NPM 1.27 0.62 8.8 0.39 U 9 0.39 U 0.39 U 0.39 U 0.39 U 0.61 0.61 0.39 UJ 0.39 U 0.39 U 0.39 U 0.39 U 0.39 UJ 0.12 J 0.39 UJ
Yakima Canyon 6414050 MWF 4.51 1.2 41 3.9 46 0.4 0.95 0.4 U 0.4 U 1.5 2.85 0.4 UJ 0.4 U 0.4 U 0.4 UJ 0.4 U 0.4 U 0.22 J 0.4 UJ
Yakima Canyon 6414051 MWF 5.43 0.7 23 2 26 0.39 U 0.84 0.39 U 0.39 U 0.87 1.71 0.39 UJ 0.39 U 0.39 U 0.39 UJ 0.39 U 0.39 U 0.24 J 0.39 UJYakima Canyon 6414052 MWF 4.67 1.1 40 3.7 45 0.53 1.1 0.22 J 0.21 J 2.1 4.16 0.4 J 0.4 U 0.4 U 0.4 UJ 0.4 U 0.4 U 0.51 0.4 U Yakima Canyon 6414057 NPM 2.87 1.4 45 1.4 48 0.27 J 1.5 0.4 U 0.4 U 1.7 3.47 J 0.4 U 0.4 U 0.4 U 0.4 UJ 0.4 U 0.4 U 0.49 0.4 UYakima Canyon 6414058 NPM 2.04 1.1 34 0.36 J 35 J 0.21 J 0.79 0.38 U 0.38 U 1.4 2.4 J 0.38 U 0.38 U 0.38 U 0.38 UJ 0.38 U 0.38 U 1.1 0.38 UYakima Canyon 6414059 NPM 1.76 0.56 15 0.2 J 16 J 0.39 U 0.53 0.39 U 0.39 U 0.9 1.43 0.39 U 0.39 U 0.39 U 0.39 UJ 0.39 U 0.39 U 0.72 0.39 UYakima Canyon 6414061 BLS 4.72 1.3 26 3.9 31 0.58 0.77 0.21 J 0.2 J 1.3 3.06 0.38 U 0.38 U 0.38 U 0.38 UJ 0.38 U 0.38 U 0.63 0.38 UYakima Canyon 6414062 BLS 2.16 0.52 5.1 0.97 7 0.37 U 0.37 U 0.37 U 0.37 U 0.37 U 0.37 U 0.37 U 0.37 U 0.37 U 0.37 UJ 0.37 U 0.37 U 0.86 0.37 UYakima Canyon 6414063 BLS 2.93 0.34 J 5.1 0.84 6 J 0.4 U 0.4 U 0.4 U 0.4 U 0.34 J 0.34 J 0.4 U 0.4 U 0.4 U 0.4 UJ 0.4 U 0.4 U 1.3 0.4 U
Wapato-Toppenish 6484230 LSS 3.33 3.8 55 4.9 64 0.39 U 0.43 UJ 0.39 U 0.39 U 0.53 0.53 1.6 U 0.39 U 0.39 U 0.39 U 0.39 U 0.39 U 0.99 J 1.6 UWapato-Toppenish 6484231 LSS 2.92 5.1 61 4 70 0.39 U 0.49 UJ 0.39 U 0.39 U 0.66 0.66 0.77 UJ 0.39 U 0.39 U 0.39 U 0.39 U 0.39 U 0.72 J 0.77 UWapato-Toppenish 6484232 LSS 3.25 8.2 71 4.9 84 0.4 U 0.51 UJ 0.4 U 0.4 U 0.61 0.61 1.6 U 0.4 U 0.4 U 0.4 U 0.4 U 0.4 U 1.5 J 1.6 UWapato-Toppenish 6484234 NPM 1.06 3 53 0.4 U 56 0.4 U 0.63 UJ 0.4 U 0.4 U 0.61 0.61 0.4 U 0.4 U 0.4 U 0.4 U 0.4 U 0.4 U 1 0.4 UWapato-Toppenish 6484235 NPM 1.1 4.2 130 0.48 135 0.4 U 0.4 U 0.4 U 0.4 U 0.42 0.42 0.4 U 0.4 U 0.4 U 0.4 U 0.4 U 0.4 U 0.6 0.4 UWapato-Toppenish 6484236 NPM 1.35 8.2 160 0.4 U 168 0.4 U 1.7 UJ 0.4 U 0.4 U 1.2 1.2 0.4 U 0.4 U 0.4 U 0.4 U 0.4 U 0.4 U 0.83 0.4 UWapato-Toppenish 6484238 MWF 3.15 8.5 110 7.9 126 0.71 1 UJ 0.39 U 0.39 U 1.9 2.61 1.6 U 0.39 U 0.39 U 0.39 U 0.39 U 0.39 U 1.5 J 1.6 UWapato-Toppenish 6484239 MWF 2.9 7.4 110 7.1 125 0.59 1.1 UJ 0.38 U 0.38 U 1.7 2.29 0.77 UJ 0.38 U 0.38 U 0.38 U 0.38 U 0.38 U 1.4 0.77 UWapato-Toppenish 6484240 MWF 3.02 5.6 80 6 92 0.4 U 0.79 UJ 0.4 U 0.4 U 1 1 1.6 U 0.4 U 0.4 U 0.4 U 0.4 U 0.4 U 1 J 1.6 U
4,4'
-DD
D
4,4'
-DD
E
4,4'
-DD
T
Tot
al
Chl
orda
ne
Met
hoxy
chlo
r
Alp
ha-B
HC
Tot
al D
DT
Cis
-Chl
orda
ne
Cis
-Non
achl
or
Ald
rin
Die
ldri
n
End
rin
Oxy
chlo
rdan
e
Bet
a-B
HC
Del
ta-B
HC
Tra
ns-
Chl
orda
ne
Tra
ns-
Non
achl
or
Gam
ma-
BH
C
(Lin
dane
)

Yakima Pesticides/PCBs TMDL: Vol 1, WQ Study Findings Page 207
Table D-1 continued.
Reach Sample No. Species Lip
ids
(%)
Prosser 6454105 CRP 4.31 25 380 3.4 408 1 4.1 0.27 J 0.4 2.7 8.47 J 0.39 UJ 0.39 U 0.39 U 0.39 U 0.39 U 0.39 U 0.39 UJ 0.39 UJProsser 6454106 CRP 7.14 38 750 7 795 1.7 7.8 0.55 0.75 5 15.8 0.39 UJ 0.39 U 0.39 U 0.39 U 0.39 U 0.39 U 0.74 J 0.39 UJProsser 6454107 CRP 3.71 21 360 2.6 384 1.2 6 0.31 J 0.58 3.7 11.8 J 0.39 UJ 0.39 U 0.39 U 0.39 U 0.39 U 0.39 U 0.65 J 0.39 UJProsser 6444234 SMB 0.62 2.5 32 0.93 35 0.39 U 0.39 U 0.39 U 0.39 U 0.39 U 0.39 U 0.39 U 0.39 U 0.39 U 0.39 U 0.39 U 0.39 UJ 1.4 0.39 UProsser 6444235 SMB 0.66 3.3 43 2.3 49 0.38 U 0.38 U 0.38 U 0.38 U 0.38 U 0.38 U 0.38 U 0.38 U 0.38 U 0.38 U 0.38 U 0.38 UJ 1.1 0.38 UProsser 6444236 SMB 0.3 3 17 0.46 20 0.4 U 0.4 U 0.4 U 0.4 U 0.4 U 0.4 U 0.4 U 0.4 U 0.4 U 0.4 U 0.4 U 0.4 UJ 0.46 0.4 UProsser 6444238 LSS 1.77 11 99 4.8 115 0.39 U 0.77 UJ 0.39 U 0.39 U 0.73 0.73 0.39 UJ 0.39 U 0.39 U 0.39 U 0.39 U 0.39 UJ 2.2 J 0.39 UJProsser 6444239 LSS 2.01 10 100 3.7 114 0.39 U 0.73 UJ 0.39 U 0.39 U 0.71 0.71 0.39 UJ 0.39 U 0.39 U 0.39 U 0.39 U 0.39 UJ 2 J 0.39 UJProsser 6444240 LSS 2.41 21 100 4.3 125 0.39 U 1.4 UJ 0.39 U 0.39 U 0.61 0.61 0.39 UJ 0.39 U 0.39 U 0.39 U 0.39 U 0.39 UJ 2.6 J 0.39 UJ
Horn Rapids 6444230 CRP 7.94 41 990 7 1038 1.6 11 UJ 0.64 0.4 U 5.8 8.04 1.6 UJ 0.4 U 0.4 U 0.4 U 0.4 U 0.4 UJ 1.6 J 1.6 UJHorn Rapids 6444231 CRP 9.17 25 500 4.3 529 1.1 7.2 UJ 0.57 0.39 U 3.9 5.57 1.6 UJ 0.39 U 0.39 U 0.39 U 0.39 U 0.39 UJ 1.3 J 1.6 UJHorn Rapids 6444232 CRP 5.83 17 380 4.2 J 401 J 0.39 U 3.9 UJ 0.39 U 0.39 U 1.9 1.9 0.79 UJ 0.39 U 0.39 U 0.39 U 0.39 U 0.39 UJ 0.8 J 0.79 UJHorn Rapids 6444242 NPM 1.08 5.2 65 0.38 U 70 0.38 U 0.96 UJ 0.38 U 0.38 U 0.73 0.73 0.38 UJ 0.38 U 0.38 U 0.38 U 0.38 U 0.38 UJ 1.4 J 0.38 UJHorn Rapids 6444243 NPM 1.41 4.8 60 0.39 U 65 0.39 U 0.89 UJ 0.39 U 0.39 U 0.51 0.51 0.39 UJ 0.39 U 0.39 U 0.39 U 0.39 U 0.39 UJ 1.9 J 0.39 UJHorn Rapids 6444244 NPM 1.3 6.7 110 0.41 117 0.4 U 0.58 UJ 0.4 U 0.4 U 0.45 0.45 0.4 UJ 0.4 U 0.4 U 0.4 U 0.4 U 0.4 UJ 4.7 J 0.4 UJHorn Rapids 6454108 SMB 1.37 3.8 78 1.3 83 0.39 U 0.66 0.39 U 0.39 U 0.46 1.12 0.39 UJ 0.39 U 0.39 U 0.54 0.39 U 0.39 U 0.62 J 0.39 UJHorn Rapids 6454109 SMB 1.01 3.3 59 0.89 63 0.38 U 0.57 0.38 U 0.38 U 0.62 1.19 0.38 UJ 0.38 U 0.38 U 0.38 0.38 U 0.38 U 1 J 0.38 UJHorn Rapids 6454110 SMB 0.95 1.9 37 1.1 40 0.39 U 0.36 J 0.39 U 0.39 U 0.31 J 0.67 J 0.39 UJ 0.39 U 0.39 U 0.48 0.39 U 0.39 U 0.76 J 0.39 UJHorn Rapids 6454111 LSS 2.79 5.3 57 2.4 65 0.22 J 0.62 0.4 U 0.4 U 0.54 1.38 J 0.4 UJ 0.4 U 0.4 U 0.4 U 0.4 U 0.4 U 0.74 J 0.4 UJHorn Rapids 6454112 LSS 4.65 6.2 79 3.1 88 0.3 J 0.87 0.2 J 0.4 U 0.76 2.13 J 0.4 UJ 0.4 U 0.4 U 0.4 J 0.4 J 0.4 J 0.92 J 0.4 UJHorn Rapids 6454113 LSS 3.56 7.7 110 5.8 124 0.39 U 1.2 0.39 U 0.39 U 0.8 2 0.39 UJ 0.39 U 0.39 U 0.53 0.39 U 0.39 U 1.2 J 0.39 UJ
(--) Not analyzed forU = The analyte was not detected at or above the reported result.J = The analyte was positively identified. The associated numerical result is an estimate.UJ = The analyte was not detected at or above the reported estimated result.NJ = There is evidence that the analyte is present. The associated numerical result is an estimate.
BLS = bridgelip sucker LSS = largescale suckerCRP = common carp MWF = mountain whitefishCTT = cutthroat trout NPM = northern pikeminnowKOK = kokanee SMB = smallmouth bass
Ald
rin
Die
ldri
n
End
rin
Oxy
chlo
rdan
e
Bet
a-B
HC
Del
ta-B
HC
Tra
ns-
Chl
orda
ne
Tra
ns-
Non
ach
lor
Gam
ma-
BH
C
(Lin
dan
e)
Tot
al
Chl
orda
ne
Met
hoxy
chlo
r
Alp
ha-B
HC
Tot
al D
DT
Cis
-Chl
orda
ne
Cis
-Non
achl
or
4,4'
-DD
D
4,4'
-DD
E
4,4'
-DD
T

Yakima Pesticides/PCBs TMDL: Vol 1, WQ Study Findings Page 208
Table D-1 continued.
Reach Sample No. Species
Keechelus Lake 6394088 LSS 0.37 U 0.37 U 0.37 U 0.37 U 0.37 U 0.37 U 0.37 U 0.37 UJ --Keechelus Lake 6394089 LSS 0.38 U 0.38 U 0.38 U 0.38 U 0.38 U 0.38 U 0.38 U 0.38 UJ --Keechelus Lake 6394090 LSS 0.38 U 0.38 U 0.38 U 0.38 U 0.38 U 0.38 U 0.38 U 0.38 UJ --Keechelus Lake 6394092 NPM 0.4 U 0.4 U 0.4 U 0.4 U 0.4 U 0.4 U 0.4 U 0.4 UJ --Keechelus Lake 6394093 NPM 0.37 U 0.37 U 0.37 U 0.37 U 0.37 U 0.37 U 0.37 U 0.37 UJ --Keechelus Lake 6394095 KOK 0.37 U 0.37 U 0.37 U 0.37 U 0.55 0.37 U 0.37 U 0.37 UJ --Keechelus Lake 6394096 KOK 0.4 UJ 0.4 UJ 0.4 U 0.4 UJ 0.5 0.4 UJ 0.4 UJ 0.4 UJ --Keechelus Lake 6394097 KOK 0.39 U 0.39 U 0.39 U 0.39 U 0.59 0.39 U 0.39 U 0.39 UJ --Keechelus Lake 6394099 CTT 0.39 U 0.39 U 0.39 U 0.39 U 0.39 U 0.39 U 0.39 U 0.39 U 2 UKeechelus Lake 6394100 CTT 0.39 U 0.39 U 0.39 U 0.39 U 0.39 U 0.39 U 0.39 U 0.39 U 2 UKeechelus Lake 6394101 CTT 0.39 U 0.39 U 0.39 U 0.39 U 0.39 U 0.39 U 0.39 U 0.39 U 2 UKeechelus Lake 6394103 MWF 0.39 U 0.39 U 0.39 U 0.39 U 0.39 U 0.39 U 0.39 U 0.39 UJ --Keechelus Lake 6394104 MWF 0.39 U 0.39 U 0.39 U 0.39 U 0.39 U 0.39 U 0.39 U 0.39 UJ --
Kachess Lake 6394080 LSS 0.4 U 0.4 U 0.4 U 0.4 U 0.4 U 0.4 U 0.4 U 0.4 UJ --Kachess Lake 6394081 LSS 0.4 U 0.4 U 0.4 U 0.4 U 0.4 U 0.4 U 0.4 U 0.4 UJ --Kachess Lake 6394082 LSS 0.39 UJ 0.39 U 0.39 U 0.39 U 0.39 U 0.39 UJ 0.39 UJ 0.39 UJ --Kachess Lake 6394084 NPM 0.4 U 0.4 U 0.4 U 0.4 U 0.4 U 0.4 U 0.4 U 0.4 UJ --Kachess Lake 6394085 NPM 0.37 U 0.37 U 0.37 U 0.37 U 0.37 U 0.37 U 0.37 U 0.37 UJ --Kachess Lake 6394086 NPM 0.39 U 0.39 U 0.39 U 0.39 U 0.39 U 0.39 U 0.39 U 0.39 UJ --
Cle Elum 6414068 MWF 0.39 UJ 0.39 UJ 0.39 U 0.39 UJ 0.25 J 0.39 UJ 0.39 UJ 0.39 UJ 1.9 UCle Elum 6414069 MWF 0.39 UJ 0.39 UJ 0.39 U 0.39 UJ 0.51 0.39 UJ 0.39 UJ 0.39 UJ 1.9 UCle Elum 6414070 MWF 0.4 UJ 0.4 UJ 0.4 U 0.4 UJ 0.45 0.4 UJ 0.4 UJ 0.4 UJ 2 UCle Elum 6414072 BLS 0.38 UJ 0.38 UJ 0.38 U 0.38 UJ 0.24 J 0.38 UJ 0.38 UJ 0.38 UJ 1.9 UJCle Elum 6414073 BLS 0.39 U 0.39 U 0.39 U 0.39 U 0.24 J 0.39 U 0.39 U 0.39 U 2 UCle Elum 6414074 BLS 0.4 UJ 0.4 UJ 0.4 U 0.4 UJ 0.4 U 0.4 UJ 0.4 UJ 0.4 UJ 4.9 UCle Elum 6414076 NPM 0.39 UJ 0.39 UJ 0.39 U 0.39 UJ 0.39 U 0.39 UJ 0.39 UJ 0.39 UJ 4.9 UCle Elum 6414077 NPM 0.38 UJ 0.38 UJ 0.38 U 0.38 UJ 0.38 U 0.38 UJ 0.38 UJ 0.38 UJ 0.38 UCle Elum 6414078 NPM 0.39 UJ 0.39 UJ 0.39 U 0.39 UJ 0.39 U 0.39 UJ 0.39 UJ 0.39 UJ 4.9 U
Yakima Canyon 6414050 MWF 0.4 UJ 0.4 UJ 0.4 U 0.4 UJ 0.26 J 0.4 UJ 0.4 UJ 0.4 UJ 2 U
Yakima Canyon 6414051 MWF 0.39 UJ 0.39 UJ 0.39 U 0.39 UJ 0.46 0.39 UJ 0.39 UJ 0.39 UJ 2 UYakima Canyon 6414052 MWF 0.4 UJ 0.4 UJ 0.4 U 0.4 U 0.53 0.4 U 0.4 U 0.4 U 2 UYakima Canyon 6414057 NPM 0.4 UJ 0.4 U 0.4 U 0.4 U 0.28 J 0.4 U 0.4 U 0.4 U 2 UYakima Canyon 6414058 NPM 0.38 UJ 0.38 U 0.38 U 0.38 U 0.23 J 0.38 U 0.38 U 0.38 U 1.9 UYakima Canyon 6414059 NPM 0.39 U 0.39 U 0.39 U 0.39 U 0.39 U 0.39 U 0.39 U 0.39 U 6.5 NJYakima Canyon 6414061 BLS 0.38 U 0.38 U 0.38 U 0.38 U 0.47 0.38 U 0.38 U 0.38 U 50 NJYakima Canyon 6414062 BLS 0.37 U 0.37 U 0.37 U 0.37 U 0.37 U 0.37 U 0.37 U 0.37 U 1.9 UYakima Canyon 6414063 BLS 0.4 U 0.4 U 0.4 U 0.4 U 0.21 J 0.4 U 0.4 U 0.4 U 2 U
Wapato-Toppenish 6484230 LSS 1.6 U 1.6 U 0.39 U 1.6 U 0.39 U 1.6 U 1.6 U 1.6 U 4.8 UWapato-Toppenish 6484231 LSS 0.77 UJ 0.77 UJ 0.39 U 0.77 U 0.39 U 0.77 U 0.77 U 0.77 UJ 0.39 UWapato-Toppenish 6484232 LSS 1.6 U 1.6 U 0.4 U 1.6 U 0.4 U 1.6 U 1.6 U 1.6 U 5 UWapato-Toppenish 6484234 NPM 0.4 U 0.4 U 0.4 U 0.4 U 0.4 U 0.4 U 0.4 U 0.4 U 5 UWapato-Toppenish 6484235 NPM 0.4 U 0.4 U 0.4 U 0.4 U 0.4 U 0.4 U 0.4 U 0.4 U 4.9 UWapato-Toppenish 6484236 NPM 0.4 U 0.4 U 0.4 U 0.4 U 0.4 U 0.4 U 0.4 U 0.4 U 10 JWapato-Toppenish 6484238 MWF 1.6 U 1.6 U 0.39 U 1.6 U 0.57 UJ 1.6 U 1.6 U 1.6 U 11 JWapato-Toppenish 6484239 MWF 0.77 UJ 0.77 UJ 0.38 U 0.77 U 0.57 UJ 1.6 0.77 U 0.77 UJ 10 JWapato-Toppenish 6484240 MWF 1.6 UJ 1.6 U 0.4 U 1.6 U 0.4 U 1.6 U 1.6 UJ 1.6 UJ 11 J
End
osu
lfan
I
End
osu
lfan
II
End
osu
lfan
Su
lfat
e
Tox
aphe
ne
End
rin
Ket
one
Hep
tach
lor
Hep
tach
lor
Epo
xide
Hex
achl
oro-
ben
zen
e
End
rin
Ald
ehyd
e

Yakima Pesticides/PCBs TMDL: Vol 1, WQ Study Findings Page 209
Table D-1 continued.
Reach Sample No. Species
Prosser 6454105 CRP 0.46 J 0.39 UJ 0.39 U 0.39 UJ 0.52 0.39 UJ 0.21 J 0.39 UJ 55 JProsser 6454106 CRP 0.35 J 0.39 UJ 0.39 U 0.39 UJ 1.3 0.39 UJ 0.22 J 0.53 J 63 JProsser 6454107 CRP 0.35 J 0.39 UJ 0.39 U 0.39 UJ 0.39 U 0.39 UJ 0.3 J 0.82 J 49 JProsser 6444234 SMB 0.39 U 0.39 U 0.39 U 0.39 U 0.39 U 0.39 U 0.39 U 0.39 U 4.9 UProsser 6444235 SMB 0.38 U 0.38 U 0.38 U 0.38 U 0.38 U 0.38 U 0.38 U 0.38 U 4.7 UProsser 6444236 SMB 0.4 U 0.4 U 0.4 U 0.4 U 0.4 U 0.4 U 0.4 U 0.4 U 4.9 UProsser 6444238 LSS 0.39 UJ 0.39 UJ 0.39 U 0.39 U 0.39 U 0.39 U 0.39 UJ 0.39 UJ 10 JProsser 6444239 LSS 0.39 UJ 0.39 UJ 0.39 U 0.39 U 0.39 U 0.39 U 0.39 UJ 0.39 UJ 4.9 UProsser 6444240 LSS 0.39 UJ 0.39 UJ 0.39 U 0.39 U 0.39 U 0.39 U 0.39 UJ 0.39 UJ 11 J
Horn Rapids 6444230 CRP 1.6 UJ 1.6 UJ 0.4 U 1.6 UJ 0.79 1.6 UJ 1.6 UJ 1.7 J 59 JHorn Rapids 6444231 CRP 1.6 UJ 1.6 UJ 0.39 U 1.6 UJ 0.91 1.6 UJ 1.6 UJ 2.1 J 25 JHorn Rapids 6444232 CRP 0.79 UJ 0.79 UJ 0.39 U 0.79 UJ 0.56 0.79 UJ 0.79 UJ 0.93 J 43 JHorn Rapids 6444242 NPM 0.38 UJ 0.38 UJ 0.38 U 0.38 U 0.38 U 0.38 U 0.38 UJ 0.38 UJ 10 JHorn Rapids 6444243 NPM 0.39 UJ 0.39 UJ 0.39 U 0.39 U 0.39 U 0.39 U 0.39 UJ 0.39 UJ 4.8 UHorn Rapids 6444244 NPM 0.4 UJ 0.4 UJ 0.4 U 0.4 U 0.4 U 0.4 U 0.4 UJ 0.4 UJ 14 JHorn Rapids 6454108 SMB 0.21 J 0.39 UJ 0.39 U 0.39 UJ 0.39 U 0.28 J 0.39 UJ 0.2 J 1.9 UHorn Rapids 6454109 SMB 0.37 J 0.38 UJ 0.38 U 0.38 UJ 0.38 U 0.38 UJ 0.38 UJ 0.38 UJ 1.9 UHorn Rapids 6454110 SMB 0.25 J 0.39 UJ 0.39 U 0.39 UJ 0.39 U 0.39 UJ 0.39 UJ 0.39 UJ 1.9 UHorn Rapids 6454111 LSS 0.33 J 0.4 UJ 0.4 U 0.4 UJ 0.23 J 0.4 UJ 0.4 UJ 0.4 UJ 9.1 JHorn Rapids 6454112 LSS 0.28 J 0.4 UJ 0.4 U 0.4 UJ 0.31 J 0.4 UJ 0.4 UJ 0.4 UJ 10 JHorn Rapids 6454113 LSS 0.3 J 0.39 UJ 0.39 U 0.39 UJ 0.24 J 0.33 J 0.39 UJ 0.39 UJ 12 J
(--) Not analyzed forU = The analyte was not detected at or above the reported result.J = The analyte was positively identified. The associated numerical result is an estimate.UJ = The analyte was not detected at or above the reported estimated result.NJ = There is evidence that the analyte is present. The associated numerical result is an estimate.
BLS = bridgelip sucker LSS = largescale suckerCRP = common carp MWF = mountain whitefishCTT = cutthroat trout NPM = northern pikeminnowKOK = kokanee SMB = smallmouth bass
End
rin
Ald
ehyd
e
End
osul
fan
I
End
osul
fan
II
End
osul
fan
Su
lfat
e
Tox
aph
ene
End
rin
Ket
one
Hep
tach
lor
Hep
tach
lor
Epo
xide
Hex
achl
oro-
benz
ene

Yakima Pesticides/PCBs TMDL: Vol 1, WQ Study Findings Page 210
Table D-2. PCBs Concentrations in Yakima River Fish Fillet Samples, 2006 (ug/Kg, wet weight, parts per billion).
Reach Sample No. Species Lip
ids
(%)
Keechelus Lake 6394088 LSS 2.08 1.9 U 1.9 U 1.9 U 1.9 U 1.9 U 7.4 J 9 J 7.5 UJ 1.9 U 16 JKeechelus Lake 6394089 LSS 1.56 1.9 U 1.9 U 1.9 U 1.9 U 1.9 U 8.1 J 7.8 J 6.6 UJ 1.9 U 16 JKeechelus Lake 6394090 LSS 1.6 1.9 U 1.9 U 1.9 U 1.9 U 1.9 U 3.6 J 4.4 J 3.8 UJ 1.9 U 8 JKeechelus Lake 6394092 NPM 1.13 2 U 2 U 2 U 2 U 2 U 6 J 8.9 J 7.9 UJ 2 U 15 JKeechelus Lake 6394093 NPM 1.09 1.9 U 1.9 U 1.9 U 1.9 U 1.9 U 8 J 11 J 9.3 UJ 1.9 U 19 JKeechelus Lake 6394095 KOK 2.54 1.9 U 1.9 U 1.9 U 1.9 U 1.9 U 11 J 4.6 J 5.6 UJ 1.9 U 16 JKeechelus Lake 6394096 KOK 2.78 2 U 2 U 2 U 2 U 2 U 9.2 J 3.7 J 4 UJ 2 U 13 JKeechelus Lake 6394097 KOK 3.33 2 U 2 U 2 U 2 U 4.9 UJ 12 J 5.8 J 3.9 UJ 2 U 18 JKeechelus Lake 6394099 CTT 1.86 2 U 2 U 2 U 2 U 2 U 5.8 2.3 -- 2 U 8Keechelus Lake 6394100 CTT 1.36 2 U 2 U 2 U 2 U 2 U 3.8 1.4 J -- 2 U 5 JKeechelus Lake 6394101 CTT 1.09 2 U 2 U 2 U 2 U 2 U 2.5 0.48 J -- 2 U 3 JKeechelus Lake 6394103 MWF 2.55 2 U 2 U 2 U 2 U 2 U 2 U 2 U 2.6 UJ 2 U 2 UKeechelus Lake 6394104 MWF 2.96 2 U 2 U 2 U 2 U 2 U 6.3 J 3.3 J 3.9 UJ 2 U 10 J
Kachess Lake 6394080 LSS 0.69 2 U 2 U 2 U 2 U 2 U 2 U 2 U 2 U 2 U 2 UKachess Lake 6394081 LSS 0.48 2 U 2 U 2 U 2 U 2 U 2 U 2 U 2 U 2 U 2 U
Kachess Lake 6394082 LSS 0.55 2 U 2 U 2 U 2 U 2 U 2 U 2 U 2 U 2 U 2 UKachess Lake 6394084 NPM 0.58 2 U 2 U 2 U 2 U 5 UJ 13 J 4.5 J 5 UJ 2 U 18 JKachess Lake 6394085 NPM 0.86 1.8 U 1.8 U 1.8 U 1.8 U 4.6 UJ 19 J 6.6 J 5.5 UJ 1.8 U 26 J
Kachess Lake 6394086 NPM 0.6 2 U 2 U 2 U 2 U 4.9 UJ 15 J 7.2 J 5.9 UJ 2 U 22 J
Cle Elum 6414068 MWF 4.24 1.9 U 1.9 U 1.9 U 1.9 U 1.9 U 12 1.9 U -- 1.9 U 12Cle Elum 6414069 MWF 5.09 1.9 U 1.9 U 1.9 U 1.9 U 1.9 U 19 7.8 -- 1.9 U 27Cle Elum 6414070 MWF 4.42 2 U 2 U 2 U 2 U 2 U 14 5.7 -- 2 U 20Cle Elum 6414072 BLS 4.03 1.9 U 1.9 U 1.9 U 1.9 U 1.9 U 7.6 3.6 -- 1.9 U 11Cle Elum 6414073 BLS 2.8 2 U 2 U 2 U 2 U 2 U 6.3 1.5 J -- 2 U 8 JCle Elum 6414074 BLS 2.51 2 U 2 U 2 U 2 U 2 U 2 U 2 U 2 U 2 U 2 UCle Elum 6414076 NPM 1.98 2 U 2 U 2 U 2 U 2 U 4.8 J 2 U 2 U 2 U 5 JCle Elum 6414077 NPM 1.73 1.9 U 1.9 U 1.9 U 1.9 U 1.9 U 4.6 J 1.9 U 1.9 U 1.9 U 5 JCle Elum 6414078 NPM 1.27 2 U 2 U 2 U 2 U 2 U 3.2 J 2.3 2 U 2 U 6 J
Yakima Canyon 6414050 MWF 4.51 2 U 2 U 2 U 2 U 2 U 17 7.1 -- 2 U 24Yakima Canyon 6414051 MWF 5.43 2 U 2 U 2 U 2 U 2 U 15 6 -- 2 U 21Yakima Canyon 6414052 MWF 4.67 2 U 2 U 2 U 2 U 2 U 20 8.7 -- 2 U 29Yakima Canyon 6414057 NPM 2.87 2 U 2 U 2 U 2 U 2 U 21 13 -- 2 U 34Yakima Canyon 6414058 NPM 2.04 1.9 U 1.9 U 1.9 U 1.9 U 1.9 U 16 7.1 -- 1.9 U 23Yakima Canyon 6414059 NPM 1.76 1.9 U 1.9 U 1.9 U 1.9 U 1.9 U 10 4.3 -- 1.2 J 16 JYakima Canyon 6414061 BLS 4.72 1.9 U 1.9 U 1.9 U 1.9 U 1.9 U 15.0 7.0 -- 1.9 U 22Yakima Canyon 6414062 BLS 2.16 1.9 U 1.9 U 1.9 U 1.9 U 1.9 U 2.4 1.9 U -- 1.9 U 2Yakima Canyon 6414063 BLS 2.93 2 U 2 U 2 U 2 U 2 U 3.8 2 U -- 2 U 4
Wapato-Toppenish 6484230 LSS 3.33 1.9 U 1.9 U 1.9 U 1.9 U 3.9 J 7 3.1 4.8 UJ 1.9 U 14 JWapato-Toppenish 6484231 LSS 2.92 1.9 U 1.9 U 1.9 U 1.9 U 3.9 J 7.9 4.1 4.8 UJ 1.9 U 16 JWapato-Toppenish 6484232 LSS 3.25 2 U 2 U 2 U 2 U 4.6 J 8 3.4 5 UJ 2 U 16 JWapato-Toppenish 6484234 NPM 1.06 2 U 2 U 2 U 2 U 2 U 6.9 5 5 UJ 2 U 12 JWapato-Toppenish 6484235 NPM 1.1 2 U 2 U 2 U 2 U 4.9 UJ 5.6 4.1 J 4.9 UJ 2 U 10 JWapato-Toppenish 6484236 NPM 1.35 2 U 2 U 2 U 2 U 3.6 J 12 J 12 J 5 UJ 2 U 28 JWapato-Toppenish 6484238 MWF 3.15 2 U 2 U 2 U 2 U 6.2 J 17 J 7.3 9.9 UJ 2 U 31 J
Tot
al P
CB
A
rocl
ors
Aro
clor
124
2
Aro
clor
124
8
Aro
clor
125
4
Aro
clor
126
2
Aro
clor
126
8
Aro
clor
101
6
Aro
clor
122
1
Aro
clor
123
2
Aro
clor
126
0

Yakima Pesticides/PCBs TMDL: Vol 1, WQ Study Findings Page 211
Table D-2 continued.
Reach Sample No. Species Lip
ids
(%)
Tot
al P
CB
A
rocl
ors
Aro
clor
124
2
Aro
clor
124
8
Aro
clor
125
4
Aro
clor
126
2
Aro
clor
126
8
Aro
clor
101
6
Aro
clor
122
1
Aro
clor
123
2
Aro
clor
126
0
Wapato-Toppenish 6484239 MWF 2.9 1.9 U 1.9 U 1.9 U 1.9 U 6.2 J 16 J 7.9 J 9.6 UJ 1.9 U 30 JWapato-Toppenish 6484240 MWF 3.02 2 U 2 U 2 U 2 U 5.3 J 11 J 5.2 J 5 UJ 2 U 22 J
Prosser 6454105 CRP 4.31 1.9 U 1.9 U 1.9 U 1.9 U 1.9 U 24 39 -- 1.9 U 63Prosser 6454106 CRP 7.14 2 U 2 U 2 U 2 U 2 U 48 61 -- 2 U 109Prosser 6454107 CRP 3.71 1.9 U 1.9 U 1.9 U 1.9 U 1.9 U 45 48 J -- 1.9 U 93 JProsser 6444234 SMB 0.62 2 U 2 U 2 U 2 U 2 U 3.6 J 2.6 2 U 2 U 6 JProsser 6444235 SMB 0.66 1.9 U 1.9 U 1.9 U 1.9 U 1.9 U 1.9 U 1.9 U 1.9 U 1.9 U 1.9 UProsser 6444236 SMB 0.3 2 U 2 U 2 U 2 U 2 U 2 U 2 U 2 U 2 U 2 UProsser 6444238 LSS 1.77 2 U 2 U 2 U 2 U 2 U 4.9 J 7.1 2 U 2 U 12 JProsser 6444239 LSS 2.01 2 U 2 U 2 U 2 U 2 U 11 J 7.2 9.8 UJ 2 U 18 JProsser 6444240 LSS 2.41 1.9 U 1.9 U 1.9 U 1.9 U 1.9 U 12 J 7.2 9.7 UJ 1.9 U 19 J
Horn Rapids 6444230 CRP 7.94 2 U 2 U 2 U 2 U 8.5 UJ 35 J 110 99 UJ 20 UJ 145 JHorn Rapids 6444231 CRP 9.17 1.9 U 1.9 U 1.9 U 1.9 U 7.2 UJ 25 J 68 J 58 UJ 1.9 UJ 93Horn Rapids 6444232 CRP 5.83 4.9 UJ 2 U 2 U 2 U 2 U 12 J 42 59 UJ 2 U 54 JHorn Rapids 6444242 NPM 1.08 1.9 U 1.9 U 1.9 U 1.9 U 1.9 U 5.7 J 6.9 9.6 UJ 1.9 U 13 JHorn Rapids 6444243 NPM 1.41 1.9 U 1.9 U 1.9 U 1.9 U 1.9 U 4.9 J 6 9.7 UJ 1.9 U 11 JHorn Rapids 6444244 NPM 1.3 2 U 2 U 2 U 2 U 2 U 3.5 J 3.9 2 U 2 U 7 JHorn Rapids 6454108 SMB 1.37 1.9 U 1.9 U 1.9 U 1.9 U 1.9 U 9.8 6.2 J -- 1.9 U 16 JHorn Rapids 6454109 SMB 1.01 1.9 U 1.9 U 1.9 U 1.9 U 1.9 U 6.9 3.5 J -- 1.9 U 10 JHorn Rapids 6454110 SMB 0.95 1.9 U 1.9 U 1.9 U 1.9 U 1.9 U 7.7 1.9 U -- 1.9 U 8Horn Rapids 6454111 LSS 2.79 2 U 2 U 2 U 2 U 2 U 7.4 4 J -- 2 U 11 JHorn Rapids 6454112 LSS 4.65 2 U 2 U 2 U 2 U 2 U 9.8 4.8 J -- 2 U 15 JHorn Rapids 6454113 LSS 3.56 1.9 U 1.9 U 1.9 U 1.9 U 1.9 U 11 9.5 J -- 1.9 U 21 J
(--) Not analyzed forU = The analyte was not detected at or above the reported result.J = The analyte was positively identified. The associated numerical result is an estimate.UJ = The analyte was not detected at or above the reported estimated result.
BLS = bridgelip sucker LSS = largescale suckerCRP = common carp MWF = mountain whitefishCTT = cutthroat trout NPM = northern pikeminnowKOK = kokanee SMB = smallmouth bass

Yakima Pesticides/PCBs TMDL: Vol 1, WQ Study Findings Page 212
Table D-3. Dioxin and Furan Concentrations in Yakima River Fish Fillet Samples, 2006 (ng/Kg, wet weight; parts per trillion).
Reach Sample No. Species Lip
ids
(%)
Keechelus Lake 394091 LSS 1.9 0.030 UJ 0.050 UJ 0.100 UJ 0.080 UJ 0.060 UJ 0.206 J 1.08 0.132 1.850 0.040 UJ 0.075 UJ 0.075 UJ 0.060 UJKeechelus Lake 394094 NPM 1.7 0.030 UJ 0.050 UJ 0.100 UJ 0.080 UJ 0.060 UJ 0.125 J 0.230 UJ 0.120 1.80 0.040 UJ 0.075 UJ 0.075 UJ 0.060 UJKeechelus Lake 394098 KOK 3.6 0.030 UJ 0.050 UJ 0.100 UJ 0.104 J 0.060 UJ 0.085 UJ 0.230 UJ 0.159 1.46 0.040 UJ 0.136 J 0.076 J 0.060 UJKeechelus Lake 394102 CTT 2.2 0.030 UJ 0.080 UJ 0.100 UJ 0.080 J 0.060 UJ 0.085 UJ 0.230 UJ 0.105 0.507 0.040 UJ 0.075 J 0.075 J 0.060 UJKeechelus Lake 394105 MWF 3.4 0.030 UJ 0.050 UJ 0.100 UJ 0.080 UJ 0.060 UJ 0.085 UJ 0.256 J 0.156 0.434 J 0.040 UJ 0.075 UJ 0.075 UJ 0.060 UJ
Kachess Lake 394083 LSS 1.8 0.030 UJ 0.050 UJ 0.100 UJ 0.080 UJ 0.060 UJ 0.085 UJ 0.230 UJ 0.039 J 0.234 J 0.040 UJ 0.075 UJ 0.075 UJ 0.060 UJKachess Lake 394087 NPM 1.4 0.030 UJ 0.050 UJ 0.100 UJ 0.080 UJ 0.060 UJ 0.249 J 0.230 UJ 0.088 J 1.00 0.040 UJ 0.239 J 0.075 UJ 0.060 UJ
Cle Elum 414071 MWF 5 0.030 UJ 0.050 UJ 0.100 UJ 0.124 J 0.060 UJ 0.197 J 0.230 UJ 0.329 0.682 0.040 UJ 0.075 UJ 0.075 UJ 0.060 UJCle Elum 414075 BLS 3.4 0.030 UJ 0.050 UJ 0.100 UJ 0.080 UJ 0.060 UJ 0.085 UJ 0.230 UJ 0.120 0.457 J 0.040 UJ 0.075 UJ 0.075 UJ 0.060 UJCle Elum 414079 NPM 2.9 0.030 UJ 0.050 UJ 0.100 UJ 0.080 UJ 0.060 UJ 0.189 J 0.290 J 0.144 0.509 0.040 UJ 0.075 UJ 0.075 UJ 0.060 UJ
Canyon 414056 MWF 6.4 0.146 0.050 UJ 0.100 UJ 0.080 UJ 0.060 UJ 0.190 J 0.230 UJ 0.364 0.700 0.040 UJ 0.075 UJ 0.075 UJ 0.060 UJCanyon 414060 NPM 2.8 0.030 UJ 0.050 UJ 0.100 UJ 0.080 UJ 0.060 UJ 0.085 UJ 0.230 UJ 0.156 0.787 0.040 UJ 0.075 UJ 0.075 UJ 0.060 UJCanyon 414067 BLS 4.2 0.03 UJ 0.05 UJ 0.100 UJ 0.08 UJ 0.060 UJ 0.085 UJ 0.23 UJ 0.036 J 0.226 J 0.040 UJ 0.075 UJ 0.075 UJ 0.060 UJ
Wapato-Toppenish 484233 LSS 4.7 0.03 UJ 0.05 UJ 0.10 UJ 0.08 UJ 0.06 UJ 0.085 UJ 0.23 UJ 0.27 0.05 UJ 0.042 UJ 0.304 0.075 UJ 0.295Wapato-Toppenish 484241 MWF 4.5 0.03 UJ 0.05 UJ 0.10 UJ 0.08 UJ 0.06 UJ 0.085 UJ 0.23 UJ 0.227 0.054 UJ 0.04 UJ 0.145 J 0.075 UJ 0.063 JWapato-Toppenish 484237 NPM 1.7 0.242 J 0.267 J 0.10 UJ 0.08 UJ 0.06 UJ 0.085 UJ 0.969 0.998 0.066 UJ 0.075 UJ 0.121 J 0.195 J 0.06 UJ
Prosser 454114 CRP 5.1 0.03 UJ 0.05 UJ 0.1 UJ 0.08 UJ 0.06 UJ 0.784 UJ 1.44 UJ 1.11 0.075 UJ 0.136 UJ 0.214 J 0.075 UJ 0.495Prosser 444241 LSS 3.1 0.031 J 0.05 UJ 0.1 UJ 0.08 UJ 0.06 UJ 0.142 J 0.728 0.625 0.05 UJ 0.04 UJ 0.075 UJ 0.075 UJ 0.144 JProsser 444237 SMB 1.5 0.03 UJ 0.05 UJ 0.10 UJ 0.08 UJ 0.06 UJ 0.085 UJ 1.24 0.251 0.05 UJ 0.171 UJ 0.366 0.075 UJ 0.153 J
Horn Rapids 444233 CRP 8.5 0.03 UJ 0.05 UJ 0.1 UJ 0.567 0.087 J 1.29 2.23 1.68 0.094 UJ 0.157 UJ 0.102 J 0.075 UJ 0.574Horn Rapids 454116 LSS 6.1 0.03 UJ 0.05 UJ 0.10 UJ 0.08 UJ 0.06 UJ 0.085 UJ 0.906 UJ 0.266 0.05 UJ 0.096 UJ 0.112 J 0.075 UJ 0.159 JHorn Rapids 444245 NPM 2.2 0.101 0.05 UJ 0.10 UJ 0.08 UJ 0.06 UJ 0.085 UJ 0.942 0.06 0.05 UJ 0.067 UJ 0.461 0.075 UJ 0.211 JHorn Rapids 454115 SMB 2.2 0.03 UJ 0.05 UJ 0.1 UJ 0.08 UJ 0.06 UJ 0.085 UJ 0.23 UJ 0.136 0.085 UJ 0.044 UJ 0.174 J 0.075 UJ 0.121 J
U = The analyte was not detected at or above the reported result. BLS = bridgelip sucker LSS = largescale suckerJ = The analyte was positively identified. The associated numerical result is an estimate. CRP = common carp MWF = mountain whitefishUJ = The analyte was not detected at or above the reported estimated result. CTT = cutthroat trout NPM = northern pikeminnow
KOK = kokanee SMB = smallmouth bassTEQ = 2,3,7,8-TCDD toxicity equivalent based on toxicity equivalency factors from Van den Berg et. al., 1998; Only detected chemicals were used in calculation.
1,2,
3,6,
7,8-
HxC
DD
1,2,
3,7,
8,9-
HxC
DD
1,2,
3,4,
6,7,
8-H
pC
DD
2,3,
7,8-
TC
DF
OC
DD
2,3,
4,6,
7,8-
HxC
DF
1,2,
3,6,
7,8-
HxC
DF
2,3,
7,8-
TC
DD
1,2,
3,7,
8-P
eCD
D
1,2,
3,4,
7,8-
HxC
DD
2,3,
4,7,
8-P
eCD
F
1,2,
3,7,
8-P
eCD
F
1,2,
3,4,
7,8-
HxC
DF

Yakima Pesticides/PCBs TMDL: Vol 1, WQ Study Findings Page 213
Table D-3 continued.
Reach Sample No. Species TEQ
Keechelus Lake 394091 LSS 0.060 UJ 0.070 UJ 0.085 UJ 0.309 J 0.358Keechelus Lake 394094 NPM 0.060 UJ 0.070 UJ 0.085 UJ 0.200 UJ 0.205Keechelus Lake 394098 KOK 0.060 UJ 0.070 UJ 0.085 UJ 0.200 UJ 0.194Keechelus Lake 394102 CTT 0.060 UJ 0.070 UJ 0.085 UJ 0.200 UJ 0.069Keechelus Lake 394105 MWF 0.060 UJ 0.070 UJ 0.085 UJ 0.200 UJ 0.083
Kachess Lake 394083 LSS 0.060 UJ 0.134 J 0.085 UJ 0.200 UJ 0.041Kachess Lake 394087 NPM 0.060 UJ 0.070 UJ 0.085 UJ 0.200 UJ 0.158
Cle Elum 414071 MWF 0.060 UJ 0.070 UJ 0.085 UJ 0.200 UJ 0.133Cle Elum 414075 BLS 0.060 UJ 0.070 UJ 0.085 UJ 0.200 UJ 0.058Cle Elum 414079 NPM 0.060 UJ 0.070 UJ 0.085 UJ 0.200 UJ 0.113
Canyon 414056 MWF 0.060 UJ 0.070 UJ 0.085 UJ 0.200 UJ 0.140Canyon 414060 NPM 0.060 UJ 0.070 UJ 0.085 UJ 0.200 UJ 0.095Canyon 414067 BLS 0.060 UJ 0.070 UJ 0.085 UJ 0.200 UJ 0.026
Wapato-Toppenish 484233 LSS 0.06 UJ 0.07 UJ 0.085 UJ 0.20 UJ 0.091Wapato-Toppenish 484241 MWF 0.06 UJ 0.07 UJ 0.085 UJ 0.20 UJ 0.049Wapato-Toppenish 484237 NPM 0.06 UJ 0.158 J 0.085 UJ 0.20 UJ 0.309
Prosser 454114 CRP 0.06 UJ 0.19 J 0.085 UJ 0.971 0.319Prosser 444241 LSS 0.06 UJ 0.07 UJ 0.085 UJ 0.2 UJ 0.167Prosser 444237 SMB 0.06 UJ 0.279 0.085 UJ 0.20 UJ 0.246
Horn Rapids 444233 CRP 0.06 UJ 0.252 J 0.085 UJ 0.476 J 0.751Horn Rapids 454116 LSS 0.06 UJ 0.07 UJ 0.085 UJ 0.581 0.121Horn Rapids 444245 NPM 0.06 UJ 0.085 J 0.085 UJ 0.20 UJ 0.19Horn Rapids 454115 SMB 0.06 UJ 0.07 UJ 0.085 UJ 0.2 UJ 0.056
U = The analyte was not detected at or above the reported result.J = The analyte was positively identified. The associated numerical result is an estimate.UJ = The analyte was not detected at or above the reported estimated result.
TEQ = 2,3,7,8-TCDD toxicity equivalent based on toxicity equivalency factors from Van den Berg et al., 1998; Only detected chemicals were used in calculation.
1,2,
3,4,
7,8,
9-H
pC
DF
OC
DF
1,2,
3,4,
6,7,
8-H
pC
DF
1,2,
3,7,
8,9-
HxC
DF

Yakima Pesticides/PCBs TMDL: Vol 1, WQ Study Findings Page 214
Table D-4. PBDE Concentrations in Yakima River Fish Fillets, 2006 (ug/Kg, wet weight, parts per billion).
Reach Sample No. Species Lip
ids
(%)
Keechelus Lake 6394088 LSS 2.08 5 0.2 U 0.2 U 0.2 U 0.2 U 0.8 0.4 U 0.13 J 0.36 J 0.4 U 0.4 U 0.4 U 0.99 UKeechelus Lake 6394093 NPM 1.09 1 0.13 J 0.2 U 0.2 U 0.2 U 0.57 0.39 U 0.39 U 0.28 J 0.39 U 0.39 U 0.39 U 0.98 UKeechelus Lake 6394099 CTT 1.86 1 0.2 U 0.2 U 0.2 U 0.4 0.18 J 0.4 U 0.13 J 0.14 J 0.4 U 0.4 U 0.4 U 0.99 UKeechelus Lake 6394103 MWF 2.55 1 0.2 U 0.2 U 0.2 U 0.9 0.31 0.4 U 0.16 J 0.16 J 0.4 U 0.4 U 0.4 U 0.99 U
Kachess Lake 6394080 LSS 0.69 5 0.19 U 0.19 U 0.19 U 0.19 U 0.19 U 0.39 U 0.39 U 0.19 U 0.39 U 0.39 U 0.39 U 0.97 UKachess Lake 6394084 NPM 0.58 1 0.16 J 0.19 U 0.19 U 0.19 U 0.33 0.39 U 0.12 J 0.2 J 0.39 U 0.39 U 0.39 U 0.96 U
Yakima Canyon 6414050 MWF 4.51 26 1.3 1 0.2 U 18 5.5 0.39 U 1.6 1.3 0.39 U 0.39 U 0.39 U 0.98 UYakima Canyon 6414057 NPM 2.87 17 0.71 0.2 U 0.2 U 0.2 U 3.6 0.39 U 0.22 J 1.2 0.39 U 0.39 U 0.39 U 0.99 UYakima Canyon 6414061 BLS 4.72 18 0.51 0.2 U 0.2 U 0.2 U 2.4 0.39 U 0.31 J 0.67 0.39 U 0.39 U 0.39 U 0.98 U
Wapato-Toppenish 6484230 LSS 3.33 33 0.58 0.2 U 0.2 U 0.2 J 4.2 0.4 U 0.85 1 0.4 U 0.4 U 0.4 U 1 UWapato-Toppenish 6484234 NPM 1.06 15 0.52 0.2 U 0.2 U 0.2 U 2.9 0.39 U 0.32 J 0.69 0.39 U 0.39 U 0.39 U 0.98 UWapato-Toppenish 6484238 MWF 3.15 94 2.7 2.6 0.19 U 61.6 19.1 0.38 U 5.5 3.3 0.38 U 0.38 U 0.38 U 3.3Wapato-Toppenish 6484239 MWF 2.9 95 2.5 3 0.2 U 68.3 20.6 0.4 U 6.8 4.2 0.4 U 0.4 U 0.4 U 1.3 U
U = The analyte was not detected at or above the reported result.J = The analyte was positively identified. The associated numerical result is an estimate.
BLS = bridgelip suckerCTT = cutthroat troutLSS = largescale suckerMWF = mountain whitefishNPM = northern pikeminnow
PB
DE
- 1
38
PB
DE
- 2
09
PB
DE
- 1
53
PB
DE
- 1
54
PB
DE
- 1
83
PB
DE
- 1
84
PB
DE
- 1
91
PB
DE
- 7
1
PB
DE
- 9
9
PB
DE
- 1
00
PB
DE
- 4
7
PB
DE
- 4
9
PB
DE
- 6
6

Yakima Pesticides/PCBs TMDL: Vol 1, WQ Study Findings Page 215
Appendix E. Pesticides Analyzed in Surface Water and in Effluents from Fruit Packers and Vegetable Processors during the 2007-08 Yakima River Water Quality Study 4,4'-DDE
4,4'-DDD
4,4'-DDT
Dieldrin
cis-Chlordane
trans-Chlordane
cis-Nonachlor
trans-Nonachlor
Oxychlordane
alpha-BHC
beta-BHC
gamma-BHC (Lindane)
delta-BHC
Chlorpyrifos
Endosulfan I
Endosulfan II
Endosulfan Sulfate
Toxaphene
Heptachlor
Heptachlor epoxide
Aldrin
Endrin
Endrin Ketone
Endrin Aldehyde
Methoxychlor
Hexachlorobenzene

Yakima Pesticides/PCBs TMDL: Vol 1, WQ Study Findings Page 216
This page is purposely left blank

Yakima Pesticides/PCBs TMDL: Vol 1, WQ Study Findings Page 217
Appendix F. Deployment Dates and PRC Recovery for SPMDs Table F-1. Deployment Dates and PRC Concentrations for May-June 2007 SPMDs. [Each sample consisted of five standard SPMD membranes. Each membrane was 4.50 grams/0.00495 L.]
Sample Number (723- )
Site Start End
Deploy Time
Final PRC Concentrations
(1,000 ng/sample starting )
Date Time Date Time (days) PCB-4 PCB-29
4180 EASTON 5/8/07 8:00 6/5/07 8:00 28.0 228 496
4182 TOWNE DIV 5/8/07 9:30 6/5/07 9:00 28.0 272 839
4183 WILSON CR* 5/7/08 12:50 6/6/08 8:20 31.8 80 338
4184 ROZA DAM 5/8/07 11:45 6/5/07 10:45 27.9 280 820
4185 NACHES R 5/8/07 13:10 6/11/07 11:20 31.9 170 578
4186 MOXEE 5/8/07 14:20 6/5/07 11:55 27.9 108 517
4187 SUNNYSIDE 5/9/07 8:35 6/5/07 12:30 27.2 116 574
4188 GRANGER 5/9/07 9:35 6/5/07 13:15 27.2 114 534
4189 SULPHUR 5/9/07 10:45 6/5/07 13:50 27.1 149 608 4190 SULPHUR REP 5/9/07 10:45 6/5/07 13:50 27.1 114 736
4192 PROSSER 5/9/07 13:35 6/6/07 9:40 27.8 113 466 4193 PROSSER REP 5/9/07 13:35 6/6/07 9:40 27.8 177 619
4194 SPRING CR 5/9/07 12:10 6/5/07 15:25 27.1 161 584
4195 HORN RAPIDS 5/8/07 16:55 6/5/07 16:00 28.3 101 488
4181 FIELD BLNK (Easton) - - - - - - - - - - 4191 FIELD BLNK (Sulphur) - - - - - - - - - -
*Original sample from 2007 lost in laboratory accident; re-deployed in 2008.

Yakima Pesticides/PCBs TMDL: Vol 1, WQ Study Findings Page 218
Table F-2. Deployment Dates and PRC Concentrations for October-November 2007 SPMDs. [Each sample consisted of five standard SPMD membranes. Each membrane was 4.50 grams/0.00495 L.]
Sample Number (748- )
Site Start End
Deploy Time
Final PRC Concentrations
(1,000 ng/sample starting )
Date Time Date Time (days) PCB-4 PCB-29
4250 EASTON 10/30/07 7:55 11/26/07 8:15 27.0 355 603
4252 TOWNE DIV 10/30/07 9:20 11/26/07 9:30 27.0 356 644
4253 WILSON CR 10/30/07 10:30 11/26/07 10:30 27.0 277 560
4254 ROZA DAM 10/30/07 11:45 11/26/07 11:20 26.0 264 627
4255 NACHES R 10/30/07 13:15 11/26/07 12:25 26.0 328 665
4256 MOXEE 10/30/07 14:45 11/26/07 13:25 26.9 252 648
4257 SUNNYSIDE 10/30/07 14:00 11/26/07 14:10 27.0 198 518
4258 GRANGER 10/30/07 15:35 11/26/07 15:00 26.0 187 560
4259 SULPHUR 10/30/07 16:29 11/26/07 15:45 25.0 135 406
4261 PROSSER 10/31/07 8:30 11/27/07 8:35 27.0 225 431 4262 PROSSER REP 10/31/07 8:30 11/27/07 8:35 27.0 196 255
4263 SPRING CR 10/31/07 11:10 11/26/07 9:15 25.9 381 673
4264 HORN RAPIDS 10/31/07 10:00 11/27/07 10:25 27.0 193 443
4251 FIELD BLNK (Easton) - - - - - - - - - - - - - - 4260 FIELD BLNK (Sulphur) - - - - - - - - - - - - - -

Yakima Pesticides/PCBs TMDL: Vol 1, WQ Study Findings Page 219
Appendix G. Ancillary Water Quality Data for SPMD Deployments

Yakima Pesticides/PCBs TMDL: Vol 1, WQ Study Findings Page 220
Table G-1. Ancillary Water Quality Data for Spring 2007 SPMD Deployments
Sample No. Field ID
Collection Date Parameter Result Units
7194080 EASTON 5/8/2007 Conductivity 49.3 umhos/cm 7194080 EASTON 5/8/2007 Dissolved Organic Carbon 1 U mg/L 7194080 EASTON 5/8/2007 Total Organic Carbon 1 U mg/L 7194080 EASTON 5/8/2007 Total Suspended Solids 2 mg/L 7194080 EASTON 5/8/2007 Turbidity 1.6 NTU 7214095 EASTON 5/22/2007 Conductivity 46 umhos/cm 7214095 EASTON 5/22/2007 Dissolved Organic Carbon 1 U mg/L 7214095 EASTON 5/22/2007 Total Suspended Solids 1 mg/L 7214095 EASTON 5/22/2007 Turbidity 1.3 NTU 7234210 EASTON 6/5/2007 Conductivity 45 umhos/cm 7234210 EASTON 6/5/2007 Dissolved Organic Carbon 1 U mg/L 7234210 EASTON 6/5/2007 Total Non-Volatile Suspended Solids 1 U mg/L 7234210 EASTON 6/5/2007 Total Organic Carbon 1 U mg/L 7234210 EASTON 6/5/2007 Total Suspended Solids 1 U mg/L 7234210 EASTON 6/5/2007 Turbidity 1.1 NTU 7194081 TOWNE DIV 5/8/2007 Conductivity 80.4 umhos/cm 7194081 TOWNE DIV 5/8/2007 Dissolved Organic Carbon 1.5 mg/L 7194081 TOWNE DIV 5/8/2007 Total Organic Carbon 1.1 mg/L 7194081 TOWNE DIV 5/8/2007 Total Suspended Solids 10 mg/L 7194081 TOWNE DIV 5/8/2007 Turbidity 4.1 NTU 7234211 TOWNE DIV 6/5/2007 Conductivity 58 umhos/cm 7234211 TOWNE DIV 6/5/2007 Dissolved Organic Carbon 1 U mg/L 7234211 TOWNE DIV 6/5/2007 Total Non-Volatile Suspended Solids 23 mg/L 7234211 TOWNE DIV 6/5/2007 Total Organic Carbon 1.2 mg/L 7234211 TOWNE DIV 6/5/2007 Total Suspended Solids 27 mg/L 7234211 TOWNE DIV 6/5/2007 Turbidity 12 NTU 7194082 WILSON CR 5/8/2007 Conductivity 232 umhos/cm 7194082 WILSON CR 5/8/2007 Dissolved Organic Carbon 3.8 mg/L 7194082 WILSON CR 5/8/2007 Total Organic Carbon 4 mg/L 7194082 WILSON CR 5/8/2007 Total Suspended Solids 50 mg/L 7194082 WILSON CR 5/8/2007 Turbidity 20 NTU 7234212 WILSON CR 6/5/2007 Conductivity 253 umhos/cm 7234212 WILSON CR 6/5/2007 Dissolved Organic Carbon 3.8 mg/L 7234212 WILSON CR 6/5/2007 Total Non-Volatile Suspended Solids 46 mg/L 7234212 WILSON CR 6/5/2007 Total Organic Carbon 4.5 mg/L 7234212 WILSON CR 6/5/2007 Total Suspended Solids 54 mg/L 7234212 WILSON CR 6/5/2007 Turbidity 18 NTU 7194083 ROZA DAM 5/8/2007 Conductivity 118 umhos/cm 7194083 ROZA DAM 5/8/2007 Dissolved Organic Carbon 1.8 mg/L 7194083 ROZA DAM 5/8/2007 Total Organic Carbon 1.9 mg/L 7194083 ROZA DAM 5/8/2007 Total Suspended Solids 4 mg/L 7194083 ROZA DAM 5/8/2007 Turbidity 3.4 NTU 7214098 ROZA DAM 5/22/2007 Conductivity 97 umhos/cm 7214098 ROZA DAM 5/22/2007 Dissolved Organic Carbon 1.6 mg/L 7214098 ROZA DAM 5/22/2007 Total Organic Carbon 1.9 mg/L 7214098 ROZA DAM 5/22/2007 Total Suspended Solids 13 mg/L

Yakima Pesticides/PCBs TMDL: Vol 1, WQ Study Findings Page 221
Sample No. Field ID
Collection Date Parameter Result Units
7214098 ROZA DAM 5/22/2007 Turbidity 6.6 NTU 7234213 ROZA DAM 6/5/2007 Conductivity 78 umhos/cm 7234213 ROZA DAM 6/5/2007 Dissolved Organic Carbon 1.2 mg/L 7234213 ROZA DAM 6/5/2007 Total Non-Volatile Suspended Solids 20 mg/L 7234213 ROZA DAM 6/5/2007 Total Organic Carbon 1.5 mg/L 7234213 ROZA DAM 6/5/2007 Total Suspended Solids 23 mg/L 7234213 ROZA DAM 6/5/2007 Turbidity 14 NTU 7194084 NACHES R. 5/8/2007 Dissolved Organic Carbon 1.3 mg/L 7194084 NACHES R. 5/8/2007 Total Organic Carbon 1.7 mg/L 7234214 NACHES R. 6/5/2007 Dissolved Organic Carbon 1.2 mg/L 7234214 NACHES R. 6/5/2007 Total Organic Carbon 2 mg/L 7194085 MOXEE 5/8/2007 Dissolved Organic Carbon 2.4 mg/L 7194085 MOXEE 5/8/2007 Total Organic Carbon 2.5 mg/L 7234215 MOXEE 6/5/2007 Dissolved Organic Carbon 1.8 mg/L 7234215 MOXEE 6/5/2007 Total Organic Carbon 2.1 mg/L 7194086 SUNNYSIDE 5/9/2007 Dissolved Organic Carbon 1.6 mg/L 7194086 SUNNYSIDE 5/9/2007 Total Organic Carbon 2.1 mg/L 7214104 SUNNYSIDE 5/22/2007 Dissolved Organic Carbon 1.7 mg/L 7214104 SUNNYSIDE 5/22/2007 Total Organic Carbon 1.8 mg/L 7234216 SUNNYSIDE 6/5/2007 Dissolved Organic Carbon 1.2 mg/L 7234216 SUNNYSIDE 6/5/2007 Total Organic Carbon 1.8 mg/L 7194087 GRANGER 5/9/2007 Dissolved Organic Carbon 2.7 mg/L 7194087 GRANGER 5/9/2007 Total Organic Carbon 3.5 mg/L 7234217 GRANGER 6/5/2007 Dissolved Organic Carbon 4.2 mg/L 7234217 GRANGER 6/5/2007 Total Organic Carbon 4.9 mg/L 7194088 SULPHUR 5/9/2007 Dissolved Organic Carbon 2 mg/L 7194088 SULPHUR 5/9/2007 Total Organic Carbon 2.9 mg/L 7234218 SULPHUR 6/5/2007 Dissolved Organic Carbon 2.3 mg/L 7234218 SULPHUR 6/5/2007 Total Organic Carbon 2.9 mg/L 7194093 SULPHUR-REP 5/9/2007 Dissolved Organic Carbon 2.4 mg/L 7194093 SULPHUR-REP 5/9/2007 Total Organic Carbon 2.5 mg/L 7194089 PROSS DM 5/9/2007 Dissolved Organic Carbon 1.8 mg/L 7194089 PROSS DM 5/9/2007 Total Organic Carbon 2.6 mg/L 7194090 PROSSER-REP 5/9/2007 Total Organic Carbon 2.6 mg/L 7224102 PROSS DM 5/30/2007 Dissolved Organic Carbon 1.4 mg/L 7224102 PROSS DM 5/30/2007 Total Organic Carbon 1.6 mg/L 7234219 PROSS DM 6/5/2007 Dissolved Organic Carbon 1.5 mg/L 7234219 PROSS DM 6/5/2007 Total Organic Carbon 1.9 mg/L 7194091 SPRING CR 5/9/2007 Dissolved Organic Carbon 2.8 mg/L 7194091 SPRING CR 5/9/2007 Total Organic Carbon 3.3 mg/L 7234220 SPRING CR 6/5/2007 Dissolved Organic Carbon 2.3 mg/L 7234220 SPRING CR 6/5/2007 Total Organic Carbon 2.9 mg/L 7194092 HORNRAPID 5/8/2007 Dissolved Organic Carbon 1.9 mg/L 7194092 HORNRAPID 5/8/2007 Total Organic Carbon 2.4 mg/L 7234221 HORNRAPID 6/5/2007 Dissolved Organic Carbon 1.5 mg/L 7234221 HORNRAPID 6/5/2007 Total Organic Carbon 2.1 mg/L
U = not detected

Yakima Pesticides/PCBs TMDL: Vol 1, WQ Study Findings Page 222
Table G-2. Ancillary Water Quality Data for Fall 2007 SPMD Deployments.
Sample No.
Field ID
Collection Date
Total Organic Carbon (mg/L)
Dissolved Organic Carbon (mg/L)
Total Suspended
Solids (mg/L)
Turbidity (NTU)
Conductivity (umhos/cm)
7444205 EASTON 10/30/2007 1.0 U 1.0 U 2.0 2.1 60.5 7484230 EASTON 11/26/2007 1.0 U 1.0 U 2 1.3 59.4 7444206 TOWNE DIV 10/30/2007 1.0 U 1.0 U 1 0.5 82 7474205 TOWNE DIV 11/16/2007 1.0 U 1.0 U 1 U na na 7484231 TOWNE DIV 11/26/2007 1.0 U 1.0 U 2 0.7 83.1 7444207 WILSON CR 10/30/2007 2.1 1.8 21 3.4 369 7474206 WILSON 11/16/2007 2.0 U 1.7 8 na na 7484232 WILSON 11/26/2007 1.6 1.8 10 3.5 387 7444208 ROZA DAM 10/30/2007 1.4 2.0 U 30 11 152 7444209 ROZA-REP 10/30/2007 1.5 1.1 29 9.8 151 7484233 ROZA DAM 11/26/2007 1.0 U 1.0 U 5 1.4 142 7444210 NACHES R. 10/30/2007 1.5 1.0 U 7474208 NACHES R. 11/16/2007 1.0 U 1.0 U 7484235 NACHES R. 11/26/2007 1.0 U 1.0 U 7444211 MOXEE 10/30/2007 2.8 2.4 7474207 MOXEE 11/16/2007 2.6 J 2.4 7484236 MOXEE 11/26/2007 2.8 2.5 7444212 SUNNYSIDE 10/30/2007 1.5 1 7474214 SUNNYSIDE 11/16/2007 1.1 1.1 7484237 SUNNYSIDE 11/26/2007 1.1 1.0 U 7444213 GRANGER 10/30/2007 3.1 2.5 7474209 GRANGER 11/16/2007 2.1 1.9 7484238 GRANGER 11/26/2007 2.8 2.5 7444214 SULPHUR 10/31/2007 2.8 2.3 7474211 SULPHUR 11/16/2007 2.4 J 2.2 7484239 SULPHUR 11/26/2007 2.7 2.4 7444215 PROSSER DM 10/31/2007 1.4 1.1 7444216 PROSSER-REP 10/31/2007 1.4 1.1 7474212 PROSSER DM 11/16/2007 1.3 1.1 7484240 PROSSER DM 11/27/2007 1.3 1.2 7484241 PROSSER-REP 11/27/2007 1.2 1.1 7444217 SPRING CR. 10/31/2007 2.3 1.8 7474210 SPRING CR. 11/16/2007 2.3 2.0 7484242 SPRING CR. 11/27/2007 2.1 2.2 7444218 HORN RAPIDS 10/31/2007 1.5 1.2 7474213 HORN RAPIDS 11/16/2007 1.3 1.1 7484243 HORN RAPIDS 11/26/2007 1.2 1.3
U = not detected J = estimated na = not analyzed

Yakima Pesticides/PCBs TMDL: Vol 1, WQ Study Findings Page 223
Appendix H. SPMD Calculations The loss rates of Performance Reference Compounds (PRCs) are used to calibrate SPMDs for the effects of water velocity, temperature, and biofouling (Huckins et al., 2006). Each of the SPMD membranes used in the present study was spiked with the PRCs PCB-4 and PCB-29 prior to their being deployed in the field. PCB-4 and -29 are not present in significant amounts in the environment. Water column concentrations of PCBs and toxaphene were calculated from the residues accumulated in the SPMD and PRC loss rates using the SPMD Water Concentration Calculator Excel spreadsheet version 5-1 developed by USGS (http://137.227.231.90/Research/spmd.htm). The PRC recovery data are in Appendix F. SPMDs only take up the dissolved form of a chemical. Total PCB and toxaphene concentrations were estimated from the dissolved residues using the equation Cw-tot = Cw (1 + TOC (Koc/Mw)) where Cw is the dissolved concentration, Koc is the organic carbon-water equilibrium partition coefficient, and Mw is the mass of water (Meadows et al., 1998). Koc was calculated from the Kow values used to determine the dissolved concentrations in the SPMD Water Concentration Calculator spreadsheet and Karickhoff’s (1981) approximation Koc = 0.411Kow.

Yakima Pesticides/PCBs TMDL: Vol 1, WQ Study Findings Page 224
Appendix I. Pesticides Analyzed in Wastewater Treatment Plant Effluents and Urban Stormwater Runoff during the 2007-08 Yakima River Water Quality Study Pesticides
4,4'-DDE
4,4'-DDD
4,4'-DDT
Dieldrin
Chlordane (technical)
alpha-BHC
beta-BHC
gamma-BHC (Lindane)
delta-BHC
Chlorpyrifos
Endosulfan I
Endosulfan II
Endosulfan Sulfate
Toxaphene
Heptachlor
Heptachlor epoxide
Aldrin
Endrin
Endrin Ketone
Endrin Aldehyde
Methoxychlor Hexachlorobenzene
Polychlorinated Biphenyls
209 individual PCB congeners (see Method 1668A - http://synetics.net/resources)

Yakima Pesticides/PCBs TMDL: Vol 1, WQ Study Findings Page 225
Appendix J. Routine Monitoring Data for Surface Water, 2007-08
Collection Flow Sample No. Field ID Date (cfs) (ng/L) (ng/L) (ng/L)
7144080 CHERRY 4/4/2007 198 0.063 U 0.081 0.063 U7144081 WIPPLE 4/4/2007 23 0.065 U 0.08 0.065 U7144082 HARRISON 4/4/2007 2,074 0.066 U 0.066 U 0.066 U7144085 PARKER 4/4/2007 5,368 0.065 U 0.15 0.065 U7144088 EUCLID 4/5/2007 6,452 0.067 0.34 0.087144090 KIONA 4/5/2007 6,331 0.096 0.4 0.17144083 NACHES 4/4/2007 3,188 0.089 0.23 0.064 U7144084 MOXEE 4/4/2007 69 0.43 0.79 0.467144086 GRANGER 4/5/2007 24 0.17 1.9 0.367144091 GRANGER REP 4/5/2007 - - 0.17 1.9 0.367144087 SULFUR 4/5/2007 182 0.15 1 0.237144089 SPRING 4/5/2007 54 2.9 2 0.737144092 TRNSFR BLNK 4/5/2007 - - 0.063 U 0.063 U 0.063 U
7164080 CHERRY 4/18/2007 156 0.1 0.13 0.062 U7164081 WIPPLE 4/18/2007 45 0.077 0.32 0.0667164082 HARRISON 4/18/2007 880 0.063 U 0.063 U 0.063 U7164085 PARKER 4/18/2007 3,217 0.063 U 0.17 0.063 U7164088 EUCLID 4/19/2007 4,044 0.063 U 0.2 0.063 U7164090 KIONA 4/19/2007 4,257 0.064 U 0.26 0.0747164083 NACHES 4/18/2007 2,868 0.12 0.28 0.063 U7164084 MOXEE 4/18/2007 52 0.2 0.79 0.167164086 GRANGER 4/19/2007 25 0.25 2.1 0.357164087 SULFUR 4/19/2007 131 0.16 1.2 0.237164089 SPRING 4/19/2007 28 0.16 0.48 0.15
7184080 CHERRY 5/2/2007 459 0.59 J 0.62 J 0.066 J7184081 WIPPLE 5/2/2007 104 0.2 0.64 0.063 U7184082 HARRISON 5/2/2007 1,653 0.063 U 0.063 U 0.063 U7184085 PARKER 5/2/2007 3,197 0.062 U 0.11 0.062 U7184088 EUCLID 5/3/2007 3,999 0.062 U 0.25 0.0747184090 KIONA 5/3/2007 4,017 0.063 U 0.23 0.0647184083 NACHES 5/2/2007 2,571 0.063 U 0.16 0.063 U7184084 MOXEE 5/2/2007 99 0.305 1.1 0.247184091 MOXEE REP 5/2/2007 - - 0.24 1.1 0.237184086 GRANGER 5/3/2007 28 0.21 1.8 0.327184087 SULFUR 5/3/2007 222 0.14 1.1 0.237184089 SPRING 5/3/2007 18 0.12 0.53 0.14
4,4'-DDT 4,4'-DDE 4,4'-DDD
U = not detected at or above reported value J = estimated na = not analyzed

Yakima Pesticides/PCBs TMDL: Vol 1, WQ Study Findings Page 226
Collection Field ID Date (ng/L) (ng/L) (ng/L) (ng/L) (ng/L)
CHERRY 4/4/2007 0.19 UJ 0.51 0.37 0.15 J 0.35WIPPLE 4/4/2007 0.32 UJ 1.3 0.19 J 0.15 J 0.74HARRISON 4/4/2007 0.12 UJ 0.89 0.43 0.24 0.45 JPARKER 4/4/2007 0.067 UJ 4.1 1.1 0.35 0.44EUCLID 4/5/2007 0.32 U 8.2 1.8 0.63 1.1KIONA 4/5/2007 0.13 UJ 16 1.6 0.68 1.6 JNACHES 4/4/2007 0.064 U 3.6 0.96 0.25 J 0.42 JMOXEE 4/4/2007 0.1 UJ 88 1.7 0.78 1.9GRANGER 4/5/2007 0.17 UJ 18 3.7 1.9 2.6GRANGER REP 4/5/2007 0.16 UJ 18 3.7 1.8 2.5SULFUR 4/5/2007 0.16 UJ 46 10 4.8 4.6SPRING 4/5/2007 0.27 UJ 82 3.3 1.4 5.1TRNSFR BLNK 4/5/2007 0.063 U 0.063 U 0.063 U 0.063 U 0.063 U
CHERRY 4/18/2007 0.28 J 0.12 J 0.062 UJ 0.062 UJ 0.09 JWIPPLE 4/18/2007 0.21 0.33 0.064 0.062 U 0.15 UJHARRISON 4/18/2007 0.071 UJ 0.17 0.084 0.063 U 0.094 UJPARKER 4/18/2007 0.072 UJ 2.4 0.21 0.092 0.3 UJEUCLID 4/19/2007 0.063 UJ 4.4 1 J 0.33 J 0.52 UJKIONA 4/19/2007 0.085 J 3.3 0.33 J 0.14 J 0.46 JNACHES 4/18/2007 0.063 U 2.7 0.17 J 0.063 J 0.33 UJMOXEE 4/18/2007 0.061 U 5.9 0.53 0.28 0.68GRANGER 4/19/2007 0.1 3.7 0.82 0.45 1.2SULFUR 4/19/2007 0.23 5.5 0.5 0.28 J 1.3SPRING 4/19/2007 0.22 14 0.15 J 0.063 UJ 2.2 J
CHERRY 5/2/2007 1.6 4.4 0.24 0.11 0.27 JWIPPLE 5/2/2007 0.62 UJ 0.31 0.17 UJ 0.11 0.27 JHARRISON 5/2/2007 0.13 UJ 0.25 0.15 UJ 0.063 U 0.14 JPARKER 5/2/2007 0.1 UJ 0.74 0.24 0.062 U 0.14 JEUCLID 5/3/2007 0.078 UJ 1.3 0.38 0.089 J 0.48 JKIONA 5/3/2007 0.067 UJ 1.5 0.27 0.15 0.54 JNACHES 5/2/2007 0.063 U 0.61 0.22 UJ 0.13 J 0.21 JMOXEE 5/2/2007 0.1265 U 2 J 2 1.05 1.5MOXEE REP 5/2/2007 0.063 U 2.1 J 2 1.1 1.6GRANGER 5/3/2007 0.13 UJ 1.5 0.31 0.19 0.69 JSULFUR 5/3/2007 0.23 UJ 3.1 1.4 0.34 0.73SPRING 5/3/2007 0.14 J 4.3 0.71 0.18 1.4
ChlorpyrifosDieldrin Endosulfan
SulfateEndosulfan
IIEndosulfan
I
U = not detected at or above reported value J = estimated na = not analyzed

Yakima Pesticides/PCBs TMDL: Vol 1, WQ Study Findings Page 227
Collection Field ID Date (ng/L) (ng/L) (ng/L) (ng/L) (ng/L) (ng/L)
CHERRY 4/4/2007 3.2 U 0.063 U 0.063 U 0.063 U 0.063 U 0.063 UWIPPLE 4/4/2007 3.2 U 0.065 U 0.065 U 0.065 U 0.065 U 0.065 UJHARRISON 4/4/2007 3.3 U 0.066 U 0.066 U 0.066 U 0.066 U 0.066 UPARKER 4/4/2007 3.3 U 0.065 U 0.065 U 0.065 U 0.065 U 0.065 UEUCLID 4/5/2007 3.2 U 0.064 U 0.064 U 0.064 U 0.064 U 0.064 UKIONA 4/5/2007 3.1 U 0.063 U 0.063 U 0.063 U 0.063 U 0.063 UNACHES 4/4/2007 3.2 U 0.064 U 0.064 U 0.064 U 0.064 U 0.064 UMOXEE 4/4/2007 3.2 U 0.064 U 0.064 U 0.064 U 0.064 U 0.064 UGRANGER 4/5/2007 3.2 U 0.064 U 0.064 U 0.064 U 0.064 U 0.064 UGRANGER REP 4/5/2007 3.2 U 0.065 U 0.065 U 0.065 U 0.065 U 0.065 USULFUR 4/5/2007 3.3 U 0.065 U 0.065 U 0.068 UJ 0.065 U 0.065 USPRING 4/5/2007 3.2 U 0.065 U 0.065 U 0.065 U 0.065 U 0.065 UTRNSFR BLNK 4/5/2007 3.1 U 0.063 U 0.063 U 0.063 U 0.063 U 0.063 U
CHERRY 4/18/2007 3.1 U 0.062 U 0.062 U 0.062 U 0.062 U 0.062 UWIPPLE 4/18/2007 3.1 U 0.062 U 0.062 U 0.062 U 0.062 U 0.062 UHARRISON 4/18/2007 3.1 U 0.063 U 0.063 U 0.063 U 0.063 U 0.063 UPARKER 4/18/2007 3.2 U 0.063 U 0.063 U 0.063 U 0.063 U 0.063 UEUCLID 4/19/2007 3.1 U 0.063 U 0.063 U 0.063 U 0.063 U 0.063 UKIONA 4/19/2007 3.2 U 0.064 U 0.064 U 0.064 U 0.064 U 0.064 UNACHES 4/18/2007 3.1 U 0.063 U 0.063 U 0.063 U 0.063 U 0.063 UMOXEE 4/18/2007 3 U 0.061 U 0.061 U 0.061 U 0.061 U 0.061 UGRANGER 4/19/2007 3.1 U 0.063 U 0.063 U 0.063 U 0.063 U 0.063 USULFUR 4/19/2007 3.1 U 0.063 U 0.063 U 0.063 U 0.063 U 0.063 USPRING 4/19/2007 3.1 U 0.063 U 0.063 U 0.063 U 0.063 U 0.063 U
CHERRY 5/2/2007 3.1 UJ 0.062 UJ 0.062 UJ 0.062 UJ 0.062 UJ 0.062 UJWIPPLE 5/2/2007 3.1 UJ 0.063 U 0.063 U 0.063 U 0.063 U 0.063 UHARRISON 5/2/2007 3.1 UJ 0.063 U 0.063 U 0.063 U 0.063 U 0.063 UPARKER 5/2/2007 3.1 UJ 0.062 U 0.062 U 0.062 U 0.062 U 0.062 UEUCLID 5/3/2007 3.1 UJ 0.062 U 0.062 U 0.062 U 0.062 U 0.062 UKIONA 5/3/2007 3.1 UJ 0.063 U 0.063 U 0.063 U 0.063 U 0.063 UNACHES 5/2/2007 3.1 UJ 0.063 U 0.063 U 0.063 U 0.063 U 0.063 UMOXEE 5/2/2007 11 J 0.0625 U 0.0765 U 0.0625 U 0.0625 U 0.0625 UMOXEE REP 5/2/2007 3.1 UJ 0.063 U 0.063 U 0.063 U 0.063 U 0.063 UGRANGER 5/3/2007 3.1 UJ 0.063 U 0.063 U 0.063 U 0.063 U 0.063 USULFUR 5/3/2007 3.1 UJ 0.061 U 0.061 U 0.061 U 0.061 U 0.061 USPRING 5/3/2007 3.2 UJ 0.063 U 0.063 U 0.063 U 0.063 U 0.063 U
ToxapheneCis-
Chlordane Cis-
NonachlorTrans-
Chlordane Trans-
NonachlorOxy-
chlordane
U = not detected at or above reported value J = estimated na = not analyzed

Yakima Pesticides/PCBs TMDL: Vol 1, WQ Study Findings Page 228
Collection Field ID Date (ng/L) (ng/L) (ng/L) (ng/L) (ng/L) (ng/L)
CHERRY 4/4/2007 0.063 U 0.063 U 0.063 U 0.063 U 0.39 UJ 0.083 UJWIPPLE 4/4/2007 0.065 U 0.065 U 0.065 U 0.065 U 0.29 UJ 0.065 UHARRISON 4/4/2007 0.066 U 0.066 U 0.066 U 0.066 U 0.12 UJ 0.066 UPARKER 4/4/2007 0.065 U 0.065 U 0.065 U 0.065 U 0.074 UJ 0.065 UEUCLID 4/5/2007 0.064 U 0.087 UJ 0.064 U 0.064 U 0.32 U 0.32 UKIONA 4/5/2007 0.063 U 0.07 UJ 0.063 U 0.063 U 0.29 UJ 0.063 UNACHES 4/4/2007 0.064 U 0.064 U 0.064 U 0.064 U 0.064 U 0.064 UMOXEE 4/4/2007 0.064 U 0.085 U 0.064 U 0.064 U 0.18 UJ 0.064 UGRANGER 4/5/2007 0.064 U 0.101 UJ 0.064 U 0.064 U 0.20 UJ 0.064 UGRANGER REP 4/5/2007 0.065 U 0.11 UJ 0.065 U 0.065 U 0.17 UJ 0.065 USULFUR 4/5/2007 0.065 U 0.065 U 0.065 U 0.065 U 0.21 UJ 0.065 USPRING 4/5/2007 0.065 U 0.065 U 0.065 U 0.065 U 0.44 UJ 0.065 UTRNSFR BLNK 4/5/2007 0.063 U 0.063 U 0.063 U 0.063 U 0.063 U 0.063 U
CHERRY 4/18/2007 0.062 U 0.062 U 0.062 U 0.062 U 0.062 UJ 0.062 UJWIPPLE 4/18/2007 0.062 U 0.062 U 0.062 U 0.062 U 0.062 U 0.062 UHARRISON 4/18/2007 0.063 U 0.063 U 0.063 U 0.063 U 0.063 U 0.063 UPARKER 4/18/2007 0.063 U 0.063 U 0.063 U 0.063 U 0.063 U 0.063 UEUCLID 4/19/2007 0.063 U 0.063 U 0.063 U 0.063 U 0.063 UJ 0.063 UJKIONA 4/19/2007 0.064 U 0.064 U 0.064 U 0.064 U 0.064 UJ 0.064 UJNACHES 4/18/2007 0.063 U 0.063 U 0.063 U 0.063 U 0.063 U 0.063 UMOXEE 4/18/2007 0.061 U 0.061 U 0.061 U 0.061 U 0.061 U 0.061 UGRANGER 4/19/2007 0.063 U 0.063 U 0.063 U 0.063 U 0.063 U 0.063 USULFUR 4/19/2007 0.063 U 0.063 U 0.063 U 0.063 U 0.1 J 0.063 USPRING 4/19/2007 0.063 U 0.063 U 0.063 U 0.063 U 0.063 UJ 0.063 UJ
CHERRY 5/2/2007 0.062 UJ 0.062 UJ 0.062 UJ 0.062 UJ 0.2 UJ 0.13 UJWIPPLE 5/2/2007 0.063 U 0.063 U 0.063 U 0.063 U 0.063 UJ 0.063 UHARRISON 5/2/2007 0.063 U 0.063 U 0.063 U 0.063 U 0.063 UJ 0.063 UPARKER 5/2/2007 0.062 U 0.062 U 0.062 U 0.062 U 0.062 UJ 0.062 UEUCLID 5/3/2007 0.062 U 0.062 U 0.062 U 0.062 U 0.062 UJ 0.062 UKIONA 5/3/2007 0.063 U 0.063 U 0.063 U 0.063 U 0.063 UJ 0.063 UNACHES 5/2/2007 0.063 U 0.063 U 0.063 U 0.063 U 0.063 U 0.063 UMOXEE 5/2/2007 0.0625 U 0.063 U 0.0625 U 0.063 U 0.063 UJ 0.063 UMOXEE REP 5/2/2007 0.063 U 0.063 U 0.063 U 0.063 U 0.063 UJ 0.063 UGRANGER 5/3/2007 0.063 U 0.063 U 0.063 U 0.063 U 0.063 UJ 0.063 USULFUR 5/3/2007 0.061 U 0.061 U 0.061 U 0.061 U 0.061 UJ 0.061 USPRING 5/3/2007 0.063 U 0.063 U 0.063 U 0.063 U 0.063 UJ 0.063 U
Alpha-BHC Lindane Aldrin EndrinBeta-BHC Delta-BHC
U = not detected at or above reported value J = estimated na = not analyzed

Yakima Pesticides/PCBs TMDL: Vol 1, WQ Study Findings Page 229
Collection Field ID Date (ng/L) (ng/L) (ng/L) (ng/L) (ng/L)
CHERRY 4/4/2007 0.37 UJ 0.096 UJ 0.063 U 0.063 U 0.063 UWIPPLE 4/4/2007 1.6 UJ 0.14 UJ 0.065 U 0.065 U 0.065 UHARRISON 4/4/2007 0.16 UJ 0.079 UJ 0.066 U 0.087 UJ 0.066 UPARKER 4/4/2007 0.11 UJ 0.065 UJ 0.065 U 0.074 UJ 0.065 UEUCLID 4/5/2007 0.32 U 0.32 U 0.064 U 0.32 U 0.064 UKIONA 4/5/2007 0.34 UJ 0.063 UJ 0.063 U 0.16 U 0.063 UNACHES 4/4/2007 0.42 UJ 0.12 UJ 0.064 U 0.064 U 0.064 UMOXEE 4/4/2007 0.42 UJ 0.064 UJ 0.064 U 0.12 0.064 UGRANGER 4/5/2007 0.23 UJ 0.064 UJ 0.064 U 0.075 UJ 0.064 UGRANGER REP 4/5/2007 0.17 UJ 0.065 UJ 0.065 U 0.071 UJ 0.065 USULFUR 4/5/2007 0.23 UJ 0.065 UJ 0.065 U 0.13 UJ 0.065 USPRING 4/5/2007 0.1 UJ 0.065 UJ 0.065 U 0.18 UJ 0.065 UTRNSFR BLNK 4/5/2007 0.063 U 0.063 U 0.063 U 0.063 U 0.063 U
CHERRY 4/18/2007 0.062 UJ 0.062 UJ 0.062 U 0.062 UJ 0.062 UWIPPLE 4/18/2007 0.062 U 0.062 U 0.062 U 0.062 U 0.062 UHARRISON 4/18/2007 0.063 U 0.063 U 0.063 U 0.065 0.063 UPARKER 4/18/2007 0.063 U 0.063 U 0.063 U 0.063 U 0.063 UEUCLID 4/19/2007 0.063 UJ 0.063 UJ 0.063 U 0.1 J 0.063 UKIONA 4/19/2007 0.064 UJ 0.064 UJ 0.064 U 0.064 UJ 0.064 UNACHES 4/18/2007 0.063 U 0.25 UJ 0.063 U 0.063 U 0.063 UMOXEE 4/18/2007 0.061 U 0.061 U 0.061 U 0.061 U 0.061 UGRANGER 4/19/2007 0.063 U 0.063 U 0.063 U 0.18 UJ 0.063 USULFUR 4/19/2007 0.089 UJ 0.063 U 0.063 U 0.14 0.063 USPRING 4/19/2007 0.15 UJ 0.063 UJ 0.063 U 0.15 UJ 0.063 U
CHERRY 5/2/2007 0.42 UJ 0.065 UJ 0.062 UJ 0.1 UJ 0.062 UJWIPPLE 5/2/2007 0.084 UJ 0.065 UJ 0.063 U 0.063 U 0.063 UHARRISON 5/2/2007 0.063 U 0.063 UJ 0.063 U 0.13 UJ 0.063 UPARKER 5/2/2007 0.062 U 0.062 U 0.062 U 0.062 U 0.062 UEUCLID 5/3/2007 0.062 U 0.062 U 0.062 U 0.077 UJ 0.062 UKIONA 5/3/2007 0.063 U 0.063 U 0.063 U 0.18 UJ 0.063 UNACHES 5/2/2007 0.063 U 0.063 U 0.063 U 0.14 UJ 0.063 UMOXEE 5/2/2007 0.265 UJ 0.0625 U 0.0625 U 0.125 0.0625 UMOXEE REP 5/2/2007 0.17 UJ 0.063 U 0.063 U 0.13 0.063 UGRANGER 5/3/2007 0.094 UJ 0.063 U 0.063 U 0.11 UJ 0.063 USULFUR 5/3/2007 0.081 UJ 0.061 U 0.061 U 0.11 UJ 0.061 USPRING 5/3/2007 0.082 UJ 0.063 U 0.063 U 0.084 UJ 0.063 U
Endrin Aldehyde
Endrin Ketone Heptachlor
Heptachlor Epoxide
Hexachloro-benzene
U = not detected at or above reported value J = estimated na = not analyzed

Yakima Pesticides/PCBs TMDL: Vol 1, WQ Study Findings Page 230
Collection Field ID Date (ng/L) (mg/L) (mg/L) (NTU) (umhos/cm)
CHERRY 4/4/2007 0.13 UJ 18 na 7.8 249WIPPLE 4/4/2007 1.2 UJ 5 na 2.1 490HARRISON 4/4/2007 0.43 UJ 16 13 7.8 114PARKER 4/4/2007 0.065 UJ 15 12 9.4 102EUCLID 4/5/2007 0.32 UJ 58 53 24 133KIONA 4/5/2007 0.4 UJ 36 33 20 142NACHES 4/4/2007 0.52 UJ 12 10 11 74.4MOXEE 4/4/2007 0.064 UJ 85 na 17 199GRANGER 4/5/2007 0.064 UJ 109 na 28 453GRANGER REP 4/5/2007 0.065 UJ 96 26 454SULFUR 4/5/2007 0.065 UJ 73 na 17 244SPRING 4/5/2007 0.065 UJ 40 na 22 206TRNSFR BLNK 4/5/2007 0.063 UJ na na na na
CHERRY 4/18/2007 0.062 UJ 23 na 11 252WIPPLE 4/18/2007 0.062 UJ 31 na 15 252HARRISON 4/18/2007 0.24 UJ 5 3 3.6 120PARKER 4/18/2007 0.14 UJ 9 7 6.5 102EUCLID 4/19/2007 0.19 UJ 19 17 8.5 145KIONA 4/19/2007 0.064 UJ 16 14 8.8 153NACHES 4/18/2007 0.37 UJ 8 8 7.7 74.4MOXEE 4/18/2007 0.13 UJ 122 na 19 169GRANGER 4/19/2007 0.063 UJ 180 na 42 395SULFUR 4/19/2007 0.22 UJ 39 na 13 355SPRING 4/19/2007 0.063 UJ 13 na 5.4 254
CHERRY 5/2/2007 0.062 U 121 107 36 301WIPPLE 5/2/2007 0.063 U 140 125 29 261HARRISON 5/2/2007 0.063 U 12 J 8 3.7 120PARKER 5/2/2007 0.062 U 13 10 3.7 J 107EUCLID 5/3/2007 0.062 U 18 15 7.6 148KIONA 5/3/2007 0.063 U 14 11 5.9 155NACHES 5/2/2007 0.063 U 7 6 4.4 71.2MOXEE 5/2/2007 0.106 UJ 108 99.5 18 193MOXEE REP 5/2/2007 0.15 UJ 105 95 21 193GRANGER 5/3/2007 0.063 U 170 160 37 397SULFUR 5/3/2007 0.061 U 38 34 13 290SPRING 5/3/2007 0.063 U 16 13 6.2 283
ConductivityTurbidityTNVSSTSSMethoxychlor
U = not detected at or above reported value J = estimated na = not analyzed

Yakima Pesticides/PCBs TMDL: Vol 1, WQ Study Findings Page 231
Collection Flow Sample No. Field ID Date (cfs) (ng/L) (ng/L) (ng/L)
7214080 CHERRY 5/23/2007 541 0.1 0.24 0.063 U7214081 WIPPLE 5/23/2007 156 0.13 0.67 0.063 U7214082 HARRISON 5/23/2007 2,771 0.063 U 0.063 U 0.063 U7214085 PARKER 5/23/2007 4,566 0.063 U 0.14 0.063 U7214088 EUCLID 5/24/2007 4,865 0.066 0.33 0.064 U7214090 KIONA 5/24/2007 5,267 0.062 U 0.38 0.0757214083 NACHES 5/23/2007 3,191 0.063 U 0.12 0.063 U7214084 MOXEE 5/23/2007 69 0.39 1.8 0.327214086 GRANGER 5/23/2007 29 0.89 4.1 0.427214087 SULFUR 5/24/2007 297 0.25 1.9 0.227214089 SPRING 5/24/2007 35 0.12 J 1.5 J 0.28 J
7234080 CHERRY 6/6/2007 459 0.063 U 0.23 0.063 U7234081 WIPPLE 6/6/2007 144 0.25 J 0.98 0.063 U7234082 HARRISON 6/6/2007 2,942 0.063 U 0.063 U 0.063 U7234085 PARKER 6/6/2007 6,950 0.061 U 0.15 0.061 U7234088 EUCLID 6/7/2007 6,516 0.2 J 0.51 0.062 U7234090 KIONA 6/7/2007 6,961 0.44 J 0.55 0.063 U7234083 NACHES 6/6/2007 4,728 0.063 U 0.14 J 0.063 U7234084 MOXEE 6/6/2007 82 0.53 J 1.8 0.21 J7234086 GRANGER 6/7/2007 34 1.7 J 3 0.22 J7234087 SULFUR 6/7/2007 492 0.3 J 1.9 J 0.14 J7234089 SPRING 6/7/2007 114 0.52 J 1.9 J 0.23 J7234091 SPRING REP 6/7/2007 - - 0.7 J 1.6 0.26 J
7264080 CHERRY 6/27/2007 411 0.063 U 0.21 0.063 U7264081 WIPPLE 6/27/2007 183 0.12 0.33 0.063 U7264082 HARRISON 6/27/2007 1,364 0.062 U 0.062 U 0.062 U7264085 PARKER 6/27/2007 266 0.061 U 0.097 0.061 U7264088 EUCLID 6/28/2007 939 0.064 0.35 0.0797264090 KIONA 6/28/2007 929 0.063 U 0.16 0.063 U7264083 NACHES 6/27/2007 744 0.065 U 0.13 0.065 U7264084 MOXEE 6/27/2007 55 0.23 1.3 0.237264086 GRANGER 6/28/2007 50 0.88 3.4 0.257264087 SULFUR 6/28/2007 254 0.26 1.5 0.167264089 SPRING 6/28/2007 51 0.15 0.66 0.19
4,4'-DDT 4,4'-DDE 4,4'-DDD
U = not detected at or above reported value J = estimated na = not analyzed

Yakima Pesticides/PCBs TMDL: Vol 1, WQ Study Findings Page 232
Collection Field ID Date (ng/L) (ng/L) (ng/L) (ng/L) (ng/L)
CHERRY 5/23/2007 0.54 0.42 0.063 U 0.063 U 0.23WIPPLE 5/23/2007 0.91 0.15 0.063 U 0.063 U 0.31HARRISON 5/23/2007 0.063 U 0.063 U 0.063 U 0.063 U 0.097 UJPARKER 5/23/2007 0.063 U 0.17 J 0.22 0.095 0.32 JEUCLID 5/24/2007 0.073 UJ 1.3 0.15 0.13 0.76 JKIONA 5/24/2007 0.092 UJ 1.4 0.2 0.11 0.63 JNACHES 5/23/2007 0.063 U 0.063 U 0.063 U 0.063 U 0.22 JMOXEE 5/23/2007 0.078 UJ 0.98 0.19 0.3 1GRANGER 5/23/2007 0.28 1.1 J 1 0.63 1.8SULFUR 5/24/2007 0.37 1.2 0.12 0.26 0.88SPRING 5/24/2007 0.23 2.4 0.16 0.29 2.7
CHERRY 6/6/2007 0.87 0.19 0.063 U 0.063 U 0.18 JWIPPLE 6/6/2007 0.66 J 0.063 U 0.063 U 0.063 U 0.22 JHARRISON 6/6/2007 0.089 UJ 0.063 U 0.063 U 0.063 U 0.093 JPARKER 6/6/2007 0.075 UJ 0.061 U 0.075 UJ 0.062 0.22 UJEUCLID 6/7/2007 0.082 UJ 0.062 U 0.085 UJ 0.062 U 0.19 JKIONA 6/7/2007 0.1 UJ 0.42 0.15 UJ 0.082 J 0.45 JNACHES 6/6/2007 0.063 U 0.063 U 0.063 U 0.063 U 0.14 JMOXEE 6/6/2007 0.092 UJ 0.5 0.16 UJ 0.28 0.82 JGRANGER 6/7/2007 0.38 3.9 0.063 U 0.11 0.45 JSULFUR 6/7/2007 0.28 0.44 J 0.066 UJ 0.19 0.58 JSPRING 6/7/2007 0.31 1.1 0.35 J 0.27 J 1.6 JSPRING REP 6/7/2007 0.34 1.3 0.41 J 0.34 J 1.7 J
CHERRY 6/27/2007 0.31 J 13 0.063 U 0.063 U 0.15 UJWIPPLE 6/27/2007 0.3 J 0.12 J 0.063 U 0.063 U 0.17 UJHARRISON 6/27/2007 0.062 U 0.062 U 0.062 U 0.062 U 0.12 UJPARKER 6/27/2007 0.061 U 0.13 J 0.061 U 0.061 U 0.13 UJEUCLID 6/28/2007 0.19 UJ 0.63 0.062 U 0.062 U 0.39KIONA 6/28/2007 0.14 UJ 0.43 J 0.063 U 0.078 0.44NACHES 6/27/2007 0.065 U 0.065 U 0.065 U 0.065 U 0.084 UJMOXEE 6/27/2007 0.11 UJ 0.43 0.41 0.62 1.2GRANGER 6/28/2007 0.47 J 0.27 J 0.11 J 0.065 UJ 0.065 UJSULFUR 6/28/2007 0.41 J 0.28 0.082 J 0.13 J 0.46SPRING 6/28/2007 0.15 UJ 0.82 0.093 J 0.1 0.91
DieldrinEndosulfan
IEndosulfan
IIEndosulfan
SulfateChlorpyrifos
U = U = not detected at or above reported value J = estimated na = not analyzed

Yakima Pesticides/PCBs TMDL: Vol 1, WQ Study Findings Page 233
Collection Field ID Date (ng/L) (ng/L) (ng/L) (ng/L) (ng/L) (ng/L)
CHERRY 5/23/2007 3.1 U 0.063 U 0.063 U 0.063 U 0.063 U 0.063 UWIPPLE 5/23/2007 3.1 U 0.063 U 0.063 U 0.063 U 0.063 U 0.063 UHARRISON 5/23/2007 3.2 U 0.063 U 0.063 U 0.063 U 0.063 U 0.063 UPARKER 5/23/2007 3.1 U 0.063 U 0.063 U 0.063 U 0.063 U 0.063 UEUCLID 5/24/2007 3.2 U 0.064 U 0.064 U 0.064 U 0.064 U 0.064 UKIONA 5/24/2007 3.1 U 0.062 U 0.062 U 0.062 U 0.062 U 0.062 UNACHES 5/23/2007 3.2 U 0.063 U 0.063 U 0.063 U 0.063 U 0.063 UMOXEE 5/23/2007 3.5 E 0.063 U 0.063 U 0.063 U 0.063 U 0.063 UGRANGER 5/23/2007 3.2 U 0.063 U 0.063 U 0.063 U 0.063 U 0.066 UJSULFUR 5/24/2007 4.3 E 0.062 U 0.062 U 0.062 U 0.062 U 0.062 USPRING 5/24/2007 3.2 UJ 0.063 UJ 0.063 UJ 0.063 UJ 0.063 UJ 0.063 UJ
CHERRY 6/6/2007 3.1 U 0.063 U 0.063 U 0.063 U 0.063 U 0.063 UWIPPLE 6/6/2007 3.2 U 0.063 U 0.063 U 0.063 U 0.084 0.063 UHARRISON 6/6/2007 3.1 U 0.063 U 0.063 U 0.063 U 0.063 U 0.063 UPARKER 6/6/2007 3 U 0.061 U 0.061 U 0.061 U 0.061 U 0.061 UEUCLID 6/7/2007 3.1 U 0.062 U 0.062 U 0.062 U 0.062 U 0.062 UKIONA 6/7/2007 3.2 U 0.063 U 0.063 U 0.063 U 0.063 U 0.063 UNACHES 6/6/2007 3.1 U 0.063 U 0.063 U 0.063 U 0.063 U 0.063 UMOXEE 6/6/2007 3.2 U 0.063 U 0.063 U 0.063 U 0.063 U 0.063 UGRANGER 6/7/2007 3.1 U 0.063 U 0.063 U 0.063 U 0.063 U 0.063 USULFUR 6/7/2007 3.2 U 0.064 U 0.064 U 0.064 U 0.064 U 0.064 USPRING 6/7/2007 3.2 U 0.063 U 0.063 U 0.063 U 0.063 U 0.063 USPRING REP 6/7/2007 3.2 U 0.063 U 0.063 U 0.1 0.063 U 0.063 U
CHERRY 6/27/2007 3.2 U 0.063 U 0.063 U 0.063 U 0.063 U 0.063 UWIPPLE 6/27/2007 3.2 U 0.063 U 0.063 U 0.063 U 0.063 U 0.063 UHARRISON 6/27/2007 3.1 U 0.062 U 0.062 U 0.062 U 0.062 U 0.062 UPARKER 6/27/2007 3.1 U 0.061 U 0.061 U 0.061 U 0.061 U 0.061 UEUCLID 6/28/2007 3.1 U 0.062 U 0.062 U 0.062 U 0.062 U 0.062 UKIONA 6/28/2007 3.1 U 0.063 U 0.063 U 0.063 U 0.063 U 0.063 UNACHES 6/27/2007 3.3 U 0.065 U 0.065 U 0.065 U 0.065 U 0.065 UMOXEE 6/27/2007 3.1 U 0.063 U 0.063 U 0.063 U 0.063 U 0.063 UGRANGER 6/28/2007 3.3 U 0.065 U 0.065 U 0.065 U 0.065 U 0.065 USULFUR 6/28/2007 3.3 U 0.065 U 0.065 U 0.065 U 0.065 U 0.065 USPRING 6/28/2007 3.2 U 0.063 U 0.063 U 0.063 U 0.063 U 0.063 U
Oxy-chlordane
Trans-Nonachlor
Trans-Chlordane
Cis-Nonachlor
Cis-Chlordane Toxaphene
U = not detected at or above reported value J = estimated na = not analyzed

Yakima Pesticides/PCBs TMDL: Vol 1, WQ Study Findings Page 234
Collection Field ID Date (ng/L) (ng/L) (ng/L) (ng/L) (ng/L) (ng/L)
CHERRY 5/23/2007 0.063 U 0.063 U 0.063 U 0.063 U 0.088 UJ 0.063 UWIPPLE 5/23/2007 0.063 U 0.063 U 0.063 U 0.11 UJ 0.063 U 0.063 UHARRISON 5/23/2007 0.063 U 0.063 U 0.063 U 0.063 U 0.063 U 0.063 UPARKER 5/23/2007 0.063 U 0.063 U 0.063 U 0.063 U 0.063 U 0.063 UEUCLID 5/24/2007 0.064 U 0.064 U 0.064 U 0.064 U 0.064 U 0.064 UKIONA 5/24/2007 0.062 U 0.062 U 0.062 U 0.062 U 0.062 U 0.062 UNACHES 5/23/2007 0.063 U 0.063 U 0.063 U 0.063 U 0.063 U 0.063 UMOXEE 5/23/2007 0.063 U 0.063 U 0.063 U 0.063 U 0.063 U 0.063 UGRANGER 5/23/2007 0.063 U 0.063 U 0.063 U 0.063 U 0.063 U 0.063 USULFUR 5/24/2007 0.062 U 0.062 U 0.062 U 0.062 U 0.062 U 0.062 USPRING 5/24/2007 0.063 UJ 0.087 UJ 0.063 UJ 0.063 UJ 0.063 U 0.095 UJ
CHERRY 6/6/2007 0.063 U 0.063 U 0.063 U 0.063 UJ 0.063 U 0.063 UWIPPLE 6/6/2007 0.063 U 0.063 U 0.063 U 0.063 UJ 0.063 U 0.063 UHARRISON 6/6/2007 0.063 U 0.063 U 0.063 U 0.063 UJ 0.063 U 0.063 UPARKER 6/6/2007 0.061 U 0.061 U 0.061 U 0.061 UJ 0.061 U 0.061 UEUCLID 6/7/2007 0.062 U 0.062 U 0.062 U 0.062 UJ 0.062 U 0.062 UKIONA 6/7/2007 0.063 U 0.063 U 0.063 U 0.063 UJ 0.063 U 0.063 UNACHES 6/6/2007 0.063 U 0.063 U 0.063 U 0.063 UJ 0.063 U 0.063 UMOXEE 6/6/2007 0.063 U 0.063 U 0.063 U 0.097 UJ 0.063 U 0.063 UGRANGER 6/7/2007 0.063 U 0.063 U 0.063 U 0.063 UJ 0.063 U 0.063 USULFUR 6/7/2007 0.064 U 0.064 U 0.064 U 0.069 UJ 0.064 U 0.064 USPRING 6/7/2007 0.063 U 0.063 U 0.063 U 0.063 UJ 0.063 U 0.063 USPRING REP 6/7/2007 0.063 U 0.063 U 0.063 U 0.063 UJ 0.063 U 0.063 U
CHERRY 6/27/2007 0.063 U 0.11 UJ 0.063 U 0.063 U 0.063 U 0.063 UWIPPLE 6/27/2007 0.063 U 0.14 UJ 0.063 U 0.063 U 0.063 U 0.063 UHARRISON 6/27/2007 0.062 U 0.15 UJ 0.062 U 0.062 U 0.062 U 0.062 UPARKER 6/27/2007 0.061 U 0.14 UJ 0.061 U 0.061 U 0.061 U 0.061 UEUCLID 6/28/2007 0.062 U 0.062 U 0.062 U 0.062 U 0.062 U 0.062 UKIONA 6/28/2007 0.063 U 0.11 UJ 0.063 U 0.063 U 0.063 U 0.063 UNACHES 6/27/2007 0.065 U 0.1 UJ 0.065 U 0.065 U 0.065 UJ 0.065 UMOXEE 6/27/2007 0.063 U 0.12 UJ 0.063 U 0.071 UJ 0.063 U 0.063 UGRANGER 6/28/2007 0.065 U 0.065 U 0.065 U 0.065 U 0.065 UJ 0.065 UJSULFUR 6/28/2007 0.065 U 0.065 U 0.065 U 0.065 U 0.065 U 0.065 USPRING 6/28/2007 0.063 U 0.14 UJ 0.063 U 0.063 U 0.063 U 0.063 U
Alpha-BHC Lindane Aldrin EndrinBeta-BHC Delta-BHC
U = not detected at or above reported value J = estimated na = not analyzed

Yakima Pesticides/PCBs TMDL: Vol 1, WQ Study Findings Page 235
Collection Field ID Date (ng/L) (ng/L) (ng/L) (ng/L) (ng/L)
CHERRY 5/23/2007 0.063 U 0.063 U 0.063 U 0.063 U 0.063 UWIPPLE 5/23/2007 0.067 UJ 0.063 U 0.063 U 0.063 U 0.063 UHARRISON 5/23/2007 0.063 U 0.063 U 0.063 U 0.063 U 0.063 UPARKER 5/23/2007 0.063 U 0.063 U 0.063 U 0.11 0.063 UEUCLID 5/24/2007 0.16 UJ 0.19 UJ 0.064 U 0.072 UJ 0.064 UKIONA 5/24/2007 0.062 U 0.062 U 0.062 U 0.062 U 0.062 UNACHES 5/23/2007 0.063 U 0.063 U 0.063 U 0.12 0.063 UMOXEE 5/23/2007 0.092 UJ 0.063 U 0.063 U 0.063 U 0.063 UGRANGER 5/23/2007 0.063 U 0.063 U 0.063 U 0.077 UJ 0.063 USULFUR 5/24/2007 0.073 UJ 0.062 U 0.062 U 0.077 UJ 0.062 USPRING 5/24/2007 0.11 UJ 0.063 U 0.063 UJ 0.063 U 0.12 J
CHERRY 6/6/2007 0.12 UJ 0.063 U 0.063 U 0.063 U 0.063 UWIPPLE 6/6/2007 0.076 UJ 0.063 U 0.063 U 0.066 0.063 UHARRISON 6/6/2007 0.063 U 0.063 U 0.063 U 0.063 U 0.063 UPARKER 6/6/2007 0.13 UJ 0.061 U 0.061 U 0.061 U 0.061 UEUCLID 6/7/2007 0.062 UJ 0.062 U 0.062 U 0.062 U 0.062 UKIONA 6/7/2007 0.063 U 0.063 U 0.063 U 0.11 UJ 0.063 UNACHES 6/6/2007 0.13 UJ 0.063 U 0.063 U 0.063 U 0.063 UMOXEE 6/6/2007 0.48 UJ 0.063 U 0.063 U 0.063 U 0.063 UGRANGER 6/7/2007 0.1 UJ 0.063 U 0.063 U 0.17 0.063 USULFUR 6/7/2007 0.083 UJ 0.064 U 0.064 U 1.3 0.064 USPRING 6/7/2007 0.077 UJ 0.063 U 0.063 U 0.1 UJ 0.063 USPRING REP 6/7/2007 0.14 UJ 0.063 U 0.063 U 0.11 UJ 0.063 U
CHERRY 6/27/2007 0.063 U 0.063 U 0.063 U 0.063 U 0.072 UJWIPPLE 6/27/2007 0.063 U 0.063 U 0.063 U 0.063 U 0.063 UHARRISON 6/27/2007 0.062 U 0.062 U 0.062 U 0.062 U 0.062 UPARKER 6/27/2007 0.061 U 0.061 U 0.061 U 0.061 U 0.061 UEUCLID 6/28/2007 0.062 U 0.062 U 0.062 U 0.062 U 0.062 UKIONA 6/28/2007 0.063 U 0.063 U 0.063 U 0.063 U 0.063 UNACHES 6/27/2007 0.065 U 0.065 U 0.065 U 0.065 U 0.065 UJMOXEE 6/27/2007 0.063 U 0.063 U 0.063 U 0.063 U 0.063 UGRANGER 6/28/2007 0.065 UJ 0.065 UJ 0.065 U 0.12 J 0.065 USULFUR 6/28/2007 0.065 U 0.065 U 0.065 U 0.065 U 0.065 USPRING 6/28/2007 0.063 U 0.063 U 0.063 U 0.063 U 0.063 U
Endrin Aldehyde
Endrin Ketone Heptachlor
Heptachlor Epoxide
Hexachloro-benzene
U = not detected at or above reported value J = estimated na = not analyzed

Yakima Pesticides/PCBs TMDL: Vol 1, WQ Study Findings Page 236
Collection MethoxychlorField ID Date (ng/L) (mg/L) (mg/L) (NTU) (umhos/cm)
CHERRY 5/23/2007 0.063 UJ 58 50 17 258WIPPLE 5/23/2007 0.077 UJ 52 45 19 228HARRISON 5/23/2007 0.16 UJ 16 13 5.5 98PARKER 5/23/2007 0.063 UJ 16 14 5.7 90EUCLID 5/24/2007 0.064 UJ 38 34 15 126KIONA 5/24/2007 0.062 UJ 43 38 16 135NACHES 5/23/2007 0.063 UJ 8 7 6.6 64MOXEE 5/23/2007 0.18 UJ 125 117 23 221GRANGER 5/23/2007 0.063 UJ 133 123 39 392SULFUR 5/24/2007 0.062 UJ 73 66 18 241SPRING 5/24/2007 0.063 UJ 218 195 50 299
CHERRY 6/6/2007 0.063 U 67 58 22 271WIPPLE 6/6/2007 0.063 U 63 56 24 262HARRISON 6/6/2007 0.084 UJ 24 20 12 87PARKER 6/6/2007 0.061 U 27 23 17 77EUCLID 6/7/2007 0.062 U 67 61 27 105KIONA 6/7/2007 0.063 U 76 68 32 109NACHES 6/6/2007 0.063 U 29 26 17 56MOXEE 6/6/2007 0.19 UJ 139 129 33 177GRANGER 6/7/2007 0.063 U 132 122 60 331SULFUR 6/7/2007 0.064 U 80 74 25 181SPRING 6/7/2007 0.063 U 92 83 34 153SPRING REP 6/7/2007 0.063 U 100 90 32 153
CHERRY 6/27/2007 0.1 UJ 44 38 13 244WIPPLE 6/27/2007 0.063 U 35 31 14 164HARRISON 6/27/2007 0.062 U 9 7 4.2 90.2PARKER 6/27/2007 0.061 U 7 6 2.9 94.9EUCLID 6/28/2007 0.062 U 16 13 5.3 236KIONA 6/28/2007 0.22 UJ 14 11 4.2 264NACHES 6/27/2007 0.065 U 4 3 3.8 72.2MOXEE 6/27/2007 0.063 U 61 57 16 212GRANGER 6/28/2007 0.17 UJ 33 30 17 374SULFUR 6/28/2007 0.065 U 26 24 9.4 287SPRING 6/28/2007 0.063 U 22 20 6 230
ConductivityTNVSSTSS Turbidity
U = not detected at or above reported value J = estimated na = not analyzed

Yakima Pesticides/PCBs TMDL: Vol 1, WQ Study Findings Page 237
Collection Flow Sample No. Field ID Date (cfs) (ng/L) (ng/L) (ng/L)
7284080 CHERRY 7/11/2007 142 0.3 0.33 0.063 U7284081 WIPPLE 7/11/2007 61 0.27 0.5 0.061 U7284082 HARRISON 7/11/2007 2,211 0.063 U 0.063 U 0.063 U7284085 PARKER 7/11/2007 384 0.066 U 0.096 0.066 U7284088 EUCLID 7/12/2007 875 0.19 UJ 0.4 0.11 UJ7284091 EUCLID REP 7/12/2007 - - 0.14 UJ 0.46 0.11 UJ7284090 KIONA 7/12/2007 846 0.063 U 0.16 0.067 UJ7284083 NACHES 7/11/2007 364 0.061 UJ 0.14 0.063 UJ7284084 MOXEE 7/11/2007 38 0.21 UJ 0.76 0.197284086 GRANGER 7/12/2007 42 0.98 J 2.7 J 0.22 J7284087 SULFUR 7/12/2007 181 0.27 1.1 0.177284089 SPRING 7/12/2007 22 0.065 U 0.37 0.13 UJ7284092 TRNSFR BLNK 7/11/2007 - - 0.061 U 0.061 U 0.061 U
7304082 HARRISON 7/24/2007 2,138 0.063 U 0.063 U 0.063 U7304085 PARKER 7/24/2007 384 0.062 U 0.074 J 0.062 U7304088 EUCLID 7/24/2007 978 0.095 0.35 0.0937304090 KIONA 7/26/2007 1,101 0.063 U 0.14 0.063 U7304083 NACHES 7/24/2007 299 0.063 U 0.17 0.063 U7304084 MOXEE 7/24/2007 43 0.31 0.98 0.247304086 GRANGER 7/24/2007 40 0.69 2.2 0.237304087 SULFUR 7/24/2007 235 0.24 0.96 0.187304089 SPRING 7/24/2007 24 0.063 U 0.38 0.15
7324080 CHERRY 8/8/2007 249 0.44 0.26 0.061 U7324081 WIPPLE 8/8/2007 98 0.099 0.54 0.062 U7324082 HARRISON 8/8/2007 2,242 0.063 U 0.063 U 0.063 U7324085 PARKER 8/9/2007 500 0.066 U 0.083 0.066 U7324088 EUCLID 8/9/2007 1,007 0.11 0.44 0.117324090 KIONA 8/9/2007 1,681 0.062 U 0.14 0.062 U7324083 NACHES 8/8/2007 334 0.07 0.18 0.0687324084 MOXEE 8/8/2007 45 0.24 1 0.27324086 GRANGER 8/9/2007 49 0.66 2.4 0.277324091 SULFUR REP 8/9/2007 288 0.35 1.2 0.157324089 SPRING 8/9/2007 43 0.074 0.4 0.15
4,4'-DDT 4,4'-DDE 4,4'-DDD
U = not detected at or above reported value J = estimated na = not analyzed

Yakima Pesticides/PCBs TMDL: Vol 1, WQ Study Findings Page 238
Collection DieldrinField ID Date (ng/L) (ng/L) (ng/L) (ng/L) (ng/L)
CHERRY 7/11/2007 2.1 0.011 J 0.063 U 0.063 U 0.21WIPPLE 7/11/2007 1.5 0.061 U 0.061 U 0.061 U 0.16HARRISON 7/11/2007 0.067 UJ 0.063 U 0.063 U 0.063 U 0.11PARKER 7/11/2007 0.087 UJ 0.089 J 0.066 U 0.066 U 0.19EUCLID 7/12/2007 0.25 J 1.1 0.17 J 0.095 J 0.72EUCLID REP 7/12/2007 0.25 J 1.4 0.21 J 0.14 0.68KIONA 7/12/2007 0.15 J 0.49 0.074 J 0.063 U 0.61NACHES 7/11/2007 0.061 U 0.074 J 0.061 U 0.061 U 0.11MOXEE 7/11/2007 0.063 U 0.31 0.063 U 0.18 0.44GRANGER 7/12/2007 0.65 J 0.22 J 0.3 J 0.19 J 0.49 JSULFUR 7/12/2007 0.92 J 0.61 J 0.3 J 0.28 0.78SPRING 7/12/2007 0.17 J 0.64 0.27 J 0.17 J 0.89TRNSFR BLNK 7/11/2007 0.061 U 0.061 U 0.061 U 0.061 U 0.061 U
HARRISON 7/24/2007 0.063 U 0.063 U 0.063 U 0.063 U 0.28PARKER 7/24/2007 0.062 U 0.11 J 0.062 U 0.062 U 0.2 JEUCLID 7/24/2007 0.22 J 20 0.12 UJ 0.096 0.76KIONA 7/26/2007 0.22 J 13 0.16 UJ 0.12 1.2NACHES 7/24/2007 0.063 U 0.063 U 0.07 UJ 0.063 U 0.15 JMOXEE 7/24/2007 0.067 UJ 0.24 0.093 UJ 0.1 J 0.58GRANGER 7/24/2007 0.38 0.56 J 0.15 UJ 0.083 J 0.6SULFUR 7/24/2007 0.59 0.6 J 0.31 UJ 0.14 0.78SPRING 7/24/2007 0.19 J 0.79 J 0.33 UJ 0.26 J 2.8
CHERRY 8/8/2007 1 0.23 0.061 U 0.061 U 0.18WIPPLE 8/8/2007 0.68 0.062 U 0.062 U 0.062 U 0.15 JHARRISON 8/8/2007 0.063 U 0.063 U 0.08 0.063 U 0.13 JPARKER 8/9/2007 0.066 U 0.066 U 0.2 0.073 0.29EUCLID 8/9/2007 0.29 6.2 0.35 0.18 0.76KIONA 8/9/2007 0.15 J 2.5 0.094 J 0.08 J 0.82NACHES 8/8/2007 0.063 U 0.063 U 0.37 0.063 U 0.18 JMOXEE 8/8/2007 0.068 J 0.063 U 0.21 J 0.15 J 0.66GRANGER 8/9/2007 0.52 0.88 0.44 J 0.14 J 0.93SULFUR REP 8/9/2007 0.6 1.2 0.65 0.29 0.95SPRING 8/9/2007 0.17 J 3.5 0.33 0.25 J 2.7
ChlorpyrifosEndosulfan
IEndosulfan
IIEndosulfan
Sulfate
U = not detected at or above reported value J = estimated na = not analyzed

Yakima Pesticides/PCBs TMDL: Vol 1, WQ Study Findings Page 239
Collection Field ID Date (ng/L) (ng/L) (ng/L) (ng/L) (ng/L) (ng/L)
CHERRY 7/11/2007 3.2 U 0.063 U 0.063 U 0.063 U 0.063 U 0.063 UWIPPLE 7/11/2007 3.1 U 0.061 U 0.061 U 0.061 U 0.061 U 0.11 UJHARRISON 7/11/2007 3.1 U 0.063 U 0.063 U 0.063 U 0.063 U 0.063 UPARKER 7/11/2007 3.3 U 0.066 U 0.066 U 0.066 U 0.066 U 0.12 UJEUCLID 7/12/2007 3.1 U 0.063 U 0.063 U 0.085 UJ 0.063 U 0.16 UJEUCLID REP 7/12/2007 3.3 U 0.066 U 0.066 U 0.066 U 0.066 U 0.066 UKIONA 7/12/2007 3.1 U 0.063 U 0.063 U 0.063 U 0.063 U 0.063 UNACHES 7/11/2007 3.1 U 0.061 U 0.061 U 0.061 U 0.061 U 0.061 UMOXEE 7/11/2007 3.2 U 0.063 U 0.063 U 0.063 UJ 0.063 U 0.063 UGRANGER 7/12/2007 3 UJ 0.061 UJ 0.061 UJ 0.061 U 0.061 UJ 0.13 UJSULFUR 7/12/2007 3.2 U 0.064 U 0.064 U 0.064 U 0.064 U 0.094 UJSPRING 7/12/2007 3.2 U 0.065 U 0.065 U 0.065 U 0.065 U 0.11 UJTRNSFR BLNK 7/11/2007 0.061 U 0.061 U 0.061 U 0.061 U 0.065 U 0.061 U
HARRISON 7/24/2007 3.2 U 0.063 U 0.063 U 0.063 U 0.063 U 0.063 UPARKER 7/24/2007 3.1 U 0.062 U 0.062 U 0.062 U 0.062 U 0.062 UEUCLID 7/24/2007 3.3 U 0.065 U 0.065 U 0.065 U 0.065 U 0.065 UKIONA 7/26/2007 3.1 U 0.063 U 0.063 U 0.063 U 0.063 U 0.063 UNACHES 7/24/2007 3.2 U 0.063 U 0.063 U 0.063 U 0.063 U 0.063 UMOXEE 7/24/2007 3.1 U 0.061 U 0.061 U 0.061 U 0.061 U 0.061 UGRANGER 7/24/2007 3.2 U 0.063 U 0.063 U 0.063 U 0.063 U 0.063 USULFUR 7/24/2007 4.1 J 0.063 U 0.063 U 0.063 U 0.063 U 0.063 USPRING 7/24/2007 3.1 U 0.063 U 0.063 U 0.063 U 0.063 U 0.063 U
CHERRY 8/8/2007 3 U 0.061 U 0.061 U 0.061 U 0.061 U 0.061 UWIPPLE 8/8/2007 3.1 U 0.062 U 0.062 U 0.062 U 0.062 U 0.062 UHARRISON 8/8/2007 3.1 U 0.063 U 0.063 U 0.063 U 0.063 U 0.063 UPARKER 8/9/2007 3.3 U 0.066 U 0.066 U 0.066 U 0.066 U 0.066 UEUCLID 8/9/2007 3.1 U 0.062 U 0.062 U 0.062 U 0.062 U 0.062 UKIONA 8/9/2007 3.1 U 0.062 U 0.062 U 0.062 U 0.062 U 0.062 UNACHES 8/8/2007 3.1 U 0.063 U 0.063 U 0.063 U 0.063 U 0.063 UMOXEE 8/8/2007 3.1 U 0.063 U 0.063 U 0.063 U 0.063 U 0.063 UGRANGER 8/9/2007 3.3 U 0.066 U 0.066 U 0.066 U 0.066 U 0.066 USULFUR REP 8/9/2007 3.1 U 0.062 U 0.062 U 0.062 U 0.062 U 0.062 USPRING 8/9/2007 3.1 U 0.063 U 0.063 U 0.063 U 0.063 U 0.063 U
Cis-Chlordane
Cis-Nonachlor
Trans-Chlordane
Trans-Nonachlor
Oxy-chlordaneToxaphene
U = not detected at or above reported value J = estimated na = not analyzed

Yakima Pesticides/PCBs TMDL: Vol 1, WQ Study Findings Page 240
Collection Field ID Date (ng/L) (ng/L) (ng/L) (ng/L) (ng/L) (ng/L)
CHERRY 7/11/2007 0.063 U 0.063 U 0.063 U 0.063 U 0.063 U 0.063 UWIPPLE 7/11/2007 0.061 U 0.061 U 0.061 U 0.092 UJ 0.061 U 0.061 UHARRISON 7/11/2007 0.063 U 0.063 U 0.063 U 0.063 U 0.063 U 0.063 UPARKER 7/11/2007 0.066 U 0.066 U 0.066 U 0.066 U 0.066 U 0.066 UEUCLID 7/12/2007 0.063 U 0.063 U 0.063 U 0.063 U 0.063 U 0.19 UJEUCLID REP 7/12/2007 0.066 U 0.066 U 0.066 U 0.066 U 0.066 U 0.15 UJKIONA 7/12/2007 0.063 U 0.063 U 0.063 U 0.063 U 0.063 U 0.075 UJNACHES 7/11/2007 0.061 U 0.061 U 0.061 U 0.061 U 0.061 U 0.061 UMOXEE 7/11/2007 0.063 U 0.063 U 0.063 U 0.075 UJ 0.063 U 0.063 UGRANGER 7/12/2007 0.061 UJ 0.061 U 0.061 UJ 0.061 UJ 0.061 UJ 0.16 UJSULFUR 7/12/2007 0.064 U 0.064 U 0.064 U 0.064 U 0.064 U 0.22 UJSPRING 7/12/2007 0.065 U 0.12 UJ 0.065 U 0.065 U 0.065 U 0.065 UTRNSFR BLNK 7/11/2007 0.061 U 0.061 U 0.061 U 0.061 U 0.061 U 0.061 U
HARRISON 7/24/2007 0.063 U 0.063 U 0.063 U 0.063 U 0.063 U 0.063 UPARKER 7/24/2007 0.062 U 0.062 U 0.062 U 0.062 U 0.062 U 0.062 UEUCLID 7/24/2007 0.065 U 0.065 U 0.065 U 0.065 U 0.085 UJ 0.065 UKIONA 7/26/2007 0.063 U 0.063 U 0.063 U 0.063 U 0.065 UJ 0.11 UJNACHES 7/24/2007 0.063 U 0.063 U 0.063 U 0.063 U 0.063 U 0.063 UMOXEE 7/24/2007 0.061 U 0.061 U 0.061 U 0.061 U 0.061 U 0.076 UJGRANGER 7/24/2007 0.063 U 0.063 U 0.063 U 0.063 U 0.063 U 0.063 USULFUR 7/24/2007 0.063 U 0.063 U 0.063 U 0.063 U 0.063 U 0.063 USPRING 7/24/2007 0.063 U 0.063 U 0.063 U 0.063 U 0.063 U 0.063 U
CHERRY 8/8/2007 0.069 0.061 U 0.061 U 0.061 U 0.061 U 0.061 UWIPPLE 8/8/2007 0.062 U 0.062 U 0.062 U 0.062 U 0.062 U 0.062 UHARRISON 8/8/2007 0.063 U 0.063 U 0.063 U 0.063 U 0.063 U 0.063 UPARKER 8/9/2007 0.066 U 0.066 U 0.066 U 0.066 U 0.066 U 0.066 UEUCLID 8/9/2007 0.062 U 0.062 U 0.062 U 0.062 U 0.062 U 0.062 UKIONA 8/9/2007 0.062 U 0.062 U 0.062 U 0.062 U 0.062 U 0.12NACHES 8/8/2007 0.063 U 0.063 U 0.063 U 0.063 U 0.063 U 0.063 UMOXEE 8/8/2007 0.063 U 0.063 U 0.063 U 0.063 U 0.063 U 0.063 UGRANGER 8/9/2007 0.066 U 0.066 U 0.066 U 0.066 U 0.066 U 0.066 USULFUR REP 8/9/2007 0.062 U 0.062 U 0.062 U 0.062 U 0.062 U 0.062 USPRING 8/9/2007 0.063 U 0.063 U 0.063 U 0.063 U 0.063 U 0.063 U
Alpha-BHC Beta-BHC
Delta-BHC Lindane Aldrin Endrin
U = not detected at or above reported value J = estimated na = not analyzed

Yakima Pesticides/PCBs TMDL: Vol 1, WQ Study Findings Page 241
Collection Field ID Date (ng/L) (ng/L) (ng/L) (ng/L) (ng/L)
CHERRY 7/11/2007 0.063 U 0.063 U 0.063 U 0.064 UJ 0.063 UWIPPLE 7/11/2007 0.061 U 0.061 U 0.061 U 0.061 U 0.061 UHARRISON 7/11/2007 0.063 U 0.063 U 0.063 U 0.063 U 0.063 UPARKER 7/11/2007 0.066 U 0.066 U 0.066 U 0.066 U 0.066 UEUCLID 7/12/2007 0.063 U 0.063 U 0.063 U 0.063 U 0.063 UEUCLID REP 7/12/2007 0.066 U 0.066 U 0.066 U 0.066 U 0.066 UKIONA 7/12/2007 0.063 U 0.063 U 0.063 U 0.063 U 0.063 UNACHES 7/11/2007 0.061 U 0.061 U 0.061 U 0.061 U 0.061 UMOXEE 7/11/2007 0.063 U 0.063 U 0.063 U 0.063 U 0.063 UGRANGER 7/12/2007 0.061 UJ 0.061 UJ 0.061 UJ 0.15 J 0.061 UJSULFUR 7/12/2007 0.064 U 0.064 U 0.064 U 0.16 J 0.064 USPRING 7/12/2007 0.065 U 0.065 U 0.065 U 0.065 U 0.065 UTRNSFR BLNK 7/11/2007 0.061 U 0.061 U 0.061 U 0.061 U 0.061 U
HARRISON 7/24/2007 0.063 U 0.063 U 0.063 U 0.063 U 0.063 UPARKER 7/24/2007 0.062 U 0.062 U 0.062 U 0.062 U 0.062 UEUCLID 7/24/2007 0.065 U 0.065 U 0.065 U 0.065 U 0.065 UKIONA 7/26/2007 0.063 U 0.23 UJ 0.063 U 0.063 U 0.063 UNACHES 7/24/2007 0.063 U 0.063 U 0.063 U 0.07 UJ 0.063 UMOXEE 7/24/2007 0.061 U 0.061 U 0.061 U 0.061 U 0.061 UGRANGER 7/24/2007 0.063 U 0.063 U 0.063 U 0.14 UJ 0.063 USULFUR 7/24/2007 0.073 UJ 0.063 U 0.063 U 0.063 U 0.063 USPRING 7/24/2007 0.063 U 0.063 U 0.063 U 0.063 U 0.063 U
CHERRY 8/8/2007 0.061 U 0.061 U 0.061 U 0.061 U 0.061 UWIPPLE 8/8/2007 0.062 U 0.062 U 0.062 U 0.062 U 0.062 UHARRISON 8/8/2007 0.063 U 0.063 U 0.063 U 0.063 U 0.063 UPARKER 8/9/2007 0.066 U 0.066 U 0.066 U 0.066 U 0.066 UEUCLID 8/9/2007 0.069 UJ 0.062 U 0.062 U 0.062 U 0.062 UKIONA 8/9/2007 0.062 U 0.062 U 0.062 U 0.062 U 0.062 UNACHES 8/8/2007 0.063 U 0.063 U 0.063 U 0.063 U 0.063 UMOXEE 8/8/2007 0.063 U 0.063 U 0.063 U 0.063 U 0.063 UGRANGER 8/9/2007 0.066 U 0.066 U 0.066 U 0.12 0.066 USULFUR REP 8/9/2007 0.062 U 0.062 U 0.062 U 0.07 J 0.062 USPRING 8/9/2007 0.063 U 0.063 U 0.063 U 0.063 U 0.063 U
Endrin Aldehyde
Endrin Ketone Heptachlor
Heptachlor Epoxide
Hexachloro-benzene
U = not detected at or above reported value J = estimated na = not analyzed

Yakima Pesticides/PCBs TMDL: Vol 1, WQ Study Findings Page 242
Collection Field ID Date (ng/L) (mg/L) (mg/L) (NTU) (umhos/cm)
CHERRY 7/11/2007 0.063 U 37 32 16 389WIPPLE 7/11/2007 0.28 UJ 34 31 11 392HARRISON 7/11/2007 0.063 U 17 14 6.7 77.4PARKER 7/11/2007 0.066 U 12 10 5.2 88.7EUCLID 7/12/2007 0.063 U 11 8 5.8 252EUCLID REP 7/12/2007 0.066 U 14 12 6.9 252KIONA 7/12/2007 0.61 UJ 7 6 4.1 273NACHES 7/11/2007 0.061 U 4 3 3.8 82.5MOXEE 7/11/2007 0.13 UJ 61 56 15 230GRANGER 7/12/2007 0.061 U 20 18 12 372SULFUR 7/12/2007 0.064 U 9 8 3.9 361SPRING 7/12/2007 0.065 U 9 7 3.6 368TRNSFR BLNK 7/11/2007 0.061 U 3.1 na na na
HARRISON 7/24/2007 0.063 U 13 11 6.5 87.3PARKER 7/24/2007 0.062 U 10 8 4.7 98.3EUCLID 7/24/2007 0.065 U 14 12 7.6 236KIONA 7/26/2007 0.26 UJ 8 6 4.2 266NACHES 7/24/2007 0.063 U 5 3 3.2 92MOXEE 7/24/2007 0.079 UJ 44 40 13 230GRANGER 7/24/2007 0.063 U 13 12 8.7 391SULFUR 7/24/2007 0.063 U 9 J 7 4.3 321SPRING 7/24/2007 0.063 U 8 6 3.3 331
CHERRY 8/8/2007 0.061 U 47 41 18 343WIPPLE 8/8/2007 0.062 U 49 42 21 350HARRISON 8/8/2007 0.063 U 10 8 4.1 83.7PARKER 8/9/2007 0.066 U 10 8 5.6 97.3EUCLID 8/9/2007 0.062 U 11 9 6.2 240KIONA 8/9/2007 0.25 UJ 7 6 3.5 258NACHES 8/8/2007 0.063 U 5 5 4.8 89.7MOXEE 8/8/2007 0.063 U 34 30 11 232GRANGER 8/9/2007 0.066 U 14 11 8.3 353SULFUR REP 8/9/2007 0.062 U 14 12 7.1 299SPRING 8/9/2007 0.063 U 14 11 6 265
Methoxychlor TSS TurbidityTNVSS Conductivity
U = not detected at or above reported value J = estimated na = not analyzed

Yakima Pesticides/PCBs TMDL: Vol 1, WQ Study Findings Page 243
Collection Flow Sample No. Field ID Date (cfs) (ng/L) (ng/L) (ng/L)
7344082 HARRISON 8/23/2007 1,653 0.064 U 0.064 U 0.064 U7344085 PARKER 8/23/2007 578 0.063 U 0.11 0.063 U7344088 EUCILID 8/23/2007 1,414 0.083 0.54 0.117344090 KIONA 8/23/2007 2,682 0.061 U 0.23 0.0757344083 NACHES 8/22/2007 394 0.063 U 0.21 0.0757344084 MOXEE 8/22/2007 78 0.23 1.3 0.257344086 GRANGER 8/22/2007 42 0.6 2.8 0.317344087 SULFUR 8/22/2007 401 0.58 2.4 0.197344089 SPRING 8/23/2007 36 0.065 U 0.46 0.14
7364080 CHERRY 9/5/2007 422 0.065 0.13 0.061 U7364081 WIPPLE 9/5/2007 203 0.063 0.27 0.062 U7364082 HARRISON 9/5/2007 462 0.061 U 0.061 U 0.061 U7364085 PARKER 9/6/2007 452 0.067 U 0.12 0.067 U7364088 EUCLID 9/6/2007 1,041 0.063 U 0.42 0.117364090 KIONA 9/6/2007 2,421 0.063 U 0.18 0.063 U7364091 KIONA REP 9/6/2007 - - 0.065 U 0.17 0.065 U7364083 NACHES 9/5/2007 1,720 0.061 U 0.16 0.061 U7364084 MOXEE 9/5/2007 54 0.19 1.1 0.27364086 GRANGER 9/6/2007 40 0.28 2 0.297364087 SULFUR 9/6/2007 364 0.16 1.2 0.147364089 SPRING 9/6/2007 71 0.063 U 0.42 0.12
7384082 HARRISON 9/19/2007 520 0.063 U 0.063 U 0.063 U7384085 PARKER 9/19/2007 473 0.063 U 0.15 0.063 U7384088 EUCLID 9/20/2007 1,049 0.061 U 0.45 0.0857384090 KIONA 9/20/2007 2,519 0.063 U 0.18 0.063 U7384083 NACHES 9/19/2007 2,386 0.063 U 0.13 0.063 U7384084 MOXEE 9/19/2007 61 0.23 1.2 0.227384086 GRANGER 9/20/2007 39 0.33 2 0.37384087 SULFUR 9/20/2007 346 0.093 0.87 0.147384089 SPRING 9/20/2007 28 0.063 U 0.4 0.137384092 TRNSFR BLNK 9/19/2007 - - 0.063 U 0.063 U 0.063 U
4,4'-DDT 4,4'-DDE 4,4'-DDD
U = not detected at or above reported value J = estimated na = not analyzed

Yakima Pesticides/PCBs TMDL: Vol 1, WQ Study Findings Page 244
Collection Field ID Date (ng/L) (ng/L) (ng/L) (ng/L) (ng/L)
HARRISON 8/23/2007 0.064 U 0.064 U 0.064 U 0.064 U 0.083 JPARKER 8/23/2007 0.076 J 0.063 U 0.063 U 0.063 U 0.25EUCILID 8/23/2007 0.18 J 2 1 0.3 J 0.99KIONA 8/23/2007 0.15 J 1.5 0.46 0.25 1.3NACHES 8/22/2007 0.063 U 0.071 UJ 0.077 0.063 U 0.22MOXEE 8/22/2007 0.062 U 0.22 J 0.19 0.35 0.9GRANGER 8/22/2007 0.37 0.49 2.9 0.49 1.6SULFUR 8/22/2007 0.65 0.85 4 1.6 2SPRING 8/23/2007 0.15 J 0.38 J 1.1 0.93 9.3
CHERRY 9/5/2007 0.21 0.061 U 0.061 U 0.061 U 0.078WIPPLE 9/5/2007 0.26 0.062 U 0.062 U 0.062 U 0.12HARRISON 9/5/2007 0.061 U 0.061 U 0.061 U 0.061 U 0.066 JPARKER 9/6/2007 0.067 U 0.067 U 0.1 J 0.12 0.14 JEUCLID 9/6/2007 0.14 J 2.5 0.15 0.068 J 0.67KIONA 9/6/2007 0.12 J 1 0.063 U 0.063 U 0.67KIONA REP 9/6/2007 0.19 1.1 0.065 U 0.065 U 0.64NACHES 9/5/2007 0.061 U 0.061 U 0.061 U 0.061 U 0.2 JMOXEE 9/5/2007 0.062 U 0.062 U 0.55 0.35 0.92GRANGER 9/6/2007 0.21 J 0.47 J 0.18 0.16 J 0.96SULFUR 9/6/2007 0.31 J 0.52 J 0.24 0.31 J 0.78SPRING 9/6/2007 0.17 J 0.21 J 0.13 0.23 J 2.4
HARRISON 9/19/2007 0.12 0.063 U 0.063 U 0.063 UJ 0.1 JPARKER 9/19/2007 0.063 U 0.063 U 0.063 U 0.063 UJ 0.28 JEUCLID 9/20/2007 0.11 J 5.1 0.087 U 0.061 UJ 0.46 JKIONA 9/20/2007 0.1 J 2.2 0.068 UJ 0.063 UJ 0.48 JNACHES 9/19/2007 0.063 U 0.063 U 0.063 U 0.063 UJ 0.22 JMOXEE 9/19/2007 0.15 0.2 UJ 0.17 0.31 J 0.58 JGRANGER 9/20/2007 0.12 J 0.08 J 0.086 UJ 0.084 J 0.47 JSULFUR 9/20/2007 0.25 0.31 0.085 UJ 0.1 J 0.43 JSPRING 9/20/2007 0.17 J 0.16 J 0.12 UJ 0.1 J 1.7 JTRNSFR BLNK 9/19/2007 0.063 U 0.063 U 0.063 U 0.063 UJ 0.063 UJ
Dieldrin ChlorpyrifosEndosulfan
I Endosulfan IIEndosulfan
Sulfate
U = not detected at or above reported value J = estimated na = not analyzed

Yakima Pesticides/PCBs TMDL: Vol 1, WQ Study Findings Page 245
Collection Field ID Date (ng/L) (ng/L) (ng/L) (ng/L) (ng/L) (ng/L)
HARRISON 8/23/2007 3.2 U 0.064 U 0.064 U 0.064 U 0.064 U 0.064 UPARKER 8/23/2007 3.2 U 0.063 U 0.063 U 0.063 U 0.063 U 0.063 UEUCILID 8/23/2007 3.2 U 0.063 U 0.063 U 0.063 U 0.063 U 0.063 UKIONA 8/23/2007 3.0 U 0.061 U 0.061 U 0.061 U 0.061 U 0.061 UNACHES 8/22/2007 3.2 U 0.063 U 0.063 U 0.063 U 0.063 U 0.063 UMOXEE 8/22/2007 3.1 U 0.062 U 0.062 U 0.062 U 0.062 U 0.062 UGRANGER 8/22/2007 3.1 U 0.063 U 0.063 U 0.063 U 0.063 U 0.063 USULFUR 8/22/2007 3.2 U 0.063 U 0.063 U 0.063 U 0.063 U 0.063 USPRING 8/23/2007 3.2 U 0.065 U 0.065 U 0.065 U 0.065 U 0.065 U
CHERRY 9/5/2007 3.1 U 0.061 U 0.061 U 0.061 U 0.061 U 0.061 UWIPPLE 9/5/2007 3.1 U 0.062 U 0.062 U 0.062 U 0.062 U 0.062 UHARRISON 9/5/2007 3 U 0.061 U 0.061 U 0.061 U 0.061 U 0.061 UPARKER 9/6/2007 3.3 U 0.067 U 0.067 U 0.067 U 0.067 U 0.067 UEUCLID 9/6/2007 3.1 U 0.063 U 0.063 U 0.063 U 0.063 U 0.063 UKIONA 9/6/2007 3.1 U 0.063 U 0.063 U 0.063 U 0.063 U 0.063 UKIONA REP 9/6/2007 3.3 U 0.065 U 0.065 U 0.065 U 0.065 U 0.065 UNACHES 9/5/2007 3 U 0.061 U 0.061 U 0.061 U 0.061 U 0.061 UMOXEE 9/5/2007 3.1 U 0.062 U 0.062 U 0.062 U 0.062 U 0.062 UGRANGER 9/6/2007 3.1 U 0.063 U 0.063 U 0.063 U 0.063 U 0.063 USULFUR 9/6/2007 3.1 U 0.063 U 0.063 U 0.063 U 0.063 U 0.063 USPRING 9/6/2007 3.2 U 0.063 U 0.063 U 0.063 U 0.063 U 0.063 U
HARRISON 9/19/2007 3.2 U 0.063 U 0.063 U 0.063 U 0.063 UJ 0.063 UPARKER 9/19/2007 3.1 U 0.063 U 0.063 U 0.063 U 0.063 UJ 0.063 UEUCLID 9/20/2007 3.1 U 0.061 U 0.061 U 0.061 U 0.061 UJ 0.061 UKIONA 9/20/2007 3.2 U 0.063 U 0.063 U 0.063 U 0.063 UJ 0.063 UNACHES 9/19/2007 3.1 U 0.063 U 0.063 U 0.063 U 0.063 UJ 0.063 UMOXEE 9/19/2007 3.1 U 0.062 U 0.062 U 0.062 U 0.062 UJ 0.062 UGRANGER 9/20/2007 3.1 U 0.062 U 0.062 U 0.062 U 0.062 UJ 0.062 USULFUR 9/20/2007 3.1 U 0.061 U 0.061 U 0.061 U 0.061 UJ 0.061 USPRING 9/20/2007 3.1 U 0.063 U 0.063 U 0.063 U 0.063 UJ 0.081TRNSFR BLNK 9/19/2007 3.2 U 0.063 U 0.063 U 0.063 U 0.063 UJ 0.063 U
Cis-Chlordane
Cis-Nonachlor
Trans-Chlordane
Trans-NonachlorToxaphene
Oxy-chlordane
U = not detected at or above reported value J = estimated na = not analyzed
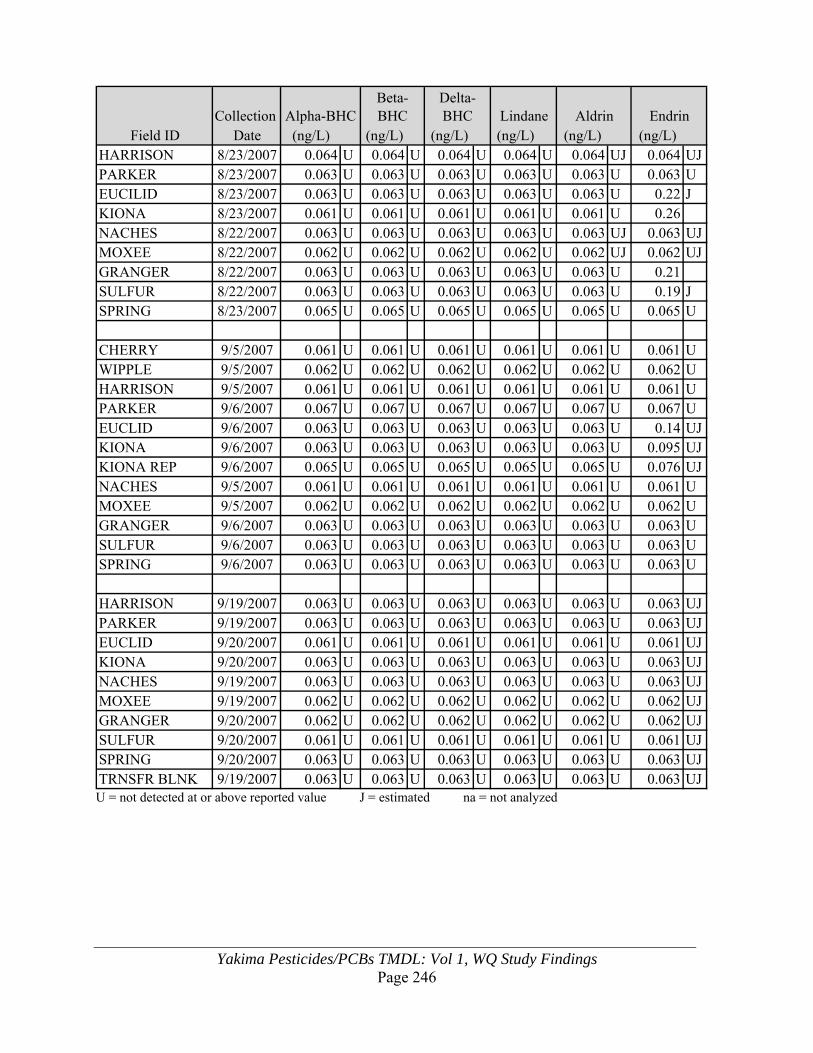
Yakima Pesticides/PCBs TMDL: Vol 1, WQ Study Findings Page 246
Collection Field ID Date (ng/L) (ng/L) (ng/L) (ng/L) (ng/L) (ng/L)
HARRISON 8/23/2007 0.064 U 0.064 U 0.064 U 0.064 U 0.064 UJ 0.064 UJPARKER 8/23/2007 0.063 U 0.063 U 0.063 U 0.063 U 0.063 U 0.063 UEUCILID 8/23/2007 0.063 U 0.063 U 0.063 U 0.063 U 0.063 U 0.22 JKIONA 8/23/2007 0.061 U 0.061 U 0.061 U 0.061 U 0.061 U 0.26NACHES 8/22/2007 0.063 U 0.063 U 0.063 U 0.063 U 0.063 UJ 0.063 UJMOXEE 8/22/2007 0.062 U 0.062 U 0.062 U 0.062 U 0.062 UJ 0.062 UJGRANGER 8/22/2007 0.063 U 0.063 U 0.063 U 0.063 U 0.063 U 0.21SULFUR 8/22/2007 0.063 U 0.063 U 0.063 U 0.063 U 0.063 U 0.19 JSPRING 8/23/2007 0.065 U 0.065 U 0.065 U 0.065 U 0.065 U 0.065 U
CHERRY 9/5/2007 0.061 U 0.061 U 0.061 U 0.061 U 0.061 U 0.061 UWIPPLE 9/5/2007 0.062 U 0.062 U 0.062 U 0.062 U 0.062 U 0.062 UHARRISON 9/5/2007 0.061 U 0.061 U 0.061 U 0.061 U 0.061 U 0.061 UPARKER 9/6/2007 0.067 U 0.067 U 0.067 U 0.067 U 0.067 U 0.067 UEUCLID 9/6/2007 0.063 U 0.063 U 0.063 U 0.063 U 0.063 U 0.14 UJKIONA 9/6/2007 0.063 U 0.063 U 0.063 U 0.063 U 0.063 U 0.095 UJKIONA REP 9/6/2007 0.065 U 0.065 U 0.065 U 0.065 U 0.065 U 0.076 UJNACHES 9/5/2007 0.061 U 0.061 U 0.061 U 0.061 U 0.061 U 0.061 UMOXEE 9/5/2007 0.062 U 0.062 U 0.062 U 0.062 U 0.062 U 0.062 UGRANGER 9/6/2007 0.063 U 0.063 U 0.063 U 0.063 U 0.063 U 0.063 USULFUR 9/6/2007 0.063 U 0.063 U 0.063 U 0.063 U 0.063 U 0.063 USPRING 9/6/2007 0.063 U 0.063 U 0.063 U 0.063 U 0.063 U 0.063 U
HARRISON 9/19/2007 0.063 U 0.063 U 0.063 U 0.063 U 0.063 U 0.063 UJPARKER 9/19/2007 0.063 U 0.063 U 0.063 U 0.063 U 0.063 U 0.063 UJEUCLID 9/20/2007 0.061 U 0.061 U 0.061 U 0.061 U 0.061 U 0.061 UJKIONA 9/20/2007 0.063 U 0.063 U 0.063 U 0.063 U 0.063 U 0.063 UJNACHES 9/19/2007 0.063 U 0.063 U 0.063 U 0.063 U 0.063 U 0.063 UJMOXEE 9/19/2007 0.062 U 0.062 U 0.062 U 0.062 U 0.062 U 0.062 UJGRANGER 9/20/2007 0.062 U 0.062 U 0.062 U 0.062 U 0.062 U 0.062 UJSULFUR 9/20/2007 0.061 U 0.061 U 0.061 U 0.061 U 0.061 U 0.061 UJSPRING 9/20/2007 0.063 U 0.063 U 0.063 U 0.063 U 0.063 U 0.063 UJTRNSFR BLNK 9/19/2007 0.063 U 0.063 U 0.063 U 0.063 U 0.063 U 0.063 UJ
Alpha-BHCBeta-BHC
Delta-BHC Lindane Aldrin Endrin
U = not detected at or above reported value J = estimated na = not analyzed

Yakima Pesticides/PCBs TMDL: Vol 1, WQ Study Findings Page 247
Collection Field ID Date (ng/L) (ng/L) (ng/L) (ng/L) (ng/L)
HARRISON 8/23/2007 0.064 U 0.064 U 0.064 U 0.064 UJ 0.064 UPARKER 8/23/2007 0.063 U 0.063 U 0.063 U 0.063 U 0.063 UEUCILID 8/23/2007 0.063 U 0.063 U 0.063 U 0.063 U 0.063 UKIONA 8/23/2007 0.061 U 0.091 UJ 0.061 U 0.061 U 0.061 UNACHES 8/22/2007 0.063 U 0.063 U 0.063 U 0.12 UJ 0.063 UMOXEE 8/22/2007 0.062 U 0.062 U 0.062 U 0.062 UJ 0.062 UGRANGER 8/22/2007 0.063 U 0.063 U 0.063 U 0.095 0.063 USULFUR 8/22/2007 0.14 UJ 0.063 U 0.063 U 0.063 U 0.063 USPRING 8/23/2007 0.065 U 0.065 U 0.065 U 0.065 U 0.065 U
CHERRY 9/5/2007 0.061 U 0.061 U 0.061 U 0.061 U 0.061 UWIPPLE 9/5/2007 0.062 U 0.062 U 0.062 U 0.062 U 0.062 UHARRISON 9/5/2007 0.061 U 0.061 U 0.061 U 0.061 U 0.061 UPARKER 9/6/2007 0.085 UJ 0.067 U 0.067 U 0.067 U 0.067 UEUCLID 9/6/2007 0.063 U 0.063 U 0.063 U 0.063 U 0.063 UKIONA 9/6/2007 0.063 U 0.091 UJ 0.063 U 0.063 U 0.063 UKIONA REP 9/6/2007 0.22 UJ 0.31 UJ 0.065 U 0.065 U 0.065 UNACHES 9/5/2007 0.061 U 0.061 U 0.061 U 0.061 U 0.061 UMOXEE 9/5/2007 0.073 UJ 0.062 U 0.062 U 0.062 U 0.062 UGRANGER 9/6/2007 0.063 U 0.063 U 0.063 U 0.063 U 0.063 USULFUR 9/6/2007 0.077 UJ 0.063 U 0.063 U 0.074 UJ 0.063 USPRING 9/6/2007 0.08 UJ 0.063 U 0.063 U 0.063 U 0.063 U
HARRISON 9/19/2007 0.063 U 0.063 U 0.063 U 0.063 U 0.063 UPARKER 9/19/2007 0.063 U 0.063 U 0.063 U 0.063 U 0.063 UEUCLID 9/20/2007 0.061 U 0.061 U 0.061 U 0.061 U 0.061 UKIONA 9/20/2007 0.063 U 0.063 U 0.063 U 0.063 U 0.063 UNACHES 9/19/2007 0.063 U 0.063 U 0.063 U 0.063 U 0.063 UMOXEE 9/19/2007 0.31 UJ 0.062 U 0.062 U 0.062 U 0.062 UGRANGER 9/20/2007 0.062 U 0.062 U 0.062 U 0.08 0.062 USULFUR 9/20/2007 0.061 U 0.061 U 0.061 U 0.061 U 0.061 USPRING 9/20/2007 0.063 U 0.063 U 0.063 U 0.063 U 0.063 UTRNSFR BLNK 9/19/2007 0.063 U 0.063 U 0.063 U 0.063 U 0.063 U
Endrin Aldehyde
Endrin Ketone Heptachlor
Heptachlor Epoxide
Hexachloro-benzene
U = not detected at or above reported value J = estimated na = not analyzed

Yakima Pesticides/PCBs TMDL: Vol 1, WQ Study Findings Page 248
Collection ConductivityField ID Date (ng/L) (mg/L) (mg/L) (NTU) (umhos/cm)
HARRISON 8/23/2007 0.18 UJ 8 6 4.4 95.3PARKER 8/23/2007 0.063 U 8 6 4 107EUCILID 8/23/2007 0.063 U 14 11 7.4 214KIONA 8/23/2007 0.061 U 11 9 5 239NACHES 8/22/2007 0.37 UJ 6 4 4.3 88.4MOXEE 8/22/2007 0.062 UJ 56 51 16 217GRANGER 8/22/2007 0.063 U 17 15 7.6 425SULFUR 8/22/2007 0.063 U 38 35 16 270SPRING 8/23/2007 0.28 UJ 10 8 5.2 309
CHERRY 9/5/2007 0.061 U 24 21 10 284WIPPLE 9/5/2007 0.062 U 28 24 13 196HARRISON 9/5/2007 0.061 U 2 1 1.7 115PARKER 9/6/2007 0.46 UJ 10 8 5.1 111EUCLID 9/6/2007 0.063 U 11 9 5 255KIONA 9/6/2007 0.063 U 6 5 2.8 274KIONA REP 9/6/2007 0.065 U 7 6 2.9 274NACHES 9/5/2007 0.061 U 14 12 11 79.3MOXEE 9/5/2007 0.2 UJ 36 33 11 265GRANGER 9/6/2007 0.063 U 11 10 5.2 396SULFUR 9/6/2007 0.12 UJ 17 15 7.7 316SPRING 9/6/2007 0.063 U 14 12 3.8 288
HARRISON 9/19/2007 0.063 UJ 4 3 2.4 145PARKER 9/19/2007 0.063 UJ 13 11 11 112EUCLID 9/20/2007 0.061 UJ 10 8 6 252KIONA 9/20/2007 0.19 UJ 5 4 2.8 278NACHES 9/19/2007 0.063 UJ 14 12 12 79.6MOXEE 9/19/2007 0.062 UJ 41 37 16 280GRANGER 9/20/2007 0.062 UJ 20 18 11 374SULFUR 9/20/2007 0.061 UJ 21 19 9.2 300SPRING 9/20/2007 0.063 UJ 6 5 2.9 376TRNSFR BLNK 9/19/2007 0.063 UJ na na na na
Methoxychlor TSS TNVSS Turbidity
U = not detected at or above reported value J = estimated na = not analyzed

Yakima Pesticides/PCBs TMDL: Vol 1, WQ Study Findings Page 249
Collection Flow 4,4'-DDT 4,4'-DDE 4,4'-DDDSample No. Field ID Date (cfs) (ng/L) (ng/L) (ng/L)
7404080 CHERRY 10/3/2007 516 0.064 U 0.36 J 0.064 U7404081 WIPPLE 10/3/2007 204 0.093 J 0.55 J 0.063 U7404082 HARRISON 10/3/2007 486 0.063 U 0.063 UJ 0.063 U7404085 PARKER 10/3/2007 716 0.061 U 0.18 J 0.061 U7404088 EUCLID 10/4/2007 1,359 0.065 U 0.77 J 0.127404090 KIONA 10/4/2007 2,943 0.061 U 0.39 J 0.0927404083 NACHES 10/3/2007 1,172 0.069 UJ 0.31 J 0.078 UJ7404084 MOXEE 10/3/2007 67 0.28 1.5 J 0.257404086 GRANGER 10/4/2007 42 0.23 3.2 J 0.387404091 GRANGER REP 10/4/2007 - - 0.29 3.6 J 0.467404087 SULFUR 10/4/2007 413 0.092 J 1.3 J 0.187404089 SPRING 10/4/2007 77 0.37 0.95 J 0.26
7454082 HARRISON 11/8/2007 848 0.063 U 0.063 U 0.063 U7454085 PARKER 11/8/2007 1,373 0.063 U 0.068 0.063 U7454091 PARKER REP 11/8/2007 - - 0.063 U 0.066 0.063 U7454088 EUCLID 11/8/2007 1,430 0.063 U 0.19 0.063 U7454090 KIONA 11/8/2007 2,702 0.067 U 0.18 0.067 U7454083 NACHES 11/8/2007 456 0.064 U 0.081 0.064 U7454084 MOXEE 11/8/2007 15 0.064 U 0.081 0.064 U7454086 GRANGER 11/8/2007 22 0.12 J 1.9 0.317454087 SULFUR 11/8/2007 101 0.062 U 1.2 0.237454089 SPRING 11/8/2007 12 0.062 U 0.39 0.12
7494082 HARRISON 12/4/2007 794 0.065 U 0.065 U 0.065 U7494091 HARRISON REP 12/4/2007 - - 0.065 U 0.065 U 0.065 U7494085 PARKER 12/4/2007 5,500 0.1 0.32 0.0837494088 EUCLID 12/5/2007 3,724 0.12 J 0.75 J 0.15 J7494090 KIONA 12/5/2007 3,865 0.22 1.3 0.227494083 NACHES 12/4/2007 5,447 0.13 J 0.27 J 0.07 J7494084 MOXEE 12/4/2007 16 0.078 0.43 0.127494086 GRANGER 12/5/2007 22 0.13 2.8 0.437494087 SULFUR 12/5/2007 70 0.074 1.8 0.367494089 SPRING 12/5/2007 8 0.065 U 0.3 0.11
U = not detected at or above reported value J = estimated na = not analyzed

Yakima Pesticides/PCBs TMDL: Vol 1, WQ Study Findings Page 250
Collection DieldrinField ID Date (ng/L) (ng/L) (ng/L) (ng/L) (ng/L)
CHERRY 10/3/2007 0.29 28 0.064 U 0.064 U 0.064 UWIPPLE 10/3/2007 0.37 1.5 0.063 U 0.13 UJ 0.12HARRISON 10/3/2007 0.11 4 0.063 U 0.063 U 0.12 JPARKER 10/3/2007 0.061 U 1.3 J 0.061 U 0.061 U 0.21EUCLID 10/4/2007 0.066 UJ 15 0.065 U 0.065 U 0.35KIONA 10/4/2007 0.07 J 9.5 0.061 U 0.061 U 0.39NACHES 10/3/2007 0.062 U 0.062 U 0.087 J 0.062 U 0.15MOXEE 10/3/2007 0.061 J 1.5 0.14 0.83 0.52GRANGER 10/4/2007 0.14 J 0.47 J 0.061 U 0.061 U 0.41GRANGER REP 10/4/2007 0.14 J 0.45 J 0.063 U 0.063 U 0.41SULFUR 10/4/2007 0.2 J 1.3 0.063 U 0.085 J 0.4SPRING 10/4/2007 0.14 J 1.1 0.11 J 0.16 J 1
HARRISON 11/8/2007 0.063 U 0.063 U 0.063 U 0.063 U 0.089 JPARKER 11/8/2007 0.063 U 0.11 UJ 0.063 U 0.1 0.16 JPARKER REP 11/8/2007 0.063 U 0.12 UJ 0.063 U 0.11 J 0.15EUCLID 11/8/2007 0.063 U 0.41 J 0.063 U 0.089 J 0.16KIONA 11/8/2007 0.067 U 0.37 J 0.067 U 0.073 J 0.19NACHES 11/8/2007 0.064 U 0.064 U 0.064 U 0.064 U 0.079MOXEE 11/8/2007 0.064 U 0.064 U 0.064 U 0.064 U 0.079GRANGER 11/8/2007 0.082 J 0.27 0.062 U 0.062 U 0.24SULFUR 11/8/2007 0.32 J 0.062 U 0.11 0.094 J 0.6SPRING 11/8/2007 0.19 0.062 U 0.062 U 0.062 U 0.64
HARRISON 12/4/2007 0.065 U 0.065 U 0.065 U 0.065 U 0.065 UHARRISON REP 12/4/2007 0.065 U 0.065 U 0.065 U 0.065 U 0.089PARKER 12/4/2007 0.063 U 0.063 U 0.063 U 0.08 0.36 JEUCLID 12/5/2007 0.063 U 0.36 J 0.063 U 0.11 0.41KIONA 12/5/2007 0.084 0.71 J 0.078 0.13 0.48NACHES 12/4/2007 0.063 U 0.063 U 0.063 U 0.085 0.26 JMOXEE 12/4/2007 0.064 0.32 0.15 0.43 0.94GRANGER 12/5/2007 0.13 0.065 U 0.065 U 0.065 U 0.29SULFUR 12/5/2007 0.37 0.07 0.063 U 0.14 0.44SPRING 12/5/2007 0.16 0.065 U 0.065 U 0.065 U 0.9
Endosulfan I
Endosulfan II
Endosulfan SulfateChlorpyrifos
U = not detected at or above reported value. J = estimated. na = not analyzed.

Yakima Pesticides/PCBs TMDL: Vol 1, WQ Study Findings Page 251
Collection Field ID Date (ng/L) (ng/L) (ng/L) (ng/L) (ng/L) (ng/L)
CHERRY 10/3/2007 3.2 U 0.064 U 0.064 U 0.064 U 0.064 U 0.064 UWIPPLE 10/3/2007 3.1 U 0.063 U 0.063 U 0.063 U 0.063 U 0.063 UHARRISON 10/3/2007 3.2 U 0.063 U 0.063 U 0.063 U 0.063 U 0.063 UPARKER 10/3/2007 3 U 0.061 U 0.061 U 0.061 U 0.061 U 0.061 UEUCLID 10/4/2007 3.2 U 0.065 U 0.065 U 0.065 U 0.065 U 0.065 UKIONA 10/4/2007 3 U 0.061 U 0.061 U 0.061 U 0.061 U 0.061 UNACHES 10/3/2007 3.1 U 0.062 U 0.062 U 0.062 U 0.062 U 0.062 UMOXEE 10/3/2007 3 U 0.061 U 0.061 U 0.061 U 0.061 U 0.061 UGRANGER 10/4/2007 3 U 0.061 U 0.061 U 0.061 U 0.061 U 0.061 UGRANGER REP 10/4/2007 3.1 U 0.063 U 0.063 U 0.063 U 0.063 U 0.063 USULFUR 10/4/2007 3.1 U 0.063 U 0.063 U 0.063 U 0.063 U 0.063 USPRING 10/4/2007 3.1 U 0.063 U 0.063 U 0.063 U 0.063 U 0.063 U
HARRISON 11/8/2007 3.2 U 0.063 U 0.063 U 0.063 U 0.063 U 0.063 UPARKER 11/8/2007 3.1 U 0.063 U 0.063 U 0.063 U 0.063 U 0.063 UPARKER REP 11/8/2007 3.1 U 0.063 U 0.063 U 0.063 U 0.063 U 0.063 UEUCLID 11/8/2007 3.1 U 0.063 U 0.063 U 0.063 U 0.063 U 0.063 UKIONA 11/8/2007 3.3 U 0.067 U 0.067 U 0.067 U 0.067 U 0.067 UNACHES 11/8/2007 3.2 U 0.064 U 0.064 U 0.064 U 0.064 U 0.064 UMOXEE 11/8/2007 3.2 U 0.064 U 0.064 U 0.064 U 0.064 U 0.064 UGRANGER 11/8/2007 3.1 U 0.062 U 0.062 U 0.062 U 0.062 U 0.062 USULFUR 11/8/2007 3.1 U 0.062 U 0.062 U 0.062 U 0.062 U 0.062 USPRING 11/8/2007 3.1 U 0.062 U 0.062 U 0.062 U 0.062 U 0.062 U
HARRISON 12/4/2007 3.3 U 0.065 U 0.065 U 0.065 U 0.065 U 0.065 UHARRISON REP 12/4/2007 3.3 U 0.065 U 0.065 U 0.065 U 0.065 U 0.065 UPARKER 12/4/2007 3.1 U 0.063 U 0.063 U 0.063 U 0.063 U 0.063 UEUCLID 12/5/2007 3.1 UJ 0.063 UJ 0.063 UJ 0.063 UJ 0.063 UJ 0.063 UJKIONA 12/5/2007 3.1 U 0.062 U 0.062 U 0.062 U 0.062 U 0.062 UNACHES 12/4/2007 3.1 UJ 0.063 UJ 0.063 UJ 0.063 UJ 0.063 UJ 0.063 UJMOXEE 12/4/2007 3.1 U 0.062 U 0.062 U 0.062 U 0.062 U 0.062 UGRANGER 12/5/2007 3.3 U 0.065 U 0.065 U 0.065 U 0.065 U 0.065 USULFUR 12/5/2007 3.1 U 0.063 U 0.063 U 0.063 U 0.063 U 0.063 USPRING 12/5/2007 3.2 U 0.065 U 0.065 U 0.065 U 0.065 U 0.065 U
ToxapheneCis-
Chlordane Cis-
NonachlorTrans-
Chlordane Trans-
NonachlorOxy-
chlordane
U = not detected at or above reported value. J = estimated. na = not analyzed.

Yakima Pesticides/PCBs TMDL: Vol 1, WQ Study Findings Page 252
Collection Field ID Date (ng/L) (ng/L) (ng/L) (ng/L) (ng/L) (ng/L)
CHERRY 10/3/2007 0.064 U 0.064 U 0.064 UJ 0.064 U 0.08 UJ 0.064 UWIPPLE 10/3/2007 0.063 U 0.063 U 0.063 UJ 0.063 U 0.063 U 0.063 UHARRISON 10/3/2007 0.063 U 0.063 U 0.063 UJ 0.063 U 0.063 U 0.063 UPARKER 10/3/2007 0.061 U 0.061 U 0.061 UJ 0.061 U 0.061 U 0.061 UEUCLID 10/4/2007 0.065 U 0.065 U 0.065 UJ 0.065 U 0.065 U 0.065 UKIONA 10/4/2007 0.061 U 0.061 U 0.061 UJ 0.061 U 0.061 U 0.18 UJNACHES 10/3/2007 0.062 U 0.062 U 0.062 UJ 0.069 UJ 0.062 U 0.062 UMOXEE 10/3/2007 0.061 U 0.061 U 0.061 UJ 0.061 U 0.061 U 0.061 UGRANGER 10/4/2007 0.061 U 0.061 U 0.061 UJ 0.061 U 0.061 U 0.061 UGRANGER REP 10/4/2007 0.063 U 0.063 U 0.063 UJ 0.063 U 0.063 U 0.063 USULFUR 10/4/2007 0.063 U 0.063 U 0.063 UJ 0.063 U 0.063 U 0.095 UJSPRING 10/4/2007 0.063 U 0.063 U 0.063 UJ 0.063 U 0.063 U 0.071 UJ
HARRISON 11/8/2007 0.063 U 0.063 U 0.063 UJ 0.063 U 0.063 U 0.063 UPARKER 11/8/2007 0.063 U 0.063 U 0.063 UJ 0.063 U 0.063 U 0.063 UPARKER REP 11/8/2007 0.063 U 0.53 UJ 0.063 UJ 0.063 U 0.063 U 0.063 UEUCLID 11/8/2007 0.063 U 0.09 UJ 0.063 UJ 0.063 U 0.063 U 0.063 UKIONA 11/8/2007 0.067 U 0.067 U 0.067 UJ 0.067 U 0.067 U 0.067 UNACHES 11/8/2007 0.064 U 0.064 U 0.064 UJ 0.064 U 0.064 U 0.064 UMOXEE 11/8/2007 0.064 U 0.064 U 0.064 UJ 0.064 U 0.064 U 0.064 UGRANGER 11/8/2007 0.062 U 0.064 UJ 0.062 UJ 0.062 U 0.062 U 0.062 USULFUR 11/8/2007 0.062 U 0.062 U 0.062 UJ 0.062 U 0.062 U 0.062 USPRING 11/8/2007 0.062 U 0.062 U 0.062 UJ 0.062 U 0.062 U 0.062 U
HARRISON 12/4/2007 0.065 U 0.21 UJ 0.065 U 0.065 U 0.065 UJ 0.065 UHARRISON REP 12/4/2007 0.065 U 0.15 UJ 0.065 U 0.065 U 0.065 UJ 0.065 UPARKER 12/4/2007 0.063 U 0.063 U 0.063 U 0.063 U 0.063 UJ 0.063 UEUCLID 12/5/2007 0.063 UJ 0.075 UJ 0.063 UJ 0.063 UJ 0.063 UJ 0.063 UKIONA 12/5/2007 0.062 U 0.094 UJ 0.062 U 0.062 U 0.062 UJ 0.062 UNACHES 12/4/2007 0.063 UJ 0.091 UJ 0.063 UJ 0.063 UJ 0.063 UJ 0.063 UMOXEE 12/4/2007 0.062 U 0.11 UJ 0.062 U 0.062 U 0.062 UJ 0.067 UJGRANGER 12/5/2007 0.065 U 0.12 UJ 0.065 U 0.065 U 0.065 UJ 0.091 UJSULFUR 12/5/2007 0.063 U 0.09 UJ 0.063 U 0.063 U 0.063 UJ 0.083 UJSPRING 12/5/2007 0.065 U 0.065 U 0.065 U 0.065 U 0.065 UJ 0.065 U
Alpha-BHC Beta-BHCDelta-BHC Lindane Aldrin Endrin
U = not detected at or above reported value. J = estimated. na = not analyzed.

Yakima Pesticides/PCBs TMDL: Vol 1, WQ Study Findings Page 253
Collection Field ID Date (ng/L) (ng/L) (ng/L) (ng/L) (ng/L)
CHERRY 10/3/2007 0.11 UJ 0.064 U 0.064 U 0.064 U 0.064 UWIPPLE 10/3/2007 0.063 U 0.063 U 0.063 U 0.063 U 0.063 UHARRISON 10/3/2007 0.063 U 0.063 U 0.063 U 0.063 U 0.063 UPARKER 10/3/2007 0.061 U 0.061 U 0.061 U 0.061 U 0.061 UEUCLID 10/4/2007 0.065 U 0.065 U 0.065 U 0.065 U 0.065 UKIONA 10/4/2007 0.061 U 0.061 U 0.061 U 0.061 U 0.061 UNACHES 10/3/2007 0.062 U 0.062 U 0.062 U 0.062 U 0.062 UMOXEE 10/3/2007 1.1 UJ 0.061 U 0.061 U 0.061 U 0.061 UGRANGER 10/4/2007 0.061 U 0.061 U 0.061 U 0.061 U 0.061 UGRANGER REP 10/4/2007 0.063 U 0.063 U 0.063 U 0.063 U 0.063 USULFUR 10/4/2007 0.063 U 0.063 U 0.063 U 0.063 U 0.063 USPRING 10/4/2007 0.063 U 0.063 U 0.063 U 0.063 U 0.063 U
HARRISON 11/8/2007 0.11 UJ 0.063 U 0.063 U 0.063 U 0.063 UPARKER 11/8/2007 0.13 UJ 0.063 U 0.063 U 0.063 U 0.063 UPARKER REP 11/8/2007 0.13 UJ 0.063 U 0.063 U 0.063 U 0.063 UEUCLID 11/8/2007 0.07 UJ 0.063 U 0.063 U 0.063 U 0.063 UKIONA 11/8/2007 0.15 UJ 0.067 U 0.067 U 0.067 U 0.067 UNACHES 11/8/2007 0.074 UJ 0.064 U 0.064 U 0.064 U 0.064 UMOXEE 11/8/2007 0.074 UJ 0.064 U 0.064 U 0.064 U 0.064 UGRANGER 11/8/2007 0.064 UJ 0.062 U 0.062 U 0.062 U 0.062 USULFUR 11/8/2007 0.19 UJ 0.062 U 0.062 U 0.062 U 0.062 USPRING 11/8/2007 0.062 U 0.062 U 0.062 U 0.062 U 0.062 U
HARRISON 12/4/2007 0.065 UJ 0.065 U 0.065 U 0.065 U 0.16 UHARRISON REP 12/4/2007 0.065 UJ 0.065 U 0.065 U 0.065 U 0.16 UPARKER 12/4/2007 0.084 UJ 0.063 U 0.063 U 0.063 U 0.21 JEUCLID 12/5/2007 0.063 UJ 0.063 U 0.063 UJ 0.063 U 0.16 UJKIONA 12/5/2007 0.062 UJ 0.062 U 0.062 U 0.062 U 0.16 UNACHES 12/4/2007 0.15 UJ 0.077 UJ 0.063 UJ 0.063 U 0.16 UJMOXEE 12/4/2007 0.062 UJ 0.062 U 0.062 U 0.062 U 0.16 UGRANGER 12/5/2007 0.065 UJ 0.065 U 0.065 U 0.065 U 0.16 USULFUR 12/5/2007 0.063 UJ 0.063 U 0.063 U 0.063 U 0.16 USPRING 12/5/2007 0.065 UJ 0.065 U 0.065 U 0.065 U 0.16 U
Endrin Aldehyde
Endrin Ketone Heptachlor
Heptachlor Epoxide
Hexachloro-benzene
U = not detected at or above reported value. J = estimated. na = not analyzed.

Yakima Pesticides/PCBs TMDL: Vol 1, WQ Study Findings Page 254
Collection ConductivityField ID Date (ng/L) (mg/L) (mg/L) (NTU) (umhos/cm)
CHERRY 10/3/2007 0.064 U 36 32 12 287WIPPLE 10/3/2007 0.063 U 33 30 12 222HARRISON 10/3/2007 0.063 U 5 4 3.8 156PARKER 10/3/2007 0.061 U 8 7 5.3 140EUCLID 10/4/2007 0.065 U 10 9 6.5 294KIONA 10/4/2007 0.095 UJ 5 4 3.7 247NACHES 10/3/2007 0.11 UJ 6 5 9.8 88.1MOXEE 10/3/2007 0.36 UJ 34 31 12 304GRANGER 10/4/2007 0.061 U 28 24 12 399GRANGER REP 10/4/2007 0.063 U 26 23 12 403SULFUR 10/4/2007 0.063 U 21 19 7.4 J 287SPRING 10/4/2007 0.063 U 11 9 5 295
HARRISON 11/8/2007 0.063 U 8 6 3.3 152PARKER 11/8/2007 0.063 U 4 3 1.6 157PARKER REP 11/8/2007 0.063 U 3 2 1.7 157EUCLID 11/8/2007 0.063 U 8 7 4.1 247KIONA 11/8/2007 0.067 U 4 3 2.5 267NACHES 11/8/2007 0.39 UJ 2 1 0.9 103MOXEE 11/8/2007 0.39 UJ 2 1 0.9 103GRANGER 11/8/2007 0.062 U 36 28 16 656SULFUR 11/8/2007 0.062 U 12 9 7.2 750SPRING 11/8/2007 0.062 U 5 4 2.4 598
HARRISON 12/4/2007 0.065 U 6 4 3.5 177HARRISON REP 12/4/2007 0.42 UJ 6 5 3.6 178PARKER 12/4/2007 0.063 U 164 143 120 101EUCLID 12/5/2007 0.063 U 342 313 150 124KIONA 12/5/2007 0.062 U 199 176 130 145NACHES 12/4/2007 0.063 U 229 201 160 61.4MOXEE 12/4/2007 0.062 U 4 2 6.6 758GRANGER 12/5/2007 0.065 U 84 78 24 740SULFUR 12/5/2007 0.063 U 40 33 19 750SPRING 12/5/2007 0.065 U 3 2 1.3 665
Methoxychlor TSS TNVSS Turbidity
U = not detected at or above reported value. J = estimated. na = not analyzed.

Yakima Pesticides/PCBs TMDL: Vol 1, WQ Study Findings Page 255
Collection Flow 4,4'-DDT 4,4'-DDE 4,4'-DDDSample No. Field ID Date (cfs) (ng/L) (ng/L) (ng/L)
8024682 HARRISON 1/9/2008 433 0.063 U 0.063 U 0.063 U8024683 NACHES 1/9/2008 883 0.062 U 0.062 U 0.062 U8024691 NACHES REP 1/9/2008 - - 0.062 U 0.062 U 0.062 U8024684 MOXEE 1/9/2008 13 0.072 0.39 0.128024685 PARKER 1/9/2008 1,536 0.064 U 0.064 U 0.064 U8024686 GRANGER 1/10/2008 18 44 5.5 0.898024687 SULFUR 1/10/2008 64 0.11 2.5 0.458024688 EUCLID 1/10/2008 1,788 0.061 U 0.18 J 0.061 U8024689 SPRING 1/10/2008 8 0.061 U 0.33 0.0898024690 KIONA 1/10/2008 2,497 0.061 U 0.14 0.061 U8024692 TRNSFR BLNK 1/9/2008 - - 0.062 U 0.062 U 0.062 U
8064082 HARRISON 2/5/2008 793 0.061 U 0.061 U 0.061 U8064083 NACHES 2/5/2008 872 0.063 U 0.063 U 0.063 U8064084 MOXEE 2/5/2008 13 0.061 UJ 0.27 J 0.2 J8064091 MOXEE REP 2/5/2008 - - 0.061 U 0.28 0.158064085 PARKER 2/5/2008 1,472 0.063 UJ 0.073 J 0.063 UJ8064086 GRANGER 2/6/2008 28 0.17 J 1 J 0.18 J8064087 SULFUR 2/6/2008 73 0.33 J 1.8 J 0.42 J8064088 EUCLID 2/6/2008 1,652 0.19 0.69 0.118064089 SPRING 2/6/2008 9 0.063 U 0.49 0.148064090 KIONA 2/6/2008 2,255 0.063 U 0.14 0.063 U
8104082 HARRISON 3/4/2008 679 0.061 U 0.061 U 0.061 U8104083 NACHES 3/4/2008 1,113 0.061 U 0.064 0.061 U8104084 MOXEE 3/4/2008 12 0.077 0.28 0.0988104085 PARKER 3/4/2008 2,957 0.062 U 0.062 U 0.062 U8104086 GRANGER 3/3/2008 18 0.15 2.1 0.428104087 SULFUR 3/3/2008 63 0.093 1.6 0.398104088 EUCLID 3/3/2008 3,259 0.063 U 0.2 0.063 U8104090 SPRING 3/3/2008 6 0.061 U 0.31 0.0818104091 KIONA 3/3/2008 4,151 0.062 U 0.26 0.0968104089 KIONA REP 3/3/2008 - - 0.061 U 0.24 0.08
8134084 MOXEE 3/24/2008 38 0.26 1.1 0.28134086 GRANGER 3/28/2008 21 0.23 1.9 0.278134087 SULFUR 3/24/2008 303 0.16 1.4 0.198134091 SULFUR REP 3/24/2008 - - 0.16 1.5 0.28134089 SPRING 3/24/2008 41 0.15 0.78 0.15
U = not detected at or above reported value. J = estimated. na = not analyzed.

Yakima Pesticides/PCBs TMDL: Vol 1, WQ Study Findings Page 256
CollectionField ID Date (ng/L) (ng/L) (ng/L) (ng/L) (ng/L)
HARRISON 1/9/2008 0.063 U 0.063 U 0.063 U 0.063 U 0.063 UNACHES 1/9/2008 0.062 U 0.062 U 0.062 U 0.062 U 0.075 JNACHES REP 1/9/2008 0.062 U 0.062 U 0.062 U 0.062 U 0.1 JMOXEE 1/9/2008 0.063 U 0.31 J 0.063 U 0.15 0.79 JPARKER 1/9/2008 0.064 U 0.18 J 0.064 U 0.064 U 0.17 JGRANGER 1/10/2008 0.061 U 0.077 UJ 0.061 U 0.061 U 0.27 JSULFUR 1/10/2008 0.22 0.33 J 0.061 U 0.11 0.51 JEUCLID 1/10/2008 0.061 U 0.26 J 0.061 U 0.061 U 0.28 JSPRING 1/10/2008 0.077 J 0.13 J 0.061 U 0.33 0.85 JKIONA 1/10/2008 0.061 U 0.19 J 0.061 U 0.061 U 0.21 JTRNSFR BLNK 1/9/2008 0.062 U 0.062 U 0.062 U 0.062 U 0.062 U
HARRISON 2/5/2008 0.061 U 0.15 UJ 0.061 U 0.061 U 0.22 JNACHES 2/5/2008 0.063 U 0.092 J 0.063 U 0.063 U 0.11 JMOXEE 2/5/2008 0.13 J 0.69 J 0.16 0.22 0.33 JMOXEE REP 2/5/2008 0.12 J 0.79 J 0.1 J 0.24 0.3 JPARKER 2/5/2008 0.063 U 0.33 J 0.072 J 0.12 0.25 JGRANGER 2/6/2008 0.47 J 0.9 J 0.11 J 0.23 J 0.48 JSULFUR 2/6/2008 0.66 0.58 UJ 0.41 UJ 0.13 J 0.37 JEUCLID 2/6/2008 0.08 0.54 J 0.063 U 0.11 0.19 JSPRING 2/6/2008 0.096 0.18 J 0.063 U 0.063 U 0.31 JKIONA 2/6/2008 0.063 U 0.37 J 0.16 0.14 0.4 J
HARRISON 3/4/2008 0.061 U 0.13 UJ 0.061 U 0.061 UJ 0.061 UJNACHES 3/4/2008 0.061 U 0.065 0.061 U 0.061 UJ 0.11 UJMOXEE 3/4/2008 0.13 J 0.47 J 0.062 U 0.25 J 1.5 JPARKER 3/4/2008 0.062 U 0.11 UJ 0.062 U 0.062 UJ 0.13 UJGRANGER 3/3/2008 0.17 0.15 0.062 U 0.062 UJ 0.39 UJSULFUR 3/3/2008 0.47 0.36 J 0.063 U 0.23 J 1 JEUCLID 3/3/2008 0.063 U 0.16 J 0.063 U 0.063 UJ 0.24 UJSPRING 3/3/2008 0.061 U 0.2 J 0.061 U 0.077 J 0.29 UJKIONA 3/3/2008 0.14 0.12 0.062 U 0.062 UJ 0.89 JKIONA REP 3/3/2008 0.14 0.092 0.061 U 0.061 UJ 0.81 J
MOXEE 3/24/2008 0.063 U 16 3.6 1.8 2.9GRANGER 3/28/2008 0.079 23 1 0.65 J 1.8 JSULFUR 3/24/2008 0.16 58 6.6 2.8 4.5SULFUR REP 3/24/2008 0.14 56 7.3 3 4.1SPRING 3/24/2008 0.12 J 211 7.3 2.8 7.1
Endosulfan I
Endosulfan IIChlorpyrifosDieldrin
Endosulfan Sulfate
U U = not detected at or above reported value J = estimated na = not analyzed

Yakima Pesticides/PCBs TMDL: Vol 1, WQ Study Findings Page 257
CollectionField ID Date (ng/L) (ng/L) (ng/L) (ng/L) (ng/L) (ng/L)
HARRISON 1/9/2008 3.1 U 0.063 U 0.063 U 0.14 UJ 0.063 U 0.19 UJNACHES 1/9/2008 3.1 U 0.062 U 0.062 U 0.062 U 0.062 U 0.15 UJNACHES REP 1/9/2008 3.1 U 0.062 U 0.062 U 0.062 U 0.062 U 0.15 UJMOXEE 1/9/2008 3.1 U 0.063 U 0.063 U 0.063 U 0.063 U 0.19 UJPARKER 1/9/2008 3.2 U 0.064 U 0.064 U 0.22 UJ 0.064 U 0.21 UJGRANGER 1/10/2008 3.1 U 0.061 U 0.061 U 0.061 U 0.061 U 0.061 USULFUR 1/10/2008 3.1 U 0.061 U 0.061 U 0.061 U 0.061 U 0.15 UJEUCLID 1/10/2008 3.1 U 0.061 U 0.061 U 0.10 UJ 0.061 U 0.13 UJSPRING 1/10/2008 3.1 U 0.061 U 0.061 U 0.061 U 0.061 U 0.14 UJKIONA 1/10/2008 3.0 U 0.061 U 0.061 U 0.061 U 0.061 U 0.13 UJTRNSFR BLNK 1/9/2008 3.1 U 0.062 U 0.062 U 0.062 U 0.062 U 0.16 UJ
HARRISON 2/5/2008 3.1 U 0.061 U 0.061 U 0.061 U 0.061 U 0.061 UNACHES 2/5/2008 3.1 U 0.063 U 0.063 U 0.063 U 0.063 U 0.063 UMOXEE 2/5/2008 3 UJ 0.061 UJ 0.061 UJ 0.061 UJ 0.061 UJ 0.061 UJMOXEE REP 2/5/2008 3.1 U 0.061 U 0.061 U 0.061 U 0.061 U 0.061 UPARKER 2/5/2008 3.1 UJ 0.063 UJ 0.063 UJ 0.063 UJ 0.063 UJ 0.063 UJGRANGER 2/6/2008 3 UJ 0.061 UJ 0.061 UJ 0.061 UJ 0.061 UJ 0.061 UJSULFUR 2/6/2008 3.1 UJ 0.063 UJ 0.063 UJ 0.063 UJ 0.063 UJ 0.063 UJEUCLID 2/6/2008 3.2 U 0.063 U 0.063 U 0.063 U 0.063 U 0.063 USPRING 2/6/2008 3.1 U 0.063 U 0.063 U 0.063 U 0.063 U 0.063 UKIONA 2/6/2008 3.2 U 0.063 U 0.063 U 0.063 U 0.063 U 0.063 U
HARRISON 3/4/2008 3.1 U 0.061 U 0.061 U 0.061 U 0.061 U 0.061 UNACHES 3/4/2008 3.1 U 0.061 U 0.061 U 0.061 U 0.061 U 0.061 UMOXEE 3/4/2008 3.1 U 0.062 U 0.062 U 0.062 U 0.062 U 0.062 UPARKER 3/4/2008 3.1 U 0.062 U 0.062 U 0.062 U 0.062 U 0.062 UGRANGER 3/3/2008 3.1 U 0.062 U 0.062 U 0.062 U 0.062 U 0.12 UJSULFUR 3/3/2008 3.1 U 0.063 U 0.063 U 0.063 U 0.063 U 0.063 UEUCLID 3/3/2008 3.1 U 0.063 U 0.063 U 0.063 U 0.063 U 0.063 USPRING 3/3/2008 3.1 U 0.061 U 0.061 U 0.061 U 0.061 U 0.061 UKIONA 3/3/2008 3.1 U 0.062 U 0.062 U 0.062 U 0.062 U 0.062 UKIONA REP 3/3/2008 3.1 U 0.061 U 0.061 U 0.061 U 0.061 U 0.061 U
MOXEE 3/24/2008 3.2 U 0.063 U 0.063 U 0.063 U 0.063 U 0.063 UGRANGER 3/28/2008 3.1 U 0.062 U 0.062 U 0.062 U 0.062 U 0.062 USULFUR 3/24/2008 3.2 U 0.064 U 0.064 U 0.064 U 0.064 U 0.064 USULFUR REP 3/24/2008 3.1 U 0.063 U 0.063 U 0.063 U 0.063 U 0.063 USPRING 3/24/2008 3.2 U 0.063 U 0.063 U 0.063 U 0.063 U 0.063 U
Toxaphene Cis-Chlordane Cis-
NonachlorTrans-
Chlordane Trans-
NonachlorOxy-
chlordane
U = not detected at or above reported value J = estimated na = not analyzed

Yakima Pesticides/PCBs TMDL: Vol 1, WQ Study Findings Page 258
CollectionField ID Date (ng/L) (ng/L) (ng/L) (ng/L) (ng/L) (ng/L)
HARRISON 1/9/2008 0.063 U 0.063 U 0.063 UJ 0.063 U 0.063 U 0.063 UNACHES 1/9/2008 0.062 U 0.062 U 0.062 UJ 0.062 U 0.062 U 0.062 UNACHES REP 1/9/2008 0.062 U 0.062 U 0.062 UJ 0.062 U 0.062 U 0.062 UMOXEE 1/9/2008 0.063 U 0.063 U 0.063 UJ 0.063 U 0.063 U 0.063 UPARKER 1/9/2008 0.064 U 0.064 U 0.064 UJ 0.064 U 0.064 U 0.064 UGRANGER 1/10/2008 0.095 UJ 0.061 U 0.061 UJ 0.061 U 0.061 U 0.061 USULFUR 1/10/2008 0.061 U 0.061 U 0.061 UJ 0.061 U 0.061 U 0.061 UEUCLID 1/10/2008 0.061 U 0.061 U 0.061 UJ 0.061 U 0.061 U 0.061 USPRING 1/10/2008 0.061 U 0.061 U 0.061 UJ 0.061 U 0.061 U 0.061 UKIONA 1/10/2008 0.061 U 0.061 U 0.061 UJ 0.061 U 0.061 U 0.061 UTRNSFR BLNK 1/9/2008 0.062 U 0.062 U 0.062 UJ 0.062 U 0.062 U 0.062 U
HARRISON 2/5/2008 0.061 U 0.061 U 0.061 U 0.061 U 0.061 U 0.061 UNACHES 2/5/2008 0.063 U 0.063 U 0.063 U 0.063 U 0.063 U 0.063 UMOXEE 2/5/2008 0.061 UJ 0.061 UJ 0.061 UJ 0.061 UJ 0.088 UJ 0.061 UJMOXEE REP 2/5/2008 0.061 U 0.061 U 0.061 U 0.061 U 0.075 UJ 0.061 UPARKER 2/5/2008 0.063 UJ 0.063 UJ 0.063 UJ 0.063 UJ 0.063 U 0.063 UGRANGER 2/6/2008 0.061 UJ 0.061 UJ 0.061 UJ 0.061 UJ 0.061 UJ 0.41 JSULFUR 2/6/2008 0.063 UJ 0.063 UJ 0.063 UJ 0.063 UJ 0.27 UJ 0.063 UEUCLID 2/6/2008 0.063 U 0.063 U 0.063 U 0.063 U 0.063 U 0.063 USPRING 2/6/2008 0.063 U 0.063 U 0.063 U 0.063 U 0.1 UJ 0.075KIONA 2/6/2008 0.063 U 0.063 U 0.063 U 0.063 U 0.067 UJ 0.22
HARRISON 3/4/2008 0.061 U 0.061 U 0.061 U 0.061 U 0.061 U 0.061 UJNACHES 3/4/2008 0.061 U 0.061 U 0.061 U 0.061 U 0.061 U 0.061 UJMOXEE 3/4/2008 0.062 U 0.062 U 0.062 U 0.062 U 0.062 U 0.062 UJPARKER 3/4/2008 0.062 U 0.072 UJ 0.062 U 0.062 U 0.062 U 0.062 UJGRANGER 3/3/2008 0.062 U 0.062 U 0.062 U 0.062 U 0.062 U 0.062 UJSULFUR 3/3/2008 0.063 U 0.063 U 0.063 U 0.063 U 0.063 U 0.063 UJEUCLID 3/3/2008 0.063 U 0.063 U 0.063 U 0.063 U 0.063 U 0.063 UJSPRING 3/3/2008 0.061 U 0.061 U 0.061 U 0.061 U 0.061 U 0.061 UJKIONA 3/3/2008 0.062 U 0.062 U 0.062 U 0.062 U 0.062 U 0.062 UJKIONA REP 3/3/2008 0.061 U 0.061 U 0.061 U 0.061 U 0.061 U 0.061 UJ
MOXEE 3/24/2008 0.063 U 0.063 U 0.063 UJ 0.063 U 0.063 U 0.063 UGRANGER 3/28/2008 0.062 U 0.062 U 0.062 U 0.062 U 0.098 0.062 USULFUR 3/24/2008 0.064 U 0.064 U 0.064 UJ 0.064 U 0.12 0.064 USULFUR REP 3/24/2008 0.063 U 0.063 U 0.063 UJ 0.063 U 0.1 0.063 USPRING 3/24/2008 0.063 U 0.063 U 0.063 UJ 0.063 U 0.26 0.063 U
Alpha-BHC Beta-BHC Delta-BHC Lindane Aldrin Endrin
U = not detected at or above reported value J = estimated na = not analyzed

Yakima Pesticides/PCBs TMDL: Vol 1, WQ Study Findings Page 259
CollectionField ID Date (ng/L) (ng/L) (ng/L) (ng/L) (ng/L)
HARRISON 1/9/2008 0.063 UJ 0.063 U 0.063 U 0.063 U 0.063 UNACHES 1/9/2008 0.062 UJ 0.062 U 0.062 U 0.062 U 0.062 UNACHES REP 1/9/2008 0.062 UJ 0.062 U 0.062 U 0.062 U 0.062 UMOXEE 1/9/2008 0.063 UJ 0.063 U 0.063 U 0.063 U 0.063 UPARKER 1/9/2008 0.064 UJ 0.064 U 0.064 U 0.064 U 0.064 UGRANGER 1/10/2008 0.061 UJ 0.061 U 0.061 U 0.069 UJ 0.061 USULFUR 1/10/2008 0.061 UJ 0.061 U 0.061 U 0.061 U 0.061 UEUCLID 1/10/2008 0.061 UJ 0.061 U 0.061 U 0.061 U 0.061 USPRING 1/10/2008 0.061 UJ 0.061 U 0.061 U 0.061 U 0.061 UKIONA 1/10/2008 0.061 UJ 0.061 U 0.061 U 0.061 U 0.061 UTRNSFR BLNK 1/9/2008 0.062 UJ 0.062 U 0.062 U 0.062 U 0.062 U
HARRISON 2/5/2008 0.061 U 0.061 U 0.061 U 0.061 U 0.061 UNACHES 2/5/2008 0.063 U 0.063 U 0.063 U 0.063 U 0.063 UMOXEE 2/5/2008 0.46 UJ 0.061 U 0.061 UJ 0.061 U 0.061 UJMOXEE REP 2/5/2008 0.46 UJ 0.061 U 0.061 U 0.061 U 0.061 UPARKER 2/5/2008 0.063 U 0.063 U 0.063 UJ 0.063 U 0.063 UJGRANGER 2/6/2008 0.11 UJ 0.62 J 0.061 UJ 0.14 UJ 0.061 UJSULFUR 2/6/2008 0.21 UJ 0.063 U 0.063 UJ 0.063 U 0.063 UJEUCLID 2/6/2008 0.063 U 0.063 U 0.063 U 0.063 U 0.063 USPRING 2/6/2008 0.16 0.21 J 0.063 U 0.063 U 0.063 UKIONA 2/6/2008 0.063 U 0.16 J 0.063 U 0.063 U 0.063 U
HARRISON 3/4/2008 0.061 U 0.061 U 0.061 U 0.061 U 0.061 UNACHES 3/4/2008 0.061 U 0.061 U 0.061 U 0.061 U 0.061 UMOXEE 3/4/2008 0.062 U 0.062 U 0.062 U 0.062 U 0.062 UPARKER 3/4/2008 0.062 U 0.062 U 0.062 U 0.062 U 0.062 UGRANGER 3/3/2008 0.11 UJ 0.069 UJ 0.062 U 0.062 U 0.062 USULFUR 3/3/2008 0.063 U 0.063 U 0.063 U 0.063 U 0.063 UEUCLID 3/3/2008 0.063 U 0.063 U 0.063 U 0.063 U 0.063 USPRING 3/3/2008 0.061 U 0.061 U 0.061 U 0.061 U 0.061 UKIONA 3/3/2008 0.062 U 0.062 U 0.062 U 0.062 U 0.062 UKIONA REP 3/3/2008 0.061 U 0.069 UJ 0.061 U 0.061 U 0.061 U
MOXEE 3/24/2008 0.063 UJ 0.063 U 0.063 U 0.063 U 0.063 UGRANGER 3/28/2008 0.062 UJ 0.097 UJ 0.062 U 0.062 U 0.062 USULFUR 3/24/2008 0.064 UJ 0.064 U 0.064 U 0.064 U 0.064 USULFUR REP 3/24/2008 0.063 UJ 0.063 U 0.063 U 0.063 U 0.063 USPRING 3/24/2008 0.063 UJ 0.063 U 0.063 U 0.063 U 0.063 U
Endrin Aldehyde Endrin Ketone Heptachlor
Heptachlor Epoxide
Hexachloro-benzene
U = not detected at or above reported value J = estimated na = not analyzed

Yakima Pesticides/PCBs TMDL: Vol 1, WQ Study Findings Page 260
Collection ConductivityField ID Date (ng/L) (mg/L) (mg/L) (NTU) (umhos/cm)
HARRISON 1/9/2008 0.063 U 2 na 1 144NACHES 1/9/2008 0.062 U 2 na 1.5 87NACHES REP 1/9/2008 0.062 U 2 U na 2 87.1MOXEE 1/9/2008 0.23 UJ 13 na 4.4 792PARKER 1/9/2008 0.064 U 3 na 1.7 144GRANGER 1/10/2008 0.061 U 141 133 27 733SULFUR 1/10/2008 0.22 80 71 28 J 771EUCLID 1/10/2008 0.061 U 5 4 3.2 224SPRING 1/10/2008 0.061 U 2 1 1.4 671KIONA 1/10/2008 0.061 U 3 2 2.6 248TRNSFR BLNK 1/9/2008 0.062 U na na na na
HARRISON 2/5/2008 0.061 UJ 4 3 1.1 J 142NACHES 2/5/2008 0.063 UJ 2 1 1.8 J 93.1MOXEE 2/5/2008 0.22 UJ 7 6 3.4 801MOXEE REP 2/5/2008 0.31 UJ 6 4 3.4 796PARKER 2/5/2008 0.084 UJ 5 4 2.5 144GRANGER 2/6/2008 0.45 UJ 56 42 37 J 775SULFUR 2/6/2008 0.063 UJ 42 37 24 J 766EUCLID 2/6/2008 0.063 UJ 10 7 7.7 J 242SPRING 2/6/2008 0.063 UJ 2 2 1.6 J 680KIONA 2/6/2008 0.063 UJ 3 3 2.6 J 243
HARRISON 3/4/2008 0.061 UJ 6 5 3.7 149NACHES 3/4/2008 0.061 UJ 4 3 4.4 104MOXEE 3/4/2008 0.35 UJ 9 6 3.3 814PARKER 3/4/2008 0.062 UJ 7 6 4.6 146GRANGER 3/3/2008 0.078 UJ 47 44 5.7 735SULFUR 3/3/2008 0.29 UJ 42 38 11 801EUCLID 3/3/2008 0.063 UJ 22 19 11 180SPRING 3/3/2008 0.067 UJ 23 20 14 189KIONA 3/3/2008 0.062 UJ 1 1 U 0.7 660KIONA REP 3/3/2008 0.061 UJ 1 1 U 0.6 661
MOXEE 3/24/2008 0.063 U 85 66 28 254GRANGER 3/28/2008 0.17 UJ 156 134 90 J 626SULFUR 3/24/2008 0.083 UJ 39 35 16 306SULFUR REP 3/24/2008 0.063 U 48 44 14 299SPRING 3/24/2008 0.063 U 28 24 13 231
Methoxychlor TSS TNVSS Turbidity
U = not detected at or above reported value J = estimated na = not analyzed

Yakima Pesticides/PCBs TMDL: Vol 1, WQ Study Findings Page 261
Appendix K. Screening Survey Data for Surface Water, 2007-08
Collection Flow 4,4'-DDT 4,4'-DDESample No. Field ID Date (cfs) (ng/L) (ng/L) (ng/L)
7204084 AHTANUM 5/16/2007 120 0.062 U 0.19 0.062 U7204101 AMON 5/16/2007 48 0.063 U 0.14 0.063 U7204099 CORRAL 5/16/2007 11 0.064 U 0.27 0.064 U7204090 COULEE DR 5/17/2007 16 0.69 0.57 0.137234103 COWICHEE 6/4/2007 37 0.35 J 0.87 0.07 J7204093 DID 7 5/16/2007 9.5 0.072 UJ 1.4 0.177204097 DRAIN 31 5/16/2007 3.4 0.25 1.3 0.137204086 EAST TOP 5/17/2007 31 0.33 0.65 0.137204096 GRANDVIEW 5/16/2007 11 0.48 2.0 0.197204088 MARION 5/16/2007 109 0.13 0.31 0.0647204102 MARION REP 5/16/2007 - - 0.14 UJ 0.36 0.064 U7204095 SATUS 302 5/17/2007 14 1.3 5.9 0.187204094 SATUS 303 5/17/2007 30 0.17 UJ 1.3 0.117204091 SATUS CK 5/17/2007 162 0.063 U 0.13 0.063 U7204082 SELAH DCH 5/16/2007 6.0 0.32 1.7 0.557204092 SOUTH DR 5/17/2007 65 1.2 3.8 0.487204103 SOUTH DR REP 5/17/2007 - - 1.3 3.8 0.577204087 SUB 35 5/17/2007 47 1.2 1.3 0.407214100 TAYLOR D 5/22/2007 6.0 0.063 U 0.32 0.0827204089 TOP CK 5/17/2007 69 0.078 0.25 0.0617204098 WAUNA 5/16/2007 6.5 0.072 UJ 0.71 0.0887214102 WENAS 5/22/2007 14 0.063 U 0.096 0.063 U7204083 WIDE HOL 5/16/2007 13 0.1 0.97 0.397204085 ZILLAH 5/16/2007 2.6 0.5 2.9 0.46 - - SELAH CR. dry - - COLD CR. dry
4,4'-DDD
U = not detected at or above reported value J = estimated REJ = rejected na = not analyzed

Yakima Pesticides/PCBs TMDL: Vol 1, WQ Study Findings Page 262
CollectionField ID Date (ng/L) (ng/L) (ng/L) (ng/L) (ng/L)
AHTANUM 5/16/2007 0.062 U 0.6 0.47 0.3 0.75 JAMON 5/16/2007 0.063 U 0.47 0.20 J 0.23 0.76CORRAL 5/16/2007 0.077 UJ 1.3 J 0.15 0.12 J 1.2COULEE DR 5/17/2007 0.062 U 4.5 0.28 UJ 0.31 0.76 JCOWICHEE 6/4/2007 0.081 UJ 1.0 0.25 0.27 0.48 JDID 7 5/16/2007 0.077 UJ 3.4 0.24 0.13 J 0.83 JDRAIN 31 5/16/2007 0.36 1.3 0.53 0.38 J 1.3 JEAST TOP 5/17/2007 0.25 0.68 1.4 1.0 1.4 JGRANDVIEW 5/16/2007 0.32 18 0.58 0.39 1.3 JMARION 5/16/2007 0.13 15 0.55 UJ 0.65 1.1 JMARION REP 5/16/2007 0.12 J 16 0.44 0.62 1.3SATUS 302 5/17/2007 1.5 7.6 0.16 J 0.34 J 1.4 JSATUS 303 5/17/2007 0.17 J 4.2 0.27 0.23 J 1.2 JSATUS CK 5/17/2007 0.063 U 4.3 0.24 0.16 0.4 UJSELAH DCH 5/16/2007 0.13 J 1.4 0.46 UJ 0.33 1.1 JSOUTH DR 5/17/2007 0.17 3.2 0.33 0.23 J 1.1SOUTH DR REP 5/17/2007 0.2 8.1 0.36 0.49 J 1.3SUB 35 5/17/2007 0.15 3.9 0.33 UJ 0.42 0.94 JTAYLOR D 5/22/2007 0.063 U 0.3 J 0.097 UJ 0.063 U 0.65TOP CK 5/17/2007 0.13 J 7.9 0.48 UJ 0.62 1.1 JWAUNA 5/16/2007 0.063 U 1.9 0.76 0.49 2.5 JWENAS 5/22/2007 0.063 U 0.093 0.063 U 0.063 U 0.36WIDE HOL 5/16/2007 0.47 2.1 J 1.1 0.85 7.0 JZILLAH 5/16/2007 0.4 UJ 1.8 0.89 1.2 2.4 JSELAH CR. dryCOLD CR. dry
Endosulfan I
Endosulfan II
Endosulfan SulfateDieldrin Chlorpyrifos
U = not detected at or above reported value J = estimated REJ = rejected na = not analyzed

Yakima Pesticides/PCBs TMDL: Vol 1, WQ Study Findings Page 263
CollectionField ID Date (ng/L) (ng/L) (ng/L) (ng/L) (ng/L) (ng/L)
AHTANUM 5/16/2007 3.1 U 0.062 U 0.062 U 0.062 U 0.062 U 0.062 UAMON 5/16/2007 3.1 U 0.063 U 0.063 U 0.063 U 0.063 U 0.063 UCORRAL 5/16/2007 3.2 U 0.064 U 0.064 U 0.064 U 0.064 U 0.064 UCOULEE DR 5/17/2007 3.1 U 0.062 U 0.062 U 0.062 U 0.062 U 0.062 UCOWICHEE 6/4/2007 3.1 U 0.063 U 0.063 U 0.063 U 0.063 U 0.063 UDID 7 5/16/2007 3.1 U 0.062 U 0.062 U 0.062 U 0.062 U 0.062 UDRAIN 31 5/16/2007 3.1 U 0.063 U 0.063 U 0.063 U 0.063 U 0.063 UEAST TOP 5/17/2007 3.1 U 0.062 U 0.062 U 0.062 U 0.07 U 0.062 UGRANDVIEW 5/16/2007 3.1 U 0.063 U 0.063 U 0.063 U 0.063 U 0.063 UMARION 5/16/2007 3.1 U 0.062 U 0.062 U 0.062 U 0.062 U 0.062 UMARION REP 5/16/2007 3.2 U 0.064 U 0.064 U 0.064 U 0.064 U 0.064 USATUS 302 5/17/2007 3.1 U 0.063 U 0.063 U 0.063 U 0.063 U 0.063 USATUS 303 5/17/2007 3.0 U 0.061 U 0.061 U 0.061 U 0.061 U 0.061 USATUS CK 5/17/2007 3.2 U 0.063 U 0.063 U 0.063 U 0.063 U 0.063 USELAH DCH 5/16/2007 3.3 U 0.065 U 0.065 U 0.065 U 0.065 U 0.065 USOUTH DR 5/17/2007 3.1 U 0.063 U 0.063 U 0.063 U 0.063 U 0.063 USOUTH DR REP 5/17/2007 3.1 U 0.063 U 0.063 U 0.063 U 0.063 U 0.063 USUB 35 5/17/2007 3.1 U 0.062 U 0.062 U 0.062 U 0.062 U 0.062 UTAYLOR D 5/22/2007 3.2 U 0.063 U 0.063 U 0.063 U 0.063 U 0.063 UTOP CK 5/17/2007 3.0 U 0.061 U 0.061 U 0.061 U 0.061 U 0.061 UWAUNA 5/16/2007 3.2 U 0.063 U 0.063 U 0.063 U 0.063 U 0.063 UWENAS 5/22/2007 3.2 U 0.063 U 0.063 U 0.063 U 0.063 U 0.063 UWIDE HOL 5/16/2007 3.2 U 0.063 U 0.063 U 0.063 U 0.063 U 0.063 UZILLAH 5/16/2007 3.1 U 0.062 U 0.062 U 0.062 U 0.062 U 0.062 USELAH CR. dryCOLD CR. dry
ToxapheneCis-
Chlordane Cis-
NonachlorTrans-
ChlordaneTrans-
NonachlorOxy-
chlordane
U = not detected at or above reported value J = estimated REJ = rejected na = not analyzed

Yakima Pesticides/PCBs TMDL: Vol 1, WQ Study Findings Page 264
CollectionField ID Date (ng/L) (ng/L) (ng/L) (ng/L) (ng/L) (ng/L)
AHTANUM 5/16/2007 0.062 U 0.062 U 0.062 U 0.062 U 0.062 UJ 0.062 UJAMON 5/16/2007 0.063 U 0.063 U 0.063 U 0.063 U 0.063 UJ 0.063 UCORRAL 5/16/2007 0.064 U 0.064 U 0.064 U 0.064 U 0.064 UJ 0.064 UCOULEE DR 5/17/2007 0.062 U 0.062 U 0.062 U 0.062 U 0.21 UJ 0.062 UCOWICHEE 6/4/2007 0.063 U 0.063 UJ 0.063 U 0.063 UJ 0.063 U 0.063 UDID 7 5/16/2007 0.062 U 0.062 U 0.062 U 0.062 U 0.062 UJ 0.062 UDRAIN 31 5/16/2007 0.063 U 0.063 U 0.063 U 0.063 U 0.063 UJ 0.063 UEAST TOP 5/17/2007 0.062 U 0.062 U 0.062 U 0.12 UJ 0.062 UJ 0.071 UJGRANDVIEW 5/16/2007 0.063 U 0.063 U 0.063 U 0.063 U 0.063 UJ 0.063 UMARION 5/16/2007 0.062 U 0.062 U 0.062 U 0.062 U 0.075 UJ 0.092 UJMARION REP 5/16/2007 0.064 U 0.064 U 0.064 U 0.064 U 0.11 UJ 0.79 UJSATUS 302 5/17/2007 0.063 U 0.063 U 0.063 U 0.17 UJ 0.094 UJ 0.09 UJSATUS 303 5/17/2007 0.061 U 0.061 U 0.061 U 0.061 U 0.1 UJ 0.061 USATUS CK 5/17/2007 0.063 U 0.063 U 0.063 U 0.063 U 0.063 UJ 0.063 USELAH DCH 5/16/2007 0.065 U 0.098 UJ 0.065 U 0.069 UJ 0.065 UJ 0.094 UJSOUTH DR 5/17/2007 0.063 U 0.063 U 0.063 U 0.063 U 0.063 UJ 0.063 USOUTH DR REP 5/17/2007 0.063 U 0.063 U 0.063 U 0.063 U 0.19 UJ 0.063 USUB 35 5/17/2007 0.062 U 0.062 U 0.062 U 0.062 U 0.10 UJ 0.11 UJTAYLOR D 5/22/2007 0.063 U 0.12 UJ 0.063 U 0.063 U 0.063 U 0.063 UTOP CK 5/17/2007 0.061 U 0.061 U 0.061 U 0.061 U 0.098 UJ 0.11 UJWAUNA 5/16/2007 0.063 U 0.063 U 0.063 U 0.063 U 0.063 UJ 0.75 UJWENAS 5/22/2007 0.063 U 0.063 U 0.063 U 0.063 U 0.063 U 0.063 UWIDE HOL 5/16/2007 0.063 U 0.063 U 0.063 U 0.063 U 0.063 UJ 0.14 UJZILLAH 5/16/2007 0.062 U 0.062 U 0.062 U 0.062 U 0.062 UJ 0.062 USELAH CR. dryCOLD CR. dry
EndrinAlpha-BHC
Beta-BHC
Delta-BHC Lindane Aldrin
U = not detected at or above reported value J = estimated REJ = rejected na = not analyzed

Yakima Pesticides/PCBs TMDL: Vol 1, WQ Study Findings Page 265
CollectionField ID Date (ng/L) (ng/L) (ng/L) (ng/L) (ng/L)
AHTANUM 5/16/2007 0.062 U 0.062 U 0.062 U 0.062 U 0.062 UAMON 5/16/2007 0.063 U 0.063 U 0.063 U 0.063 U 0.063 UCORRAL 5/16/2007 0.064 U 0.064 U 0.064 U 0.064 U 0.064 UCOULEE DR 5/17/2007 0.062 U 0.062 U 0.062 U 0.062 U 0.062 UCOWICHEE 6/4/2007 0.10 UJ 0.063 U 0.063 U 0.063 U 0.063 UDID 7 5/16/2007 0.15 UJ 0.062 U 0.062 U 0.062 U 0.062 UDRAIN 31 5/16/2007 0.083 UJ 0.063 U 0.063 U 0.071 0.063 UEAST TOP 5/17/2007 0.062 UJ 0.062 U 0.062 U 0.062 0.062 UGRANDVIEW 5/16/2007 0.082 UJ 0.063 U 0.063 U 0.063 U 0.063 UMARION 5/16/2007 0.062 U 0.062 U 0.062 U 0.062 U 0.062 UMARION REP 5/16/2007 0.064 U 0.064 U 0.064 U 0.064 U 0.064 USATUS 302 5/17/2007 0.065 UJ 0.063 U 0.063 U 0.10 0.063 USATUS 303 5/17/2007 0.10 UJ 0.061 U 0.061 U 0.061 U 0.061 USATUS CK 5/17/2007 0.14 UJ 0.063 U 0.063 U 0.063 U 0.063 USELAH DCH 5/16/2007 0.11 UJ 0.065 U 0.065 U 0.065 U 0.065 USOUTH DR 5/17/2007 0.078 UJ 0.063 U 0.063 U 0.063 U 0.063 USOUTH DR REP 5/17/2007 0.073 UJ 0.063 U 0.063 U 0.063 U 0.063 USUB 35 5/17/2007 0.062 U 0.062 U 0.062 U 0.062 U 0.062 UTAYLOR D 5/22/2007 0.063 U 0.063 UJ 0.063 U 0.063 U 0.063 UTOP CK 5/17/2007 0.078 UJ 0.061 U 0.061 U 0.061 U 0.061 UWAUNA 5/16/2007 0.087 UJ 0.063 U 0.063 U 0.063 U 0.063 UWENAS 5/22/2007 0.09 UJ 0.063 U 0.063 U 0.063 U 0.063 UWIDE HOL 5/16/2007 0.063 U 0.063 U 0.063 U 0.063 U 0.14 JZILLAH 5/16/2007 0.087 UJ 0.1 UJ 0.062 U 0.087 J 0.062 USELAH CR. dryCOLD CR. dry
Endrin Aldehyde
Endrin Ketone Heptachlor
Heptachlor Epoxide
Hexachloro-benzene
U = not detected at or above reported value J = estimated REJ = rejected na = not analyzed

Yakima Pesticides/PCBs TMDL: Vol 1, WQ Study Findings Page 266
CollectionField ID Date (ng/L) (mg/L) (NTU) (umhos/cm)
AHTANUM 5/16/2007 0.062 UJ 27 12 130AMON 5/16/2007 0.063 UJ 23 6.3 312CORRAL 5/16/2007 0.064 UJ 18 5.7 454COULEE DR 5/17/2007 0.062 UJ 9 12 274COWICHEE 6/4/2007 0.33 UJ 44 16 164DID 7 5/16/2007 0.062 UJ 60 35 350DRAIN 31 5/16/2007 0.063 UJ 16 11 260EAST TOP 5/17/2007 0.062 UJ 29 15 186GRANDVIEW 5/16/2007 0.063 UJ 31 12 174MARION 5/16/2007 0.062 UJ 13 9.2 233MARION REP 5/16/2007 0.064 UJ 66 9.2 233SATUS 302 5/17/2007 0.063 UJ 173 80 279SATUS 303 5/17/2007 0.061 UJ 47 21 182SATUS CK 5/17/2007 0.063 UJ 12 6.3 203SELAH DCH 5/16/2007 0.37 UJ 8 3.8 683SOUTH DR 5/17/2007 0.46 UJ 92 38 318SOUTH DR REP 5/17/2007 0.063 UJ 100 40 319SUB 35 5/17/2007 0.29 UJ 37 20 270TAYLOR D 5/22/2007 0.063 UJ 16 9.0 421TOP CK 5/17/2007 0.061 UJ 7 6.8 248WAUNA 5/16/2007 0.063 UJ 43 19 222WENAS 5/22/2007 0.21 UJ 10 4 198WIDE HOL 5/16/2007 0.063 UJ 5 4.2 307ZILLAH 5/16/2007 0.062 UJ 45 19 160SELAH CR. dryCOLD CR. dry
Methoxychlor
Total Suspended
Solids Turbidity Conductivity
U = not detected at or above reported value J = estimated REJ = rejected na = not analyzed

Yakima Pesticides/PCBs TMDL: Vol 1, WQ Study Findings Page 267
Collection FlowSample No. Field ID Date (cfs) (ng/L) (ng/L) (ng/L)
7334084 AHTANUM 8/14/2007 26 0.062 UJ 0.062 UJ 0.062 UJ7334101 AMON 8/16/2007 49 0.062 UJ 0.091 J 0.062 UJ7334099 CORRAL 8/16/2007 13 0.064 UJ 0.25 J 0.064 UJ7334090 COULEE DR 8/15/2007 37 0.12 0.36 0.0997334104 COWICHEE 8/14/2007 2 0.35 0.93 0.217334093 DID7 8/16/2007 20 0.061 UJ 0.65 J 0.11 J7334097 DRAIN 31 8/16/2007 3 0.41 J 1.4 J 0.14 J7334086 EAST TOP 8/15/2007 15 0.22 0.58 0.217334096 GRANDVIEW 8/16/2007 16 0.64 J 2.3 J 0.23 J7334088 MARION 8/15/2007 54 0.062 U 0.25 0.0667334103 SAT302REP 8/15/2007 - - 1.3 5.1 0.147334095 SATUS 302 8/15/2007 26 1.3 5.2 0.157334094 SATUS 303 8/15/2007 6.6 0.49 2.5 0.227334091 SATUS CK 8/15/2007 61 0.065 U 0.13 0.065 U7334082 SELAH DCH 8/14/2007 6.6 0.46 2.0 0.707334092 SOUTH DR 8/15/2007 61 0.79 3.5 0.467334087 SUB 35 8/15/2007 60 0.57 0.75 0.257334100 TAYLOR D 8/14/2007 1.4 0.062 U 0.30 0.107334089 TOP CK 8/15/2007 40 0.063 U 0.16 0.063 U7334098 WAUNA 8/16/2007 1.6 0.063 UJ 0.25 J 0.063 UJ7334081 WENAS 8/14/2007 1.9 0.063 U 0.096 0.063 U7334083 WIDE HOL 8/14/2007 9.6 0.087 1.1 0.387334102 WIDE REP 8/14/2007 - - 0.091 1.1 0.397334085 ZILLAH 8/15/2007 2.6 0.2 2.5 0.55 - - SELAH CR. dry - - COLD CR. dry
4,4'-DDD4,4'-DDE4,4'-DDT
U = not detected at or above reported value J = estimated REJ = rejected na = not analyzed

Yakima Pesticides/PCBs TMDL: Vol 1, WQ Study Findings Page 268
U = not detected at or above reported value J = estimated REJ = rejected na = not analyzed
Field IDCollection
DateAHTANUM 8/14/2007 REJ REJ 0.062 UJ REJ 0.062 UJ
AMON 8/16/2007 0.12 J 1.1 J 0.19 J 0.17 J 0.78 J
CORRAL 8/16/2007 0.064 UJ 0.32 J 0.25 J 0.064 UJ 0.68 J
COULEE DR 8/15/2007 0.061 U 21 0.12 0.14 J 0.61COWICHEE 8/14/2007 0.063 0.063 U 0.25 0.25 0.94DID7 8/16/2007 0.061 UJ 0.061 UJ 0.37 J 0.16 J 0.91 J
DRAIN 31 8/16/2007 1.7 0.58 J 0.75 J 0.5 J 1.4 J
EAST TOP 8/15/2007 0.14 UJ 0.67 0.34 J 0.41 0.99GRANDVIEW 8/16/2007 0.55 J 0.62 J 1.5 J 0.56 J 1.5 J
MARION 8/15/2007 0.15 J 4.8 0.23 0.17 0.87SAT302REP 8/15/2007 1.8 4.3 0.2 0.22 1.1SATUS 302 8/15/2007 1.9 7.6 0.19 0.28 1.1SATUS 303 8/15/2007 0.31 2.1 0.17 0.061 U 0.99SATUS CK 8/15/2007 0.079 J 10 0.19 0.12 0.57SELAH DCH 8/14/2007 0.062 U 0.15 UJ 7.1 5.0 5.8SOUTH DR 8/15/2007 0.57 2.1 0.2 0.18 1.0SUB 35 8/15/2007 0.27 12 0.2 0.21 0.94TAYLOR D 8/14/2007 0.062 U 0.81 0.36 0.1 J 0.57TOP CK 8/15/2007 0.11 J 3.7 0.2 0.21 0.93WAUNA 8/16/2007 0.088 J 0.71 J 0.54 J 0.29 J 1.4 J
WENAS 8/14/2007 0.063 U 0.13 J 0.081 0.088 UJ 0.49WIDE HOL 8/14/2007 0.47 0.32 J 0.35 0.53 2.6WIDE REP 8/14/2007 0.51 0.31 0.38 0.56 3.1ZILLAH 8/15/2007 0.11 J 0.51 2.2 0.38 1.6SELAH CR. dryCOLD CR. dry
Endosulfan Sulfate (ng/L)
Endosulfan II
(ng/L)
Endosulfan I
(ng/l)Chlorpyriphos
(ng/L)Dieldrin (ng/L)

Yakima Pesticides/PCBs TMDL: Vol 1, WQ Study Findings Page 269
U = not detected at or above reported value J = estimated REJ = rejected na = not analyzed
Field IDCollection
DateAHTANUM 8/14/2007 3.1 U 0.062 UJ 0.062 UJ 0.062 UJ 0.062 UJ 0.062 UJ
AMON 8/16/2007 3.1 U 0.062 UJ 0.062 UJ 0.062 UJ 0.062 UJ 0.062 UJ
CORRAL 8/16/2007 3.2 UJ 0.064 UJ 0.064 UJ 0.064 UJ 0.064 UJ 0.064 UJ
COULEE DR 8/15/2007 3.0 U 0.061 U 0.061 U 0.061 U 0.061 U 0.061 U
COWICHEE 8/14/2007 3.1 U 0.063 U 0.063 U 0.063 U 0.063 U 0.063 U
DID7 8/16/2007 3.1 UJ 0.061 UJ 0.061 UJ 0.061 UJ 0.061 UJ 0.061 UJ
DRAIN 31 8/16/2007 3.2 UJ 0.064 UJ 0.064 UJ 0.064 UJ 0.064 J 0.064 UJ
EAST TOP 8/15/2007 3.1 U 0.09 J 0.063 U 0.10 UJ 0.098 UJ 0.14 UJ
GRANDVIEW 8/16/2007 3.1 UJ 0.063 UJ 0.063 UJ 0.063 UJ 0.063 UJ 0.063 UJ
MARION 8/15/2007 3.1 U 0.062 U 0.062 U 0.062 U 0.062 U 0.062 U
SAT302REP 8/15/2007 3.1 U 0.062 U 0.062 U 0.062 U 0.062 U 0.062 U
SATUS 302 8/15/2007 3.0 U 0.061 U 0.061 U 0.061 U 0.061 U 0.061 U
SATUS 303 8/15/2007 3.0 U 0.061 U 0.061 U 0.061 U 0.061 U 0.061 U
SATUS CK 8/15/2007 3.2 U 0.065 U 0.065 U 0.065 U 0.065 U 0.065 U
SELAH DCH 8/14/2007 3.1 U 0.062 U 0.062 U 0.062 U 0.062 U 0.073 UJ
SOUTH DR 8/15/2007 3.1 U 0.061 U 0.061 U 0.061 U 0.061 U 0.061 U
SUB 35 8/15/2007 3.1 U 0.063 U 0.063 U 0.063 U 0.063 U 0.063 U
TAYLOR D 8/14/2007 3.1 U 0.13 J 0.062 U 0.062 U 0.062 U 0.062 U
TOP CK 8/15/2007 3.2 U 0.063 U 0.063 U 0.063 U 0.063 U 0.063 U
WAUNA 8/16/2007 3.1 UJ 0.063 UJ 0.063 UJ 0.063 UJ 0.063 UJ 0.34 J
WENAS 8/14/2007 3.1 U 0.063 U 0.063 U 0.063 U 0.063 U 0.063 U
WIDE HOL 8/14/2007 3.2 U 0.081 J 0.063 U 0.063 U 0.074 0.063 U
WIDE REP 8/14/2007 3.2 U 0.08 J 0.063 U 0.063 U 0.063 U 0.063 U
ZILLAH 8/15/2007 3.1 U 0.063 U 0.063 U 0.063 U 0.063 U 0.063 U
SELAH CR. dryCOLD CR. dry
Toxaphene (ng/L)
Oxy-chlordane
(ng/L)
Trans-Nonachlor
(ng/L)
Trans-Chlordane
(ng/L))
Cis-Nonachlor
(ng/L)
Cis-Chlordane
(ng/L)

Yakima Pesticides/PCBs TMDL: Vol 1, WQ Study Findings Page 270
U = not detected at or above reported value J = estimated REJ = rejected na = not analyzed
Field IDCollection
DateAHTANUM 8/14/2007 0.062 UJ 0.062 UJ 0.062 UJ 0.062 UJ 0.062 UJ REJAMON 8/16/2007 0.062 UJ 0.062 UJ 0.062 UJ 0.062 UJ 0.062 UJ 0.062 UJ
CORRAL 8/16/2007 0.064 UJ 0.064 UJ 0.064 UJ 0.064 UJ 0.064 UJ 0.064 UJ
COULEE DR 8/15/2007 0.061 U 0.061 U 0.061 U 0.061 U 0.078 UJ 0.73COWICHEE 8/14/2007 0.063 U 0.063 U 0.063 U 0.063 U 0.063 UJ 0.063 UJ
DID7 8/16/2007 0.061 UJ 0.061 UJ 0.061 UJ 0.061 UJ 0.27 UJ 0.11 UJ
DRAIN 31 8/16/2007 0.064 UJ 0.064 UJ 0.064 UJ 0.064 UJ 0.064 UJ 0.36 UJ
EAST TOP 8/15/2007 0.063 U 0.063 U 0.063 U 0.063 U 0.068 UJ 0.063 U
GRANDVIEW 8/16/2007 0.063 UJ 0.063 UJ 0.063 UJ 0.063 UJ 0.063 UJ 0.095 UJ
MARION 8/15/2007 0.062 U 0.062 U 0.062 U 0.062 U 0.096 UJ 0.14 UJ
SAT302REP 8/15/2007 0.062 U 0.062 U 0.062 U 0.062 U 0.13 UJ 0.69 J
SATUS 302 8/15/2007 0.061 U 0.061 U 0.061 U 0.061 U 0.11 UJ 0.64SATUS 303 8/15/2007 0.061 U 0.061 U 0.061 U 0.061 U 0.061 U 0.061 U
SATUS CK 8/15/2007 0.065 U 0.065 U 0.065 U 0.065 U 0.092 UJ 0.47 J
SELAH DCH 8/14/2007 0.062 U 0.062 U 0.065 UJ 0.062 U 0.062 U 0.062 U
SOUTH DR 8/15/2007 0.061 U 0.061 U 0.061 U 0.061 U 0.09 UJ 0.67SUB 35 8/15/2007 0.063 U 0.063 U 0.063 U 0.063 U 0.17 UJ 0.17 UJ
TAYLOR D 8/14/2007 0.062 U 0.13 UJ 0.062 U 0.062 U 0.062 UJ 0.062 UJ
TOP CK 8/15/2007 0.063 U 0.063 U 0.063 U 0.063 U 0.11 UJ 0.8 J
WAUNA 8/16/2007 0.063 UJ 0.063 UJ 0.063 UJ 0.063 UJ 0.063 UJ 0.19 UJ
WENAS 8/14/2007 0.063 U 0.063 U 0.063 U 0.063 U 0.063 U 0.063 U
WIDE HOL 8/14/2007 0.063 U 0.063 U 0.063 U 0.063 U 0.063 U 0.14 J
WIDE REP 8/14/2007 0.063 U 0.063 U 0.063 U 0.063 U 0.063 UJ 0.15 J
ZILLAH 8/15/2007 0.063 U 0.063 U 0.063 U 0.063 U 0.063 U 0.063 U
SELAH CR. dryCOLD CR. dry
Alpha-BHC (ng/L)
Beta-BHC (ng/L)
Delta-BHC (ng/L)
Lindane (ng/L)
Aldrin (ng/L)
Endrin (ng/L)

Yakima Pesticides/PCBs TMDL: Vol 1, WQ Study Findings Page 271
U = not detected at or above reported value J = estimated REJ = rejected na = not analyzed
Field IDCollection
DateAHTANUM 8/14/2007 REJ REJ 0.062 UJ REJ 0.062 UJ
AMON 8/16/2007 0.062 UJ 0.062 UJ 0.062 UJ 0.062 UJ 0.062 UJ
CORRAL 8/16/2007 0.064 UJ 0.064 UJ 0.064 UJ 0.064 UJ 0.064 UJ
COULEE DR 8/15/2007 0.061 U 0.061 U 0.061 U 0.061 U 0.061 U
COWICHEE 8/14/2007 0.12 UJ 0.063 U 0.063 U 0.095 UJ 0.063 U
DID7 8/16/2007 0.061 UJ 0.061 UJ 0.061 UJ 0.061 UJ 0.061 UJ
DRAIN 31 8/16/2007 0.076 UJ 0.064 UJ 0.064 UJ 0.064 UJ 0.064 UJ
EAST TOP 8/15/2007 0.063 U 0.063 U 0.063 U 0.063 U 0.063 U
GRANDVIEW 8/16/2007 0.087 UJ 0.063 UJ 0.063 UJ 0.063 UJ 0.063 UJ
MARION 8/15/2007 0.062 U 0.062 U 0.062 U 0.062 0.062 U
SAT302REP 8/15/2007 0.12 UJ 0.062 U 0.062 U 0.062 UJ 0.062 U
SATUS 302 8/15/2007 0.061 U 0.061 U 0.061 U 0.061 U 0.061 U
SATUS 303 8/15/2007 0.061 U 0.061 U 0.061 U 0.061 U 0.061 U
SATUS CK 8/15/2007 0.065 U 0.065 U 0.065 U 0.065 U 0.065 U
SELAH DCH 8/14/2007 0.062 U 0.062 U 0.062 U 0.064 J 0.062 U
SOUTH DR 8/15/2007 0.061 U 0.061 U 0.061 U 0.061 U 0.061 U
SUB 35 8/15/2007 0.063 U 0.063 U 0.063 U 0.063 U 0.063 U
TAYLOR D 8/14/2007 0.062 U 0.28 0.062 U 0.062 UJ 0.062 U
TOP CK 8/15/2007 0.063 U 0.063 U 0.063 U 0.063 U 0.063 U
WAUNA 8/16/2007 0.063 UJ 0.063 UJ 0.063 UJ 0.077 J 0.063 UJ
WENAS 8/14/2007 0.063 U 0.063 U 0.063 U 0.063 U 0.063 U
WIDE HOL 8/14/2007 0.063 U 0.063 U 0.063 U 0.07 J 0.28WIDE REP 8/14/2007 0.067 UJ 0.063 U 0.063 U 0.096 J 0.29ZILLAH 8/15/2007 0.063 UJ 0.063 U 0.063 U 0.07 UJ 0.063 U
SELAH CR. dryCOLD CR. dry
Hexachloro-benzene (ng/L)
Heptachlor Epoxide (ng/L)
Heptachlor (ng/L)
Endrin Ketone (ng/L)
Endrin Aldehyde
(ng/L)

Yakima Pesticides/PCBs TMDL: Vol 1, WQ Study Findings Page 272
U = not detected at or above reported value J = estimated REJ = rejected na = not analyzed
Field IDCollection
DateAHTANUM 8/14/2007 REJ 6 3.4 237AMON 8/16/2007 0.062 UJ 18 5.1 380CORRAL 8/16/2007 0.064 UJ 30 9.4 436COULEE DR 8/15/2007 0.061 U 4 2.8 290COWICHEE 8/14/2007 0.063 UJ 3 2.7 294DID7 8/16/2007 0.061 UJ 20 14 351DRAIN 31 8/16/2007 1.2 UJ 7 4.3 268EAST TOP 8/15/2007 0.063 U 13 9.8 255GRANDVIEW 8/16/2007 0.063 UJ 27 11 176MARION 8/15/2007 0.062 U 11 6 247SAT302REP 8/15/2007 1 UJ 85 40 282SATUS 302 8/15/2007 0.061 UJ 73 45 282SATUS 303 8/15/2007 0.061 U 6 4.4 368SATUS CK 8/15/2007 0.065 U 5 4.9 332SELAH DCH 8/14/2007 0.062 U 6 2.7 544SOUTH DR 8/15/2007 0.061 U 25 16 366SUB 35 8/15/2007 0.063 U 10 8.7 284TAYLOR D 8/14/2007 0.062 UJ 6 4.3 386TOP CK 8/15/2007 0.063 U 4 4.2 235WAUNA 8/16/2007 0.063 UJ 4 3.9 193WENAS 8/14/2007 0.063 U 5 3.3 510WIDE HOL 8/14/2007 0.15 UJ 4 2.4 263WIDE REP 8/14/2007 0.063 UJ 4 2.3 263ZILLAH 8/15/2007 0.063 U 47 13 164SELAH CR. dryCOLD CR. dry
Conductivity (umhos/cm)
Total Suspended
Solids (mg/L)
Turbidity (NTU)
Methoxychlor (ng/L)

Yakima Pesticides/PCBs TMDL: Vol 1, WQ Study Findings Page 273
Collection Flow 4,4'-DDTSample No. Field ID Date (cfs) (ng/L) (ng/L) (ng/L)
7464084 AHTANUM 11/15/2007 27 0.061 UJ 0.14 0.061 U7464101 AMON CK 11/13/2007 19 0.066 U 0.066 U 0.066 U7464099 CORRAL 11/13/2007 7.8 0.063 U 0.063 U 0.063 U7464090 COULEE DR 11/14/2007 <1 est. 0.063 U 0.15 0.063 U7464104 COWICHEE 11/15/2007 10 0.068 J 0.27 0.087464093 DID 7 11/13/2007 6.0 0.064 U 0.41 0.0787464097 DRAIN 31 11/13/2007 0.5 0.064 U 0.41 0.064 U7464086 EAST TOP 11/14/2007 21 0.064 U 0.58 0.247464096 GRANDVIEW 11/13/2007 8.8 0.29 3.1 0.497464088 MARION 11/14/2007 222 0.067 U 0.27 0.067 U7464094 SATUS 303 11/13/2007 0.99 0.066 U 0.28 0.066 U7464091 SATUS CK 11/13/2007 29 0.066 U 0.066 U 0.066 U7484082 SELAH DC H 11/26/2007 9.6 0.51 J 6.1 1.37464092 SOUTH DR 11/13/2007 9.2 0.063 U 0.83 0.167464102 SOUTH REP 11/13/2007 - - 0.063 U 0.82 0.167464087 SUB 35 11/14/2007 23 0.16 0.56 0.287464100 TAYLOR D 11/15/2007 7.5 0.063 UJ 0.16 0.063 U7464089 TOP CK 11/14/2007 48 0.064 U 0.13 0.064 U7464081 WENAS 11/15/2007 5.4 0.063 UJ 0.064 0.063 U7464083 WIDE HOL 11/15/2007 22 0.062 UJ 1.2 0.337464103 WIDE REP 11/15/2007 - - 0.063 UJ 0.98 0.267464085 ZILLAH 11/14/2007 0.3 0.067 U 0.82 0.22 - - SATUS 302 standing water - - SELAH CR. dry - - COLD CR. dry
4,4'-DDE 4,4'-DDD
U = not detected at or above reported value J = estimated REJ = rejected na = not analyzed

Yakima Pesticides/PCBs TMDL: Vol 1, WQ Study Findings Page 274
CollectionField ID Date (ng/L) (ng/L) (ng/L) (ng/L) (ng/L)
AHTANUM 11/15/2007 0.061 U 0.061 UJ 0.061 U 0.086 J 0.2 JAMON CK 11/13/2007 0.066 U 0.074 J 0.066 U 0.066 UJ 0.12 UJCORRAL 11/13/2007 0.063 U 0.063 UJ 0.063 U 0.063 UJ 0.18 JCOULEE DR 11/14/2007 0.063 U 0.46 J 0.063 U 0.063 UJ 0.067 UJCOWICHEE 11/15/2007 0.061 U 0.061 UJ 0.061 U 0.12 J 0.30 JDID 7 11/13/2007 0.064 U 0.072 J 0.064 U 0.064 UJ 0.13 UJDRAIN 31 11/13/2007 0.22 0.068 J 0.064 U 0.064 U 0.064 UJEAST TOP 11/14/2007 0.39 0.064 UJ 0.064 U 0.42 J 0.54 JGRANDVIEW 11/13/2007 0.29 0.065 UJ 0.065 U 0.065 UJ 0.09 UJMARION 11/14/2007 0.067 U 0.89 J 0.067 U 0.078 J 0.11 UJSATUS 303 11/13/2007 0.23 0.96 J 0.10 J 0.069 J 0.11 UJSATUS CK 11/13/2007 0.066 U 2.2 J 0.066 U 0.15 J 0.14 UJSELAH DC H 11/26/2007 0.20 UJ 0.49 UJ 0.10 UJ 0.75 J 1.3SOUTH DR 11/13/2007 0.16 J 0.32 J 0.063 U 0.063 UJ 0.17 JSOUTH REP 11/13/2007 0.15 J 0.23 J 0.063 U 0.063 UJ 0.16 JSUB 35 11/14/2007 0.072 J 2.4 J 0.064 U 0.064 J 0.071 UJTAYLOR D 11/15/2007 0.063 U 0.063 UJ 0.063 U 0.084 J 0.3 JTOP CK 11/14/2007 0.064 U 0.48 J 0.064 U 0.076 J 0.25 JWENAS 11/15/2007 0.063 U 0.074 J 0.063 U 0.063 UJ 0.14 JWIDE HOL 11/15/2007 0.70 UJ 0.062 UJ 0.83 0.98 J 4.4WIDE REP 11/15/2007 0.60 UJ 0.063 UJ 0.68 0.65 J 2.2 JZILLAH 11/14/2007 0.063 U 0.063 UJ 0.067 U 0.16 J 0.59 JSATUS 302 standing water SELAH CR. dryCOLD CR. dry
Endosulfan I
Endosulfan II
Endosulfan SulfateDieldrin Chlorpyrifos
U = not detected at or above reported value J = estimated REJ = rejected na = not analyzed

Yakima Pesticides/PCBs TMDL: Vol 1, WQ Study Findings Page 275
CollectionField ID Date (ng/L) (ng/L) (ng/L) (ng/L) (ng/L) (ng/L)
AHTANUM 11/15/2007 3.1 U 0.061 U 0.061 U 0.061 U 0.061 U 0.061 UAMON CK 11/13/2007 3.3 UJ 0.066 U 0.066 U 0.066 U 0.066 U 0.066 UCORRAL 11/13/2007 3.2 UJ 0.063 U 0.063 U 0.063 U 0.063 U 0.063 UCOULEE DR 11/14/2007 3.2 UJ 0.063 U 0.063 U 0.063 U 0.063 U 0.063 UCOWICHEE 11/15/2007 3.1 U 0.061 U 0.061 U 0.061 U 0.061 U 0.061 UDID 7 11/13/2007 3.2 UJ 0.064 U 0.064 U 0.064 U 0.064 U 0.064 UDRAIN 31 11/13/2007 3.2 UJ 0.064 U 0.064 U 0.064 U 0.064 U 0.064 UEAST TOP 11/14/2007 3.2 UJ 0.064 U 0.10 UJ 0.064 U 0.064 U 0.064 UGRANDVIEW 11/13/2007 3.2 UJ 0.065 U 0.065 U 0.065 U 0.065 U 0.065 UMARION 11/14/2007 3.3 UJ 0.067 U 0.067 U 0.067 U 0.067 U 0.067 USATUS 303 11/13/2007 3.3 UJ 0.066 U 0.066 U 0.066 U 0.066 U 0.066 USATUS CK 11/13/2007 3.3 UJ 0.066 U 0.066 U 0.066 U 0.066 U 0.066 USELAH DC H 11/26/2007 3.1 U 0.063 U 0.063 U 0.11 UJ 0.063 U 0.063 USOUTH DR 11/13/2007 3.2 UJ 0.063 U 0.063 U 0.063 U 0.063 U 0.063 USOUTH REP 11/13/2007 3.1 UJ 0.063 U 0.063 U 0.063 U 0.063 U 0.063 USUB 35 11/14/2007 3.2 UJ 0.064 U 0.064 U 0.064 U 0.064 U 0.064 UTAYLOR D 11/15/2007 3.1 U 0.063 U 0.063 U 0.063 U 0.063 U 0.063 UTOP CK 11/14/2007 3.2 UJ 0.064 U 0.064 U 0.064 U 0.064 U 0.064 UWENAS 11/15/2007 3.1 U 0.063 U 0.063 U 0.063 U 0.063 U 0.063 UWIDE HOL 11/15/2007 3.1 U 0.062 J 0.062 U 0.072 J 0.062 U 0.062 UWIDE REP 11/15/2007 3.1 U 0.063 U 0.063 U 0.063 U 0.063 U 0.063 UZILLAH 11/14/2007 3.2 0.063 U 0.063 U 0.067 U 0.067 U 0.067 USATUS 302 standing water SELAH CR. dryCOLD CR. dry
Oxy-chlordaneToxaphene
Cis-Chlordane
Cis-Nonachlor
Trans-Chlordane
Trans-Nonachlo
U = not detected at or above reported value J = estimated REJ = rejected na = not analyzed

Yakima Pesticides/PCBs TMDL: Vol 1, WQ Study Findings Page 276
CollectionField ID Date (ng/L) (ng/L) (ng/L) (ng/L) (ng/L) (ng/L)
AHTANUM 11/15/2007 0.061 U 0.061 U 0.061 UJ 0.061 U 0.061 U 0.061 UJAMON CK 11/13/2007 0.066 U 0.098 UJ 0.066 UJ 0.066 U 0.066 U 0.066 UJCORRAL 11/13/2007 0.063 U 0.063 U 0.063 UJ 0.063 U 0.063 U 0.063 UJCOULEE DR 11/14/2007 0.063 U 0.063 U 0.063 UJ 0.063 U 0.063 U 0.063 UJCOWICHEE 11/15/2007 0.061 U 0.061 U 0.061 UJ 0.061 U 0.061 U 0.061 UJDID 7 11/13/2007 0.064 U 0.064 U 0.064 UJ 0.064 U 0.064 U 0.064 UJDRAIN 31 11/13/2007 0.064 U 0.064 U 0.064 UJ 0.064 U 0.064 U 0.064 UJEAST TOP 11/14/2007 0.064 U 0.064 U 0.064 UJ 0.49 0.064 U 0.07 UJGRANDVIEW 11/13/2007 0.065 U 0.065 U 0.065 UJ 0.065 U 0.065 U 0.065 UJMARION 11/14/2007 0.067 U 0.067 U 0.067 UJ 0.067 U 0.067 U 0.067 UJSATUS 303 11/13/2007 0.14 0.16 J 0.066 UJ 0.085 0.066 U 0.066 UJSATUS CK 11/13/2007 0.066 U 0.066 U 0.066 UJ 0.066 U 0.066 U 0.066 UJSELAH DC H 11/26/2007 0.063 U 0.099 UJ 0.097 UJ 0.30 UJ 0.063 U 0.091 JSOUTH DR 11/13/2007 0.063 U 0.063 U 0.063 UJ 0.063 U 0.063 U 0.063 UJSOUTH REP 11/13/2007 0.063 U 0.063 U 0.063 UJ 0.063 U 0.063 U 0.063 UJSUB 35 11/14/2007 0.064 U 0.064 U 0.064 UJ 0.064 U 0.064 U 0.064 UJTAYLOR D 11/15/2007 0.063 U 0.12 UJ 0.063 UJ 0.063 U 0.063 U 0.063 UJTOP CK 11/14/2007 0.064 U 0.064 U 0.064 UJ 0.064 U 0.064 U 0.064 UJWENAS 11/15/2007 0.063 U 0.063 U 0.063 UJ 0.063 U 0.063 U 0.063 UJWIDE HOL 11/15/2007 0.062 U 0.062 U 0.062 UJ 0.062 U 0.062 U 0.36 JWIDE REP 11/15/2007 0.063 U 0.063 U 0.063 UJ 0.063 U 0.063 U 0.27 JZILLAH 11/14/2007 0.067 U 0.067 U 0.067 UJ 0.067 U 0.067 U 0.063 UJSATUS 302 standing water SELAH CR. dryCOLD CR. dry
EndrinAlpha-BHC
Beta-BHC
Delta-BHC Lindane Aldrin
U = not detected at or above reported value J = estimated REJ = rejected na = not analyzed

Yakima Pesticides/PCBs TMDL: Vol 1, WQ Study Findings Page 277
Collection
Field ID Date (ng/L) (ng/L) (ng/L) (ng/L) (ng/L)AHTANUM 11/15/2007 0.061 U 0.061 U 0.061 U 0.061 U 0.061 UAMON CK 11/13/2007 0.066 U 0.066 U 0.066 U 0.066 U 0.066 UCORRAL 11/13/2007 0.13 UJ 0.063 U 0.063 U 0.063 U 0.063 UCOULEE DR 11/14/2007 0.063 U 0.063 U 0.063 U 0.063 U 0.063 UCOWICHEE 11/15/2007 0.061 U 0.061 U 0.061 U 0.061 U 0.061 UDID 7 11/13/2007 0.064 U 0.064 U 0.064 U 0.064 U 0.064 UDRAIN 31 11/13/2007 0.18 UJ 0.064 U 0.064 U 0.064 U 0.064 UEAST TOP 11/14/2007 0.16 UJ 0.064 U 0.064 U 0.064 U 0.064 UGRANDVIEW 11/13/2007 0.092 UJ 0.065 U 0.065 U 0.065 U 0.065 UMARION 11/14/2007 0.067 U 0.067 U 0.067 U 0.067 U 0.067 USATUS 303 11/13/2007 0.096 UJ 0.066 U 0.066 U 0.066 U 0.066 USATUS CK 11/13/2007 0.1 UJ 0.066 U 0.066 U 0.066 U 0.066 USELAH DC H 11/26/2007 0.84 UJ 0.063 U 0.063 U 0.2 UJ 0.063 USOUTH DR 11/13/2007 0.064 UJ 0.063 U 0.063 U 0.063 U 0.063 USOUTH REP 11/13/2007 0.067 UJ 0.063 U 0.063 U 0.063 U 0.063 USUB 35 11/14/2007 0.064 U 0.064 U 0.064 U 0.064 U 0.064 UTAYLOR D 11/15/2007 0.21 UJ 0.11 UJ 0.063 U 0.063 U 0.063 UTOP CK 11/14/2007 0.064 U 0.064 U 0.064 U 0.064 U 0.064 UWENAS 11/15/2007 0.063 U 0.063 U 0.063 U 0.063 U 0.063 UWIDE HOL 11/15/2007 0.15 UJ 0.13 J 0.062 U 0.062 U 0.43 UJWIDE REP 11/15/2007 0.13 UJ 0.075 UJ 0.063 U 0.063 U 0.35 UJZILLAH 11/14/2007 0.097 UJ 0.067 U 0.067 U 0.067 U 0.067 USATUS 302 standing water SELAH CR. dryCOLD CR. dry
Endrin Aldehyde
Endrin Ketone Heptachlor
Heptachlor Epoxide
Hexachloro-benzene
U = not detected at or above reported value J = estimated REJ = rejected na = not analyzed

Yakima Pesticides/PCBs TMDL: Vol 1, WQ Study Findings Page 278
CollectionField ID Date (ng/L) (mg/L) (NTU) (umhos/cm)
AHTANUM 11/15/2007 0.25 UJ 3 2.6 219AMON CK 11/13/2007 0.066 UJ 2 0.6 718CORRAL 11/13/2007 0.086 UJ 3 1.8 545COULEE DR 11/14/2007 0.063 UJ 3 3.5 306COWICHEE 11/15/2007 0.45 UJ 2 1.2 345DID 7 11/13/2007 0.22 UJ 8 10 627DRAIN 31 11/13/2007 0.52 UJ 7 4.1 867EAST TOP 11/14/2007 0.064 UJ 11 11 310GRANDVIEW 11/13/2007 0.065 UJ 33 12 559MARION 11/14/2007 0.067 UJ 10 7.3 360SATUS 303 11/13/2007 0.24 UJ 1 U 1.0 1080SATUS CK 11/13/2007 0.19 UJ 2 2.2 237SELAH DC H 11/26/2007 0.063 UJ 73 28 696SOUTH DR 11/13/2007 0.063 UJ 10 3.4 780SOUTH REP 11/13/2007 0.10 UJ 10 4.4 780SUB 35 11/14/2007 0.064 UJ 11 8.9 331TAYLOR D 11/15/2007 0.33 UJ 3 2.6 432TOP CK 11/14/2007 0.19 UJ 5 6.0 424WENAS 11/15/2007 0.3 UJ 1 2.0 350WIDE HOL 11/15/2007 0.35 UJ 5 2.2 517WIDE REP 11/15/2007 0.39 UJ 4 2.7 517ZILLAH 11/14/2007 0.067 UJ 7 5.0 498SATUS 302 standing water SELAH CR. dryCOLD CR. dry
Methoxychlor
Total Suspended
Solids ConductivityTurbidity
U = not detected at or above reported value J = estimated REJ = rejected na = not analyzed

Yakima Pesticides/PCBs TMDL: Vol 1, WQ Study Findings Page 279
Collection FlowSample No. Field ID Date (cfs) (ng/L) (ng/L) (ng/L)
8074084 AHTANUM 2/11/2008 44 0.062 U 0.2 0.0798074101 AMON CK 2/13/2008 9.6 0.065 U 0.085 0.065 U8074099 CORRAL 2/13/2008 4.6 0.064 U 0.14 0.064 U8074090 COULEE DR 2/12/2008 <1 0.062 U 0.35 J 0.14 J8074104 COWICHEE 2/11/2008 10.0 0.13 0.38 0.0858074093 DID7 2/13/2008 3.6 0.065 U 0.52 0.1 J8074097 DRAIN 31 2/13/2008 0.1 0.064 U 0.38 0.075 J8074086 EAST TOP 2/12/2008 6.6 0.063 U 0.74 J 0.39 J8074096 GRANDVIEW 2/13/2008 5.1 1.1 J 2.9 J 0.8 J8074088 MARION 2/12/2008 179 0.061 U 0.5 J 0.14 J8074094 SATUS 303 2/13/2008 1.3 0.063 U 0.33 0.063 U8074091 SATUS CK 2/12/2008 352 0.063 U 0.063 U 0.063 U8074080 SELAH CK 2/11/2008 1.7 0.061 UJ 0.061 UJ 0.061 UJ8074082 SELAH DCH 2/11/2008 1.3 0.25 1.4 0.748074092 SOUTH DR 2/13/2008 10 0.066 J 0.68 0.18 J8074102 SOUTH REP 2/13/2008 - - 0.066 J 0.67 0.17 J8074087 SUB 35 2/12/2008 20.9 0.28 J 1.4 J 1.1 J8074100 TAYLOR D 2/11/2008 3.8 0.063 U 0.31 0.10 J8074089 TOP CK 2/12/2008 112 0.063 U 0.11 0.063 U8074081 WENAS 2/11/2008 2.5 0.065 U 0.15 0.065 U8074083 WIDE HOL 2/12/2008 3.3 0.1 J 1.2 J 0.47 J8074085 ZILLAH 2/12/2008 0.1 0.15 1.3 0.368074103 ZILLAH REP 2/12/2008 - - 0.09 0.79 0.21 - - COLD CR. dry - - WAUNA dry
4,4'-DDT 4,4'-DDE 4,4'-DDD
U = not detected at or above reported value J = estimated REJ = rejected na = not analyzed

Yakima Pesticides/PCBs TMDL: Vol 1, WQ Study Findings Page 280
CollectionField ID Date (ng/L) (ng/L) (ng/L) (ng/L) (ng/L)
AHTANUM 2/11/2008 0.062 U 0.18 UJ 0.062 U 0.062 U 0.4 JAMON CK 2/13/2008 0.065 U 0.15 J 0.074 J 0.12 J 1.1 JCORRAL 2/13/2008 0.064 U 0.068 J 0.064 U 0.064 U 0.35 JCOULEE DR 2/12/2008 0.062 U 1.1 0.11 0.062 U 0.17 JCOWICHEE 2/11/2008 0.065 U 0.86 0.12 J 0.18 J 1.7 UJDID7 2/13/2008 0.065 U 0.11 J 0.065 U 0.065 U 0.29 JDRAIN 31 2/13/2008 0.38 0.82 0.27 J 0.3 0.43 UJEAST TOP 2/12/2008 0.29 1.7 0.063 U 0.33 J 0.48 JGRANDVIEW 2/13/2008 0.3 0.087 J 0.062 U 0.062 U 0.21 UJMARION 2/12/2008 0.061 U 0.86 0.072 0.061 U 0.13 JSATUS 303 2/13/2008 0.27 0.79 J 0.17 0.11 J 1.5 UJSATUS CK 2/12/2008 0.063 U 0.14 J 0.063 U 0.063 U 0.26 JSELAH CK 2/11/2008 0.061 U 0.061 U 0.48 UJ 0.39 UJ 8.7 JSELAH DCH 2/11/2008 0.88 J 0.063 U 1.2 J 1.4 J 2.7 JSOUTH DR 2/13/2008 0.12 0.21 J 0.078 J 0.063 U 0.41 JSOUTH REP 2/13/2008 0.13 0.15 J 0.075 J 0.064 U 0.39 JSUB 35 2/12/2008 0.061 U 1.2 0.061 U 0.061 U 0.1 JTAYLOR D 2/11/2008 0.33 J 1.2 0.063 U 0.063 U 0.88 JTOP CK 2/12/2008 0.063 U 0.53 J 0.084 J 0.063 U 0.54 JWENAS 2/11/2008 0.35 J 0.72 J 0.4 UJ 0.22 J 1.1 JWIDE HOL 2/12/2008 1.0 J 0.55 J 2.2 J 2 J 13 JZILLAH 2/12/2008 0.063 U 0.56 0.063 J 0.15 1.1ZILLAH REP 2/12/2008 0.063 U 0.34 0.063 U 0.078 J 0.36 JCOLD CR. dryWAUNA dry
Endosulfan I
Endosulfan II
Endosulfan SulfateDieldrin Chlorpyrifos
U = not detected at or above reported value J = estimated REJ = rejected na = not analyzed

Yakima Pesticides/PCBs TMDL: Vol 1, WQ Study Findings Page 281
CollectionField ID Date (ng/L) (ng/L) (ng/L) (ng/L) (ng/L) (ng/L)
AHTANUM 2/11/2008 3.1 U 0.062 U 0.062 U 0.062 U 0.062 U 0.062 UAMON CK 2/13/2008 3.2 U 0.065 U 0.065 U 0.065 U 0.065 U 0.065 UCORRAL 2/13/2008 3.2 U 0.064 U 0.064 U 0.064 U 0.064 U 0.064 UCOULEE DR 2/12/2008 3.1 U 0.062 U 0.062 U 0.062 U 0.062 U 0.062 UCOWICHEE 2/11/2008 3.2 U 0.065 U 0.065 U 0.065 U 0.065 U 0.065 UDID7 2/13/2008 3.2 U 0.065 U 0.065 U 0.065 U 0.065 U 0.065 UDRAIN 31 2/13/2008 3.2 U 0.064 U 0.064 U 0.064 U 0.064 U 0.064 UEAST TOP 2/12/2008 3.1 U 0.094 UJ 0.063 U 0.71 UJ 0.063 U 0.063 UGRANDVIEW 2/13/2008 3.1 U 0.062 U 0.062 U 0.062 U 0.062 U 0.062 UMARION 2/12/2008 3.1 U 0.061 U 0.061 U 0.061 U 0.061 U 0.061 USATUS 303 2/13/2008 3.1 U 0.063 U 0.063 U 0.063 U 0.063 U 0.063 USATUS CK 2/12/2008 3.2 U 0.063 U 0.063 U 0.063 U 0.063 U 0.063 USELAH CK 2/11/2008 3.1 UJ 0.061 UJ 0.061 UJ 0.061 UJ 0.061 UJ 0.061 UJSELAH DCH 2/11/2008 3.1 U 0.063 U 0.063 U 0.063 U 0.063 U 0.063 USOUTH DR 2/13/2008 3.2 U 0.063 U 0.063 U 0.063 U 0.063 U 0.063 USOUTH REP 2/13/2008 3.2 U 0.064 U 0.064 U 0.064 U 0.064 U 0.064 USUB 35 2/12/2008 3.1 U 0.061 U 0.061 U 0.061 U 0.061 U 0.061 UTAYLOR D 2/11/2008 3.2 U 0.063 U 0.063 U 0.063 U 0.063 U 0.063 UTOP CK 2/12/2008 3.1 U 0.063 U 0.063 U 0.063 U 0.063 U 0.063 UWENAS 2/11/2008 3.2 U 0.065 U 0.065 U 0.065 U 0.065 U 0.065 UWIDE HOL 2/12/2008 3.2 U 0.065 U 0.065 U 0.065 U 0.065 U 0.065 UZILLAH 2/12/2008 3.1 U 0.063 U 0.063 U 0.063 U 0.063 U 0.063 UZILLAH REP 2/12/2008 3.1 U 0.063 U 0.063 U 0.063 U 0.063 U 0.063 UCOLD CR. dryWAUNA dry
Oxy-chlordaneToxaphene
Cis-Chlordane
Cis-Nonachlor
Trans-Chlordane
Trans-Nonachlor
U = not detected at or above reported value J = estimated REJ = rejected na = not analyzed

Yakima Pesticides/PCBs TMDL: Vol 1, WQ Study Findings Page 282
CollectionField ID Date (ng/L) (ng/L) (ng/L) (ng/L) (ng/L) (ng/L)
AHTANUM 2/11/2008 0.062 U 0.063 UJ 0.062 U 0.062 U 0.064 UJ 0.062 UAMON CK 2/13/2008 0.065 U 0.065 U 0.065 U 0.065 U 0.13 UJ 0.099 UJCORRAL 2/13/2008 0.064 U 0.064 U 0.064 U 0.064 U 0.087 0.064 UCOULEE DR 2/12/2008 0.062 U 0.062 U 0.062 U 0.062 U 0.21 UJ 0.062 UCOWICHEE 2/11/2008 0.065 U 0.065 U 0.065 U 0.065 U 0.58 UJ 0.14 UJDID7 2/13/2008 0.065 U 0.065 U 0.065 U 0.065 U 0.12 UJ 0.065 UDRAIN 31 2/13/2008 0.064 U 0.064 U 0.064 U 0.064 U 0.064 U 0.064 UEAST TOP 2/12/2008 0.063 U 0.063 U 0.063 U 0.064 UJ 0.27 UJ 0.07 UJGRANDVIEW 2/13/2008 0.062 U 0.062 U 0.062 U 0.062 U 0.28 0.062 UMARION 2/12/2008 0.061 U 0.061 U 0.061 U 0.061 U 0.067 UJ 0.061 USATUS 303 2/13/2008 0.063 U 0.063 U 0.063 U 0.063 U 0.10 UJ 0.19 UJSATUS CK 2/12/2008 0.063 U 0.063 U 0.063 U 0.063 U 0.12 UJ 0.063 USELAH CK 2/11/2008 0.085 J 0.061 J 0.061 UJ 0.075 J 1.6 UJ 2.7 UJSELAH DCH 2/11/2008 0.063 U 0.079 UJ 0.063 U 0.063 U 0.14 UJ 0.12 UJSOUTH DR 2/13/2008 0.063 U 0.063 U 0.063 U 0.063 U 0.17 UJ 0.068SOUTH REP 2/13/2008 0.064 U 0.064 U 0.064 U 0.064 U 0.17 UJ 0.064 USUB 35 2/12/2008 0.061 U 0.061 U 0.061 U 0.061 U 0.061 U 0.061 UTAYLOR D 2/11/2008 0.063 U 0.063 U 0.063 U 0.063 U 0.83 UJ 0.15 UJTOP CK 2/12/2008 0.063 U 0.063 U 0.063 U 0.063 U 0.27 UJ 0.063 UWENAS 2/11/2008 0.065 U 0.065 U 0.065 U 0.065 U 0.99 UJ 0.37WIDE HOL 2/12/2008 0.065 U 0.065 U 0.065 U 0.065 U 0.11 UJ 0.41 JZILLAH 2/12/2008 0.063 U 0.063 U 0.063 U 0.063 U 0.064 UJ 0.063 UZILLAH REP 2/12/2008 0.063 U 0.063 U 0.063 U 0.063 U 0.063 U 0.063 UCOLD CR. dryWAUNA dry
EndrinAlpha-BHC
Beta-BHC
Delta-BHC Lindane Aldrin
U = not detected at or above reported value J = estimated REJ = rejected na = not analyzed

Yakima Pesticides/PCBs TMDL: Vol 1, WQ Study Findings Page 283
CollectionField ID Date (ng/L) (ng/L) (ng/L) (ng/L) (ng/L)
AHTANUM 2/11/2008 0.062 U 0.062 U 0.062 U 0.062 U 0.062 UAMON CK 2/13/2008 0.13 UJ 0.065 U 0.065 U 0.065 U 0.065 UCORRAL 2/13/2008 0.064 U 0.064 U 0.064 U 0.064 U 0.064 UCOULEE DR 2/12/2008 0.062 U 0.15 UJ 0.062 U 0.062 U 0.062 UCOWICHEE 2/11/2008 0.065 UJ 0.065 U 0.065 U 0.065 U 0.065 UDID7 2/13/2008 0.065 U 0.069 UJ 0.065 U 0.065 U 0.065 UDRAIN 31 2/13/2008 0.11 UJ 0.23 UJ 0.064 U 0.11 UJ 0.064 UEAST TOP 2/12/2008 0.18 UJ 0.063 U 0.063 U 0.063 U 0.063 UGRANDVIEW 2/13/2008 0.069 UJ 0.071 UJ 0.062 U 0.062 U 0.062 UMARION 2/12/2008 0.061 U 0.061 U 0.061 U 0.061 U 0.061 USATUS 303 2/13/2008 0.21 UJ 0.063 U 0.063 U 0.063 U 0.063 USATUS CK 2/12/2008 0.081 UJ 0.063 U 0.063 U 0.063 U 0.063 USELAH CK 2/11/2008 1.9 UJ 1.9 UJ 0.061 UJ 2.0 UJ 0.093 UJSELAH DCH 2/11/2008 0.063 U 0.063 U 0.063 U 0.57 UJ 0.063 USOUTH DR 2/13/2008 0.063 U 0.074 UJ 0.063 U 0.063 U 0.063 USOUTH REP 2/13/2008 0.064 U 0.064 U 0.064 U 0.064 U 0.064 USUB 35 2/12/2008 0.061 U 0.061 U 0.061 U 0.061 U 0.061 UTAYLOR D 2/11/2008 1.4 UJ 0.063 U 0.063 U 0.063 U 0.063 UTOP CK 2/12/2008 0.063 U 0.13 UJ 0.063 U 0.063 U 0.063 UWENAS 2/11/2008 0.31 UJ 0.5 UJ 0.065 U 0.17 UJ 0.065 UWIDE HOL 2/12/2008 0.081 UJ 0.20 J 0.065 U 0.065 U 0.61 JZILLAH 2/12/2008 0.15 UJ 0.063 U 0.063 U 0.063 U 0.063 UZILLAH REP 2/12/2008 0.09 UJ 0.063 U 0.063 U 0.063 U 0.063 UCOLD CR. dryWAUNA dry
Endrin Aldehyde
Endrin Ketone Heptachlor
Heptachlor Epoxide
Hexachloro-benzene
U = not detected at or above reported value J = estimated REJ = rejected na = not analyzed

Yakima Pesticides/PCBs TMDL: Vol 1, WQ Study Findings Page 284
CollectionField ID Date (ng/L) (mg/L) (NTU) (umhos/cm)
AHTANUM 2/11/2008 0.062 UJ 12 7.8 205AMON CK 2/13/2008 0.075 UJ 32 10 759CORRAL 2/13/2008 0.15 UJ 9 4.3 579COULEE DR 2/12/2008 0.062 UJ 8 5.4 298COWICHEE 2/11/2008 0.065 UJ 9 8.1 188DID7 2/13/2008 0.094 UJ 5 3.9 625DRAIN 31 2/13/2008 0.58 UJ 2 2.2 834EAST TOP 2/12/2008 0.64 UJ 12 6.8 296GRANDVIEW 2/13/2008 1.3 J 8 4.1 593MARION 2/12/2008 0.061 UJ 19 7.4 376SATUS 303 2/13/2008 1.4 UJ 1 U 0.5 1080SATUS CK 2/12/2008 0.25 UJ 19 7.9 123SELAH CK 2/11/2008 1.8 UJ 30 39 210SELAH DCH 2/11/2008 1.0 UJ 30 9.7 681SOUTH DR 2/13/2008 0.063 UJ 4 4.4 766SOUTH REP 2/13/2008 0.064 UJ 5 3.1 768SUB 35 2/12/2008 0.061 UJ 23 9.7 350TAYLOR D 2/11/2008 0.063 UJ 3 3.4 540TOP CK 2/12/2008 0.063 UJ 10 7.9 338WENAS 2/11/2008 0.66 UJ 7 6.5 281WIDE HOL 2/12/2008 0.17 UJ 2 1.0 540ZILLAH 2/12/2008 0.16 UJ 4 2.8 530ZILLAH REP 2/12/2008 0.063 UJ 4 2.6 534COLD CR. dryWAUNA dry
Methoxychlor
Total Suspended
Solids Turbidity Conductivity
U = not detected at or above reported value J = estimated REJ = rejected na = not analyzed

Yakima Pesticides/PCBs TMDL: Vol 1, WQ Study Findings Page 285
Appendix L. Washington State Department of Health Fish Consumption Advisory
You are here: DOH Home » News Releases Home » 09-075 Search | Employees
For immediate release: April 30, 2009 (09-075)
Contacts: Dave McBride, Environmental Health Assessments 360-236-3176 Allison Cook, Communications Office 360-236-4022
Yakima River fish consumption advisory lifted due to lower DDT levels Other fish will be added due to increased PCB monitoring and detection
OLYMPIA Dropping levels of DDT found in fish in the Yakima River have led state health officials to drop advisories to limit meals from certain fish species from the river. Recent data on PCBs, though, has resulted in new advice on eating common carp from the Yakima.
Since 1993 the Department of Health has recommended people eat no more than one meal a week of bottom fish from the Yakima River to avoid DDT exposure. At that time, DDT levels in Yakima River bottom fish were among the highest reported in the nation. The advisory was for largescale and bridgelip sucker, mountain whitefish, channel catfish, northern pikeminnow, and common carp. DDT is a pesticide that was used in agriculture; its use was banned in the 1970s.
A Department of Ecology study completed in 2007 found erosion control projects put in place by Yakima basin irrigators helped reduce DDT and its byproducts in fish from the Yakima River. The state health department evaluated the new data and determined the fish advisories based on DDT levels are no longer needed. The declining levels of DDT in resident bottom fish from the river, along with proper cleaning and cooking, allow people to eat them safely without limits.
"Fish is an excellent low-fat food and a great source of protein, vitamins, and minerals," said State Health Officer Dr. Maxine Hayes. "It’s important to include a variety of fish as part of a healthy diet. And while the news on DDT in Yakima River fish is good, we recently learned that PCBs in carp from the lower Yakima are high enough to warrant a meal limit. This is especially true for young children and women who might one day become pregnant."
"Yakima Valley irrigators really stepped up and deserve recognition for tackling a tough problem on one of Washington’s great rivers," said Department of Ecology Director Jay Manning. "Like most watersheds, there’s more work to be done, but this community has shown it can take on these types of challenges."

Yakima Pesticides/PCBs TMDL: Vol 1, WQ Study Findings Page 286
Data from the Ecology fish tissue study showed PCB levels in common carp in the lower section of the river indicate a need for a limit of one meal per week. This advisory includes carp taken from the lower Yakima River from the city of Prosser to the mouth near Richland.
PCB levels for other species sampled throughout the river system were below levels of health concern for people. Meanwhile, the statewide mercury advisory for women who are or might become pregnant, nursing mothers, and young children remains in effect. State health officials advise people in these groups not to eat northern pikeminnow, and to limit largemouth and smallmouth bass to two meals per month.
PCBs and mercury are long-lasting chemicals that are found worldwide. They can cause behavior and learning deficits in children exposed in the womb. Banned since 1977, PCBs were used as insulating fluid in electrical transformers, lubricants, and hydraulic fluids. Mercury occurs naturally but also comes from coal-fired electric plants and improper disposal of fluorescent bulbs, thermometers, thermostats, and electrical switches.
To reduce your exposure to PCBs in common carp from the Yakima River, the Department of Health recommends you:
Limit your consumption of common carp caught from Prosser to the mouth of the river near Richland to no more than one meal per week.
Cook and clean fish to reduce contaminants; remove fat, skin, and organs and allow fat to drip off during cooking. Filleting reduces PCB, but not mercury contamination.
Learn more about the Yakima River fish advisory, other fish consumption advisories, and healthy fish choices (www.doh.wa.gov/fish/) on the state health department Web site.

Yakima Pesticides/PCBs TMDL: Vol 1, WQ Study Findings Page 287
Appendix M. SPMD Data, 2007-08 Appendix M-1. SPMD Data for Spring 2007.
Sample No. Field ID
Residue in SPMD (ng/sample)
Water Column Concentration
(ng/L, dissolved)
ToxapheneTotal PCBs
Toxaphene Total PCBs
7234180 EASTON 50 UJ 95 J 0.077 UJ 0.084 U
7234181 EASTON BLANK 50 UJ 148 J - - J
7234182 TOWNE DIV 50 UJ 159 J 0.095 UJ 0.12 J
7244015 WILSON CR† 332 J 124 J 0.50 J 0.007 J
7234184 ROZA DAM 100 J 165 J 0.19 J 0.018 J
7234185 NACHES R 73 J 257 J 0.11 J 0.063 J
7234186 MOXEE 470 198 J 0.71 0.024 J
7234187 SUNNYSIDE 150 J 187 J 0.23 J 0.020 J
7234188 GRANGER 550 J 338 J 0.84 J 0.095 J
7234189 SULPHUR 1,900 J 418 J 2.96 J 0.16 J
7234190 SULPHUR REP 1,700 J 532 J 2.73 J 0.27 J
7234191 SULPHUR BLANK 50 U 150 J - - - -
7234192 PROSSER 200 194 J 0.30 0.021 J
7234193 PROSSER REP 210 J 268 J 0.33 J 0.075 J
7234194 SPRING CR 270 J 198 J 0.42 J 0.024 J
7234195 HORN RAPIDS 240 246 J 0.36 0.045 J
Note: Dissolved PCB concentrations calculated after subtracting average field blank residue (149 ng). *Laboratory blank for SPMD preparation prior to field deployment. †Collected Spring 2008. U = not detected. UJ = not detected, reporting limit is an estimate. J= estimated concentration.

Yakima Pesticides/PCBs TMDL: Vol 1, WQ Study Findings Page 288
Appendix M-2. SPMD Data for Winter 2007.
Sample No.
Field ID
Residue in SPMD Water Column Concentration
(ng/sample) (ng/L, dissolved)
Toxaphene Total PCBs
Toxaphene Total PCBs
7484250 EASTON 50 U 136 J 0.083 U 0.11 J
7484251 EASTON BLANK 50 UJ 104 J - - - -
7484252 TOWNE DIV 50 U 152 J 0.084 U 0.13 J
7484253 WILSON CR 78 J 128 J 0.12 J 0.084 J
7484254 ROZA DAM 50 U 120 J 0.081 U 0.086 J
7484255 NACHES R 50 UJ 119 J 0.084 UJ 0.099 J
7484256 MOXEE 88 J 146 J 0.14 J 0.11 J
7484257 SUNNYSIDE 66 J 116 J 0.10 J 0.065 J
7484258 GRANGER 190 J 249 J 0.30 J 0.15 J
7484259 SULPHUR 452 J 191 J 0.68 J 0.084 J
7484260 SULPHUR BLANK 50 UJ 108 J - - - -
7484261 PROSSER 86 J 104 J 0.13 J 0.056 J
7484262 PROSSER REP 86 J 132 J 0.13 J 0.053 J
7484263 SPRING CR 110 J 138 J 0.19 J 0.12 J
7484264 HORN RAPIDS 68 J 124 J 0.10 J 0.063 J
Note: Dissolved PCB concentrations calculated after subtracting average field blank residue (106 ng). *Laboratory blank for SPMD preparation prior to field deployment. U = not detected. UJ = not detected, reporting limit is an estimate. J= estimated concentration.

Yakima Pesticides/PCBs TMDL: Vol 1, WQ Study Findings Page 289
Appendix N. Wastewater Treatment Plant Effluent Data, 2007-08
Collection Flow
Sample No. Field ID Date (mgd) (ng/L) (ng/L) (ng/L)
7248002 CLE ELUM WP 6/12/2007 0.460 na na na
7248001 ELLENSBURG WP 6/12/2007 3.69 na na na
7248014 ELLENSBURG REP 6/12/2007 - - na na na
7248000 KITTITAS WP 6/12/2007 0.212 na na na
7238100 SELAH WP 6/7/2007 1.05 2.1 UJ 2.1 UJ 2.1 UJ
7238101 NACHES WP 6/7/2007 0.101 2.1 UJ 2.1 UJ 2.1 UJ
7238102 COWICHE WP 6/7/2007 0.176 2.0 UJ 2.0 UJ 2.0 UJ
7238103 YAKIMA WP 6/7/2007 11.9 2.1 UJ 2.1 UJ 2.1 UJ
7238118 YAKIMA REP 6/7/2007 - - 2.1 UJ 2.1 UJ 2.1 UJ
7248003 MOXEE WP 6/12/2007 0.175 2.0 UJ 2.0 UJ 2.0 UJ
7248004 BUENA WP 6/12/2007 0.750 2.0 UJ 2.0 UJ 2.0 UJ
7248005 ZILLAH WP 6/12/2007 0.240 2.1 UJ 2.1 UJ 2.1 UJ
7248006 GRANGER WP 6/12/2007 0.178 2.1 UJ 2.1 UJ 2.1 UJ
7248007 SUNNYSIDE WP 6/12/2007 1.07 2.0 UJ 2.0 UJ 2.0 UJ
7248008 SS PORT WP 6/12/2007 0.534 2.0 UJ 2.0 UJ 2.0 UJ
7248009 MABTON WP 6/12/2007 0.110 2.0 UJ 2.0 UJ 2.0 UJ
7248010 GRANDVIEW WP 6/12/2007 1.75 2.0 UJ 2.0 UJ 2.0 UJ
7248011 PROSSER WP 6/14/2007 0.918 2.2 UJ 2.2 UJ 2.2 UJ
7248012 BENTONC WP 6/14/2007 0.185 2.1 UJ 2.1 UJ 2.1 UJ
7248013 W RICHLAND 6/14/2007 0.581 2.1 UJ 2.1 UJ 2.1 UJ
7248015 TRNSFR BLANK 6/12/2007 - - 2.0 UJ 2.0 UJ 2.0 UJ
7388847 CLE ELUM WP 9/18/2007 0.380 na na na
7388846 ELLENSBURG WP 9/18/2007 2.54 na na na
7388845 KITTITAS WP 9/18/2007 0.252 na na na
7388848 SELAH WP 9/20/2007 1.05 5.1 UJ 5.1 UJ 5.1 UJ
7388849 NACHES WP 9/20/2007 0.112 5.0 UJ 5.0 UJ 5.0 UJ
7388850 COWICHE WP 9/20/2007 0.165 5.1 UJ 5.1 UJ 5.1 UJ
7388851 YAKIMA WP 9/20/2007 12.8 5.1 UJ 5.1 UJ 5.1 UJ
7398827 MOXEE WP 9/25/2007 0.170 4.9 UJ 4.9 UJ 4.9 UJ
7398828 BUENA WP 9/25/2007 0.080 5.2 UJ 5.2 UJ 5.2 UJ
7398829 ZILLAH WP 9/25/2007 0.222 5.3 U 5.3 UJ 5.3 U
7398830 GRANGER WP 9/25/2007 0.193 5.1 U 5.1 UJ 5.1 U
7398834 SUNNYSIDE WP 9/25/2007 1.16 5.1 UJ 5.1 UJ 5.1 UJ
7398839 SUNYSIDE REP 9/25/2007 - - 5.2 UJ 5.2 UJ 5.2 UJ
7398835 SS PORT WP 9/25/2007 1.39 5.1 UJ 5.1 UJ 5.1 UJ
7398837 MABTON WP 9/25/2007 0.114 5.1 U 5.1 UJ 5.1 U
7398836 GRANDVIEW WP 9/25/2007 1.42 5.2 UJ 5.2 UJ 5.2 UJ
7398831 PROSSER WP 9/27/2007 0.956 5.3 UJ 5.3 UJ 5.3 UJ
7398832 BENTON WP 9/27/2007 0.189 5.4 UJ 5.4 UJ 5.4 UJ
7398833 W RICHLAND 9/27/2007 0.956 5.5 UJ 5.5 UJ 5.5 UJ
7398838 W RICHLAND REP 9/27/2007 - - 5.5 UJ 5.5 UJ 5.5 UJ
7398840 TRNSFR BLANK na na na
7'398841 BOTTLE BLNK na na na
4,4'-DDD 4,4'-DDE 4,4'-DDT
U = not detected at or above reported value J = estimated REJ = rejected na = not analyzed LS = lost in shipment

Yakima Pesticides/PCBs TMDL: Vol 1, WQ Study Findings Page 290
Collection
Field ID Date (ng/L) (ng/L) (ng/L) (ng/L) (ng/L)
CLE ELUM WP 6/12/2007 na na na na na
ELLENSBURG WP 6/12/2007 na na na na na
ELLENSBURG REP 6/12/2007 na na na na na
KITTITAS WP 6/12/2007 na na na na na
SELAH WP 6/7/2007 2.1 U 2.1 U 2.1 U 2.1 U 2.7 J
NACHES WP 6/7/2007 2.1 U 2.1 U 2.1 U 2.1 U 3.5 J
COWICHE WP 6/7/2007 2.0 U 8.7 J 2.0 U 12 29 J
YAKIMA WP 6/7/2007 2.1 U 5.3 2.1 U 2.1 U 2.1 U
YAKIMA REP 6/7/2007 2.1 U 6.1 2.1 U 2.1 U 2.1 U
MOXEE WP 6/12/2007 2.0 U 3.2 2.0 U 2.0 U 2.7 J
BUENA WP 6/12/2007 2.0 U 2.2 J 2.0 U 2.0 U 6.7 J
ZILLAH WP 6/12/2007 2.1 U 4.2 2.1 U 2.1 U 5.4 J
GRANGER WP 6/12/2007 2.1 U 4.1 2.1 U 2.1 U 8.0 J
SUNNYSIDE WP 6/12/2007 2.0 U 2.0 J 2.0 U 2.0 U 4.5 J
SS PORT WP 6/12/2007 2.0 UJ 2.0 UJ 2.0 UJ 2.0 UJ 2.5 J
MABTON WP 6/12/2007 2.0 U 2.4 J 2.0 U 2.0 U 6.7 J
GRANDVIEW WP 6/12/2007 2.0 U 2 U 2 U 2.0 U 2.0 J
PROSSER WP 6/14/2007 2.2 U 2.2 U 2.2 U 2.2 U 2.2 U
BENTONC WP 6/14/2007 2.1 U 2.1 U 2.1 U 2.1 U 3.3 J
W RICHLAND 6/14/2007 2.1 U 2.1 U 2.1 U 2.1 U 2.1 U
TRNSFR BLANK 6/12/2007 2.0 U 2.0 U 2.0 U 2.0 U 2.0 U
CLE ELUM WP 9/18/2007 na na na na na
ELLENSBURG WP 9/18/2007 na na na na na
KITTITAS WP 9/18/2007 na na na na na
SELAH WP 9/20/2007 5.1 U 5.1 U 5.1 U 5.1 U 5.1 U
NACHES WP 9/20/2007 5.0 U 5.0 U 5.0 U 5.0 U 5.0 U
COWICHE WP 9/20/2007 5.1 U 5.1 U 5.1 U 33 12
YAKIMA WP 9/20/2007 5.1 U 7.2 UJ 5.1 U 5.1 U 5.1 U
MOXEE WP 9/25/2007 4.9 UJ 4.9 UJ 4.9 UJ 4.9 UJ 4.9 UJ
BUENA WP 9/25/2007 5.2 U 5.2 U 5.2 U 5.2 U 5.2 U
ZILLAH WP 9/25/2007 5.3 U 5.3 U 5.3 U 5.3 U 16
GRANGER WP 9/25/2007 5.1 U 5.1 U 5.1 U 5.1 U 7.1
SUNNYSIDE WP 9/25/2007 5.1 U 5.1 U 5.1 U 5.1 U 8.3
SUNYSIDE REP 9/25/2007 5.2 U 5.2 U 5.2 U 5.2 U 5.8 J
SS PORT WP 9/25/2007 5.1 UJ 5.1 UJ 5.1 UJ 5.1 UJ 5.1 UJ
MABTON WP 9/25/2007 5.1 U 5.1 U 5.1 U 5.1 U 8.4
GRANDVIEW WP 9/25/2007 5.2 U 5.2 U 5.2 U 5.2 U 5.2 U
PROSSER WP 9/27/2007 5.3 U 5.3 U 5.3 U 5.3 U 5.3 U
BENTON WP 9/27/2007 5.4 U 5.4 U 5.4 U 5.4 U 5.4 U
W RICHLAND 9/27/2007 5.5 U 5.5 U 5.5 U 5.5 U 5.5 U
W RICHLAND REP 9/27/2007 5.5 U 5.5 U 5.5 U 5.5 U 5.5 U
TRNSFR BLANK na na na na na
BOTTLE BLNK na na na na na
Dieldrin Chlorpyrifos Endosulfan IEndosulfan
IIEndosulfan
Sulfate
U = not detected at or above reported value J = estimated REJ = rejected na = not analyzed LS = lost in shipment

Yakima Pesticides/PCBs TMDL: Vol 1, WQ Study Findings Page 291
U = not detected at or above reported value J = estimated REJ = rejected na = not analyzed LS = lost in shipment
Field IDCollection
DateCLE ELUM WP 6/12/2007 na na na na naELENSBURG WP 6/12/2007 na na na na naELENSBRG REP 6/12/2007 na na na na naKITTITAS WP 6/12/2007 na na na na naSELAH WP 6/7/2007 2.1 UJ 2.1 UJ 2.1 UJ 2.1 UJ 2.1 UJNACHES WP 6/7/2007 2.1 UJ 2.1 UJ 2.1 UJ 2.1 UJ 2.1 UJCOWICHE WP 6/7/2007 2.0 UJ 2.0 UJ 2.0 UJ 2.0 UJ 2.0 UJYAKIMA WP 6/7/2007 2.1 UJ 2.1 UJ 2.1 UJ 2.1 UJ 2.1 UJYAKIMA REP 6/7/2007 2.1 UJ 2.1 UJ 2.1 UJ 2.1 UJ 2.1 UJMOXEE WP 6/12/2007 2.0 UJ 2.0 UJ 2.0 UJ 2.0 UJ 2.0 UJBUENA WP 6/12/2007 2.0 UJ 2.0 UJ 2.0 UJ 2.0 UJ 2.0 UJZILLAH WP 6/12/2007 2.1 UJ 2.1 UJ 2.1 UJ 2.1 UJ 2.1 UJGRANGER WP 6/12/2007 2.1 UJ 2.1 UJ 2.1 UJ 2.1 UJ 2.1 UJSUNNYSIDE WP 6/12/2007 2.0 UJ 2.0 UJ 2.0 UJ 2.0 UJ 2.0 UJSS PORT WP 6/12/2007 2.0 UJ 2.0 UJ 2.0 UJ 2.0 UJ 2.0 UJMABTON WP 6/12/2007 2.0 UJ 2.0 UJ 2.0 UJ 2.0 UJ 2.0 UJGRANDVIEW WP 6/12/2007 2.0 UJ 2.0 UJ 2.0 UJ 2.0 UJ 2.0 UJPROSSER WP 6/14/2007 2.2 UJ 2.2 UJ 2.2 UJ 2.2 UJ 2.2 UJBENTONC WP 6/14/2007 2.1 UJ 2.1 UJ 2.1 UJ 2.1 UJ 2.1 UJW RICHLAND WP 6/14/2007 2.1 UJ 2.1 UJ 2.1 UJ 2.1 UJ 2.1 UJTRNSFR BLNK 6/12/2007 2.0 U 2.0 U 2.0 U 2.0 U 2.0 U
CLE ELUM WP 9/18/2007 na na na na naELENSBURG WP 9/18/2007 na na na na naKITTITAS WP 9/18/2007 na na na na naSELAH WP 9/20/2007 5.1 UJ 5.1 UJ 5.1 UJ 5.1 UJ 5.1 UJNACHES WP 9/20/2007 5.0 UJ 5.0 UJ 5.0 UJ 5.0 UJ 5.0 UJCOWICHE WP 9/20/2007 5.1 UJ 5.1 UJ 5.1 UJ 5.1 UJ 5.1 UJYAKIMA WP 9/20/2007 5.1 UJ 5.1 UJ 5.1 UJ 5.1 UJ 5.1 UJMOXEE WP 9/25/2007 4.9 UJ 4.9 UJ 4.9 UJ 4.9 UJ 4.9 UJBUENA WP 9/25/2007 5.2 UJ 5.2 UJ 5.2 UJ 5.2 UJ 5.2 UJZILLAH WP 9/25/2007 5.3 U 5.3 U 5.3 U 5.3 U 5.3 UGRANGER WP 9/25/2007 5.1 U 5.1 U 5.1 U 5.1 U 5.1 USUNNYSIDE WP 9/25/2007 5.1 UJ 5.1 UJ 5.1 UJ 5.1 UJ 5.1 UJSUNYSIDE REP 9/25/2007 5.2 UJ 5.2 UJ 5.2 UJ 5.2 UJ 5.2 UJSS PORT WP 9/25/2007 5.1 UJ 5.1 UJ 5.1 UJ 5.1 UJ 5.1 UJMABTON WP 9/25/2007 5.1 U 5.1 U 5.1 U 5.1 U 5.1 UGRANDVIEW WP 9/25/2007 5.2 UJ 5.2 UJ 5.2 UJ 5.2 UJ 5.2 UJPROSSER WP 9/27/2007 5.3 UJ 5.3 UJ 5.3 UJ 5.3 UJ 5.3 UJBENTON WP 9/27/2007 5.4 UJ 5.4 UJ 5.4 UJ 5.4 UJ 5.4 UJW RICHLAND WP 9/27/2007 5.5 UJ 5.5 UJ 5.5 UJ 5.5 UJ 5.5 UJW RICHLAND REP 9/27/2007 5.5 UJ 5.5 UJ 5.5 UJ 5.5 UJ 5.5 UJTRNSFR BLANK na na na na naBOTTLE BLANK na na na na na
Cis-Nonachlor (ng/L)
Trans-Chlordane (ng/L)
Trans-Nonachlor (ng/L)
Oxychlordane (ng/L)
Cis-Chlordane (ng/L)

Yakima Pesticides/PCBs TMDL: Vol 1, WQ Study Findings Page 292
Collection
Field ID Date (ng/L) (ng/L) (ng/L) (ng/L) (ng/L) (ng/L)
CLE ELUM WP 6/12/2007 na na na na na na
ELLENSBURG WP 6/12/2007 na na na na na na
ELLENSBURG REP 6/12/2007 na na na na na na
KITTITAS WP 6/12/2007 na na na na na na
SELAH WP 6/7/2007 26.0 UJ 26 UJ 2.1 UJ 2.1 UJ 2.1 UJ 2.1 UJ
NACHES WP 6/7/2007 26.0 UJ 26 UJ 2.1 UJ 2.1 UJ 2.1 UJ 2.1 UJ
COWICHE WP 6/7/2007 25.0 UJ 25 UJ 2.0 UJ 2.0 UJ 2.0 UJ 2.0 UJ
YAKIMA WP 6/7/2007 26.0 UJ 26 UJ 2.1 UJ 2.5 UJ 2.1 UJ 2.1 UJ
YAKIMA REP 6/7/2007 26.0 UJ 26 UJ 2.1 UJ 3.0 UJ 2.1 UJ 2.1 UJ
MOXEE WP 6/12/2007 25.0 UJ 25 UJ 2.0 UJ 2.0 UJ 2.0 UJ 2.0 UJ
BUENA WP 6/12/2007 25.0 UJ 25 UJ 2.0 UJ 2.0 UJ 2.0 UJ 2.0 UJ
ZILLAH WP 6/12/2007 26.0 UJ 26 UJ 2.1 UJ 2.1 UJ 2.1 UJ 2.1 UJ
GRANGER WP 6/12/2007 26.0 UJ 26 UJ 2.1 UJ 2.1 UJ 2.1 UJ 2.1 UJ
SUNNYSIDE WP 6/12/2007 25.0 UJ 25 UJ 2.0 UJ 2.0 UJ 2.0 UJ 2.0 UJ
SS PORT WP 6/12/2007 26.0 UJ 26 UJ 2.0 UJ 2.0 UJ 2.0 UJ 2.0 UJ
MABTON WP 6/12/2007 25.0 UJ 25 UJ 2.0 UJ 2.0 UJ 2.0 UJ 2.0 UJ
GRANDVIEW WP 6/12/2007 25.0 UJ 25 UJ 2.0 UJ 2.0 UJ 2.0 UJ 2.0 UJ
PROSSER WP 6/14/2007 27.0 UJ 27 UJ 2.2 UJ 2.2 UJ 2.2 UJ 2.2 UJ
BENTONC WP 6/14/2007 26.0 UJ 26 UJ 2.1 UJ 2.1 UJ 2.1 UJ 2.1 UJ
W RICHLAND 6/14/2007 26.0 UJ 26 UJ 2.1 UJ 2.1 UJ 2.1 UJ 2.1 UJ
TRNSFR BLANK 6/12/2007 25.0 UJ 25 UJ 2.0 UJ 2.0 UJ 2.0 UJ 2.0 UJ
CLE ELUM WP 9/18/2007 na na na na na na
ELLENSBURG WP 9/18/2007 na na na na na na
KITTITAS WP 9/18/2007 na na na na na na
SELAH WP 9/20/2007 na 26 UJ 5.1 UJ 5.1 UJ 5.1 UJ 5.1 UJ
NACHES WP 9/20/2007 na 25 UJ 5.0 UJ 5.0 UJ 5.0 UJ 5.0 UJ
COWICHE WP 9/20/2007 na 25 UJ 5.1 UJ 5.1 UJ 5.1 UJ 5.1 UJ
YAKIMA WP 9/20/2007 na 26 UJ 5.1 UJ 5.1 UJ 5.1 UJ 5.1 UJ
MOXEE WP 9/25/2007 na 25 UJ 4.9 UJ 4.9 UJ 4.9 UJ 4.9 UJ
BUENA WP 9/25/2007 na 26 UJ 5.2 UJ 5.2 UJ 5.2 UJ 5.2 UJ
ZILLAH WP 9/25/2007 na 26 U 5.3 U 5.3 U 5.3 UJ 5.3 U
GRANGER WP 9/25/2007 na 25 U 5.1 U 5.1 U 5.1 UJ 5.1 U
SUNNYSIDE WP 9/25/2007 na 26 UJ 5.1 UJ 5.1 UJ 5.1 UJ 5.1 UJ
SUNYSIDE REP 9/25/2007 na 26 UJ 5.2 UJ 5.2 UJ 5.2 UJ 5.2 UJ
SS PORT WP 9/25/2007 na 26 UJ 5.1 UJ 5.1 UJ 5.1 UJ 5.1 UJ
MABTON WP 9/25/2007 na 26 U 5.1 U 5.1 U 5.1 UJ 5.1 U
GRANDVIEW WP 9/25/2007 na 26 UJ 5.2 UJ 5.2 UJ 5.2 UJ 5.2 UJ
PROSSER WP 9/27/2007 na 26 UJ 5.3 UJ 5.3 UJ 5.3 UJ 5.3 UJ
BENTON WP 9/27/2007 na 27 UJ 5.4 UJ 5.4 UJ 5.4 UJ 5.4 UJ
W RICHLAND 9/27/2007 na 27 UJ 5.5 UJ 5.5 UJ 5.5 UJ 5.5 UJ
W RICHLAND REP 9/27/2007 na 27 UJ 5.5 UJ 5.5 UJ 5.5 UJ 5.5 UJ
TRNSFR BLANK na na na na na na
BOTTLE BLNK na na na na na na
Chlordane (technical) Toxaphene
Alpha-BHC Beta-BHC Delta-BHC Lindane
U = not detected at or above reported value J = estimated REJ = rejected na = not analyzed LS = lost in shipment

Yakima Pesticides/PCBs TMDL: Vol 1, WQ Study Findings Page 293
Collection
Field ID Date (ng/L) (ng/L) (ng/L) (ng/L) (ng/L) (ng/L)
CLE ELUM WP 6/12/2007 na na na na na na
ELLENSBURG WP 6/12/2007 na na na na na na
ELLENSBURG REP 6/12/2007 na na na na na na
KITTITAS WP 6/12/2007 na na na na na na
SELAH WP 6/7/2007 2.1 U 2.1 U 2.1 UJ 2.1 U 2.1 UJ 2.1 U
NACHES WP 6/7/2007 2.1 U 2.1 U 2.1 U 2.1 U 2.1 UJ 2.1 U
COWICHE WP 6/7/2007 2.0 U 2.0 U 2.0 UJ 2.0 U 2.0 UJ 2.0 U
YAKIMA WP 6/7/2007 2.1 U 2.1 UJ 2.1 UJ 2.1 U 2.1 UJ 2.1 U
YAKIMA REP 6/7/2007 2.1 U 2.2 UJ 2.1 UJ 2.1 U 2.1 UJ 2.1 U
MOXEE WP 6/12/2007 2.0 U 2.0 U 2.0 UJ 2.0 U 2.0 UJ 2.0 U
BUENA WP 6/12/2007 2.0 U 2.0 U 2.0 UJ 2.0 U 2.0 UJ 2.0 U
ZILLAH WP 6/12/2007 2.1 U 2.1 U 2.1 UJ 2.1 U 2.1 UJ 2.1 U
GRANGER WP 6/12/2007 2.1 U 2.1 U 2.1 UJ 2.1 U 2.1 UJ 2.1 U
SUNNYSIDE WP 6/12/2007 2.0 U 2.0 U 2.0 UJ 2.0 U 2.0 UJ 2.0 U
SS PORT WP 6/12/2007 2.0 UJ 2.0 UJ 2.0 UJ 2.0 UJ 2.0 UJ 2.0 UJ
MABTON WP 6/12/2007 2.0 U 2.0 U 2.0 UJ 2.0 U 2.0 UJ 2.0 U
GRANDVIEW WP 6/12/2007 2.0 U 2.0 U 2.0 UJ 2.0 U 2.0 UJ 2.0 U
PROSSER WP 6/14/2007 2.2 U 2.2 U 2.2 UJ 2.2 U 2.2 UJ 2.2 U
BENTONC WP 6/14/2007 2.1 U 2.1 U 2.1 UJ 2.1 U 2.1 UJ 2.1 U
W RICHLAND 6/14/2007 2.1 U 2.1 U 2.1 UJ 2.1 U 2.1 UJ 2.1 U
TRNSFR BLANK 6/12/2007 2.0 U 2.0 U 2.0 UJ 2.0 U 2.0 UJ 2.0 U
CLE ELUM WP 9/18/2007 na na na na na na
ELLENSBURG WP 9/18/2007 na na na na na na
KITTITAS WP 9/18/2007 na na na na na na
SELAH WP 9/20/2007 5.1 U 5.1 U 5.1 U 5.1 U 5.1 UJ 5.1 U
NACHES WP 9/20/2007 5.0 U 5.0 U 5.0 U 5.0 U 5.0 UJ 5.0 U
COWICHE WP 9/20/2007 5.1 U 5.1 U 5.1 U 5.1 U 5.1 UJ 5.1 U
YAKIMA WP 9/20/2007 5.1 U 5.1 U 5.1 U 5.1 U 5.1 UJ 5.1 U
MOXEE WP 9/25/2007 4.9 4.9 UJ 4.9 UJ 4.9 UJ 4.9 UJ 4.9 UJ
BUENA WP 9/25/2007 5.2 U 5.2 U 5.2 UJ 5.2 U 5.2 UJ 5.2 U
ZILLAH WP 9/25/2007 5.3 U 5.3 U 5.3 UJ 5.3 U 5.3 U 5.3 U
GRANGER WP 9/25/2007 5.1 U 5.1 U 5.1 UJ 5.1 U 5.1 U 5.1 U
SUNNYSIDE WP 9/25/2007 5.1 U 5.1 U 5.1 UJ 5.1 U 5.1 UJ 5.1 U
SUNYSIDE REP 9/25/2007 5.2 U 5.2 U 5.2 UJ 5.2 U 5.2 UJ 5.2 U
SS PORT WP 9/25/2007 5.1 5.1 UJ 5.1 UJ 5.1 UJ 5.1 UJ 5.1 UJ
MABTON WP 9/25/2007 5.1 U 5.1 U 5.1 UJ 5.1 U 5.1 U 5.1 U
GRANDVIEW WP 9/25/2007 5.2 U 5.2 U 5.2 UJ 5.2 U 5.2 UJ 5.2 U
PROSSER WP 9/27/2007 5.3 U 5.3 U 5.3 U 5.3 U 5.3 UJ 5.3 U
BENTON WP 9/27/2007 5.4 U 5.4 U 5.4 U 5.4 U 5.4 UJ 5.4 U
W RICHLAND 9/27/2007 5.5 U 5.5 U 5.5 U 5.5 U 5.5 UJ 5.5 U
W RICHLAND REP 9/27/2007 5.5 U 5.5 U 5.5 U 5.5 U 5.5 UJ 5.5 U
TRNSFR BLANK na na na na na na
BOTTLE BLNK na na na na na na
AldrinEndrin Ketone Heptachlor
Heptachlor Epoxide
Endrin AldehydeEndrin
U = not detected at or above reported value J = estimated REJ = rejected na = not analyzed LS = lost in shipment

Yakima Pesticides/PCBs TMDL: Vol 1, WQ Study Findings Page 294
U = not detected at or above reported value J = estimated REJ = rejected na = not analyzed LS = lost in shipment
Collection
Field ID Date (ng/L) (ng/L) (pg/L) (mg/L) (NTU) (umhos/cm)
CLE ELUM WP 6/12/2007 na na 719 J 5 2.7 412
ELLENSBURG WP 6/12/2007 na na 192 J 4 1.8 381
ELLENSBURG REP 6/12/2007 na na 97 J 4 1.9 382
KITTITAS WP 6/12/2007 na na 42 J 3 1.7 439
SELAH WP 6/7/2007 2.1 UJ 2.1 U 7,360 7 2.9 849
NACHES WP 6/7/2007 2.1 UJ 2.1 U 40 UJ 2 2.1 298
COWICHE WP 6/7/2007 2.0 UJ 2.0 U 40 UJ 1 1.5 685
YAKIMA WP 6/7/2007 2.1 UJ 2.1 U 798 J 5 3.7 536
YAKIMA REP 6/7/2007 2.1 UJ 2.1 U na 5 3.0 534
MOXEE WP 6/12/2007 2.0 UJ 2.0 U 47 J 3 2.1 588
BUENA WP 6/12/2007 2.0 UJ 2.0 U 285 J 7 3.8 743
ZILLAH WP 6/12/2007 2.1 UJ 2.1 U 403 J 10 4.5 1100
GRANGER WP 6/12/2007 2.1 UJ 2.1 U 253 J 2 1.5 726
SUNNYSIDE WP 6/12/2007 2.0 UJ 2.0 U 747 J 2 1.1 801
SS PORT WP 6/12/2007 2.0 UJ 2.0 UJ 601 J 555 190 2440
MABTON WP 6/12/2007 2.0 UJ 2.0 UJ 31 J 5 1.7 857
GRANDVIEW WP 6/12/2007 2.0 UJ 2.0 U 50 UJ 23 8.9 1080
PROSSER WP 6/14/2007 2.2 UJ 2.2 U 406 J 7 4.0 914
BENTONC WP 6/14/2007 2.1 UJ 2.1 U 44 J 2 1.2 1260
W RICHLAND 6/14/2007 2.1 UJ 2.1 U 97 J 3 1.6 963
TRNSFR BLANK 6/12/2007 2.0 UJ 2.0 U 115 J na na na
CLE ELUM WP 9/18/2007 na na 262 J 2 1.7 330
ELLENSBURG WP 9/18/2007 na na 318 J 2 1.6 374
KITTITAS WP 9/18/2007 na na 143 J 2 0.9 432
SELAH WP 9/20/2007 5.1 UJ 5.1 U 246 J 11 4.0 868
NACHES WP 9/20/2007 5.0 UJ 5.0 U 245 J 14 4.4 304
COWICHE WP 9/20/2007 5.1 UJ 5.1 U 276 J 1 1.4 684
YAKIMA WP 9/20/2007 5.1 UJ 5.1 U 856 J 7 4.0 515
MOXEE WP 9/25/2007 4.9 UJ 4.9 UJ 387 J 5 3.8 620
BUENA WP 9/25/2007 5.2 UJ 5.2 U 288 J 2 1.9 740
ZILLAH WP 9/25/2007 5.3 U 5.3 U 223 J 3 1.9 1190
GRANGER WP 9/25/2007 5.1 U 5.1 U 226 J 2 1.2 709
SUNNYSIDE WP 9/25/2007 5.1 UJ 5.1 U 475 J 2 1.5 830
SUNYSIDE REP 9/25/2007 5.2 UJ 5.2 U 523 J 2 1.5 828
SS PORT WP 9/25/2007 5.1 UJ 5.1 163 J 77 22 3160
MABTON WP 9/25/2007 5.1 U 5.1 U 304 J 3 2.1 672
GRANDVIEW WP 9/25/2007 5.2 UJ 5.2 U 153 J 65 3.3 1140
PROSSER WP 9/27/2007 5.3 UJ 5.3 U 375 J 6 3.6 987
BENTON WP 9/27/2007 5.4 UJ 6.8 UJ 335 J 2 1.2 1240
W RICHLAND 9/27/2007 5.5 UJ 5.5 U 319 J 6 3.1 1010
W RICHLAND REP 9/27/2007 5.5 UJ 7.7 UJ 203 J 6 2.0 1010
TRNSFR BLANK na na 10 UJ na na na
BOTTLE BLNK na na 133 J na na na
Hexachloro-benzene Methoxychlor T-PCBs
Total Suspended
Solids Turbidity Conductivity

Yakima Pesticides/PCBs TMDL: Vol 1, WQ Study Findings Page 295
Collection Flow
Sample No. Field ID Date (mgd) (ng/L) (ng/L) (ng/L)
7508100 CLE ELUM WP 12/13/2007 0.471 na na na
7508102 ELLENSBURG WP 12/13/2007 3.239 na na na
7508101 KITTITAS WP 12/13/2007 0.142 na na na
7508103 SELAH WP 12/13/2007 1.347 2.5 UJ 2.5 UJ 2.5 UJ
7508107 SELAH REP 12/13/2007 - - 2.6 UJ 2.6 UJ 2.6 UJ
7508104 NACHES WP 12/12/2007 0.0697 2.5 UJ 2.5 UJ 2.5 UJ
7508105 COWICHE WP 12/12/2007 0.1057 2.6 UJ 2.6 UJ 2.6 UJ
7508106 YAKIMA WP 12/12/2007 9.82 2.7 UJ 2.7 UJ 2.7 UJ
7518105 MOXEE WP 12/18/2007 0.1515 2.5 UJ 2.5 UJ 2.5 UJ
7518103 BUENA WP 12/18/2007 0.080 2.6 UJ 2.6 UJ 2.6 UJ
7518104 ZILLAH WP 12/18/2007 0.2522 2.5 UJ 2.5 UJ 2.5 UJ
7518106 GRANGER WP 12/18/2007 0.171 2.5 UJ 2.5 UJ 2.5 UJ
7518107 SUNNYSIDE WP 12/18/2007 1.100 2.6 UJ 2.6 UJ 2.6 UJ
7518108 SS PORT WP 12/18/2007 0.3097 REJ REJ REJ
7518110 MABTON WP 12/18/2007 0.175 2.7 UJ 2.7 UJ 2.7 UJ
7518109 GRANDVIEW WP 12/18/2007 1.41 2.5 UJ 2.5 UJ 2.5 UJ
7518114 GRANDVIEW 12/18/2007 - - 2.5 UJ 2.5 UJ 2.5 UJ
7518111 PROSSER WP 12/20/2007 0.565 2.6 UJ 2.6 UJ 2.6 UJ
7518112 BENTONC WP 12/20/2007 0.230 2.6 UJ 2.6 UJ 2.6 UJ
7518113 W RICHLAND 12/20/2007 0.549 2.6 UJ 2.6 UJ 2.6 UJ
7518116 BOTTLE BLNK 12/18/2007 - - 2.6 U 2.6 U 2.6 U
7518115 TRNSFR BLANK 12/18/2007 - - 2.5 U 2.5 U 2.5 U
8118825 CLE ELUM WP 3/11/2008 1.315 na na na
8118827 ELLENSBURG WP 3/11/2008 2.750 na na na
8118826 KITTITAS WP 3/11/2008 0.129 na na na
8118828 SELAH WP 3/11/2008 1.132 2.6 U 2.6 U 2.6 U
8118829 NACHES WP 3/13/2008 0.054 2.6 U 2.6 U 2.6 U
8118830 COWICHE WP 3/13/2008 0.211 2.5 U 2.5 U 2.5 U
8118831 YAKIMA WP 3/13/2008 9.240 2.5 U 2.5 U 2.5 U
8118832 YAKIMA REP 3/13/2008 - - 2.6 U 2.6 U 2.6 U
8128840 MOXEE WP 3/18/2008 0.151 2.6 U 2.6 U 2.6 U
8128838 BUENA WP 3/18/2008 0.074 2.6 U 2.6 U 2.6 U
8128839 ZILLAH WP 3/18/2008 0.215 2.6 UJ 2.6 UJ 2.6 UJ
8128841 GRANGER WP 3/18/2008 0.172 2.6 U 2.6 U 2.6 U
8128842 SUNNYSIDE WP 3/18/2008 1.067 2.6 U 2.6 U 2.6 U
8128843 SS PORT WP 3/18/2008 0.538 2.6 UJ 2.6 UJ 2.6 UJ
8128845 MABTON WP 3/18/2008 1.270 2.6 UJ 2.6 UJ 2.6 UJ
8128844 GRANDVIEW WP 3/18/2008 1.080 2.6 U 2.6 U 2.6 U
8128846 PROSSER WP 3/20/2008 0.652 2.6 UJ 2.6 UJ 2.6 UJ
8128849 PROSSER REP 3/20/2008 - - 2.6 U 2.6 U 2.6 U
8128847 BENTONC WP 3/20/2008 0.225 2.6 U 2.6 U 2.6 U
8128848 W RICHLAND 3/20/2008 0.523 2.6 U 2.6 U 2.6 U
8128850 TRNSFR BLANK 3/20/2008 - - 2.6 UJ 2.6 UJ 2.6 UJ
8128851 BOTTLE BLANK 3/20/2008 na na na
4,4'-DDD 4,4'-DDE 4,4'-DDT
U = not detected at or above reported value J = estimated REJ = rejected na = not analyzed LS = lost in shipment

Yakima Pesticides/PCBs TMDL: Vol 1, WQ Study Findings Page 296
Collection
Field ID Date (ng/L) (ng/L) (ng/L) (ng/L) (ng/L)
CLE ELUM WP 12/13/2007 na na na na na
ELLENSBURG WP 12/13/2007 na na na na na
KITTITAS WP 12/13/2007 na na na na na
SELAH WP 12/13/2007 2.5 U 2.5 U 2.5 U 3.1 6.1
SELAH REP 12/13/2007 2.6 U 2.6 U 2.6 U 2.9 6.3
NACHES WP 12/12/2007 2.5 U 2.5 U 2.5 U 2.5 U 2.5 U
COWICHE WP 12/12/2007 2.6 U 6.7 J 2.9 J 25 21
YAKIMA WP 12/12/2007 2.7 U 3.3 J 2.7 U 5.4 4.4 J
MOXEE WP 12/18/2007 2.5 U 3.7 J 2.5 U 2.5 U 2.5 U
BUENA WP 12/18/2007 2.6 U 2.6 U 2.6 U 2.6 U 4.5 J
ZILLAH WP 12/18/2007 2.5 U 3.7 2.5 U 2.5 U 6.7 J
GRANGER WP 12/18/2007 2.5 U 5.7 J 2.5 U 2.5 U 2.5 U
SUNNYSIDE WP 12/18/2007 2.6 U 4.8 J 2.6 U 2.6 U 6.2 J
SS PORT WP 12/18/2007 REJ REJ REJ REJ REJ
MABTON WP 12/18/2007 2.7 U 2.7 J 2.7 U 2.7 U 2.7 U
GRANDVIEW WP 12/18/2007 2.5 UJ 2.5 UJ 2.5 UJ 2.5 UJ 3.2 J
GRANDVIEW 12/18/2007 2.5 U 2.5 U 2.5 U 2.5 U 3.1 J
PROSSER WP 12/20/2007 2.6 U 2.6 U 2.6 U 2.6 U 2.6 U
BENTONC WP 12/20/2007 2.6 U 2.6 U 2.6 U 2.6 U 2.6 U
W RICHLAND 12/20/2007 2.6 U 2.6 J 2.6 U 2.6 U 2.6 U
BOTTLE BLNK 12/18/2007 2.6 U 2.6 U 2.6 U 2.6 U 2.6 U
TRNSFR BLANK 12/18/2007 2.5 U 2.5 U 2.5 U 2.5 U 2.5 U
CLE ELUM WP 3/11/2008 na na na na na
ELLENSBURG WP 3/11/2008 na na na na na
KITTITAS WP 3/11/2008 na na na NA na
SELAH WP 3/11/2008 2.6 UJ 2.6 UJ 2.6 UJ 2.6 UJ 4.8 J
NACHES WP 3/13/2008 2.6 U 2.6 U 2.6 U 2.6 U 2.6 U
COWICHE WP 3/13/2008 2.5 U 3.6 J 6.3 32 17
YAKIMA WP 3/13/2008 2.5 UJ 3.9 J 38 J 7.8 J 4.5 J
YAKIMA REP 3/13/2008 2.6 UJ 2.6 UJ 37 J 8.0 J 5.2 J
MOXEE WP 3/18/2008 2.6 UJ 2.6 UJ 2.6 UJ 2.6 UJ 2.6 UJ
BUENA WP 3/18/2008 2.6 UJ 2.6 UJ 2.6 UJ 2.6 UJ 2.6 UJ
ZILLAH WP 3/18/2008 2.6 UJ 2.6 UJ 2.6 UJ 2.6 UJ 2.6 UJ
GRANGER WP 3/18/2008 2.6 UJ 2.6 UJ 2.6 UJ 2.6 UJ 2.6 UJ
SUNNYSIDE WP 3/18/2008 2.6 UJ 11 J 2.6 UJ 2.6 UJ 2.6 UJ
SS PORT WP 3/18/2008 2.6 UJ 2.6 UJ 2.6 UJ 2.6 UJ 2.6 UJ
MABTON WP 3/18/2008 2.6 UJ 9.5 J 3.3 J 2.6 UJ 2.6 UJ
GRANDVIEW WP 3/18/2008 2.6 UJ 2.6 UJ 2.6 UJ 2.6 UJ 2.6 UJ
PROSSER WP 3/20/2008 2.6 UJ 2.6 UJ 2.6 UJ 2.6 UJ 2.6 UJ
PROSSER REP 3/20/2008 2.6 UJ 2.6 UJ 2.6 UJ 2.6 UJ 2.6 UJ
BENTONC WP 3/20/2008 2.6 UJ 2.6 UJ 2.6 UJ 2.6 UJ 2.6 UJ
W RICHLAND 3/20/2008 2.6 UJ 2.6 UJ 2.6 UJ 2.6 UJ 2.6 UJ
TRNSFR BLANK 3/20/2008 2.6 UJ 2.6 UJ 2.6 UJ 2.6 UJ 2.6 UJ
BOTTLE BLANK 3/20/2008 na na na na na
Dieldrin Chlorpyrifos Endosulfan IEndosulfan
IIEndosulfan
Sulfate
U = not detected at or above reported value J = estimated REJ = rejected na = not analyzed LS = lost in shipment

Yakima Pesticides/PCBs TMDL: Vol 1, WQ Study Findings Page 297
Collection
Field ID Date (ng/L) (ng/L) (ng/L) (ng/L) (ng/L)
CLE ELUM WP 12/13/2007 na na na na na
ELLENSBURG WP 12/13/2007 na na na na na
KITTITAS WP 12/13/2007 na na na na na
SELAH WP 12/13/2007 2.5 UJ 2.5 UJ 2.5 UJ 2.5 UJ 2.5 UJ
SELAH REP 12/13/2007 2.6 UJ 2.6 UJ 2.6 UJ 2.6 UJ 2.6 UJ
NACHES WP 12/12/2007 2.5 UJ 2.5 UJ 2.5 UJ 2.5 UJ 2.5 UJ
COWICHE WP 12/12/2007 2.6 UJ 2.6 UJ 2.6 UJ 2.6 UJ 2.6 UJ
YAKIMA WP 12/12/2007 2.7 UJ 2.7 UJ 2.7 UJ 2.7 UJ 2.7 UJ
MOXEE WP 12/18/2007 2.5 UJ 2.5 UJ 2.5 UJ 2.5 UJ 2.5 UJ
BUENA WP 12/18/2007 2.6 UJ 2.6 UJ 2.6 UJ 2.6 UJ 2.6 UJ
ZILLAH WP 12/18/2007 2.5 UJ 2.5 UJ 2.5 UJ 2.5 UJ 2.5 UJ
GRANGER WP 12/18/2007 2.5 UJ 2.5 UJ 2.5 UJ 2.5 UJ 2.5 UJ
SUNNYSIDE WP 12/18/2007 2.6 UJ 2.6 UJ 2.6 UJ 2.6 UJ 2.6 UJ
SS PORT WP 12/18/2007 REJ REJ REJ REJ REJ
MABTON WP 12/18/2007 2.7 UJ 2.7 UJ 2.7 UJ 2.7 UJ 2.7 UJ
GRANDVIEW WP 12/18/2007 2.5 UJ 2.5 UJ 2.5 UJ 2.5 UJ 2.5 UJ
GRANDVIEW 12/18/2007 2.5 UJ 2.5 UJ 2.5 UJ 2.5 UJ 2.5 UJ
PROSSER WP 12/20/2007 2.6 UJ 2.6 UJ 2.6 UJ 2.6 UJ 2.6 UJ
BENTONC WP 12/20/2007 2.6 UJ 2.6 UJ 2.6 UJ 2.6 UJ 2.6 UJ
W RICHLAND 12/20/2007 2.6 UJ 2.6 UJ 2.6 UJ 2.6 UJ 2.6 UJ
BOTTLE BLNK 12/18/2007 2.6 U 2.6 U 2.6 U 2.6 U 2.6 U
TRNSFR BLANK 12/18/2007 2.5 U 2.5 U 2.5 U 2.5 U 2.5 U
CLE ELUM WP 3/11/2008 na na na na na
ELLENSBURG WP 3/11/2008 na na na na na
KITTITAS WP 3/11/2008 na na na na na
SELAH WP 3/11/2008 2.6 U 2.6 U 2.6 U 2.6 U 2.6 U
NACHES WP 3/13/2008 2.6 U 2.6 U 2.6 U 2.6 U 2.6 U
COWICHE WP 3/13/2008 2.5 U 2.5 U 2.5 U 2.5 U 2.5 U
YAKIMA WP 3/13/2008 2.5 U 2.5 U 2.5 U 2.5 U 2.5 U
YAKIMA REP 3/13/2008 2.6 U 2.6 U 2.6 U 2.6 U 2.6 U
MOXEE WP 3/18/2008 2.6 U 2.6 U 2.6 U 2.6 U 2.6 U
BUENA WP 3/18/2008 2.6 U 2.6 U 2.6 U 2.6 U 2.6 U
ZILLAH WP 3/18/2008 2.6 UJ 2.6 UJ 2.6 UJ 2.6 UJ 2.6 UJ
GRANGER WP 3/18/2008 2.6 U 2.6 U 2.6 U 2.6 U 2.6 U
SUNNYSIDE WP 3/18/2008 2.6 U 2.6 U 2.6 U 2.6 U 2.6 U
SS PORT WP 3/18/2008 2.6 UJ 2.6 UJ 2.6 UJ 2.6 UJ 2.6 UJ
MABTON WP 3/18/2008 2.6 UJ 2.6 UJ 2.6 UJ 2.6 UJ 2.6 UJ
GRANDVIEW WP 3/18/2008 2.6 U 2.6 U 2.6 U 2.6 U 2.6 U
PROSSER WP 3/20/2008 2.6 UJ 2.6 UJ 2.6 UJ 2.6 UJ 2.6 UJ
PROSSER REP 3/20/2008 2.6 U 2.6 U 2.6 U 2.6 U 2.6 U
BENTONC WP 3/20/2008 2.6 U 2.6 U 2.6 U 2.6 U 2.6 U
W RICHLAND 3/20/2008 2.6 U 2.6 U 2.6 U 2.6 U 2.6 U
TRNSFR BLANK 3/20/2008 2.6 UJ 2.6 UJ 2.6 UJ 2.6 UJ 2.6 UJ
BOTTLE BLANK 3/20/2008 na na na na na
Cis-Chlordane
Cis-Nonachlor
Trans-Chlordane
Trans-Nonachlor Oxychlordane
U = not detected at or above reported value J = estimated REJ = rejected na = not analyzed LS = lost in shipment

Yakima Pesticides/PCBs TMDL: Vol 1, WQ Study Findings Page 298
Collection
Field ID Date (ng/L) (ng/L) (ng/L) (ng/L) (ng/L)
CLE ELUM WP 12/13/2007 na na na na na na
ELLENSBURG WP 12/13/2007 na na na na na na
KITTITAS WP 12/13/2007 na na na na na na
SELAH WP 12/13/2007 na 25 UJ 2.5 UJ 2.5 UJ 2.5 UJ 2.5 UJ
SELAH REP 12/13/2007 na 26 UJ 2.6 UJ 2.6 UJ 2.6 UJ 2.6 UJ
NACHES WP 12/12/2007 na 25 UJ 2.5 UJ 2.5 UJ 2.5 UJ 2.5 UJ
COWICHE WP 12/12/2007 na 26 UJ 2.6 UJ 2.6 UJ 2.6 UJ 2.6 UJ
YAKIMA WP 12/12/2007 na 27 UJ 2.7 UJ 2.7 UJ 2.7 UJ 2.7 UJ
MOXEE WP 12/18/2007 na 25 UJ 2.5 UJ 2.5 UJ 2.5 UJ 2.5 UJ
BUENA WP 12/18/2007 na 26 UJ 2.6 UJ 2.6 UJ 2.6 UJ 2.6 UJ
ZILLAH WP 12/18/2007 na 25 UJ 2.5 UJ 2.5 UJ 2.5 UJ 2.5 UJ
GRANGER WP 12/18/2007 na 25 UJ 2.5 UJ 2.5 UJ 2.5 UJ 2.5 UJ
SUNNYSIDE WP 12/18/2007 na 26 UJ 2.6 UJ 2.6 UJ 2.6 UJ 2.6 UJ
SS PORT WP 12/18/2007 na REJ REJ REJ REJ REJ
MABTON WP 12/18/2007 na 27 UJ 2.7 UJ 2.7 UJ 2.7 UJ 2.7 UJ
GRANDVIEW WP 12/18/2007 na 25 UJ 2.5 UJ 2.5 UJ 2.5 UJ 2.5 UJ
GRANDVIEW 12/18/2007 na 25 UJ 2.5 UJ 2.5 UJ 2.5 UJ 2.5 UJ
PROSSER WP 12/20/2007 na 26 UJ 2.6 UJ 2.6 UJ 2.6 UJ 2.6 UJ
BENTONC WP 12/20/2007 na 26 UJ 2.6 UJ 2.6 UJ 2.6 UJ 2.6 UJ
W RICHLAND 12/20/2007 na 26 UJ 2.6 UJ 2.6 UJ 2.6 UJ 2.6 UJ
BOTTLE BLNK 12/18/2007 na 26 U 2.6 U 2.6 U 2.6 U 2.6 U
TRNSFR BLANK 12/18/2007 na 25 U 2.5 U 2.5 U 2.5 U 2.5 U
CLE ELUM WP 3/11/2008 na na na na na na
ELLENSBURG WP 3/11/2008 na na na na na na
KITTITAS WP 3/11/2008 na na na na na na
SELAH WP 3/11/2008 na 26 U 2.6 U 2.6 U 13 U 2.6 U
NACHES WP 3/13/2008 na 26 U 2.6 U 2.6 U 13 U 2.6 U
COWICHE WP 3/13/2008 na 25 U 2.5 U 2.5 U 13 U 2.5 U
YAKIMA WP 3/13/2008 na 25 U 2.5 U 7.6 UJ 13 U 11
YAKIMA REP 3/13/2008 na 26 U 2.6 U 7.3 UJ 13 U 15
MOXEE WP 3/18/2008 na 26 U 2.6 U 2.6 U 13 U 2.6 U
BUENA WP 3/18/2008 na 26 U 2.6 U 2.6 U 13 U 2.6 U
ZILLAH WP 3/18/2008 na 26 UJ 2.6 UJ 2.6 UJ 13 UJ 2.6 UJ
GRANGER WP 3/18/2008 na 26 U 2.6 U 2.6 U 13 U 2.6 U
SUNNYSIDE WP 3/18/2008 na 26 U 2.6 U 2.6 U 13 U 7.4
SS PORT WP 3/18/2008 na 26 UJ 2.6 UJ 2.6 UJ 13 UJ 2.6 UJ
MABTON WP 3/18/2008 na 26 UJ 2.6 UJ 2.6 UJ 13 UJ 2.6 UJ
GRANDVIEW WP 3/18/2008 na 26 U 2.6 U 2.6 U 13 U 2.6 U
PROSSER WP 3/20/2008 na 26 UJ 2.6 UJ 2.6 UJ 13 UJ 2.6 UJ
PROSSER REP 3/20/2008 na 26 U 2.6 U 2.6 U 13 UJ 2.6 U
BENTONC WP 3/20/2008 na 26 U 2.6 U 2.6 U 13 U 2.6 U
W RICHLAND 3/20/2008 na 26 U 2.6 U 2.6 U 13 U 2.6 U
TRNSFR BLANK 3/20/2008 na 26 UJ 2.6 UJ 2.6 UJ 13 UJ 2.6 UJ
BOTTLE BLANK 3/20/2008 na na na na na na
Chlordane (technical) Toxaphene
Alpha-BHC Beta-BHC
Delta-BHC Lindane
U = not detected at or above reported value J = estimated REJ = rejected na = not analyzed LS = lost in shipment

Yakima Pesticides/PCBs TMDL: Vol 1, WQ Study Findings Page 299
Collection
Field ID Date (ng/L) (ng/L) (ng/L) (ng/L) (ng/L) (ng/L)
CLE ELUM WP 12/13/2007 na na na na na na
ELLENSBURG WP 12/13/2007 na na na na na na
KITTITAS WP 12/13/2007 na na na na na na
SELAH WP 12/13/2007 2.5 U 2.5 U 2.5 U 2.5 U 2.5 UJ 2.5 U
SELAH REP 12/13/2007 2.6 U 2.6 U 2.6 U 2.6 U 2.6 UJ 2.6 U
NACHES WP 12/12/2007 2.5 U 2.5 U 2.5 U 2.5 U 2.5 UJ 2.5 U
COWICHE WP 12/12/2007 2.6 U 2.6 U 2.6 U 2.6 U 2.6 UJ 2.6 U
YAKIMA WP 12/12/2007 2.7 U 2.7 U 2.7 U 2.7 U 2.7 UJ 2.7 U
MOXEE WP 12/18/2007 2.5 U 2.5 U 2.5 U 2.5 U 2.5 UJ 2.5 U
BUENA WP 12/18/2007 2.6 U 2.6 U 2.6 U 2.6 U 2.6 UJ 2.6 U
ZILLAH WP 12/18/2007 2.5 U 2.5 U 2.5 U 2.5 U 2.5 UJ 2.5 U
GRANGER WP 12/18/2007 2.5 U 2.5 U 2.5 U 2.5 U 2.5 UJ 2.5 U
SUNNYSIDE WP 12/18/2007 2.6 U 2.6 U 2.6 U 2.6 U 2.6 UJ 2.6 U
SS PORT WP 12/18/2007 REJ REJ REJ REJ REJ REJ
MABTON WP 12/18/2007 2.7 U 2.7 U 2.7 U 2.7 U 2.7 UJ 2.7 U
GRANDVIEW WP 12/18/2007 2.5 UJ 2.5 UJ 2.5 UJ 2.5 U 2.5 UJ 2.5 UJ
GRANDVIEW 12/18/2007 2.5 U 2.5 U 2.5 U 2.5 U 2.5 UJ 2.5 U
PROSSER WP 12/20/2007 2.6 U 2.6 U 2.6 UJ 2.6 U 2.6 UJ 2.6 U
BENTONC WP 12/20/2007 2.6 U 2.6 U 2.6 UJ 2.6 U 2.6 UJ 2.6 U
W RICHLAND 12/20/2007 2.6 U 2.6 U 2.6 UJ 2.6 U 2.6 UJ 2.6 U
BOTTLE BLNK 12/18/2007 2.6 U 2.6 U 2.6 U 2.6 U 2.6 U 2.6 U
TRNSFR BLANK 12/18/2007 2.5 U 2.5 U 2.5 U 2.5 U 2.5 U 2.5 U
CLE ELUM WP 3/11/2008 na na na na na na
ELLENSBURG WP 3/11/2008 na na na na na na
KITTITAS WP 3/11/2008 na na na na na na
SELAH WP 3/11/2008 2.6 UJ 2.6 UJ 2.6 UJ 2.6 UJ 2.6 U 2.6 UJ
NACHES WP 3/13/2008 2.6 U 2.6 U 2.6 U 2.6 U 2.6 U 2.6 U
COWICHE WP 3/13/2008 2.5 U 2.5 U 2.7 UJ 2.5 U 2.5 U 2.5 U
YAKIMA WP 3/13/2008 2.5 UJ 2.5 J 3.6 UJ 2.5 UJ 2.5 U 2.5 UJ
YAKIMA REP 3/13/2008 2.6 UJ 2.6 UJ 3.7 UJ 2.6 UJ 2.6 U 2.6 UJ
MOXEE WP 3/18/2008 2.6 UJ 2.6 UJ 2.6 UJ 2.6 UJ 2.6 U 2.6 UJ
BUENA WP 3/18/2008 2.6 UJ 2.6 UJ 2.6 UJ 2.6 UJ 2.6 U 2.6 UJ
ZILLAH WP 3/18/2008 2.6 UJ 2.6 UJ 2.6 UJ 2.6 UJ 2.6 UJ 2.6 UJ
GRANGER WP 3/18/2008 2.6 UJ 2.6 UJ 2.6 UJ 2.6 UJ 2.6 U 2.6 UJ
SUNNYSIDE WP 3/18/2008 2.6 UJ 2.6 UJ 2.6 UJ 2.6 UJ 2.6 U 2.6 UJ
SS PORT WP 3/18/2008 2.6 UJ 2.6 UJ 2.6 UJ 2.6 UJ 2.6 UJ 2.6 UJ
MABTON WP 3/18/2008 2.6 UJ 2.6 UJ 2.6 UJ 2.6 UJ 2.6 UJ 2.6 UJ
GRANDVIEW WP 3/18/2008 2.6 UJ 2.6 UJ 2.6 UJ 2.6 UJ 2.6 U 2.6 UJ
PROSSER WP 3/20/2008 2.6 UJ 2.6 UJ 2.6 UJ 2.6 UJ 2.6 UJ 2.6 UJ
PROSSER REP 3/20/2008 2.6 UJ 2.6 UJ 2.6 UJ 2.6 UJ 2.6 U 2.6 UJ
BENTONC WP 3/20/2008 2.6 UJ 2.6 UJ 2.6 UJ 2.6 UJ 2.6 U 2.6 UJ
W RICHLAND 3/20/2008 2.6 UJ 2.6 UJ 2.6 UJ 2.6 UJ 2.6 U 2.6 UJ
TRNSFR BLANK 3/20/2008 2.6 UJ 2.6 UJ 2.6 UJ 2.6 UJ 2.6 UJ 2.6 UJ
BOTTLE BLANK 3/20/2008 na na na na na na
AldrinEndrin Ketone Heptachlor
Heptachlor EpoxideEndrin
Endrin Aldehyde
U = not detected at or above reported value J = estimated REJ = rejected na = not analyzed LS = lost in shipment

Yakima Pesticides/PCBs TMDL: Vol 1, WQ Study Findings Page 300
Collection
Field ID Date (ng/L) (ng/L) (pg/L) (mg/L) (NTU) (umhos/cm)
CLE ELUM WP 12/13/2007 na na 279 J 2 1.5 463
ELLENSBURG WP 12/13/2007 na na 2,067 J 4 2.2 443
KITTITAS WP 12/13/2007 na na 376 J 1 U 0.7 445
SELAH WP 12/13/2007 2.5 UJ 2.5 U 322 J 8 3.9 931
SELAH REP 12/13/2007 2.6 UJ 2.6 U 342 J 7 3.5 930
NACHES WP 12/12/2007 2.5 UJ 2.5 U 380 J 3 2.4 412
COWICHE WP 12/12/2007 2.6 UJ 2.6 U 857 J 2 1.7 638
YAKIMA WP 12/12/2007 2.7 UJ 2.7 U 932 J 3 2.4 548
MOXEE WP 12/18/2007 2.5 UJ 2.8 UJ 192 J 5 2.8 673
BUENA WP 12/18/2007 2.6 UJ 2.6 U 267 J 2 1.5 740
ZILLAH WP 12/18/2007 2.5 UJ 2.9 UJ 285 J 3 2.0 1300
GRANGER WP 12/18/2007 2.5 UJ 2.5 U 299 J 6 5.2 757
SUNNYSIDE WP 12/18/2007 2.6 UJ 3.3 UJ 967 J 3 1.6 894
SS PORT WP 12/18/2007 REJ REJ 510 J 247 6.5 3250
MABTON WP 12/18/2007 2.7 UJ 2.7 U 284 J 8 4.8 627
GRANDVIEW WP 12/18/2007 2.5 UJ 2.5 UJ LS 26 7.5 1140
GRANDVIEW 12/18/2007 2.5 UJ 2.5 U 121 J 25 6.9 1150
PROSSER WP 12/20/2007 2.6 UJ 2.9 UJ 599 J 16 5.1 869
BENTONC WP 12/20/2007 2.6 UJ 2.6 U 260 J 14 4.1 1450
W RICHLAND 12/20/2007 2.6 UJ 2.6 U 350 J 8 4.6 1060
BOTTLE BLNK 12/18/2007 2.6 U 2.6 U 579 J na na na
TRNSFR BLANK 12/18/2007 2.5 U 2.5 U 516 J na na na
CLE ELUM WP 3/11/2008 na na 571 J 2 1.5 J 340
ELLENSBURG WP 3/11/2008 na na 713 J 4 1.3 J 433
KITTITAS WP 3/11/2008 na na 377 J 2 0.8 J 442
SELAH WP 3/11/2008 2.6 UJ 2.6 UJ 962 J 25 9.2 J 798
NACHES WP 3/13/2008 2.6 UJ 2.6 UJ 443 J 4 2.8 444
COWICHE WP 3/13/2008 2.5 UJ 2.7 UJ 680 J 2 1.2 588
YAKIMA WP 3/13/2008 2.5 UJ 4.9 UJ 1,382 J 4 2.4 645
YAKIMA REP 3/13/2008 2.6 UJ 5.1 UJ 434 J 4 2.3 644
MOXEE WP 3/18/2008 2.6 U 2.6 UJ 355 J 5 2.8 J 681
BUENA WP 3/18/2008 2.6 U 2.6 UJ 626 J 7 3.1 J 759
ZILLAH WP 3/18/2008 2.6 UJ 2.6 UJ 1,186 J 5 2.2 J 1450
GRANGER WP 3/18/2008 2.6 U 2.6 UJ 801 J 3 1.8 J 776
SUNNYSIDE WP 3/18/2008 2.6 U 2.6 UJ 1,106 J 2 1.9 J 840
SS PORT WP 3/18/2008 2.6 UJ 2.6 UJ 1,323 J 36 12 J 3150
MABTON WP 3/18/2008 2.6 UJ 2.6 UJ 2,370 J 71 32 J 639
GRANDVIEW WP 3/18/2008 2.6 U 2.6 UJ 463 J 19 5.4 J 1260
PROSSER WP 3/20/2008 2.6 UJ 2.6 UJ 493 J 1 U 0.8 997
PROSSER REP 3/20/2008 2.6 U 2.6 UJ 387 J 1 0.7 996
BENTONC WP 3/20/2008 2.6 U 2.6 UJ 749 J 3 2.1 1250
W RICHLAND 3/20/2008 2.6 U 2.6 UJ 531 J na 1.3 1020
TRNSFR BLANK 3/20/2008 2.6 UJ 2.6 UJ 184 J na na na
BOTTLE BLANK 3/20/2008 na na 640 J na na na
Hexachloro-benzene Methoxychlor T-PCBs
Total Suspended
Solids Turbidity Conductivity
U = not detected at or above reported value J = estimated REJ = rejected na = not analyzed LS = lost in shipment

Yakima Pesticides/PCBs TMDL: Vol 1, WQ Study Findings Page 301
Appendix O. Fruit Packer and Vegetable Processor Effluent Data, 2007-08
Collection FlowSample No. Field ID Date (mgd) (ng/L) (ng/L) (ng/L)
7308986 ANDRUS 7/26/2007 0.0048 0.35 J 3.1 J 3.0 J7308983 APPLE KING 7/26/2007 0.0058 1.1 J 1.7 J 0.062 UJ7308984 GILBERT 7/26/2007 0.0054 0.063 UJ 0.096 J 0.063 UJ7314010 SNOKIST 7/30/2007 0.162 0.061 U 0.061 U 0.097 J7308987 TWIN CITY 7/26/2007 0.261 0.064 UJ 0.064 UJ 0.064 UJ7308982 ZIRKLE FRUIT 7/26/2007 0.166 0.12 J 0.21 UJ 0.063 UJ7308988 ZIRKLE REP 7/26/2007 - - 0.13 J 0.21 J 0.063 UJ7308989 TRNSFR BLNK 7/26/2007 - - 0.065 UJ 0.065 UJ 0.065 UJ
7418900 ANDRUS 10/10/2007 0.0030 0.84 J 3.0 J 1.2 J7388864 APPLE KING 9/20/2007 0.0058 1.7 2.7 J 0.061 U7398820 GILBERT 9/25/2007 0.0054 0.064 UJ 0.064 UJ 0.064 UJ7388865 SNOKIST 9/20/2007 1.0360 0.62 0.062 UJ 0.062 U7398821 TWIN CITY 9/27/2007 0.3910 0.061 UJ 0.061 UJ 0.061 UJ7398823 TWIN REP 9/27/2007 - - 0.061 UJ 0.061 UJ 0.061 UJ7388863 ZIRKLE FRUIT 9/18/2007 0.0827 0.23 J 0.69 J 0.063 U
7508111 ANDRUS 12/12/2007 0.0030 0.44 J 0.37 J 0.067 J7508109 APPLE KING 12/12/2007 0.0058 0.39 J 0.44 J 0.068 J7508112 APPLE REP 12/12/2007 - - 0.44 J 0.45 J 0.088 J7518100 GILBERT 12/18/2007 0.0054 0.067 J 1.6 J 1.7 J7508110 SNOKIST 12/12/2007 0.25 0.062 UJ 0.062 UJ 0.062 UJ7518101 CON AGRA* 12/18/2007 0.23 0.063 U 0.063 U 0.063 U7508108 ZIRKLE FRUIT 12/13/2007 0.11 0.062 J 0.65 J 0.24 J7508113 TRNSFR BLNK 12/12/2007 - - 0.063 U 0.063 U 0.063 U
- - ANDRUS - -not processing
8118821 APPLE KING 3/13/2008 0.0058 0.52 J 1.2 J 0.16 J8128833 GILBERT 3/18/2008 0.0054 1.6 J 6.8 4.6 J8128835 SNOKIST 3/20/2008 0.21 0.12 J 0.067 0.063 U8128836 SNOKIST REP 3/20/2008 - - 0.063 U 0.063 U 0.063 U8128834 CON AGRA* 3/19/2008 0.34 0.063 UJ 0.063 UJ 0.063 UJ8118820 ZIRKLE 3/11/2008 0.089 0.49 J 0.37 J 0.18 J8128837 TRNSFR BLNK 3/19/2008 - - 0.063 U 0.063 U 0.063 UJ
U = not detected at or above reported valueJ = estimated REJ = rejectedna = not analyzed*Twin City sold to Con Agra Foods Oct 07
4,4'-DDD 4,4'-DDE 4,4'-DDT

Yakima Pesticides/PCBs TMDL: Vol 1, WQ Study Findings Page 302
CollectionField ID Date (ng/L) (ng/L) (ng/L) (ng/L) (ng/L) (ng/L)
ANDRUS 7/26/2007 0.87 J 2.9 J 0.062 UJ 0.062 UJ 0.062 UJ 0.062 UJAPPLE KING 7/26/2007 1.9 J 1.0 UJ 0.062 UJ 0.062 UJ 0.062 UJ 0.062 UJGILBERT 7/26/2007 0.08 J 0.26 J 0.063 UJ 0.063 UJ 0.063 UJ 0.063 UJSNOKIST 7/30/2007 0.43 J 0.99 0.061 U 0.061 U 0.061 U 0.061 UTWIN CITY 7/26/2007 2.5 J 1.2 UJ 0.064 UJ 0.064 UJ 0.088 J 0.064 UJZIRKLE FRUIT 7/26/2007 0.84 UJ 7.9 UJ 0.063 UJ 0.063 UJ 0.063 UJ 0.063 UJZIRKLE REP 7/26/2007 1.3 UJ 17 UJ 0.063 UJ 0.063 UJ 0.063 UJ 0.063 UJTRNSFR BLNK 7/26/2007 0.065 UJ 0.12 UJ 0.065 UJ 0.065 UJ 0.065 UJ 0.065 UJ
ANDRUS 10/10/2007 0.32 UJ 19 J 0.064 UJ 0.24 UJ 0.064 UJ 0.064 UJAPPLE KING 9/20/2007 1.1 UJ 1.2 UJ 0.061 U 0.28 UJ 0.23 UJ 0.061 UGILBERT 9/25/2007 0.86 J 2.5 J 0.064 UJ 1.3 J 0.064 UJ 0.064 UJSNOKIST 9/20/2007 0.062 U 0.091 UJ 0.062 U 0.062 U 0.093 UJ 0.062 UTWIN CITY 9/27/2007 0.078 0.25 J 0.061 U 0.061 U 0.061 U 0.061 UTWIN REP 9/27/2007 0.061 U 0.42 J 0.061 U 0.061 U 0.061 U 0.061 UZIRKLE FRUIT 9/18/2007 0.59 UJ 74 UJ 0.063 U 0.063 U 0.063 U 0.063 U
ANDRUS 12/12/2007 0.082 UJ 1.6 J 0.068 J 0.063 UJ 0.21 J 0.063 UJAPPLE KING 12/12/2007 1.2 2.4 J 0.063 UJ 0.063 UJ 0.063 UJ 0.18 UJAPPLE REP 12/12/2007 1.3 2.5 J 0.063 UJ 0.063 UJ 0.063 UJ 0.063 UJGILBERT 12/18/2007 0.69 UJ 1.5 UJ 0.063 UJ 0.33 UJ 0.063 UJ 0.16 UJSNOKIST 12/12/2007 0.062 UJ 0.25 J 0.062 UJ 0.062 UJ 0.062 UJ 0.062 UJCON AGRA* 12/18/2007 0.07 UJ 0.063 UJ 0.063 U 0.063 U 0.063 U 0.063 UZIRKLE FRUIT 12/13/2007 2.6 J 3.1 J 0.062 UJ 0.26 UJ 0.062 UJ 0.062 UJTRNSFR BLNK 12/12/2007 0.063 U 0.063 U 0.063 U 0.063 U 0.063 U 0.063 U
ANDRUS - -APPLE KING 3/13/2008 0.55 J 6.3 J 0.062 UJ 0.062 UJ 0.083 UJ 0.062 UJGILBERT 3/18/2008 0.061 U 2.0 0.23 UJ 0.061 U 0.16 UJ 0.12 UJSNOKIST 3/20/2008 0.063 U 1.3 0.063 U 0.063 U 0.063 U 0.063 USNOKIST REP 3/20/2008 0.063 U 1.3 0.063 U 0.063 U 0.063 U 0.063 UCON AGRA* 3/19/2008 0.14 J 0.45 UJ 0.063 UJ 0.063 UJ 0.063 UJ 0.063 UJZIRKLE 3/11/2008 1.1 UJ 3.0 J 0.063 UJ 0.063 UJ 0.063 UJ 0.063 UJTRNSFR BLNK 3/19/2008 0.063 U 0.17 0.063 U 0.063 U 0.063 U 0.063 U
U = not detected at or above reported valueJ = estimated REJ = rejectedna = not analyzed*Twin City sold to Con Agra Foods Oct 07
Dieldrin ChlorpyrfosCis-
Chlordane Cis-
NonachlorTrans-
ChlordaneTrans-
Nonachlor

Yakima Pesticides/PCBs TMDL: Vol 1, WQ Study Findings Page 303
CollectionField ID Date (ng/L) (ng/L) (ng/L) (ng/L) (ng/L)
ANDRUS 7/26/2007 0.062 UJ 3.1 UJ 0.22 J 0.47 UJ 0.073 UJAPPLE KING 7/26/2007 0.062 UJ 3.1 UJ 0.062 UJ 0.062 UJ 0.073 UJGILBERT 7/26/2007 0.063 UJ 3.1 UJ 0.063 UJ 0.063 UJ 0.063 UJSNOKIST 7/30/2007 0.061 U 3.1 U 0.11 0.061 U 0.061 UTWIN CITY 7/26/2007 0.064 UJ 3.8 UJ 0.14 J 0.064 UJ 0.064 UJZIRKLE FRUIT 7/26/2007 0.063 UJ 5.7 UJ 0.063 UJ 0.063 UJ 0.084 UJZIRKLE REP 7/26/2007 0.063 UJ 7.7 UJ 0.063 UJ 0.063 UJ 0.079 UJTRNSFR BLNK 7/26/2007 0.065 UJ 3.1 UJ 0.065 UJ 0.065 UJ 0.065 UJ
ANDRUS 10/10/2007 0.064 UJ 16 UJ 0.35 0.064 UJ 0.15 UJAPPLE KING 9/20/2007 0.061 U 3.1 U 0.061 U 0.061 UJ 0.061 UJGILBERT 9/25/2007 0.064 UJ 3.2 UJ 0.064 UJ 0.064 UJ 0.064 UJSNOKIST 9/20/2007 0.062 U 3.1 U 0.18 0.13 UJ 0.062 UJTWIN CITY 9/27/2007 0.061 U 3.1 U 0.061 0.061 0.061 UJTWIN REP 9/27/2007 0.061 U 3.1 U 0.061 U 0.061 U 0.061 UZIRKLE FRUIT 9/18/2007 0.063 U 6.3 UJ 0.063 U 0.99 UJ 0.13 UJ
ANDRUS 12/12/2007 0.063 UJ 3.1 UJ 0.063 UJ 0.063 UJ 0.063 UJAPPLE KING 12/12/2007 0.063 UJ 3.1 U 0.063 UJ 0.086 UJ 0.063 UJAPPLE REP 12/12/2007 0.063 UJ 3.1 UJ 0.063 UJ 0.063 UJ 0.063 UJGILBERT 12/18/2007 0.063 UJ 16 UJ 0.063 UJ 0.074 UJ 0.24 UJSNOKIST 12/12/2007 0.062 UJ 3.1 UJ 0.062 UJ 0.062 UJ 0.062 UJCON AGRA* 12/18/2007 0.063 U 3.1 U 0.063 U 0.063 U 0.063 UJZIRKLE FRUIT 12/13/2007 0.062 UJ 6.2 UJ 0.17 UJ 0.062 UJ 0.17 UJTRNSFR BLNK 12/12/2007 0.063 U 3.2 U 0.063 U 0.063 U 0.063 UJ
ANDRUS - -APPLE KING 3/13/2008 0.062 UJ 3.1 UJ 0.062 UJ 0.062 UJ 0.07 UJGILBERT 3/18/2008 0.31 UJ 30 UJ 0.086 UJ 0.061 U 0.061 UJSNOKIST 3/20/2008 0.063 U 7.8 UJ 0.063 U 0.44 UJ 0.063 UJSNOKIST REP 3/20/2008 0.063 U 7.8 UJ 0.063 U 0.48 UJ 0.063 UJCON AGRA* 3/19/2008 0.063 UJ 3.1 UJ 0.063 UJ 0.063 UJ 0.063 UJZIRKLE 3/11/2008 0.063 UJ 16 UJ 0.14 J 0.12 J 0.11 UJTRNSFR BLNK 3/19/2008 0.063 U 3.1 U 0.063 U 0.063 U 0.063 UJ
U = not detected at or above reported valueJ = estimated REJ = rejectedna = not analyzed*Twin City sold to Con Agra Foods Oct 07
Oxychlordane ToxapheneAlpha-BHC Beta-BHC Delta-BHC

Yakima Pesticides/PCBs TMDL: Vol 1, WQ Study Findings Page 304
CollectionField ID Date (ng/L) (ng/L) (ng/L) (ng/L) (ng/L)
ANDRUS 7/26/2007 0.062 UJ 0.062 UJ 0.42 J 0.63 J 1.0 JAPPLE KING 7/26/2007 0.062 UJ 0.062 UJ 0.8 J 2.2 J 3.7 JGILBERT 7/26/2007 0.063 UJ 0.063 UJ 0.72 J 2.1 J 1.3 JSNOKIST 7/30/2007 0.061 U 0.24 UJ 0.12 J 0.082 J 3.0 JTWIN CITY 7/26/2007 0.064 UJ 0.064 UJ 1.3 J 0.2 J 7.2 JZIRKLE FRUIT 7/26/2007 0.063 UJ 0.37 UJ 1.2 UJ 9.6 J 13 JZIRKLE REP 7/26/2007 0.063 UJ 0.063 UJ 1.5 J 12 J 18 JTRNSFR BLNK 7/26/2007 0.065 UJ 0.065 UJ 0.065 UJ 0.065 UJ 0.065 UJ
ANDRUS 10/10/2007 0.55 J 0.32 UJ 0.32 UJ 93 J 34 JAPPLE KING 9/20/2007 0.065 UJ 0.18 UJ 0.58 J 1.6 2.6GILBERT 9/25/2007 0.064 UJ 0.064 UJ 0.064 UJ 0.064 UJ 14 JSNOKIST 9/20/2007 0.062 U 0.062 U 0.099 J 0.27 J 2.0TWIN CITY 9/27/2007 0.077 0.061 UJ 0.65 0.067 1.8 JTWIN REP 9/27/2007 0.061 U 0.061 UJ 0.61 0.071 J 1.2ZIRKLE FRUIT 9/18/2007 0.063 U 0.099 UJ 1.2 J 7.8 J 15
ANDRUS 12/12/2007 0.075 J 0.73 UJ 1.7 J 12 J 7.7 JAPPLE KING 12/12/2007 0.063 UJ 0.41 UJ 2.4 11 7.4 JAPPLE REP 12/12/2007 0.063 UJ 1.3 UJ 2.7 14 J 9.2 JGILBERT 12/18/2007 0.18 UJ 1.9 UJ 3.5 13 J 8.0 JSNOKIST 12/12/2007 0.062 UJ 0.062 UJ 0.062 UJ 0.16 J 1.1 JCON AGRA* 12/18/2007 0.14 0.27 UJ 0.98 J 0.39 UJ 12 EZIRKLE FRUIT 12/13/2007 0.17 UJ 2.6 UJ 4.4 21 J 17 JTRNSFR BLNK 12/12/2007 0.063 U 0.063 UJ 0.063 U 0.063 UJ 0.063 UJ
ANDRUS - -APPLE KING 3/13/2008 0.062 UJ 0.062 UJ 3.4 J 7.6 J 7.7 JGILBERT 3/18/2008 0.3 UJ 0.88 UJ 5 J 14 J 53SNOKIST 3/20/2008 0.063 U 0.063 U 0.66 0.46 2.0 JSNOKIST REP 3/20/2008 0.15 0.063 U 0.52 0.33 1.8 JCON AGRA* 3/19/2008 0.063 UJ 0.063 UJ 0.083 UJ 0.17 J 6.6 JZIRKLE 3/11/2008 0.23 J 0.89 UJ 1.3 J 14 J 11 JTRNSFR BLNK 3/19/2008 0.063 U 0.063 U 0.063 U 0.063 U 0.078 J
U = not detected at or above reported valueJ = estimated REJ = rejectedna = not analyzed*Twin City sold to Con Agra Foods Oct 07
Lindane Aldrin Endosulfan I Endosulfan IIEndosulfan
Sulfate
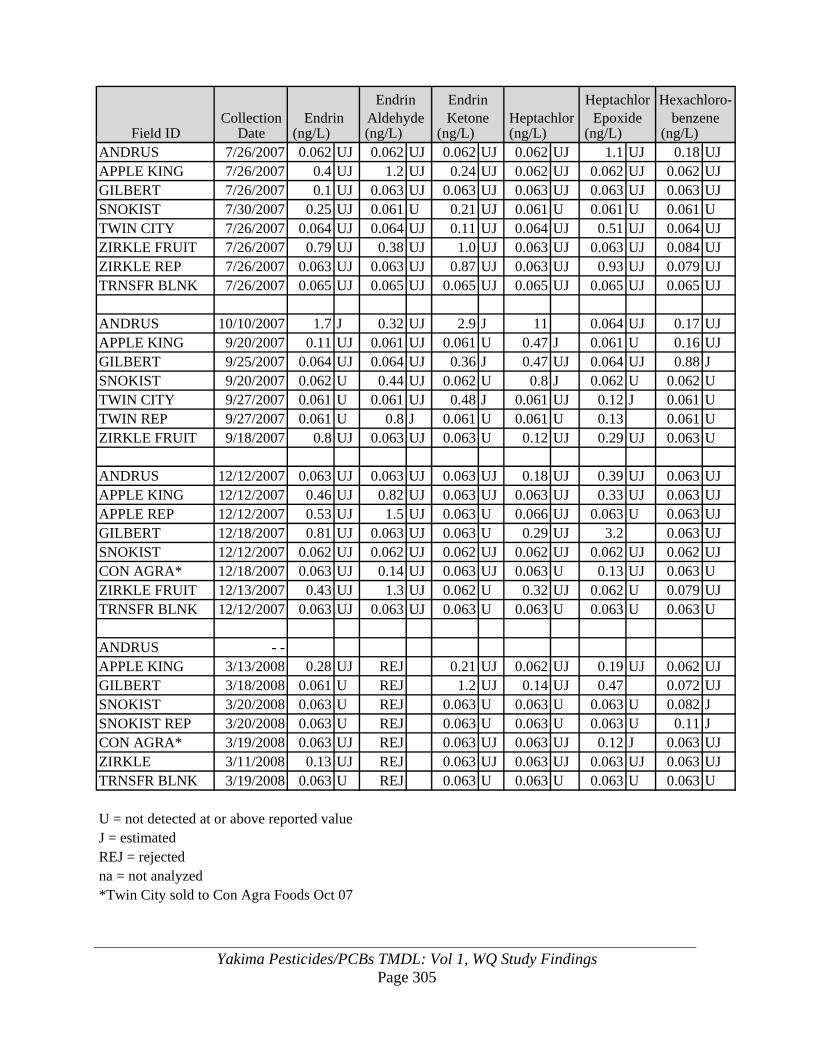
Yakima Pesticides/PCBs TMDL: Vol 1, WQ Study Findings Page 305
CollectionField ID Date (ng/L) (ng/L) (ng/L) (ng/L) (ng/L) (ng/L)
ANDRUS 7/26/2007 0.062 UJ 0.062 UJ 0.062 UJ 0.062 UJ 1.1 UJ 0.18 UJAPPLE KING 7/26/2007 0.4 UJ 1.2 UJ 0.24 UJ 0.062 UJ 0.062 UJ 0.062 UJGILBERT 7/26/2007 0.1 UJ 0.063 UJ 0.063 UJ 0.063 UJ 0.063 UJ 0.063 UJSNOKIST 7/30/2007 0.25 UJ 0.061 U 0.21 UJ 0.061 U 0.061 U 0.061 UTWIN CITY 7/26/2007 0.064 UJ 0.064 UJ 0.11 UJ 0.064 UJ 0.51 UJ 0.064 UJZIRKLE FRUIT 7/26/2007 0.79 UJ 0.38 UJ 1.0 UJ 0.063 UJ 0.063 UJ 0.084 UJZIRKLE REP 7/26/2007 0.063 UJ 0.063 UJ 0.87 UJ 0.063 UJ 0.93 UJ 0.079 UJTRNSFR BLNK 7/26/2007 0.065 UJ 0.065 UJ 0.065 UJ 0.065 UJ 0.065 UJ 0.065 UJ
ANDRUS 10/10/2007 1.7 J 0.32 UJ 2.9 J 11 0.064 UJ 0.17 UJAPPLE KING 9/20/2007 0.11 UJ 0.061 UJ 0.061 U 0.47 J 0.061 U 0.16 UJGILBERT 9/25/2007 0.064 UJ 0.064 UJ 0.36 J 0.47 UJ 0.064 UJ 0.88 JSNOKIST 9/20/2007 0.062 U 0.44 UJ 0.062 U 0.8 J 0.062 U 0.062 UTWIN CITY 9/27/2007 0.061 U 0.061 UJ 0.48 J 0.061 UJ 0.12 J 0.061 UTWIN REP 9/27/2007 0.061 U 0.8 J 0.061 U 0.061 U 0.13 0.061 UZIRKLE FRUIT 9/18/2007 0.8 UJ 0.063 UJ 0.063 U 0.12 UJ 0.29 UJ 0.063 U
ANDRUS 12/12/2007 0.063 UJ 0.063 UJ 0.063 UJ 0.18 UJ 0.39 UJ 0.063 UJAPPLE KING 12/12/2007 0.46 UJ 0.82 UJ 0.063 UJ 0.063 UJ 0.33 UJ 0.063 UJAPPLE REP 12/12/2007 0.53 UJ 1.5 UJ 0.063 U 0.066 UJ 0.063 U 0.063 UJGILBERT 12/18/2007 0.81 UJ 0.063 UJ 0.063 U 0.29 UJ 3.2 0.063 UJSNOKIST 12/12/2007 0.062 UJ 0.062 UJ 0.062 UJ 0.062 UJ 0.062 UJ 0.062 UJCON AGRA* 12/18/2007 0.063 UJ 0.14 UJ 0.063 UJ 0.063 U 0.13 UJ 0.063 UZIRKLE FRUIT 12/13/2007 0.43 UJ 1.3 UJ 0.062 U 0.32 UJ 0.062 U 0.079 UJTRNSFR BLNK 12/12/2007 0.063 UJ 0.063 UJ 0.063 U 0.063 U 0.063 U 0.063 U
ANDRUS - -APPLE KING 3/13/2008 0.28 UJ REJ 0.21 UJ 0.062 UJ 0.19 UJ 0.062 UJGILBERT 3/18/2008 0.061 U REJ 1.2 UJ 0.14 UJ 0.47 0.072 UJSNOKIST 3/20/2008 0.063 U REJ 0.063 U 0.063 U 0.063 U 0.082 JSNOKIST REP 3/20/2008 0.063 U REJ 0.063 U 0.063 U 0.063 U 0.11 JCON AGRA* 3/19/2008 0.063 UJ REJ 0.063 UJ 0.063 UJ 0.12 J 0.063 UJZIRKLE 3/11/2008 0.13 UJ REJ 0.063 UJ 0.063 UJ 0.063 UJ 0.063 UJTRNSFR BLNK 3/19/2008 0.063 U REJ 0.063 U 0.063 U 0.063 U 0.063 U
U = not detected at or above reported valueJ = estimated REJ = rejectedna = not analyzed*Twin City sold to Con Agra Foods Oct 07
EndrinEndrin
AldehydeEndrin Ketone Heptachlor
Heptachlor Epoxide
Hexachloro-benzene

Yakima Pesticides/PCBs TMDL: Vol 1, WQ Study Findings Page 306
CollectionField ID Date (ng/L) (mg/L) (NTU) (umhos/cm)
ANDRUS 7/26/2007 0.062 UJ 86 110 679APPLE KING 7/26/2007 2.0 UJ 4 18 456GILBERT 7/26/2007 0.095 UJ 2 0.7 185SNOKIST 7/30/2007 1.4 UJ 24 6.3 996TWIN CITY 7/26/2007 2.3 UJ 15 5.3 3,010ZIRKLE FRUIT 7/26/2007 1.0 UJ 2 5.4 569ZIRKLE REP 7/26/2007 0.063 UJ 2 U 5.3 568TRNSFR BLNK 7/26/2007 0.065 UJ na na na
ANDRUS 10/10/2007 35 J 242 110 603APPLE KING 9/20/2007 0.061 UJ 7 9.6 432GILBERT 9/25/2007 0.064 UJ 51 28 250SNOKIST 9/20/2007 0.062 UJ 4 1.9 529TWIN CITY 9/27/2007 0.061 U 2 1.9 2,110TWIN REP 9/27/2007 0.061 U 2 2.1 2,100ZIRKLE FRUIT 9/18/2007 0.063 UJ 2 U 3.5 718
ANDRUS 12/12/2007 2.7 UJ 20 28 494APPLE KING 12/12/2007 0.84 UJ 3 17 479APPLE REP 12/12/2007 0.87 UJ 4 12 480GILBERT 12/18/2007 2.3 UJ 68 34 221SNOKIST 12/12/2007 0.062 UJ 11 4.1 592CON AGRA* 12/18/2007 0.063 UJ 5 3.5 2,310ZIRKLE FRUIT 12/13/2007 2.3 UJ 16 18 748TRNSFR BLNK 12/12/2007 0.063 UJ na na na
ANDRUS - -APPLE KING 3/13/2008 0.062 UJ 6 16 518GILBERT 3/18/2008 1.1 UJ 24 24 J 225SNOKIST 3/20/2008 0.063 U 3 1.3 545SNOKIST REP 3/20/2008 0.063 U 3 1.1 543CON AGRA* 3/19/2008 0.063 UJ 8 4.3 2,990ZIRKLE 3/11/2008 0.063 UJ 19 23 766TRNSFR BLNK 3/19/2008 0.063 UJ na na na
U = not detected at or above reported valueJ = estimated REJ = rejectedna = not analyzed*Twin City sold to Con Agra Foods Oct 07
Methoxychlor
Total Suspended
Solids Turbidity Conductivity

Yakima Pesticides/PCBs TMDL: Vol 1, WQ Study Findings Page 307
Appendix P. Stormwater Data, 2007-08
U = not detected at or above reported value
J = estimated
na = not analyzed
Sample No. City Field IDCollection
Date7404850 Ellensburg CANYON RD 10/4/2007 na na na7404851 Ellensburg MT VIEW 10/4/2007 na na na7404852 Ellensburg CORA 10/4/2007 na na na
7424858 Yakima HORSE 10/18/2007 2.5 UJ 9.1 J 7.5 J7424863 Yakima HORSE REP 10/18/2007 0.29 J 5.8 J 4.7 J
7474858 Yakima HORSE 11/17/2007 2.5 J 14 J 9.6 J7474861 Yakima HORSE REP 11/17/2007 3 J 19 J 13 J7474859 Yakima 12TH 11/17/2007 3.3 J 18 J 22 J7474860 Yakima PERRY T 11/17/2007 2.5 UJ 18 J 13 J7474862 Yakima TRAILER 11/17/2007 2.5 UJ 2.5 UJ 2.5 UJ7474863 Yakima 34TH 11/17/2007 2.5 UJ 3 J 2.5 UJ7474864 Yakima TRANSF BLNK 11/17/2007 na na na
7474850 Ellensburg CANYON RD 11/17/2007 na na na7474851 Ellensburg MT VIEW 11/17/2007 na na na7474852 Ellensburg CORA 11/17/2007 na na na7474853 Ellensburg MUSIC 11/17/2007 na na na
na na na7494859 Yakima 12TH 12/2/2007 2.7 UJ 13 J 13 J7494861 Yakima 12TH REP 12/2/2007 2.6 UJ 13 J 13 J7494858 Yakima HORSE 12/2/2007 2.5 UJ 9.8 J 9.9 J7494860 Yakima PERRY T 12/2/2007 2.5 UJ 11 J 9.5 J7494864 Yakima TRANSF BLNK 12/2/2007 2.5 U 2.5 U 2.5 U
7494850 Ellensburg CANYON RD 12/3/2007 na na na7494851 Ellensburg MT VIEW 12/3/2007 na na na7494852 Ellensburg CORA 12/3/2007 na na na7494853 Ellensburg MUSIC 12/3/2007 na na na7494854 Ellensburg CORA REP 12/3/2007 na na na7494865 Ellensburg TRANSF BLNK 12/3/2007 na na na
4,4'-DDD (ng/L)
4,4'-DDE (ng/L)
4,4'-DDT (ng/L)

Yakima Pesticides/PCBs TMDL: Vol 1, WQ Study Findings Page 308
U = not detected at or above reported value
J = estimated
na = not analyzed
CollectionSample No. City Field ID Date (ng/L) (ng/L) (ng/L) (ng/L) (ng/L)
7404850 Ellensburg CANYON RD 10/4/2007 na na na na na7404851 Ellensburg MT VIEW 10/4/2007 na na na na na7404852 Ellensburg CORA 10/4/2007 na na na na na
7424858 Yakima/Union HORSE 10/18/2007 8.3 17 J 4.9 15 267424863 Yakima/Union HORSE REP 10/18/2007 4.6 9.6 J 5.8 8.7 16
7474858 Yakima/Union HORSE 11/17/2007 7.4 UJ 19 J 2.8 J 19 J 21 J7474861 Yakima/Union HORSE REP 11/17/2007 9.3 UJ 4.8 J 12 24 267474859 Yakima/Union 12TH 11/17/2007 4.4 J 2.4 UJ 2.4 U 12 J 14 J7474860 Yakima/Union PERRY T 11/17/2007 5.1 J 2.5 UJ 2.5 UJ 10 J 12 J7474862 Yakima/Union TRAILER 11/17/2007 2.5 UJ 2.5 UJ 2.5 UJ 2.5 UJ 2.5 UJ7474863 Yakima/Union 34TH 11/17/2007 2.5 UJ 2.5 UJ 2.5 UJ 4.5 J 7.0 J7474864 Yakima/Union TRNSF BLNK 11/17/2007 na na na na na
7474850 Ellensburg CANYON RD 11/17/2007 na na na na na7474851 Ellensburg MT VIEW 11/17/2007 na na na na na7474852 Ellensburg CORA 11/17/2007 na na na na na7474853 Ellensburg MUSIC 11/17/2007 na na na na na
7494859 Yakima/Union 12TH 12/2/2007 2.7 UJ 3.8 J 5.4 J 15 J 13 J7494861 Yakima/Union 12TH REP 12/2/2007 2.9 J 4.3 J 5.2 J 13 J 11 J7494858 Yakima/Union HORSE 12/2/2007 2.5 U 3.3 4.9 13 J 9.9 J7494860 Yakima/Union PERRY T 12/2/2007 3.0 J 4.5 J 3.0 13 J 10 J7494864 Yakima/Union TRNSF BLNK 12/2/2007 2.5 U 2.5 U 2.5 U 2.5 UJ 2.5 UJ
7494850 Ellensburg CANYON RD 12/3/2007 na na na na na7494851 Ellensburg MT VIEW 12/3/2007 na na na na na7494852 Ellensburg CORA 12/3/2007 na na na na na7494853 Ellensburg MUSIC 12/3/2007 na na na na na7494854 Ellensburg CORA REP 12/3/2007 na na na na na7494865 Ellensburg TRNSF BLNK 12/3/2007 na na na na na
Endosulfan Sulfate
Endosulfan I
Endosulfan II
Chlor-pyrifosDieldrin

Yakima Pesticides/PCBs TMDL: Vol 1, WQ Study Findings Page 309
TaTi
CollectionCity Field ID Date (ng/L) (ng/L) (ng/L) (ng/L)
Ellensburg CANYON RD 10/4/2007 na na na naEllensburg MT VIEW 10/4/2007 na na na naEllensburg CORA 10/4/2007 na na na na
Yakima/Union HORSE 10/18/2007 2.5 UJ 2.5 UJ 2.5 UJ 2.5 UJYakima/Union HORSE REP 10/18/2007 2.5 UJ 2.5 UJ 2.5 UJ 2.5 UJ
Yakima/Union HORSE 11/17/2007 2.4 UJ 2.4 UJ 2.4 UJ 2.4 UJYakima/Union HORSE REP 11/17/2007 2.5 UJ 2.5 UJ 2.5 UJ 2.5 UJYakima/Union 12TH 11/17/2007 4.0 J 2.4 UJ 4.1 J 4.5 JYakima/Union PERRY T 11/17/2007 2.5 UJ 2.5 UJ 2.5 UJ 2.5 UJYakima/Union TRAILER 11/17/2007 2.5 UJ 2.5 UJ 2.5 UJ 2.5 UJYakima/Union 34TH 11/17/2007 2.5 UJ 2.5 UJ 2.5 UJ 2.5 UJYakima/Union TRNSF BLNK 11/17/2007 na na na na
Ellensburg CANYON RD 11/17/2007 na na na naEllensburg MT VIEW 11/17/2007 na na na naEllensburg CORA 11/17/2007 na na na naEllensburg MUSIC 11/17/2007 na na na na
Yakima/Union 12TH 12/2/2007 2.7 UJ 2.7 UJ 2.7 UJ 2.7 UJYakima/Union 12TH REP 12/2/2007 2.6 UJ 2.6 UJ 2.6 UJ 2.6 UJYakima/Union HORSE 12/2/2007 2.5 UJ 2.5 UJ 2.5 UJ 2.5 UJYakima/Union PERRY T 12/2/2007 2.5 UJ 2.5 UJ 2.5 UJ 2.5 UJYakima/Union TRNSF BLNK 12/2/2007 2.5 U 2.5 U 2.5 U 2.5 U
Ellensburg CANYON RD 12/3/2007 na na na naEllensburg MT VIEW 12/3/2007 na na na naEllensburg CORA 12/3/2007 na na na naEllensburg MUSIC 12/3/2007 na na na naEllensburg CORA REP 12/3/2007 na na na naEllensburg TRNSF BLNK 12/3/2007 na na na naU = not detected at or above reported value
J = estimated
na = not analyzed
Cis-Chlordane Cis-
NonachlorTrans-
Chlordane Trans-
Nonachlor

Yakima Pesticides/PCBs TMDL: Vol 1, WQ Study Findings Page 310
CollectionCity Field ID Date (ng/L) (ng/L) (ng/L) (ng/L)
Ellensburg CANYON RD 10/4/2007 na na na naEllensburg MT VIEW 10/4/2007 na na na naEllensburg CORA 10/4/2007 na na na na
Yakima/Union HORSE 10/18/2007 2.5 UJ 2.5 UJ 2.5 UJ 2.5 UJYakima/Union HORSE REP 10/18/2007 2.5 UJ 2.5 UJ 2.5 UJ 2.5 UJ
Yakima/Union HORSE 11/17/2007 2.4 UJ 2.4 UJ 2.4 UJ 2.4 UJYakima/Union HORSE REP 11/17/2007 2.5 UJ 2.5 UJ 2.5 UJ 2.5 UJYakima/Union 12TH 11/17/2007 2.4 UJ 2.4 UJ 2.4 UJ 2.4 UJYakima/Union PERRY T 11/17/2007 2.5 UJ 2.5 UJ 2.5 UJ 2.5 UJYakima/Union TRAILER 11/17/2007 2.5 UJ 2.5 UJ 2.5 UJ 2.5 UJYakima/Union 34TH 11/17/2007 2.5 UJ 2.5 UJ 2.5 UJ 2.5 UJYakima/Union TRNSF BLNK 11/17/2007 na na na na
Ellensburg CANYON RD 11/17/2007 na na na naEllensburg MT VIEW 11/17/2007 na na na naEllensburg CORA 11/17/2007 na na na naEllensburg MUSIC 11/17/2007 na na na na
Yakima/Union 12TH 12/2/2007 2.7 UJ 2.7 UJ 2.7 UJ 2.7 UJYakima/Union 12TH REP 12/2/2007 2.6 UJ 2.6 UJ 2.6 UJ 2.6 UJYakima/Union HORSE 12/2/2007 2.5 UJ 2.5 UJ 2.5 UJ 2.5 UJYakima/Union PERRY T 12/2/2007 2.5 UJ 2.5 UJ 2.5 UJ 2.5 UJYakima/Union TRNSF BLNK 12/2/2007 2.5 U 2.5 U 2.5 U 2.5 U
Ellensburg CANYON RD 12/3/2007 na na na naEllensburg MT VIEW 12/3/2007 na na na naEllensburg CORA 12/3/2007 na na na naEllensburg MUSIC 12/3/2007 na na na naEllensburg CORA REP 12/3/2007 na na na naEllensburg TRNSF BLNK 12/3/2007 na na na naU = not detected at or above reported value
J = estimated
na = not analyzed
Oxy-chlordane
Alpha-BHC Beta-BHC Delta-BHC

Yakima Pesticides/PCBs TMDL: Vol 1, WQ Study Findings Page 311
CollectionCity Field ID Date (ng/L) (ng/L) (pg/L) (ng/L) (ng/L)
Ellensburg CANYON RD 10/4/2007 na na 2,144 J na naEllensburg MT VIEW 10/4/2007 na na 530 J na naEllensburg CORA 10/4/2007 na na 352 J na na
Yakima/Union HORSE 10/18/2007 2.5 UJ 25 UJ 15,999 J 2.5 U 4.4 UJYakima/Union HORSE REP 10/18/2007 2.5 UJ 25 UJ 1,668 J 2.5 U 2.5 U
Yakima/Union HORSE 11/17/2007 2.4 UJ 24 UJ 24,467 J 4.0 J 2.9 UJYakima/Union HORSE REP 11/17/2007 2.5 UJ 25 UJ 32,372 J 3.3 J 4.9 UJYakima/Union 12TH 11/17/2007 2.4 UJ 24 UJ na 2.6 UJ 2.5 UJYakima/Union PERRY T 11/17/2007 2.5 UJ 25 UJ 15,490 J 2.5 UJ 2.5 UJYakima/Union TRAILER 11/17/2007 2.5 UJ 25 UJ 566 J 2.5 UJ 2.5 UJYakima/Union 34TH 11/17/2007 2.5 UJ 25 UJ 734 J 2.5 UJ 2.5 UJYakima/Union TRNSF BLNK 11/17/2007 na na 133 J na na
Ellensburg CANYON RD 11/17/2007 na na 7,046 J na naEllensburg MT VIEW 11/17/2007 na na 33,485 J na naEllensburg CORA 11/17/2007 na na broken na naEllensburg MUSIC 11/17/2007 na na 440 J na na
Yakima/Union 12TH 12/2/2007 2.7 UJ 27 UJ 11,135 J 2.7 UJ 2.7 UJYakima/Union 12TH REP 12/2/2007 2.6 UJ 26 UJ 10,989 J 2.6 UJ 2.6 UJYakima/Union HORSE 12/2/2007 2.5 UJ 25 UJ 2,159 J 2.5 U 2.5 UJYakima/Union PERRY T 12/2/2007 2.5 UJ 25 UJ 1,994 J 2.5 U 2.5 UJYakima/Union TRNSF BLNK 12/2/2007 2.5 U 25 U 363 J 2.5 U 2.5 UJ
Ellensburg CANYON RD 12/3/2007 na na 6,136 J na naEllensburg MT VIEW 12/3/2007 na na 1,009 J na naEllensburg CORA 12/3/2007 na na 1,104 J na naEllensburg MUSIC 12/3/2007 na na 2,000 J na naEllensburg CORA REP 12/3/2007 na na 19,815 J na naEllensburg TRNSF BLNK 12/3/2007 na na 463 J na naU = not detected at or above reported value
J = estimated
na = not analyzed
Lindane ToxapheneTotal PCBs Aldrin Endrin

Yakima Pesticides/PCBs TMDL: Vol 1, WQ Study Findings Page 312
CollectionCity Field ID Date (ng/L) (ng/L) (ng/L) (ng/L)
Ellensburg CANYON RD 10/4/2007 na na na naEllensburg MT VIEW 10/4/2007 na na na naEllensburg CORA 10/4/2007 na na na na
Yakima/Union HORSE 10/18/2007 11 UJ 3.4 UJ 2.5 UJ 3.4 JYakima/Union HORSE REP 10/18/2007 10 UJ 2.5 U 2.5 UJ 2.5 U
Yakima/Union HORSE 11/17/2007 7.8 UJ 2.0 U 2.4 UJ 2.8 JYakima/Union HORSE REP 11/17/2007 5.3 UJ 2.6 UJ 2.5 UJ 3.5 JYakima/Union 12TH 11/17/2007 2.7 UJ 2.5 UJ 2.4 UJ 2.5 JYakima/Union PERRY T 11/17/2007 4.0 UJ 2.5 UJ 2.5 UJ 2.7 JYakima/Union TRAILER 11/17/2007 2.5 UJ 2.5 UJ 2.5 UJ 2.5 UJYakima/Union 34TH 11/17/2007 2.5 UJ 2.5 UJ 2.5 UJ 2.5 UJYakima/Union TRNSF BLNK 11/17/2007 na na na na
Ellensburg CANYON RD 11/17/2007 na na na naEllensburg MT VIEW 11/17/2007 na na na naEllensburg CORA 11/17/2007 na na na naEllensburg MUSIC 11/17/2007 na na na na
Yakima/Union 12TH 12/2/2007 2.7 UJ 2.7 UJ 2.7 UJ 2.7 UJYakima/Union 12TH REP 12/2/2007 2.6 UJ 2.6 UJ 2.6 UJ 2.6 UJYakima/Union HORSE 12/2/2007 2.5 UJ 2.5 U 2.5 UJ 2.5 UYakima/Union PERRY T 12/2/2007 2.5 UJ 2.5 U 2.5 UJ 2.5 UYakima/Union TRNSF BLNK 12/2/2007 2.5 UJ 2.5 U 2.5 U 2.5 U
Ellensburg CANYON RD 12/3/2007 na na na naEllensburg MT VIEW 12/3/2007 na na na naEllensburg CORA 12/3/2007 na na na naEllensburg MUSIC 12/3/2007 na na na naEllensburg CORA REP 12/3/2007 na na na naEllensburg TRNSF BLNK 12/3/2007 na na na naU = not detected at or above reported value
J = estimated
na = not analyzed
Endrin Aldehyde
Endrin Ketone Heptachlor
Heptachlor Epoxide

Yakima Pesticides/PCBs TMDL: Vol 1, WQ Study Findings Page 313
CollectionCity Field ID Date (ng/L) (ng/L) (mg/L) (NTU) (umhos/cm)
Ellensburg CANYON RD 10/4/2007 na na 127 210 J 192Ellensburg MT VIEW 10/4/2007 na na 20 39 J 118Ellensburg CORA 10/4/2007 na na 28 29 J 245
Yakima/Union HORSE 10/18/2007 2.5 UJ 11 43 75 91Yakima/Union HORSE REP 10/18/2007 2.5 UJ 6.3 38 75 91
Yakima/Union HORSE 11/17/2007 2.4 UJ 16 641 370 J 148Yakima/Union HORSE REP 11/17/2007 2.5 UJ 14 512 330 J 219Yakima/Union 12TH 11/17/2007 2.4 UJ 3.3 654 400 J 98Yakima/Union PERRY T 11/17/2007 2.5 UJ 5.1U 323 280 J 165Yakima/Union TRAILER 11/17/2007 2.5 UJ 2.5 1 U 1.4 J 286Yakima/Union 34TH 11/17/2007 2.5 UJ 2.5 18 33 J 146Yakima/Union TRNSF BLNK 11/17/2007 na na na na na
Ellensburg CANYON RD 11/17/2007 na na 206 200 J 51Ellensburg MT VIEW 11/17/2007 na na 116 140 J 42Ellensburg CORA 11/17/2007 na na 74 98 J 175Ellensburg MUSIC 11/17/2007 na na 15 45 J 261
Yakima/Union 12TH 12/2/2007 2.7 UJ 23 326 400 J 1,990Yakima/Union 12TH REP 12/2/2007 2.6 UJ 22 244 450 J 2,020Yakima/Union HORSE 12/2/2007 2.5 UJ 19 111 180 J 661Yakima/Union PERRY T 12/2/2007 2.5 UJ 3.3U 98 230 J 4,710Yakima/Union TRNSF BLNK 12/2/2007 2.5 U 2.5 na na na
Ellensburg CANYON RD 12/3/2007 na na 134 280 344Ellensburg MT VIEW 12/3/2007 na na 52 140 354Ellensburg CORA 12/3/2007 na na 66 120 342Ellensburg MUSIC 12/3/2007 na na 47 110 282Ellensburg CORA REP 12/3/2007 na na 63 120 347Ellensburg TRNSF BLNK 12/3/2007 na na na na naU = not detected at or above reported value
J = estimated
na = not analyzed
Hexachloro-benzene
Methox-ychlor
Total Suspended
Solids Turbidity Conductivity

Yakima Pesticides/PCBs TMDL: Vol 1, WQ Study Findings Page 314
CollectionSample No. City Field ID Date (ng/L) (ng/L) (ng/L)
8114859 Yakima/Union 12TH 3/13/2008 33 J 54 J 3.5 J8114858 Yakima/Union HORSE 3/13/2008 30 J 52 J 4.1 J8114861 Yakima/Union HORSE REP 3/13/2008 30 J 52 J 4.1 J8114864 Yakima/Union TRNSF BLNK 3/13/2008 2.6 U 2.6 U 2.6 U8114862 Yakima/Union BOTTLE BLNK 3/13/2008 na na na
8134858 Yakima/Union HORSE 3/28/2008 na na na8134859 Yakima/Union 12TH 3/28/2008 na na na8134861 Yakima/Union HORSE REP 3/28/2008 na na na8134864 Yakima/Union TRNSF BLNK 3/28/2008 na na na8134865 Yakima/Union BOTTLE BLNK 3/28/2008 na na na
8234850 Ellensburg CANYON RD 6/3/2008 na na na8234852 Ellensburg CORA 6/3/2008 na na na8234860 Yakima/Union PERRY T 6/3/2008 9.1 14 2.5 U8234864 Yakima/Union BOTTLE BLNK 6/3/2008 2.5 U 2.5 U 2.5 U
U = not detected at or above reported value
J = estimated
na = not analyzed
4,4'-DDT 4,4'-DDE 4,4'-DDD

Yakima Pesticides/PCBs TMDL: Vol 1, WQ Study Findings Page 315
Collection
City Field ID Date (ng/L) (ng/L) (ng/L) (ng/L) (ng/L)Yakima/Union 12TH 3/13/2008 2.6 UJ 222 J 40 J 47 J 14 JYakima/Union HORSE 3/13/2008 3.1 UJ 159 J 47 J 42 J 5.6 JYakima/Union HORSE REP 3/13/2008 3.1 UJ 156 J 40 J 41 J 6.8 JYakima/Union TRNSF BLNK 3/13/2008 2.6 UJ 2.6 UJ 2.6 UJ 2.6 UJ 2.6 UJYakima/Union BOTTLE BLNK 3/13/2008 na na na na na
Yakima/Union HORSE 3/28/2008 na na na na naYakima/Union 12TH 3/28/2008 na na na na naYakima/Union HORSE REP 3/28/2008 na na na na naYakima/Union TRNSF BLNK 3/28/2008 na na na na naYakima/Union BOTTLE BLNK 3/28/2008 na na na na na
Ellensburg CANYON RD 6/3/2008 na na na na naEllensburg CORA 6/3/2008 na na na na naYakima/Union PERRY T 6/3/2008 2.5 UJ 6.0 J 84 J 23 J 17 JYakima/Union BOTTLE BLNK 6/3/2008 2.5 UJ 2.5 UJ 2.5 UJ 2.5 UJ 2.5 UJ
U = not detected at or above reported value
J = estimated
na = not analyzed
DieldrinChlor-pyrifos
Endosulfan I
Endosulfan II
Endosulfan Sulfate

Yakima Pesticides/PCBs TMDL: Vol 1, WQ Study Findings Page 316
CollectionCity Field ID Date (ng/L) (ng/L) (ng/L) (ng/L)
Yakima/Union 12TH 3/13/2008 2.6 UJ 2.6 UJ 2.7 J 2.6 UJYakima/Union HORSE 3/13/2008 2.6 UJ 2.6 UJ 2.9 J 2.6 UJYakima/Union HORSE REP 3/13/2008 2.6 UJ 2.6 UJ 3.1 J 2.6 UJYakima/Union TRNSF BLNK 3/13/2008 2.6 U 2.6 U 2.6 U 2.6 UYakima/Union BOTTLE BLNK 3/13/2008 na na na na
Yakima/Union HORSE 3/28/2008 na na na naYakima/Union 12TH 3/28/2008 na na na naYakima/Union HORSE REP 3/28/2008 na na na naYakima/Union TRNSF BLNK 3/28/2008 na na na naYakima/Union BOTTLE BLNK 3/28/2008 na na na na
Ellensburg CANYON RD 6/3/2008 na na na naEllensburg CORA 6/3/2008 na na na naYakima/Union PERRY T 6/3/2008 2.5 U 2.5 U 2.5 U 2.5 UYakima/Union BOTTLE BLNK 6/3/2008 2.5 U 2.5 U 2.5 U 2.5 U
U = not detected at or above reported value
J = estimated
na = not analyzed
Cis-Chlordane Cis-
NonachlorTrans-
Chlordane Trans-
Nonachlor

Yakima Pesticides/PCBs TMDL: Vol 1, WQ Study Findings Page 317
CollectionCity Field ID Date (ng/L) (ng/L) (ng/L) (ng/L)
Yakima/Union 12TH 3/13/2008 2.6 UJ 2.6 UJ 2.6 UJ 2.6 UJYakima/Union HORSE 3/13/2008 2.6 UJ 2.6 UJ 2.6 UJ 2.6 UJYakima/Union HORSE REP 3/13/2008 2.6 UJ 2.6 UJ 2.6 UJ 2.6 UJYakima/Union TRNSF BLNK 3/13/2008 2.6 U 2.6 U 2.6 U 2.6 UJYakima/Union BOTTLE BLNK 3/13/2008 na na na na
Yakima/Union HORSE 3/28/2008 na na na naYakima/Union 12TH 3/28/2008 na na na naYakima/Union HORSE REP 3/28/2008 na na na naYakima/Union TRNSF BLNK 3/28/2008 na na na naYakima/Union BOTTLE BLNK 3/28/2008 na na na na
Ellensburg CANYON RD 6/3/2008 na na na naEllensburg CORA 6/3/2008 na na na naYakima/Union PERRY T 6/3/2008 2.5 U 2.5 U 2.5 U 2.5 UYakima/Union BOTTLE BLNK 6/3/2008 2.5 U 2.5 U 2.5 U 2.5 U
U = not detected at or above reported value
J = estimated
na = not analyzed
Oxy-chlordane
Alpha-BHC Beta-BHC Delta-BHC

Yakima Pesticides/PCBs TMDL: Vol 1, WQ Study Findings Page 318
CollectionCity Field ID Date (ng/L) (ng/L) (pg/L) (ng/L) (ng/L)
Yakima/Union 12TH 3/13/2008 2.6 UJ 26 UJ 11,207 J 2.6 UJ 2.6 UJYakima/Union HORSE 3/13/2008 2.6 UJ 32 J 19,584 J 2.6 UJ 2.6 UJYakima/Union HORSE REP 3/13/2008 2.6 UJ 29 J 16,245 J 6.2 UJ 2.6 UJYakima/Union TRNSF BLNK 3/13/2008 2.6 U 26 U 57 J 2.6 UJ 2.6 UJYakima/Union BOTTLE BLNK 3/13/2008 na na 506 J na na
Yakima/Union HORSE 3/28/2008 na na 8,097 J na naYakima/Union 12TH 3/28/2008 na na 7,512 J na naYakima/Union HORSE REP 3/28/2008 na na 8,502 J na naYakima/Union TRNSF BLNK 3/28/2008 na na 292 J na naYakima/Union BOTTLE BLNK 3/28/2008 na na 283 J na na
Ellensburg CANYON RD 6/3/2008 na na na na naEllensburg CORA 6/3/2008 na na na na naYakima/Union PERRY T 6/3/2008 2.5 U 25 UJ na 2.5 UJ 2.5 UJYakima/Union BOTTLE BLNK 6/3/2008 2.5 U 25 UJ na 2.5 UJ 2.5 UJ
U = not detected at or above reported value
J = estimated
na = not analyzed
Lindane ToxapheneTotal PCBs Aldrin Endrin

Yakima Pesticides/PCBs TMDL: Vol 1, WQ Study Findings Page 319
CollectionCity Field ID Date (ng/L) (ng/L) (ng/L) (ng/L)
Yakima/Union 12TH 3/13/2008 2.6 UJ 3.2 UJ 2.6 UJ 2.6 UJYakima/Union HORSE 3/13/2008 2.6 UJ 2.6 UJ 2.6 UJ 12 JYakima/Union HORSE REP 3/13/2008 2.6 UJ 2.6 UJ 2.6 UJ 8.7 JYakima/Union TRNSF BLNK 3/13/2008 2.6 UJ 2.6 UJ 2.6 U 2.6 UJYakima/Union BOTTLE BLNK 3/13/2008 na na na na
Yakima/Union HORSE 3/28/2008 na na na naYakima/Union 12TH 3/28/2008 na na na naYakima/Union HORSE REP 3/28/2008 na na na naYakima/Union TRNSF BLNK 3/28/2008 na na na naYakima/Union BOTTLE BLNK 3/28/2008 na na na
Ellensburg CANYON RD 6/3/2008 na na na naEllensburg CORA 6/3/2008 na na na naYakima/Union PERRY T 6/3/2008 2.5 UJ 2.5 UJ 2.5 U 2.5 UJYakima/Union BOTTLE BLNK 6/3/2008 2.5 UJ 2.5 UJ 2.5 U 2.5 UJ
U = not detected at or above reported value
J = estimated
na = not analyzed
Endrin Aldehyde
Endrin Ketone Heptachlor
Heptachlor Epoxide

Yakima Pesticides/PCBs TMDL: Vol 1, WQ Study Findings Page 320
CollectionCity Field ID Date (ng/L) (ng/L) (mg/L) (NTU) (umhos/cm)
Yakima/Union 12TH 3/13/2008 2.6 UJ 2.6 290 330 236Yakima/Union HORSE 3/13/2008 17 J 19 450 450 478Yakima/Union HORSE REP 3/13/2008 18 J 7.8 410 500 473Yakima/Union TRNSF BLNK 3/13/2008 2.6 UJ 2.6 na na naYakima/Union BOTTLE BLNK 3/13/2008 na na
Yakima/Union HORSE 3/28/2008 na na 196 225 J 370Yakima/Union 12TH 3/28/2008 na na 46 60 J 178Yakima/Union HORSE REP 3/28/2008 na na na na naYakima/Union TRNSF BLNK 3/28/2008 na na na na naYakima/Union BOTTLE BLNK 3/28/2008 na na na na na
naEllensburg CANYON RD 6/3/2008 na na 155 235 232Ellensburg CORA 6/3/2008 na na 63 70 182Yakima/Union PERRY T 6/3/2008 2.5 U 2.5 85 92 93Yakima/Union BOTTLE BLNK 6/3/2008 2.5 U 2.5 na na na
U = not detected at or above reported value
J = estimated
na = not analyzed
Hexachloro-benzene
Methox-ychlor
Total Suspended
Solids Turbidity Conductivity

Yakima Pesticides/PCBs TMDL: Vol 1, WQ Study Findings Page 321
Appendix Q. Values of Potential Use for Calculating Stormwater Loads to the Yakima River from Sunnyside and Richland (using the Simple Method)
Sunnyside
City Limits (acres) 4,232 Annual Rainfall (in.) 7.0 Fraction of Runoff 0.90 Impervious Fraction 0.22 Runoff Coefficient 0.25 Annual Runoff (in.) 1.79
Richland
Area discharging to Yakima River (acres) 5,990 Annual Rainfall (in.) 7.0 Fraction of Runoff 0.90 Impervious Fraction 0.22 Runoff Coefficient 0.25 Annual Runoff (in.) 1.79

Yakima Pesticides/PCBs TMDL: Vol 1, WQ Study Findings Page 322
This page is purposely left blank

Yakima Pesticides/PCBs TMDL: Vol 1, WQ Study Findings Page 323
Appendix R. Glossary, Acronyms, and Abbreviations
Glossary
303(d) list: Section 303(d) of the federal Clean Water Act requires Washington State periodically to prepare a list of all surface waters in the state for which beneficial uses of the water – such as for drinking, recreation, aquatic habitat, and industrial use – are impaired by pollutants. These are water quality limited estuaries, lakes, and streams that fall short of state surface water quality standards, and are not expected to improve within the next two years.
Best Management Practices (BMPs): Physical, structural, and/or operational practices that, when used singularly or in combination, prevent or reduce pollutant discharges.
Bioaccumulative Pollutants: Pollutants that build up in the food chain.
Clean Water Act: Federal Act passed in 1972 that contains provisions to restore and maintain the quality of the nation’s waters. Section 303(d) of the Clean Water Act establishes the TMDL program.
Conductivity: A measure of water’s ability to conduct an electrical current. Conductivity is related to the concentration and charge of dissolved ions in water.
Designated Uses: Those uses specified in Chapter 173-201A WAC (Water Quality Standards for Surface Waters of the State of Washington) for each waterbody or segment, regardless of whether or not the uses are currently attained.
Exceeds Criteria: Fails to meet criteria.
Existing Uses: Those uses actually attained in fresh and marine waters on or after November 28, 1975, whether or not they are designated uses. Introduced species that are not native to Washington, and put-and-take fisheries comprised of non-self-replicating introduced native species, do not need to receive full support as an existing use.
Grab Sample: A discrete sample from a single point in the water column or sediment surface.
Irrigation Season: In this study, the irrigation season is April through October.
Legacy Pesticide: Banned pesticides no longer used but that persist in the environment.
Load Allocation: The portion of a receiving waters’ loading capacity attributed to one or more of its existing or future sources of nonpoint pollution or to natural background sources.
Loading Capacity: The greatest amount of a substance that a waterbody can receive and still meet water quality standards.
Margin of Safety (MOS): Required component of TMDLs that accounts for uncertainty about the relationship between pollutant loads and quality of the receiving waterbody.

Yakima Pesticides/PCBs TMDL: Vol 1, WQ Study Findings Page 324
Municipal Separate Storm Sewer Systems (MS4): A conveyance or system of conveyances (including roads with drainage systems, municipal streets, catch basins, curbs, gutters, ditches, manmade channels, or storm drains): (i) owned or operated by a state, city, town, borough, county, parish, district, association, or other public body having jurisdiction over disposal of wastes, stormwater, or other wastes and (ii) designed or used for collecting or conveying stormwater; (iii) which is not a combined sewer; and (iv) which is not part of a Publicly Owned Treatment Works (POTW) as defined in the Code of Federal Regulations at 40 CFR 122.2.
National Pollutant Discharge Elimination System (NPDES): National program for issuing, modifying, revoking and reissuing, terminating, monitoring and enforcing permits, and imposing and enforcing pretreatment requirements under the Clean Water Act. The NPDES program regulates discharges from wastewater treatment plants, large factories, and other facilities that use, process, and discharge water back into lakes, streams, rivers, bays, and oceans.
Nonpoint Source: Pollution that enters any waters of the state from any dispersed land-based or water-based activities, including but not limited to atmospheric deposition, surface water runoff from agricultural lands, urban areas, or forest lands, subsurface or underground sources, or discharges from boats or marine vessels not otherwise regulated under the National Pollutant Discharge Elimination System Program. Generally, any unconfined and diffuse source of contamination. Legally, any source of water pollution that does not meet the legal definition of “point source” in section 502(14) of the Clean Water Act.
Parameter: Water quality constituent being measured. A physical, chemical, or biological property whose values determine environmental characteristics or behavior.
Phase I Stormwater Permit: The first phase of stormwater regulation required under the federal Clean Water Act. The permit is issued to medium and large municipal separate storm sewer systems (MS4s) and construction sites of five or more acres.
Phase II Stormwater Permit: The second phase of stormwater regulation required under the federal Clean Water Act. The permit is issued to smaller municipal separate storm sewer systems (MS4s) and construction sites over one acre.
Point Source: Sources of pollution that discharge at a specific location from pipes, outfalls, and conveyance channels to a surface water. Examples of point source discharges include municipal wastewater treatment plants, municipal stormwater systems, industrial waste treatment facilities, and construction sites that clear more than 5 acres of land.
Pollution: Such contamination, or other alteration of the physical, chemical, or biological properties, of any waters of the state. This includes change in temperature, taste, color, turbidity, or odor of the waters. It also includes discharge of any liquid, gaseous, solid, radioactive, or other substance into any waters of the state. This definition assumes that these changes will, or are likely to, create a nuisance or render such waters harmful, detrimental, or injurious to (1) public health, safety, or welfare, or (2) domestic, commercial, industrial, agricultural, recreational, or other legitimate beneficial uses, or (3) livestock, wild animals, birds, fish, or other aquatic life.
Salmonid: Any fish that belong to the family Salmonidae. Basically, any species of salmon, trout, or char. www.fws.gov/le/ImpExp/FactSheetSalmonids.htm

Yakima Pesticides/PCBs TMDL: Vol 1, WQ Study Findings Page 325
Stormwater: The portion of precipitation that does not naturally percolate into the ground or evaporate but instead runs off roads, pavement, and roofs during rainfall or snowmelt. Stormwater can also come from hard or saturated grass surfaces such as lawns, pastures, playfields, and from gravel roads and parking lots.
Synoptic survey: Data collected simultaneously or over a short period of time.
Surface Waters of the State: Lakes, rivers, ponds, streams, inland waters, salt waters, wetlands and all other surface waters and watercourses within the jurisdiction of Washington State.
Total Maximum Daily Load (TMDL): A distribution of a substance in a waterbody designed to protect it from exceeding water quality standards. A TMDL is equal to the sum of all of the following: (1) individual wasteload allocations for point sources, (2) the load allocations for nonpoint sources, (3) the contribution of natural sources, and (4) a Margin of Safety to allow for uncertainty in the wasteload determination. A reserve for future growth is also generally provided.
Total Suspended Solids (TSS): The suspended particulate matter in a water sample as retained by a filter.
Turbidity: A measure of water clarity. High levels of turbidity can have a negative impact on aquatic life.
Wasteload Allocation: The portion of a receiving water’s loading capacity allocated to existing or future point sources of pollution. Wasteload allocations constitute one type of water quality-based effluent limitation.
Watershed: A drainage area or basin in which all land and water areas drain or flow toward a central collector such as a stream, river, or lake at a lower elevation.
Acronyms and Abbreviations
CRO Central Regional Office (Department of Ecology)
DDD Dichloro-diphenyl-dichloroethane
DDE Dichloro-diphenyl-dichloroethylene
DDT Dichloro-diphenyl-trichloroethane
DOC Dissolved organic carbon
EAP Environmental Assessment Program (Department of Ecology)
Ecology Washington State Department of Ecology
EPA U.S. Environmental Protection Agency
FIFRA Federal Insecticide, Fungicide, and Rodenticide Act
GC/ECD Gas chromatography/electron capture detection
HRGC/MS High resolution gas chromatography/mass spectrometry
LVI Volume injection
N Number

Yakima Pesticides/PCBs TMDL: Vol 1, WQ Study Findings Page 326
NTU Nephelometric turbidity units
PCB Polychlorinated biphenyl
r.m. River mile
RSBOJC Roza-Sunnyside Board of Joint Control
SOP Standard operating procedure
SPE Solid phase extraction
SPMD Semipermeable membrane device
SWMP Surface Water Monitoring Program for Pesticides in Salmonid Bearing Streams
TMDL (See Glossary above)
TNVSS Total non-volatile suspended solids
TOC Total organic carbon
Trib Tributary
TSS (See Glossary above)
USBR U.S. Bureau of Reclamation
USGS U.S. Geological Survey
WDOH Washington State Department of Health
WRIA Water Resource Inventory Area
WSDA Washington State Department of Agriculture
WWTP Wastewater treatment plant