yahara wins - madsewer.org · • project proposal for legacy sediment ... proposal • $2,000‐to...
TRANSCRIPT

Yahara WINsStrategic Planning Workgroup
October 7, 2014

Welcome!• Approval of Minutes from June 26, 2014• Agenda repair
• RCPP moved up to Dane Co. Report• Administrative Asst. moved to budget
• Announcements

YaharaPrideFarms2014AgInnovationDays

YAHARA WINs ADAPTIVE MANAGEMENT PILOT REPORT
STRATEGIC PLANNING WORKGROUP MEETING
OCTOBER 7TH 2014
Dane County Land & Water Resources Department
Kyle MinksConservation Nutrient Specialist

INVENTORY
• Roughly 8,000 acres completed
• New nutrient management plan date will be evaluated this winter
• MRBI report submitted to NRCS

PRACTICE IMPLEMENTATION
Six Mile Yahara
Practices Completed In-ProgressScheduled
Fall Completed In-ProgressScheduled
Fall TotalsNMPs 5 7 12Waste storage closer 1 1Harvestable buffers 3 1 1 5Sediment basin 1 1Grassed waterway 1 6 7Manure storage 1 1 2Roof runoff management 2 2Critical area planting 1 1Roof over feedlot 1 1Leachate runoff system 1 1Diversion 1 1Grade stabilization structure 1 1
Totals 9 0 3 17 5 1 35

HARVESTABLE BUFFERS
• 13 acres of buffer• Treating 182 field
acres• 362 pounds of P
reduced per year• Cost of $34,615.73• Practice life of 5 years• $18.51 per pound of P
reduced

BUFFER 5/22/2014

BUFFER 6/16/2014

BUFFER 9/9/2014

CONTINUING 2014 EFFORTS
• P reductions from 2008 to 2012 for all Reaches
• Mapping and quantifying 2014 practices
• Updated cost model
• RFP for NCS at Middleton
• Project proposal for legacy sediment removal
• NRCS-RCPP

RCPP
• Proposal submitted Oct 2nd
• 5 Year project
• NRCS request for $1,740,000
• Partners contributing $4,758,000
• Total = 6,498,000
• Objectives• Practice implementation
• Innovative practices
• Comprehensive monitoring
• Quantify reductions
• Implementation plan
• Outreach & education

2015 COUNTY BUDGET
• $750,000 for conservation practices
• $1 million for urban practices
• $150,000 for 2 new staff• Funding from MMSD
• $60,000 for EPA watershed plan• Aid in developing
implementation plan• Funding from SCF
• $55,000 to pilot legacy sediment removal in Six Mile
• $500,000 for manure storage
• Final funding for NCS at Middleton
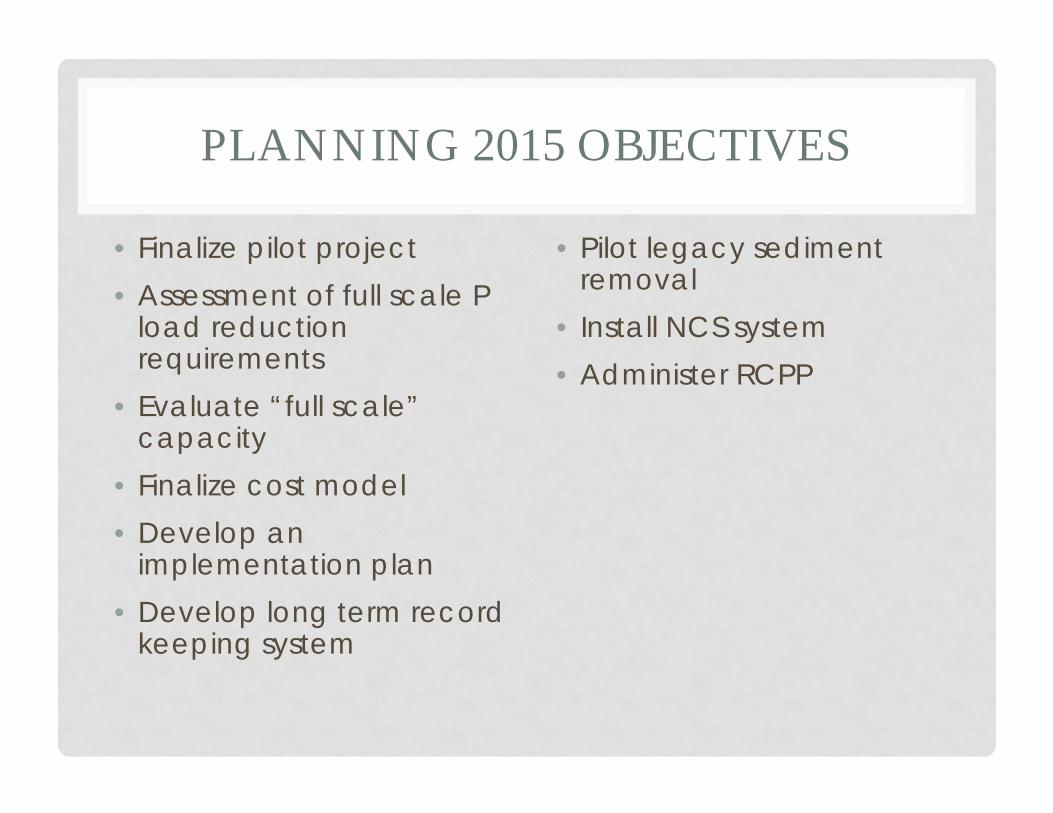
PLANNING 2015 OBJECTIVES
• Finalize pilot project• Assessment of full scale P
load reduction requirements
• Evaluate “full scale” capacity
• Finalize cost model• Develop an
implementation plan• Develop long term record
keeping system
• Pilot legacy sediment removal
• Install NCS system• Administer RCPP

QUESTIONS?

LeafManagementProjectUpdate• Bill Selbig ‐ USGS
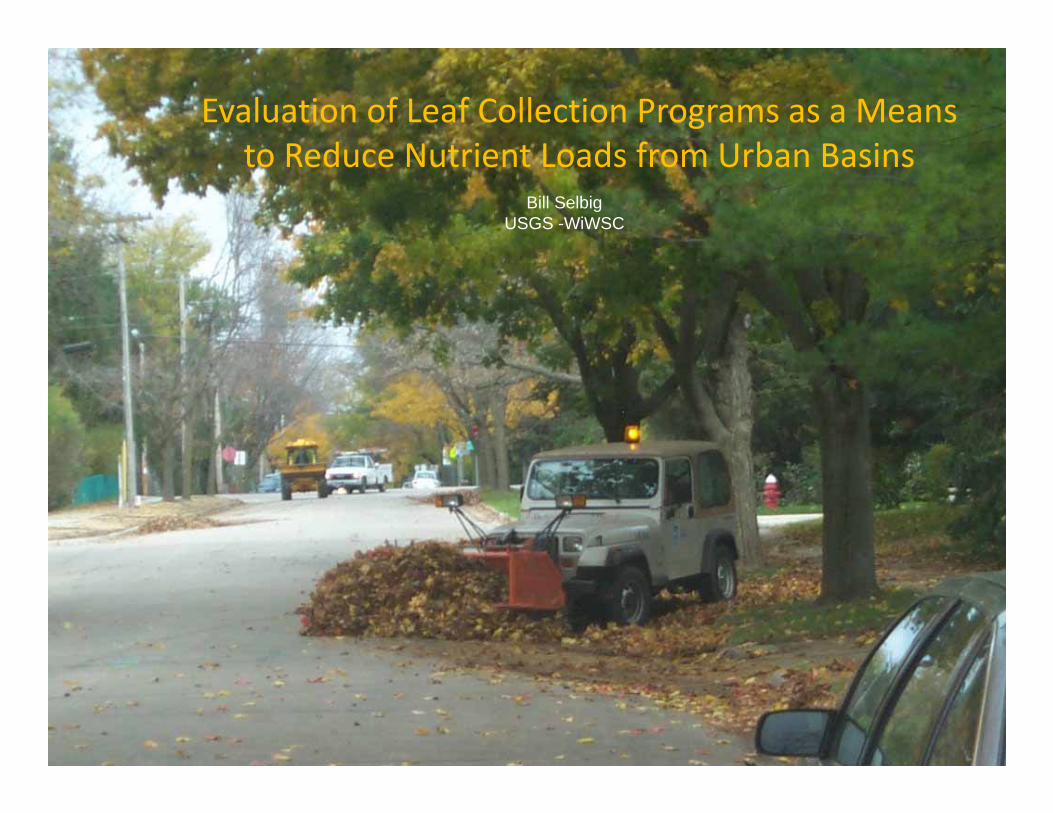
Evaluation of Leaf Collection Programs as a Means to Reduce Nutrient Loads from Urban Basins
Bill SelbigUSGS -WiWSC
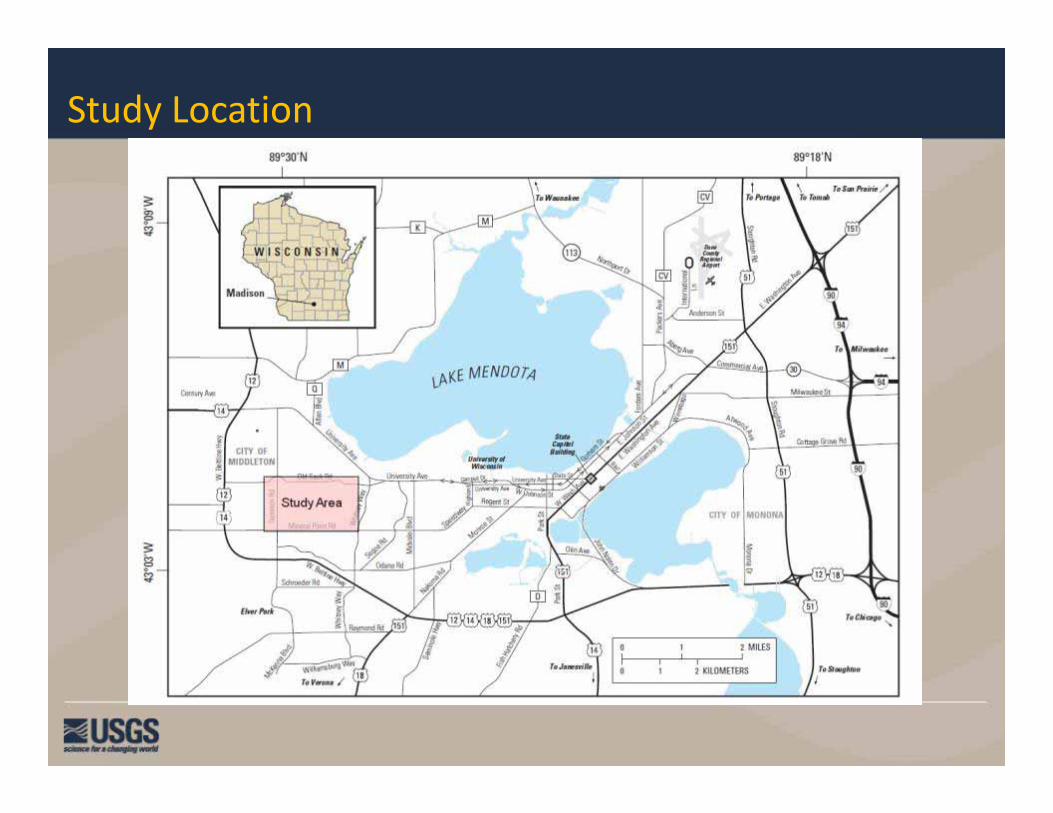
Study Location
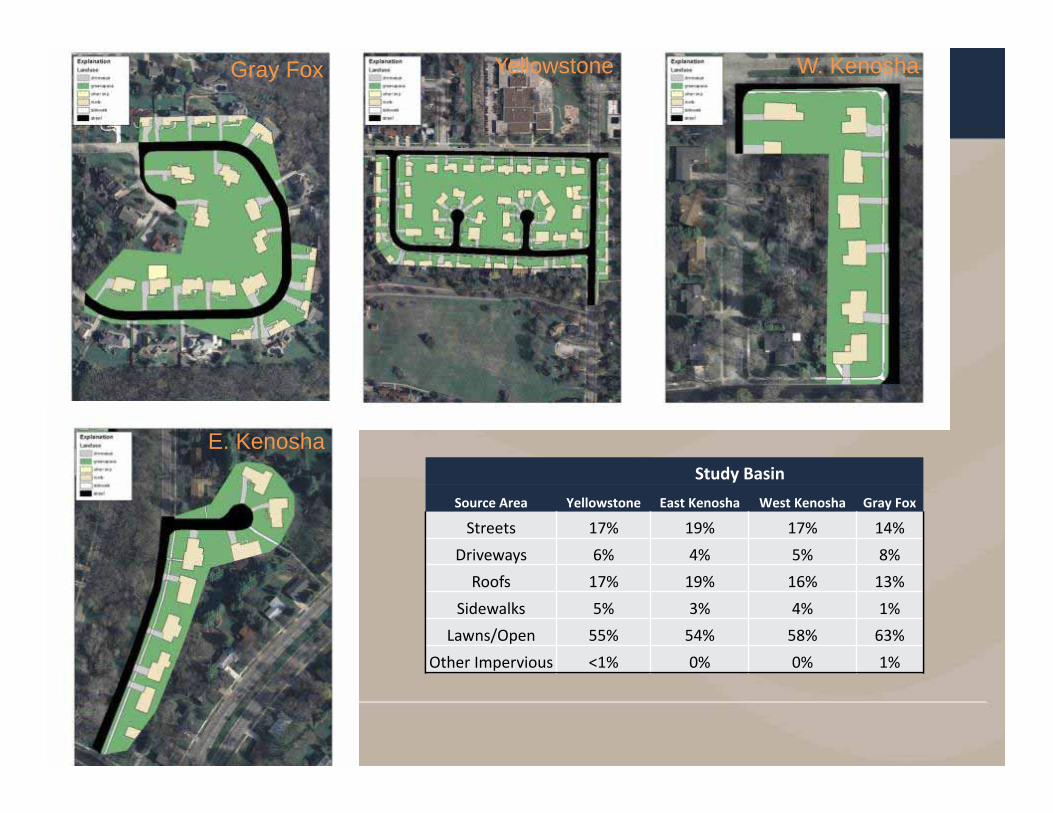
Study BasinSource Area Yellowstone East Kenosha West Kenosha Gray Fox
Streets 17% 19% 17% 14%Driveways 6% 4% 5% 8%Roofs 17% 19% 16% 13%
Sidewalks 5% 3% 4% 1%Lawns/Open 55% 54% 58% 63%
Other Impervious <1% 0% 0% 1%
Gray Fox Yellowstone W. Kenosha
E. Kenosha
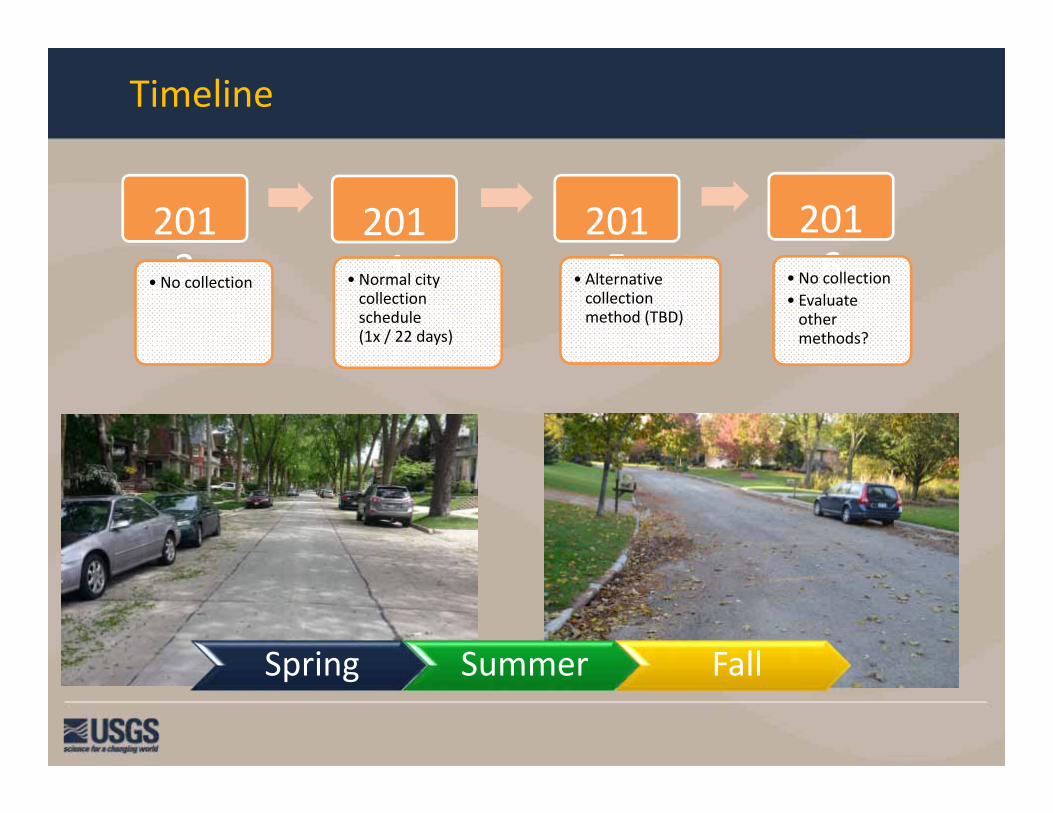
Timeline
2013•No collection
2014•Normal city
collection schedule (1x / 22 days)
2015•Alternative
collection method (TBD)
2016•No collection
• Evaluate other methods?
Spring Summer Fall

Basin Response During Calibration Phase (No Collection 2013)
0
1
2
3
4
5
6
7
8
Total Pho
spho
rus, in
mg/L
Total Phosphorus Concentration
Yellowstone
E. Kenosha
W. Kenosha
Gray Fox

Paired Basin Yield by Season‐ Dissolved P
0
0.05
0.1
0.15
0 0.1 0.2 0.3
E. Ken
osha
Yellowstone
Fall Spring
• Dissolved Phosphorus yields are consistently higher in the fall than in spring
0
0.02
0.04
0.06
0.08
0 0.1 0.2 0.3
W. K
enosha
Yellowstone
Fall Spring
0
0.01
0.02
0.03
0.04
0 0.1 0.2 0.3
Gray Fox
Yellowstone
Fall Spring
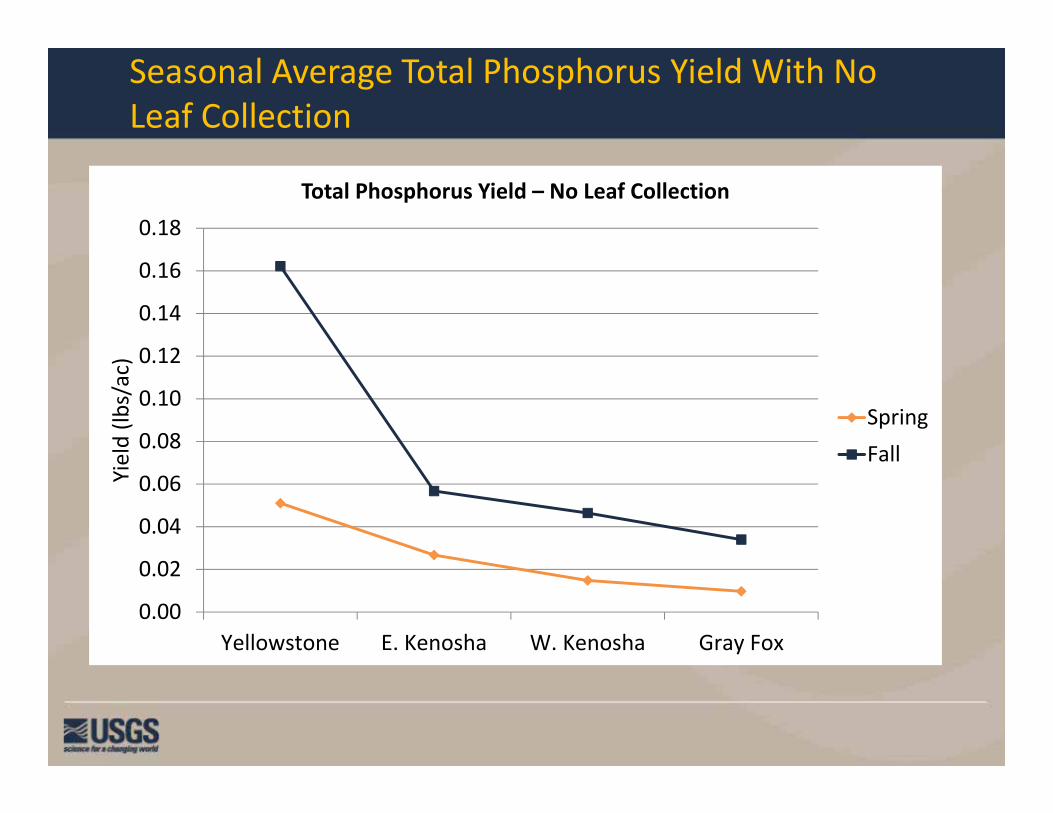
Seasonal Average Total Phosphorus Yield With No Leaf Collection
0.00
0.02
0.04
0.06
0.08
0.10
0.12
0.14
0.16
0.18
Yellowstone E. Kenosha W. Kenosha Gray Fox
Yield (lb
s/ac)
Total Phosphorus Yield – No Leaf Collection
SpringFall
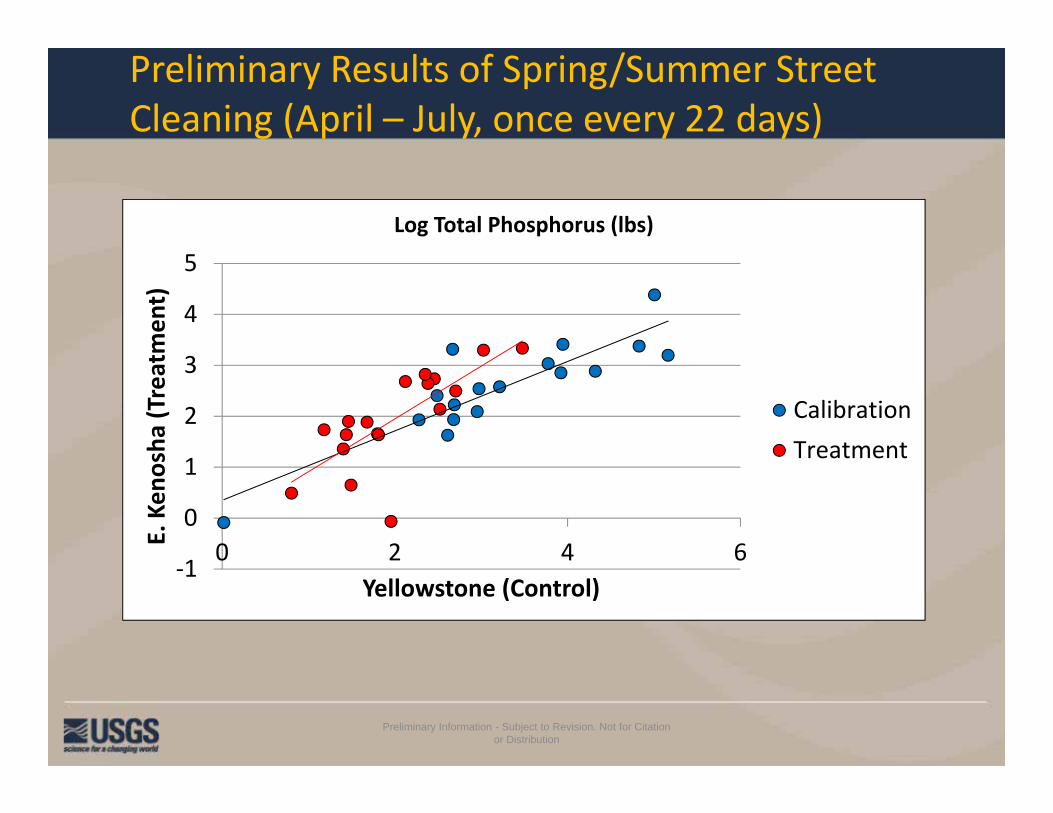
Preliminary Results of Spring/Summer Street Cleaning (April – July, once every 22 days)
Preliminary Information - Subject to Revision. Not for Citation or Distribution
‐1
0
1
2
3
4
5
0 2 4 6E. Ken
osha
(Treatmen
t)
Yellowstone (Control)
Log Total Phosphorus (lbs)
CalibrationTreatment

Preliminary Results of Spring/Summer Street Cleaning (April – July, once every 22 days)
Preliminary Information - Subject to Revision. Not for Citation or Distribution
‐1
0
1
2
3
4
5
6
0 2 4 6 8 10
E. Ken
osha
(Treatmen
t)
Yellowstone (Control)
Log Dissolved Phosphorus (lbs.)
CalibrationTreatment

Seasonal Differences with No Sweeping
0.001
0.01
0.1
1
Total P
(lbs/ac)
Spring
0.001
0.01
0.1
1
Total P
(lbs/ac)
Fall
Historic This Study Historic This Study
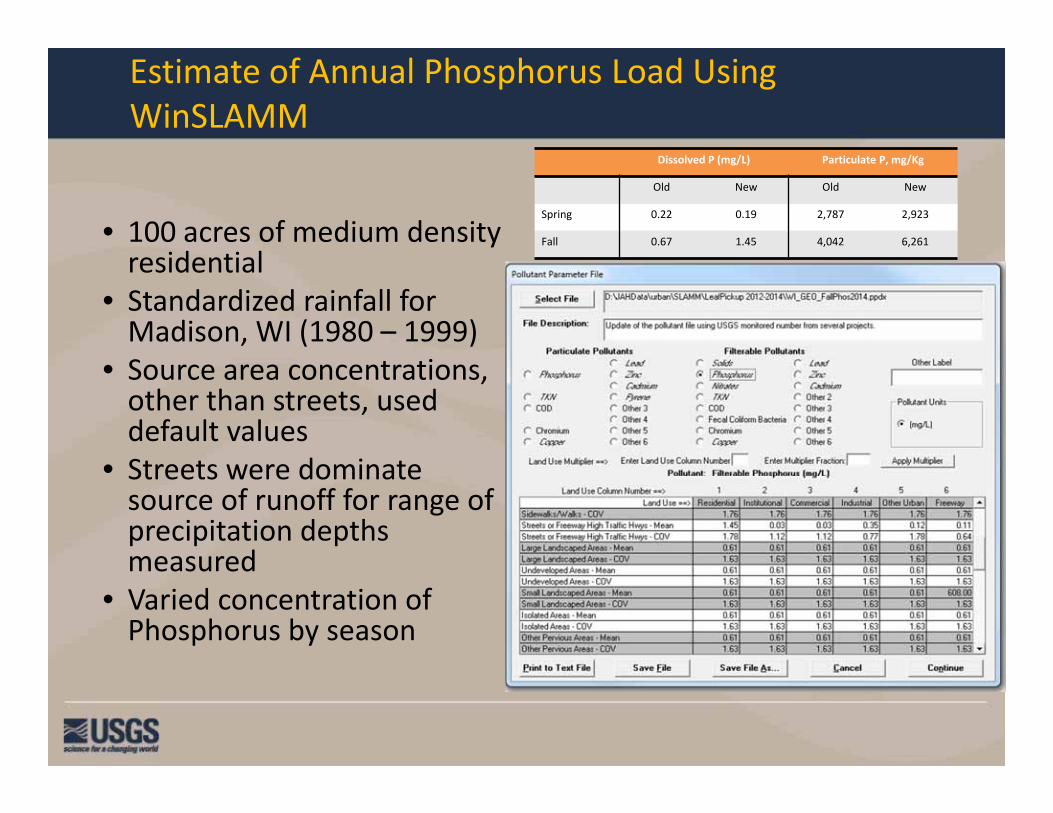
Dissolved P (mg/L) Particulate P, mg/Kg
Old New Old New
Spring 0.22 0.19 2,787 2,923
Fall 0.67 1.45 4,042 6,261
Estimate of Annual Phosphorus Load Using WinSLAMM
• 100 acres of medium density residential
• Standardized rainfall for Madison, WI (1980 – 1999)
• Source area concentrations, other than streets, used default values
• Streets were dominate source of runoff for range of precipitation depths measured
• Varied concentration of Phosphorus by season
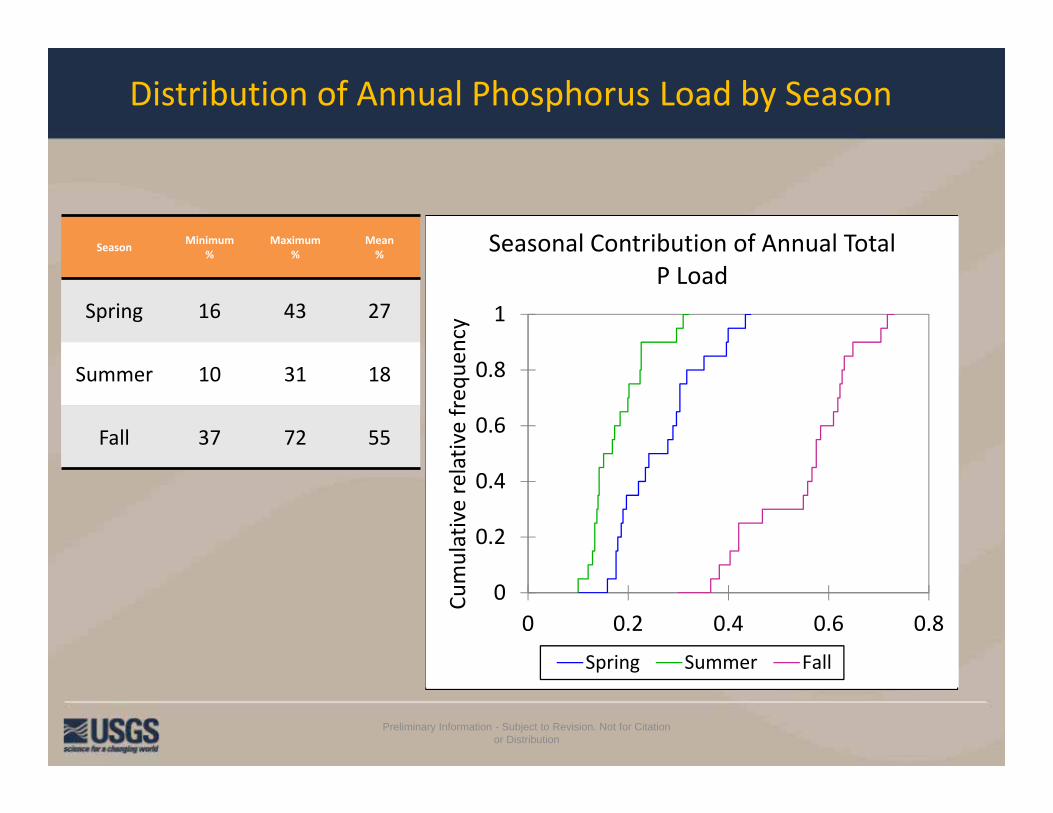
Distribution of Annual Phosphorus Load by Season
Season Minimum%
Maximum%
Mean%
Spring 16 43 27
Summer 10 31 18
Fall 37 72 55
0%
10%
20%
30%
40%
50%
60%
70%
80%
1980 1982 1984 1986 1988 1990 1992 1994 1996 1998
Seasonal Distribution of Total P Annual Load Simulated Over 20 Years
Spring
Fall
Preliminary Information - Subject to Revision. Not for Citation or Distribution
0
0.2
0.4
0.6
0.8
1
0 0.2 0.4 0.6 0.8
Cumulative relative freq
uency
Seasonal Contribution of Annual Total P Load
Spring Summer Fall
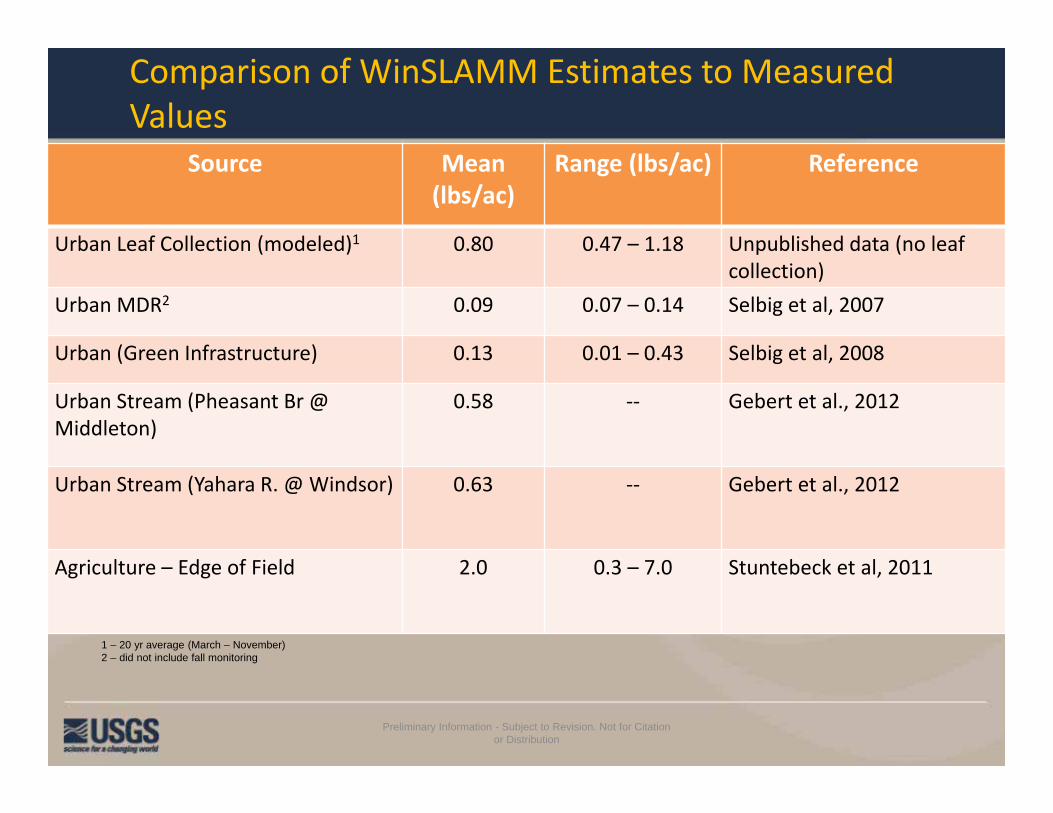
Comparison of WinSLAMM Estimates to Measured Values
Season Minimum%
Maximum%
Mean%
Spring 16 43 27
Summer 10 31 18
Fall 37 72 55
Source Mean (lbs/ac)
Range (lbs/ac) Reference
Urban Leaf Collection (modeled)1 0.80 0.47 – 1.18 Unpublished data (no leaf collection)
Urban MDR2 0.09 0.07 – 0.14 Selbig et al, 2007
Urban (Green Infrastructure) 0.13 0.01 – 0.43 Selbig et al, 2008
Urban Stream (Pheasant Br @ Middleton)
0.58 ‐‐ Gebert et al., 2012
Urban Stream (Yahara R. @ Windsor) 0.63 ‐‐ Gebert et al., 2012
Agriculture – Edge of Field 2.0 0.3 – 7.0 Stuntebeck et al, 2011
1 – 20 yr average (March – November)2 – did not include fall monitoring
Preliminary Information - Subject to Revision. Not for Citation or Distribution

Summary
• Early results indicate very high P concentrations and yields in fall when leaves are not collected; spring can also be high
• Majority of P is in the dissolved phase as orthophosphate in fall, particulate in spring
• Leaf collection/sweeper timing could be crucial. Need more basin‐specific information to measure response
• Model simulations indicate annual P load from urban areas may be higher than originally thought but lower than agricultural sources.

YaharaWINsBudget‐ RevenueandExpenses
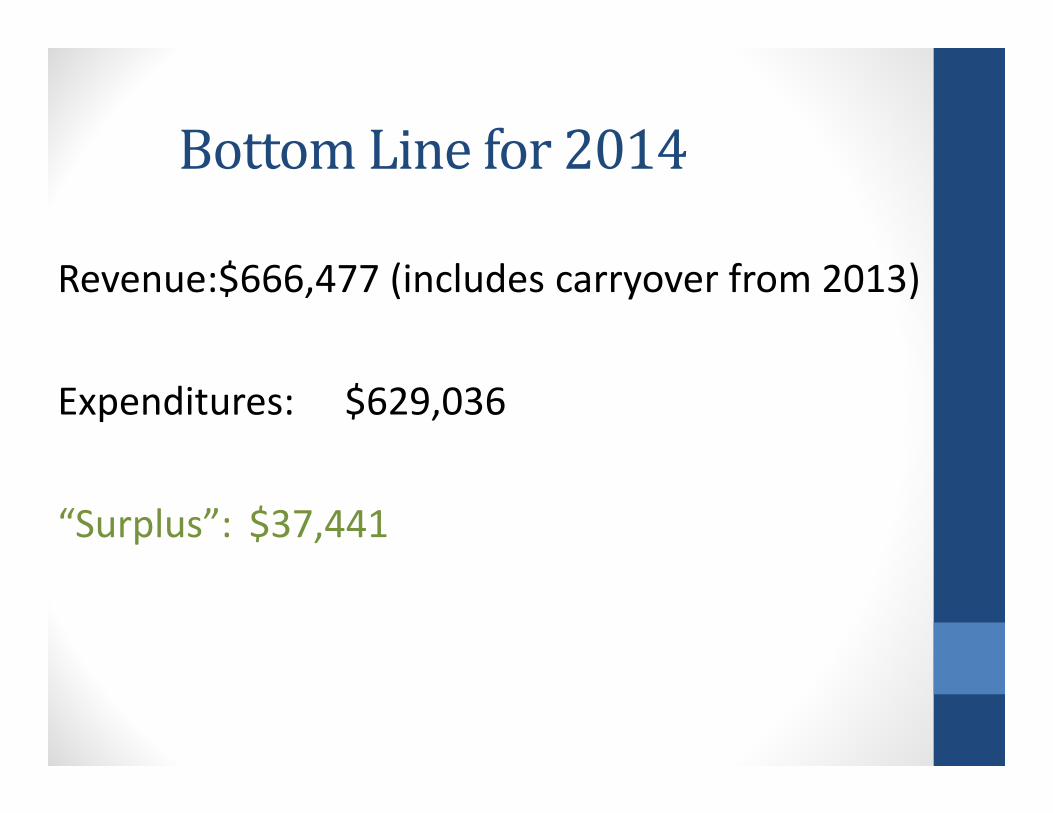
BottomLinefor2014
Revenue:$666,477 (includes carryover from 2013)
Expenditures: $629,036
“Surplus”: $37,441
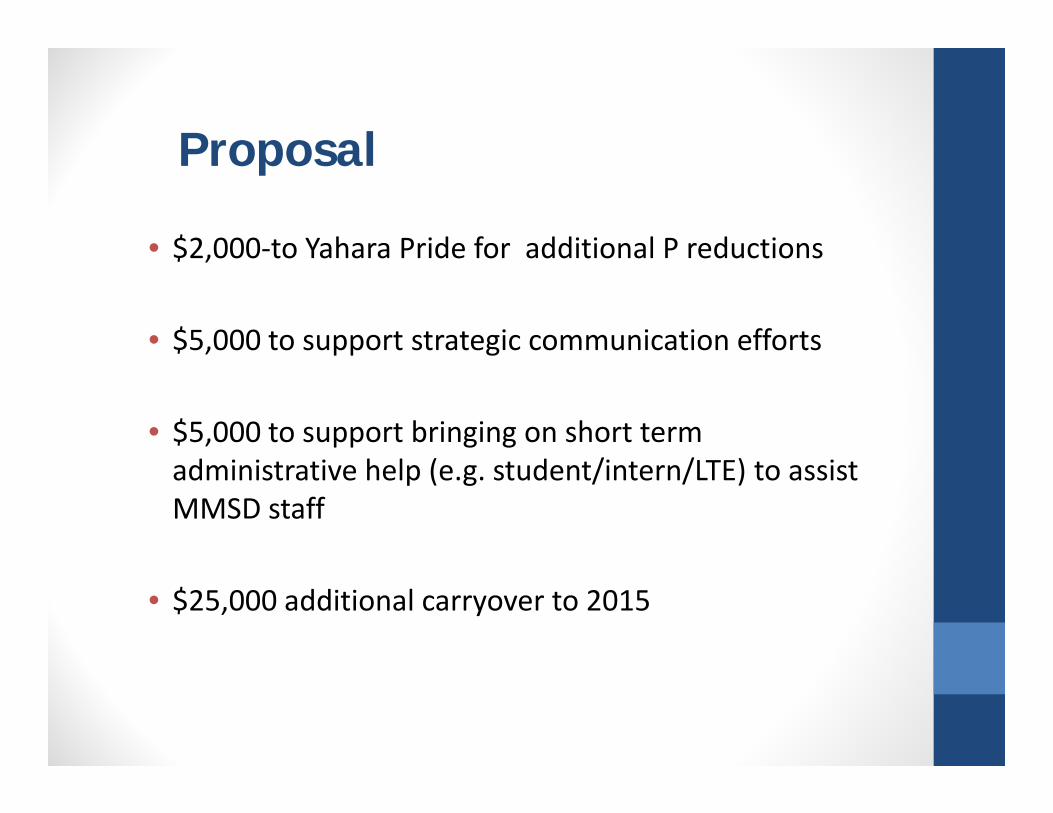
Proposal
• $2,000‐to Yahara Pride for additional P reductions
• $5,000 to support strategic communication efforts
• $5,000 to support bringing on short term administrative help (e.g. student/intern/LTE) to assist MMSD staff
• $25,000 additional carryover to 2015

Low‐CostPhosphorusReducingGrant• Variety of Projects funded in 2013 and 2014 for $83,325.
• Mix of projects• Variety of learning in addition to P
City of MadisonCity of Monona Yahara Pride Farms
Courtesy of J. Wipperfurth
Westport/Holy WisdomCourtesy of Friends of Prairie

MOU With DNR Adaptive management as a TMDL implementation strategy
Common understanding on key issues Adjustments to TMDL baseline Role of modeling Etc.
Certainty for District and partners
Consistency going forward
MOU is not a substitute for an adaptive management plan
Broad Areas Covered
Adaptive management plan‐how it will be used
Target reduction goals
Measuring load reductions
End of the adaptive management period

RevisedCostModel‐SomeDifferences(Initialvs.CurrentModel)
• Better dataoP reduction, practice cost, etc.
• Stream reach delineation
• Baseline load adjustment
• Ramp up period
• Water quality monitoring
• Inflation

FarmingVariesbyReach
0%10%20%30%40%50%60%70%80% Reach 63
1993 1994 19951996 1997 19981999 2000 20012002 2003 20042005 2006 20072010 2011 2012
0%10%20%30%40%50%60%70%80% Reach 69
1993 1994 19951996 1997 19981999 2000 20012002 2003 20042005 2006 20072010 2011 20122013

PracticesWillVaryByStreamReach

WorkInProgressExamples of Additional Considerations
• Efficiencies in delivery of services
• Independent practices by producers w/o cost share
• Practices that could become “standard practices”
• P reduction that occurs within urban service area

CommunicationStrategy
CoverCropPilotProject• Heidi Johnson, Crop and Soils Educator, Dane County – UW‐Extension

Yahara Pride Cover Crop Demonstration Plot
Heidi JohnsonDane County UWEX Crops and Soils Agent

Goals of YP Demonstration Plot
• Evaluate many different cover crop species and planting dates– After silage harvest and manure application
• Options after wheat will be different• Ideal cover crops
– Erosion protection, reduce phosphorus run‐off– Economically beneficial for farmers

Cover Crop Demo Plot
• Goal is to show options for planting after silage – Field for demo was in alfalfa
• Alfalfa killed on the first of September• Manure applied• Half of plots were no‐till, half of plots were strip tilled

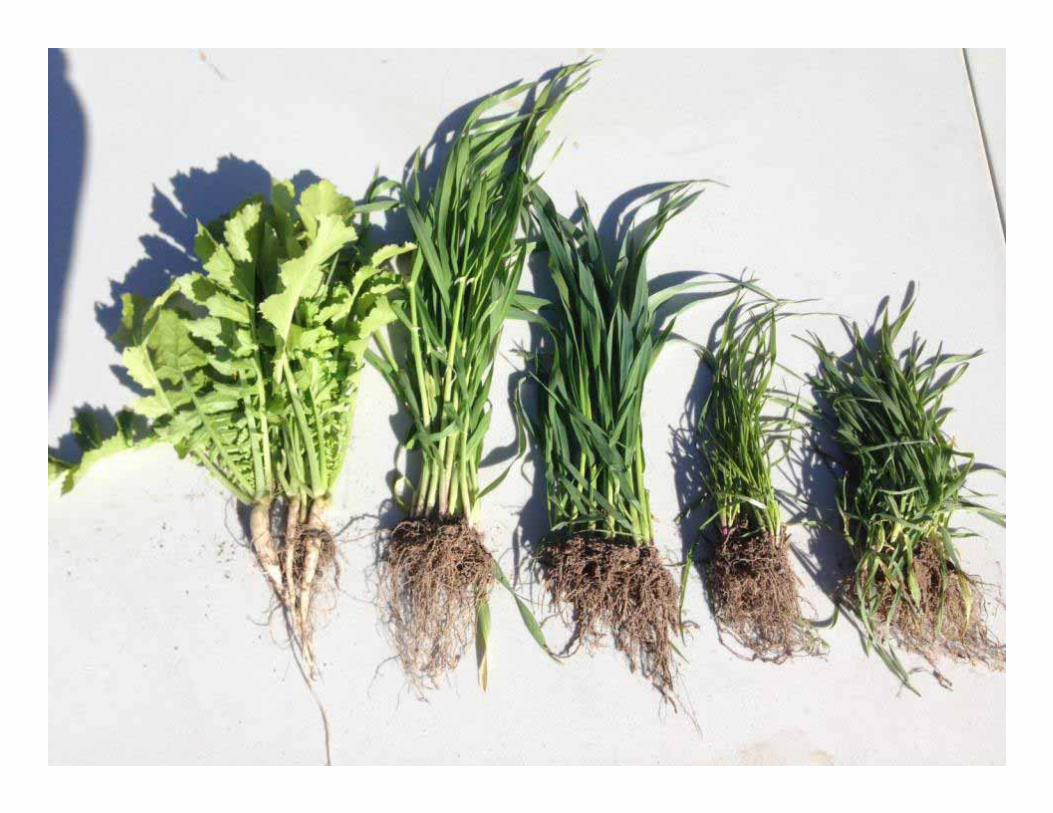
Cover crops• Winter Rye (100 lbs./acre)• Annual Ryegrass (var. King) (25 lbs./acre)• Oats (var. Badger) (60lbs./acre)• Barley (100lbs./acre)• Rye/Barley (60, 25 lbs./acre)• Tillage Radish™ and Rye (4, 100 lbs./acre)• Tillage Radish™ and Barley (4, 100 lbs./acre)• Tillage Radish™, Austrian Peas and Rye (4, 20 and 65 lbs./acre)

Planting dates
• September 9• September 23• September 30• October 10

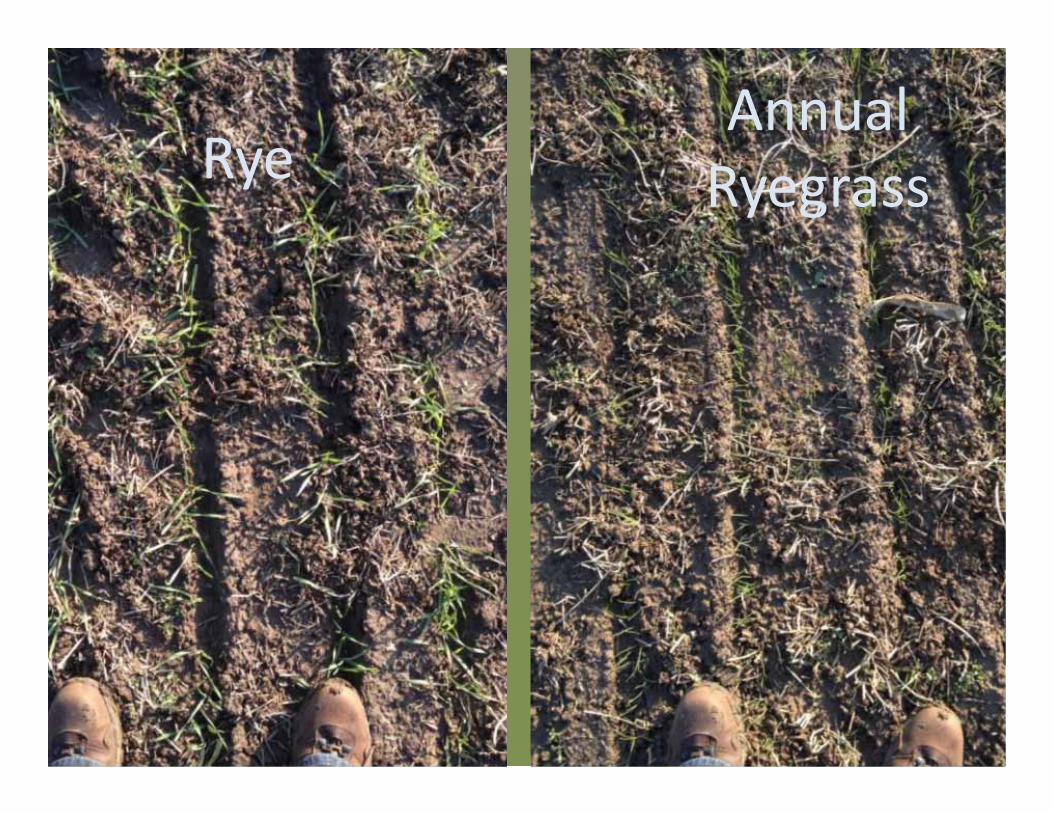
Comparing the Cover Crops• Pictures taken of plots • Measurements
– Visual estimation of ground cover in plots – fall – Actual measure of residue cover ‐ spring– Height of cover crops – forage stick– Biomass – 2 square foot samples– Soil samples to 1 ft. – analyzed for nitrates
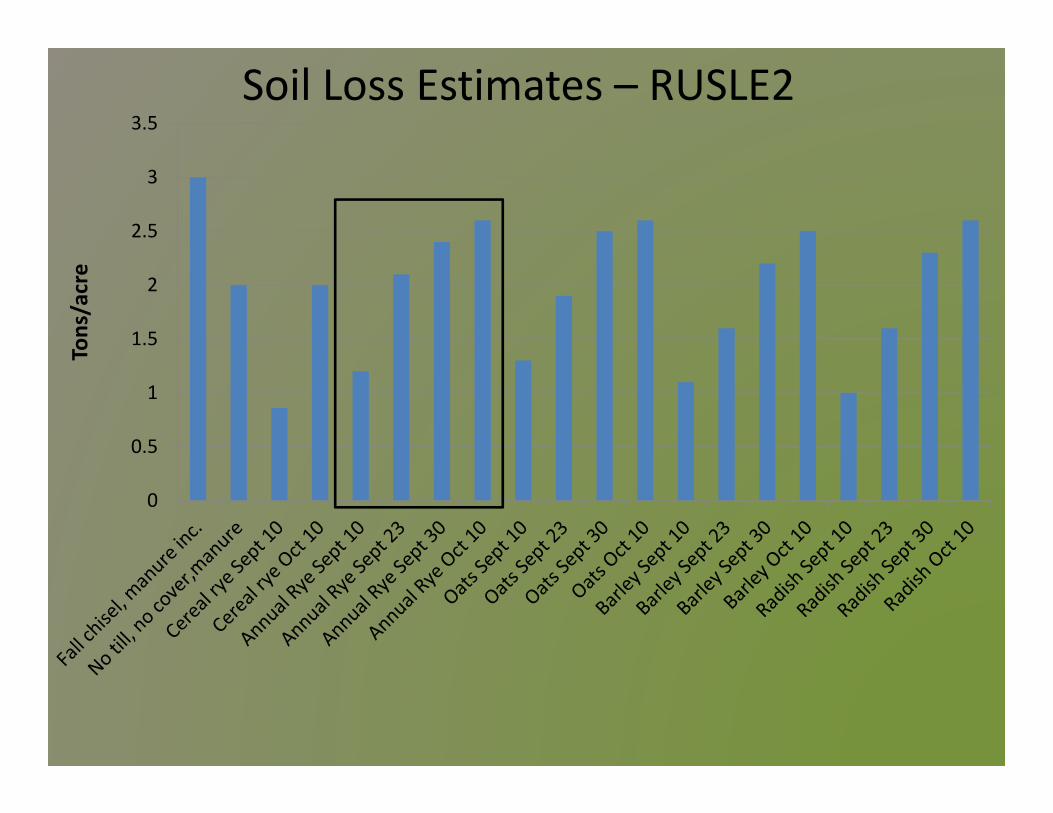
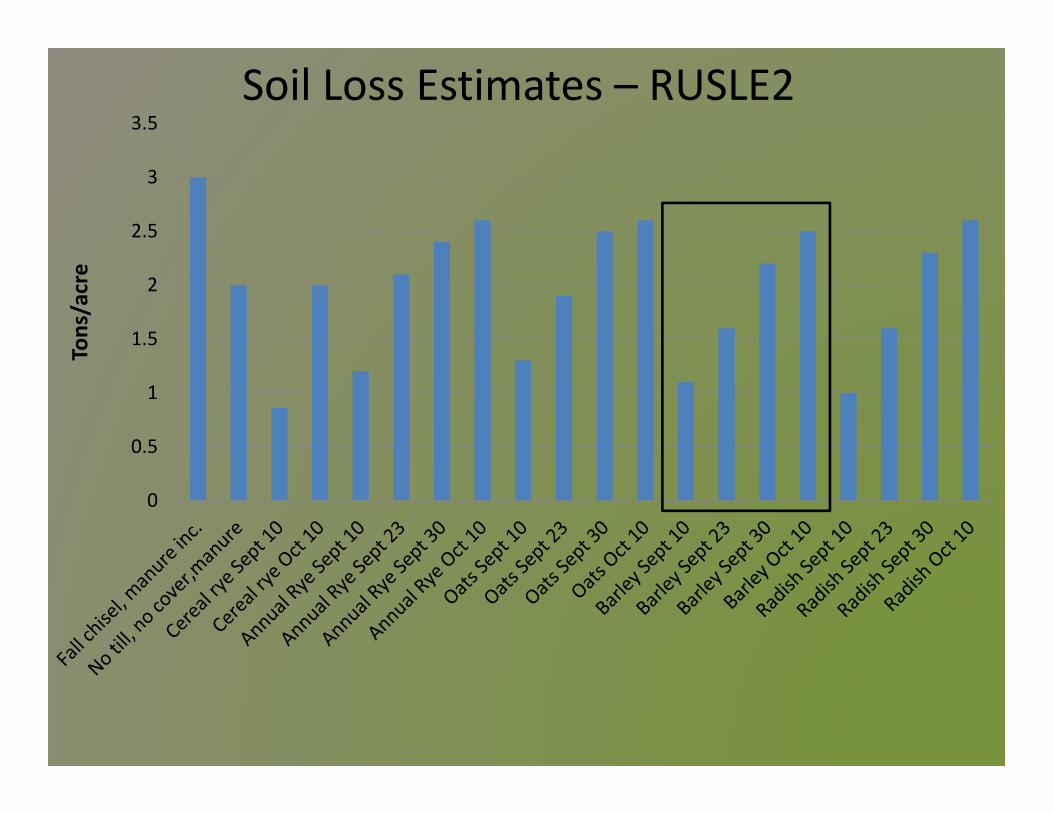
• Calculations – Soil loss estimates – using biomass– Phosphorus index– Seeds costs

0
10
20
30
40
50
60
70
80
90
0
0.2
0.4
0.6
0.8
1
1.2
1.4Tem
perature (F)Precipita
tion (in
ches)
Precipitation (inches)
Average Daily Temperatures

0
20
40
60
80
100
120
September 9 September 23 September 30 October 10
Ground cover (%)Ceral Rye Annual Ryegrass
Oats Barley
Radish and Barley Radish and Rye
Rye and Barley Radish, barley, pea

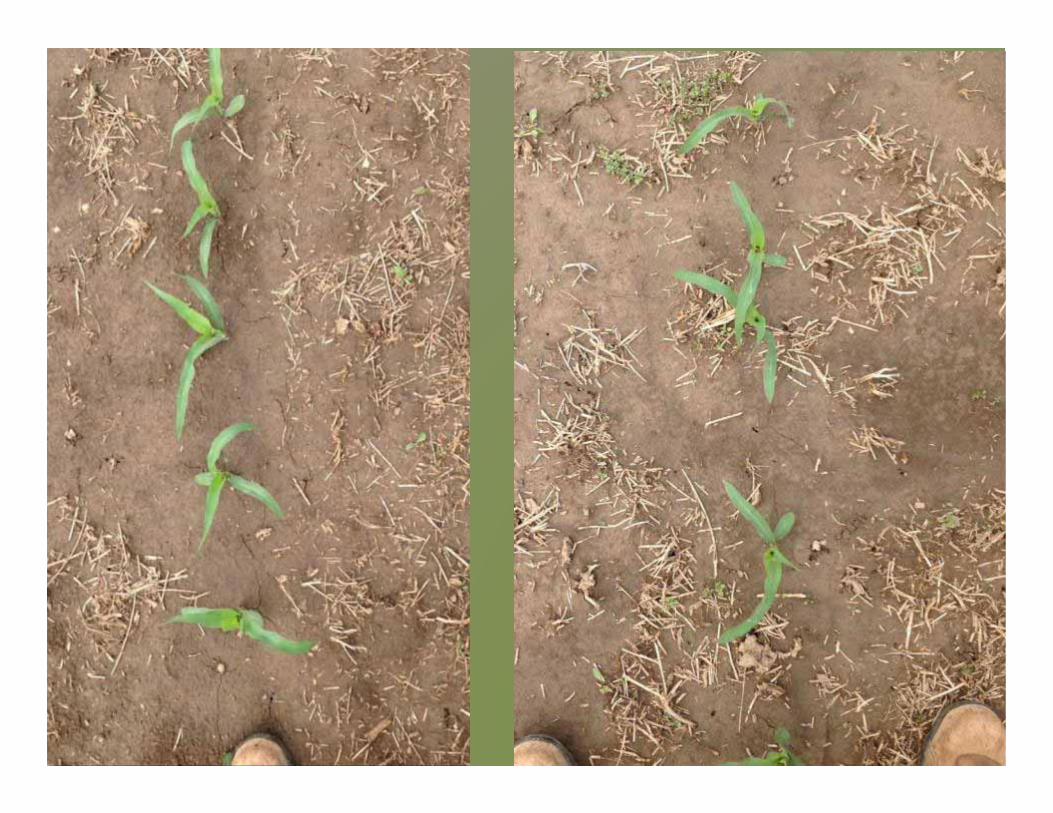
Pictures taken on November 10th

SEPTEMBER 10TH PLANTING

Rye Annual Ryegrass

SEPTEMBER 23RD PLANTING

Rye Annual Ryegrass

SEPTEMBER 30TH PLANTING

Rye Annual Ryegrass

OCTOBER 10TH PLANTING
Rye Annual Ryegrass

Pictures taken on May 28th

SEPTEMBER 10TH PLANTING

e Oats

OCTOBER 10TH PLANTING

Soil Loss Estimates – RUSLE2
0
0.5
1
1.5
2
2.5
3
3.5
Tons/acre

Soil Loss Estimates – RUSLE2
0
0.5
1
1.5
2
2.5
3
3.5
Tons/acre
Soil Loss Estimates – RUSLE2
0
0.5
1
1.5
2
2.5
3
3.5
Tons/acre

Soil Loss Estimates – RUSLE2
0
0.5
1
1.5
2
2.5
3
3.5
Tons/acre
Soil Loss Estimates – RUSLE2
0
0.5
1
1.5
2
2.5
3
3.5
Tons/acre

Soil Loss Estimates – RUSLE2
0
0.5
1
1.5
2
2.5
3
3.5
Tons/acre

Phosphorus Index
0
0.5
1
1.5
2
2.5
3
3.5
4
4.5Ph
osph
orus In
dex

Seed prices ($/acre)
0
10
20
30
40
50
60
Cereal Rye AnnualRyegrass
Oats Barley Radish andBarley
Radish andRye
Rye andBarley
Radish,barley and
pea
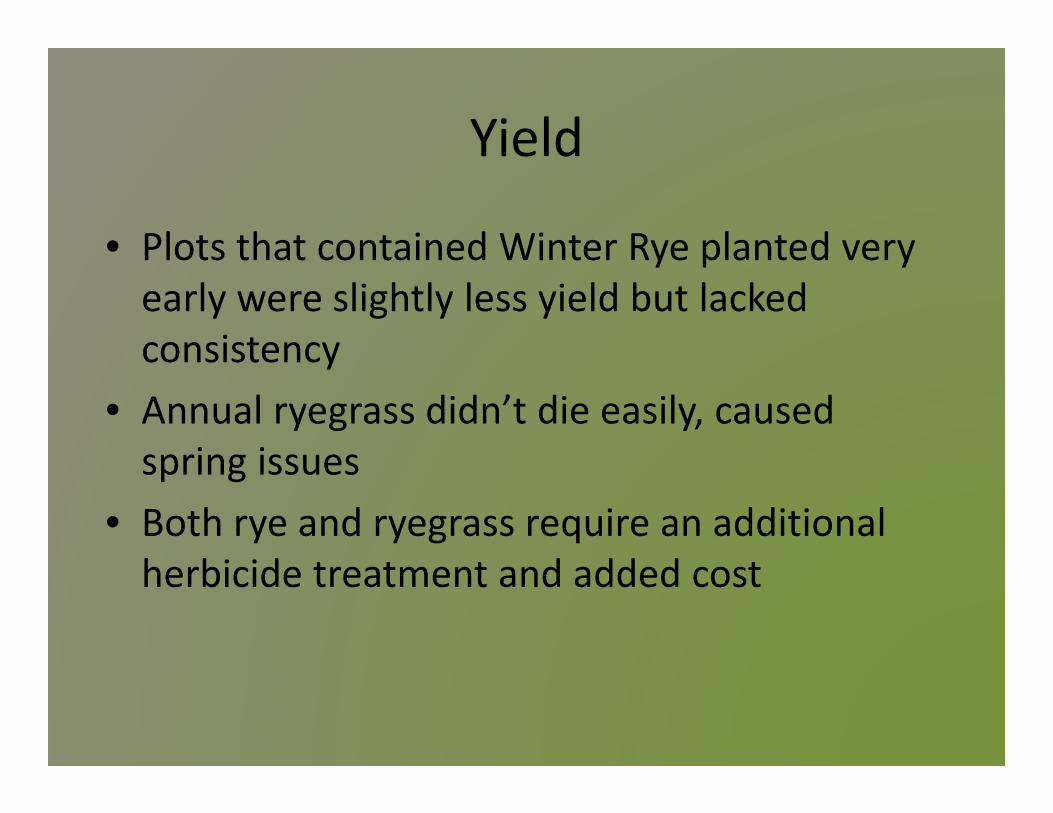
Yield
• Plots that contained Winter Rye planted very early were slightly less yield but lacked consistency
• Annual ryegrass didn’t die easily, caused spring issues
• Both rye and ryegrass require an additional herbicide treatment and added cost

The Bottom Line• If cover crops can go in very early – get good growth on winter killed cover crops
• Rye and wheat are the only late options –spring growth– Provide a spring forage
• Farmers needs to plan on spending extra time in the spring managing overwintered cover crops

The Future
• Continued this fall in the same field• Planted cover crops at different planting rates• Two planting dates• Silage again
AMPilotProject
• Bill Hafs, Director of Environmental Programs

NEW WaterUpdate on Silver Creek Pilot Project
Bill Hafs - NEW Water 10/2014
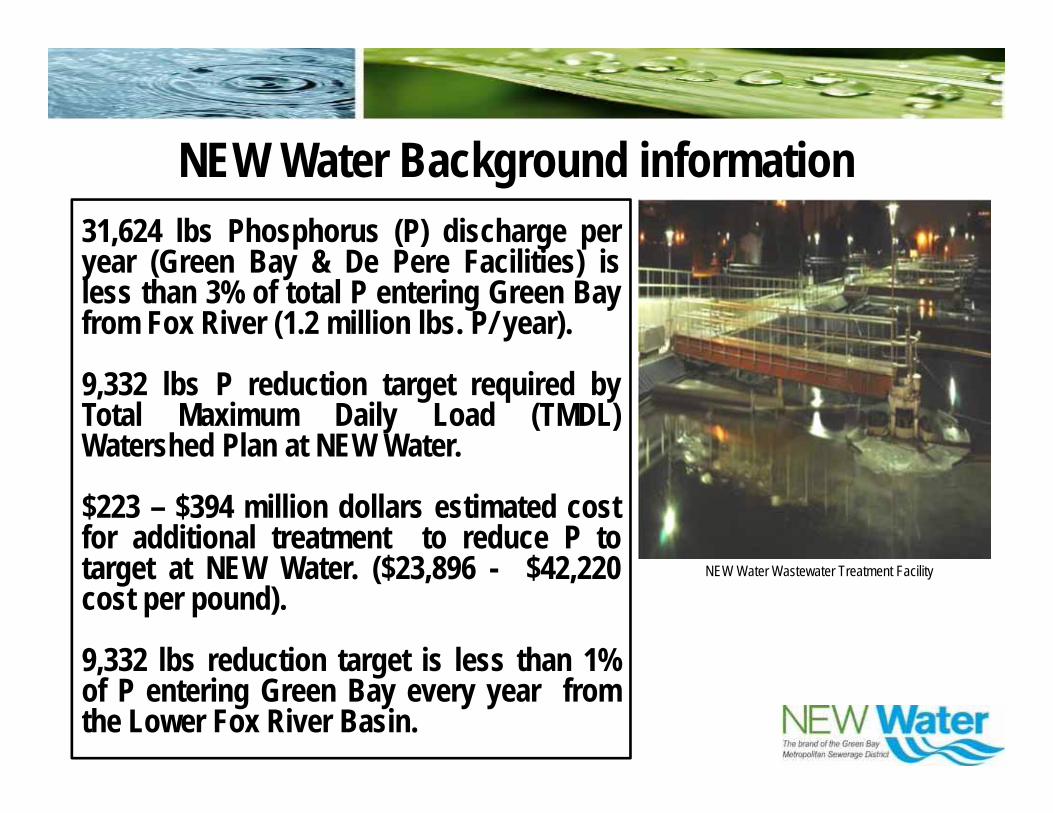
NEW Water Background information 31,624 lbs Phosphorus (P) discharge peryear (Green Bay & De Pere Facilities) isless than 3% of total P entering Green Bayfrom Fox River (1.2 million lbs. P/ year).
9,332 lbs P reduction target required byTotal Maximum Daily Load (TMDL)Watershed Plan at NEW Water.
$223 – $394 million dollars estimated costfor additional treatment to reduce P totarget at NEW Water. ($23,896 - $42,220cost per pound).
9,332 lbs reduction target is less than 1%of P entering Green Bay every year fromthe Lower Fox River Basin.
NEW Water Wastewater Treatment Facility

•Evaluate Adaptive Management on small scale.
• Is .075 mg/L in Silver Creek attainable?
•Agreement with Oneida Tribe.•Partnerships will be key.•Can stream be restored?•Evaluate phosphorus reduction in cost per pound.
Silver Creek Pilot ProjectStream restoration in 5 years

Adaptive Management ModelGoals
Plan and Prioritize
Implement
Monitor
Evaluate
Adjust

Revised Adaptive Management Model‐ Silver Creek
82
Goals.075 mg/L Phosphorus
WQ Monitorand Model
Plan and Prioritize
ImplementWQ Monitorand Model
Evaluate
Adjust

Silver Creek Pilot Project Silver Creek Watershed (LF05-8) a sub-watershed of the Lower Duck Creek (HUC12 040302040106
Watershed Area 4799.8 acres (7.50 mi2)
MS4 346 acres (7.2% of watershed)Land cover2012 Cropland Data Layer USDA NRCS
Agricultural 2296.4 acres (47.8%)Forest 585.1 acres (12.2%)Grassland 12.3 acres (0.3%)Pasture 1065 acres (22.2%)Urban 503.9 acres (10.5%)Water 64.5 acres (1.3%)Wetlands 272.6 acres (5.7%)
Stream Length 14.93 milesTMDL Phosphorus Baseline Load 3391 lbs. (0.71 lbs. per acre)

Mouth of East River at the Fox River
Priority Sub Watersheds
Map of Lower Fox River Basin

Silver Creek Pilot Project 2013 -2018 • Stream Monitoring USGS,
UWGB, NEW Water.• Steering Committee.• Inventory of watershed.• Implementation. • Project evaluation.


Silver Creek Pilot Project• How much land will need to be taken out of
production?
• What is economic cost to Agriculture?
• Sustainable permanent decisions.
• Spend the least amount of dollars to accomplish the greatest water quality. Benefit our rate payers , community water quality.
• Build watershed partnerships: Industry, AG, Storm water, Wastewater, Community leaders.

Lower Fox River Challenges
15 Sub-watersheds in LFR basin.
20 Permitted Industrial WWTFs.
14 Permitted Municipal WWTFs.
42 units of government.
15 WPDES permitted CAFOs.
TMDL phosphorus reduction goal = 59%.
TMDL TSS reduction goal = 55%.
Reduced Cropland & Increased Livestock density.
NR151 and NR243 were developed before Water Quality Standards.

Thank You – Questions?Bill Hafs |Director of Environmental ProgramsGreen Bay Metropolitan Sewerage District
T: (920) 438-1040E: [email protected]
www.newwater.us

FinalItems• Future Meetings • Future Agenda Items
• Oconomowoc Adaptive Mgt Pilot Project• Alum Treatment
• Other Business• Adjournment