xx. implications of sea basing a. assumptions
TRANSCRIPT

XX-1
XX. IMPLICATIONS OF SEA BASING
A. ASSUMPTIONS
The results of any major study are only as good as the assumptions – the better the
assumptions, the better the results. We carefully selected several key assumptions that
shape the Conceptual architecture for future Sea Base operations. The key ExWar project
assumptions are as follows:
• MEB operations occur in the 2015-2020 timeframe.
• MEB and Sea Base operations are conducted up to 200 nautical miles
inland with a standoff distance from land ranging from 25-250 NM
offshore, but not to exceed 275 NM from Sea Base to Objective.
• Current USN and USMC legacy platforms projected will remain
operational through 2015 - 2020 and will not retire early.
• All current USN and USMC acquisitions of new aircraft and land
vehicles will be available in 2015-2020 and will be delivered on schedule.
• A MEB size MAGTF composition and sustainment requirements remain
relatively constant between the present and 2015 - 2020.
• A MEB size Expeditionary Force will not conduct a forcible entry,
without the support of at least one CSG provides support.
• The Sea Base will be formed by merging at a minimum of two MEUs
sized ARG, their escorts, logistics and prepositioned equipment support
ships, and associated CSG.
• Future ARGs deploy as ESGs with surface combatant escorts as
envisioned in the Chief of Naval Operation’s (CNO) Sea Power 21 (Clark,
2002).
B. INTRODUCTION
The USN and the USMC together are transforming the current force structure
towards a Sea Basing concept that is highly maneuverable, flexible, and less vulnerable.
XX-2
The Planned architecture for future ExWar does not provide a robust enough capability to
surge and sustain a MEB size Landing Force of approximately 6,800 personnel ashore at
225 to 275 NM from the Sea Base to the Objective for an indefinite period of time. With
a major gap identified in the Planned architecture, we were tasked to examine “new
seabasing options for logistics, command facilities, and support of sustain operations
ashore” (McGinn, 2002). The Conceptual architecture for ExWar we designed is capable
and robust enough to strike and sustain deep from the sea to deep inland. As stated in the
Naval Transformation Roadmap, the future Navy and Marine Corps Team is fostering a
culture that is transforming itself to “project responsive force worldwide with the
capability to fight and win, operate continuously from an expanded and secure maneuver
area—the sea, and minimize vulnerabilities tied to oversea land support.” (Department of
the Navy, 2002, 4). Our Conceptual architecture, incorporating a Sea Base concept,
provides a possible framework to meet this transformational revolution.
Sea Basing is the catalyst that enhances the Navy and Marine Corps’ capability to
carry out OMFTS, STOM, EMW, and other ExWar concepts.
OMFTS is the maneuver of expeditionary forces at the operational level. “The
heart of Operational Maneuver from the Sea is the maneuver of naval forces at the
operational level, a bold bid for victory that aims at exploiting a significant enemy
weakness in order to deal a decisive blow” (Headquarters U.S. Marine Corps, 1996, V-9).
OMFTS uses the sea as a maneuver space and emphasizes rapid movement, not merely
from ship to shore, but from ship to objectives that may be miles away from blue water
and from inland positions back to offshore vessels. Additionally, operational maneuver is
focus on attacking the enemy’s center of gravity – something vital to the enemy’s ability
to carry out operations (Headquarters U.S. Marine Corps 1996, V-9).
STOM is a tactical concept that supports OMFTS. STOM permits units to move
from shipboard platforms that are positioned over the horizon to objectives lying far
inland and back. “True Ship-to-Objective Maneuver is not aimed at seizing a beach, but
at thrusting combat units ashore in their fighting formations, to a decisive place, and in
sufficient strength to ensure mission accomplishment” (MCCDC 1997, II-7). An
essential ingredient to rapid and successful STOM operations is a highly capable Sea

XX-3
Base. The Sea Base must have the capability to move combat forces, equipment, and
supplies ashore rapidly so they can engage and conquer the enemy in an expedient
fashion.
“EMW, moves us down the path outlined in Marine Corps Strategy 21, and
provides the foundation for the way the Marine Corps will conduct operations the
complex environment of this new century.” EMW is much broader than OMFTS. “It is
the union of the Marine Corps’ core competencies; maneuver warfare philosophy;
expeditionary heritage; and the concepts by which we organize, deploy, and employ
forces” (Headquarters U.S. Marine Corps, 10 November, 2001).
C. THE NEED -WHY SEABASING
“Seventy percent of the world’s population lives within 200 miles of a coast, and
80% of the world’s capitals are located within 300 miles of a coast. This urbanization of
the world’s littoral regions mean that operations from the sea provide the nation with an
enduring means to influence and shape the evolving international environment.” (Krulak,
1997). With a high probability of engaging enemy forces within 200 to 300 miles of a
coast, the United States must have a global reach capability to protect our national
interests, as well as our allies’ and friends’ national interests. Sea Basing supports that
global reach.
As the United States changes from a two major war strategy to a “4-2-1” strategy,
a transformation in the architecture has to match that strategy. The new “4-2-1” strategy
is “deterrence in four places at one time, quickly defeat an adversary in two places and
overwhelmingly and decisively defeat and have regime change in one other place”
(Clark, October 2002). Sea Basing is the transformation architecture that supports the “4-
2-1” strategy at the strategic, operational, and tactical level.
The United States’ military presence overseas has significantly decreased over the
past 20 years. Examples of this decrease in forward presence are the closure of bases in
the Philippines and Panama, as well as the reduction of troops stationed in Europe and
Southeast Asia. This reduction abroad decreases responsiveness and deterrence. Sea
Basing allows us to maintain a continuous presence that decreases deployment times and
deters adversarial threats against the United States, its allies, and friends. If deterrence
XX-4
fails, then Sea Basing gives Joint Force Commanders the capability to respond quickly
and decisively.
Forward deployed troops stationed on land are susceptible and vulnerable to
terrorist attacks. In recent years, the United States has experienced several such attacks.
1. USS Cole (DDG 67)
On October 12, 2000, terrorists exploded a small boat alongside the USS Cole
while the ship was refueling in Aden, Yemen. As a result of the powerful explosion, 17
sailors died as well as hundreds of millions of dollars in damage to the ship.
2. Khobar Towers
On June 25, 1996, terrorists exploded a massive improvised explosive truck bomb
outside the Khobar Towers housing barracks, in Dhahran, Saudi Arabia. The terrorist act
killed nineteen American service members, and injured hundreds of others.
3. Beirut
On October 23, 1983 terrorists exploded a massive truck bomb in the Marine
barracks in Beirut, Lebanon, killing 220 Marines and 21 other U. S. Service members.
A Sea Base, although not free from risk of attack, is less vulnerable than
stationary facilities ashore or assets in close proximity to shore. A moving target is much
harder to hit than a stationary target. A Sea Base can station itself at distances greater
than 25 NM from the coast of a hostile country and use the sea as a maneuvering space to
gain a tactical advantage over the enemy. For troops stationed ashore the risk of being
attacked by WMD is a possibility. The Sea Base offers a safer place for deployed troops.
As the United States shifts from a threat-based strategy to a capabilities-based
strategy, NPS’ Conceptual Sea Base design provides two desired transformational
capabilities as stated in the Naval Transformation Roadmap. First, the Sea Base allows
accelerated deployment and employment times that decrease from months to days.
Second, the Sea Base presents the Joint Force Commander the ability to extend the battle

XX-5
space beyond the enemy’s reach, as well as move critical components from the shore to a
secure operating area – the sea (Department of the Navy, 2002, 24 - 25).
As anti-American sentiments increase outside the borders of the United States, the
chance of regional conflict increases as well. The Sea Base allows a forward presence
without the difficulty of gaining sovereign rights to access friendly ports or airfields. Sea
Basing assures access without dependence.
The MPS and the LHA Ships are nearing the end of their service lives. Without
the replacement of these lift assets, the Marine Corps will not have its recommended lift
capability. NPS’ Sea Base will provide the necessary lift capability.
In conclusion, Sea Basing is a transformational concept that will enhance the
United States’ ability to maintain global military dominance and help carry out the
national and military strategy.
D. WHAT IS SEA BASING
Sea Basing, as stated in the Naval Transformation Roadmap, is a transformational
concept that will revolutionize the projection, protection, and sustainment of sovereign
warfighting capabilities around the world for the United States Navy and Marine Corp.
Sea Basing capitalizes on the inherent mobility, security, and flexibility of naval forces to
overcome the emerging military and political limitations to overseas access. This
capability will be conducted efficiently and aims to reduce the need to build up logistical
stockpiles ashore that may burden or endanger allies and drastically complicate force-
protection requirements. It will also reduce the early demands on the national strategic
lift capability. Sea Basing will enable the Navy to conduct sustained, persistent combat
operations from the sea and when fully implemented will provide a viable option to
totally eliminate the limitations imposed by reliance on overseas shore-based support.
E. CONCEPT OF OPERATION
Sea Basing requires accomplishing at sea, often under severe weather and sea-
state conditions, many of the functions traditionally undertaken by logistics bases
XX-6
established on shore. The challenge is to achieve organizational design, shipboard
distribution operations, integration of sustainment efforts and strategic resupply
efficiently, effectively and safely from the sea.
By providing sustainment to warfighters ashore directly over-the-horizon from the
safer sanctuary of the sea base, OMFTS and STOM can become a reality. The Sea Base
is mobile and can maneuver as part of the Expeditionary Task Force to support sustained
operations ashore. By employing direct replenishment from ship to the objectives, the
“Iron Mountain” and operational pause can be reduced or eliminated. In addition, there is
no need to allocate resources to protect this “Iron Mountain,” though the force protection
need is now transferred to ensuring safe transit between the Sea Base and the objectives.
When operating under the umbrella of a battle group, the Sea Base will allow positioning
of networked joint forces for immediate employment ashore. With future networked
communications capabilities, the Sea Base will further enhance maneuver ashore by
reducing the need to project major command and control elements, heavy fire support
systems, or logistics stockpile necessary under the current mode of expeditionary
operations.
F. ANALYSIS OF SEA BASE SUSTAINMENT OF FORCES ASHORE USING EXTENDTM
This section presents an analysis of the Sea Base as a system for sustaining the
forces ashore using the EXTENDTM models; specifically the model for the ExWar
Planned architecture. The Planned Architecture was chosen in this excursion study
because it offers us more readily available materials for cross referencing. This analysis
will describe how the Sea Base is affected by varying its distance from the Objective and
how the replenishment system is affected by using different proportions of air and sea
transportation means. The effectiveness of the system is measured using several MOPs
namely TBU to 80% of Forces at the Objective and MSE of Supply at both the Sea Base
and the Objective. For detailed description on the workings of the model and the MOP,
please refer to Chapter XII.
The main assumption used for modeling the Sea Base is that the replenishment to
the Sea Base is a fixed quantity of resources so as to determine when and where areas of
XX-7
concerns arise. This assumption creates a baseline for comparison when the factors
affecting the Sea Base are varied. In the models used for the Sea Base analysis, the
environmental factors have been fixed as good weather, high attrition, no mine threat and
high consumption rate at the Objective. For detailed explanations of these factors, please
refer to Chapter XII.
1. Distance of Sea Base Relative to Objective
In this analysis, four different distances are compared; 58 NM, 108 NM, 158 NM,
208 NM. Fifty-eight NM is the distance of the Sea Base from the Objective that was
used in the scenario during the ExWar architectures analysis. Increments of 50 NM are
used here to observe the effects varying distances have on the system as a whole. Please
refer to Chapter V for details on the scenario used in this model.
a. Time to Build Up (TBU) 80% of Forces at the Objective
This MOP will indicate the amount of time that the forces are being built up at the
Objective. It will specifically measure the time that it takes the forces to reach 80 percent
of the planned level at the Objective. This desired level is calculated based on a tabulated
Combat Power Index (Chapter XIII – Appendix 13-1).
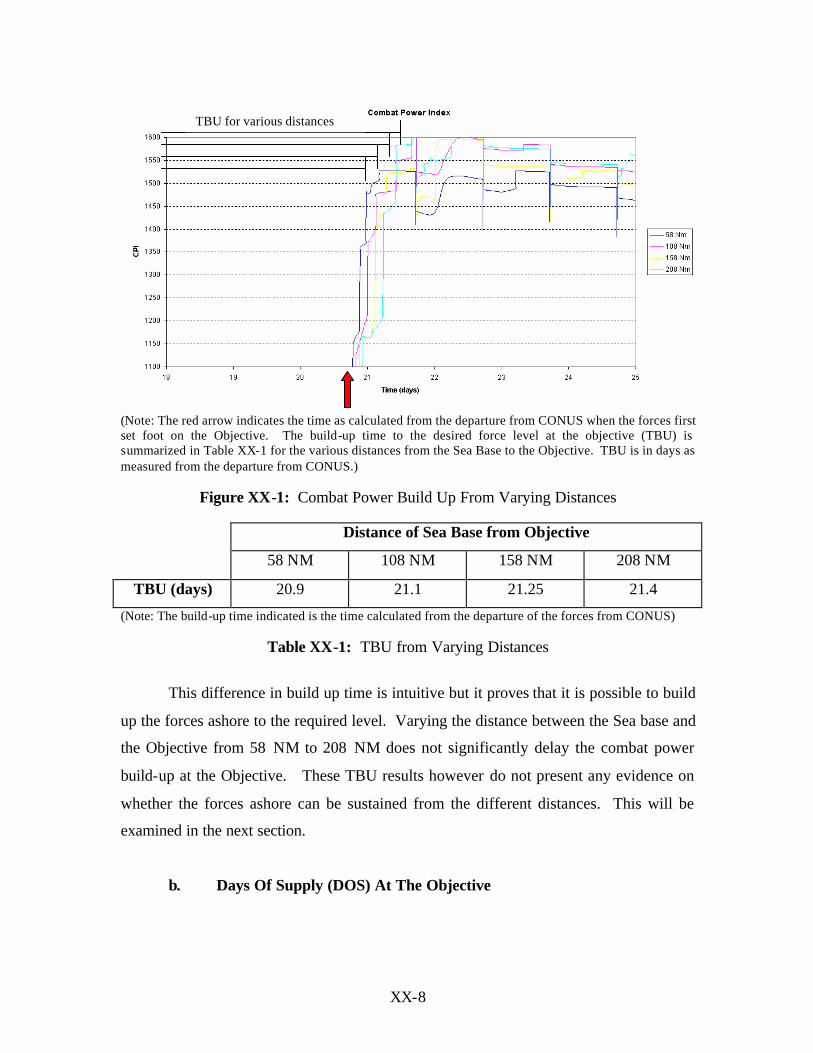
Increasing the distance between the Sea Base and the Objective results in an
increase in the TBU. This is represented in the following figure and table:
XX-8
(Note: The red arrow indicates the time as calculated from the departure from CONUS when the forces first set foot on the Objective. The build-up time to the desired force level at the objective (TBU) is summarized in Table XX-1 for the various distances from the Sea Base to the Objective. TBU is in days as measured from the departure from CONUS.)
Figure XX-1: Combat Power Build Up From Varying Distances
Distance of Sea Base from Objective
58 NM 108 NM 158 NM 208 NM
TBU (days) 20.9 21.1 21.25 21.4
(Note: The build-up time indicated is the time calculated from the departure of the forces from CONUS)
Table XX-1: TBU from Varying Distances
This difference in build up time is intuitive but it proves that it is possible to build
up the forces ashore to the required level. Varying the distance between the Sea base and
the Objective from 58 NM to 208 NM does not significantly delay the combat power
build-up at the Objective. These TBU results however do not present any evidence on
whether the forces ashore can be sustained from the different distances. This will be
examined in the next section.
b. Days Of Supply (DOS) At The Objective
TBU for various distances

XX-9
This MOP will indicate the bias and variability of the level of resources from the
desired level at the Objective: 5 DOS. This MOP will indicate the robustness and
consistency of the resource levels at the Objective and will represent how well the Sea
Base is sustaining the forces ashore.
Charts depicting the DOS at the Objective pertaining to each distance are shown
below. The vertical axis is the days of supplies of the type of resources and the
horizontal axis is time in days.
Figure XX-2: DOS at Objective with distance = 58 NM
(Note: The arrow indicates that fuel is exhausted beginning at day 86.)
Figure XX-3: DOS at Objective with distance = 108 NM
Days of Supply (Objective) - 108 Nm
0
1
2
3
4
5
6
7
8
9
10
11
12
13
0 10 20 30 40 50 60 70 80 90 100
Time (Days)
Sus
tain
men
t Le
vel
Sustainment Level (Fuel) Sustainment Level (Food) Sustainment Level (Water) Sustainment Level (Ammo)
XX-10
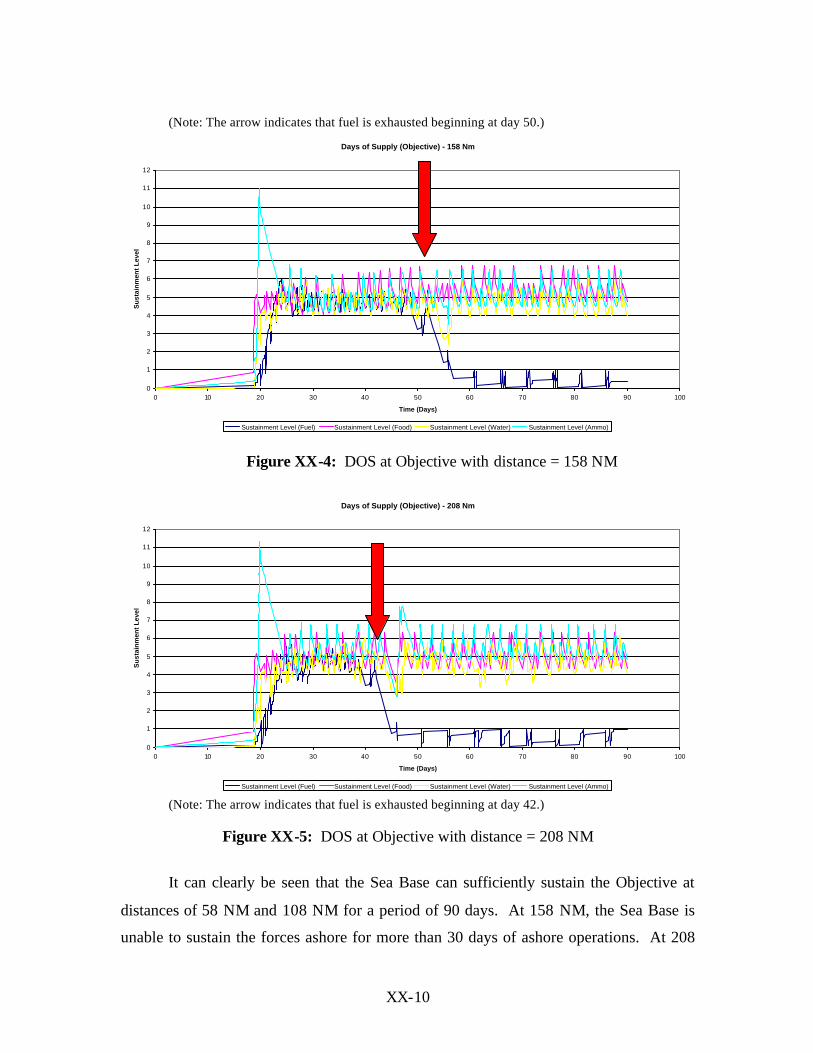
(Note: The arrow indicates that fuel is exhausted beginning at day 50.)
Figure XX-4: DOS at Objective with distance = 158 NM
(Note: The arrow indicates that fuel is exhausted beginning at day 42.)
Figure XX-5: DOS at Objective with distance = 208 NM
It can clearly be seen that the Sea Base can sufficiently sustain the Objective at
distances of 58 NM and 108 NM for a period of 90 days. At 158 NM, the Sea Base is
unable to sustain the forces ashore for more than 30 days of ashore operations. At 208
Days of Supply (Objective) - 158 Nm
0
1
2
3
4
5
6
7
8
9
10
11
12
0 10 20 30 40 50 60 70 80 90 100
Time (Days)
Su
stai
nm
ent
Lev
el
Sustainment Level (Fuel) Sustainment Level (Food) Sustainment Level (Water) Sustainment Level (Ammo)
Days of Supply (Objective) - 208 Nm
0
1
2
3
4
5
6
7
8
9
10
11
12
0 10 20 30 40 50 60 70 80 90 100
Time (Days)
Su
stai
nm
ent
Lev
el
Sustainment Level (Fuel) Sustainment Level (Food) Sustainment Level (Water) Sustainment Level (Ammo)

XX-11
NM, the Sea Base will fail its sustainment operations at the 20th day ashore. The area of
concern arises when the fuel re-supply begins to collapse on the 65th day at 108 NM, 30th
day at 158 NM and 20th day at 208 NM. This problem is two-fold: one is due to the fixed
fuel re-supply to the Sea Base, and the other is due to the increasing fuel demand from
the air re-supply platforms and the land vehicles when we stretch the ranges up to 208
nm. This concern for the fuel re-supply can be eradicated by ensuring there are more
frequent fuel re-supply runs to the Sea Base and the Objective, or by ensuring that the
Sea base ships are designed with a bigger fuel storage capacity.
Distance of Sea Base from Objective
58 NM 108 NM 158 NM 208 NM
MSE (days) 0.707 0.784 1.673 1.812
Table XX-2: MSE at Objective at Varying Distances
The MSE at the Objective increases as the distance of the Sea Base from the
Objective increases. At 58 NM and 108 NM, the variability of the resource levels is
0.707 and 0.784 days of supply respectively. This increases to 1.673 and 1.812 days of
supply at the Objective when the distance increased to 158 NM and 208 NM. In absolute
terms, 1.673 and 1.812 days of supply is minute, however in percentage terms, these
translate into 33.4% and 36.24% of resource drawdown.
Distance of the Sea Base to the Objective is a critical factor in designing the Sea
Base. In order to have a functioning Sea Base that can sustain the forces ashore
indefinitely at OTH distances, the replenishment system needs to be made more robust or
the load on the system reduced, so it can function at longer distances.
One of the interesting points to note is the depletion of fuel as the distances
increased. As we have a fixed rate of fuel replenishment to the Sea Base, the fuel supply
was unable keep up with the increased consumption as more re-supply missions were
flown or launched. Therefore, flexibility in increasing or decreasing the supply,
especially fuel, to the Sea Base is highly desirable.
This can also be accomplished by reducing the consumption of resources at the
Objective. This implies efficient usage of fuel and ammunition. Having more fuel
XX-12
efficient hardware systems and using precision strike weaponry will translate into less
consumption at the Objective and will also mean that fewer resources need to be sent to
the Objective from the Sea Base.
Moving the ashore support fires onto the Sea Base can also relieve the load on the
replenishment system. This reduced strain on the replenishment system will mean it can
function at longer distances.
2. Replenishment Options for Sustaining Forces Ashore
This section discusses varying the proportions of air and sea transport for
replenishing the Objective from the Sea Base. Four different options are tested and
compared using the EXTENDTM models and each option is also tested under different
weather conditions.
Under the architecture, some equipment, such as the M1A1 tank, cannot be
airlifted. Even when a 100% air replenishment option is used, the M1A1 will still be a
surface delivered combat system. Resources like food, fuel, and ammunition, etc., will
be air or sea delivered depending on the option chosen.
One of the early results of this analysis is that a 100% air replenishment option is
subject to high levels of attritions. This is due to the tremendous number of sorties that
need to be flown in order to replace a single Heavy Landing Craft Air Cushion (HLCAC)
load, thus increasing the aircraft’ exposure to enemy fire. The draw down on aircraft will
impact the replenishment system within the first 10 days, bringing the Sea Base re-supply
missions to a ha lt. It was concluded that a 100% air replenishment option is only viable
in a low or no attrition environment, which translates to air superiority and dominance of
theater’s air space with ISR assets. Therefore, we tested this option with a zero attrition
rate to garner the insights.
a. Days of Supply (DOS) at the Objective
The first eye-catching result from the analysis is that neither air nor sea means of
replenishment can be omitted. When 100% air replenishment was used, the model came

XX-13
to an abrupt halt due to attrition of the aircraft. On the other hand, when 100% sea means
was used, the variability of the resource levels at the Objective increased.
Mean Squared Error at Objective Good Weather Poor Weather
50% Air Means & 50% Sea Means 0.784 2.824
0% Air Means & 100% Sea Means
0.957 2.877
75% Air Means & 25% Sea Means 0.737 2.847
100% Air Means & 0% Sea Means
0.677 0.777
(Note: Based on no aircraft attrition)
Table XX-3: MSE at Objective with different Replenishment Options
A 100% air replenishment option in a no air attrition environment results in a
lower MSE and is also more robust under inclement weather conditions. This suggests
that using air transportation to deliver resources ashore is more reliable as it provides a
stable resource level at the Objective. However, this conclusion must be qualified. This
result was only possible by zeroing the attrition for the air route between the Sea Base
and the Objective. In reality, this is only possible if true air superiority is gained, and
only then will attrition be minimized or eliminated.
b. Days of Supply (DOS) at the Sea Base
Mean Squared Error at Sea Base Good Weather Poor Weather
50% Air Means & 50% Sea Means 13.354 11.091
0% Air Means & 100% Sea Means
14.151 11.667
75% Air Means & 25% Sea Means 13.492 12.257
100% Air Means & 0% Sea Means
8.489 9.936
(Note: Based on no aircraft attrition)
Table XX-4: MSE at Sea Base with different Replenishment Options

XX-14
At the Sea Base, the same picture was presented. Omitting either air or sea means
of replenishments from the Sea Base to the Objective results in an increased variability or
a quick halt to the re-supply missions due to the attrition of the aircraft.
Similarly at the Sea Base, the option of using 100% air replenishments in a no air
attrition environment results in the lowest variability and increased robustness in
inclement weather conditions. Conclusively, replenishments via air can improve the
stability of the resource levels at both the Sea Base and the Objective.
G. AERIAL THROUGHPUT OF THE SEA BASE
1. Scope of the Problem
One of the most important capabilities of the Sea Base is to support and sustain
the warfighters ashore. Having the means to get “the right stuff, to the right place, at the
right time” is critical in order to carry out STOM. Moving large quantities of logistical
supplies OTH from the Sea Base to 200 NM inland requires a large dependence on air
assets and a large enough Sea Base to support those air assets.
Concentrating on the Conceptual Sea Base architecture designed by NPS’ TSSE
Team and the Heavy Lift Aircraft designed by NPS’ AERO Team, this study examines
the aerial throughput required to support and sustain indefinitely a notional MEB’s
Landing Force in 2015-2020.
The main objectives of this aerial throughput study are to compare sustainment
capabilities of the Planned architecture to the Conceptual architecture at 25, 55, and 250
NM, calculate the throughput rate (tons delivered per day) for the Conceptual architecture
at 225, 250, and 275 NM, develop a spreadsheet model that produces charts and graphs
that can be used as a planning tool, and analyze the Heavy Lift Aircraft using a modeling
and simulation program – ARENATM.
In order to carry out these objectives, the force and the supporting assets need to
be identified.

XX-15
2. Marine Expeditionary Brigade
The Marine Corps is a rapid-action response force that deploys as a MAGTF and
is scalable depending on the mission. The MEU is the smallest scalable force with
approximately 2,200 personnel. The MEU is able to sustain itself for 15 days and has a
limited capability.
The intermediate scalable force is the MEB, consisting of approximately 17,000
personnel and having the following capabilities:
• Responsive to a full range of crises
• Has a forcible entry capability
• Enabler for follow-on joint or combined forces
• Operates as an independent operational maneuver element
• Creates and exploits the enemies weaknesses attacks the
center of gravity
• Deploys either by air, sea, or both
• 30 Days self-sustainment capability
As one of the key project assumptions, the future MEB size MAGTF of 2015-
2020 will remain relativity the same as the current. The table below represents a
representative MEB of 2015 – 2020.

XX-16
Marines Navy
Detachment/Unit Officer Enlisted Officer Enlisted Civilian Total
Command Element (CE) 111 635 5 10 2 763
Ground Combat Element
(GCE) 315 5,477 18 272 0 6,082
Aviation Command Element
(ACE) 608 4,470 35 130 0 5,243
Brigade Service Support
Group (BSSG) 87 1924 76 228 0 2,315
MPF MEB TOTAL 1121 12506 134 640 2 14,403
MPF MEB 14,403
Table XX-5: Maritime Prepositioning Force (MPF) Marine Expeditionary
Brigade (MEB) (Source: Headquarters U.S. Marine Corps)
The largest MAGTF force is the Marine Expeditionary Force (MEF). The MEF is
most capable of the three Marine Corps forces. It is self-sustainable for approximately 60
days and has approximately 50,000 combat personnel.
Although the three force structures vary in size, they have the same common
denominator -- organizational elements. All three of the scalable Marine Corps force
packages consist of the following elements: Command Element (CE), Ground Combat
Element (GCE), Aviation Combat Element (ACE), and Combat Service Support Element
(CSSE).
3. Daily Sustainment Requirement for a MEB Size Landing Force
For the purpose of this study, the daily sustainment requirements are based on a
reduced MEB ashore -- MEB size Landing Force only. What makes up the reduced MEB
size Landing Force? The Landing Force consists of three elements – the CE, the GCE,
and the CSSE. The CE is reduced by approximately half its original composition. Half
of the CE goes ashore, while the other half remains at the Sea Base. The GCE retains the

XX-17
same number of personnel, whereas, the GSSE is reduced by 75 percent. With an
effective Sea Base, the logistical footprint ashore is greatly reduced – the more robust the
Sea Base, the less the logistical tail ashore. Refer to Table XX-6 for the composition and
number of personnel assigned to a reduced MEB size Landing Force.
MEB Landing Force Personnel Command Element 365
Ground Combat Element 5,694 Combat Service Support Element 747
Total 6,806
Table XX-6: Marine Expeditionary Brigade Landing Force (Source: Naval Board Studies, 1999)
The daily sustainment requirement is calculated using the following factors: the
number of personnel, equipment required, consumption rates, environment, and opposing
force. Based on characteristics and purpose, the Marine Corps divides their supplies into
10 classes. The following is a list of the 10 classes of supplies (MCCDC, 1999, 1-7):
a. Class I - Subsistence (Food and Water)
b. Class II - Individual Equipment
c. Class III – Petroleum, Oils, Lubricants (POL)
d. Class IV – Construction Material
e. Class V – Ammunition (W) represents ground, (A) represents air
f. Class VI – Personal Demand Items or Non-Military Sales Items
g. Class VII – Major End Items
h. Class VIII – Medical and Dental Items
i. Class IX – Repair Parts
j. Class X – Non-Military Program Materials
Although all the classes are important, Classes I, III, V, and IX receive special
attention because they require the most logistical effort ashore. As a result, this study
concentrates on the logistical challenge that faces the Sea Base’s ability to meet these
demands – moving large amounts over long distances. This study examines throughput
XX-18
as the Measure of Effectiveness (MOE). Throughput is the average quantity of cargo,
equipment, and/or passengers that can pass from the Sea Base to the Objective on a daily
basis. In this case, throughput is expressed in short tons per day. In different scenarios
bad weather and attrition reduce the throughput rate, but in this study we assume good
weather and no attrition. Additionally, throughput may be delivered by surface, air, or
both, but this study concentrates on the aerial throughput.
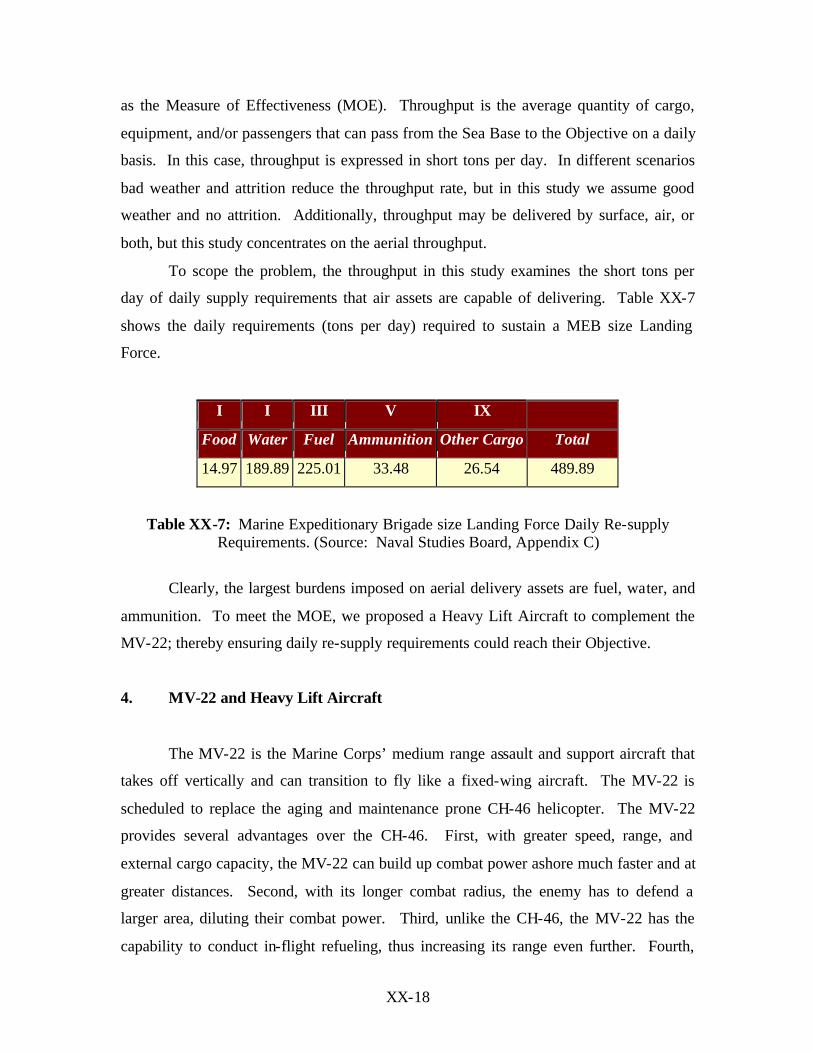
To scope the problem, the throughput in this study examines the short tons per
day of daily supply requirements that air assets are capable of delivering. Table XX-7
shows the daily requirements (tons per day) required to sustain a MEB size Landing
Force.
I I III V IX
Food Water Fuel Ammunition Other Cargo Total
14.97 189.89 225.01 33.48 26.54 489.89
Table XX-7: Marine Expeditionary Brigade size Landing Force Daily Re-supply Requirements. (Source: Naval Studies Board, Appendix C)
Clearly, the largest burdens imposed on aerial delivery assets are fuel, water, and
ammunition. To meet the MOE, we proposed a Heavy Lift Aircraft to complement the
MV-22; thereby ensuring daily re-supply requirements could reach their Objective.
4. MV-22 and Heavy Lift Aircraft
The MV-22 is the Marine Corps’ medium range assault and support aircraft that
takes off vertically and can transition to fly like a fixed-wing aircraft. The MV-22 is
scheduled to replace the aging and maintenance prone CH-46 helicopter. The MV-22
provides several advantages over the CH-46. First, with greater speed, range, and
external cargo capacity, the MV-22 can build up combat power ashore much faster and at
greater distances. Second, with its longer combat radius, the enemy has to defend a
larger area, diluting their combat power. Third, unlike the CH-46, the MV-22 has the
capability to conduct in-flight refueling, thus increasing its range even further. Fourth,

XX-19
and most importantly, the MV-22’s OTH capability, coupled with its heavier payload
capacity and long range, is better suited to support the operational concept OMFTS, and
its implementing concepts – STOM, and Sea Based Logistics (SBL) (MCCDC and NDC
1998).
We discovered that the Planned air assets consisting of thirty-six MV-22s and
eight CH-53Es are not capable of supporting and sustaining a MEB size Landing Force
for an indefinite period at long distances without setting up a vulnerable refueling site. A
mobile Forward Refueling and Arming Position could be established, but the tradeoff
would be survivability and slower build up times at the Objective. As envisioned in
operational concept OMFTS, and its implementing concept – STOM, and SBL, the
distance from the Sea Base to the Objective could exceed 225 NM – 25 NM from the Sea
Base to the beach and 200 NM inland.
Current trends suggest that the safe standoff distances between the Sea Base and
the beach will increase because of improved advanced technologies in threat missiles and
gunfire. With an increased standoff distance from the Sea Base to the beach, the aviation
assets re-supplying the combat troops ashore will require larger payload capacities at
longer ranges, thus generating a need for a Heavy Lift Aircraft.
Having examined the potential risks associated with future ExWar operations in
terms of re-supplying the combat forces ashore, we wrote requirements for NPS’ AERO
Design Team. Refer to Chapter XV for additional information on the Long Range,
Heavy Lift Aircraft and its requirements. If designed to the requirements, the Heavy Lift
Aircraft will have the capability to carry an external payload of 37,500 pounds 300 NM
from the Sea Base to the Objective, offload its payload, and return to the Sea Base
without refueling. Additionally, the Heavy Lift Aircraft will be capable of carrying an
internal load of 20,000 pounds for 300 NM, offloading, and returning to the Sea Base
without refueling.
5. Sea Base
In order to handle the high volume of air operations required to surge and sustain
a MEB size Landing Force indefinitely, the Sea Base becomes an integral part of the
system of systems needed to carry out future ExWar as envisioned. NPS’ TSSE Team

XX-20
designed a family of six ships to form a Sea Base. Figure XX-6 is a conceptual
illustration of one of the six ships that forms the Sea Base. Additionally, three other ships
with the same hull form are used as shuttle ships to transit back and forth from a mobile
or fixed off shore base to re-supply the Sea Base.
Figure XX-6: NPS’ TSSE Ship Design
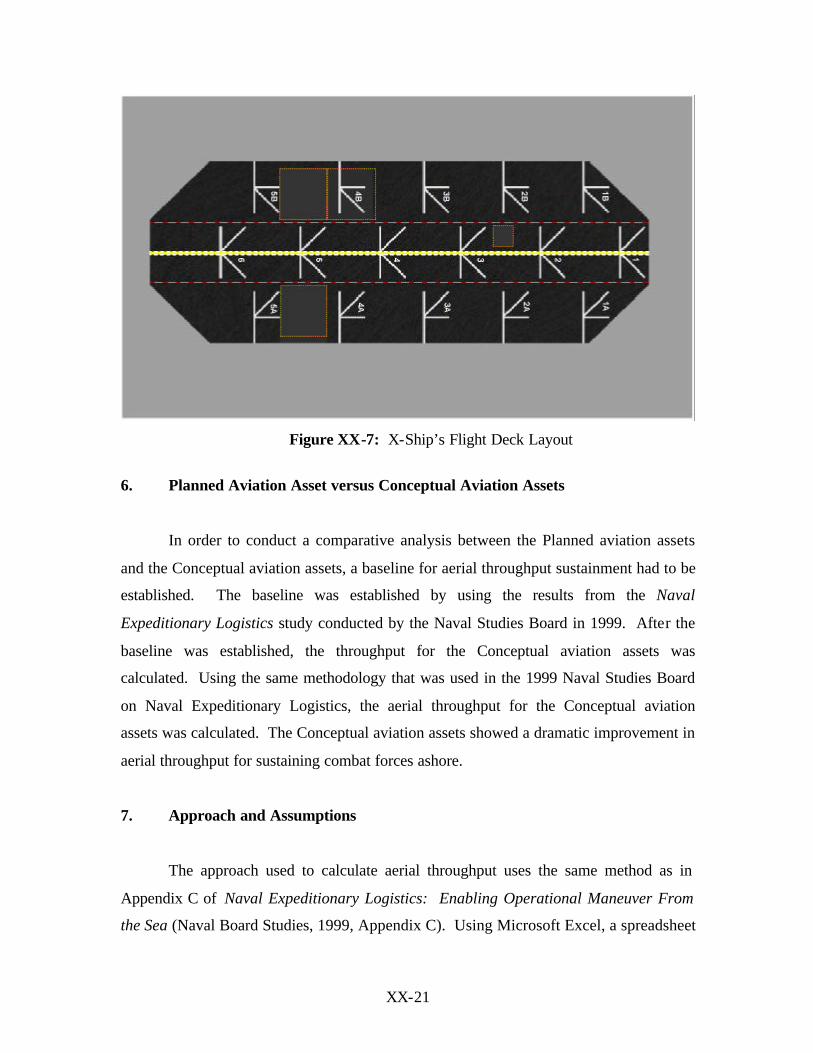
With a high volume of cargo requiring transportation to support combat troops
ashore, the flight deck provides sixteen possible spots capable of conducting air
operations. In comparison, the LHD and LHA each have 9 usable helicopter spots. The
MV-22 requires one spot and the Heavy Lift Aircraft requires 2 spots. Figure XX-7 is an
illustration of the flight deck spots on the X-Ship.
XX-21
Figure XX-7: X-Ship’s Flight Deck Layout
6. Planned Aviation Asset versus Conceptual Aviation Assets
In order to conduct a comparative analysis between the Planned aviation assets
and the Conceptual aviation assets, a baseline for aerial throughput sustainment had to be
established. The baseline was established by using the results from the Naval
Expeditionary Logistics study conducted by the Naval Studies Board in 1999. After the
baseline was established, the throughput for the Conceptual aviation assets was
calculated. Using the same methodology that was used in the 1999 Naval Studies Board
on Naval Expeditionary Logistics, the aerial throughput for the Conceptual aviation
assets was calculated. The Conceptual aviation assets showed a dramatic improvement in
aerial throughput for sustaining combat forces ashore.
7. Approach and Assumptions
The approach used to calculate aerial throughput uses the same method as in
Appendix C of Naval Expeditionary Logistics: Enabling Operational Maneuver From
the Sea (Naval Board Studies, 1999, Appendix C). Using Microsoft Excel, a spreadsheet

XX-22
model of throughput - tons delivered per day for each type of air transporter - was
calcula ted for the Planned Aviation Assets - 36 MV-22s and 8 CH-53Es, as well as the
Conceptual Aviation Assets 96 MV-22s and 24 Heavy Lift Aircraft.
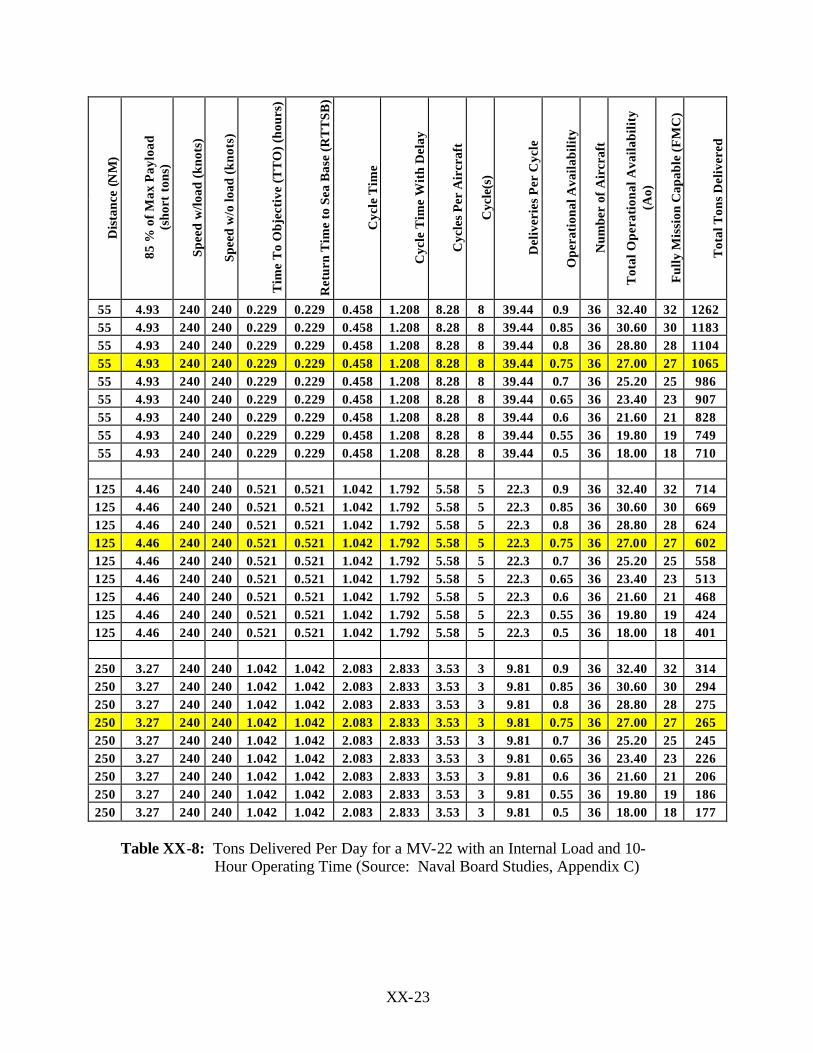
Table XX-8, although slightly different from Table C.3 in Appendix C of the
Naval Expeditionary Logistics publication, shows the basic layout for calculating tons
delivered per 10 hours of operating time. Table XX-8, unlike Table C.3 in Appendix C,
provides a range of operational availabilities instead of just one for the MV-22 and the
CH-53E. The numbers for total tons delivered are slightly different due to rounding
errors. Table XX-8, a sample of the Aerial Throughput Model has sixteen columns that
contribute to the final results of total tons delivered. The following describes the contents
of each column:
a. First Column
The first column lists the ranges of interest – specifically, 55, 125, and 250 NM.
b. Second Column
The second column refers to eighty-five percent capacity of the maximum
payload in short tons (ST). Due to different internal and external payload weights, the
percent percent factor multiplied by the maximum payload accounts for the average
payload weight for a light or heavy payload. Unlike the MV-22 and CH-53E, the Heavy
Lift Aircraft uses a seventy percent factor vice eighty-five percent factor because the
Conceptual design has not been tested. Typically, as range increases, payload decreases.
The Heavy Lift Aircraft, on the other hand, uses a maximum payload of 37,500 pounds
for external lifts and 20,000 pounds for internal lift for all range up to and including 300
NM as stated in the Operational Requirements Documents (ORD). Refer to Chapter XV
for additional information on the Heavy Lift Aircraft.
XX-23
Dis
tanc
e (N
M)
85 %
of M
ax P
aylo
ad
(sho
rt t
ons)
Spee
d w
/load
(kn
ots)
Spee
d w
/o lo
ad (k
nots
)
Tim
e T
o O
bjec
tive
(TT
O) (
hour
s)
Ret
urn
Tim
e to
Sea
Bas
e (R
TT
SB)
Cyc
le T
ime
Cyc
le T
ime
Wit
h D
elay
Cyc
les
Per
Air
craf
t
Cyc
le(s
)
Del
iver
ies
Per
Cyc
le
Ope
rati
onal
Ava
ilabi
lity
Num
ber
of A
ircr
aft
Tot
al O
pera
tion
al A
vaila
bilit
y (A
o)
Ful
ly M
issi
on C
apab
le (F
MC
)
Tot
al T
ons
Del
iver
ed
55 4.93 240 240 0.229 0.229 0.458 1.208 8.28 8 39.44 0.9 36 32.40 32 1262 55 4.93 240 240 0.229 0.229 0.458 1.208 8.28 8 39.44 0.85 36 30.60 30 1183 55 4.93 240 240 0.229 0.229 0.458 1.208 8.28 8 39.44 0.8 36 28.80 28 1104 55 4.93 240 240 0.229 0.229 0.458 1.208 8.28 8 39.44 0.75 36 27.00 27 1065 55 4.93 240 240 0.229 0.229 0.458 1.208 8.28 8 39.44 0.7 36 25.20 25 986 55 4.93 240 240 0.229 0.229 0.458 1.208 8.28 8 39.44 0.65 36 23.40 23 907 55 4.93 240 240 0.229 0.229 0.458 1.208 8.28 8 39.44 0.6 36 21.60 21 828 55 4.93 240 240 0.229 0.229 0.458 1.208 8.28 8 39.44 0.55 36 19.80 19 749 55 4.93 240 240 0.229 0.229 0.458 1.208 8.28 8 39.44 0.5 36 18.00 18 710
125 4.46 240 240 0.521 0.521 1.042 1.792 5.58 5 22.3 0.9 36 32.40 32 714 125 4.46 240 240 0.521 0.521 1.042 1.792 5.58 5 22.3 0.85 36 30.60 30 669 125 4.46 240 240 0.521 0.521 1.042 1.792 5.58 5 22.3 0.8 36 28.80 28 624 125 4.46 240 240 0.521 0.521 1.042 1.792 5.58 5 22.3 0.75 36 27.00 27 602 125 4.46 240 240 0.521 0.521 1.042 1.792 5.58 5 22.3 0.7 36 25.20 25 558 125 4.46 240 240 0.521 0.521 1.042 1.792 5.58 5 22.3 0.65 36 23.40 23 513 125 4.46 240 240 0.521 0.521 1.042 1.792 5.58 5 22.3 0.6 36 21.60 21 468 125 4.46 240 240 0.521 0.521 1.042 1.792 5.58 5 22.3 0.55 36 19.80 19 424 125 4.46 240 240 0.521 0.521 1.042 1.792 5.58 5 22.3 0.5 36 18.00 18 401
250 3.27 240 240 1.042 1.042 2.083 2.833 3.53 3 9.81 0.9 36 32.40 32 314 250 3.27 240 240 1.042 1.042 2.083 2.833 3.53 3 9.81 0.85 36 30.60 30 294 250 3.27 240 240 1.042 1.042 2.083 2.833 3.53 3 9.81 0.8 36 28.80 28 275 250 3.27 240 240 1.042 1.042 2.083 2.833 3.53 3 9.81 0.75 36 27.00 27 265 250 3.27 240 240 1.042 1.042 2.083 2.833 3.53 3 9.81 0.7 36 25.20 25 245 250 3.27 240 240 1.042 1.042 2.083 2.833 3.53 3 9.81 0.65 36 23.40 23 226 250 3.27 240 240 1.042 1.042 2.083 2.833 3.53 3 9.81 0.6 36 21.60 21 206 250 3.27 240 240 1.042 1.042 2.083 2.833 3.53 3 9.81 0.55 36 19.80 19 186 250 3.27 240 240 1.042 1.042 2.083 2.833 3.53 3 9.81 0.5 36 18.00 18 177
Table XX-8: Tons Delivered Per Day for a MV-22 with an Internal Load and 10- Hour Operating Time (Source: Naval Board Studies, Appendix C)

XX-24
c. Third Column
The third column is the speed of the aircraft (knots) for an internal or external
load.
d. Fourth Column
The fourth column is the speed of the aircraft (knots) without the payload. The
Naval Studies Board used the same speed for the aircraft both with a load and without a
load. In the comparing Planned aviation assets and Conceptual aviation assets the same
assumption was made, however, better analysis of the Conceptual aviation assets at 225,
250, and 275 NM required the different speeds.
e. Fifth Column
The fifth column is the total time (hours) to the objective (TTTO). TTTO is
calculated by dividing the first column by the third column.
f. Sixth Column
The sixth column is the return time (hours) to the Sea Base (RTTSB). RTTSB is
calculated by dividing the first column by the fourth column.
g. Seventh Column.
The seventh column is the total cycle time (operating time) to complete one trip
from the Sea Base to the Objective and back to the Sea Base. Cycle time is calculated by
adding the fifth and sixth columns.
h. Eighth Column
The eighth column is the total cycle time plus a 45-minute delay for loading,
unloading, and refueling. The internal load requires a longer delay time than an external
load, but this study uses the internal load as the standard. Column eight is calculated by
adding a 45-minute delay to column seven.
i. Ninth Column
The ninth column is the number of cycles for 10, 12, or 14-hours of flight.
XX-25
Cycles per aircraft at the respective 10, 12, 14-hour flight day is calculated by dividing
the flight hours by column eight.
j. Tenth Column
The tenth column is the number of cycles per day as a whole integer. Cycles per
day are calculated by using a round-down function on the ninth column. This method
ensures a conservative number. To illustrate this point -- assume a Heavy Lift Aircraft
with a .75 operational availability is carrying an external load for 250 NM at a 12 hour
operating time. The number of cycles per aircraft for 12 hours is 3.83 cycles. Instead of
finishing with 4 cycles the number is rounded down to 3 cycles. In terms of total tons
delivered -- it is a difference of 945 STs minus 709 STs for a difference of 236 STs.
k. Eleventh Column
The eleventh column is the total tons delivered (STs) during a 10, 12, or 14 hour
operating time for each type of aircraft. Deliveries per aircraft for each day are calculated
by multiplying second column by the tenth column.
l. Twelfth Column
The twelfth column is the operational availability (Ao). Operational availability is
“the probability that a system or equipment, when used under stated conditions in an
actual operational environment, will operate satisfactorily when called upon” (Blanchard
and Fabrycky 1998, 359). A range of .5 was incremented by .05 until the maximum Ao
of .9 was reached – (.5, .55, .6, .65, .7, .75, .8, .85, .90). Ideally, any aircraft having an
operational availability greater than .75 is considered the norm.
m. Thirteenth Column
The thirteenth column shows the number of aircraft tentatively scheduled to be
part of the future Sea Base. The Planned Aviation Assets are as follows: 36 MV-22s and
8 CH-53Es and the Conceptual Aviation Assets are as follows: 96 MV-22s and 24
Heavy Lift Aircraft. The aircraft listed are only part of the ACE. Additional aircraft are
assigned to the ACE, but will not use as part of the major re-supply lift.

XX-26
n. Fourteenth Column
The fourteenth column is the available aircraft. Available aircraft is the number
of aircraft times the operation availability. Availability is calculated by multiplying the
twelfth column by the thirteenth column.
o. Fifteenth Column
The fifteenth column uses the round-down function on the fourteenth column to
give the Fully Mission Capable (FMC) Aircraft.
p. Sixteenth Column
The sixteenth column is the total tons delivered per day. The total tons delivered
per day are calculated by multiplying the eleventh column by the fifteenth column.
The methodology used above does not take into account bad weather or attrition
due to enemy fire. However, with a range of operational availabilities, the FMC can be
adjusted to account for enemy attrition. For example, assume the attrition rate for Heavy
Lift Aircraft is 5 percent for the first three days during the initial assault phase.
Additionally, assume the operational availability is .75 percent. To find the adjusted total
tons delivered, use a new operational availability of .60 instead. To account for weather,
the speed and payloads could be adjusted to account for bad weather.
For computations for both internal and external loads at 10, 12, and 14 hour
operating times refer to Appendix 20-2.
8. Comparing Planned Aviation Assets to Conceptual Aviation Assets
Using the throughput results from the Aerial Throughput model, the percentages
of re-supply requirements were calculated and Tables XX-9 and XX-10 shows the
results. This study assumed the following: First, there are no aerial or shore based
refueling assets available. Second, the distance represented (Sea Base to Objective) is the
distance the aircraft can fly one-way form the Sea Base to the Objective with a payload,
unload its payload, and return to the Sea Base. Third, the MV-22 does not have the

XX-27
capability to carry an external payload 250 nm or greater. Fourth, the aircraft can carry
internal loads or external loads, but not both.
In Table XX-9, we show the percentage of re-supply for air deliveries at a 10-
hour flight day utilizing 27 MV-22s and 5 CH-53s. Planned aviation assets consist of 36
MV-22s and 8 CH-53Es; however, the table takes into account operational availabilities
for both aircraft. The MV-22 uses an operational availability .75 -- 36 times .75 equals
27 FMC aircraft. The CH-53E, on the other hand, uses a lower operational availability of
.70 – 8 times .70 equals 5.6, but this number is rounded down to 5 FMC aircraft. Table
XX-9 illustrates two very important points. First, Planned aviation air assets alone do not
have the capability to re-supply combat forces ashore at 250 NM. Second, as the supply
demand ashore decreases, the percent of re-supply increases.
Percent of Re-supply Requirements Met by Air Deliveries at a 10-Hour Operating Time Using all Planned Sea Base Air Assets -- MV-22s and CH-53Es
Portion of Force Supported Tons Needed
short tons Number of Personnel 250 nm 125 nm 55 nm
Full MEF (FWD) 2,235 17,800 15 percent
34 percent
62 percent
MEF (FWD) less ACE 848 10,460 40 percent
88 percent
165 percent
MEF (FWD) less ACE and CE 785 9,660 43 percent
95 percent
178 percent
Landing Force only 490 6,800 69 percent
153 percent
285 percent
(Note: For Landing Force only at 250 NM, the Planned Aviation Assets cannot meet the daily re-supply requirements, which include fuel, water, food, ammo, and spares.)
Table XX-9: Percent of Re-supply for Planned Aviation Assets (Naval Studies Board, 1999, Chapter 4)
In Table XX-10, we show the percentage of re-supply for air deliveries for a 10-
hour flight day utilizing 72 MV-22s and 18 Heavy Lift Aircraft. Conceptual aviation
assets consist of 96 MV-22s and 24 Heavy Lift Aircraft; however, the table takes into
account operational availabilities for both aircraft. The MV-22 uses an operational
availability .75 -- 96 times .75 equals 72 FMC aircraft. The Heavy Lift Aircraft uses an
operational availability of .75 – 24 times .75 equals 18 FMC aircraft. Table XX-10
shows dramatic improvements at all ranges and combat troops supported. The only
situation where the Conceptual aviation assets are not adequate is the re-supply

XX-28
requirement for a full MEB equivalent force ashore at 250 NM. When comparing Tables
XX-9 and XX-10, the Conceptual has 11 out of 12 “100 percent”, whereas, the Planned
only has 4 out of 12.
Percent of Re-supply Requirements Met by Air Deliveries at a 10-Hour Operating Time
Using all Conceptual Sea Base Air Assets -- MV-22s and Heavy Lift Aircraft
Portion of Force Supported Tons Needed
short tons Number of Personnel 250 nm 125 nm 55 nm
Full MEF (FWD) 2,235 17,800 49 percent
100 percent
172 percent
MEF (FWD) less ACE 848 10,460 128 percent
264 percent
454 percent
MEF (FWD) less ACE and CE 785 9,660 138 percent
285 percent
490 percent
Landing Force only 490 6,800 221 percent
456 percent
785 percent
(Note: For a Landing Force only, the Conceptual Aviation Assets can meet the daily re-supply requirements by 221%.)
Table XX-10: Percent of Re-supply for Conceptual Aviation Assets
Clearly, the Conceptual aviation assets are better suited for re-supply at longer
ranges and larger footprints, but how much better? The next several tables will provide a
comparative look at the Conceptual aviation assets versus the Planned aviation assets.
The comparison shows the total tons delivered for both the Conceptual and Planned
aviation assets. We choose three different operating times and two different loads. The
normal operating time (flight day) for aviation operations is 12 hours, so we selected 12
hours plus and minus 2 hours. All three aircraft carry either internal or external loads.

XX-29
Internal Load Capacity 10-Hour Operating Time Planned Aviation Assets versus Conceptual
Aviation Assets
38482236
10841396 749 3370
2000
4000
6000
55 125 250
Sea Base to Objective (nm)
To
tal T
on
s D
eliv
ered
Conceptual AviationAssets (96) MV-22'sAo=.75, FMC=72 & (24)Heavy Lift AircraftsAo=.75, FMC=18
Planned ArchitectureAssets (36) MV-22'sAo=.75, FMC=27 & (8)CH-53E's Ao=.70, FMC=5
(Note: Daily re-supply requirement for Landing Force only is 490 tons.)
Figure XX-8: Throughput of Planned versus Conceptual Aviation Assets with an Internal Load and 10-Hour Operating Time
External Load Capacity 10-Hour Operating Time Planned Aviation Assets versus Conceptual
Aviation Assets
4138
23077091208 569 36
0
2000
4000
6000
55 125 250
Sea Base to Objective (nm)
To
tal T
on
s D
eliv
ered
Conceptual AviationAssets (96) MV-22'sAo=.75, FMC=72 &(24) Heavy Lift AircraftsAo=.75, FMC=18Planned ArchitectureAssets (36) MV-22'sAo=.75, FMC=27 & (8)CH-53E's Ao=.70,FMC=5
(Note: Daily re-supply requirement for Landing Force only is 490 tons.)
Figure XX-9: Throughput of Planned versus Conceptual Aviation Assets with an
External Load and 10-Hour Operating Time
Figures XX-8 and XX-9 provide a comparative look at Planned aviation assets
and NPS’ Conceptual aviation assets for internal and external loads. In Figure XX-8, the
internal load capacity of the Conceptual has a much higher throughput rate than the
Planned. As the range increases, the throughput ratio, Conceptual throughput divided by
Planned throughput, increases -- 2.76 times more throughput at 55NM, 2.98 at 125 NM,

XX-30
and 3.22 at 250. Figure XX-9 shows the same throughput ratio increase, but at a much
faster rate. The throughput ratios are as follows: 3.43 at 55 NM, 4.05 at 125 NM, and
19.69 at 250 NM. This suggests that the external load capacity for the Planned
architecture lacks a long-range capability. Additionally, Planned has a better internal
throughput capability than the external throughput capability, whereas, the Conceptual is
better suited for external lift than internal lift.
Internal Load Capacity 12-Hour Operating Time Planned Aviation Assets versus Conceptual
Aviation Assets
43292683
13201585 918 4250
2000
4000
6000
55 125 250
Sea Base to Objective (nm)
To
tal T
on
s D
eliv
ered
Conceptual AviationAssets (96) MV-22'sAo=.75, FMC=72 &(24) Heavy Lift AircraftsAo=.75, FMC=18Planned ArchitectureAssets (36) MV-22'sAo=.75, FMC=27 & (8)CH-53E's Ao=.70,FMC=5
(Note: Daily re-supply requirement for Landing Force only is 490 tons.)
Figure XX-10: Throughput of Planned versus Conceptual Aviation Assets with
an Internal Load and 12-Hour Operating Time
External Load Capacity 12-Hour Operating Time Planned Aviation Assets versus Conceptual
Aviation Assets
4966
2825
7091396
675 720
2000
4000
6000
55 125 250
Sea Base to Objective (nm)
To
tal T
on
s D
eliv
ered
Conceptual AviationAssets (96) MV-22'sAo=.75, FMC=72 &(24) Heavy Lift AircraftsAo=.75, FMC=18Planned ArchitectureAssets (36) MV-22'sAo=.75, FMC=27 & (8)CH-53E's Ao=.70,FMC=5
(Note: Daily re-supply requirement for Landing Force only is 490 tons.)
Figure XX-11: Throughput of Planned versus Conceptual Aviation Assets with
an External Load and 12-Hour Operating Time

XX-31
Figures XX-10, XX-11, XX-12, and XX-13 are the basically the same and yield
similar results as Figures XX-8 and XX-9, but have different operating times. This
suggests longer operating times can help meet short term surge requirements.
Internal Load Capacity 14-Hour Operating Time Planned Aviation Assets versus Conceptual
Aviation Assets5291
3130
144619061087
462
0100020003000400050006000
55 125 250
Sea Base to Objective (nm)
To
tal T
on
s D
eliv
ered
Conceptual AviationAssets (96) MV-22'sAo=.75, FMC=72 &(24) Heavy Lift AircraftsAo=.75, FMC=18Planned ArchitectureAssets (36) MV-22'sAo=.75, FMC=27 & (8)CH-53E's Ao=.70,FMC=5
(Note: Daily re-supply requirement for Landing Force only is 490 tons.)
Figure XX-12: Throughput of Planned versus Conceptual Aviation Assets with
an Internal Load and 14-Hour Operating Time
External Load Capacity 14-Hour Operating Time Planned Aviation Assets versus Conceptual
Aviation Assets
5912
3343
9451718829 72
02000400060008000
55 125 250
Sea Base to Objective (nm)
To
tal T
on
s D
eliv
ered
Conceptual AviationAssets (96) MV-22'sAo=.75, FMC=72 &(24) Heavy Lift AircraftsAo=.75, FMC=18Planned ArchitectureAssets (36) MV-22'sAo=.75, FMC=27 & (8)CH-53E's Ao=.70,FMC=5
(Note: Daily re-supply requirement for Landing Force only is 490 tons.)
Figure XX-13: Throughput of Planned versus Conceptual Aviation Assets with
an External Load and 14-Hour Operating Time
XX-32
9. Conceptual Aviation Assets at Long-Range
The approach used to calculate throughput at long ranges uses the same
methodology as applied in Table XX-8, but with two differences. First, the ranges of
interest were changed to 225, 250, and 275 NM. Having the capability to use the sea as a
maneuver space and the ability to strike deep inland enhances the Navy and Marine
Corps ability to be first to the fight and first to fight. Second, the speed of the MV-22
with an external load was changed from 180 knots to 167 knots; and speed without a load
was changed from 180 knots to 240 knots, both these speed changes provide a more
realistic number.
Appendix 20-3 shows the calculated throughput for the Conceptual aviation assets
of (24) Heavy Lift Aircraft and (96) MV-22s for internal and external loads. Using the
information in Appendix 20-3, several graphs were developed to show the throughput
required for one, two, and three days of re-supply. The daily re-supply requirement for a
MEB size Landing Force of approximately 6,800 personnel is 490 STs. Comparing the
days of supplies to the Conceptual throughput capability provides an excellent planning
tool for an operational planner. Having flexibility and throughput capability to move
large amounts of supplies to combat troops ashore helps reduce their footprint, making
them more mobile to engage the enemy. Using Figures XX-14 though XX-19, Tables
XX-11, 12, and 13 were created to show whether or not the Conceptual aviation assets
could delivered 1 DOS, 2 DOS, or 3 DOS within 10, 12, or 14 hours for either an external
or internal load. Green means the daily re-supply requirement can be achieved and Red
means the daily re-supply requirement cannot be achieved, assuming an operational
availability of .75 – (18) Heavy Lift Aircraft and (72) MV-22s. The Conceptual aviation
assets have the capability to deliver a one- day re-supply for all three distances with the
exception of an external load at 275 NM and a 10-hour operating time. The requirement
to conduct a two-day re-supply is possible with the exception of external loads at 250 and
275 NM. Additionally, it is possible to conduct a three-day re-supply at 225 NM, but not
at 250 and 275 NM. At 14 hours for 225 NM, it is possible to conduct a three-day re-
supply for both internal and external loads. At 12 hours for 225 NM only the internal
load is possible.

XX-33
225 NM Cycle Time Payload 1 DOS 2 DOS 3 DOS
10 Internal Green Green Red 10 External Green Green Red 12 Internal Green Green Green 12 External Green Green Red 14 Internal Green Green Green 14 External Green Green Green
(Note: Operational Availability = .75 and the payload is all internal or all external, but not both. Green means can achieve daily re-supply requirements; Red means cannot achieve requirements.)
Table XX-11: Capability Matrix for Conceptual Aviation Assets at 225 NM
250 NM Cycle Time Payload 1 DOS 2 DOS 3 DOS
10 Internal Green Green Red 10 External Green Red Red 12 Internal Green Green Red 12 External Green Red Red 14 Internal Green Green Red 14 External Green Red Red
(Note: Operational Availability = .75 and the payload is all internal or all external, but not both. Green means can achieve daily re-supply requirements; Red means cannot achieve requirements)
Table XX-12: Capability Matrix for Conceptual Aviation Assets at 250 NM
275 NM Cycle Time Payload 1 DOS 2 DOS 3 DOS
10 Internal Green Green Red 10 External Red Red Red 12 Internal Green Green Red 12 External Green Red Red 14 Internal Green Green Red 14 External Green Red Red
(Note: Operational Availability = .75 and the payload is all internal or all external, but not both. Green means can achieve daily re-supply requirements; Red means cannot achieve requirements)
Table XX-13: Capability Matrix for Conceptual Aviation Assets at 275 NM

XX-34
Conceptual Aviation Assets Total Internal Load Capacity
(96) MV-22 & (24) Heavy Lift Aircraft10-Hour Operating Time
0200400600800
1000120014001600
107 101 95 90 83 77 71 65 60
0.9 0.85 0.8 0.75 0.7 0.65 0.6 0.55 0.5
Fully Mission Capable Base on Operational Availability
To
tal T
on
s D
eliv
ered
Per
D
ay 225nm250nm
275nm
1 DOS
2 DOS3 DOS
FMC
Ao
Figure XX-14: Comparison Between Conceptual Throughput to Days of Supply for an Internal Load at 10-Hour Operating Time
Conceptual Aviation Assets Total External Load Capacity
(96) MV-22 & (24) Heavy Lift Aircraft10-Hour Operating Time
0200400600800
1000120014001600
107 101 95 90 83 77 71 65 60
0.9 0.85 0.8 0.75 0.7 0.65 0.6 0.55 0.5
Fully Mission Capable Base on Operational Availability
To
tal T
on
s D
eliv
ered
Per
Day
225nm
250nm
275nm
1 DOS2 DOS
3 DOS
FMC
Ao
Figure XX-15: Comparison Between Conceptual Throughput to Days of Supply
for an External Load at 10-Hour Operating Time
XX-35
Conceptual Aviation Assets Total Internal Load Capacity
(96) MV-22 & (24) Heavy Lift Aircraft12-Hour Operating Time
0
500
1000
1500
2000
107 101 95 90 83 77 71 65 60
0.9 0.85 0.8 0.75 0.7 0.65 0.6 0.55 0.5
Fully Mission Capable Base on Operational Availability
To
tal T
on
s D
eliv
ered
Per
D
ay 225nm
250nm
275nm1 DOS
2 DOS
3 DOSFMC
Ao
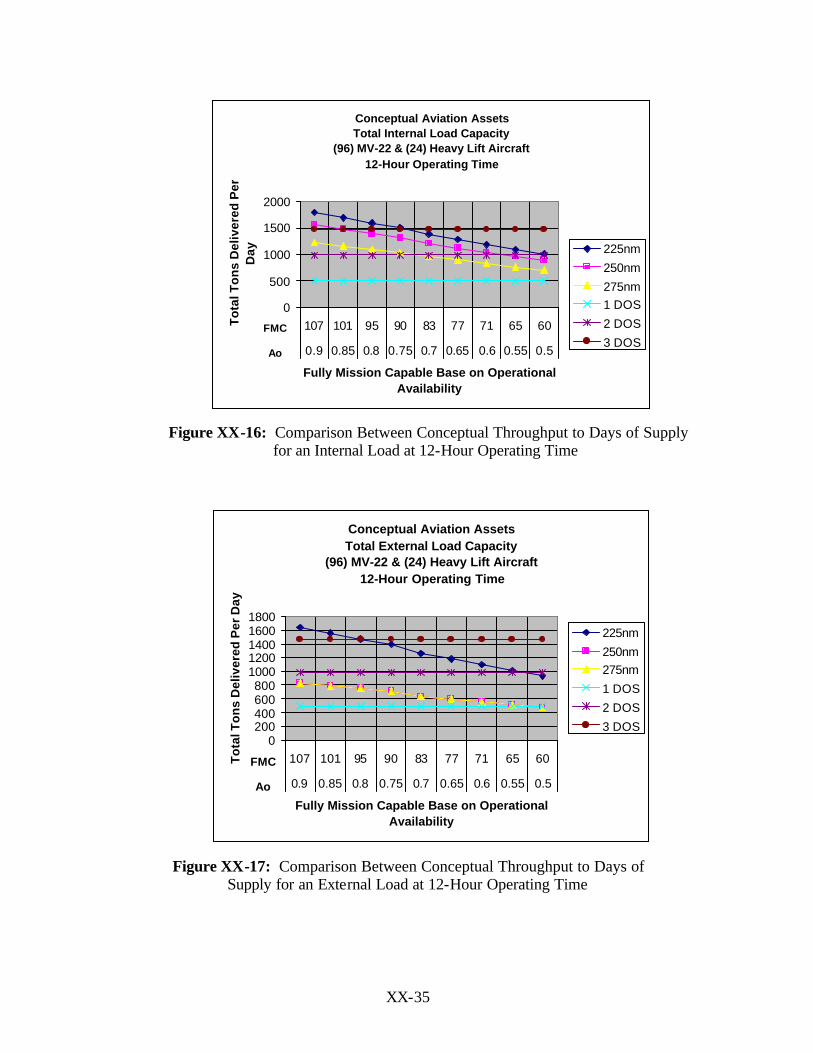
Figure XX-16: Comparison Between Conceptual Throughput to Days of Supply for an Internal Load at 12-Hour Operating Time
Conceptual Aviation Assets Total External Load Capacity
(96) MV-22 & (24) Heavy Lift Aircraft12-Hour Operating Time
0200400600800
10001200140016001800
107 101 95 90 83 77 71 65 60
0.9 0.85 0.8 0.75 0.7 0.65 0.6 0.55 0.5
Fully Mission Capable Base on Operational Availability
To
tal T
on
s D
eliv
ered
Per
Day
225nm
250nm275nm
1 DOS
2 DOS
3 DOS
FMC
Ao
Figure XX-17: Comparison Between Conceptual Throughput to Days of
Supply for an External Load at 12-Hour Operating Time

XX-36
Conceptual Aviation Assets Total Internal Load Capacity
(96) MV-22 & (24) Heavy Lift Aircraft14-Hour Operating Time
0
500
1000
1500
2000
2500
107 101 95 90 83 77 71 65 60
0.9 0.85 0.8 0.75 0.7 0.65 0.6 0.55 0.5
Fully Mission Capable Base on Operational Availability
To
tal T
on
s D
eliv
ered
Per
D
ay 225nm250nm
275nm
1 DOS
2 DOS3 DOS
FMC
Ao
Figure XX-18: Comparison Between Conceptual Throughput to Days of Supply for an Internal Load at 14-Hour Operating Time
Conceptual Aviation Assets Total External Load Capacity
(96) MV-22 & (24) Heavy Lift Aircraft14-Hour Operating Time
0
500
1000
1500
2000
107 101 95 90 83 77 71 65 60
0.9 0.85 0.8 0.75 0.7 0.65 0.6 0.55 0.5
Fully Mission Capable Base on Operational Availability
To
tal T
on
s D
eliv
ered
Per
Day
225nm
250nm275nm
1 DOS
2 DOS
3 DOS
FMC
Ao
Figure XX-19: Comparison Between Conceptual Throughput to Days of
Supply for an External Load at 14-Hour Operating Time

XX-37
Table XX-14: Heavy Lift Aircraft and MV-22 Throughput at a 10-Hour Operating Time (shorts tons)
Table XX-14 is one of 12 different tables listed in Appendix 20-4. This table
represents the total tons delivered per day for both the Heavy Lift Aircraft with an
external load and the MV-22 with an internal load. Appendix 20-4 has the following
tables at 10-hour, 12-hour, and 14-hour operating times: External Load – Heavy Lift
Aircraft and Internal Load MV-22, External Load – Heavy Lift Aircraft and External
Load MV-22, Internal Load – Heavy Lift Aircraft and External Load MV-22, and
Internal Load – Heavy Lift Aircraft and Internal Load MV-22. The External Load –
Heavy Lift Aircraft and the Internal Load – MV22 provides the greatest throughput
capability for all three different operating times, whereas, the Internal Load – Heavy Lift
Aircraft and the External Load – MV22 provides the least throughput capability for all
three different operating times. The difference between the greatest and the least
21 20 19 18 16 15 14 13 12 21 20 19 18 16 15 14 13 12 21 20 19 18 16 15 14 13 12
225 225 225 225 225 225 225 225 225 250 250 250 250 250 250 250 250 250 275 275 275 275 275 275 275 275 2751103 1050 998 945 840 788 735 683 630 827 788 748 709 630 591 551 512 473 827 788 748 709 630 591 551 512 473
86 225 1204 2307 2254 2202 2149 2044 1992 1939 1887 1834 2031 1992 1952 1913 1834 1795 1755 1716 1677 2031 1992 1952 1913 1834 1795 1755 1716 167781 225 1134 2237 2184 2132 2079 1974 1922 1869 1817 1764 1961 1922 1882 1843 1764 1725 1685 1646 1607 1961 1922 1882 1843 1764 1725 1685 1646 1607
76 225 1064 2167 2114 2062 2009 1904 1852 1799 1747 1694 1891 1852 1812 1773 1694 1655 1615 1576 1537 1891 1852 1812 1773 1694 1655 1615 1576 1537
72 225 1008 2111 2058 2006 1953 1848 1796 1743 1691 1638 1835 1796 1756 1717 1638 1599 1559 1520 1481 1835 1796 1756 1717 1638 1599 1559 1520 148167 225 938 2041 1988 1936 1883 1778 1726 1673 1621 1568 1765 1726 1686 1647 1568 1529 1489 1450 1411 1765 1726 1686 1647 1568 1529 1489 1450 1411
62 225 868 1971 1918 1866 1813 1708 1656 1603 1551 1498 1695 1656 1616 1577 1498 1459 1419 1380 1341 1695 1656 1616 1577 1498 1459 1419 1380 134157 225 798 1901 1848 1796 1743 1638 1586 1533 1481 1428 1625 1586 1546 1507 1428 1389 1349 1310 1271 1625 1586 1546 1507 1428 1389 1349 1310 1271
52 225 728 1831 1778 1726 1673 1568 1516 1463 1411 1358 1555 1516 1476 1437 1358 1319 1279 1240 1201 1555 1516 1476 1437 1358 1319 1279 1240 120148 225 672 1775 1722 1670 1617 1512 1460 1407 1355 1302 1499 1460 1420 1381 1302 1263 1223 1184 1145 1499 1460 1420 1381 1302 1263 1223 1184 1145
86 250 1125 2227 2175 2122 2070 1965 1912 1860 1807 1755 1952 1912 1873 1834 1755 1716 1676 1637 1597 1952 1912 1873 1834 1755 1716 1676 1637 159781 250 1059 2162 2109 2057 2004 1899 1847 1794 1742 1689 1886 1847 1808 1768 1689 1650 1611 1571 1532 1886 1847 1808 1768 1689 1650 1611 1571 1532
76 250 994 2097 2044 1992 1939 1834 1782 1729 1677 1624 1821 1782 1742 1703 1624 1585 1545 1506 1467 1821 1782 1742 1703 1624 1585 1545 1506 146772 250 942 2044 1992 1939 1887 1782 1729 1677 1624 1572 1769 1729 1690 1651 1572 1532 1493 1454 1414 1769 1729 1690 1651 1572 1532 1493 1454 1414
67 250 876 1979 1926 1874 1821 1716 1664 1611 1559 1506 1703 1664 1624 1585 1506 1467 1428 1388 1349 1703 1664 1624 1585 1506 1467 1428 1388 1349
62 250 811 1913 1861 1808 1756 1651 1598 1546 1493 1441 1638 1598 1559 1520 1441 1402 1362 1323 1283 1638 1598 1559 1520 1441 1402 1362 1323 128357 250 746 1848 1796 1743 1691 1586 1533 1481 1428 1376 1572 1533 1494 1454 1376 1336 1297 1257 1218 1572 1533 1494 1454 1376 1336 1297 1257 1218
52 250 680 1783 1730 1678 1625 1520 1468 1415 1363 1310 1507 1468 1428 1389 1310 1271 1231 1192 1153 1507 1468 1428 1389 1310 1271 1231 1192 115348 250 628 1730 1678 1625 1573 1468 1415 1363 1310 1258 1455 1415 1376 1337 1258 1218 1179 1140 1100 1455 1415 1376 1337 1258 1218 1179 1140 1100
86 275 789 1892 1839 1787 1734 1629 1577 1524 1472 1419 1616 1577 1538 1498 1419 1380 1341 1301 1262 1616 1577 1538 1498 1419 1380 1341 1301 126281 275 744 1846 1794 1741 1689 1584 1531 1479 1426 1374 1570 1531 1492 1452 1374 1334 1295 1255 1216 1570 1531 1492 1452 1374 1334 1295 1255 1216
76 275 698 1800 1748 1695 1643 1538 1485 1433 1380 1328 1525 1485 1446 1406 1328 1288 1249 1210 1170 1525 1485 1446 1406 1328 1288 1249 1210 117072 275 661 1763 1711 1658 1606 1501 1448 1396 1343 1291 1488 1448 1409 1370 1291 1252 1212 1173 1133 1488 1448 1409 1370 1291 1252 1212 1173 1133
67 275 615 1718 1665 1613 1560 1455 1403 1350 1298 1245 1442 1403 1363 1324 1245 1206 1166 1127 1088 1442 1403 1363 1324 1245 1206 1166 1127 108862 275 569 1672 1619 1567 1514 1409 1357 1304 1252 1199 1396 1357 1317 1278 1199 1160 1120 1081 1042 1396 1357 1317 1278 1199 1160 1120 1081 1042
57 275 523 1626 1573 1521 1468 1363 1311 1258 1206 1153 1350 1311 1271 1232 1153 1114 1075 1035 996 1350 1311 1271 1232 1153 1114 1075 1035 996
52 275 477 1580 1527 1475 1422 1317 1265 1212 1160 1107 1304 1265 1225 1186 1107 1068 1029 989 950 1304 1265 1225 1186 1107 1068 1029 989 95048 275 441 1543 1491 1438 1386 1281 1228 1176 1123 1071 1268 1228 1189 1149 1071 1031 992 953 913 1268 1228 1189 1149 1071 1031 992 953 913
External Load -- Heavy Lift Aircraft
I
nter
nal L
oad
-- M
V-2
2

XX-38
throughput ranges from 100 to 500 total tons delivered, depending on the number of
aircraft available, distance, and operating time.
The tables in Appendix 20-4 are very user friendly. First, select the operating
time of interest -- 10-hours, 12-hours, or 14-hours. Second, select the payloads of interest
for the Heavy Lift Aircraft and the MV-22 -- internal or external load. Third, select the
number of fully mission capable aircraft. The Conceptual Sea Base has 96 MV-22s and
24 Heavy Lift Aircraft. Typically, not all aircraft are available for daily operations
because of scheduled maintenance, unscheduled maintenance, and logistical delays.
Fully mission capable aircraft are computed by multiplying the operational availability by
the total numbered of aircraft – example 96 times .9 equals 86. The following table
represents the fully mission capable aircraft based on the different operational
availabilities.
Ao .9 .85 .8 .75 .7 .65 .6 .55 .5
HLA 21 20 19 18 16 15 14 13 12
MV-22 86 81 76 72 67 62 57 52 48
Table XX-15: Fully Mission Capable Heavy Lift Aircraft and MV-22s
In Table XX-14, the light blue vertical column represents the fully mission
capable aircraft for the MV-22 with an internal load. The light blue horizontal row
represents the fully mission capable aircraft for the Heavy Lift Aircraft with an external
load. Fourth, select a distance of interest – 225, 250, or 275 NM. The green horizontal
and vertical lines represent the three distances. The highlighted yellow rectangles
represent the same distances for both the Heavy Lift Aircraft and the MV-22. Fifth, after
selecting the fully mission capable aircraft for both the Heavy Lift and the MV-22 and
the distance move horizontally across and vertically down until the two meet. The
intersection is the throughput capacity (STs delivered per day). Table XX-16 illustrates
how to find the throughput capability for following: Operating Time – 12-hours, 18
Heavy Lift Aircraft with external loads, 72 MV-22s with internal load, and distance from
Sea Base to Objective equals 225 NM. The total throughput capability equals 1953 STs.
1953 STs is approximately four times the daily sustainment requirement (490 ST) for a
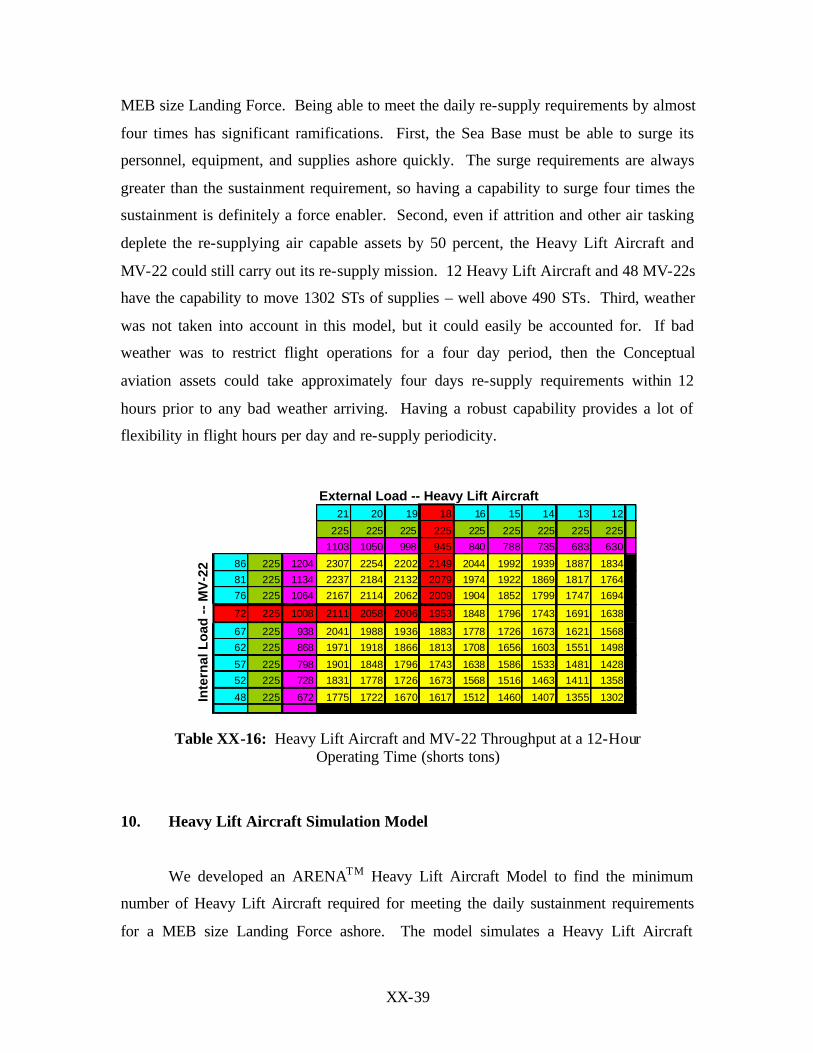
XX-39
MEB size Landing Force. Being able to meet the daily re-supply requirements by almost
four times has significant ramifications. First, the Sea Base must be able to surge its
personnel, equipment, and supplies ashore quickly. The surge requirements are always
greater than the sustainment requirement, so having a capability to surge four times the
sustainment is definitely a force enabler. Second, even if attrition and other air tasking
deplete the re-supplying air capable assets by 50 percent, the Heavy Lift Aircraft and
MV-22 could still carry out its re-supply mission. 12 Heavy Lift Aircraft and 48 MV-22s
have the capability to move 1302 STs of supplies – well above 490 STs. Third, weather
was not taken into account in this model, but it could easily be accounted for. If bad
weather was to restrict flight operations for a four day period, then the Conceptual
aviation assets could take approximately four days re-supply requirements within 12
hours prior to any bad weather arriving. Having a robust capability provides a lot of
flexibility in flight hours per day and re-supply periodicity.
Table XX-16: Heavy Lift Aircraft and MV-22 Throughput at a 12-Hour
Operating Time (shorts tons)
10. Heavy Lift Aircraft Simulation Model
We developed an ARENATM Heavy Lift Aircraft Model to find the minimum
number of Heavy Lift Aircraft required for meeting the daily sustainment requirements
for a MEB size Landing Force ashore. The model simulates a Heavy Lift Aircraft
21 20 19 18 16 15 14 13 12
225 225 225 225 225 225 225 225 225
1103 1050 998 945 840 788 735 683 630
86 225 1204 2307 2254 2202 2149 2044 1992 1939 1887 1834
81 225 1134 2237 2184 2132 2079 1974 1922 1869 1817 1764
76 225 1064 2167 2114 2062 2009 1904 1852 1799 1747 1694
72 225 1008 2111 2058 2006 1953 1848 1796 1743 1691 1638
67 225 938 2041 1988 1936 1883 1778 1726 1673 1621 1568
62 225 868 1971 1918 1866 1813 1708 1656 1603 1551 1498
57 225 798 1901 1848 1796 1743 1638 1586 1533 1481 1428
52 225 728 1831 1778 1726 1673 1568 1516 1463 1411 1358
48 225 672 1775 1722 1670 1617 1512 1460 1407 1355 1302Inte
rnal
Lo
ad -
- M
V-2
2
External Load -- Heavy Lift Aircraft

XX-40
carrying an internal or external load at either 225, 250, or 275 NM for a 12-hour flight
day. Each X-Ship uses 4 of its 16 spots to conduct flight operations, utilizing two spots
forward and two spots aft on either side of the X-Ship. The center flight spots remains
clear for Joint Strike Fighters. MREs, ammunition, and spare parts are palletized and
transferred to the flight spot when requested by a forklift. Assume the transfer for the
forklift is a uniform distribution -- two to four minutes. After the cargo is transferred to
the Heavy Lift Aircraft, it is loaded internally or externally. The Heavy Lift Aircraft has
the capacity to carry eight pallets of any type – MREs, ammunition, or spare parts and
other. The quadruple container (QUADCON) can carry two pallets per QUADCON for a
total eight pallets per container equivalent. Water and fuel are pumped into 500-gallon
bladders for external loads and 800-gallon internal tanks for internal loads. The
following table summarizes the internal lift capacity for the Heavy Lift Aircraft.
Internal Lift Capacity of the Heavy Lift Aircraft
Short Tons Pounds
Approx
Weight of
Pallet
Pounds
Weight
800 Gallon
Tank
Pounds
Pallets or
800 Gallon
Tanks
Required
Per Day
Carrying
Capacity
MREs 15 30,000 1,000 30 8
Water 190 380,000 6,400 60 3
Fuel 225 450,000 5,440 83 3
Ammo 33.5 67,000 2,500 27 8
Spares and
Others 26.5 53,000 2,000 27 8
Note: Water is assumed to be 8lbs per gallon and fuel is assumed to be 6.8lbs per gallon.
Table XX-17: Internal Lift Capacity of the Heavy Lift Aircraft

XX-41
External Lift Capacity of the Heavy Lift Aircraft
Short Tons Pounds
Approx
Weight of
Pallet
Pounds
Weight
500 Gallon
Bladders
Pounds
Pallets or
500 Gallon
Bladders
Required
Per Day
Carrying
Capacity
MREs 15 30,000 1,000 30 8
Water 190 380,000 4,000 95 6
Fuel 225 450,000 3,400 133 6
Ammo 33.5 67,000 2,500 27 8
Spares and
Others 26.5 53,000 2,000 27 8
Note: Water is assumed to be 8lbs per gallon and fuel is assumed to be 6.8lbs per gallon.
Table XX-18: External Lift Capacity of the Heavy Lift Aircraft
The loading and unloading times for internal loads are assumed to be a uniform
distribution -- eighteen to twenty-five minutes: whereas, the loading and unloading times
for external loads are shorter -- four to six minutes. The Heavy Lift Aircraft can load
while refueling, but an additional 20 minutes was allotted to account for unexpected
problems and longer refueling times. The travel time from the Sea Base to the Objective
depends on the payload and the range. Table XX-19 shows the travel times as triangular
distributions (minimum, most likely, maximum).
Sea Base to Objective Range
Internal Load External Load Objective to Sea Base
225 (60,61,66) (67,68,73) (80,81,86)
250 (67,68,73) (74,75,80) (87,88,93)
275 (73,74,79) (82,83,88) (93,94,99)
Table XX-19: Heavy Lift Aircraft Flight Times

XX-42
Utilizing the process analyzer embedded within the ARENATM software program,
the simulation runs were set to determine the minimum number of Heavy Lift Aircraft.
Thirty replications of six individual runs were simulated with the following shown in
Table XX-20.
Recommended Minimum Number of HLAs
Distance Internal External
225 NM 20 13
250 NM 20 13
275 NM 20 17
(Note: Base on a 12-Hour Operating Time (Flight Day) )
Table XX-20: Minimum Number of Heavy Lift Aircraft to re-supply a MEB
H. PROTECTION OF THE SEA BASE
1. Protecting the Sea Base
The Sea Base is a transformational concept that exploits the safer sanctuary
offered by the sea and eliminates the attendant risk associated with a current stationary
logistics base ashore in conducting expeditionary operations. While a Sea Base is mobile
and can maneuver according to the dynamic disposition of enemy forces, thus presenting
itself as a relatively harder target to hit than a stationary target like an ashore logistical
base generally referred to as the “Iron Mountain”, it is not free from concerted enemy
attacks. A stand-off Sea Base while relatively safer than its predecessors ashore, is itself
still a key lucrative node or a set of nodes (represented by the Sea Base distributed among
the collection of amphibious and logistics ships) among the inter-related set of Naval
ExWar capability components, which is vulnerable to specific attacks by a capable
enemy.
This section is devoted to investigating the protection needs of the Sea Base, the
composition of protection escorts for the amphibious task force and subsequently the
force sustaining effort of the Sea Based collection of ships, and finally the self-defensive
capabilities of the component Sea Based ships. It is recognized in Naval Expeditionary

XX-43
Warfare: Decisive Power, Global Reach (Dept of Navy, July, 2002) that amphibious
ships and the ir associated logistics ships must not only be able to protect themselves, but
they must also contribute to the collective defense of an amphibious force and a CSG.
The future Sea Base will have not only an effective self-defense capability, but also some
notable offensive capabilities.
The protection of the Sea Base can be viewed as the individual self-defensive
capabilities of each ship and their inherent offensive capabilities or the offensive
capabilities of the assets carried by the Sea Based ships which can be relied upon in
protecting the overall Sea Base, such as the aircraft carried onboard the amphibious ships.
The vulnerability of the Sea Base can be classified according to the phases of the
operation: from transit to the area of operations, at the assembly area, at the launch area,
at the eventual sustainment location, and finally at the re-constitution or re-deployment
location before moving onwards to a new crisis region. The specific threats can be
classified into five broad categories: namely, (1) air threat in the form of aircraft and
missiles, (2) surface threat from surface combatants and their associated anti-ship
missiles or land-based anti-ship missile threats, (3) underwater threat in the form of
submarines and their torpedoes, (4) mine warfare threat, and finally (5) the asymmetric
threat such as terrorist and suicide attacks by small fast crafts.
In general, the Sea Base is expected to operate under the protective cover of the
CSG. However, the Sea Base and the NESG may in the future be entrusted with a more
autonomous role without the protective cover of the CSG since the amphibious ships will
have organic JSF, surveillance helicopters, and UAVs that can assume some limited
protective roles. There may also be occasions when the NESG is urgently needed to
arrive on scene of the crisis area well before the CSG arrives. It is under such
circumstances that the organic self-defense and limited offensive capabilities of the
NESG are crucial in determining the level of defensive capabilities required to meet the
anticipated future threats.
Hence, to investigate the organic defensive capabilities of the Sea Based
architectures, the analysis assumed the Sea Base is operating without the cover of the
CSG. To equalize this imbalance, we will not examine the air threat in terms of enemy
ship strike aircraft, sub-surface threats such as submarine, the area denial threat of mines,

XX-44
and asymmetric threats posed by terrorists. The investigative analysis focuses primarily
on surface threats, mainly ship-borne anti-ship missiles and naval gun- fire. As a further
excursion, land based mobile anti-ship cruise missiles are added to assess the impact on
the NESG.
2. Objectives of the Study of the Protection of the Sea Base
We layout an analysis tool that is applicable for future dynamic simulation
investigations on the force protection structure for sea based forces in future ExWar. The
novel approach we explored uses an agent based simulation model called EINSTein,
which stands for Enhanced ISAAC Neural Simulation Toolkit. EINSTein was originally
developed for land warfare but was later adapted for maritime use by Center for Naval
Analysis. A more detailed description of EINSTein is given in the subsequent sections.
Our exclusion of the subsur face and air threats is also partly due to the current
limitation of the EINSTein model for effectively emulating these threat and capabilities.
Our approach is to determine a minimum protection force level to ensure at least 80%
survivability of a MEB-sized Sea Based NESG, and to make a comparative evaluation of
the different ExWar Architectures. By substituting or adding to the protection force an
incremental number of CGs, DDGs and FFGs with the future Littoral Combat Ship, we
will make our comparative analyses.
From this exploratory effort using EINSTein, we show that valuable insights into
the refinements needed for the various architectures in terms of defensive capabilities and
minimum level of protection escort ships for the Sea Based can be distilled. This first
attempt is a stepping-stone to subsequent iterative systems engineering, integration and
analysis effort on force protection issues concerning ExWar.
3. The EINSTein Model
EINSTein (Enhanced ISAAC Neural Simulation Toolkit) is an agent-based
simulation tool that served as an artificial- life laboratory for exploring self-organized
emergence in land combat. The simulation, originally designed to model small unit

XX-45
ground combat, was written by Andrew Ilachinski and modified by Greg Cox of the
Center for Naval Analysis for use in maritime warfare. Dr. Cox first introduced
EINSTein to NPS students when he was a guest lecturer in a Joint Campaign Analysis
class in early 2002. EINStein represents the first systematic attempt, within the military
operations research community, to simulate combat -- on a small to medium scale -- by
using autonomous agents to model individual behaviors and personalities rather than
specific weapons. The agents are all endowed with rudimentary form of “intelligence”
and can respond to a very large class of changing conditions as they evolve during battle.
Each ship type in the NESG is created as a distinct agent with accompanying personality
attributes in terms of aggressiveness or affinity towards staying around friendly or
pursuing enemy agents, different movement speeds, sensor and weapon ranges,
simultaneous engagements, weapon system kill probability and ability to absorb hits, i.e.
soft or hard kill incoming enemy missiles. This is that adaptation initiated by Dr. Cox
and introduced to the NPS students during the Joint Campaign Analysis class. More
details in the features and capabilities can be found in the EINSTein: An Artificial-Life
Laboratory for for Exploring Self- Organized Emergence in Land Combat Beta-Test
User’s Guide (U).
The relative simplicity of the underlying dynamical rules of EINSTein allows for
rapid outcomes for a wide spectrum of tunable parameter values defining specific
scenarios to be extracted, and it can thus be used to effectively map out the space of
possible behaviors and provide insights of the collective emergent behaviors of the task
force.
Following the initial exploratory work in NPS as introduced by Dr Cox in the
NPS Joint Campaign Analysis Class, CAPT Jeff Kline adapted and expanded the effort
by applying EINSTein in subsequent Joint Campaign Analysis Classes. As part of the
campus-wide integrating project effort on ExWar, CAPT Kline further introduced
EINSTein to the System Engineering and Integration-3 students in a specifically designed
SI3900 class to equip students with applied methods of operations analysis to military
tactical operations and warfare for the ExWar Project.
Our work here is an exploratory application to apply EINSTein to investigate the
specific protection of the Sea Base. It is a continuation effort from an earlier two-man

XX-46
sub-team study to adapt EINSTein for the comparative study on the protection needs of
the NESG. The methodology adopted here also refers to the “Exploratory Evaluation of
the Littoral Combat Ship in an Expeditionary Littoral Environment” conducted by the
earlier NPS Joint Campaign Analysis class.
4. Agent-Based Modeling and Simulation
Agent-based simulations of complex adaptive systems are becoming increasingly
popular as a practical and theoretical tool to explore the global behavior of very
complicated systems. It is predicated that such global behavior is derived collectively
from simpler, low-level interactions among constituent agents. Insights about the real-
world system can then be gained by looking at the emergent structures induced by the
interaction processes taking place within the simulation.
In modeling combat, agent-based simulation is a fundamental shift from simple
force-on-force attrition calculations towards a process of examining how complex, high
level properties and behaviors of combat emerge out of lower level rules of behaviors and
interactions which themselves may also sometimes be evolving. According to Ilachinski,
agent-based models focus on finding a set of low-level rules that defines the local
behaviors of individual agents. The collective actions of these agents determine the
dynamics of the whole system. It is this unique focus on the dynamics of the system-of-
systems that prompted the System Engineering and Integration study team to apply the
EINSTein model to explore the defensive needs of the ExWar architectures, particularly
the protection of the Sea Base. Here, the agents are the individual ship types that make
up the NESG, which also constitute the sea-based force. By appropriately assigning
attributes, behavior personalities, movement speed, sensors and weapon systems ranges,
probabilities of kill, abilities to absorb or neutralize missile hits through both soft or hard
kills measures, a representative collection of a task force of ships according to the desired
ExWar ship systems architectures can be modeled and studied. While it is recognized
that the assignment of the different parameter values of the individual agents will have an
impact on the results, it is noted that in comparing the effectiveness of the different
architectures, the importance is in assigning the appropriated relative strengths and

XX-47
weaknesses, rather than the precise capabilities since the architectures will be examined
across similar baselines.
5. The Analysis Approach
a. Problem Definition and Comparing the Various ExWar Architectures
The task is to investigate the protection requirements for a sea based ExWar
system-of-systems in terms of protection force level (Defense of the Sea Base in terms of
the numbers and type of escort ships needed) for a MEB size amphibious task force. The
investigation covers all three ExWar architectures being examined, namely:
(1) Current : Today’s ExWar force structure. This is based on a
combination of 9 amphibious ships consisting of 3 LPD-4, 3 LHD/LHA and 3 LSD-41
classes of ships supported by 6 MPS-type ships to make up a MEB-size NESG. In the
simulation model, different amphibious ship types are created separately according to
their capabilities and their expected behaviors in operations. In addition, under the
Current CONOPS, it is assumed that the enemy force attacks the MEB-size NESG at the
most vulnerable launch and supporting Sea Base area.
(2) Planned: The future ExWar force structure as programmed by the
Navy for 2015. The key components here are the inclusion of LHA(R), LPD-17 and the
MPF(F) as part of the amphibious assault and support force structures. It is assumed that
the entire MEB force arrives in the Area of Operations (AO) on 9 amphibious ships (3
LHA(R), 3 LSD-41 and 3 LPD-17) supported by 6 MPF(F)s.
(3) Conceptual: The TSSE and System Engineering and Integration students’
design of the future system-of-systems force structure solution to the ExWar problem.
Within this Conceptual Architecture design, there are two further variants, namely one
that includes legacy platforms as defined as Conceptual (With Legacy), consisting of 3
LSD-41, 3 LPD-17, 2 X-ships of the combat variant, 1 X-ship of the logistics variant, and
4 MPF(F) logistics ships; and the other completely replaced by the new X-ships design
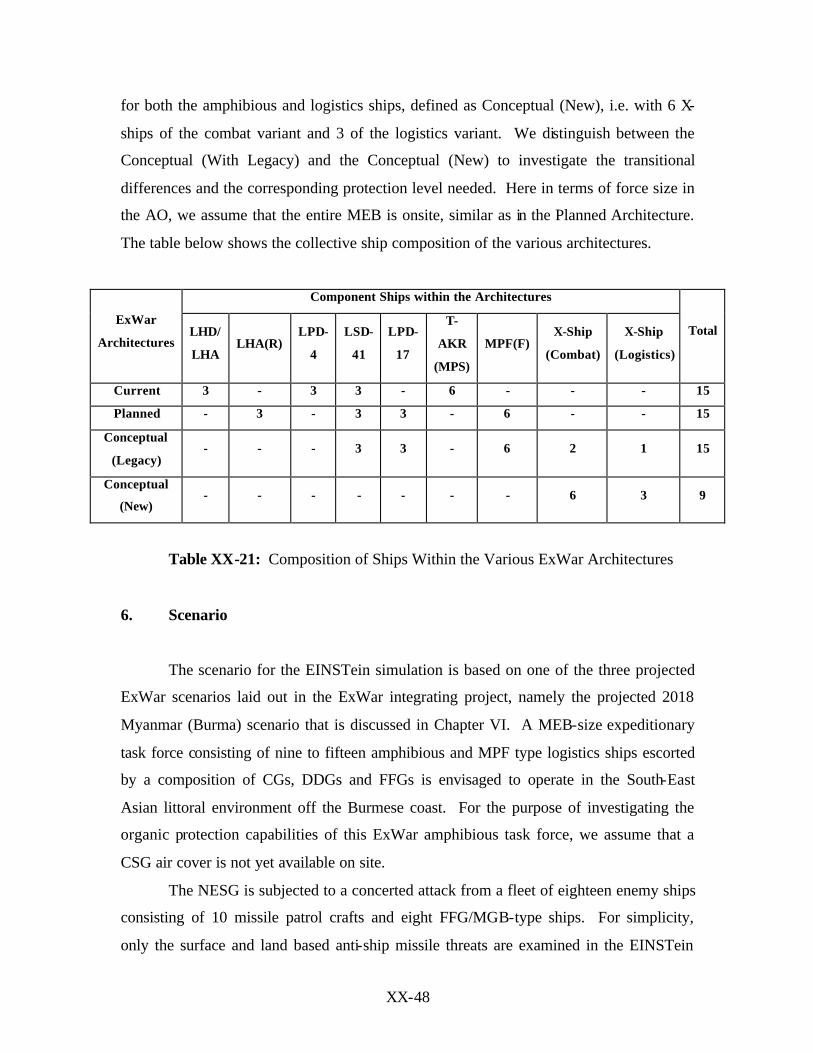
XX-48
for both the amphibious and logistics ships, defined as Conceptual (New), i.e. with 6 X-
ships of the combat variant and 3 of the logistics variant. We distinguish between the
Conceptual (With Legacy) and the Conceptual (New) to investigate the transitional
differences and the corresponding protection level needed. Here in terms of force size in
the AO, we assume that the entire MEB is onsite, similar as in the Planned Architecture.
The table below shows the collective ship composition of the various architectures.
Component Ships within the Architectures
ExWar
Architectures LHD/
LHA LHA(R)
LPD-
4
LSD-
41
LPD-
17
T-
AKR
(MPS)
MPF(F) X-Ship
(Combat)
X-Ship
(Logistics)
Total
Current 3 - 3 3 - 6 - - - 15
Planned - 3 - 3 3 - 6 - - 15
Conceptual
(Legacy) - - - 3 3 - 6 2 1 15
Conceptual
(New) - - - - - - - 6 3 9
Table XX-21: Composition of Ships Within the Various ExWar Architectures
6. Scenario
The scenario for the EINSTein simulation is based on one of the three projected
ExWar scenarios laid out in the ExWar integrating project, namely the projected 2018
Myanmar (Burma) scenario that is discussed in Chapter VI. A MEB-size expeditionary
task force consisting of nine to fifteen amphibious and MPF type logistics ships escorted
by a composition of CGs, DDGs and FFGs is envisaged to operate in the South-East
Asian littoral environment off the Burmese coast. For the purpose of investigating the
organic protection capabilities of this ExWar amphibious task force, we assume that a
CSG air cover is not yet available on site.
The NESG is subjected to a concerted attack from a fleet of eighteen enemy ships
consisting of 10 missile patrol crafts and eight FFG/MGB-type ships. For simplicity,
only the surface and land based anti-ship missile threats are examined in the EINSTein

XX-49
model. The air and subsurface threats are not considered in order to keep a focused
analysis on the Anti-Surface Warfare tactical scenario, since the protection of a CSG and
the escorting submarine and anti-submarine capabilities are not included in the analysis.
It is noted that while EINSTein can be adapted to simulate submarines and aircraft, the
effort was beyond the limited timeframe for the integrating project. Moreover, these
factors will complicate the investigation effort as the simulated submarine and aircraft
behaviors have yet to be thoroughly investigated and validated by earlier works on
EINSTein. A snapshot of the simulation of the Burmese scenario by EINSTein is shown
in Figure XX-20.
(Note: Blue indicates enemy ships and Red indicates Own Forces’ ExWar Ships. The Black dot shows the ExWar Assembly and Launch area. The terrain line indicates the Southern Burmese Coastline)
Figure XX-20: Snapshot of Burma Scenario for ExWar Simulation Run on EINSTein

XX-50
7. Caveats In understanding the acceptable boundary of the analysis, we note the following
caveats:
a. The limited project timeframe requires the team to have a very focused
simplified tactical scenario with single MOE.
b. EINSTein is used to both provide data and to evaluate agent-based
simulation in campaign analysis.
c. We use estimates for weapon ranges, sensor ranges, system Probability of
kill (P(k)), and the ability to conduct simultaneous engagements and the level of
defensive capabilities in terms of soft and hard kill of in-coming missiles before the
individual ship is damaged or destroyed. In particular, the figures are our best
professional judgment estimated according to the ship types and the projected future
capabilities and threat.
d. Cost estimates and evaluations are not included as this is an introductory
exploration using EINSTein. Such analysis would be further complicated by the limited
information on the full life-cycle costs for the different architectures being investigated.
(Cost comparison options using EINSTein can certainly be undertaken if the preliminary
findings proved to be useful.)
e. Time did not allow for adequate sensitivity analysis.
8. Measure of Effectiveness (MOE)
The MOE that we adopted is the percentage of the NESG (including escorts)
remaining unharmed after the engagement, based on 50-battle runs. We assessed that the
percentage of ships alive will be more indicative of the interrelated demands for the
preservation of the mixed elements of escorts for different roles like anti-air, anti-surface
and anti-sub and the amphibious and MPF-type logistics ships. We count the number of
escorts and amphibious or logistics ships unharmed, since the loss of escort ships will
impact not only protection from surface threats but will also degrade the layered defense
against air and sub-surface threats in the real world. As we have not examined the

XX-51
protection level to include air and sub-surface threats in the model, there needs to be a
buffer when considering the associated escorts required.
By setting the goal to achieve at least 80% of the NESG ships remaining
unharmed after the engagements, we have in fact factored in a buffer for the entire NESG
and provided for a defensive capacity to deal with the other threats not investigated here.
To assume a case of zero attrition for the amphibious or logistic ships will demand too
high an escort protection force level and can lead to unrealistic demands or over-
optimism in eventual force structural planning. In separate sampling runs for the model,
when at least 80% survival rates of the overall NESG is achieved, we note that there is at
most one amphibious or logistics ship damaged or destroyed, albeit relatively
infrequently. This observation from the model may indicate that in the expected real-
world case, the amphibious and logistics ships may still suffer some damage or losses in
operations despite having comprehensive protection. But most of the time (Out of 50
simulation runs) the losses in the EINSTein simulation runs are due to the smaller DDGs,
FFGs or LCSs.
9. Baseline Inputs and the Incremental Protection Force Level
We first establish a baseline defensive escort force of 1 CG, 1 DDGs and 1 FFGs
for each of the ExWar architectures against a baseline enemy force of 10 PCs and 8
FFGs. This baseline protection force is chosen arbitrarily to set a relative level for
comparison across the different architectures. From this baseline, incremental protection
force levels are added to achieve the set goal of at least 80% of the NESG alive and
unharmed. Various combinations of CG, DDG and FFG increases are investigated.
Substitution by LCSs is also explored. In summary, the representative approach in
applying incremental steps to meet the minimum 80% NESG survival goal can be
summarized as follows:
a. Add varying number of CG, DDG and FFG to the baseline protection
force.
b. Substitute and add LCSs to the baseline protection force.
c. Improve the offensive and defensive capabilities of the amphibious and
logistics ships

XX-52
10. Model Inputs
The inputs for the attributes of the individual ship types that make up the Current,
Planned, Conceptual (With Legacy) and Conceptual (New – All X-ships, without legacy
ships) Architecture in the EINSTein model are summarized in the tables below. Table
XX-22 to XX-25 capture the description, types, numbers, movement, staying power,
sensor and weapon ranges, the accompanying single shot probability of hit SSPHit) and
Table XX-22: Inputs for Various Current Architecture (Baseline) Agents – With 1 CG,
1 DDG and 1 FFG as Escorts
(simultaneous engagement capabilities of the collection of ships that make up the
Current, Planned, Conceptual (With legacy) and Conceptual (New- Without legacy ships)
respectively. The tables also included the baseline number of escort ships, namely 1 CG,
The Current Architecture MEB-Size NESG Baseline Numbers and Capabilities
Movement per Time Step
(Speed in tens of knots)
Staying Power (hard /soft kill of
enemy missile prior to leaker)
Sensor/Weapon Range
(Equivalent to nm)
SSPHit (No. of
Simultaneous Engagements)
Squad No.
Asset Type
No. Alive Injured Alive Injured Alive Injured Alive Injured
1 CG 1 3 1 3 1 30/15 15/10 0.5 (3)
0.5 (1)
2 LSD-41 3 1 1 1 1 25/5 15/5 0.3 (1)
0.2 (1)
3 DDG 1 3 1 2 1 30/15 12/10 0.5 (3)
0.5 (1)
4 FFG 1 2 1 2 1 25/12 10/8 0.5 (2)
0.5 (1)
5 MPS (T-
AKR) 6 1 1 1 1 20/1 15/1
0.1 (1)
0.05 (1)
6 Comms Net
0 0 0 99 99 99/0 99/0 0 (0)
0 (0)
7 LHA 3 1 1 2 1 30/15 15/8 0.5 (2)
0.3 (1)
8 LPD-4 3 1 1 1 1 25/5 15/5 0.3 (1)
0.2 (1)
9 LCS 0 4 1 1 1 30/15 15/5 0.5 (2)
0.5 (1)
Total No. of Ships
18

XX-53
1 DDG and 1 FFG, set arbitrarily for comparison. The baseline Current and Planned
Architecture MEB size NESG each consists of 18 ships (inclusive of the 3 escorts ships)
whereas the Conceptual (With Legacy ships)’s NESG is made up of 16 ships and the
Conceptual (New-All X-ship)’s NESG of 12 ships.
Table XX-23: Inputs for Various Planned Architecture (Baseline) Agents – With 1 CG, 1 DDG and 1 FFG as Escorts
The Planned Architecture’s NESG has improvements in terms of the amphibious
and logistics ships’ staying power, sensor and weapon ranges and effectiveness in terms
of SS PHit as compared to the Current Architecture’s NESG. The Conceptual (New)
amphibious and logistics ships represented by the X-Ships in both the combat and the
logistics variants constitute the ExWar structure with the most effective self-defensive
capabilities among the architectures.
The Planned Architecture MEB-Size NESG Baseline Numbers and Capabilities
Movement per Time Step
(Speed in tens of knots)
Staying Power (hard /soft kill of
enemy missile prior to leaker)
Sensor/Weapon Range
(Equivalent to nm)
SSPHit (No. of
Simultaneous Engagements)
Squad No.
Asset Type
No. Alive Injured Alive Injured Alive Injured Alive Injured
1 CG 1 3 1 3 1 30/15 15/10 0.5 (3)
0.5 (1)
2 LSD-41 3 1 1 2 1 30/10 15/5 0.5 (2)
0.3 (1)
3 DDG 1 3 1 2 1 30/15 12/10 0.5 (3)
0.5 (1)
4 FFG 1 2 1 2 1 25/12 10/8 0.5 (2)
0.5 (1)
5 MPF(F) 6 1 1 1 1 25/3 15/1 0.3 (1)
0.05 (1)
6 Comms Net
0 0 0 99 99 99/0 99/0 0 (0)
0 (0)
7 LHA(R) 3 1 1 3 1 45/15 15/10 0.5 (2)
0.3 (1)
8 LPD-17 3 1 1 2 1 30/10 15/5 0.3 (1)
0.2 (1)
9 LCS 0 4 1 1 1 30/15 15/5 0.5 (2)
0.5 (1)
Total No. of Ships
18
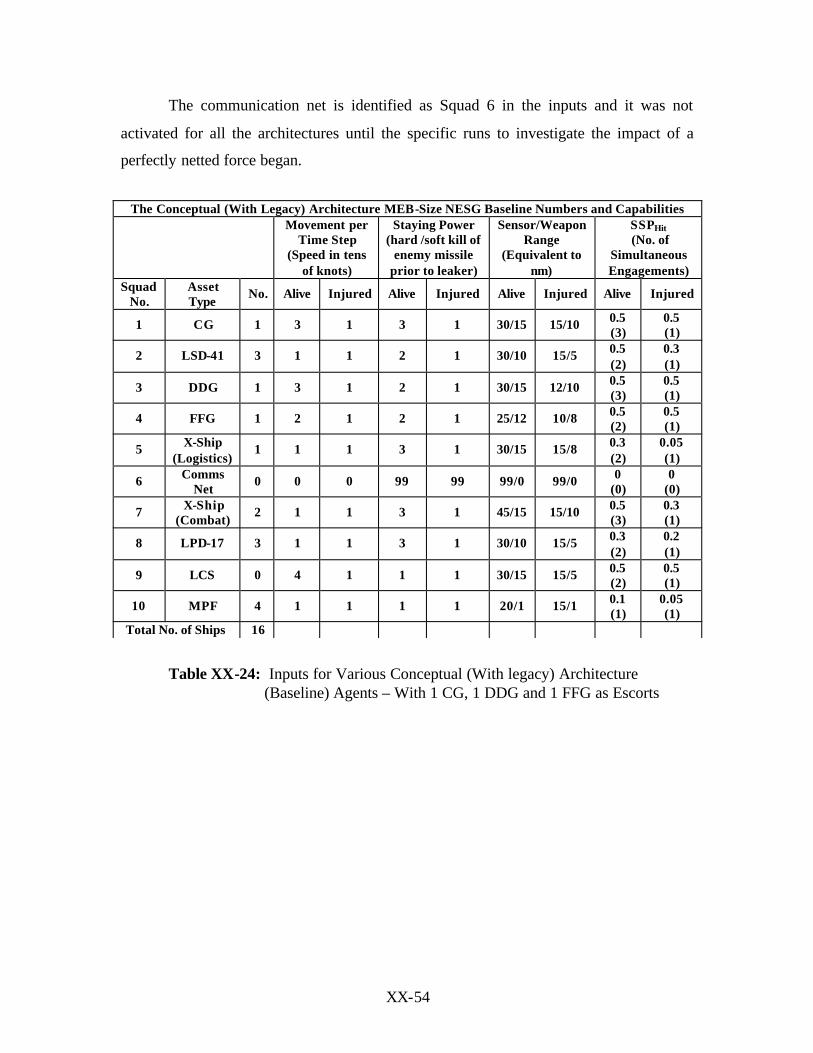
XX-54
The communication net is identified as Squad 6 in the inputs and it was not
activated for all the architectures until the specific runs to investigate the impact of a
perfectly netted force began.
Table XX-24: Inputs for Various Conceptual (With legacy) Architecture (Baseline) Agents – With 1 CG, 1 DDG and 1 FFG as Escorts
The Conceptual (With Legacy) Architecture MEB-Size NESG Baseline Numbers and Capabilities
Movement per Time Step
(Speed in tens of knots)
Staying Power (hard /soft kill of
enemy missile prior to leaker)
Sensor/Weapon Range
(Equivalent to nm)
SSPHit (No. of
Simultaneous Engagements)
Squad No.
Asset Type
No. Alive Injured Alive Injured Alive Injured Alive Injured
1 CG 1 3 1 3 1 30/15 15/10 0.5 (3)
0.5 (1)
2 LSD-41 3 1 1 2 1 30/10 15/5 0.5 (2)
0.3 (1)
3 DDG 1 3 1 2 1 30/15 12/10 0.5 (3)
0.5 (1)
4 FFG 1 2 1 2 1 25/12 10/8 0.5 (2)
0.5 (1)
5 X-Ship (Logistics)
1 1 1 3 1 30/15 15/8 0.3 (2)
0.05 (1)
6 Comms Net
0 0 0 99 99 99/0 99/0 0 (0)
0 (0)
7 X-Ship (Combat)
2 1 1 3 1 45/15 15/10 0.5 (3)
0.3 (1)
8 LPD-17 3 1 1 3 1 30/10 15/5 0.3 (2)
0.2 (1)
9 LCS 0 4 1 1 1 30/15 15/5 0.5 (2)
0.5 (1)
10 MPF 4 1 1 1 1 20/1 15/1 0.1 (1)
0.05 (1)
Total No. of Ships 16

XX-55
Table XX-25: Inputs for Various Conceptual (New – All X-Ships) Architecture (Baseline) Agents – With 1 CG, 1 DDG and 1 FFG as Escorts
The attributes of the enemy collection of ships, namely the PCs and FFG/MGB
are summarized in Table XX-26. The attributes of the agent representing the land-based
mobile anti-ship cruise missile (ASCM) battery are also included in the table. Here, the
ASCM battery will only be activated in the excursion investigation on the impact of the
ASCM on the ExWar operations.
Finally, the “Personality” weights of the various ExWar component ships and
assets are tabulated in Table XX-27. The weights are set for affinity to stick to alive
friend, alive foe, injured friend, injured foe, friend flag or foe flag when the agents are
alive (unharmed) or when they are injured.
The Conceptual (New) Architecture MEB-Size NESG Baseline Numbers and Capabilities
Movement per Time Step
(Speed in tens of knots)
Staying Power (hard /soft kill of
enemy missile prior to leaker)
Sensor/Weapon Range
(Equivalent to nm)
SSPHit (No. of
Simultaneous Engagements)
Squad No.
Asset Type
No. Alive Injured Alive Injured Alive Injured Alive Injured
1 CG 1 3 1 3 1 30/15 15/10 0.5 (3)
0.5 (1)
2 LSD-41 0 1 1 2 1 30/10 15/5 0.5 (2)
0.3 (1)
3 DDG 1 3 1 2 1 30/15 12/10 0.5 (3)
0.5 (1)
4 FFG 1 2 1 2 1 25/12 10/8 0.5 (2)
0.5 (1)
5 X-Ship (Logistics)
3 1 1 3 1 30/15 15/10 0.5 (2)
0.3 (1)
6 Comms Net
0 0 0 99 99 99/0 99/0 0 (0)
0 (0)
7 X-Ship (Combat)
6 1 1 3 1 45/15 15/10 0.5 (3)
0.3 (1)
8 LPD-17 0 1 1 3 1 30/10 15/5 0.3 (2)
0.2 (1)
9 LCS 0 4 1 1 1 30/15 15/5 0.5 (2)
0.5 (1)
Total No. of Ships 12

XX-56
Table XX-26: Inputs for Various Enemy Task Force Agents
ExWar NESG Component Ships’ Alive and Injured Personality Weights When Alive When Injured
Asset Type
To Alive Friend
To Alive Foe
To Injured Friend
To Injured
Foe
To Friend Flag
To Foe Flag
To Alive Friend
To Alive Foe
To Injured Friend
To Injured
Foe
To Friend Flag
To Foe Flag
CG 45 30 15 10 0 0 45 10 20 5 20 0 LSD-41 30 0 30 0 40 0 50 0 30 0 20 0
DDG 40 35 15 10 0 0 40 10 25 5 20 0 FFG 40 35 15 10 0 0 40 10 25 5 20 0
X-Ship (Logistics)
30 0 30 0 40 0 50 0 30 0 20 0
Comms Net
0 0 0 0 0 0 0 0 0 0 0 0
X-Ship (Combat)
30 0 30 0 40 0 50 0 30 0 20 0
LPD-17 30 0 30 0 40 0 50 0 30 0 20 0 LCS 40 30 15 15 0 0 35 15 20 10 20 0 LHA 30 0 30 0 40 0 50 0 30 0 20 0
LHA(R) 30 0 30 0 40 0 50 0 30 0 20 0 MPF 30 0 30 0 40 0 50 0 30 0 20 0
MPF(F) 30 0 30 0 40 0 50 0 30 0 20 0 (Note: Comms net is simulated as a stationary, indestructible agent and the personality weights are set to zero. The agent’s affinity to go towards the Foe Flag is also set to zero as it is NESG’s aim is to move towards and stay within the assembly and launch area which is designated as the Friend Flag position in the EINSTein model.)
Table XX-27: ExWar Agents’ Personality Weights
The corresponding “Personality” weights for the enemy agents are indicated in
Table XX-28. These weights determine the behavior of the agent ships in the scenario
The Enemy Ship Numbers and Capabilities
Movement per Time Step
(Speed in tens of knots)
Staying Power (hard /soft kill
of enemy missile prior to leaker)
Sensor/Weapon Range
(Equivalent to NM)
SSPHit (No. of
Simultaneous Engagements)
Squad No.
Asset Type
No. Alive Injured Alive Injured Alive Injured Alive Injured
1 PC 10 3 1 3 1 30/15 15/10 0.5 (3)
0.5 (1)
2 FFG/MGB 8 1 1 2 1 30/10 15/5 0.5 (2)
0.3 (1)
3-6 ASCM 0 0 0 2 1 45/35 1/1 0.4 (2)
0.1 (1)
Total No. of Ships 18

XX-57
runs in terms of how each of the ship types would generally behave under operational
conditions.
Enemy Component Ships’ Alive and Injured Personality Weights
When Alive When Injured
Asset Type
To Alive Friend
To Alive Foe
To Injured Friend
To Injured
Foe
To Friend Flag
To Foe Flag
To Alive Friend
To Alive Foe
To Injured Friend
To Injured
Foe
To Friend Flag
To Foe Flag
PC & FFG/MGB
10 30 10 25 0 25 30 0 20 25 10 25
Table XX-28: Enemy Agents’ Personality Weights
Additionally, the meta-personality weights and movement controls are not set as
more in-depth tactics and movement which are largely dependent on the tactical situation
the dynamic changes are not simulated in this limited excursion.
As far as possible, 50 simulation runs per set scenario were recorded and the raw
data captured using the inherent features. The mean value of the MOE and the upper and
lower 0.95 confidence level of the results were then extracted from the recorded data and
presented in the comparison graphical plots.
11. Summary of Results From The Baseline Protection Force Comparison
The comparative results from the baseline protection level analysis between the
ExWar Current, Planned and the two Conceptual variant Architectures are summarized in
the chart shown in Figure XX-21. The vertical axis is the fraction of the NESG
unharmed after the engagement and the horizontal axis depicts the different architectures.
Within each colored column, the plots of own and enemy forces unharmed or alive are
shown. The central blue diamond shape indicates the mean value from the 50 EINSTein
simulation runs and the upper and lower bars are the upper and lower 0.95 confidence
level indicators of the results. The plots clearly show that the baseline protection level of
1 CG, 1 DDG and 1 FFG is insufficient to achieve 80% of the NESG unharmed when
pitted against the collection of 18 enemy ships.

XX-58
Current
ExWar Task Force Various Architectures( With Baseline Defense – 1 CG, 1 DDG & 1 FFG)
vs 18 Enemy PC/FFG:Less than 60% Own Forces Remains Unharmed
Based on 50 “battles” in EinsteinPlanned Conceptual
(Legacy)
Own Enemy
0
0.1
0.2
0.3
0.4
0.5
0.6
0.7
0.8
0.9
1
Upper .95 CIAverageLower .95 CI
Own Enemy Own Enemy
Conceptual (New)
Own Enemy
Frac
tio
n o
f Fo
rces
Un
har
med
Figure XX-21: Comparative Results from the Baseline Protection Force
Analysis Among the Different Architectures.
Interestingly, with just the baseline protection, the Conceptual (New-with no
legacy ships) architecture suffers comparatively less attrition than the Current, Planned
and the Conceptual (with legacy ships) architectures. The Planned architecture also
seemed to be only marginally better than the Current. The Planned and the Conceptual
(with legacy) are almost comparable.
This difference is attributable to the enhanced defensive and offensive capabilities
of the X-ships in the Conceptual (New) Architecture. The X-ship agents are modeled on
the assumption that the X-ships will be equipped with sensors and weapon systems
comparable with those that are expected to be onboard a future upgraded CG or DDG,
though fewer in number of systems. Similarly, the X-ships’ organic defensive
capabilities are enhanced by both soft and hard kill systems which can absorb or
neutralize the equivalent number of incoming missiles that we expect a CG is capable of
handling. The relative offensive and defensive capabilities of the X-ship and CG of the
Conceptual (New) architecture are shown in Table XX-25.
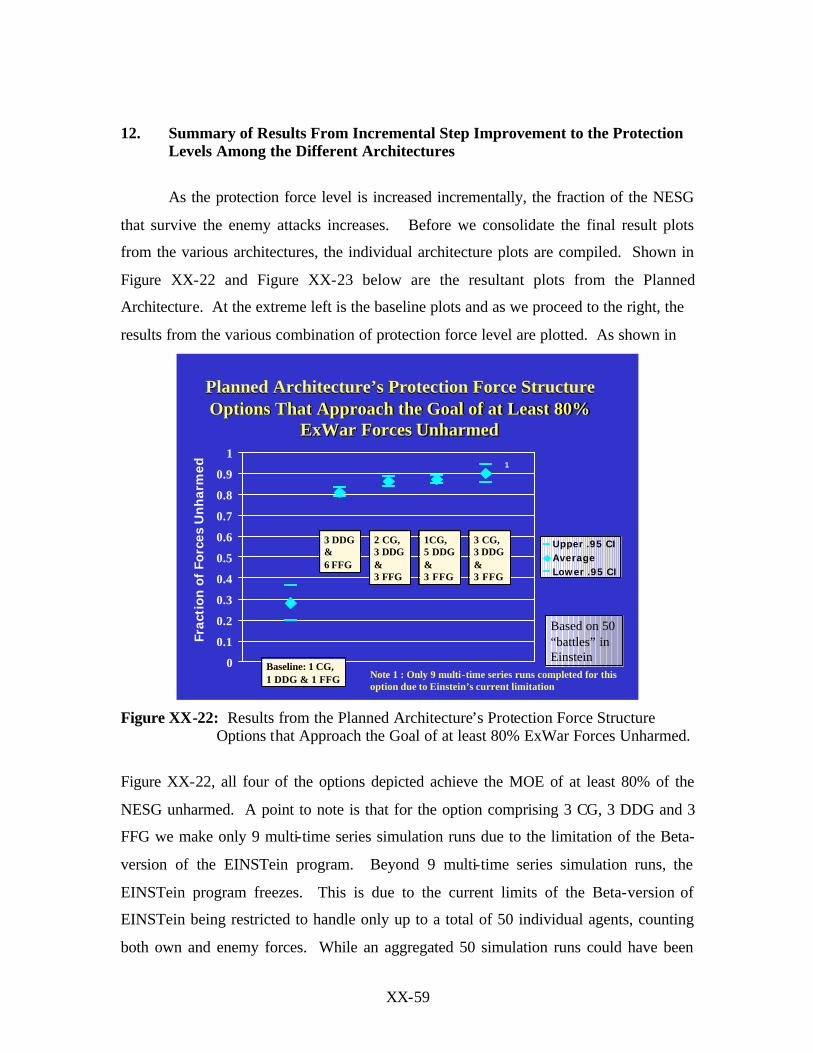
XX-59
12. Summary of Results From Incremental Step Improvement to the Protection Levels Among the Different Architectures
As the protection force level is increased incrementally, the fraction of the NESG
that survive the enemy attacks increases. Before we consolidate the final result plots
from the various architectures, the individual architecture plots are compiled. Shown in
Figure XX-22 and Figure XX-23 below are the resultant plots from the Planned
Architecture. At the extreme left is the baseline plots and as we proceed to the right, the
results from the various combination of protection force level are plotted. As shown in
Planned Architecture’s Protection Force Structure Planned Architecture’s Protection Force Structure Options That Approach the Goal of at Least 80% Options That Approach the Goal of at Least 80%
ExWarExWar Forces UnharmedForces Unharmed
0
0.1
0.2
0.3
0.4
0.5
0.6
0.7
0.8
0.9
1
Upper .95 CIAverageLower .95 CI
Based on 50 “battles” in Einstein
3 DDG & 6 FFG
2 CG, 3 DDG & 3 FFG
1CG, 5 DDG & 3 FFG
Baseline: 1 CG, 1 DDG & 1 FFG
3 CG, 3 DDG & 3 FFG
Frac
tio
n o
f Fo
rces
Un
har
med 1
Note 1 : Only 9 multi-time series runs completed for this option due to Einstein’s current limitation
Figure XX-22: Results from the Planned Architecture’s Protection Force Structure
Options that Approach the Goal of at least 80% ExWar Forces Unharmed.
Figure XX-22, all four of the options depicted achieve the MOE of at least 80% of the
NESG unharmed. A point to note is that for the option comprising 3 CG, 3 DDG and 3
FFG we make only 9 multi-time series simulation runs due to the limitation of the Beta-
version of the EINSTein program. Beyond 9 multi-time series simulation runs, the
EINSTein program freezes. This is due to the current limits of the Beta-version of
EINSTein being restricted to handle only up to a total of 50 individual agents, counting
both own and enemy forces. While an aggregated 50 simulation runs could have been

XX-60
achieved using a combination of 6 separate 9-multi-time series runs we did not pursued
this since only a relative indicative level is required in the comparison.
Next in Figure XX-23, the options are changed to combinations of CG and LCS;
DDG and LCS; and LCS only. Again, the limits of the EINSTein program are reached
whereby beyond having 10 LCSs, the simulation run freezes. Here, only the option of 3
DDG and 7 LCS can meet the MOE as stated.
Planned Architecture’s Protection Force Structure Planned Architecture’s Protection Force Structure Options That Approach the Goal of at Least 80% Options That Approach the Goal of at Least 80%
ExWarExWar Forces UnharmedForces Unharmed
0
0.1
0.2
0.3
0.4
0.5
0.6
0.7
0.8
0.9
1
Upper .95 CIAverageLower .95 CI
Based on 50 “battles” in Einstein
1 CG & 9 LCS
1 CG, 1 DDG & 8 LCS
3 DDG & 7 LCS
Baseline: 1 CG, 1 DDG & 1 FFG
10 LCS
Frac
tio
n o
f Fo
rces
Un
har
med
Figure XX-23: Results from the Planned Architecture’s Protection Force Structure
Options that Approach the Goal of at least 80% ExWar Forces Unharmed (Substitution by LCSs)
A similar approach of incremental step increase in protection level is applied to
all the architectures being investigated. The consolidated comparison results are plotted
in Figure XX-24 and Figure XX-25. The results from the Current Architecture are
depicted in Red, Planned in Blue, Conceptual (Legacy) in Orange and Conceptual (New)
in Green. From the plots, it appears that the Conceptual (New) Architecture consistently
achieved a lower MOE as compared to the Current, Planned and Conceptual (Legacy)
Architectures, except when there is inadequate level of force protection. With
sufficiently higher level of escort ships, the Conceptual (New) Architecture does not

XX-61
appear to be performing better than the other architectures. This may first appear to be
counter intuitive, but as we examine further, we will note that in the Conceptual (New)
Architecture, the NESG is now concentrated over a smaller number of relatively larger
ships. Basically, the two X-ships of the combat variant replace three of the Current or
Planned amphibious ships, resulting in a less distributed Sea Base that has now become
more vulnerable. A less distributed Sea Base provides the enemy with opportunity to
concentrate fire at fewer targets.
Comparison of Various Architecture’s Protection Force Comparison of Various Architecture’s Protection Force Structure Options That Approach the Goal of at Least Structure Options That Approach the Goal of at Least
80% 80% ExWarExWar Forces UnharmedForces Unharmed
0
0.1
0.2
0.3
0.4
0.5
0.6
0.7
0.8
0.9
1Upper .95 CI
Current Ave
Lower .95 CI
Upper .95 CI
Planned Ave
Lower .95 CI
Upper .95 CI
Conceptual (Legacy) Ave
Lower .95 CI
Upper .95 CI
Conceptual (New) Ave
Lower .95 CI
Based on 50 “battles” in Einstein
3 DDG & 6 FFG
2 CG, 3 DDG & 3 FFG
1CG, 5 DDG & 3 FFG
Baseline: 1 CG, 1 DDG & 1 FFG
3 CG, 3 DDG & 3 FFG
Frac
tio
n o
f Fo
rces
Un
har
med
Figure XX-24: Comparison of Various Architectures’ Protection Force Structure
Options that Approach the Goal of at least 80% ExWar Forces Unharmed (I).

XX-62
0
0.1
0.2
0.3
0.4
0.5
0.6
0.7
0.8
0.9
1 Upper .95 CI
Current Ave
Lower .95 CI
Upper .95 CI
Planned Ave
Lower .95 CI
Upper .95 CI
Conceptual (Legacy) Ave
Lower .95 CI
Upper .95 CI
Conceptual (New) Ave
Lower .95 CI
Based on 50 “battles” in Einstein
1 CG & 9 LCS
1 CG, 1 DDG & 8 LCS
3 DDG & 7 LCS
Baseline: 1 CG, 1 DDG & 1 FFG
10 LCS
Frac
tio
n o
f Fo
rces
Un
har
med
Comparison of Various Architecture’s Protection Force Comparison of Various Architecture’s Protection Force Structure Options That Approach Goal of 80Structure Options That Approach Goal of 80 --90% 90% ExWarExWar
Task Force UnharmedTask Force Unharmed
Figure XX-25: Comparison of the Various Architectures’ Protection Force Structure Options that Approach the Goal of at least 80% ExWar Forces Unharmed (II).
13. Excursion Analysis on the Defensive and Offensive Capabilities of the Amphibious and Logistics Ships of the Conceptual (New) Architecture
This sub-section focuses on the varying defensive and offensive capabilities to be
designed into the Conceptual (New) Architecture’s X-ships for both the combat and
logistics variants. The intent is to investigate if there are significant changes to the
overall survivability of the NESG if the defensive and offensive capabilities of the
amphibious and logistics ships are adjusted.
Three levels of settings for the amphibious and logistics ships of the Conceptual
(New) Architecture to be investigated are:
a. Higher defensive and offensive capabilities (Indicated as Red on Chart).
b. Higher defensive but limited offensive capabilities (Indicated as Blue on
Chart).

XX-63
c. Lower defensive and offensive capabilities (Indicated as Orange on
Chart).
Simulation runs with these new settings for the Conceptual (New) Architecture
were conducted for the set of escort options as discussed earlier and the consolidated
results are plotted in the charts as shown in Figures XX-26 and XX-27. It can be seen
that in the presence of adequate protection escorts, the defensive and offensive
capabilities of the X-ships do not have a significant impact on the overall survivability of
the NESG. Under adequate protection, there seems to be only a very marginal
improvement to the overall survivability if the X-ships are equipped with enhanced
defensive and offensive capabilities. However, if there is inadequate escort, i.e., the
Comparison of Various Defensive & Offensive Capability Comparison of Various Defensive & Offensive Capability Options for XOptions for X--Ships in Conceptual (New) Architecture’s Ships in Conceptual (New) Architecture’s
Protection Force StructureProtection Force Structure
0
0.1
0.2
0.3
0.4
0.5
0.6
0.7
0.8
0.9
1Upper .95 CI
Higher Def & Off Ave
Lower .95 CI
Upper .95 CI
Higher Def Ltd Off Ave
Lower .95 CI
Upper .95 CI
Lower Def & Off Ave
Lower .95 CI
Based on 50 “battles” in Einstein
3 DDG & 6 FFG
2 CG, 3 DDG & 3 FFG
1CG, 5 DDG & 3 FFG
Baseline: 1 CG, 1 DDG & 1 FFG
3 CG, 3 DDG & 3 FFG
Frac
tio
n o
f Fo
rces
Un
har
med
Figure XX-26: Comparison of the Various Defensive and Offensive Capability Options
for the X-ships in the Conceptual (New) Architecture’s Protection Force Structure (I)
NESG operates with limited accompanying CG, DDGs, FFGs or LCSs in the future, the
organic defensive and offensive capabilities of the X-ships becomes significantly more
important. This trend is clearly depicted by the lower Orange plots in Figure XX-27,
which indicates the lower defensive and offensive capability options of the X-ships.

XX-64
0
0.1
0.2
0.3
0.4
0.5
0.6
0.7
0.8
0.9
1 Upper .95 CI
Higher Def & Off Ave
Lower .95 CI
Upper .95 CI
Higher Def Ltd Off Ave
Lower .95 CI
Upper .95 CI
Lower Def & Off Ave
Lower .95 CI
Based on 50 “battles” in Einstein
1 CG & 9 LCS
1 CG, 1 DDG & 8 LCS
3 DDG & 7 LCS
Baseline: 1 CG, 1 DDG & 1 FFG
10 LCS
Frac
tio
n o
f Fo
rces
Un
har
med
Comparison of Various Defensive & Offensive Capability Comparison of Various Defensive & Offensive Capability Options for XOptions for X--Ships in Conceptual (New) Architecture’s Ships in Conceptual (New) Architecture’s
Protection Force StructureProtection Force Structure
Figure XX-27: Comparison of the Various Defensive and Offensive Capability Options
for the X-ships in the Conceptual (New) Architecture’s Protection Force Structure (II).
14. Excursion on Impact of Anti-Ship Cruise Missile Threat
In the separate analysis on the introduction of the mobile land-based anti-ship
cruise missile battery within strike range of the vicinity of the Sea Base, the results based
on two earlier adequate protection level options – (1) Consisting of 3 CG, 3 DDG and 3
FFG, and (2) consisting of 16 LCSs, show that the ExWar force will suffer sizeable
damages and losses as indicated in Figure XX-28. The threat of a single missile battery
that escapes earlier dedicated suppression effort is something future planners cannot
ignore. Either the Sea Base needs to now stand-off at a further distance, thus imposing
further strains on the transit runs of the re-supply chain to support the MEB ashore or the
various Sea Base ships, both amphibious and logistics ships need to have enhanced
defensive capabilities, or both. In general, the Sea Base is expected to first operate at a
far stand-off distance from the shore to reduce such land-based missile threats, and as
operations progress and such threats are neutralized, the Sea Base can then pull closer to
the shore to reduce the distance from the objectives. Specific operations to counter
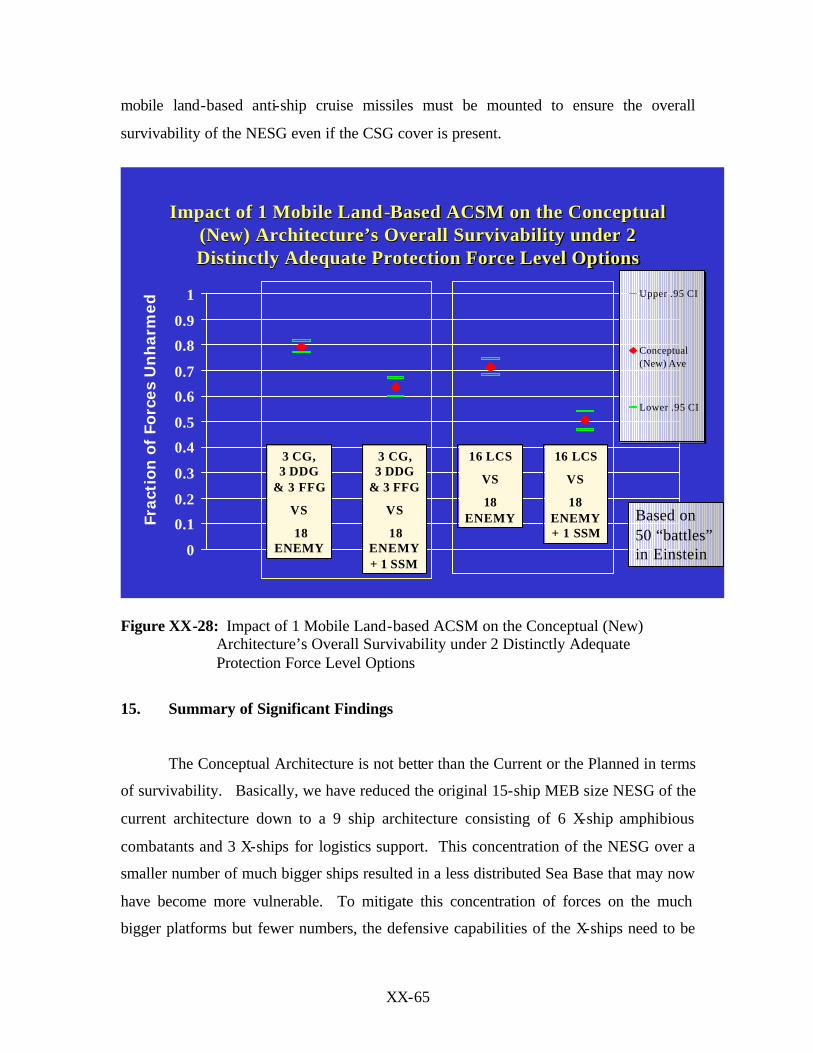
XX-65
mobile land-based anti-ship cruise missiles must be mounted to ensure the overall
survivability of the NESG even if the CSG cover is present.
Impact of 1 Mobile LandImpact of 1 Mobile Land--Based ACSM on the Conceptual Based ACSM on the Conceptual (New) Architecture’s Overall Survivability under 2 (New) Architecture’s Overall Survivability under 2 Distinctly Adequate Protection Force Level OptionsDistinctly Adequate Protection Force Level Options
0
0.1
0.2
0.3
0.4
0.5
0.6
0.7
0.8
0.9
1 Upper .95 CI
Conceptual(New) Ave
Lower .95 CI
Based on 50 “battles” in Einstein
3 CG, 3 DDG
& 3 FFG
VS
18 ENEMY
16 LCS
VS
18 ENEMY
3 CG, 3 DDG
& 3 FFG
VS
18 ENEMY + 1 SSM
Frac
tio
n o
f Fo
rces
Un
har
med
16 LCS
VS
18 ENEMY + 1 SSM
Figure XX-28: Impact of 1 Mobile Land-based ACSM on the Conceptual (New)
Architecture’s Overall Survivability under 2 Distinctly Adequate Protection Force Level Options
15. Summary of Significant Findings
The Conceptual Architecture is not better than the Current or the Planned in terms
of survivability. Basically, we have reduced the original 15-ship MEB size NESG of the
current architecture down to a 9 ship architecture consisting of 6 X-ship amphibious
combatants and 3 X-ships for logistics support. This concentration of the NESG over a
smaller number of much bigger ships resulted in a less distributed Sea Base that may now
have become more vulnerable. To mitigate this concentration of forces on the much
bigger platforms but fewer numbers, the defensive capabilities of the X-ships need to be

XX-66
increased (A bigger platform is associated with a more STOM friendly architecture due
to the premium on the overall space and also the flight deck space which is able to
support the high aerial throughput rate for the initial assault launch to capture the
objective ashore). Also, the protection escort ships need to be sized adequately to
provide the necessary screen. For the conceptual Architecture, the MOE of have more
than 80% of the task force unharmed can be achieved by 16 LCSs; or a combined force
of 3 CG, 3 DDG and 3 FFG; or 3 DDG and 12 LCSs.
The excursion on the substitution of the escort ships with LCSs for the
Conceptual Architecture provides a very rough order of equal capability equation for
specific anti-surface warfare scenario depicted here as:
1 CG, 1 DDG and 1 FFG collectively = about 6 LCSs.
Another interesting finding when we activated the communication net in the
EINSTein model to simulate the Sea Base as a “perfectly” netted network centric force
(with 100% accurate information shared between the ships of the various ExWar
architectures), only marginal improvements to the MOE occur. While the overall
percentage of forces remaining unharmed increased only marginally, a sizeable reduction
in the variability of the results over the 50 EINSTein simulation battles is observed. This
at first seemed counter- intuitive as a much larger effect is anticipated in the light of future
Network Centric Warfare and better sharing of target data. However, this marginal
improvement may be attributable to the Comms net being not adequately exploited due to
the concentrated force package of the X-ships in the simulated assembly/launch area.
Moreover, the focused attacks by enemy forces from one general direction did not pose a
significant coordination problem. The ExWar forces in the simulation do not operate as a
distributed force over a wider area and this may explain the less than anticipated benefits
of “comprehensive awareness and a netted force structure”.
Lastly, the option most sensitive to incremental change in the protection level
appeared to be the addition of offensive and defensive capabilities to the ships. This
indicates that investment on such weapon systems’ capabilities as sensor and effective
engagement ranges, number of simultaneous engagements, the probability of kill, the

XX-67
ability to soft-kill and hard kill incoming missiles are crucial to the survivability of the
future ExWar force. While this excursion study on the protection needs of the Sea Base
is not able to explore the options from the equal cost or cost effectiveness point of view,
due to the limitation of time and manpower, a comparison across the different
architectures basing of cost opportunities and trade-offs can certainly be applied to
provide further insights on the appropriate defensive and offensive needs of the NESG.
16. Potential for Future Applications Using EINSTein.
Further agent-based simulation can be applied to explore the appropriate mix of
protection force levels of the different escort ships under different threat levels to provide
a quick guide to the force planners of the necessary assignment or make-up of the NESG
for the given scenarios.
The NESG and the accompanying Sea Base can be viewed as a complex and
dynamic collection of ship types, with individual ships, their specific weapon systems,
coupled with the prevailing control measures and applicable tactical considerations. The
entire architecture is a unique system-of-systems which will have some expected
emergent collective behavior and combat capabilities and weaknesses that can be
explored in more detailed in a simulated environment using agent-based modeling tools
like EINSTein.
The unique command and control, meta-personalities, and movement constraints
features offered by EINSTein make it a feasible and easily adaptable tool to better
simulate the tactical movement and action of the NESG or other complex task force. In
particular, the new LCS CONOPS can be explored using EINSTein whereby the
subordinate UUVs and UAVs can be better modeled akin to the relationship between a
battalion, company and squad, not unlike the way land forces organizes the different
levels of component forces.
Another area of exploration is the offensive and defensive capabilities needed to
ensure the NESG’s collective survivability. The focus areas can be armament, sensors,
and even considerations in tactical employment. Here, if the attributes of the weapon
systems on the associated platforms can be represented appropriately and effectively,
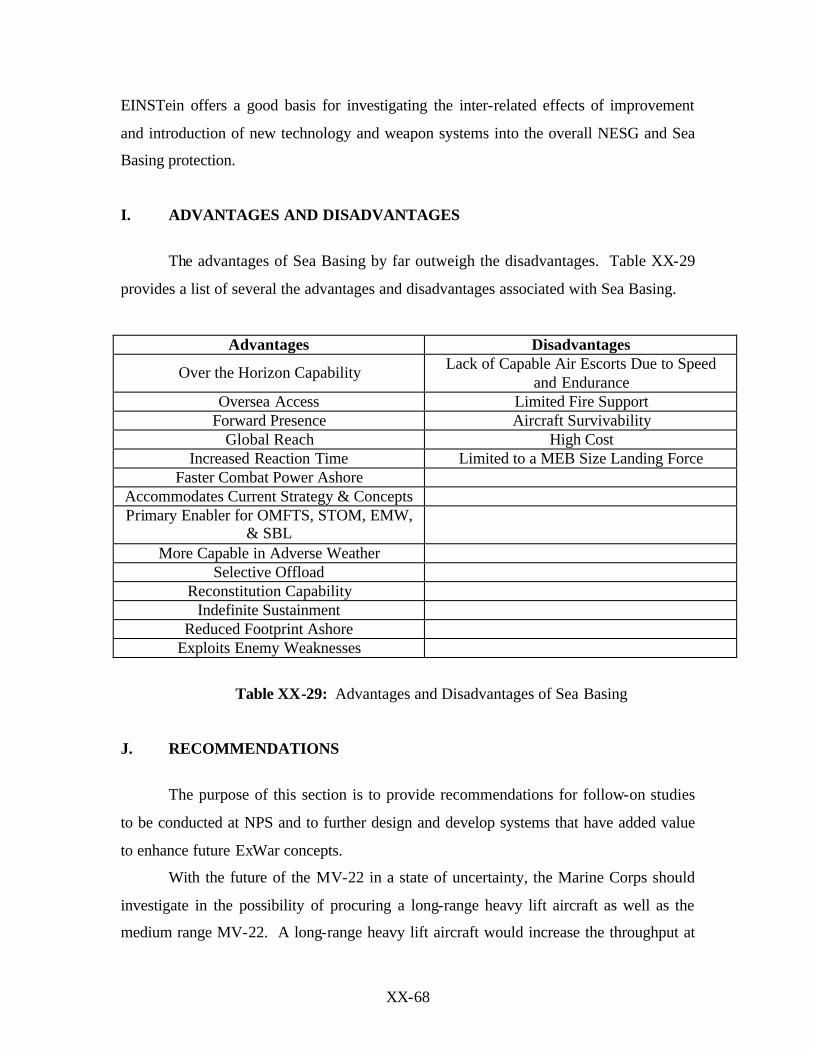
XX-68
EINSTein offers a good basis for investigating the inter-related effects of improvement
and introduction of new technology and weapon systems into the overall NESG and Sea
Basing protection.
I. ADVANTAGES AND DISADVANTAGES
The advantages of Sea Basing by far outweigh the disadvantages. Table XX-29
provides a list of several the advantages and disadvantages associated with Sea Basing.
Advantages Disadvantages
Over the Horizon Capability Lack of Capable Air Escorts Due to Speed and Endurance
Oversea Access Limited Fire Support Forward Presence Aircraft Survivability
Global Reach High Cost Increased Reaction Time Limited to a MEB Size Landing Force
Faster Combat Power Ashore Accommodates Current Strategy & Concepts Primary Enabler for OMFTS, STOM, EMW,
& SBL
More Capable in Adverse Weather Selective Offload
Reconstitution Capability Indefinite Sustainment
Reduced Footprint Ashore Exploits Enemy Weaknesses
Table XX-29: Advantages and Disadvantages of Sea Basing
J. RECOMMENDATIONS
The purpose of this section is to provide recommendations for follow-on studies
to be conducted at NPS and to further design and develop systems that have added value
to enhance future ExWar concepts.
With the future of the MV-22 in a state of uncertainty, the Marine Corps should
investigate in the possibility of procuring a long-range heavy lift aircraft as well as the
medium range MV-22. A long-range heavy lift aircraft would increase the throughput at

XX-69
longer ranges and enhance the USMC’s airlift capability. Having the capability to deliver
large quantities of fuel, water, and ammunition would help reduce the footprint ashore,
giving the combat forces ashore more flexibility and maneuverability.
Procuring a heavy lift aircraft would require a future study in finding optimal
loading plans for internal and external loads. Maximizing the aircraft payload capability
would reduce the number of aircraft required to delivered the daily sustainment
requirements and allow for greater flexibility in scheduling the aircraft for other
operational commitments.
With a longer-range capability to move combat troops, equipment, and supplies
ashore, a follow-on study needs to address the possibility of moving Joint Forces, as well
as Allied Forces. The Sea Base is a resource for providing a launching pad when a host
nation doesn’t want U. S. Forces stationed on their soil. So having the capability to move
not only the Navy and Marine Corps would definitely add a most robust capability to the
Joint Force Commander.
Although not thoroughly studied by us the need for aerial and naval fire support
needs to be studied in great detail. With limited range capabilities in naval gunfire
support and the lack of range and endurance for aerial fire support assets, the need to
figure out a way to protect the combat troops ashore and the logistics moving ashore
becomes very important.
K. CONCLUSIONS In this study we examine the Sea Base using various tools and concluded Sea Basing is a
viable option for the future of Expeditionary Warfare provided a robust aerial throughput
capability and a capable force protection package exists. The following summarizes our
conclusions using ENTEND, EXCEL, ARENA, and EINSTein.
1. Conclusions resulting from EXTENDTM analysis
• The distance from the Sea Base to the Objective is critical to the overall
sustainment effort.
XX-70
• Greater distances create more variability and difficulties in maintaining a
desired level of days of supplies at the Objective.
• Air re-supply is more robust in adverse weather, but it is highly dependent on
survivability during transit.
• Air re-supply is more responsive and expedient, but it consumes a significant
amount of fuel.
2. Conclusions resulting from EXCELTM and ARENATM simulations and analysis
• Planned aviation assets cannot meet the sustainment needs of a MEB
beyond 175 NM.
• Conceptual aviation assets with 24 HLAs and 96 MV-22s
operating from the 6 X-ships can surge and sustain a MEB up to 275 NM from the
Sea Base.
• Conceptual aerial throughput capability has a surge capacity of 4 times the
daily sustainment requirements at 225 NM; 3 times at 250 NM and 2 times at
275 NM (12-Hour Operating Time).
• Conceptual Architecture can accept up to 50% attrition or diversion of assets
to other missions and still sustain a MEB ashore up to 275 NM daily (Ao =
.75).
3. Conclusions resulting from EINSTein Simulations
• The Conceptual Sea Base did not perform better than Current or Planned in
terms of survivability.
• A less dis tributed Sea Base becomes less survivable.
• Mobile land-based ASCMs (Anti-Ship Cruise Missiles) pose a threat to the
Sea Base.
• The defense capabilities of the ships need to be increased.
• The simulations indicate the MOE for the Conceptual architecture can be
achieved with 16 LCS; 3CG, 3DDG and 3 FFG; or 3 DDG and 12 LCS.