xiaolin li, jun liu, yuyan shao, huilin pan, pengfei yan ...€¦ · room temperature na-ion...
TRANSCRIPT
Room Temperature Na-ion Battery Development
Xiaolin Li, Jun Liu, Yuyan Shao, Huilin Pan, Pengfei Yan,
Chongmin Wang, Wei Wang, Vincent L. Sprenkle
Pacific Northwest National Laboratory
Electrochemical Materials and Systems
DOE Office of Electricity Energy Storage Program – Imre Gyuk
Program Manager.
OE Energy Storage Systems Program Review
September 16-19th, 2014
Outline
1. Introduction
Advantages and challenges of Na-ion batteries
Current status and perspective
2. Overview of our previous work
3. Progress of FY14
i) Optimization of Na0.44MnO2 (C)-hard carbon (A) chemistry
ii) Development of phosphate (Na3V2(PO4)3) cathode
iii) Exploration of Prussian blue cathode materials
4. Summary and Future work
1
2
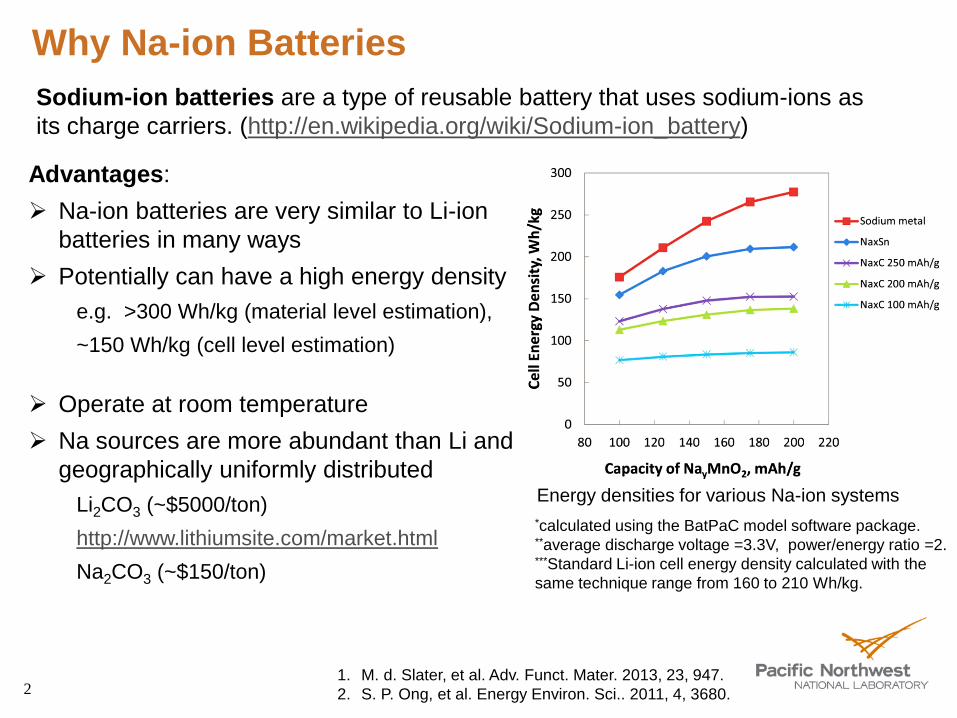
Advantages:
Na-ion batteries are very similar to Li-ion
batteries in many ways
Potentially can have a high energy density
e.g. >300 Wh/kg (material level estimation),
~150 Wh/kg (cell level estimation)
Operate at room temperature
Na sources are more abundant than Li and
geographically uniformly distributed
Li2CO3 (~$5000/ton)
http://www.lithiumsite.com/market.html
Na2CO3 (~$150/ton)
Sodium-ion batteries are a type of reusable battery that uses sodium-ions as
its charge carriers. (http://en.wikipedia.org/wiki/Sodium-ion_battery)
Why Na-ion Batteries
1. M. d. Slater, et al. Adv. Funct. Mater. 2013, 23, 947.
2. S. P. Ong, et al. Energy Environ. Sci.. 2011, 4, 3680.
Energy densities for various Na-ion systems
*calculated using the BatPaC model software package. **average discharge voltage =3.3V, power/energy ratio =2. ***Standard Li-ion cell energy density calculated with the
same technique range from 160 to 210 Wh/kg.
3
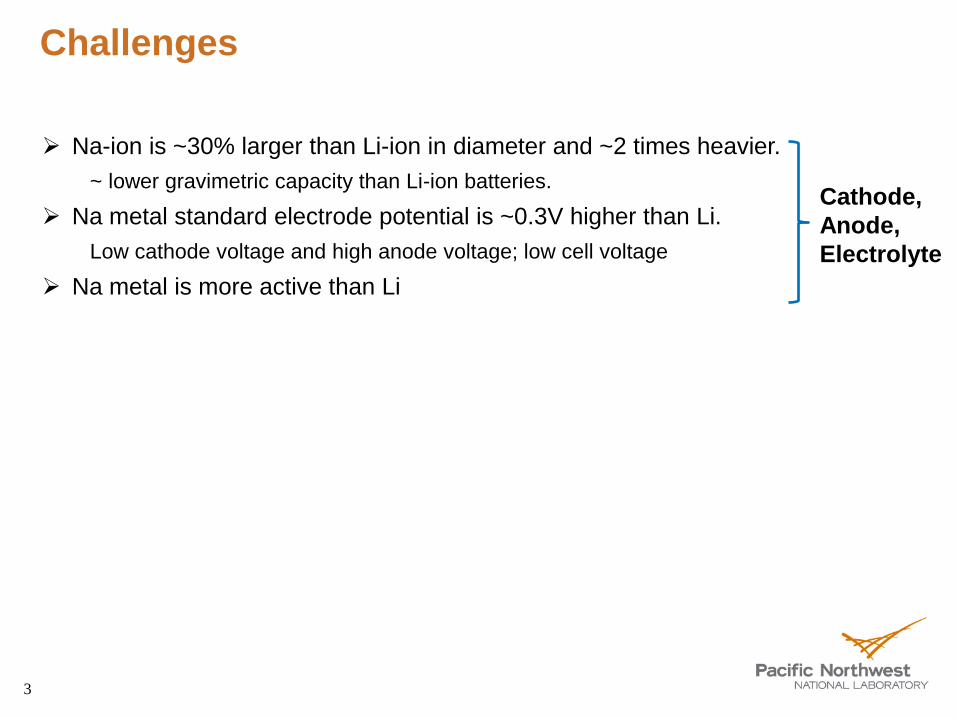
Na-ion is ~30% larger than Li-ion in diameter and ~2 times heavier.
~ lower gravimetric capacity than Li-ion batteries.
Na metal standard electrode potential is ~0.3V higher than Li.
Low cathode voltage and high anode voltage; low cell voltage
Na metal is more active than Li
Cathode,
Anode,
Electrolyte
Challenges
4
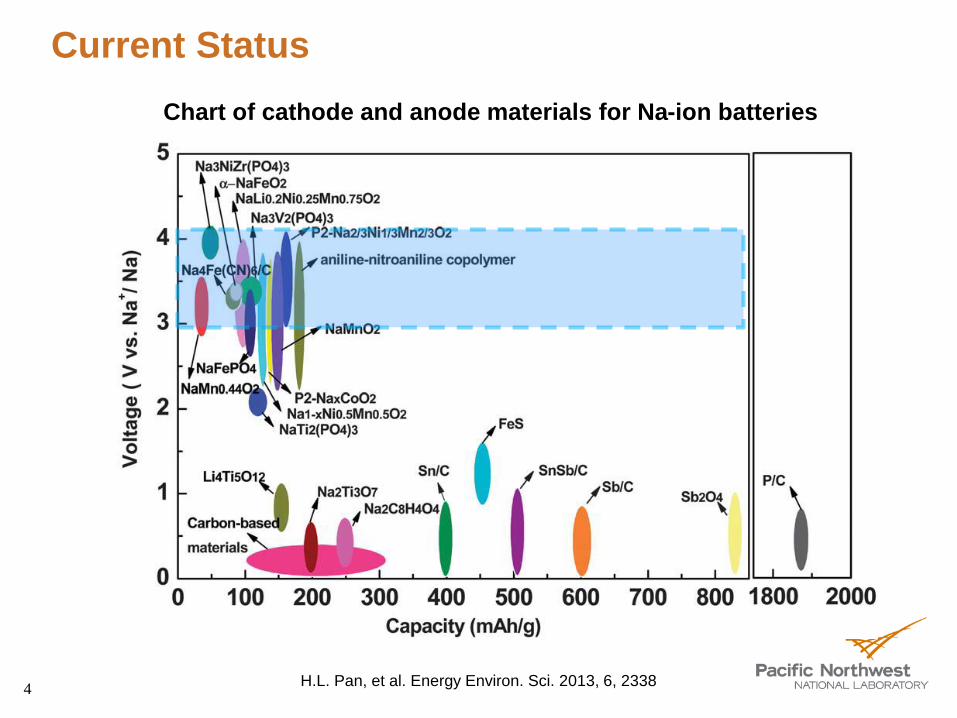
Current Status
H.L. Pan, et al. Energy Environ. Sci. 2013, 6, 2338
Chart of cathode and anode materials for Na-ion batteries
5
Current Status
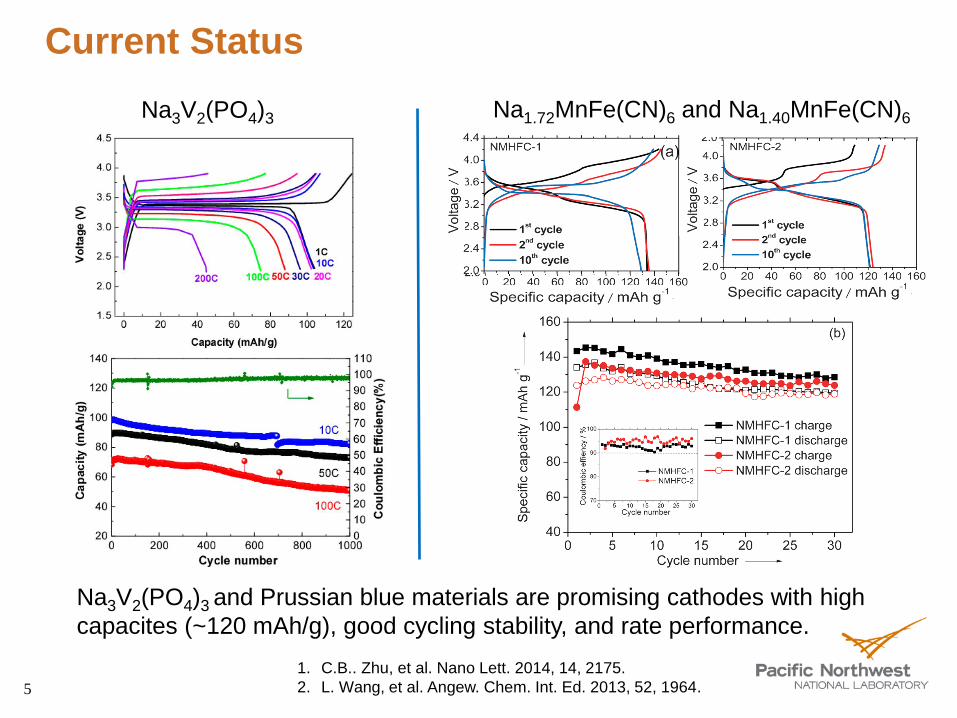
Na3V2(PO4)3
1. C.B.. Zhu, et al. Nano Lett. 2014, 14, 2175.
2. L. Wang, et al. Angew. Chem. Int. Ed. 2013, 52, 1964.
Na3V2(PO4)3 and Prussian blue materials are promising cathodes with high
capacites (~120 mAh/g), good cycling stability, and rate performance.
Na1.72MnFe(CN)6 and Na1.40MnFe(CN)6
6
Our Perspective
PNNL will demonstrate potentially low cost full cell Na-ion batteries
with high capacity and long cycling stability for grid scale applications
7
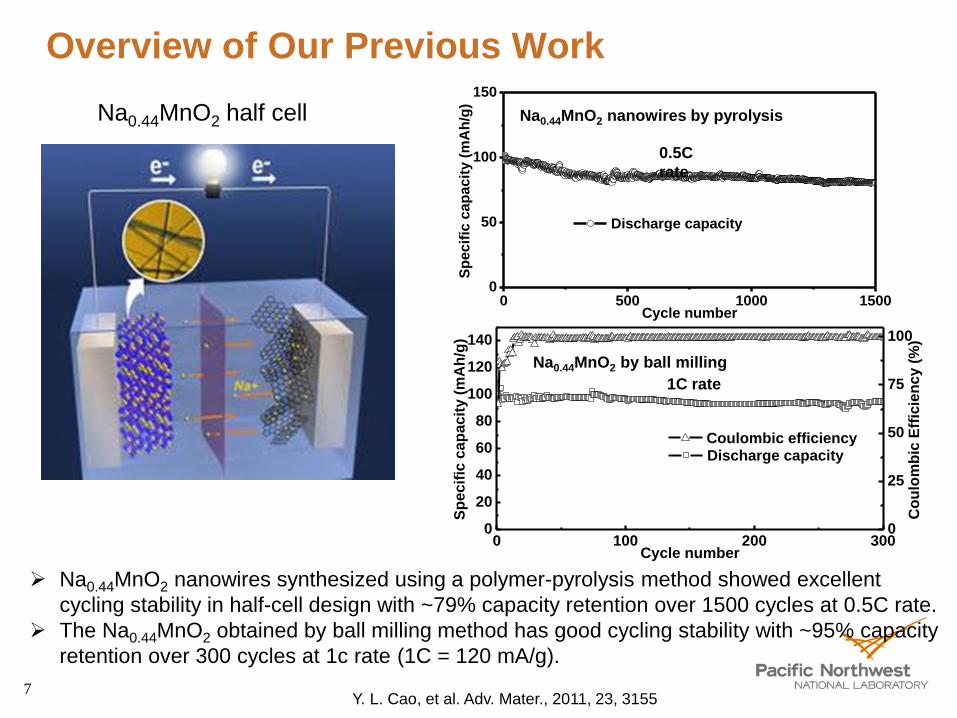
Overview of Our Previous Work
0 500 1000 15000
50
100
150
Discharge capacity
Sp
ecif
ic c
ap
acit
y (
mA
h/g
)
Cycle number
Y. L. Cao, et al. Adv. Mater., 2011, 23, 3155
Na0.44MnO2 nanowires synthesized using a polymer-pyrolysis method showed excellent
cycling stability in half-cell design with ~79% capacity retention over 1500 cycles at 0.5C rate.
The Na0.44MnO2 obtained by ball milling method has good cycling stability with ~95% capacity
retention over 300 cycles at 1c rate (1C = 120 mA/g).
Na0.44MnO2 half cell
0 100 200 3000
20
40
60
80
100
120
140
Discharge capacityS
pecif
ic c
ap
acit
y (
mA
h/g
)
Cycle number
0
25
50
75
100
Coulombic efficiency
Co
ulo
mb
ic E
ffic
ien
cy (
%)
1C rate
Na0.44MnO2 nanowires by pyrolysis
0.5C
rate
Na0.44MnO2 by ball milling
8
0 100 200 300 400 500 600 700 800 900 10000
20
40
60
80
100
120
140
Discharge capacity
Sp
ecif
ic c
ap
acit
y (
mA
h/g
)
Cycle number
0
25
50
75
100
Coulombic efficiency
Co
ulo
mb
ic E
ffic
ien
cy (
%)
2C rate
~83% retention over 1000 cycles
0 20 40 60 80 100 120 1401.5
2.0
2.5
3.0
3.5
4.0
Vo
ltag
e (
V)
Specific capacity (mAh/g)
1st cycle
500th
cycle
1000th
cycle
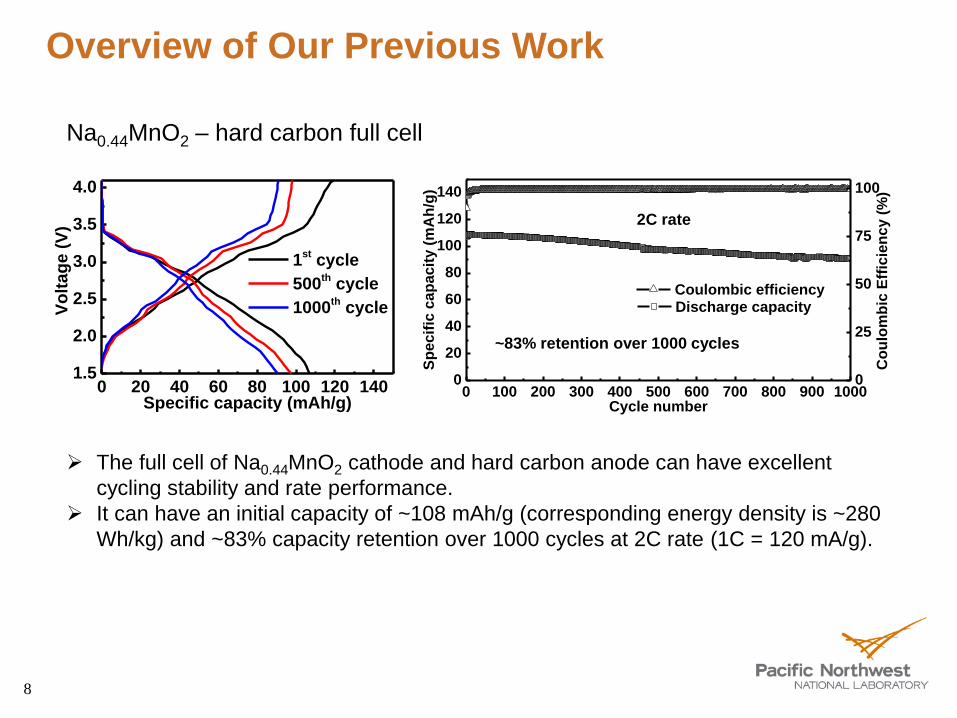
The full cell of Na0.44MnO2 cathode and hard carbon anode can have excellent
cycling stability and rate performance.
It can have an initial capacity of ~108 mAh/g (corresponding energy density is ~280
Wh/kg) and ~83% capacity retention over 1000 cycles at 2C rate (1C = 120 mA/g).
Overview of Our Previous Work
Na0.44MnO2 – hard carbon full cell
9
0 100 200 300 400 500 600 700 8000
20
40
60
80
100
120
140
Discharge capacity
Sp
ecif
ic c
ap
acit
y (
mA
h/g
)
Cycle number
0
25
50
75
100
Coulombic efficiency
Co
ulo
mb
ic E
ffic
ien
cy (
%)
0.5C rate
~88% retention
over 800 cycles
0 20 40 60 80 1002.5
3.0
3.5
4.0
Vo
ltag
e (
V)
Specific capacity (mAh/g)
100th
cycle
500th
cycle
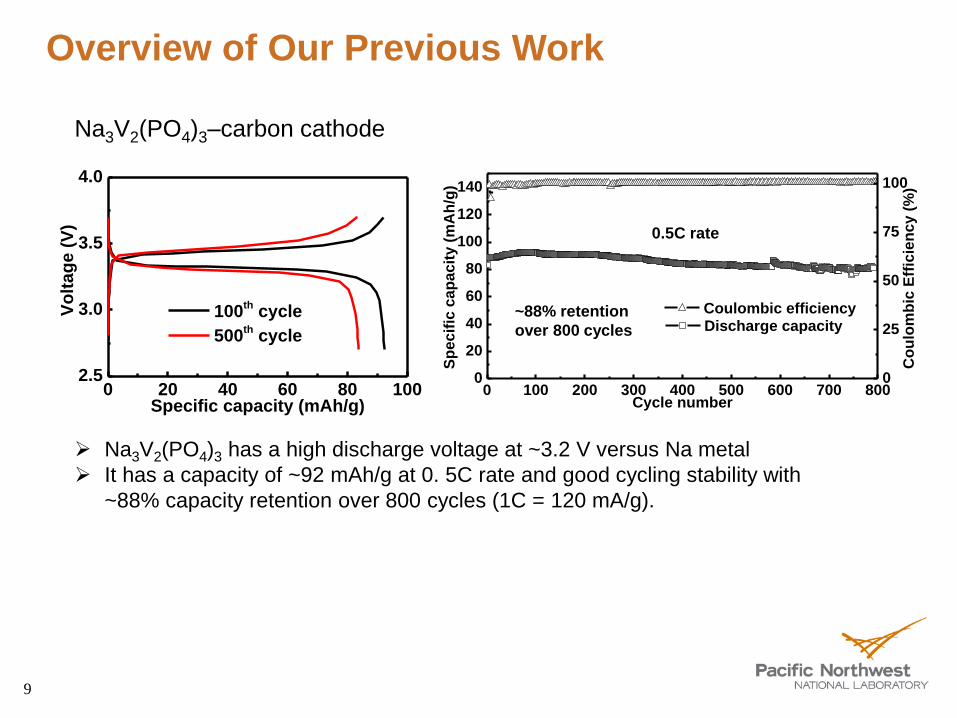
Na3V2(PO4)3 has a high discharge voltage at ~3.2 V versus Na metal
It has a capacity of ~92 mAh/g at 0. 5C rate and good cycling stability with
~88% capacity retention over 800 cycles (1C = 120 mA/g).
Overview of Our Previous Work
Na3V2(PO4)3–carbon cathode
10
0 500 1000 1500 20000
20
40
60
80
100
120
140
Na0.44
MnO2
Discharge capacity
Sp
ec
ific
ca
pa
cit
y (
mA
h•g
-1)
Cycle number
0.1C
0
20
40
60
80
100
Coulombic efficiency
2.0 to 3.7 V
Co
ulo
mb
ic E
ffic
ien
cy
(%
)1C
0 500 1000 1500 20000
20
40
60
80
100
120
140
Na0.44
MnO2
Discharge capacity
Sp
ecif
ic c
ap
acit
y (
mA
h•g
-1)
Cycle number
0
20
40
60
80
100
Coulombic efficiency
2.0 to 4.0 V
Co
ulo
mb
ic E
ffic
ien
cy (
%)
1C0.1C
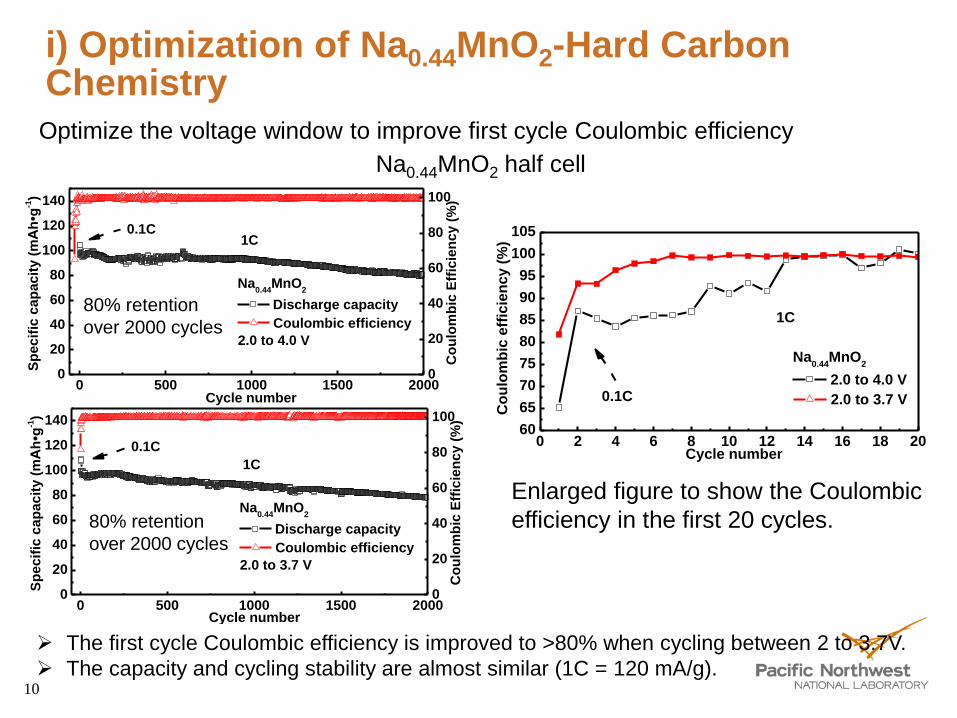
i) Optimization of Na0.44MnO2-Hard Carbon Chemistry Optimize the voltage window to improve first cycle Coulombic efficiency
Na0.44MnO2 half cell
The first cycle Coulombic efficiency is improved to >80% when cycling between 2 to 3.7V.
The capacity and cycling stability are almost similar (1C = 120 mA/g).
80% retention
over 2000 cycles
80% retention
over 2000 cycles
0 2 4 6 8 10 12 14 16 18 2060
65
70
75
80
85
90
95
100
105
Na0.44
MnO2
2.0 to 4.0 V
Co
ulo
mb
ic e
ffic
ien
cy
(%
)
Cycle number
0.1C
2.0 to 3.7 V
1C
Enlarged figure to show the Coulombic
efficiency in the first 20 cycles.
11
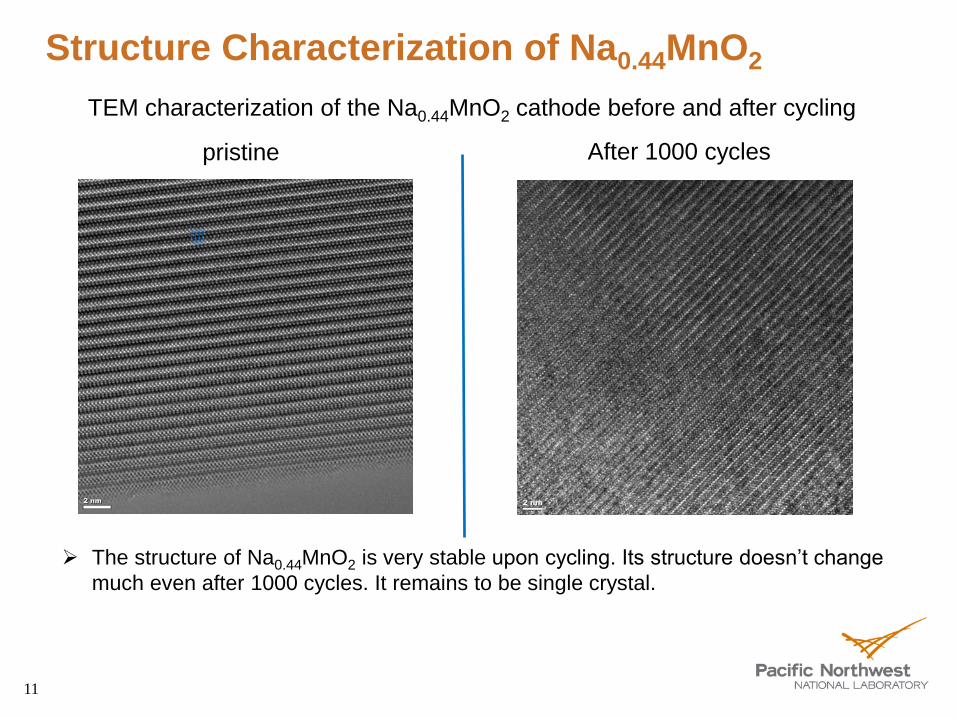
pristine After 1000 cycles
The structure of Na0.44MnO2 is very stable upon cycling. Its structure doesn’t change
much even after 1000 cycles. It remains to be single crystal.
TEM characterization of the Na0.44MnO2 cathode before and after cycling
Structure Characterization of Na0.44MnO2
12
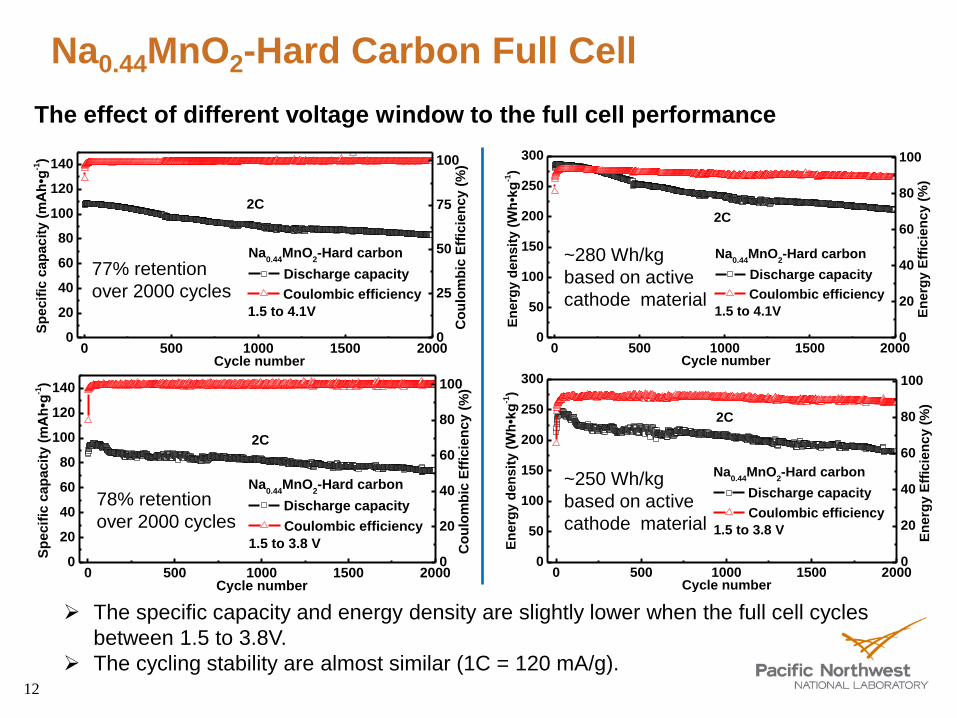
The specific capacity and energy density are slightly lower when the full cell cycles
between 1.5 to 3.8V.
The cycling stability are almost similar (1C = 120 mA/g).
0 500 1000 1500 20000
20
40
60
80
100
120
140
Na0.44
MnO2-Hard carbon
Discharge capacity
Sp
ecif
ic c
ap
acit
y (
mA
h•g
-1)
Cycle number
0
25
50
75
100
Coulombic efficiency
1.5 to 4.1V
Co
ulo
mb
ic E
ffic
ien
cy (
%)
2C
0 500 1000 1500 20000
20
40
60
80
100
120
140
Na0.44
MnO2-Hard carbon
Discharge capacity
Sp
ec
ific
ca
pa
cit
y (
mA
h•g
-1)
Cycle number
0
20
40
60
80
100
Coulombic efficiency
1.5 to 3.8 V Co
ulo
mb
ic E
ffic
ien
cy
(%
)
2C
77% retention
over 2000 cycles
78% retention
over 2000 cycles
The effect of different voltage window to the full cell performance
0 500 1000 1500 20000
50
100
150
200
250
300
Na0.44
MnO2-Hard carbon
Discharge capacity
En
erg
y d
en
sit
y (
Wh
•kg
-1)
Cycle number
0
20
40
60
80
100
Coulombic efficiency
1.5 to 4.1V
En
erg
y E
ffic
ien
cy (
%)
2C
0 500 1000 1500 20000
50
100
150
200
250
300
Na0.44
MnO2-Hard carbon
Discharge capacity
En
erg
y d
en
sit
y (
Wh
•kg
-1)
Cycle number
0
20
40
60
80
100
Coulombic efficiency
1.5 to 3.8 V
En
erg
y E
ffic
ien
cy
(%
)
2C
~280 Wh/kg
based on active
cathode material
~250 Wh/kg
based on active
cathode material
Na0.44MnO2-Hard Carbon Full Cell
13
ii) Development of Na3V2(PO4)3 Cathode
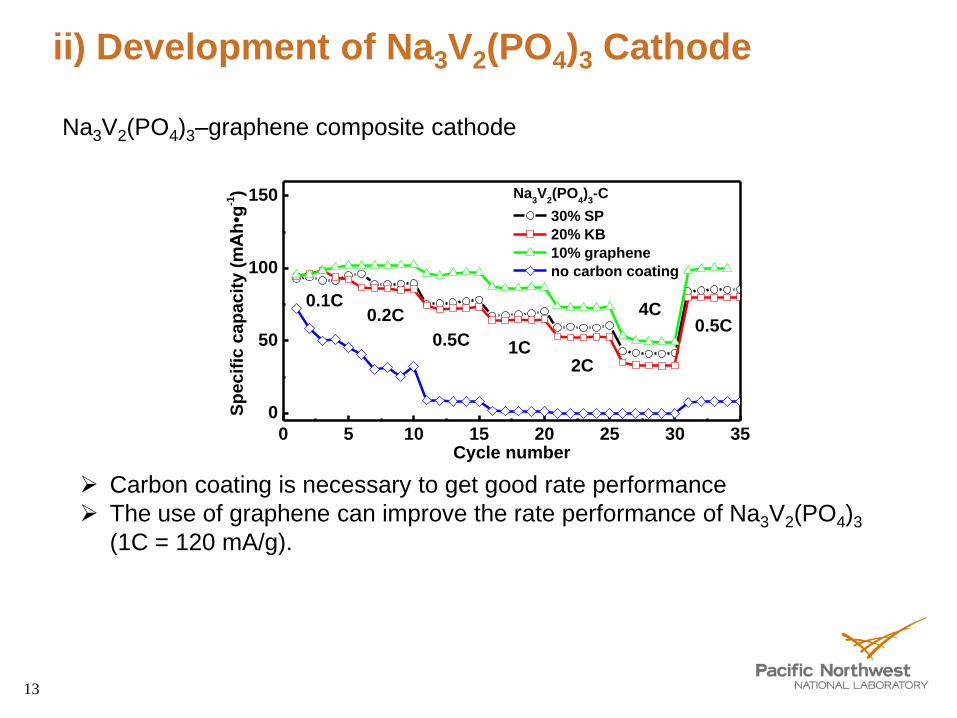
Na3V2(PO4)3–graphene composite cathode
0 5 10 15 20 25 30 35
0
50
100
150 Na3V
2(PO
4)3-C
30% SP
20% KB
10% graphene
no carbon coating
Sp
ecif
ic c
ap
acit
y (
mA
h•g
-1)
Cycle number
0.1C0.2C
0.5C 1C2C
4C0.5C
Carbon coating is necessary to get good rate performance
The use of graphene can improve the rate performance of Na3V2(PO4)3
(1C = 120 mA/g).
14
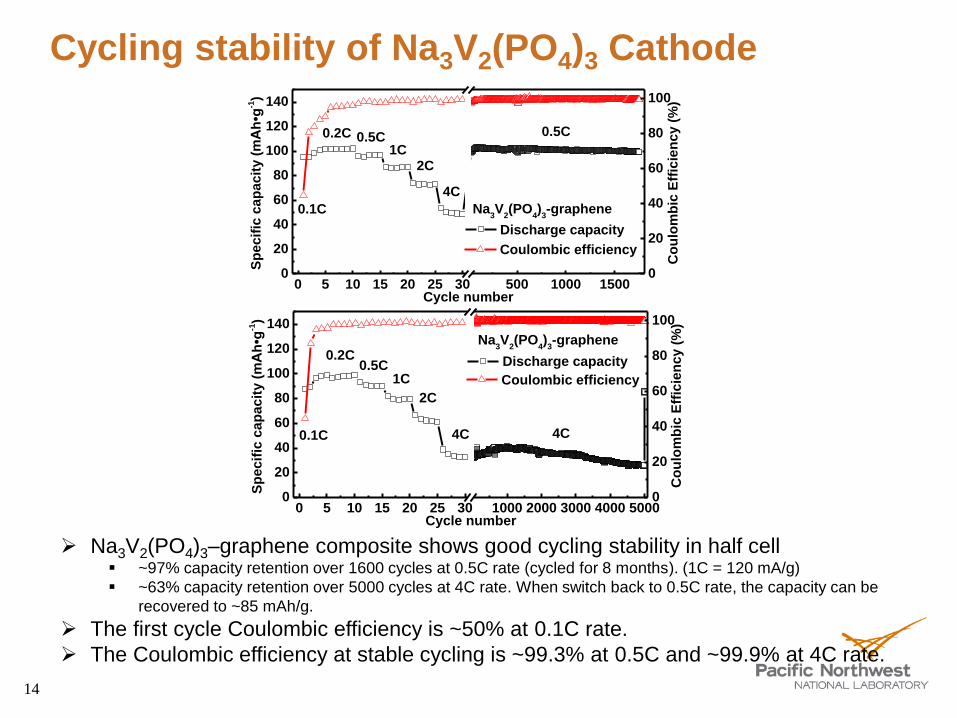
Na3V2(PO4)3–graphene composite shows good cycling stability in half cell ~97% capacity retention over 1600 cycles at 0.5C rate (cycled for 8 months). (1C = 120 mA/g)
~63% capacity retention over 5000 cycles at 4C rate. When switch back to 0.5C rate, the capacity can be
recovered to ~85 mAh/g.
The first cycle Coulombic efficiency is ~50% at 0.1C rate.
The Coulombic efficiency at stable cycling is ~99.3% at 0.5C and ~99.9% at 4C rate.
0 5 10 15 20 25 30 500 1000 15000
20
40
60
80
100
120
140
Discharge capacity
Sp
ec
ific
ca
pa
cit
y (
mA
h•g
-1)
Cycle number
0.1C
0.5C
1C2C
0.5C0.2C
4C
Na3V
2(PO
4)3-graphene
0
20
40
60
80
100
Coulombic efficiency
Co
ulo
mb
ic E
ffic
ien
cy
(%
)
0 5 10 15 20 25 30 1000 2000 3000 4000 50000
20
40
60
80
100
120
140
Discharge capacity
Sp
ec
ific
ca
pa
cit
y (
mA
h•g
-1)
Cycle number
0.1C 4C
1C
2C
0.5C0.2C
4C
Na3V
2(PO
4)3-graphene
0
20
40
60
80
100
Coulombic efficiency
Co
ulo
mb
ic E
ffic
ien
cy
(%
)
Cycling stability of Na3V2(PO4)3 Cathode
15
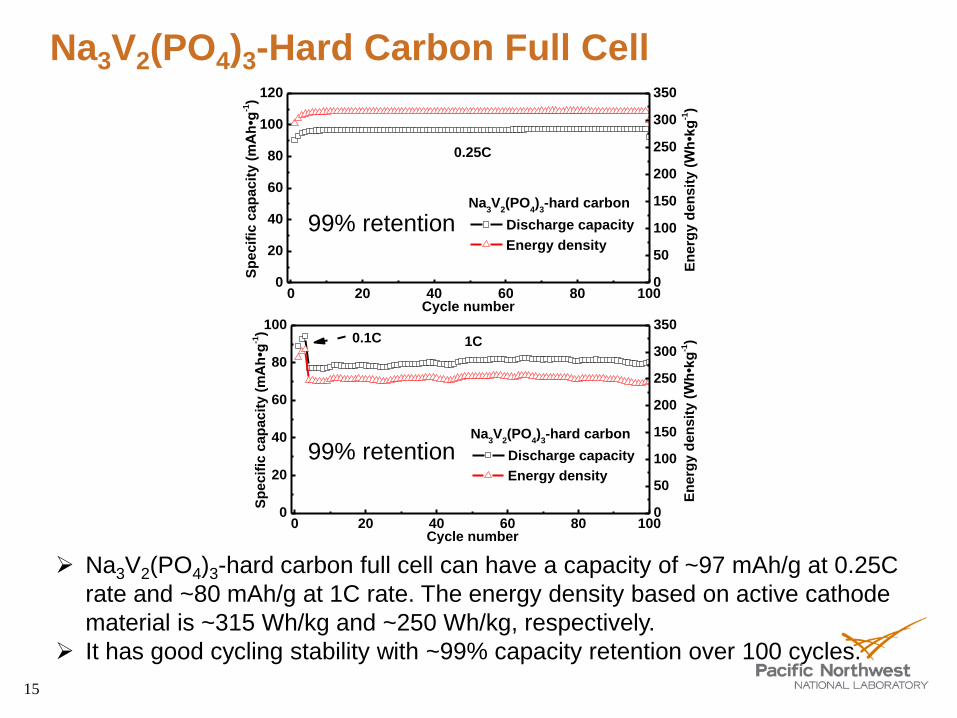
Na3V2(PO4)3-hard carbon full cell can have a capacity of ~97 mAh/g at 0.25C
rate and ~80 mAh/g at 1C rate. The energy density based on active cathode
material is ~315 Wh/kg and ~250 Wh/kg, respectively.
It has good cycling stability with ~99% capacity retention over 100 cycles.
0 20 40 60 80 1000
20
40
60
80
100
120
Discharge capacity
Sp
ec
ific
ca
pa
cit
y (
mA
h•g
-1)
Cycle number
0.25C
Na3V
2(PO
4)3-hard carbon
0
50
100
150
200
250
300
350
Energy density
En
erg
y d
en
sit
y (
Wh
•kg
-1)
0 20 40 60 80 1000
20
40
60
80
100
Discharge capacity
Sp
ec
ific
ca
pa
cit
y (
mA
h•g
-1)
Cycle number
0.1C
Na3V
2(PO
4)3-hard carbon
1C
0
50
100
150
200
250
300
350
Energy density
En
erg
y d
en
sit
y (
Wh
•kg
-1)
Na3V2(PO4)3-Hard Carbon Full Cell
99% retention
99% retention

16
iii) Exploration of Prussian blue cathodes
The capacity is ~88 mAh/g at 0.1C and ~56 mAh/g at 0.5C rate (1C = 100 mA/g).
It has excellent cycling stability with the capacity retention of ~68% (38 mAh/g) over
3000 cycles. at 0.5C.
The first cycle Coulombic efficiency is ~77%. The Coulombic efficiency is ~99.8% at
stable cycling at 0.5C rate.
CuHCFe from Stanford
0 5 10 15 20 25 1000 2000 30000
20
40
60
80
100
Discharge capacity
Sp
ecif
ic c
ap
acit
y (
mA
h•g
-1)
Cycle number
0.1C
0.5C1C
2C
0.5C
0.2C
4C
Prussian blue
0 50 100 150
2.0
2.5
3.0
3.5
4.0
1st cycle
1000th
cycle
3000th
cycle
Vo
lta
ge
(V
)
Specific capacity (mAh•g-1)
17
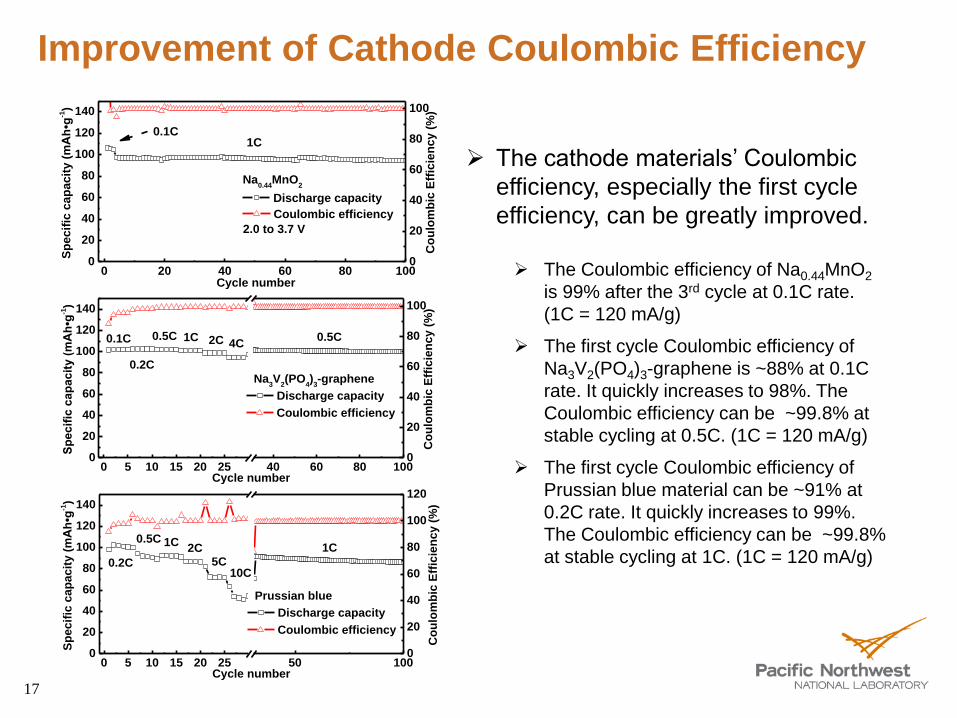
Improvement of Cathode Coulombic Efficiency
The cathode materials’ Coulombic
efficiency, especially the first cycle
efficiency, can be greatly improved.
The Coulombic efficiency of Na0.44MnO2
is 99% after the 3rd cycle at 0.1C rate.
(1C = 120 mA/g)
The first cycle Coulombic efficiency of
Na3V2(PO4)3-graphene is ~88% at 0.1C
rate. It quickly increases to 98%. The
Coulombic efficiency can be ~99.8% at
stable cycling at 0.5C. (1C = 120 mA/g)
The first cycle Coulombic efficiency of
Prussian blue material can be ~91% at
0.2C rate. It quickly increases to 99%.
The Coulombic efficiency can be ~99.8%
at stable cycling at 1C. (1C = 120 mA/g)
0 5 10 15 20 25 40 60 80 1000
20
40
60
80
100
120
140
Discharge capacity
Sp
ec
ific
ca
pa
cit
y (
mA
h•g
-1)
Cycle number
0.1C 0.5C1C 2C0.5C
0.2C
4C
Na3V
2(PO
4)3-graphene
0
20
40
60
80
100
Coulombic efficiency
Co
ulo
mb
ic E
ffic
ien
cy
(%
)
0 5 10 15 20 25 50 1000
20
40
60
80
100
120
140
Discharge capacity
Sp
ec
ific
ca
pa
cit
y (
mA
h•g
-1)
Cycle number
0.2C
1C2C5C
1C0.5C
10C
Prussian blue
0
20
40
60
80
100
120
Coulombic efficiency
Co
ulo
mb
ic E
ffic
ien
cy
(%
)
0 20 40 60 80 1000
20
40
60
80
100
120
140
Na0.44
MnO2
Discharge capacity
Sp
ecif
ic c
ap
acit
y (
mA
h•g
-1)
Cycle number
0
20
40
60
80
100
Coulombic efficiency
2.0 to 3.7 V
Co
ulo
mb
ic E
ffic
ien
cy (
%)
1C
0 500 1000 1500 20000
20
40
60
80
100
120
140
Na0.44
MnO2
Discharge capacity
Sp
ec
ific
ca
pa
cit
y (
mA
h•g
-1)
Cycle number
0
20
40
60
80
100
Coulombic efficiency
2.0 to 4.0 V
Co
ulo
mb
ic E
ffic
ien
cy
(%
)
1C0.1C
18
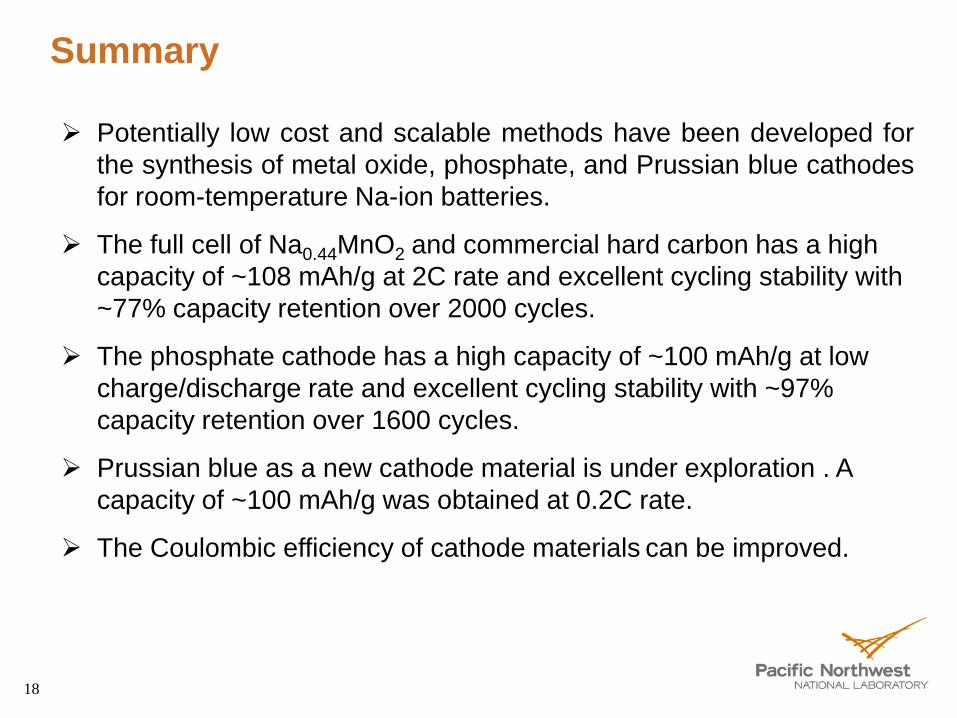
Summary
Potentially low cost and scalable methods have been developed for
the synthesis of metal oxide, phosphate, and Prussian blue cathodes
for room-temperature Na-ion batteries.
The full cell of Na0.44MnO2 and commercial hard carbon has a high
capacity of ~108 mAh/g at 2C rate and excellent cycling stability with
~77% capacity retention over 2000 cycles.
The phosphate cathode has a high capacity of ~100 mAh/g at low
charge/discharge rate and excellent cycling stability with ~97%
capacity retention over 1600 cycles.
Prussian blue as a new cathode material is under exploration . A
capacity of ~100 mAh/g was obtained at 0.2C rate.
The Coulombic efficiency of cathode materials can be improved.
19
Future work
Development of stable Na-ion battery anode materials of
high capacity and high Coulombic efficiency.
Demonstration of high performance Na3V2(PO4)3 full cells
Development of Prussian blue cathode materials
Material scale up to large cell (pouch cells or 18650 cells)
fabrication
Safety (heat generation) assessments and cost estimation
(component cost).
Acknowledgements
US DOE Office of Electricity – Dr. Imre Gyuk, Energy Storage Program
Manager
A portion of the research was performed using EMSL, a national scientific
user facility sponsored by the Department of Energy's Office of Biological
and Environmental Research and located at Pacific Northwest National
Laboratory.
20