xcel energy’s wind energy...
TRANSCRIPT

Xcel Energy’s Wind Energy Program
Wind Energy Prediction – Research & Development WorkshopMay 11-12, 2010

About Xcel EnergyNorthern States Power Company- Minnesota
Northern States Power Company- Minnesota
Northern States Power Company- Minnesota
Northern States Power Company- Minnesota
Public ServiceCompany
of Colorado
Public ServiceCompany
of Colorado
Public ServiceCompany
of Colorado
Public ServiceCompany
of Colorado
Southwestern Public ServiceSouthwestern Public ServiceSouthwestern Public ServiceSouthwestern Public Service
Northern States Power Company- Wisconsin
Northern States Power Company- WisconsinNorthern States Power Company- Wisconsin
Northern States Power Company- Wisconsin
5th Largest Combination Electric and Gas Utility (based on customers)
5th Largest Combination Electric and Gas Utility (based on customers)
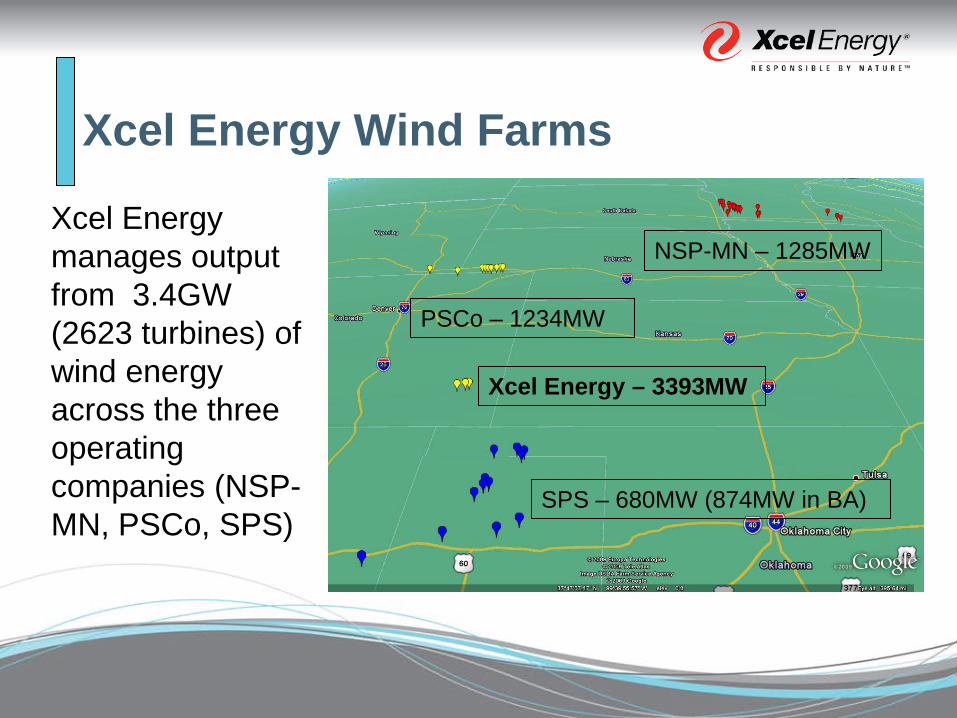
Xcel Energy Wind Farms
PSCo – 1234MW
SPS – 680MW (874MW in BA)
NSP-MN – 1285MW
Xcel Energy – 3393MW
Xcel Energy manages output from 3.4GW (2623 turbines) of wind energy across the three operating companies (NSP-MN, PSCo, SPS)
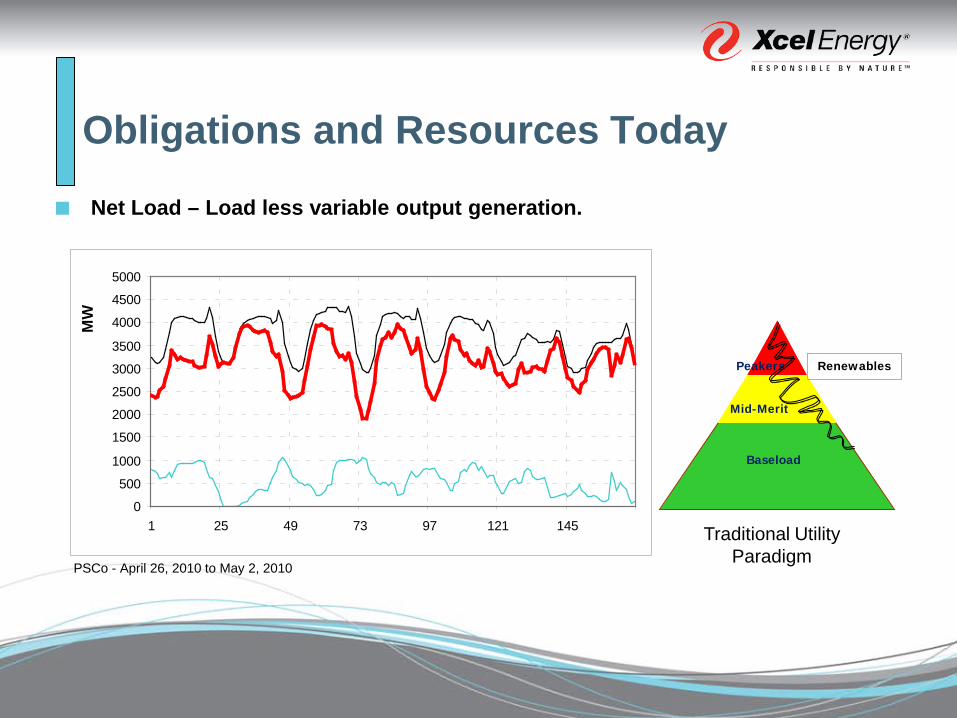
Obligations and Resources Today
Net Load – Load less variable output generation.
Traditional Utility Paradigm
Mid-Merit
Baseload
Peakers Renewables
PSCo - April 26, 2010 to May 2, 2010
0
500
1000
1500
2000
2500
3000
3500
4000
4500
5000
1 25 49 73 97 121 145
MW

Loads and Resources Today
Loads and Resources are forecast every working day for operational planning purposes. This is called day-ahead commitment.
PSCo - April 26, 2010 to May 2, 2010 Actual – Thick Line; Forecast – Thin Line
0
500
1000
1500
2000
25003000
3500
4000
4500
5000
1 25 49 73 97 121 145
MW
Forecasts of loads, variable energy generation, and unit availability are inputs to the operational planning process. Typically 18 to 42 hours ahead, but as much as five days.
Wind
Loads
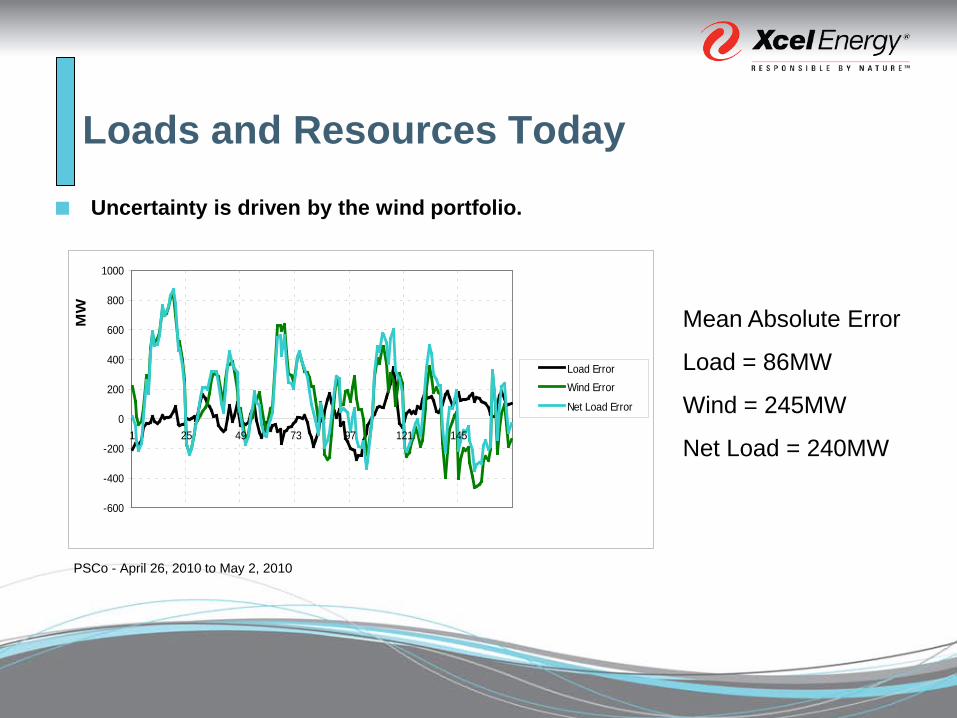
Loads and Resources Today
Uncertainty is driven by the wind portfolio.
PSCo - April 26, 2010 to May 2, 2010
Mean Absolute Error
Load = 86MW
Wind = 245MW
Net Load = 240MW
-600
-400
-200
0
200
400
600
800
1000
1 25 49 73 97 121 145
MW
Load ErrorWind Error
Net Load Error
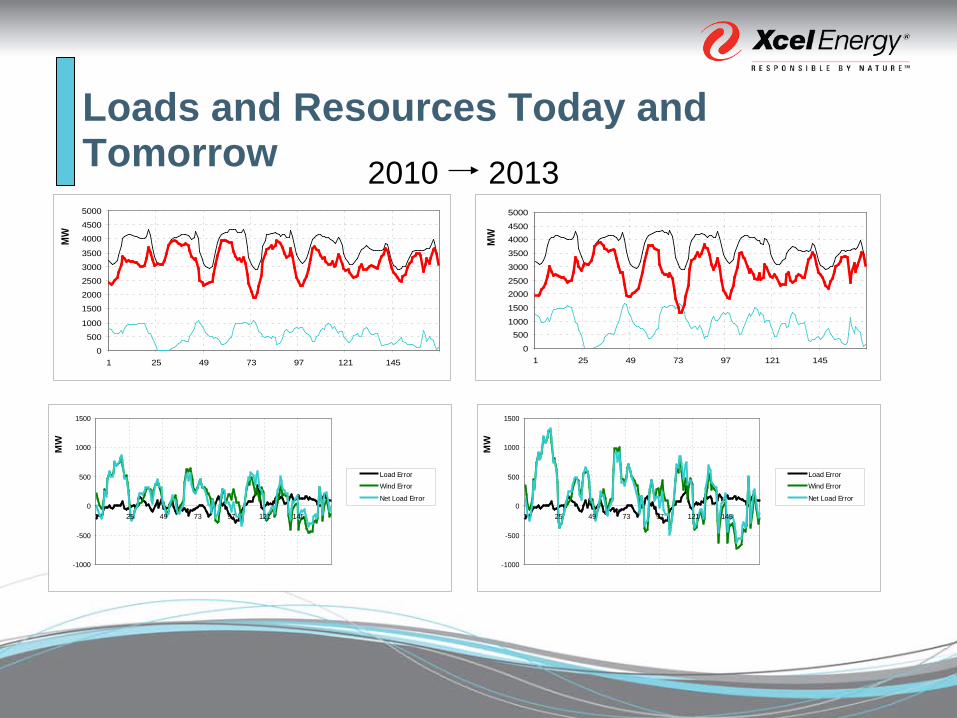
Loads and Resources Today and Tomorrow
0
5001000
1500
20002500
3000
3500
40004500
5000
1 25 49 73 97 121 145
MW
PSCo - April 26, 2010 to May 2, 2010 -1000
-500
0
500
1000
1500
1 25 49 73 97 121 145
MW
Load ErrorWind Error
Net Load Error
0
500
1000
1500
2000
2500
3000
3500
4000
4500
5000
1 25 49 73 97 121 145
MW
-1000
-500
0
500
1000
1500
1 25 49 73 97 121 145
MW
Load ErrorWind Error
Net Load Error
2010 2013

Wind as a Percent of LoadPSCO Wind as a Percentage of Obligation Load (1/1/2007 thru 4/30/2010)
4/13/2010 HE3 (38.5%)
Oct 1, 2009 HE2 (36.9%)Mar 23, 2009 HE3 (35.4%)
0%
5%
10%
15%
20%
25%
30%
35%
40%
1/1/
2007
2/1/
2007
3/1/
2007
4/1/
2007
5/1/
2007
6/1/
2007
7/1/
2007
8/1/
2007
9/1/
2007
10/1
/200
7
11/1
/200
7
12/1
/200
7
1/1/
2008
2/1/
2008
3/1/
2008
4/1/
2008
5/1/
2008
6/1/
2008
7/1/
2008
8/1/
2008
9/1/
2008
10/1
/200
8
11/1
/200
8
12/1
/200
8
1/1/
2009
2/1/
2009
3/1/
2009
4/1/
2009
5/1/
2009
6/1/
2009
7/1/
2009
8/1/
2009
9/1/
2009
10/1
/200
9
11/1
/200
9
12/1
/200
9
1/1/
2010
2/1/
2010
3/1/
2010
4/1/
2010
5/1/
2010
Hourly Monthly Annual
In real-time, more wind means fewer dispatchable resources are on-line to manage the variability. Those resources that remain on-line are typically cheap and inflexible baseload facilities
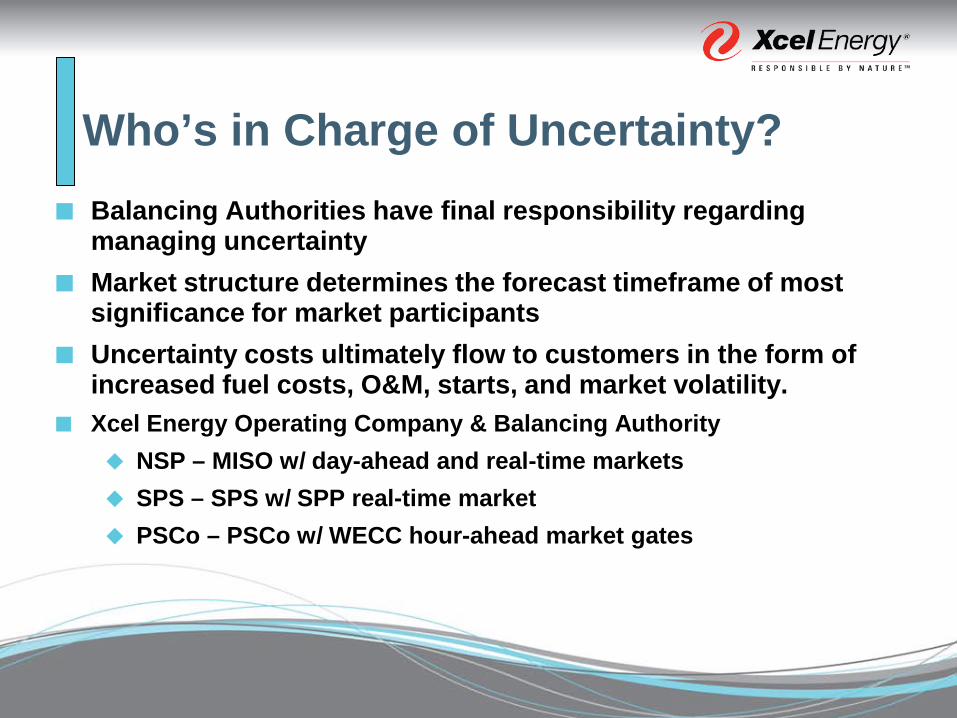
Who’s in Charge of Uncertainty? Balancing Authorities have final responsibility regarding
managing uncertainty Market structure determines the forecast timeframe of most
significance for market participants Uncertainty costs ultimately flow to customers in the form of
increased fuel costs, O&M, starts, and market volatility. Xcel Energy Operating Company & Balancing Authority
NSP – MISO w/ day-ahead and real-time markets SPS – SPS w/ SPP real-time market PSCo – PSCo w/ WECC hour-ahead market gates
Wind Prediction System
Goal: Create a new state-of-the-art wind forecasting system covering the entire Xcel Energy service territoryMinimize Dispatch Costs Increase Reliability
This is primarily a function of reducing uncertainty associated with short and long-term wind energy production
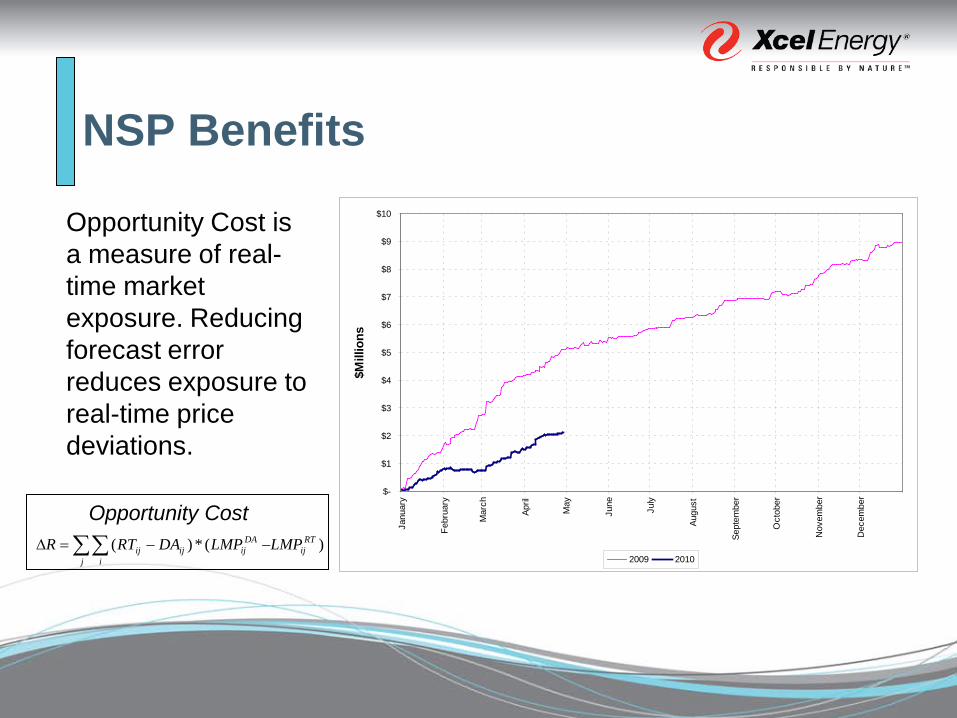
NSP Benefits
$-
$1
$2
$3
$4
$5
$6
$7
$8
$9
$10
Janu
ary
Febr
uary
Mar
ch
April
May
June
July
Augu
st
Sept
embe
r
Oct
ober
Nov
embe
r
Dec
embe
r
$Mill
ions
2009 2010
Opportunity Cost is a measure of real-time market exposure. Reducing forecast error reduces exposure to real-time price deviations.
∑∑ −−=∆j
RTij
i
DAijijij LMPLMPDARTR )(*)(
Opportunity Cost

PSCo BenefitsFebruary - Dispatch Cost due to Wind Uncertainty
y = 256957xR2 = 0.3274
$(50,000)
$-
$50,000
$100,000
$150,000
$200,000
0.0% 5.0% 10.0% 15.0% 20.0% 25.0% 30.0% 35.0% 40.0%
Daily Normalized Mean Absolute Error
Dai
ly C
ost
0.0%
5.0%
10.0%
15.0%
20.0%
25.0%
Janu
ary
Febr
uary
Mar
ch
Apr
il
May
June
July
Aug
ust
Sep
tem
ber
Oct
ober
Nov
embe
r
Dec
embe
r
200820092010
In PSCo, savings are due to more optimal dispatch of resources. This saves fuel through more efficient loading of units, leaner commitment, and avoided wind curtailments.
The rate of savings is a function of natural gas price…
$5.50/mmbtu = $800k/%MAE
Currently reducing error by 4% over 2009
~$3.2M annualized
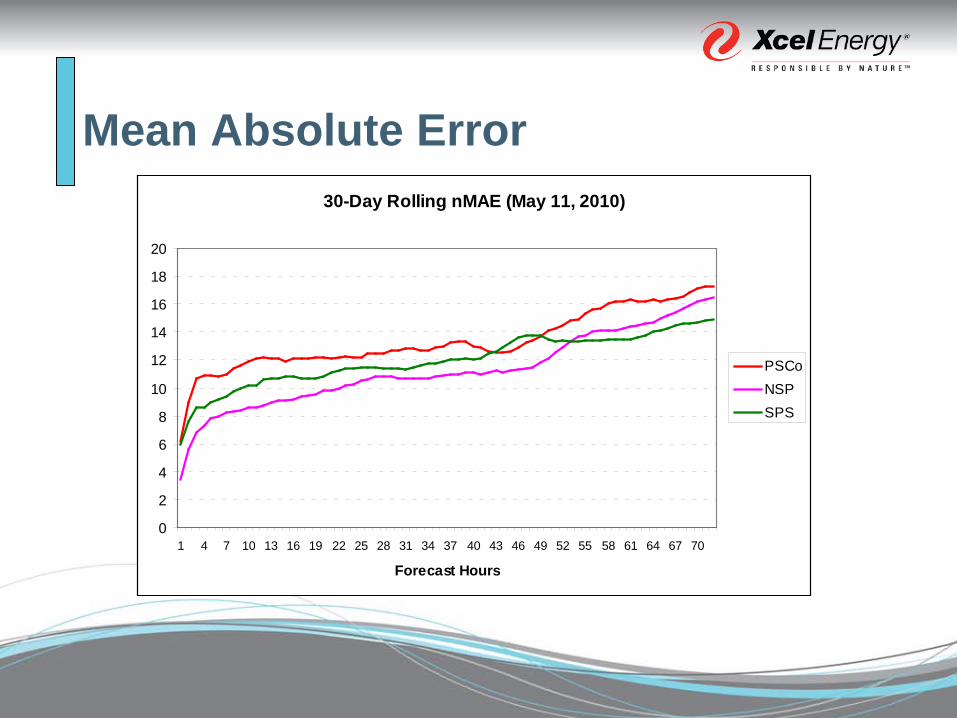
Mean Absolute Error30-Day Rolling nMAE (May 11, 2010)
0
2
4
6
8
10
12
14
16
18
20
1 4 7 10 13 16 19 22 25 28 31 34 37 40 43 46 49 52 55 58 61 64 67 70
Forecast Hours
PSCoNSPSPS