xcel energy inc. - empower our...
TRANSCRIPT
UNITED STATES
SECURITIES AND EXCHANGE COMMISSION
Washington, D.C. 20549
FORM 10-K (Mark One)
For the fiscal year ended December 31, 2012
or
Commission File Number: 1-3034
Xcel Energy Inc.
(Exact name of registrant as specified in its charter)
414 Nicollet Mall
Minneapolis, MN 55401 (Address of principal executive offices)
Registrant’s telephone number, including area code: 612-330-5500 Securities registered pursuant to Section 12(b) of the Act:
Indicate by check mark if the registrant is a well-known seasoned issuer, as defined in Rule 405 of the Securities Act. ⌧ Yes o No
Indicate by check mark if the registrant is not required to file reports pursuant to Section 13 or Section 15(d) of the Act. o Yes ⌧ No
Indicate by check mark whether the registrant (1) has filed all reports required to be filed by Section 13 or 15(d) of the Securities Exchange Act of 1934
during the preceding 12 months (or for such shorter period that the registrant was required to file such reports), and (2) has been subject to such filing requirements for the past 90 days. ⌧ Yes o No
Indicate by check mark whether the registrant has submitted electronically and posted on its corporate Website, if any, every Interactive Data File required to be submitted and posted pursuant to Rule 405 and Regulation S-T (§232.405 of this chapter) during the preceding 12 months (or for such shorter period that the registrant was required to submit and post such files). ⌧ Yes o No
Indicate by check mark if disclosure of delinquent filers pursuant to Item 405 of Regulations S-K (§229.405 of this chapter) is not contained herein, and will not be contained, to the best of the registrant’s knowledge, in definitive proxy or information statements incorporated by reference in Part III of this Form 10-K or any amendment to this Form 10-K. o
Indicate by check mark whether the registrant is a large accelerated filer, an accelerated filer, a non-accelerated filer, or a smaller reporting company. See the
definitions of “large accelerated filer,” “accelerated filer” and “smaller reporting company” in Rule 12b-2 of the Exchange Act. ⌧ Large accelerated filer o Accelerated filer o Non-accelerated filer (Do not check if a smaller reporting company) o Smaller Reporting Company
Indicate by check mark whether the registrant is a shell company (as defined in Rule 12b-2 of the Act). o Yes ⌧ No
As of June 30, 2012, the aggregate market value of the voting common stock held by non-affiliates of the Registrants was $13,843,781,225 and there were 487,285,506 shares of common stock outstanding.
XEL 10-K 12/31/2012
Section 1: 10-K (XCEL ENERGY INC 10-K 12-31-2012)
⌧⌧⌧⌧ ANNUAL REPORT PURSUANT TO SECTION 13 OR 15(d) OF THE SECURITIES EXCHANGE ACT OF 1934
o TRANSITION REPORT PURSUANT TO SECTION 13 OR 15(d) OF THE SECURITIES EXCHANGE ACT OF 1934
Minnesota 41-0448030 (State or other jurisdiction of incorporation or organization) (I.R.S. Employer Identification No.)
Title of each class Name of each exchange on which registered Common Stock, $2.50 par value per share New York $7.60 Junior Subordinated Notes, Series due 2068 New York Securities registered pursuant to section 12(g) of the Act: None

As of Feb. 14, 2013, there were 488,284,020 shares of common stock outstanding, $2.50 par value.
DOCUMENTS INCORPORATED BY REFERENCE
The Registrant’s Definitive Proxy Statement for its 2013 Annual Meeting of Shareholders is incorporated by reference into Part III of this Form 10-K.

TABLE OF CONTENTS
Index
PART I Item 1 — Business 3 DEFINITION OF ABBREVIATIONS AND INDUSTRY TERMS 3 COMPANY OVERVIEW 6 ELECTRIC UTILITY OPERATIONS 8 NSP-Minnesota 8 NSP-Wisconsin 15 PSCo 16 SPS 21 Electric Operating Statistics 26 NATURAL GAS UTILITY OPERATIONS 27 NSP-Minnesota 28 NSP-Wisconsin 29 PSCo 30 Natural Gas Operating Statistics 32 GENERAL 32 ENVIRONMENTAL MATTERS 33 CAPITAL SPENDING AND FINANCING 33 EMPLOYEES 33 EXECUTIVE OFFICERS 33 Item 1A — Risk Factors 35 Item 1B — Unresolved Staff Comments 43 Item 2 — Properties 43 Item 3 — Legal Proceedings 46 Item 4 — Mine Safety Disclosures 46 PART II Item 5 — Market for Registrant’s Common Equity, Related Stockholder Matters and Issuer Purchases of Equity Securities 46 Item 6 — Selected Financial Data 48 Item 7 — Management’s Discussion and Analysis of Financial Condition and Results of Operations 49 Item 7A — Quantitative and Qualitative Disclosures About Market Risk 77 Item 8 — Financial Statements and Supplementary Data 77 Item 9 — Changes in and Disagreements with Accountants on Accounting and Financial Disclosure 153 Item 9A — Controls and Procedures 153 Item 9B — Other Information 153 PART III Item 10 — Directors, Executive Officers and Corporate Governance 153 Item 11 — Executive Compensation 154 Item 12 — Security Ownership of Certain Beneficial Owners and Management and Related Stockholder Matters 154 Item 13 — Certain Relationships and Related Transactions, and Director Independence 154 Item 14 — Principal Accountant Fees and Services 154 PART IV Item 15 — Exhibits, Financial Statement Schedules 154 SIGNATURES 165
2

PART I
Item 1 — Business
DEFINITION OF ABBREVIATIONS AND INDUSTRY TERMS
Table of Contents
Xcel Energy Inc.’s Subsidiaries and Affiliates (current and former) Cheyenne Cheyenne Light, Fuel and Power Company CIG Colorado Interstate Gas Company Eloigne Eloigne Company NCE New Century Energies, Inc. NMC Nuclear Management Company, LLC NSP-Minnesota Northern States Power Company, a Minnesota corporation NSP System The integrated electric production and transmission system of
NSP-Minnesota and NSP-Wisconsin managed by NSP-Minnesota NSP-Wisconsin Northern States Power Company, a Wisconsin corporation PSCo Public Service Company of Colorado PSRI P.S.R. Investments, Inc. SPS Southwestern Public Service Co. Utility subsidiaries NSP-Minnesota, NSP-Wisconsin, PSCo and SPS WGI WestGas InterState, Inc. WYCO WYCO Development LLC Xcel Energy Xcel Energy Inc. and its subsidiaries Federal and State Regulatory Agencies ASLB Atomic Safety and Licensing Board CFTC Commodity Futures Trading Commission CPUC Colorado Public Utilities Commission DOE United States Department of Energy DOI United States Department of the Interior DOT United States Department of Transportation EIB New Mexico Environmental Improvement Board EPA United States Environmental Protection Agency FERC Federal Energy Regulatory Commission IRS Internal Revenue Service MPCA Minnesota Pollution Control Agency MPSC Michigan Public Service Commission MPUC Minnesota Public Utilities Commission NDPSC North Dakota Public Service Commission NERC North American Electric Reliability Corporation NMPRC New Mexico Public Regulation Commission NRC Nuclear Regulatory Commission PSCW Public Service Commission of Wisconsin PUCT Public Utility Commission of Texas SDPUC South Dakota Public Utilities Commission SEC Securities and Exchange Commission WDNR Wisconsin Department of Natural Resources
Electric, Purchased Gas and Resource Adjustment Clauses CIP Conservation improvement program DCRF Distribution cost recovery factor DRC Deferred renewable cost rider DSM Demand side management DSMCA Demand side management cost adjustment ECA Retail electric commodity adjustment EE Energy efficiency EECRF Energy efficiency cost recovery factor
3

Table of Contents
EIR Environmental improvement rider (recovers the costs associated with investments in environmental improvements to fossil fuel generation plants)
EPU Extended power uprate FCA Fuel clause adjustment FPPCAC Fuel and purchased power cost adjustment clause GAP Gas affordability program GCA Gas cost adjustment OATT Open access transmission tariff PCCA Purchased capacity cost adjustment PCRF Power cost recovery factor (recovers the costs of certain purchased power costs) PGA Purchased gas adjustment PSIA Pipeline system integrity adjustment QSP Quality of service plan RDF Renewable development fund RES Renewable energy standard (recovers the costs of new renewable generation) RESA Renewable energy standard adjustment SCA Steam cost adjustment SEP State energy policy TCA Transmission cost adjustment TCR Transmission cost recovery adjustment TCRF Transmission cost recovery factor (recovers transmission infrastructure improvement costs
and changes in wholesale transmission charges)
Other Terms and Abbreviations AFUDC Allowance for funds used during construction ALJ Administrative law judge APBO Accumulated postretirement benefit obligation ARC Aggregator of retail customers ARO Asset retirement obligation ASU FASB Accounting Standards Update BART Best available retrofit technology CAA Clean Air Act CACJA Clean Air Clean Jobs Act CAIR Clean Air Interstate Rule CapX2020 Alliance of electric cooperatives, municipals and investor-owned utilities in the upper
Midwest involved in a joint transmission line planning and construction effort CCN Certificate of convenience and necessity CO
2 Carbon dioxide
COLI Corporate owned life insurance CON Certificate of need CPCN Certificate of public convenience and necessity CSAPR Cross-State Air Pollution Rule CWIP Construction work in progress EEI Edison Electric Institute EGU Electric generating unit EPS Earnings per share ETR Effective tax rate FASB Financial Accounting Standards Board FTR Financial transmission right GAAP Generally accepted accounting principles GHG Greenhouse gas IFRS International Financial Reporting Standards LLW Low-level radioactive waste LNG Liquefied natural gas MACT Maximum achievable control technology MGP Manufactured gas plant MISO Midwest Independent Transmission System Operator, Inc. Moody’s Moody’s Investor Services
4

Table of Contents
MVP Multi-value project Native load Customer demand of retail and wholesale customers that a utility has an obligation to serve
under statute or long-term contract NEI Nuclear Energy Institute NOL Net operating loss NOx Nitrogen oxide NOV Notice of violation NTC Notifications to construct O&M Operating and maintenance OCI Other comprehensive income PBRP Performance-based regulatory plan PCB Polychlorinated biphenyl PFS Private Fuel Storage, LLC PJM PJM Interconnection, LLC PM Particulate matter PPA Purchased power agreement Provident Provident Life & Accident Insurance Company PRP Potentially responsible party PSP Performance share plan PTC Production tax credit PURPA Public Utilities Regulatory Policy Act of 1978 PV Photovoltaic QF Qualifying facilities REC Renewable energy credit RFP Request for proposal ROE Return on equity RPS Renewable portfolio standards RSG Revenue sufficiency guarantee RSU Restricted stock unit RTO Regional Transmission Organization SCR Selective catalytic reduction SIP State implementation plan SO2 Sulfur dioxide
SPP Southwest Power Pool, Inc. Standard & Poor’s Standard & Poor’s Ratings Services TSR Total shareholder return Measurements Bcf Billion cubic feet GWh Gigawatt hours KV Kilovolts KWh Kilowatt hours Mcf Thousand cubic feet MMBtu Million British thermal units MW Megawatts MWh Megawatt hours
5

COMPANY OVERVIEW
Xcel Energy Inc. is a holding company with subsidiaries engaged primarily in the utility business. In 2012, Xcel Energy Inc.’s continuing operations included the activity of four wholly owned utility subsidiaries that serve electric and natural gas customers in eight states. These utility subsidiaries are NSP-Minnesota, NSP-Wisconsin, PSCo and SPS, and serve customers in portions of Colorado, Michigan, Minnesota, New Mexico, North Dakota, South Dakota, Texas and Wisconsin. Along with WYCO, a joint venture formed with CIG to develop and lease natural gas pipelines, storage, and compression facilities, and WGI, an interstate natural gas pipeline company, these companies comprise the continuing regulated utility operations. Xcel Energy Inc. was incorporated under the laws of Minnesota in 1909. Xcel Energy’s executive offices are located at 414 Nicollet Mall, Minneapolis, Minn. 55401. Its website address is www.xcelenergy.com. Xcel Energy makes available, free of charge through its website, its annual report on Form 10-K, quarterly reports on Form 10-Q, current reports on Form 8-K and all amendments to those reports filed or furnished pursuant to Section 13(a) or 15(d) of the Securities Exchange Act of 1934 as soon as reasonably practicable after the reports are electronically filed with or furnished to the SEC. The public may read and copy any materials that Xcel Energy files with the SEC at the SEC’s Public Reference Room at 100 F Street, N.E., Washington, D.C. 20549. The public may obtain information on the operation of the Public Reference Room by calling the SEC at 1-800-SEC-0330. The SEC also maintains an internet site that contains reports, proxy and information statements, and other information regarding issuers that file electronically with the SEC at http://www.sec.gov. Xcel Energy’s corporate strategy focuses on three core objectives: obtain stakeholder alignment; invest in our regulated utility businesses; and earn a fair return on our utility investments. Xcel Energy files periodic rate cases and establishes formula rates or automatic rate adjustment mechanisms with state and federal regulators to earn a return on its investments and recover costs of operations. Environmental leadership is a core priority for Xcel Energy and is designed to meet customer and policy maker expectations for clean energy at a competitive price while creating shareholder value. NSP-Minnesota NSP-Minnesota is an operating utility primarily engaged in the generation, purchase, transmission, distribution and sale of electricity in Minnesota, North Dakota and South Dakota. The wholesale customers served by NSP-Minnesota comprised approximately 4 percent of its total KWh sold in 2012. NSP-Minnesota also purchases, transports, distributes and sells natural gas to retail customers and transports customer-owned natural gas in Minnesota and North Dakota. NSP-Minnesota provides electric utility service to approximately 1.4 million customers and natural gas utility service to approximately 0.5 million customers. Approximately 89 percent of NSP-Minnesota’s retail electric operating revenues were derived from operations in Minnesota during 2012. Although NSP-Minnesota’s large commercial and industrial electric retail customers are comprised of many diversified industries, a significant portion of NSP-Minnesota’s large commercial and industrial electric sales include customers in the following industries: petroleum and coal, as well as food products. For small commercial and industrial customers, significant electric retail sales include customers in the following industries: real estate and educational services. Generally, NSP-Minnesota’s earnings contribute approximately 35 percent to 45 percent of Xcel Energy’s consolidated net income. The electric production and transmission costs of the entire NSP System are shared by NSP-Minnesota and NSP-Wisconsin. A FERC-approved Interchange Agreement between the two companies provides for the sharing of all generation and transmission costs of the NSP System. Such costs include current and potential obligations of NSP-Minnesota related to its nuclear generating facilities. NSP-Minnesota owns the following direct subsidiaries: United Power and Land Company, which holds real estate; and NSP Nuclear Corporation, which owns NMC, an inactive company.
Table of Contents
6

NSP-Wisconsin NSP-Wisconsin is an operating utility primarily engaged in the generation, transmission, distribution and sale of electricity in portions of northwestern Wisconsin and in the western portion of the Upper Peninsula of Michigan. The wholesale customers served by NSP-Wisconsin comprised approximately 6 percent of its total KWh sold in 2012. NSP-Wisconsin also purchases, transports, distributes and sells natural gas to retail customers and transports customer-owned natural gas in the same service territory. NSP-Wisconsin provides electric utility service to approximately 251,000 customers and natural gas utility service to approximately 108,000 customers. Approximately 98 percent of NSP-Wisconsin’s retail electric operating revenues were derived from operations in Wisconsin during 2012. Although NSP-Wisconsin’s large commercial and industrial electric retail customers are comprised of many diversified industries, a significant portion of NSP-Wisconsin’s large commercial and industrial electric sales include customers in the following industries: paper and allied products, food products, as well as oil and gas extraction. For small commercial and industrial customers, significant electric retail sales include customers in the following industries: grocery and dining establishments and educational services. Generally, NSP-Wisconsin’s earnings contribute approximately 5 percent to 10 percent of Xcel Energy’s consolidated net income. The management of the electric production and transmission system of NSP-Wisconsin is integrated with NSP-Minnesota. NSP-Wisconsin owns the following direct subsidiaries: Chippewa and Flambeau Improvement Co., which operates hydro reservoirs; Clearwater Investments Inc., which owns interests in affordable housing; and NSP Lands, Inc., which holds real estate. PSCo PSCo is an operating utility engaged primarily in the generation, purchase, transmission, distribution and sale of electricity in Colorado. The wholesale customers served by PSCo comprised approximately 13 percent of its total KWh sold in 2012. PSCo also purchases, transports, distributes and sells natural gas to retail customers and transports customer-owned natural gas. PSCo provides electric utility service to approximately 1.4 million customers and natural gas utility service to approximately 1.3 million customers. All of PSCo’s retail electric operating revenues were derived from operations in Colorado during 2012. Although PSCo’s large commercial and industrial electric retail customers are comprised of many diversified industries, a significant portion of PSCo’s large commercial and industrial electric sales include customers in the following industries: fabricated metal products, as well as oil and gas extraction. For small commercial and industrial customers, significant electric retail sales include customers in the following industries: real estate and dining establishments. Generally, PSCo’s earnings contribute approximately 45 percent to 55 percent of Xcel Energy’s consolidated net income. PSCo owns the following direct subsidiaries: 1480 Welton, Inc. and United Water Company, both of which own certain real estate interests; and Green and Clear Lakes Company, which owns water rights and certain real estate interests. PSCo also owns PSRI, which held certain former employees’ life insurance policies. PSCo also holds a controlling interest in several other relatively small ditch and water companies. SPS SPS is an operating utility engaged primarily in the generation, purchase, transmission, distribution and sale of electricity in portions of Texas and New Mexico. The wholesale customers served by SPS comprised approximately 33 percent of its total KWh sold in 2012. SPS provides electric utility service to approximately 381,000 retail customers in Texas and New Mexico. Approximately 74 percent of SPS’ retail electric operating revenues were derived from operations in Texas during 2012. Although SPS’ large commercial and industrial electric retail customers are comprised of many diversified industries, a significant portion of SPS’ large commercial and industrial electric sales include customers in the following industries: oil and gas extraction, as well as petroleum and coal products. For small commercial and industrial customers, significant electric retail sales include customers in the following industries: oil and gas extraction and crop related agricultural industries. Generally, SPS’ earnings contribute approximately 5 percent to 15 percent of Xcel Energy’s consolidated net income. Other Subsidiaries WGI is a small interstate natural gas pipeline company engaged in transporting natural gas from the PSCo system near Chalk Bluffs, Colo., to the Cheyenne system near Cheyenne, Wyo. WYCO was formed as a joint venture with CIG to develop and lease natural gas pipeline, storage, and compression facilities. Xcel Energy has a 50 percent ownership interest in WYCO. The gas pipeline and storage facilities are leased under a FERC-approved agreement to CIG.
Table of Contents
7

Xcel Energy Services Inc. is the service company for Xcel Energy Inc. Xcel Energy Inc.’s nonregulated subsidiary is Eloigne, which invests in rental housing projects that qualify for low-income housing tax credits. Xcel Energy conducts its utility business in the following reportable segments: regulated electric utility, regulated natural gas utility and all other. See Note 16 to the consolidated financial statements for further discussion relating to comparative segment revenues, income from continuing operations and related financial information.
ELECTRIC UTILITY OPERATIONS
NSP-Minnesota Public Utility Regulation Summary of Regulatory Agencies and Areas of Jurisdiction — Retail rates, services and other aspects of NSP-Minnesota’s operations are regulated by the MPUC, the NDPSC and the SDPUC within their respective states. The MPUC also has regulatory authority over security issuances, property transfers, mergers, dispositions of assets and transactions between NSP-Minnesota and its affiliates. In addition, the MPUC reviews and approves NSP-Minnesota’s electric resource plans for meeting customers’ future energy needs. The MPUC also certifies the need for generating plants greater than 50 MW and transmission lines greater than 100 KV that will be located within the state. No large power plant or transmission line may be constructed in Minnesota except on a site or route designated by the MPUC. The NDPSC and SDPUC have regulatory authority over generation and transmission facilities, along with the siting and routing of new generation and transmission facilities in North Dakota and South Dakota, respectively. NSP-Minnesota is subject to the jurisdiction of the FERC with respect to its wholesale electric operations, hydroelectric licensing, accounting practices, wholesale sales for resale, transmission of electricity in interstate commerce, compliance with NERC electric reliability standards, asset transfers and mergers, and natural gas transactions in interstate commerce. NSP-Minnesota has been granted continued authorization from the FERC to make wholesale electric sales at market-based prices. NSP-Minnesota is a transmission owning member of the MISO RTO. Fuel, Purchased Energy and Conservation Cost-Recovery Mechanisms — NSP-Minnesota has several retail adjustment clauses that recover fuel, purchased energy and other resource costs:
The MPUC approved NSP-Minnesota’s request that the recovery of the costs associated with the EIR and RES be included in base rates in the Minnesota electric rate case as part of the final rates effective Sept. 1, 2012. No costs are being recovered through the EIR at this time. NSP-Minnesota will continue to track PTCs associated with company-owned renewable projects and reflect the difference between the base rate amount and actual costs in the RES adjustment clause. NSP-Minnesota’s retail electric rates in Minnesota, North Dakota and South Dakota include a FCA for monthly billing adjustments for changes in prudently incurred cost of fuel, fuel related items and purchased energy. NSP-Minnesota is permitted to recover these costs through FCA mechanisms approved by the regulators in each jurisdiction. The FCA allows NSP-Minnesota to bill customers for the cost of fuel and related costs used to generate electricity at its plants and energy purchased from other suppliers. In general, capacity costs are not recovered through the FCA. In addition, costs associated with MISO are generally recovered through either the FCA or base rates.
Table of Contents
• CIP — The CIP recovers the costs of programs that help customers save energy. CIP includes a comprehensive list of programs that benefit all customers including Saver’s Switch®, energy efficiency rebates and energy audits.
• EIR — The EIR recovers the costs of environmental improvement projects. • GAP — The GAP is a surcharge billed to all non-interruptible customers to recover the costs of offering a low-income customer co-pay program
designed to reduce natural gas service disconnections. • RDF — The RDF allocates money collected from retail customers to support the research and development of emerging renewable energy projects and
technologies. • RES — The RES recovers the cost of new renewable generation. • SEP — The SEP recovers costs related to various energy policies approved by the Minnesota legislature. • TCR — The TCR recovers costs associated with new investments in electric transmission.
8

Minnesota state law requires electric utilities to invest 1.5 percent of their state revenues in CIP, except NSP-Minnesota, which is required by law to invest 2 percent. NSP-Minnesota was in compliance with this standard in 2012 and expects to be in compliance in 2013. These costs are recovered through an annual cost-recovery mechanism for electric conservation and energy management program expenditures. CIP Triennial Plan — In October 2012, the Department of Commerce approved NSP-Minnesota’s 2013 through 2015 CIP Triennial Plan, which increases the savings goals and budgets over the previous plan. The plan sets an electric goal of annually saving the equivalent of 1.5 percent of sales (calculated on a historical three-year average, excluding opt-out customers) and an annual natural gas goal of saving 1.0 percent of sales. The combined electric and gas budgets average $104 million per year over the 2013 through 2015 period. Capacity and Demand Uninterrupted system peak demand for the NSP System’s electric utility for each of the last three years and the forecast for 2013, assuming normal weather, is listed below.
The peak demand for the NSP System typically occurs in the summer. The 2012 uninterrupted system peak demand for the NSP System occurred on July 2, 2012. The 2011 peak demand occurred on a day with extremely high temperatures and humidity, which resulted in the highest uninterrupted system peak demand since July 31, 2006. The 2012 peak demand occurred uninterrupted on a day with weather much closer to normal peak day conditions. The forecast for 2013 assumes normal peak day weather and includes the impact of the termination of several firm wholesale contracts primarily at NSP-Wisconsin. The 2013 forecast also reflects the impact of two large commercial and industrial customers that have ceased operations. These customers represented 0.05 percent of 2012 sales. Energy Sources and Related Transmission Initiatives NSP-Minnesota expects to use existing power plants, power purchases, CIP options, new generation facilities and expansion of existing power plants to meet its system capacity requirements. Purchased Power — NSP-Minnesota has contracts to purchase power from other utilities and independent power producers. Long-term purchased power contracts typically require a periodic payment to secure the capacity and a charge for the associated energy actually purchased. NSP-Minnesota also makes short-term purchases to meet system load and energy requirements, to replace generation from company-owned units under maintenance or during outages, to meet operating reserve obligations, or to obtain energy at a lower cost. Purchased Transmission Services — In addition to using their integrated transmission system, NSP-Minnesota and NSP-Wisconsin have contracts with MISO and regional transmission service providers to deliver power and energy to the NSP System. NSP System Resource Plans — In November 2012, the MPUC issued an order on NSP-Minnesota’s resource plan and required additional filings to determine the next resources needed for the NSP System generating capacity. In December 2012, NSP-Minnesota filed its information indicating an estimated need of 150 MW in 2017 and increasing to 440 MW by 2019, with the size and timing to be determined by the MPUC. A competitive acquisition process is anticipated to commence in March 2013 and result in the selection of a developer or developers by the MPUC in the fourth quarter of 2013. See additional discussion within the Prairie Island Nuclear EPU section below. CapX2020 — In 2009, the MPUC granted CONs to construct one 230 KV electric transmission line and three 345 KV electric transmission lines as part of the CapX2020 project. The estimated cost of the four major transmission projects is $1.9 billion. NSP-Minnesota and NSP-Wisconsin are responsible for approximately $1.1 billion of the total cost. The remainder of the costs will be borne by other utilities in the upper Midwest. These cost estimates will be updated as the projects progress. Hampton, Minn. to Rochester, Minn. to La Crosse, Wis. 345 KV transmission line In May 2012, the MPUC issued a route permit for the Minnesota portion of the project. Two parties have filed an appeal with the Minnesota Court of Appeals against the MPUC’s route permit decision. A decision by the Court is anticipated in mid-2013. In May 2012, the PSCW issued a CPCN for the Wisconsin portion of the project. Subsequent legal challenges to the PSCW’s order by intervenors were unsuccessful, thereby rendering the PSCW’s decision final. Construction on the project started in Minnesota in January 2013 and the project is expected to go into service in 2015.
Table of Contents
System Peak Demand (in MW) 2010 2011 2012 2013 Forecast NSP System 9,131 9,792 9,475 9,215
9

Monticello, Minn. to Fargo, N.D. 345 KV transmission line In December 2011, the Monticello, Minn. to St. Cloud, Minn. portion of the Monticello, Minn. to Fargo, N.D. project was placed in service. The MPUC issued a route permit for the Minnesota portion of the St. Cloud, Minn. to Fargo, N.D. section in June 2011. The NDPSC granted a CPCN in January 2011 and a certificate of corridor compatibility and route permit for the portion of the line in North Dakota in September 2012. In January 2013, construction started on the project in North Dakota. Brookings County, S.D. to Hampton, Minn. 345 KV transmission line The MPUC route permit approvals for the Minnesota segments were obtained in 2010 and 2011. In June 2011, the SDPUC approved a facility permit for the South Dakota segment. In December 2011, MISO granted the final approval of the project as a MVP. In May 2012, construction started on the project in Minnesota. Bemidji, Minn. to Grand Rapids, Minn. 230 KV transmission line The Bemidji, Minn. to Grand Rapids, Minn. line was placed in service in September 2012. Black Dog Repowering CON — In November 2012, the MPUC approved the termination of the Black Dog Repowering CON proceeding. Nuclear Power Operations and Waste Disposal NSP-Minnesota owns two nuclear generating plants: the Monticello plant and the Prairie Island plant. Nuclear power plant operations produce gaseous, liquid and solid radioactive wastes. The discharge and handling of such wastes are controlled by federal regulation. High-level radioactive wastes primarily include used nuclear fuel. LLW consists primarily of demineralizer resins, paper, protective clothing, rags, tools and equipment that have become contaminated through use in a plant. NRC Regulation — The NRC regulates the nuclear operations of NSP-Minnesota. Decisions by the NRC can significantly impact the operations of the nuclear generating plants. The event at the nuclear generating plant in Fukushima, Japan in 2011 could impact the NRC’s deliberations on NSP-Minnesota’s Monticello power uprate request and could also result in additional regulation, which could require additional capital expenditures or operating expenses. The NRC has created an internal task force that has developed recommendations on whether it should require immediate emergency preparedness and mitigating enhancements at U.S. reactors and any changes to NRC regulations, inspection procedures and licensing processes. In July 2011, the task force released its recommendations in a written report which recommends actions to enhance U.S. nuclear generating plant readiness to safely manage severe events. In March 2012, the NRC issued three orders and a request for additional information to all licensees. The orders included requirements for mitigation strategies for beyond-design-basis external events, requirements with regard to reliable spent fuel instrumentation and requirements with regard to reliable hardened containment vents, which are applicable to boiling water reactor containments at the Monticello plant. The request for additional information included requirements to perform walkdowns of seismic and flood protection, to evaluate seismic and flood hazards and to assess the emergency preparedness staffing and communications capabilities at each plant. NSP-Minnesota expects that complying with these requirements will cost approximately $35 to $50 million at the Monticello and Prairie Island plants. Based on current refueling outage plans specific to each nuclear facility, the dates of the required compliance to meet the orders is expected to begin in the second quarter of 2015 with all units expected to be fully compliant by December 2016. Portions of the work that fall under the requests for additional information are expected to be completed by 2018. NSP-Minnesota believes the costs associated with compliance would be recoverable from customers through regulatory mechanisms and does not expect a material impact on its results of operations, financial position, or cash flows. LLW Disposal — LLW from NSP-Minnesota’s Monticello and Prairie Island nuclear plants is currently disposed at the Clive facility located in Utah. If off-site LLW disposal facilities become unavailable, NSP-Minnesota has storage capacity available on-site at Prairie Island and Monticello that would allow both plants to continue to operate until the end of their current licensed lives. High-Level Radioactive Waste Disposal — The federal government has the responsibility to permanently dispose of domestic spent nuclear fuel and other high-level radioactive wastes. The Nuclear Waste Policy Act requires the DOE to implement a program for nuclear high-level waste management. This includes the siting, licensing, construction and operation of a repository for spent nuclear fuel from civilian nuclear power reactors and other high-level radioactive wastes at a permanent federal storage or disposal facility.
Table of Contents
10

Nuclear Geologic Repository - Yucca Mountain Project In 2002, the U.S. Congress designated Yucca Mountain, Nevada as the first deep geologic repository. In 2008, the DOE submitted an application to construct a deep geologic repository at this site to the NRC. In 2010, the DOE announced its intention to stop the Yucca Mountain project and requested the NRC approve the withdrawal of the application. In June 2010, the ASLB issued a ruling that the DOE could not withdraw the Yucca Mountain application. In September 2011, the NRC announced that it was evenly divided on whether to take the affirmative action of overturning or upholding the ASLB decision. Because the NRC could not reach a decision, an order was issued instructing that information associated with the ASLB adjudication should be preserved. The ASLB complied and the proceeding has been suspended. The DOE’s decision and the resulting stoppage of the NRC’s review has prompted multiple legal challenges, including the DOE’s authority to stop the project and withdraw the application, the DOE’s authority to continue to collect the nuclear waste fund fee and the NRC’s authority to stop their review of the DOE’s application. The utility industry, including Xcel Energy, Inc. and NSP-Minnesota, are represented in these challenges by the NEI. Currently, only the challenges to set the nuclear waste fund fee collection rate to zero and seeking the NRC to complete their review remain active and decisions are expected from the U.S. Court of Appeals for the District of Columbia Circuit (D.C. Circuit) in 2013. At the time that the DOE decided to stop the Yucca Mountain project and withdraw the application, the Secretary of Energy convened a Blue Ribbon Commission to recommend alternatives to Yucca Mountain for disposal of used nuclear fuel. In January 2012, the Blue Ribbon Commission report was issued. The report provided numerous policy recommendations that are being considered by the Secretary of Energy. In January 2013, the DOE provided its report to Congress relative to their plans to implement the Blue Ribbon Commission’s recommendations including the required legislative changes and authorizations required. The report also announced the Obama Administration's intent to make a pilot consolidated interim storage facility available in 2021, a larger consolidated interim storage facility available in 2025 and a deep geologic repository available in 2048. Nuclear Spent Fuel Storage NSP-Minnesota has interim on-site storage for spent nuclear fuel at its Monticello and Prairie Island nuclear generating plants. As of Dec. 31, 2012, there were 29 casks loaded and stored at the Prairie Island plant and 10 canisters loaded and stored at the Monticello plant. An additional 35 casks for Prairie Island and 20 canisters for Monticello have been authorized by the State of Minnesota. This currently authorized storage capacity is sufficient to allow NSP-Minnesota to operate until the end of the renewed operating licenses in 2030 for Monticello, 2033 for Prairie Island Unit 1, and 2034 for Prairie Island Unit 2. PFS — The eight partners of PFS, including NSP-Minnesota, have agreed to dissolve the LLC. PFS filed a letter with the NRC in December 2012 requesting to terminate the PFS license effective immediately. PFS will be taking the appropriate actions to dissolve the LLC in 2013. NRC Waste Confidence Decision (WCD) — In June 2012, the D.C. Circuit issued a ruling to vacate and remand the NRC’s WCD. The WCD assesses how long temporary on-site storage can remain safe and when facilities for the disposal of nuclear waste will become available. The D.C. Circuit remanded the WCD to the NRC and directed it to prepare an environmental impact statement (EIS) if there are significant impacts or an environmental assessment to support a finding of no significant impact. In September 2012, the NRC Commissioners directed the NRC Staff to develop an EIS and a revised WCD and rule on the temporary storage of spent nuclear fuel. The EIS and rule are to be completed within 24 months. NSP-Minnesota does not believe that there will be an immediate impact on operations at the Prairie Island or Monticello nuclear generating plants. See Notes 13 and 14 to the consolidated financial statements for further discussion regarding nuclear related items. Nuclear Plant Power Uprates and Life Extension Life Extensions — In 2006, the NRC renewed the Monticello operating license allowing the plant to operate until 2030. In 2011, the NRC issued renewed operating licenses for Prairie Island Units 1 and 2, allowing Unit 1 to operate until 2033 and Unit 2 until 2034. Prairie Island Independent Spent Fuel Storage Installation (ISFSI) License Renewal — The current license to operate an ISFSI at Prairie Island expires in October 2013. An application to renew the ISFSI license for an additional 40 years until 2053 was submitted by NSP-Minnesota to the NRC in October 2011. In August 2012, the Prairie Island Indian Community (PIIC) petitioned to intervene and filed contentions with the NRC. In September 2012, the NRC named an ASLB to review the PIIC’s request to intervene and contentions. In December 2012, the ASLB found that the PIIC had standing to intervene and admitted three of the seven contentions put forward by the PIIC. The ASLB will establish a schedule for the hearing which should be completed by mid-2014. As Prairie Island met the NRC’s criteria for timely renewal by submitting its ISFSI license renewal application more than two years in advance of the expiration of the ISFSI’s current license, it will be allowed to continue to operate under the current license until the NRC has rendered a decision on the license renewal application.
Table of Contents
11

Prairie Island Nuclear Plant EPU — In 2009, the MPUC granted NSP-Minnesota a CON for an EPU project at the Prairie Island nuclear generating plant. The total estimated cost of the EPU was $294 million, of which approximately $77.6 million has been incurred, including AFUDC of approximately $13.3 million. Subsequently, NSP-Minnesota filed a resource plan update and a change of circumstances filing notifying the MPUC that there were changes in the size, timing and cost estimates for this project, revisions to economic and project design analysis and changes due to the estimated impact of revised scheduled outages. The information indicated reductions to the estimated benefit of the uprate project. As a result, NSP-Minnesota concluded that further investment in this project would not benefit customers. In December 2012, the MPUC voted unanimously that no party had shown cause to prevent termination of the EPU CON. The MPUC is expected to issue an order terminating the EPU CON in the first half of 2013. NSP-Minnesota plans to address recovery of incurred costs in the next rate case for each of the NSP-Minnesota jurisdictions and to file a request with the FERC for approval to recover a portion of the costs from NSP-Wisconsin through the Interchange Agreement. NSP-Wisconsin plans to seek cost recovery in a future rate case. Based on the outcome of the MPUC decision, EPU costs incurred to date were compared to the discounted value of the estimated future rate recovery based on past jurisdictional precedent, resulting in a $10.1 million pretax charge in December 2012 which is included in O&M expense. Monticello Nuclear Plant EPU — In 2008, NSP-Minnesota filed for both state and federal approvals of an EPU of approximately 71 MW for NSP-Minnesota’s Monticello nuclear generating plant. The MPUC approved the CON for the EPU in 2008. The license amendment filing was placed on hold by the NRC Staff to address concerns raised by the Advisory Committee on Reactor Safeguards related to containment pressure associated with pump performance. In September 2012, NSP-Minnesota made a supplemental filing to the NRC to address the containment accident pressure concern, as part of its application to amend the operating license to allow the power uprate. NSP-Minnesota expects to receive approval of the EPU project by the NRC in the second half of 2013. NSP-Minnesota is planning to complete implementation of the equipment changes needed to support the Monticello life extension and EPU projects in the planned spring 2013 refueling outage. Overall, NSP-Minnesota is nearing completion of its life cycle management and EPU project at the Monticello nuclear generating plant to help ensure continued safe and reliable operation through 2030, and to provide additional capacity of approximately 71 MW. As a result of the licensing delays discussed above, as well as engineering design changes and emergent work discovered during implementation, both the cost and the projected in-service date exceed initial estimates, consistent with experience of other nuclear plant life extension and uprate projects. In addition, despite the cancellation of the EPU project at the Prairie Island nuclear generating plant, NSP-Minnesota is implementing life cycle management improvements at the Prairie Island facilities to help ensure their safe and reliable operation through 2034. The major capital investments for these activities at the Monticello and Prairie Island nuclear generating plants are expected to be completed in the years 2013 through 2017, with combined forecasted capital costs in that period of approximately $500 million. Energy Source Statistics
Table of Contents
Year Ended Dec. 31 2012 2011 2010
NSP System Millions of
KWh Percent of Generation
Millions of KWh
Percent of Generation
Millions of KWh
Percent of Generation
Coal 16,023 35 % 20,131 44 % 19,579 42 %Nuclear 13,231 29 13,332 29 14,628 31 Natural Gas 6,200 13 3,016 7 3,887 8 Wind (a) 5,443 12 4,312 9 3,760 8 Hydroelectric 3,193 7 3,444 8 3,487 7 Other (b) 1,617 4 1,453 3 1,494 4
Total 45,707 100 % 45,688 100 % 46,835 100 %
Owned generation 31,365 69 % 31,668 69 % 33,758 72 %Purchased generation 14,342 31 14,020 31 13,077 28
Total 45,707 100 % 45,688 100 % 46,835 100 %
(a) This category includes wind energy de-bundled from RECs and also includes Windsource RECs. The NSP System uses RECs to meet or exceed state resource requirements and may sell surplus RECs.
(b) Includes energy from other sources, including solar, biomass, oil and refuse. Distributed generation from the Solar*Rewards program is not included.
12

Fuel Supply and Costs The following table shows the delivered cost per MMBtu of each significant category of fuel consumed for owned electric generation, the percentage of total fuel requirements represented by each category of fuel and the total weighted average cost of all fuels.
* Includes refuse-derived fuel and wood. See Items 1A and 7 for further discussion of fuel supply and costs. Fuel Sources Coal — The NSP System normally maintains approximately 41 days of coal inventory. Coal supply inventories at Dec. 31, 2012 and 2011 were approximately 39 and 48 days usage, respectively. NSP-Minnesota’s generation stations use low-sulfur western coal purchased primarily under contracts with suppliers operating in Wyoming and Montana. During 2012 and 2011, coal requirements for the NSP System’s major coal-fired generating plants were approximately 7.2 million tons and 9.5 million tons, respectively. The estimated coal requirements for 2013 are approximately 8.6 million tons. NSP-Minnesota and NSP-Wisconsin have contracted for coal supplies to provide 97 percent of their coal requirements in 2013, and a declining percentage of the requirements in subsequent years. The NSP System’s general coal purchasing objective is to contract for approximately 100 percent of requirements for the following year, 67 percent of requirements in two years, and 33 percent of requirements in three years. Remaining requirements will be filled through the procurement process or over-the-counter transactions. NSP-Minnesota and NSP-Wisconsin have a number of coal transportation contracts that provide for delivery of 100 and 80 percent of their coal requirements in 2013 and 2014, respectively. Coal delivery may be subject to short-term interruptions or reductions due to operation of the mines, transportation problems, weather and availability of equipment. Nuclear — To operate NSP-Minnesota’s nuclear generating plants, NSP-Minnesota secures contracts for uranium concentrates, uranium conversion, uranium enrichment and fuel fabrication. The contract strategy involves a portfolio of spot purchases and medium and long-term contracts for uranium concentrates, conversion services and enrichment services with multiple producers and with a focus on diversification to minimize potential impacts caused by supply interruptions due to geographical and world political issues.
Fabrication services for Monticello and Prairie Island are 100 percent committed through 2025 and 2014, respectively. A contract for fuel fabrication services for Prairie Island is currently being negotiated for 2015 and beyond. NSP-Minnesota expects sufficient uranium concentrates, conversion services and enrichment services to be available for the total fuel requirements of its nuclear generating plants. Some exposure to spot market price volatility will remain due to index-based pricing structures contained in certain supply contracts.
Table of Contents
Coal* Nuclear Natural Gas Weighted
Average Owned NSP System Generating Plants Cost Percent Cost Percent Cost Percent Fuel Cost 2012 $ 2.13 47% $ 0.90 42% $ 4.21 11% $ 1.88 2011 2.06 55 0.89 40 6.56 5 1.82 2010 1.89 51 0.83 42 6.29 7 1.73
• Current nuclear fuel supply contracts cover 100 percent of uranium concentrates requirements through 2018 and approximately 67 percent of the requirements for 2019 through 2025.
• Current contracts for conversion services cover 100 percent of the requirements through 2020 and approximately 67 percent of the requirements for 2021 through 2025.
• Current enrichment service contracts cover 99.7 percent of the requirements through 2022 and approximately 84 percent of the requirements for 2023 through 2025.
13

Natural gas — The NSP System uses both firm and interruptible natural gas supply and standby oil in combustion turbines and certain boilers. Natural gas supplies and associated transportation and storage services for power plants are procured under contracts with various terms to provide an adequate supply of fuel. However, as natural gas primarily serves intermediate and peak demand, remaining forecasted requirements are able to be procured through a liquid spot market. Generally, natural gas supply contracts have pricing that is tied to various natural gas indices. Most transportation contract pricing is based on FERC approved transportation tariff rates. These transportation rates are subject to revision based upon FERC approval of changes in the timing or amount of allowable cost recovery by providers. Certain natural gas supply and transportation agreements include obligations for the purchase and/or delivery of specified volumes of natural gas or to make payments in lieu of delivery. At Dec. 31, 2012 and 2011, the NSP System did not have any commitments related to gas supply contracts; however commitments related to gas transportation and storage contracts were approximately $384 million and $462 million, respectively. Commitments related to gas transportation and storage contracts expire in various years from 2013 to 2028. The NSP System also has limited on-site fuel oil storage facilities and primarily relies on the spot market for incremental supplies. Renewable Energy Sources The NSP System’s renewable energy portfolio includes wind, hydroelectric, biomass and solar power from both owned generating facilities and PPAs. As of Dec. 31, 2012, the NSP System was in compliance with mandated RPS, which require generation from renewable resources of 18 percent and 8.89 percent of NSP-Minnesota and NSP-Wisconsin electric retail sales, respectively. Renewable energy comprised 22.0 percent and 19.7 percent of the NSP System’s total owned and purchased energy for 2012 and 2011, respectively. Wind energy comprised 11.9 percent and 9.4 percent of the total owned and purchased energy on the NSP System for 2012 and 2011, respectively. Hydroelectric energy comprised 7.0 percent and 7.5 percent of the total owned and purchased energy on the NSP System for 2012 and 2011, respectively. Biomass and solar power comprised approximately 3.1 percent and 2.8 percent of renewable energy for 2012 and 2011, respectively. The NSP System also offers customer-focused renewable energy initiatives. Windsource®, one of the nation’s largest voluntary renewable energy programs, allows customers in Minnesota, Wisconsin, and Michigan to purchase a portion or all of their electricity from renewable sources. Approximately 24,000 and 23,000 customers purchased 184,000 MWh and 177,000 MWh of electricity under the Windsource program in 2012 and 2011, respectively. Additionally, to encourage the growth of solar energy on the system, customers are offered incentives to install solar panels on their homes and businesses under the Solar*Rewards® program. Over 561 PV systems with approximately 6.7 MW of aggregate capacity and over 300 PV systems with approximately 3 MW of aggregate capacity have been installed in Minnesota under this program as of Dec. 31, 2012 and 2011, respectively. Wind — The NSP System acquires the majority of its wind energy from PPAs with wind farm owners, primarily in Southwestern Minnesota. The NSP System currently has more than 100 of these agreements in place, with facilities ranging in size from under 1 MW to more than 200 MW. In 2012, the NSP System began purchasing wind from three new projects, which provided approximately 266 MW of capacity. The largest of these projects, the Prairie Rose Wind Project began commercial operations in December 2012 and the NSP System will purchase the entire output from this 200 MW project. In addition to receiving purchased wind energy under these agreements, the NSP System also typically receives wind RECs, which are used to meet state renewable resource requirements. The average cost per MWh of wind energy under these contracts was approximately $41 and $39 for 2012 and 2011, respectively. The cost per MWh of wind energy varies by contract and may be influenced by a number of factors including regulation, state specific renewable resource requirements, and the year of contract execution. Generally, contracts executed in 2012 benefited from improvements in technology, excess capacity among manufacturers, and motivation to complete new construction prior to the anticipated expiration of the Federal PTCs in 2012. In January 2013, the Federal PTC was extended through 2013. The NSP System also owns and operates two wind farms. The 101 MW Grand Meadow Wind Farm and the 201 MW Nobles Wind Farm began generating electricity in 2008 and 2010, respectively. Collectively, the NSP System had over 1,870 MW and over 1,600 MW of wind energy on its system at the end of 2012 and 2011, respectively. Hydroelectric — The NSP System acquires its hydroelectric energy from both owned generation and PPAs. The NSP System owns 20 hydroelectric plants throughout Wisconsin and Minnesota which provide 274 MW of capacity. For most of 2012, there were nine PPAs in place which provided approximately 37 MW of hydroelectric capacity. Additionally, the NSP System purchases approximately 850 MW of generation from Manitoba Hydro which is sourced primarily from its fleet of hydroelectric facilities. Wholesale Commodity Marketing Operations NSP-Minnesota conducts various wholesale marketing operations, including the purchase and sale of electric capacity, energy and energy-related products. See Item 7 for further discussion.
Table of Contents
14

NSP-Wisconsin
Public Utility Regulation Summary of Regulatory Agencies and Areas of Jurisdiction — Retail rates, services and other aspects of NSP-Wisconsin’s operations are regulated by the PSCW and the MPSC, within their respective states. In addition, each of the state commissions certifies the need for new generating plants and electric transmission lines before the facilities may be sited and built. NSP-Wisconsin is subject to the jurisdiction of the FERC with respect to its wholesale electric operations, hydroelectric generation licensing, accounting practices, wholesale sales for resale, the transmission of electricity in interstate commerce, compliance with the NERC electric reliability standards, asset transactions and mergers, and natural gas transactions in interstate commerce. NSP-Wisconsin and NSP-Minnesota have been granted continued joint authorization from the FERC to make wholesale electric sales at market-based prices. NSP-Wisconsin is a transmission owning member of the MISO RTO. The PSCW has a biennial base rate filing requirement. By June of each odd numbered year, NSP-Wisconsin must submit a rate filing for the test year beginning the following January. Fuel and Purchased Energy Cost Recovery Mechanisms — NSP-Wisconsin does not have an automatic electric fuel adjustment clause for Wisconsin retail customers. Instead, under Wisconsin rules, utilities submit a forward-looking annual fuel cost plan to the PSCW for approval. Once the PSCW approves the fuel cost plan, utilities defer the amount of any fuel cost over-collection or under-collection in excess of a two percent annual tolerance band, for future rate recovery or refund. Approval of a fuel cost plan and any rate adjustment for refund or recovery of deferred costs is determined by the PSCW after an opportunity for a hearing. Rate recovery of deferred fuel cost is subject to an earnings test based on the utility’s most recently authorized ROE. NSP-Wisconsin’s wholesale electric rate schedules include a FCA to provide for adjustments to billings and revenues for changes in the cost of fuel and purchased energy. Effective Jan. 1, 2013, NSP-Wisconsin no longer serves any wholesale municipal electric customers. Rates for wholesale municipal services provided in 2012 will be subject to a formula rate true-up in 2013. NSP-Wisconsin’s retail electric rate schedules for Michigan customers include power supply cost recovery factors, which are based on 12-month projections. After each 12-month period, a reconciliation is submitted whereby over-collections are refunded and any under-collections are collected from the customers over the subsequent 12-month period. Wisconsin Energy Efficiency and Conservation Goals — In June 2011, the Wisconsin biennial budget bill was signed into law, which rolled back the projected increases for state energy efficiency and conservation funding effective in 2012. Based on this action, NSP-Wisconsin was allocated approximately $8.1 million of the statewide program costs in 2012. This amount is expected to increase to approximately $8.6 million by 2014. Historically, NSP-Wisconsin has recovered these costs in rates charged to Wisconsin retail customers and expects to recover the program costs in rates going forward. Capacity and Demand NSP-Wisconsin operates an integrated system with NSP-Minnesota. See NSP-Minnesota Capacity and Demand. Energy Sources and Related Transmission Initiatives NSP-Wisconsin operates an integrated system with NSP-Minnesota. See NSP-Minnesota Energy Sources and Related Transmission Initiatives. NSP-Wisconsin CapX2020 CPCN — The PSCW issued a CPCN for the Wisconsin portion of the CapX2020 Hampton, Minn. to Rochester, Minn. to La Crosse, Wis. 345 KV project in May 2012. The Wisconsin portion consists of approximately 50 miles of new transmission line. The PSCW also approved a route permit and the cost is estimated at $211 million. Subsequent legal challenges to the PSCW’s order by intervenors were unsuccessful, thereby rendering the PSCW’s order final. Construction on the Wisconsin portion of the line is anticipated to begin in 2014 and the line is expected to go into service in 2015. Fuel Supply and Costs NSP-Wisconsin operates an integrated system with NSP-Minnesota. See NSP-Minnesota Fuel Supply and Costs.
Table of Contents
15

PSCo
Public Utility Regulation Summary of Regulatory Agencies and Areas of Jurisdiction — PSCo is regulated by the CPUC with respect to its facilities, rates, accounts, services and issuance of securities. PSCo is regulated by the FERC with respect to its wholesale electric operations, accounting practices, hydroelectric licensing, wholesale sales for resale, the transmission of electricity in interstate commerce, compliance with the NERC electric reliability standards and natural gas transactions in interstate commerce. Fuel, Purchased Energy and Conservation Cost-Recovery Mechanisms — PSCo has several retail adjustment clauses that recover fuel, purchased energy and other resource costs:
PSCo recovers fuel and purchased energy costs from its wholesale electric customers through a fuel cost adjustment clause approved by the FERC. PSCo’s wholesale customers have agreed to pay the full cost of certain renewable energy purchase and generation costs through a fuel clause and in exchange receive RECs associated with those resources. The wholesale customers pay their jurisdictional allocation of production costs through a fully forecasted formula rate with true-up. PBRP and QSP Requirements — PSCo operates under an electric PBRP. This regulatory plan provides for bill credits to customers if PSCo does not achieve certain performance targets relating to electric reliability and customer service through 2012. PSCo regularly monitors and records, as necessary, an estimated customer refund obligation under the PBRP. In April of each year following the measurement period, PSCo files its proposed rate adjustment under the PBRP. The CPUC conducts proceedings to review and approve these rate adjustments annually. In July 2012, PSCo filed an application with the CPUC to extend the terms of the current QSP through the end of 2015. PSCo is in settlement discussions and expects resolution in the first quarter of 2013. Capacity and Demand Uninterrupted system peak demand for PSCo’s electric utility for each of the last three years and the forecast for 2013, assuming normal weather, is listed below.
The peak demand for PSCo’s system typically occurs in the summer. The 2012 uninterrupted system peak demand for PSCo occurred on June 25, 2012, which was an extremely hot day. The forecasted 2013 system peak is lower than the 2012 peak, primarily due to the assumption of normal weather. Energy Sources and Related Transmission Initiatives PSCo expects to meet its system capacity requirements through existing electric generating stations, power purchases, new generation facilities, DSM options and phased expansion of existing generation at select power plants.
Table of Contents
• ECA — The ECA recovers fuel and purchased power costs. Short-term sales margins are shared with retail customers through the ECA. The ECA is revised quarterly.
• PCCA — The PCCA recovers purchased capacity payments. • SCA — The SCA recovers the difference between PSCo’s actual cost of fuel and the amount of these costs recovered under its base steam service
rates. The SCA rate is revised annually in January, as well as on an interim basis to coincide with changes in fuel costs. • DSMCA — The DSMCA recovers DSM, interruptible service option credit costs and performance initiatives for achieving various energy savings
goals. • RESA — The RESA recovers the incremental costs of compliance with the RES and is set at its maximum level of 2 percent of the customer’s total bill. • Wind Energy Service — Wind Energy Service is a premium service for those customers who voluntarily choose to pay an additional charge to
increase the level of renewable resource generation used to meet the customer’s load requirements. • TCA — The TCA recovers transmission plant revenue requirements and allows for a return on CWIP outside of rate cases.
System Peak Demand (in MW) 2010 2011 2012 2013 Forecast PSCo 6,436 6,896 6,689 6,428
16

Purchased Power — PSCo has contracts to purchase power from other utilities and independent power producers. Long-term purchased power contracts typically require a periodic payment to secure the capacity and a charge for the associated energy actually purchased. PSCo also makes short-term purchases to meet system load and energy requirements, to replace generation from company-owned units under maintenance or during outages, to meet operating reserve obligations, or to obtain energy at a lower cost. Purchased Transmission Services — In addition to using its own transmission system, PSCo has contracts with regional transmission service providers to deliver power and energy to PSCo’s customers. PSCo Resource Plan — In July 2012, PSCo filed two separate applications to update its resource plan. The first was an application to purchase Brush Power, LLC and all of its assets including Brush generating Units 1, 3 and 4 for a total purchase price of approximately $75 million. The Brush units currently provide 237 MW of natural gas fueled capacity and energy to PSCo under PPAs that are set to expire in 2017 for Brush Unit 1 and Brush Unit 3, and 2022 for Brush Unit 4. The second application sought approval to retire Arapahoe Unit 4, a 109 MW coal-fired company-owned generating station at the end of 2013. This was presented as an alternative to permanently fuel switching Arapahoe Unit 4 to natural gas and instead replacing the capacity and associated energy with a natural gas PPA with an existing generator. In September 2012, the FERC approved the acquisition of Brush Power, LLC. In January 2013, the CPUC denied approval of the acquisition due to the risks associated with the transaction. PSCo has the ability to terminate the transaction pursuant to the terms of the purchase agreement. The CPUC also decided that it was best not to make the decision to retire Arapahoe Unit 4 in this first phase of the resource plan and instead determined that the decision is best made after the retirement can be compared to bids received in the second phase. RES Compliance Plan — Colorado law mandates that at least 30 percent of PSCo’s energy sales are supplied by renewable energy by 2020 and includes a distributed generation standard. The CPUC has approved PSCo’s 2012 and 2013 RES compliance plan to acquire up to 30 MW of customer-sited solar projects each year and up to 9 MW of community solar garden projects. The CPUC also approved moving solely to a pay-for-performance basis under the Solar*Rewards distributed solar generation program, which PSCo implemented in June 2012. Based on CPUC approval, PSCo implemented a solar gardens program called Solar*Rewards Community, which will allow customers who either cannot or who prefer not to install solar generation on their property to join together to own interests in a common solar facility and receive a credit related to their share of the solar garden’s electric production on their electric bill. PSCo filled the 9 MW allotted for Solar*Rewards Community in 2012 and will seek to acquire an additional 9 MW in 2013. See Renewable Energy Sources for further discussion. CACJA — The CACJA required PSCo to file a comprehensive plan to reduce annual emissions of NOx from the coal-fired generation identified in the plan by at least 70 to 80 percent or greater from 2008 levels by 2017. The plan allows PSCo to propose emission controls, plant refueling or plant retirement of at least 900 MW of coal-fired generating units in Colorado by 2017. The total investment associated with the adopted plan is approximately $1.0 billion through 2017. In September 2012, the EPA formally approved the Colorado SIP, including the proposed changes at the PSCo plants. PSCo’s plan as of Dec. 31, 2012 is as follows:
Table of Contents
• Cherokee Units 2 and 1 were shut down in 2011 and 2012, respectively, and Cherokee Unit 3 (365 MW in total) is expected to be shut down by the end of 2016, after a new natural gas combined-cycle unit is built at Cherokee Station (569 MW);
• Cherokee Unit 2 was converted to a synchronous condenser to support the transmission system in 2012; • Fuel switch Cherokee Unit 4 (352 MW) to natural gas by 2017, unless a more cost-effective bid is provided to PSCo in response to the RFP to be
issued in Phase 2 of the PSCo Resource Plan in early 2013. If a more cost-effective bid is obtained, then Cherokee Unit 4 would be retired at the end of 2017;
• Shutdown Arapahoe Unit 3 (45 MW) at the end of 2013; • Fuel Switch Arapahoe Unit 4 (111 MW) at the end of 2013, unless a more cost-effective bid is provided to PSCo in response to the RFP to be issued in
Phase 2 of the PSCo Resource Plan in early 2013. If a more cost effective bid is obtained, then Arapahoe Unit 4 would be retired at the end of 2013; • Shutdown Valmont Unit 5 (186 MW) in 2017; • Install SCR for controlling NOx and a scrubber for controlling SO
2 on Pawnee Generating Station in 2014; and
• Install SCRs on Hayden Unit 1 in 2015 and Hayden Unit 2 in 2016.
17

PSCo has received CPCNs for the following:
PSCo is in the process of decommissioning Cherokee Units 1 and 2. Steam System Package Boilers and Regulatory Plan — In December 2012, PSCo filed for a CPCN to construct two packaged boilers for its steam utility. The application also sought approval for PSCo’s regulatory plan affecting rates for natural gas and steam services effective after the boilers have been placed in service. The proposed regulatory plan would combine the gas and steam revenue requirements for purposes of setting rates for retail gas and steam customers beginning January 2016. PSCo estimates that the impact of its proposed regulatory plan will be a reduction in the revenue requirement for steam of approximately $3.2 million and a corresponding $3.2 million increase in the revenue requirement for natural gas. A CPUC decision is expected in late 2013. San Luis Valley-Calumet-Comanche Transmission Project — In May 2009, PSCo and Tri-State Generation and Transmission Association filed a joint application with the CPUC for a 230 KV and 345 KV line and substation construction project. The line was intended to assist in bringing solar power in the San Luis Valley to customers. In March 2011, the CPUC granted a CPCN for this project. The CPUC’s decisions have been appealed to the Costilla County District Court by Blanca Ranch Holdings, LLC and Trinchera Ranch Holdings, LLC, and are pending before the Court. In October 2011, PSCo determined that due to lower projected load growth, lower gas prices and the higher cost of solar thermal generation, it was unlikely to need the transmission line in the foreseeable future. PSCo is awaiting a final Phase I decision in its 2011 resource plan before making a final determination. A CPUC decision on the resource plan is anticipated in the first quarter of 2013. SmartGridCity™ (SGC) Cost Recovery — PSCo requested recovery of the revenue requirements associated with $45 million of capital and $4 million of annual O&M costs incurred to develop and operate SGC as part of its 2010 electric rate case. In February 2011, the CPUC allowed recovery of approximately $28 million of the capital cost and all of the O&M costs. In December 2011, PSCo requested CPUC approval for the recovery of the remaining capital investment in SGC and also provided the additional information requested. On Jan. 17, 2013, the ALJ recommended denial of PSCo’s request for recovery of the remaining portion of the SGC investment. On Feb. 6, 2013, PSCo filed exceptions to the ALJ recommendation requesting that the CPUC grant recovery of its investment. However, as a result of the ALJ’s recommended decision denying recovery, PSCo recognized a $10.7 million pre-tax charge in 2012, representing the net book value of the disallowed investment, which is included in O&M expense. Boulder, Colo. Franchise Agreement — In November 2011, two ballot measures were passed by the citizens of Boulder. The first measure increased the occupation tax to raise an additional $1.9 million annually for a limited duration with the stated purpose of funding the exploration costs of forming a municipal utility and acquiring the PSCo electric distribution system in Boulder. The second measure authorized the formation and operation of a municipal light and power utility and the issuance of enterprise revenue bonds, subject to certain restrictions, including the level of initial rates and debt service coverage. Boulder has retained multiple legal firms that specialize in condemnation and FERC matters, as well as several other consultants. The City Council has not yet decided whether it will proceed with the formation of a municipal electric utility or with the commencement of a condemnation or FERC stranded cost proceeding. In December 2012, Boulder issued a white paper exploring opportunities for reaching its energy goals with PSCo, in lieu of condemnation. PSCo has advised Boulder that it is willing to discuss many of these opportunities. Boulder has announced that the City Council will decide whether to proceed with the formation of a municipal electric utility in April 2013. Should Boulder attempt to condemn PSCo facilities, PSCo would seek to obtain full compensation for the property and business taken by Boulder and for all damages resulting to PSCo and its system. PSCo would also seek appropriate compensation for stranded costs with the FERC.
Table of Contents
• Conversion of Cherokee Unit 2 to a synchronous condenser; • Decommissioning of Cherokee Unit 1 and Unit 2; • Installing Pawnee emissions controls; • Installing SCRs on the Hayden units; • Shutdown Arapahoe 3 at the end of 2013; and • Constructing a new natural gas combined-cycle unit at Cherokee Station.
18

Energy Source Statistics
Fuel Supply and Costs The following table shows the delivered cost per MMBtu of each significant category of fuel consumed for owned electric generation, the percentage of total fuel requirements represented by each category of fuel and the total weighted average cost of all fuels.
See Items 1A and 7 for further discussion of fuel supply and costs. Fuel Sources Coal — PSCo normally maintains approximately 41 days of coal inventory. Coal supply inventories at Dec. 31, 2012 and 2011 were approximately 46 and 48 days usage, respectively. PSCo’s generation stations use low-sulfur western coal purchased primarily under contracts with suppliers operating in Colorado and Wyoming. During 2012 and 2011, PSCo’s coal requirements for existing plants were approximately 11.3 and 10.5 million tons, respectively. The estimated coal requirements for 2013 are approximately 11.4 million tons. PSCo has contracted for coal supply to provide 97 percent of its coal requirements in 2013, and a declining percentage of requirements in subsequent years. PSCo’s general coal purchasing objective is to contract for approximately 100 percent of requirements for the following year, 67 percent of requirements in two years, and 33 percent of requirements in three years. Remaining requirements will be filled through the procurement process or over-the-counter transactions. PSCo has coal transportation contracts that provide for delivery of 100 and 46 percent of its coal requirements in 2013 and 2014, respectively. Coal delivery may be subject to short-term interruptions or reductions due to operation of the mines, transportation problems, weather and availability of equipment.
Table of Contents
Year Ended Dec. 31 2012 2011 2010
Millions of
KWh Percent of Generation
Millions of KWh
Percent of Generation
Millions of KWh
Percent of Generation
Coal 21,367 59 % 22,065 61 % 22,767 61 %Natural Gas 7,930 22 8,896 24 9,854 27 Wind (a) 5,752 16 4,518 12 3,830 10 Hydroelectric 590 2 681 2 446 1 Other (b) 263 1 324 1 257 1
Total 35,902 100 % 36,484 100 % 37,154 100 %
Owned generation 23,766 66 % 23,743 65 % 24,444 66 %Purchased generation 12,136 34 12,741 35 12,710 34
Total 35,902 100 % 36,484 100 % 37,154 100 %
(a) This category includes wind energy de-bundled from RECs and also includes Windsource RECs. PSCo uses RECs to meet or exceed state resource requirements and may sell surplus RECs.
(b) Includes energy from other sources, including nuclear, solar, biomass, oil and refuse. Distributed generation from the Solar*Rewards program is not included.
Coal Natural Gas Weighted
Average Owned PSCo Generating Plants Cost Percent Cost Percent Fuel Cost 2012 $ 1.77 78 % $ 4.25 22 % $ 2.31 2011 1.77 76 4.98 24 2.54 2010 1.58 85 5.05 15 2.11
19

Natural gas — PSCo uses both firm and interruptible natural gas supply and standby oil in combustion turbines and certain boilers. Natural gas supplies for PSCo’s power plants are procured under contracts to provide an adequate supply of fuel. However, as natural gas primarily serves intermediate and peak demand, any remaining forecasted requirements are able to be procured through a liquid spot market. The majority of natural gas supply under contract is covered by a long-term agreement with Anadarko Energy Services Company, the balance of natural gas supply contracts have pricing features tied to changes in various natural gas indices. PSCo hedges a portion of that risk through financial instruments. See Note 11 to the consolidated financial statements for further discussion. Most transportation contract pricing is based on FERC approved transportation tariff rates. These transportation rates are subject to revision based upon FERC approval of changes in the timing or amount of allowable cost recovery by providers. Certain natural gas supply and transportation agreements include obligations for the purchase and/or delivery of specified volumes of natural gas or to make payments in lieu of delivery. At Dec. 31, 2012, PSCo’s commitments related to gas supply contracts, which expire in various years from 2013 through 2023, were approximately $1.1 billion and commitments related to gas transportation and storage contracts, which expire in various years from 2013 through 2060, were approximately $754 million. At Dec. 31, 2011, PSCo’s commitments related to gas supply contracts were approximately $730 million and commitments related to gas transportation and storage contracts were approximately $819 million. PSCo has limited on-site fuel oil storage facilities and primarily relies on the spot market for incremental supplies. Renewable Energy Sources PSCo’s renewable energy portfolio includes wind, hydroelectric, biomass and solar power from both owned generating facilities and PPAs. As of Dec. 31, 2012, PSCo was in compliance with mandated RPS, which require generation from renewable resources of 12 percent of electric retail sales. Renewable energy comprised 18.7 percent and 14.6 percent of PSCo’s total owned and purchased energy for 2012 and 2011, respectively. Wind energy comprised 16.0 percent and 12.4 percent of PSCo’s total owned and purchased energy for 2012 and 2011, respectively. Hydroelectric, biomass and solar power comprised approximately 2.7 percent and 2.2 percent of renewable energy for 2012 and 2011. PSCo also offers customer-focused renewable energy initiatives. Windsource, one of the nation’s largest voluntary renewable energy programs, allows customers to purchase a portion or all of their electricity from renewable sources. Approximately 34,000 and 36,000 customers in Colorado purchased 201,000 MWh and 212,000 MWh of electricity under the Windsource program in 2012 and 2011, respectively. Additionally, to encourage the growth of solar energy on the system, customers are offered incentives to install solar panels on their homes and businesses under the Solar*Rewards program. Over 12,500 PV systems with approximately 138 MW of aggregate capacity and over 9,600 PV systems with approximately 110 MW of aggregate capacity have been installed in Colorado under this program as of Dec. 31, 2012 and 2011, respectively. PSCo acquires the majority of its wind energy from PPAs with wind farm owners, primarily in Colorado and Wyoming. PSCo currently has 19 of these agreements in place, with facilities ranging in size from 2 MW to over 300 MW. In addition to receiving purchased wind energy under these agreements, PSCo also typically receives wind RECs, which are used to meet state renewable resource requirements. The average cost per MWh of wind energy under these contracts was approximately $47 and $45 for 2012 and 2011, respectively. The cost per MWh of wind energy varies by contract and may be influenced by a number of factors including regulation, state specific renewable resource requirements, and the year of contract execution. Generally, contracts executed in 2012 benefited from improvements in technology, excess capacity among manufacturers, and motivation to complete new construction prior to the anticipated expiration of the Federal PTCs in 2012. In January 2013, the Federal PTC was extended through 2013. In November 2012, the 200 MW Limon Wind Energy Center and 200 MW Limon Wind Energy Center II began commercial operations. PSCo has long-term PPAs to acquire the output of both facilities. The average cost over the 25 year term of the Limon II contract is approximately $35 per MWh, which is lower than the average cost per MWh of purchased wind energy on the PSCo system. Additionally, PSCo owns and operates the 26 MW Ponnequin Wind Farm in northern Colorado, which has been in service since 1999. PSCo collectively had approximately 2,200 MW and 1,800 MW of wind energy on its system at the end of 2012 and 2011, respectively. Wholesale Commodity Marketing Operations PSCo conducts various wholesale marketing operations, including the purchase and sale of electric capacity, energy and energy related products. See Item 7 for further discussion.
Table of Contents
20

SPS
Public Utility Regulation Summary of Regulatory Agencies and Areas of Jurisdiction — The PUCT and NMPRC regulate SPS’ retail electric operations and have jurisdiction over its retail rates and services and the construction of transmission or generation in their respective states. The municipalities in which SPS operates in Texas have original jurisdiction over SPS’ rates in those communities. Each municipality can deny SPS’ rate increases. SPS can then appeal municipal rate decisions to the PUCT, which hears all municipal rate denials in one hearing. The NMPRC also has jurisdiction over the issuance of securities. SPS is regulated by the FERC with respect to its wholesale electric operations, accounting practices, wholesale sales for resale, the transmission of electricity in interstate commerce, compliance with NERC electric reliability standards, asset transactions and mergers, and natural gas transactions in interstate commerce. SPS has received authorization from the FERC to make wholesale electric sales at market-based prices. Fuel, Purchased Energy and Conservation Cost-Recovery Mechanisms — SPS has several retail adjustment clauses that recover fuel, purchased energy and other resource costs:
The PUCT approved SPS’ request that the recovery of the costs associated with the TCRF and PCRF be included in base rates effective February 2011. Fuel and purchased energy costs are recovered in Texas through a fixed fuel and purchased energy recovery factor, which is part of SPS’ retail electric tariff. Based on regulatory approval in 2011, SO2 and NOx allowance revenues and costs are also recovered through the fixed fuel and purchased energy recovery
factor. The regulations allow retail fuel factors to change up to three times per year. The fixed fuel and purchased energy recovery factor provides for the over- or under-recovery of fuel and purchased energy expenses. Regulations also require refunding or surcharging over- or under- recovery amounts, including interest, when they exceed four percent of the utility’s annual fuel and purchased energy costs on a rolling 12-month basis, if this condition is expected to continue. PUCT regulations require periodic examination of SPS’ fuel and purchased energy costs, the efficient use of fuel and purchased energy, fuel acquisition and management policies and purchased energy commitments. SPS is required to file an application for the PUCT to retrospectively review fuel and purchased energy costs at least every three years. NMPRC regulations require SPS to request authority to continue collecting its fuel and purchased power costs through a fuel adjustment clause every 4 years. The NMPRC has granted SPS authority to use a fuel adjustment clause through November 2014. SPS recovers fuel and purchased energy costs from its wholesale customers through a monthly wholesale fuel and purchased economic energy cost adjustment clause accepted for filing by the FERC. Capacity and Demand Uninterrupted system peak demand for SPS for each of the last three years and the forecast for 2013, assuming normal weather, is listed below.
The peak demand for the SPS system typically occurs in the summer. The 2012 uninterrupted system peak demand for SPS occurred on Aug. 2, 2012.
Table of Contents
• DCRF — The DCRF rider recovers distribution costs in Texas. • DRC — The DRC rider recovers deferred costs associated with renewable energy programs in New Mexico. The current rider is in effect through June
2013. • EECRF — The EECRF rider recovers costs associated with providing energy efficiency programs in Texas. • EE rider — The EE rider recovers costs associated with providing energy efficiency programs in New Mexico. • FPPCAC — The FPPCAC adjusts monthly to recover the difference between the actual fuel and purchased power costs and the amount included in
base rates of SPS’ New Mexico retail jurisdiction. • PCRF — The PCRF rider allows recovery of certain purchased power costs in Texas. • TCRF — The TCRF rider recovers transmission infrastructure improvement costs and changes in wholesale transmission charges in Texas.
System Peak Demand (in MW) 2010 2011 2012 2013 Forecast SPS 4,985 5,210 5,265 5,193
21

Energy Sources and Related Transmission Initiatives SPS expects to use existing electric generating stations, power purchases and DSM options to meet its net dependable system capacity requirements. Purchased Power — SPS has contracts to purchase power from other utilities and independent power producers. Long-term purchased power contracts typically require a periodic payment to secure the capacity and a charge for the associated energy actually purchased. SPS also makes short-term purchases to meet system load and energy requirements, to replace generation from company-owned units under maintenance or during outages, to meet operating reserve obligations or to obtain energy at a lower cost. Purchased Transmission Services — SPS has contractual arrangements with SPP and regional transmission service providers, including PSCo, to deliver power and energy to its native load customers, which are retail and wholesale load obligations with terms of more than one year. SPS Transmission NTC — As a member of SPP, SPS accepts NTCs for projects identified through SPP’s reliability planning process, transmission service, generator interconnection study process, economic study process or the load addition process. These are all new electric transmission projects and are typically a portfolio of transmission lines and electric substation projects. SPS has accepted NTCs for several hundred miles of transmission line and substations at an estimated capital cost of approximately $800 million. These projects span several years to plan, site, procure and develop. Typical SPS capital spending for SPP NTC transmission projects is approximately $150 to $200 million per year, but may vary. Under their jurisdictions, the NMPRC and PUCT have approved the siting and routing of all SPP identified transmission line NTC projects that have been presented. Projects identified through SPP NTCs may have costs allocated to other SPP members in accordance with SPP policies. Costs allocated to SPS are permissible for recovery through NMPRC, PUCT and FERC processes. TUCO Inc. (TUCO) to Woodward 345 KV transmission line The TUCO to Woodward District extra high voltage interchange is a 345 KV transmission line. This line connects the major TUCO substation near Lubbock, Texas with the Oklahoma Gas & Electric (OGE) substation in Woodward, Okla. SPS is constructing the line to just inside the Oklahoma state line, and OGE is building from there to Woodward. SPS’ estimated investment in the TUCO to Woodward line and substation is $185 million and is expected to be recovered from SPP members in accordance with the SPP OATT and the ratemaking process. The PUCT approved SPS’ CCN to build the line in 2012. It is anticipated to be complete in 2014. Hitchland to Woodward 345 KV transmission line The Hitchland to Woodward line is a 345 KV double circuit transmission line and associated substation facilities in the Oklahoma and Texas Panhandle. SPS is building the first 30 miles from Hitchland towards Woodward and OGE is completing the line from there to Woodward. SPS’ estimated investment for the Hitchland to Woodward line and substation is $56 million and is expected to be recovered from SPP members in accordance with the SPP OATT and the ratemaking process. Jones CCN — In August 2011, the PUCT approved SPS’ request for a CCN to build a gas-fired combustion turbine generating unit at SPS’ existing Jones Station in Lubbock, Texas (Jones Unit 4). This generating unit will add 168 MW of capacity to the SPS service territory. In February 2012, the NMPRC approved the CCN with a projected cost of $118 million, inclusive of AFUDC. Jones Unit 4 is expected to reach commercial operation in the second quarter of 2013. SPS Resource Plans — SPS is required to develop and implement a renewable portfolio plan in which ten percent of its energy to serve its New Mexico retail customers is produced by renewable resources in 2011, increasing to 15 percent in 2015. SPS primarily fulfills its renewable portfolio requirements through the purchase of wind energy. In 2009, the NMPRC granted SPS a variance to allow SPS to delay meeting its solar energy requirement until 2012 provided that SPS compensates for any shortfall of the 2011 solar energy requirement during 2012 through 2014. SPS executed and received NMPRC approval for a total of 50 MW of PV solar energy PPAs. SPS requested and was granted a variance from the NMPRC to extend the time to implement a portion of the diversity requirements to January 2014. SPS is continuing its efforts to acquire viable biomass generation or make a biogas purchase to meet the diversity portion of its renewable energy portfolio plan in New Mexico. SPS solicited public participation throughout 2011 in its New Mexico 2012 Integrated Resource Planning (IRP). SPS made the IRP filing with NMPRC in July 2012, which was accepted without modification in September 2012. CSAPR — CSAPR addresses long range transport of PM and ozone by requiring reductions in SO
2 and NOx from utilities located in the eastern half of the
U.S. In August 2012, the D.C. Circuit issued an opinion that vacated the CSAPR, but required continued implementation of the CAIR pending the EPA’s development of a replacement program. CSAPR and CAIR are discussed further at Note 13 to the consolidated financial statements — Environmental Contingencies.
Table of Contents
22

Energy Source Statistics
Fuel Supply and Costs The following table shows the delivered cost per MMBtu of each significant category of fuel consumed for owned electric generation, the percentage of total fuel requirements represented by each category of fuel and the total weighted average cost of all fuels.
See Items 1A and 7 for further discussion of fuel supply and costs. Fuel Sources Coal — SPS purchases all of the coal requirements for its two coal facilities, Harrington and Tolk electric generating stations, from TUCO. TUCO arranges for the purchase, receiving, transporting, unloading, handling, crushing, weighing and delivery of coal to meet SPS’ requirements. TUCO is responsible for negotiating and administering contracts with coal suppliers, transporters and handlers. The coal supply contract with TUCO expires in 2016 and 2017 for the Harrington station and Tolk station, respectively. As of Dec. 31, 2012 and 2011, coal inventories at SPS were approximately 40 and 43 days supply, respectively. TUCO has coal agreements to supply 92 percent of SPS’ coal requirements in 2013, and a declining percentage of the requirements in subsequent years. SPS’ general coal purchasing objective is to contract for approximately 100 percent of requirements for the following year, 67 percent of requirements in two years, and 33 percent of requirements in three years. Natural gas — SPS uses both firm and interruptible natural gas supply and standby oil in combustion turbines and certain boilers. Natural gas for SPS’ power plants is procured under contracts to provide an adequate supply of fuel; which typically is purchased with terms of one year or less. The transportation and storage contracts expire in various years from 2013 to 2033. All of the natural gas supply contracts have pricing that is tied to various natural gas indices. Most transportation contract pricing is based on FERC and Railroad Commission of Texas approved transportation tariff rates. Certain natural gas supply and transportation agreements include obligations for the purchase and/or delivery of specified volumes of natural gas or to make payments in lieu of delivery. SPS’ commitments related to gas supply contracts were approximately $57 million and $24 million and commitments related to gas transportation and storage contracts were approximately $229 million and $242 million at Dec. 31, 2012 and 2011, respectively. SPS has limited on-site fuel oil storage facilities and primarily relies on the spot market for incremental supplies.
Table of Contents
Year Ended Dec. 31 2012 2011 2010
Millions of
KWh Percent of Generation
Millions of KWh
Percent of Generation
Millions of KWh
Percent of Generation
Coal 14,005 49 % 14,818 48 % 15,486 51 %Natural Gas 12,088 43 13,167 43 12,206 40 Wind (a) 2,103 7 2,386 8 2,295 8 Other (b) 177 1 409 1 361 1
Total 28,373 100 % 30,780 100 % 30,348 100 %
Owned generation 19,940 70 % 19,310 63 % 19,303 64 %Purchased generation 8,433 30 11,470 37 11,045 36
Total 28,373 100 % 30,780 100 % 30,348 100 %
(a) This category includes wind energy de-bundled from RECs and also includes Windsource RECs. SPS uses RECs to meet or exceed state resource requirements and may sell surplus RECs.
(b) Includes energy from other sources, including nuclear, hydroelectric, solar, biomass, oil and refuse. Distributed generation from the Solar*Rewards program is not included.
Coal Natural Gas Weighted
Average Owned SPS Generating Plants Cost Percent Cost Percent Fuel Cost 2012 $ 1.87 67 % $ 2.99 33 % $ 2.24 2011 1.89 67 4.37 33 2.71 2010 1.84 71 4.59 29 2.64
23

Renewable Energy Sources SPS’ renewable energy portfolio includes wind and solar power from both owned generating facilities and PPAs. As of Dec. 31, 2012, SPS is in compliance with mandated RPS, which require generation from renewable resources of approximately 4 percent and 10 percent of Texas and New Mexico electric retail sales, respectively. Renewable energy comprised 7.9 percent and 8.2 percent of SPS’ total owned and purchased energy for 2012 and 2011, respectively. Wind energy comprised 7.4 percent and 7.8 percent of SPS’ total owned and purchased energy for 2012 and 2011, respectively. Solar power comprised approximately 0.5 percent and 0.4 percent of renewable energy for 2012 and 2011, respectively. SPS also offers customer-focused renewable energy initiatives. Windsource, one of the nation’s largest voluntary renewable energy programs, allows customers in New Mexico to purchase a portion or all of their electricity from renewable sources. Approximately 1,100 and 1,200 customers purchased 5,000 MWh and 7,000 MWh of electricity under the Windsource program in 2012 and 2011, respectively. Additionally, to encourage the growth of solar energy on the system in New Mexico, customers are offered incentives to install solar panels on their homes and businesses under the Solar*Rewards program. Over 80 PV systems with approximately 4.5 MW of aggregate capacity and over 70 PV systems with approximately 5 MW of aggregate capacity have been installed in New Mexico under this program as of Dec. 31, 2012 and 2011, respectively. SPS acquires its wind energy from long-term PPAs with wind farm owners, primarily in the Texas Panhandle area of Texas and New Mexico. SPS currently has six of these agreements in place, with facilities ranging in size from under 2 MW to 161 MW for a total capacity greater than 600 MW. In late 2012, the 161 MW Spinning Spur Wind Ranch began commercial operations. SPS will purchase the entire output of this 161 MW facility. In addition to receiving purchased wind energy under these agreements, SPS also typically receives wind RECs, which are used to meet state renewable resource requirements. Additionally, SPS is currently purchasing an additional 250 MW of wind energy from qualified generating facilities, as defined in the PURPA. The average cost per MWh of wind energy under the PPA and QF contracts was approximately $26 for each of 2012 and 2011. The cost per MWh of wind energy varies by contract and may be influenced by a number of factors including regulation, state specific renewable resource requirements and the year of contract execution. Generally, contracts executed in 2012 benefited from improvements in technology, excess capacity among manufacturers, and motivation to complete new construction prior to the anticipated expiration of the Federal PTCs in 2012. In January 2013, the Federal PTC was extended through 2013. At the end of 2012 and 2011, SPS had nearly 860 MW and 700 MW of wind energy on its system, respectively. Wholesale Commodity Marketing Operations SPS conducts various wholesale marketing operations, including the purchase and sale of electric capacity, energy and energy related products. SPS uses physical and financial instruments to minimize commodity price and credit risk and hedge sales and purchases. See Item 7 for further discussion.
Summary of Recent Federal Regulatory Developments The FERC has jurisdiction over rates for electric transmission service in interstate commerce and electricity sold at wholesale, hydro facility licensing, natural gas transportation, accounting practices and certain other activities of Xcel Energy Inc.’s utility subsidiaries, including enforcement of NERC mandatory electric reliability standards. State and local agencies have jurisdiction over many of Xcel Energy Inc.’s utility subsidiaries’ activities, including regulation of retail rates and environmental matters. In addition to the matters discussed below, see Note 12 to the accompanying consolidated financial statements for a discussion of other regulatory matters. FERC Order 1000, Transmission Planning and Cost Allocation (Order 1000) —The FERC issued Order 1000 adopting new requirements for transmission planning, cost allocation and development to be effective prospectively. The requirements for transmission planning and cost allocation were addressed by revisions to the MISO Tariff for NSP-Minnesota and NSP-Wisconsin as discussed below in MISO Transmission Pricing; and Xcel Energy expects the requirements will be addressed by revisions to the SPP Tariff for SPS. PSCo submitted its compliance filing in October 2012, proposing to comply through participation in WestConnect, a consortium of utilities in the Western Interconnection. The filing is pending FERC action. In 2012, Minnesota’s Governor signed legislation that preserves the rights of incumbent utilities to construct and own transmission interconnected to their systems. This legislation is similar to legislation previously passed in North Dakota and South Dakota. Therefore, Order 1000 is expected to have limited impacts on future transmission development and ownership in the NSP System in Minnesota, North Dakota and South Dakota. For the Wisconsin portion of the NSP System, the impacts of the new requirements relating to future transmission development and ownership are uncertain.
Table of Contents
24
Furthermore, in Texas, the issue of whether incumbent utilities have the rights to construct and own transmission interconnected to their system is disputed by some parties in SPP. Xcel Energy believes that state statutes protect the right of incumbent utilities to construct and own transmission interconnected to their systems, and does not expect that this aspect of Order 1000 will impact the portion of SPS in Texas. However, the portion of SPS in New Mexico and PSCo may be impacted by the provisions of Order 1000 relating to an incumbent’s right to build transmission because neither New Mexico nor Colorado has legislation protecting the rights of utilities to develop transmission projects in their service areas. Xcel Energy Services Inc. and NSP-Wisconsin vs. ATC (La Crosse, Wis. to Madison, Wis. Transmission Line) — In February 2012, Xcel Energy Services Inc. and NSP-Wisconsin filed a complaint with the FERC concerning ownership of the proposed La Crosse, Wis. to Madison, Wis. 345 KV transmission line. In July 2012, the FERC granted Xcel Energy Services Inc.’s and NSP-Wisconsin’s complaint, ruling that the responsibilities to construct the La Crosse, Wis. to Madison, Wis. transmission line belong equally to both parties. In August 2012, American Transmission Company LLC (ATC) requested rehearing and requested that the FERC grant a stay of the ruling. In September 2012, the FERC granted rehearing for purposes of further consideration but did not grant a stay. Thus, the July ruling remains in effect pending the FERC’s further ruling on rehearing. In order to proceed with development of the project, the two companies are working together on routing and regulatory state issues pending FERC action on ATC’s request for rehearing. In addition, ITC Midwest LLC filed a similar complaint against ATC with the FERC concerning ownership of the Dubuque, Iowa to Cardinal (Madison, Wis.) line, a 136 mile, 345 KV transmission line that is also a MISO MVP project and that connects in Madison, Wis. to the La Crosse, Wis. to Madison, Wis. line. In February 2013, the FERC granted the ITC Midwest complaint. ATC vs. Xcel Energy Services Inc. and MISO (Hampton, Minn. to Rochester, Minn. to La Crosse, Wis. Transmission Line) — In October 2012, ATC filed a complaint against MISO, Xcel Energy Services Inc., NSP-Minnesota and NSP-Wisconsin, alleging that, under the legal principles set forth in the July 2012 FERC ruling in the La Crosse to Madison transmission line complaint filed by Xcel Energy Services Inc. on behalf of its subsidiary NSP-Wisconsin against ATC, that the FERC should determine that MISO should have designated the Hampton to Rochester to La Crosse CapX2020 line and the La Crosse to Madison line as a single facility under the MISO Transmission Owners Agreement and Tariff. Thus, ATC should have been designated as the owner of the La Crosse to Madison line portion of the purported single facility. Xcel Energy filed an answer seeking dismissal of the ATC complaint in October 2012. On Feb. 4, 2013, the FERC issued an order denying the ATC complaint. The FERC found that MISO properly applied its planning process and that Hampton to La Crosse and the La Crosse to Madison lines are separate. Therefore, MISO’s prior ownership decisions stand. ARCs — In 2009, the FERC adopted rules requiring RTOs to allow ARCs to offer demand response aggregation services to end-use customers of large utilities unless the relevant state regulatory agency prohibited the operation of ARCs. Under MISO’s proposed tariff revisions, ARCs would operate in competition with the state-regulated retail demand response programs offered by NSP-Minnesota and NSP-Wisconsin. In 2010, MISO requested its compliance tariff revisions be effective in June 2010, and the MPUC, NDPSC, SDPUC, PSCW and MPSC all issued orders prohibiting, or temporarily prohibiting, the operation of ARCs in their states. In December 2011, the FERC issued orders denying rehearing of the rules and approving most aspects of the MISO compliance filing. The FERC retained the rules allowing state regulatory authorities to prohibit ARCs within their state. NSP-Minnesota is exploring a pilot program that would expand existing retail CIP services to more fully interact with the MISO market. The most recent filing in this open docket was in November 2012. Electric Transmission Rate Regulation — The FERC regulates the rates and terms and conditions for electric transmission services. FERC policy encourages utilities to turn over the functional control of their electric transmission assets for the sale of electric transmission services to an RTO. NSP-Minnesota and NSP-Wisconsin are members of the MISO RTO. SPS is a member of the SPP RTO. Each RTO separately files regional transmission tariff rates for approval by the FERC. All members within that RTO are then subjected to those rates. In 2009, PSCo filed a tariff to participate with other utilities in WestConnect, a consortium of utilities offering regionalized non firm transmission services. The WestConnect tariff was effective in the first quarter of 2009 and the FERC approved a two year extension in the second quarter of 2011. The WestConnect tariff has not had a material impact on PSCo transmission usage or revenues. WestConnect may provide wholesale energy market functions in the future, but would not be considered an RTO. MISO Transmission Pricing — The MISO Tariff presently provides for different allocation methods for the costs of new transmission investments: some lower voltage projects are fully allocated to loads near the project vicinity, and other reliability projects are allocated 20 percent regionally and 80 percent to local loads. If a project qualifies as a MVP, the costs would be fully allocated to all loads in the MISO region. MVP eligibility is generally obtained for higher voltage (345 KV and higher) projects expected to provide multiple purposes, such as improved reliability, reduced congestion, transmission for renewable energy, and load serving. Certain parties have appealed the FERC MVP tariff orders to the U.S. Court of Appeals for the Seventh Circuit.
Table of Contents
25

In its Order 1000 compliance filing in October 2012, MISO proposed that all future reliability projects be fully allocated to the zones in which the project is located (rather than allocating costs more broadly) while MVP projects would continue to be eligible for regional cost allocation. FERC action is anticipated in 2013. The NSP System has certain new transmission facilities for which other customers in MISO contribute to cost recovery. Likewise, the NSP System also pays a share of the costs of projects constructed by other transmission owning entities. The transmission revenues received by the NSP System from MISO, and the transmission charges paid to MISO, associated with projects subject to regional cost allocation could be significant in future periods. RSG Charges — The MISO tariff charges certain market participants a real-time RSG charge, which is designed to ensure that any generator scheduled or dispatched by MISO will receive no less than its offer price for start-up, no-load and incremental energy. In August 2010, the FERC issued two orders relating to RSG charge exemptions and the allocation of the RSG costs among MISO participants. In recent RSG filings, MISO has proposed, and the FERC has accepted, allocating a greater portion of the RSG costs related to resources committed for voltage and local reliability requirements to the market participants with the loads that benefit from such commitments. NSP-Minnesota is permitted to recover the RSG costs through FCA mechanisms approved by the regulators in each jurisdiction. Certain of the FERC’s orders remain pending on rehearing, and appeals of the FERC orders to the U.S. Court of Appeals for the D.C. Circuit have been held in abeyance, pending the FERC’s disposition of rehearing requests.
Electric Operating Statistics Electric Sales Statistics
Table of Contents
Year Ended Dec. 31 2012 2011 2010 Electric sales (Millions of KWh) Residential 25,033 25,278 25,143 Large commercial and industrial 27,396 27,419 27,167 Small commercial and industrial 35,660 35,597 35,650 Public authorities and other 1,109 1,135 1,100
Total retail 89,198 89,429 89,060 Sales for resale 15,781 20,177 20,532
Total energy sold 104,979 109,606 109,592
Number of customers at end of period Residential 2,940,024 2,919,660 2,906,248 Large commercial and industrial 1,147 1,129 1,112 Small commercial and industrial 419,618 415,755 413,750 Public authorities and other 68,510 69,350 70,413
Total retail 3,429,299 3,405,894 3,391,523 Wholesale 75 78 88
Total customers 3,429,374 3,405,972 3,391,611
Electric revenues (Thousands of Dollars) Residential $ 2,713,575 $ 2,712,340 $ 2,622,284 Large commercial and industrial 1,534,728 1,616,596 1,533,993 Small commercial and industrial 3,023,154 3,025,416 2,956,077 Public authorities and other 130,538 129,826 126,345
Total retail 7,401,995 7,484,178 7,238,699 Wholesale 687,912 936,875 960,505 Other electric revenues 427,389 345,540 252,641
Total electric revenues $ 8,517,296 $ 8,766,593 $ 8,451,845
KWh sales per retail customer 26,011 26,257 26,260 Revenue per retail customer $ 2,158 $ 2,197 $ 2,134 Residential revenue per KWh 10.84 ¢ 10.73 ¢ 10.43 ¢ Large commercial and industrial revenue per KWh 5.60 5.90 5.65 Small commercial and industrial revenue per KWh 8.48 8.50 8.29 Wholesale revenue per KWh 4.36 4.64 4.68
26

Energy Source Statistics
NATURAL GAS UTILITY OPERATIONS
Overview The most significant developments in the natural gas operations of the utility subsidiaries are continued volatility in natural gas market prices, uncertainty regarding political and regulatory developments that impact hydraulic fracturing, safety requirements for natural gas pipelines and the continued trend of declining use per residential and small commercial and industrial (C&I) customer, as a result of improved building construction technologies, higher appliance efficiencies and conservation. From 2000 to 2012, average annual sales to the typical residential customer declined from 96 MMBtu per year to 78 MMBtu per year and to the typical small C&I customer declined from 441 MMBtu per year to 377 MMBtu per year, on a weather-normalized basis. Although wholesale price increases do not directly affect earnings because of natural gas cost-recovery mechanisms, high prices can encourage further efficiency efforts by customers. The Pipeline and Hazardous Materials Safety Administration Pipeline Safety Act — The Pipeline Safety, Regulatory Certainty, and Job Creation Act, signed into law in January 2012 (Pipeline Safety Act) requires, among other things, additional verification of pipeline infrastructure records by pipeline owners and operators to confirm the maximum allowable operating pressure of lines located in high consequence areas or more-densely populated areas. Where records are inadequate to confirm the maximum allowable operating pressure, the DOT Pipeline and Hazardous Materials Safety Administration (PHMSA) will require operators to re-confirm the maximum allowable operating pressure. This process could cause temporary or permanent limitations on throughput for affected pipelines. In addition, the Pipeline Safety Act requires PHMSA to issue reports and develop new regulations, addressing a variety of subjects, including: requiring use of automatic or remote-controlled shut-off valves in certain circumstances; requiring testing of certain previously untested transmission lines; and expanding integrity management requirements. The Pipeline Safety Act also raises the maximum penalty for violating pipeline safety rules to $0.2 million per violation per day up to $2 million for a related series of violations. While Xcel Energy cannot predict the ultimate impact Pipeline Safety Act will have on its costs, operations or financial results, Xcel Energy is taking actions that are intended to comply with the Pipeline Safety Act and any related PHMSA regulations as they become effective. PSCo can generally recover costs to comply with the transmission and distribution integrity management programs through the PSIA rider.
Table of Contents
Year Ended Dec. 31 2012 2011 2010
Millions of
KWh Percent of Generation
Millions of KWh
Percent of Generation
Millions of KWh
Percent of Generation
Coal 51,395 47 % 57,014 50 % 57,832 51 %Natural Gas 26,218 24 25,080 22 25,947 23 Wind (a) 13,298 12 11,216 10 9,885 9 Nuclear 13,249 12 13,781 12 15,012 13 Hydroelectric 3,800 3 4,203 4 3,998 3 Other (b) 2,022 2 1,659 2 1,663 1
Total 109,982 100 % 112,953 100 % 114,337 100 %
Owned generation 75,071 68 % 74,722 66 % 77,506 68 %Purchased generation 34,911 32 38,231 34 36,831 32
Total 109,982 100 % 112,953 100 % 114,337 100 %
(a) This category includes wind energy de-bundled from RECs and also includes Windsource RECs. Xcel Energy uses RECs to meet or exceed state resource requirements and may sell surplus RECs.
(b) Includes energy from other sources, including solar, biomass, oil and refuse. Distributed generation from the Solar*Rewards program is not included.
27

NSP-Minnesota
Public Utility Regulation Summary of Regulatory Agencies and Areas of Jurisdiction — Retail rates, services and other aspects of NSP-Minnesota’s retail natural gas operations are regulated by the MPUC and the NDPSC within their respective states. The MPUC has regulatory authority over security issuances, certain property transfers, mergers with other utilities and transactions between NSP-Minnesota and its affiliates. In addition, the MPUC reviews and approves NSP-Minnesota’s natural gas supply plans for meeting customers’ future energy needs. NSP-Minnesota is subject to the jurisdiction of the FERC with respect to certain natural gas transactions in interstate commerce. NSP-Minnesota is subject to the DOT, the Minnesota Office of Pipeline Safety, the NDPSC and the SDPUC for pipeline safety compliance, including pipeline facilities used in electric utility operations for fuel deliveries. Purchased Gas and Conservation Cost-Recovery Mechanisms — NSP-Minnesota’s retail natural gas rates for Minnesota and North Dakota include a PGA clause that provides for prospective monthly rate adjustments to reflect the forecasted cost of purchased natural gas, transportation service and storage service. The annual difference between the natural gas cost revenues collected through PGA rates and the actual natural gas costs is collected or refunded over the subsequent 12-month period. The MPUC and NDPSC have the authority to disallow recovery of certain costs if they find the utility was not prudent in its procurement activities. Minnesota state law requires utilities to invest 0.5 percent of their state natural gas revenues in CIP. These costs are recovered through customer base rates and an annual cost-recovery mechanism for the CIP expenditures. Capability and Demand Natural gas supply requirements are categorized as firm or interruptible (customers with an alternate energy supply). The maximum daily send-out (firm and interruptible) for NSP-Minnesota was 732,135 MMBtu, which occurred on Jan. 19, 2012 and 751,985 MMBtu, which occurred on Jan. 20, 2011. NSP-Minnesota purchases natural gas from independent suppliers, generally based on market indices that reflect current prices. The natural gas is delivered under transportation agreements with interstate pipelines. These agreements provide for firm deliverable pipeline capacity of 590,698 MMBtu per day. In addition, NSP-Minnesota contracts with providers of underground natural gas storage services. These agreements provide storage for approximately 26 percent of winter natural gas requirements and 32 percent of peak day firm requirements of NSP-Minnesota. NSP-Minnesota also owns and operates one LNG plant with a storage capacity of 2.0 Bcf equivalent and three propane-air plants with a storage capacity of 1.3 Bcf equivalent to help meet its peak requirements. These peak-shaving facilities have production capacity equivalent to 246,000 MMBtu of natural gas per day, or approximately 31 percent of peak day firm requirements. LNG and propane-air plants provide a cost-effective alternative to annual fixed pipeline transportation charges to meet the peaks caused by firm space heating demand on extremely cold winter days. NSP-Minnesota is required to file for a change in natural gas supply contract levels to meet peak demand, to redistribute demand costs among classes, or to exchange one form of demand for another. The 2009-2010, 2010-2011, 2011-2012, and 2012-2013 entitlement levels are pending MPUC action. Natural Gas Supply and Costs NSP-Minnesota actively seeks natural gas supply, transportation and storage alternatives to yield a diversified portfolio that provides increased flexibility, decreased interruption and financial risk and economical rates. In addition, NSP-Minnesota conducts natural gas price hedging activity that has been approved by the MPUC. The following table summarizes the average delivered cost per MMBtu of natural gas purchased for resale by NSP-Minnesota’s regulated retail natural gas distribution business:
NSP-Minnesota has firm natural gas transportation contracts with several pipelines, which expire in various years from 2013 through 2033.
Table of Contents
2012 $ 4.41 2011 5.25 2010 5.43
28

NSP-Minnesota has certain natural gas supply, transportation and storage agreements that include obligations for the purchase and/or delivery of specified volumes of natural gas or to make payments in lieu of delivery. At Dec. 31, 2012, NSP-Minnesota was committed to approximately $377 million in such obligations under these contracts. NSP-Minnesota purchases firm natural gas supply utilizing long-term and short-term agreements from approximately 21 domestic and Canadian suppliers. This diversity of suppliers and contract lengths allows NSP-Minnesota to maintain competition from suppliers and minimize supply costs. See Items 1A and 7 for further discussion of natural gas supply and costs.
NSP-Wisconsin Public Utility Regulation Summary of Regulatory Agencies and Areas of Jurisdiction — NSP-Wisconsin is regulated by the PSCW and the MPSC. The PSCW has a biennial base-rate filing requirement. By June of each odd-numbered year, NSP-Wisconsin must submit a rate filing for the test year period beginning the following January. NSP-Wisconsin is subject to the jurisdiction of the FERC with respect to certain natural gas transactions in interstate commerce. NSP-Wisconsin is subject to the DOT, the PSCW and the MPSC for pipeline safety compliance. Natural Gas Cost-Recovery Mechanisms — NSP-Wisconsin has a retail PGA cost-recovery mechanism for Wisconsin operations to recover the actual cost of natural gas and transportation and storage services. The PSCW has the authority to disallow certain costs if it finds NSP-Wisconsin was not prudent in its procurement activities. NSP-Wisconsin’s natural gas rate schedules for Michigan customers include a natural gas cost-recovery factor, which is based on 12-month projections. Capability and Demand Natural gas supply requirements are categorized as firm or interruptible (customers with an alternate energy supply). The maximum daily send-out (firm and interruptible) for NSP-Wisconsin was 143,134 MMBtu, which occurred on Jan. 19, 2012, and 134,636 MMBtu, which occurred on Jan. 20, 2011. NSP-Wisconsin purchases natural gas from independent suppliers, generally based on market indices that reflect current prices. The natural gas is delivered under transportation agreements with interstate pipelines. These agreements provide for firm deliverable pipeline capacity of approximately 133,153 MMBtu per day. In addition, NSP-Wisconsin contracts with providers of underground natural gas storage services. These agreements provide storage for approximately 26 percent of winter natural gas requirements and 39 percent of peak day firm requirements of NSP-Wisconsin. NSP-Wisconsin also owns and operates one LNG plant with a storage capacity of 270,000 Mcf equivalent and one propane-air plant with a storage capacity of 2,700 Mcf equivalent to help meet its peak requirements. These peak-shaving facilities have production capacity equivalent to 18,408 MMBtu of natural gas per day, or approximately 13 percent of peak day firm requirements. LNG and propane-air plants provide a cost-effective alternative to annual fixed pipeline transportation charges to meet the peaks caused by firm space heating demand on extremely cold winter days. NSP-Wisconsin is required to file a natural gas supply plan with the PSCW annually to change natural gas supply contract levels to meet peak demand. NSP-Wisconsin’s winter 2012-2013 supply plan was approved by the PSCW in October 2012. Natural Gas Supply and Costs NSP-Wisconsin actively seeks natural gas supply, transportation and storage alternatives to yield a diversified portfolio that provides increased flexibility, decreased interruption and financial risk and economical rates. In addition, NSP-Wisconsin conducts natural gas price hedging activity that has been approved by the PSCW.
Table of Contents
29

The following table summarizes the average delivered cost per MMBtu of natural gas purchased for resale by NSP-Wisconsin’s regulated retail natural gas distribution business:
The cost of natural gas supply, transportation service and storage service is recovered through various cost-recovery adjustment mechanisms. NSP-Wisconsin has firm natural gas transportation contracts with several pipelines, which expire in various years from 2013 through 2029. NSP-Wisconsin has certain natural gas supply, transportation and storage agreements that include obligations for the purchase and/or delivery of specified volumes of natural gas or to make payments in lieu of delivery. At Dec. 31, 2012, NSP-Wisconsin was committed to approximately $86 million in such obligations under these contracts. NSP-Wisconsin purchased firm natural gas supply utilizing long-term and short-term agreements from approximately 12 domestic and Canadian suppliers. This diversity of suppliers and contract lengths allows NSP-Wisconsin to maintain competition from suppliers and minimize supply costs. See Items 1A and 7 for further discussion of natural gas supply and costs.
PSCo Public Utility Regulation Summary of Regulatory Agencies and Areas of Jurisdiction — PSCo is regulated by the CPUC with respect to its facilities, rates, accounts, services and issuance of securities. PSCo holds a FERC certificate that allows it to transport natural gas in interstate commerce without PSCo becoming subject to full FERC jurisdiction under the Federal Natural Gas Act. PSCo is subject to the DOT and the CPUC with regards to pipeline safety compliance. Purchased Natural Gas and Conservation Cost-Recovery Mechanisms — PSCo has retail adjustment clauses that recover purchased natural gas and other resource costs:
QSP Requirements — The CPUC established a natural gas QSP that provides for bill credits to customers if PSCo does not achieve certain performance targets relating to natural gas leak repair time and customer service through 2012. The CPUC conducts proceedings to review and approve the rate adjustment annually. In July 2012, PSCo filed an application with the CPUC to extend the terms of the current QSP through the end of 2015. PSCo is in settlement discussions and expects to close out this matter in the first quarter of 2013. Capability and Demand PSCo projects peak day natural gas supply requirements for firm sales and backup transportation, which include transportation customers contracting for firm supply backup, to be 1,936,810 MMBtu. In addition, firm transportation customers hold 726,530 MMBtu of capacity for PSCo without supply backup. Total firm delivery obligation for PSCo is 2,663,340 MMBtu per day. The maximum daily deliveries for PSCo for firm and interruptible services were 1,539,864 MMBtu on Dec. 19, 2012 and 2,155,547 on Feb. 1, 2011.
Table of Contents
2012 $ 4.36 2011 5.18 2010 5.46
• GCA — The GCA recovers the actual costs of purchased natural gas and transportation to meet the requirements of its customers and is revised quarterly to allow for changes in natural gas rates.
• DSMCA — PSCo has a low-income energy assistance program. The costs of this energy conservation and weatherization program are recovered through the gas DSMCA.
• PSIA — Effective Jan. 1, 2012, the PSIA began to recover costs associated with transmission and distribution pipeline integrity management programs and two projects to replace large transmission pipelines.
30

PSCo purchases natural gas from independent suppliers, generally based on market indices that reflect current prices. The natural gas is delivered under transportation agreements with interstate pipelines. These agreements provide for firm deliverable pipeline capacity of approximately 1,846,358 MMBtu per day, which includes 853,453 MMBtu of natural gas held under third-party underground storage agreements. In addition, PSCo operates three company-owned underground storage facilities, which provide approximately 22,400 MMBtu of natural gas supplies on a peak day. The balance of the quantities required to meet firm peak day sales obligations are primarily purchased at PSCo’s city gate meter stations. PSCo is required by CPUC regulations to file a natural gas purchase plan by June of each year projecting and describing the quantities of natural gas supplies, upstream services and the costs of those supplies and services for the 12-month period of the following year. PSCo is also required to file a natural gas purchase report by October of each year reporting actual quantities and costs incurred for natural gas supplies and upstream services for the previous 12-month period. Natural Gas Supply and Costs PSCo actively seeks natural gas supply, transportation and storage alternatives to yield a diversified portfolio that provides increased flexibility, decreased interruption and financial risk and economical rates. In addition, PSCo conducts natural gas price hedging activities that have been approved by the CPUC. The following table summarizes the average delivered cost per MMBtu of natural gas purchased for resale by PSCo’s regulated retail natural gas distribution business:
PSCo has natural gas supply, transportation and storage agreements that include obligations for the purchase and/or delivery of specified volumes of natural gas or to make payments in lieu of delivery. At Dec. 31, 2012, PSCo was committed to approximately $2.0 billion in such obligations under these contracts, which expire in various years from 2013 through 2029. PSCo purchases natural gas by optimizing a balance of long-term and short-term natural gas purchases, firm transportation and natural gas storage contracts. During 2012, PSCo purchased natural gas from approximately 41 suppliers. See Items 1A and 7 for further discussion of natural gas supply and costs.
SPS Natural Gas Facilities Used for Electric Generation SPS does not provide retail natural gas service, but purchases and transports natural gas for certain of its generation facilities and operates natural gas pipeline facilities connecting the generation facilities to interstate natural gas pipelines. SPS is subject to the jurisdiction of the FERC with respect to certain natural gas transactions in interstate commerce; and to the jurisdiction of the DOT and the PUCT for pipeline safety compliance. See Items 1A and 7 for further discussion of natural gas costs.
Table of Contents
2012 $ 4.28 2011 4.99 2010 5.10
31

Natural Gas Operating Statistics
GENERAL Seasonality The demand for electric power and natural gas is affected by seasonal differences in the weather. In general, peak sales of electricity occur in the summer and winter months, and peak sales of natural gas occur in the winter months. As a result, the overall operating results may fluctuate substantially on a seasonal basis. Additionally, Xcel Energy’s operations have historically generated less revenues and income when weather conditions are milder in the winter and cooler in the summer. See Item 7 — Management’s Discussion of Financial Condition and Results of Operations. Competition Xcel Energy’s industrial and large commercial customers have the ability to own or operate facilities to generate their own electricity. In addition, customers may have the option of substituting other fuels, such as natural gas, steam or chilled water for heating, cooling and manufacturing purposes, or the option of relocating their facilities to a lower cost region. The FERC has continued to promote competitive wholesale markets through open access transmission and other means. As a result, Xcel Energy Inc.’s utility subsidiaries and their wholesale customers can purchase the output from generation resources of competing wholesale suppliers and use the transmission systems of the utility subsidiaries on a comparable basis to serve their native load. Xcel Energy Inc.’s utility subsidiaries also have franchise agreements with certain cities subject to periodic renewal. If a city elected not to renew the franchise agreement, it could seek alternative means for its citizens to access electric power or gas, such as municipalization. While each of Xcel Energy Inc.’s utility subsidiaries faces these challenges, Xcel Energy believes their rates are competitive with currently available alternatives.
Table of Contents
Year Ended Dec. 31 2012 2011 2010 Natural gas deliveries (Thousands of MMBtu) Residential 123,835 139,200 137,809 Commercial and industrial 77,848 86,788 87,599
Total retail 201,683 225,988 225,408 Transportation and other 116,611 117,654 121,261
Total deliveries 318,294 343,642 346,669
Number of customers at end of period Residential 1,760,364 1,747,153 1,735,032 Commercial and industrial 154,158 153,911 152,937
Total retail 1,914,522 1,901,064 1,887,969 Transportation and other 5,789 5,395 5,281
Total customers 1,920,311 1,906,459 1,893,250
Natural gas revenues (Thousands of Dollars) Residential $ 964,642 $ 1,133,888 $ 1,115,253 Commercial and industrial 488,644 601,298 589,449
Total retail 1,453,286 1,735,186 1,704,702 Transportation and other 84,088 76,740 77,880
Total natural gas revenues $ 1,537,374 $ 1,811,926 $ 1,782,582
MMBtu sales per retail customer 105.34 118.87 119.39 Revenue per retail customer $ 759 $ 913 $ 903 Residential revenue per MMBtu 7.79 8.15 8.09 Commercial and industrial revenue per MMBtu 6.28 6.93 6.73 Transportation and other revenue per MMBtu 0.72 0.65 0.64
32

ENVIRONMENTAL MATTERS Xcel Energy’s facilities are regulated by federal and state environmental agencies. These agencies have jurisdiction over air emissions, water quality, wastewater discharges, solid wastes and hazardous substances. Various company activities require registrations, permits, licenses, inspections and approvals from these agencies. Xcel Energy has received all necessary authorizations for the construction and continued operation of its generation, transmission and distribution systems. Xcel Energy’s facilities have been designed and constructed to operate in compliance with applicable environmental standards. Xcel Energy strives to comply with all environmental regulations applicable to its operations. However, it is not possible to determine when or to what extent additional facilities or modifications of existing or planned facilities will be required as a result of changes to environmental regulations, interpretations or enforcement policies or, what effect future laws or regulations may have upon Xcel Energy’s operations. See Item 7 and Notes 12 and 13 to the consolidated financial statements for further discussion. There are significant future environmental regulations under consideration to encourage the use of clean energy technologies and regulate emissions of GHGs to address climate change. While environmental regulations related to climate change and clean energy continue to evolve, Xcel Energy has undertaken a number of initiatives to meet current requirements and prepare for potential future regulations, reduce GHG emissions and respond to state renewable and energy efficiency goals. Although the impact of these policies on Xcel Energy will depend on the specifics of state and federal policies, legislation, and regulation, we believe that, based on prior state commission practice, we would recover the cost of these initiatives through rates. Xcel Energy is committed to addressing climate change and potential climate change regulation through efforts to reduce its GHG emissions in a balanced, cost-effective manner. Xcel Energy adopted a methodology for calculating CO2 emissions based on the reporting protocols of The Climate Registry, a nonprofit
organization that provides and compiles GHG emissions data from reporting entities. As third-party CO2 reporting protocols continue to evolve, Xcel Energy
expects additional changes in reporting methodology and reported CO2 emissions. Starting in 2011, Xcel Energy began reporting GHG emissions to the
EPA. Currently, EPA reporting rules do not address REC transactions. It is not clear whether future GHG reporting regulations could require reporting of CO2
emissions for REC transactions. Based on The Climate Registry’s current reporting protocol, Xcel Energy estimated that its current electric generating portfolio, which includes coal- and gas-fired plants, emitted approximately 59.1 million and 59.8 million tons of CO2 in 2012 and 2011, respectively. Xcel Energy also estimated emissions associated
with electricity purchased for resale to Xcel Energy customers from generation facilities owned by third parties. Xcel Energy estimates that these third-party facilities emitted approximately 15.1 million and 19.9 million tons of CO
2 in 2012 and 2011, respectively. Estimated total CO
2 emissions, associated with service
to Xcel Energy electric customers, decreased by 5.5 million tons in 2012 compared to 2011. The decrease in emissions was associated with a decrease of 3.9 million MWh of generation. The average annual decrease in CO2 emissions since 2010 is approximately 2.1 million tons of CO2 per year.
CAPITAL SPENDING AND FINANCING See Item 7 for a discussion of expected capital expenditures and funding sources. EMPLOYEES As of Dec. 31, 2012, Xcel Energy had 11,028 full-time employees and 170 part-time employees, of which 5,476 were covered under collective-bargaining agreements. See Note 9 to the consolidated financial statements for further discussion. EXECUTIVE OFFICERS Benjamin G.S. Fowke III, 54, Chairman of the Board, President and Chief Executive Officer, Xcel Energy Inc., August 2011 to present. Previously, President and Chief Operating Officer, Xcel Energy Inc., August 2009 to August 2011; Executive Vice President and Chief Financial Officer, Xcel Energy Inc., December 2008 to August 2009; Vice President and Chief Financial Officer, Xcel Energy Inc., May 2004 to December 2008; Vice President, Chief Financial Officer and Treasurer, Xcel Energy Inc., October 2003 to May 2004; Vice President and Treasurer, Xcel Energy Inc., November 2002 to October 2003; and Vice President and Chief Financial Officer, Energy Markets Business Unit, Xcel Energy Services Inc., August 2000 to November 2002.
Table of Contents
33

David L. Eves, 54, President, Director and Chief Executive Officer, PSCo, December 2009 to present. Previously, President, Director and Chief Operating Officer, PSCo, November 2009 to December 2009; President and Director, SPS, December 2006 to November 2009; Chief Executive Officer, SPS, August 2006 to November 2009; Vice President of Resource Planning and Acquisition, Xcel Energy Services Inc., November 2002 to July 2006; and Managing Director, Resource Planning and Acquisition, Xcel Energy Services Inc., August 2000 to November 2002. Cathy J. Hart, 63, Vice President and Corporate Secretary, Xcel Energy Inc., August 2000 to present and Vice President, Business Services Group, Xcel Energy Services Inc., September 2011 to present. Previously, Vice President, Corporate Services Group, Xcel Energy Services Inc., November 2005 to September 2011. C. Riley Hill, 53, President, Director and Chief Executive Officer, SPS, November 2009 to present. Previously, Vice President and Chief Operating Officer, SPS, July 2009 to November 2009; Regional Vice President, Xcel Energy Services Inc., November 2007 to July 2009; Vice President, Construction, Operations and Maintenance, PSCo, February 2006 to November 2007; and Director Design and Construction, PSCo, March 2004 to February 2006. Kent T. Larson, 53, Senior Vice President, Operations, Xcel Energy Services Inc., September 2011 to present. Previously, Chief Energy Supply Officer, Xcel Energy Services Inc., March 2010 to September 2011; Vice President, Transmission, Xcel Energy Services Inc., August 2008 to March 2010; Regional Vice President, Xcel Energy Services Inc., February 2006 to August 2008; Vice President, Jurisdictional Relations, Xcel Energy Services Inc., April 2004 to February 2006; and State Vice President, NSP-Minnesota, September 2000 to April 2004. Teresa S. Madden, 56, Senior Vice President and Chief Financial Officer, Xcel Energy Inc., September 2011 to present. Previously, Vice President and Controller, Xcel Energy Inc., January 2004 to September 2011; Vice President of Finance, Customer and Field Operations Business Unit, Xcel Energy Inc., August 2003 to January 2004; Interim Chief Financial Officer, Rogue Wave Software, Inc., February 2003 to July 2003; and Corporate Controller, Rogue Wave Software, Inc., October 2000 to February 2003. Marvin E. McDaniel, Jr., 52, Senior Vice President and Chief Administrative Officer, Xcel Energy Inc., August 2012 to present. Previously, Senior Vice President and Chief Administrative Officer, Xcel Energy Services Inc., September 2011 to August 2012; Vice President and Chief Administrative Officer, Xcel Energy Services Inc., August 2009 to September 2011 and Vice President, Talent and Technology Business Areas, Xcel Energy Services Inc., August 2009 to September 2011; Vice President, Human Resources, Xcel Energy Services Inc., July 2007 to August 2009; Vice President and Assistant Controller, Xcel Energy Services Inc., March 2005 to June 2007; and Vice President and Controller Energy Markets Business Unit, Xcel Energy Services Inc., February 2004 to February 2005. Timothy O’Connor, 53, Senior Vice President and Chief Nuclear Officer, Xcel Energy Services Inc., February 2013 to present. Previously, Acting Chief Nuclear Officer, NSP-Minnesota, September 2012 to February 2013; Vice President, Engineering and Nuclear Regulatory Compliance and Licensing July 2012 to September 2012; Monticello Site Vice President in May 2007 to July 2012; Site Vice President and plant manager, Nine Mile Point Station, Constellation Energy, 2004 to May 2007; and corporate and site responsibilities at Public Service Enterprise Group, Hope and Salem plants, between the years of 1999 to 2004. R. Roy Palmer, 54, Senior Vice President, Public Policy and External Affairs, Xcel Energy Services Inc., September 2011 to present. Previously, Vice President, Federal and State Government Affairs, Xcel Energy Services Inc., January 2009 to September 2011; Managing Director, Government and Regulatory Affairs, Xcel Energy Services, Inc., November 2007 to January 2009; Executive Director, State Public Affairs, Xcel Energy Services Inc., April 2005 to November 2007; and Director, Regional Government Affairs, Xcel Energy Services Inc., March 2004 to April 2005. Judy M. Poferl, 52, President, Director and Chief Executive Officer, NSP-Minnesota, August 2009 to present. Previously, Regional Vice President, NSP-Minnesota, September 2008 to August 2009; Managing Director, Government and Regulatory Affairs, Xcel Energy Services Inc., November 2007 to September 2008; and Director, Regulatory Administration, Xcel Energy Services Inc., August 2000 to November 2007. Jeffrey S. Savage, 41, Vice President and Controller, Xcel Energy Inc., September 2011 to present. Previously, Senior Director, Financial Reporting, Corporate and Technical Accounting, Xcel Energy Services Inc., December 2009 to September 2011; Director, Financial Reporting and Technical Accounting, Xcel Energy Services Inc., March 2007 to December 2009; and Director, Financial Reporting and Technical Accounting, The Mosaic Company, January 2006 to March 2007.
Table of Contents
34

David M. Sparby, 58, Senior Vice President and Group President, Xcel Energy Services Inc., September 2011 to present. Previously, Vice President and Chief Financial Officer, Xcel Energy Inc., August 2009 to September 2011; President, Director and Chief Executive Officer, NSP-Minnesota, August 2008 to August 2009; Executive Vice President and Director, Acting President and Chief Executive Officer, NSP-Minnesota, January 2007 to August 2008; and Vice President, Government and Regulatory Affairs, Xcel Energy Services Inc., September 2000 to January 2007. Mark E. Stoering, 52, President, Director and Chief Executive Officer, NSP-Wisconsin, January 2012 to present. Previously, Vice President, Portfolio Strategy and Business Development, Xcel Energy Services Inc., August 2000 to December 2011. George E. Tyson, II, 47, Vice President and Treasurer, Xcel Energy Inc., May 2004 to present. Previously, Managing Director and Assistant Treasurer, Xcel Energy Inc., July 2003 to May 2004; Director of Origination, Energy Markets Business Unit, Xcel Energy Services Inc., May 2002 to July 2003; and Associate and Vice President, Deutsche Bank Securities, December 1996 to April 2002. Scott M. Wilensky, 56, Senior Vice President and General Counsel, Xcel Energy Inc., September 2011 to present. Previously, Vice President, Regulatory and Resource Planning, Xcel Energy Services Inc., September 2009 to September 2011; Vice President, Government and Regulatory Affairs, Xcel Energy Services Inc., August 2008 to September 2009; Executive Director, Revenue, Xcel Energy Services Inc., March 2006 to August 2008; Director, State Public Affairs, Xcel Energy Services Inc., November 2001 to March 2006; Assistant General Counsel, Xcel Energy Services Inc., August 2001 to November 2001; and Senior Attorney, Xcel Energy Services Inc., December 1998 to August 2001. No family relationships exist between any of the executive officers or directors. Item 1A — Risk Factors Like other companies in our industry, Xcel Energy is subject to a variety of risks, many of which are beyond our control. Important risks that may adversely affect the business, financial condition, and results of operations are further described below. These risks should be carefully considered together with the other information set forth in this report and in future reports that Xcel Energy files with the SEC. There may be further risks and uncertainties that are not presently known or are not currently believed to be material that may adversely affect our performance or financial condition in the future. Oversight of Risk and Related Processes The goal of Xcel Energy’s risk management process is to understand, manage and, when possible, mitigate material risk. Management is responsible for identifying and managing risks, while the Board of Directors oversees and holds management accountable. As described more fully below, Xcel Energy is faced with a number of different types of risk. Many of these risks are cross-cutting risks such that these risks are discussed and managed across business areas and coordinated by Xcel Energy’s senior management. Our risk management process has three parts: identification and analysis, management and mitigation and communication and disclosure. Management identifies and analyzes risks to determine materiality and other attributes such as timing, probability and controllability. Management broadly considers our business, the utility industry, the domestic and global economy and the environment to identify risks. Identification and analysis occurs formally through a key risk assessment process conducted by senior management, the financial disclosure process, the hazard risk management process and internal auditing and compliance with financial and operational controls. Management also identifies and analyzes risk through its business planning process and development of goals and key performance indicators, which include risk identification to determine barriers to implementing Xcel Energy’s strategy. At the same time, the business planning process identifies areas in which there is a potential for a business area to take inappropriate risk to meet goals and determines how to prevent inappropriate risk-taking. Management seeks to mitigate the risks inherent in the implementation of Xcel Energy’s strategy. The process for risk mitigation includes adherence to our code of conduct and other compliance policies, operation of formal risk management structures and groups, and overall business management. At a threshold level, Xcel Energy has developed a robust compliance program and promotes a culture of compliance, which further mitigates risk. Building on this culture of compliance, Xcel Energy manages and mitigates risks through operation of formal risk management structures and groups, including management councils, risk committees and the services of corporate areas such as internal audit, the corporate controller and legal services. While Xcel Energy has developed a number of formal structures for risk management, many material risks affect the business as a whole and are managed across business areas.
Table of Contents
35

Management also communicates with the Board and key stakeholders regarding risk. Management provides information to the Board in presentations and communications over the course of the year. Senior management presents an assessment of key risks to the Board annually. The presentation of the key risks and the discussion provides the Board with information on the risks management believes are material, including the earnings impact, timing, likelihood and controllability. Based on this presentation, the Board reviews risks at an enterprise level and confirms risk management and mitigation are included in Xcel Energy’s strategy. The guidelines on corporate governance and committee charters define the scope of review and inquiry for the Board and committees. The standing committees also oversee risk management as part of their charters. Each committee has responsibility for overseeing aspects of risk and Xcel Energy’s management and mitigation of the risk. The Board has overall responsibility for risk oversight. As described above, the Board reviews the key risk assessment process presented by senior management. This key risk assessment analyzes the most likely areas of future risk to Xcel Energy. The Board also reviews the performance and annual goals of each business area. This review, when combined with the oversight of specific risks by the committees, allows the Board to confirm risk is considered in the development of goals and that risk has been adequately considered and mitigated in the execution of corporate strategy. The presentation of the assessment of key risks also provides the basis for the discussion of risk in our public filings and securities disclosures. Risks Associated with Our Business Environmental Risks We are subject to environmental laws and regulations, with which compliance could be difficult and costly. We are subject to environmental laws and regulations that affect many aspects of our past, present and future operations, including air emissions, water quality, wastewater discharges and the generation, transport and disposal of solid wastes and hazardous substances. These laws and regulations require us to obtain and comply with a wide variety of environmental registrations including those for protected natural and cultural resources (such as wetlands, endangered species and other protected wildlife, and archeological and historical resources), licenses, permits, inspections and other approvals. Environmental laws and regulations can also require us to restrict or limit the output of certain facilities or the use of certain fuels, to install pollution control equipment at our facilities, clean up spills and correct environmental hazards and other contamination. Both public officials and private individuals may seek to enforce the applicable environmental laws and regulations against us. We may be required to pay all or a portion of the cost to remediate (i.e., cleanup) sites where our past activities, or the activities of certain other parties, caused environmental contamination. At Dec. 31, 2012, these sites included:
We are also subject to mandates to provide customers with clean energy, renewable energy and energy conservation offerings. These mandates are designed in part to mitigate the potential environmental impacts of utility operations. Failure to meet the requirements of these mandates may result in fines or penalties, which could have a material effect on our results of operations. If our regulators do not allow us to recover all or a part of the cost of capital investment or the O&M costs incurred to comply with the mandates, it could have a material effect on our results of operations, financial position or cash flows. In addition, existing environmental laws or regulations may be revised, and new laws or regulations seeking to protect the environment may be adopted or become applicable to us, including but not limited to, regulation of mercury, NOx, SO
2, CO
2, particulates, coal ash and cooling water intake systems. We may
also incur additional unanticipated obligations or liabilities under existing environmental laws and regulations. We are subject to physical and financial risks associated with climate change. There is a growing consensus that emissions of GHGs are linked to global climate change. Climate change creates physical and financial risk. Physical risks from climate change include an increase in sea level and changes in weather conditions, such as changes in precipitation and extreme weather events. We do not serve any coastal communities so the possibility of sea level rises does not directly affect us or our customers. Our customers’ energy needs vary with weather conditions, primarily temperature and humidity. For residential customers, heating and cooling represent their largest energy use. To the extent weather conditions are affected by climate change, customers’ energy use could increase or decrease depending on the duration and magnitude of the changes.
Table of Contents
• Sites of former MGPs operated by our subsidiaries, predecessors, or other entities; and • Third party sites, such as landfills, for which we are alleged to be a PRP that sent hazardous materials and wastes.
36

Increased energy use due to weather changes may require us to invest in additional generating assets, transmission and other infrastructure to serve increased load. Decreased energy use due to weather changes may affect our financial condition, through decreased revenues. Extreme weather conditions in general require more system backup, adding to costs, and can contribute to increased system stress, including service interruptions. Weather conditions outside of our service territory could also have an impact on our revenues. We buy and sell electricity depending upon system needs and market opportunities. Extreme weather conditions creating high energy demand on our own and/or other systems may raise electricity prices as we buy short-term energy to serve our own system, which would increase the cost of energy we provide to our customers. Severe weather impacts our service territories, primarily when thunderstorms, tornadoes and snow or ice storms occur. To the extent the frequency of extreme weather events increases, this could increase our cost of providing service. Changes in precipitation resulting in droughts or water shortages could adversely affect our operations, principally our fossil generating units. A negative impact to water supplies due to long-term drought conditions could adversely impact our ability to provide electricity to customers, as well as increase the price they pay for energy. We may not recover all costs related to mitigating these physical and financial risks. To the extent climate change impacts a region’s economic health, it may also impact our revenues. Our financial performance is tied to the health of the regional economies we serve. The price of energy, as a factor in a region’s cost of living as well as an important input into the cost of goods and services, has an impact on the economic health of our communities. The cost of additional regulatory requirements, such as a tax on GHGs or additional environmental regulation could impact the availability of goods and prices charged by our suppliers which would normally be borne by consumers through higher prices for energy and purchased goods. To the extent financial markets view climate change and emissions of GHGs as a financial risk, this could negatively affect our ability to access capital markets or cause us to receive less than ideal terms and conditions. Financial Risks Our profitability depends in part on the ability of our utility subsidiaries to recover their costs from their customers and there may be changes in circumstances or in the regulatory environment that impair the ability of our utility subsidiaries to recover costs from their customers. We are subject to comprehensive regulation by federal and state utility regulatory agencies. The utility commissions in the states where we operate regulate many aspects of our utility operations, including siting and construction of facilities, customer service and the rates that we can charge customers. The FERC has jurisdiction, among other things, over wholesale rates for electric transmission service, the sale of electric energy in interstate commerce and certain natural gas transactions in interstate commerce. The profitability of our utility operations is dependent on our ability to recover the costs of providing energy and utility services to our customers and earn a return on our capital investment in our utility operations. Our utility subsidiaries currently provide service at rates approved by one or more regulatory commissions. These rates are generally regulated and based on an analysis of the utility’s costs incurred in a test year. Our utility subsidiaries are subject to both future and historical test years depending upon the regulatory mechanisms approved in each jurisdiction. Thus, the rates a utility is allowed to charge may or may not match its costs at any given time. While rate regulation is premised on providing an opportunity to earn a reasonable rate of return on invested capital, in a continued low interest rate environment there could be pressure on ROE. There can also be no assurance that the applicable regulatory commission will judge all the costs of our utility subsidiaries to have been prudently incurred or that the regulatory process in which rates are determined will always result in rates that will produce full recovery of such costs. Rising fuel costs could increase the risk that our utility subsidiaries will not be able to fully recover their fuel costs from their customers. Furthermore, there could be changes in the regulatory environment that would impair the ability of our utility subsidiaries to recover costs historically collected from their customers. Management currently believes these prudently incurred costs are recoverable given the existing regulatory mechanisms in place. However, changes in regulations or the imposition of additional regulations, including additional environmental or climate change regulation, could have an adverse impact on our results of operations and hence could materially and adversely affect our ability to meet our financial obligations, including debt payments and the payment of dividends on our common stock.
Table of Contents
37

Any reductions in our credit ratings could increase our financing costs and the cost of maintaining certain contractual relationships. We cannot be assured that any of our current ratings or our subsidiaries’ ratings will remain in effect for any given period of time or that a rating will not be lowered or withdrawn entirely by a rating agency. In addition, our credit ratings may change as a result of the differing methodologies or change in the methodologies used by the various rating agencies. For example, Standard & Poor’s calculates an imputed debt associated with capacity payments from purchased power contracts. An increase in the overall level of capacity payments would increase the amount of imputed debt, based on Standard & Poor’s methodology. Therefore, Xcel Energy Inc. and its subsidiaries credit ratings could be adversely affected based on the level of capacity payments associated with purchased power contracts or changes in how our imputed debt is determined. Any downgrade could lead to higher borrowing costs. Also, our utility subsidiaries may enter into certain procurement and derivative contracts that require the posting of collateral or settlement of applicable contracts if credit ratings fall below investment grade. We are subject to capital market and interest rate risks. Utility operations require significant capital investment in property, plant and equipment; consequently, we are an active participant in debt and equity markets. Any disruption in capital markets could have a material impact on our ability to fund our operations. Capital markets are global in nature and are impacted by numerous issues and events throughout the world economy, such as the concerns regarding European sovereign debt and management of the U.S. federal debt. Capital market disruption events, and resulting broad financial market distress, such as the events surrounding the collapse in the U.S. sub-prime mortgage market, could prevent us from issuing new securities or cause us to issue securities with less than ideal terms and conditions, such as higher interest rates. Higher interest rates on short-term borrowings with variable interest rates or on incremental commercial paper issuances could also have an adverse effect on our operating results. Changes in interest rates may also impact the fair value of the debt securities in the nuclear decommissioning fund and master pension trust, as well as our ability to earn a return on short-term investments of excess cash. We are subject to credit risks. Credit risk includes the risk that our retail customers will not pay their bills, which may lead to a reduction in liquidity and an eventual increase in bad debt expense. Retail credit risk is comprised of numerous factors including the price of products and services provided, the overall economy and local economies in the geographic areas we serve, including local unemployment rates. Credit risk also includes the risk that various counterparties that owe us money or product will breach their obligations. Should the counterparties to these arrangements fail to perform, we may be forced to enter into alternative arrangements. In that event, our financial results could be adversely affected and we could incur losses. One alternative available to address counterparty credit risk is to transact on liquid commodity exchanges. The credit risk is then socialized through the exchange central clearinghouse function. While exchanges do remove counterparty credit risk, all participants are subject to margin requirements, which create an additional need for liquidity to post margin as exchange positions change value daily. The Dodd-Frank Wall Street Reform Act (Dodd-Frank Act) requires broad clearing of financial swap transactions through a central counterparty, which could lead to additional margin requirements that would impact our liquidity: however, we expect to take advantage of an exception to mandatory clearing afforded to commercial end-users who are not classified as a major swap participant. The CFTC has granted an increase in the de minimis level for swap transactions with defined utility special entities, generally entities owning or operating electric or natural gas facilities, from $25 million to $800 million. Our current level of financial swap activity with special entities is significantly below this new threshold; therefore, we will not be classified as a swap dealer in our special entity activity. Swap transactions with non special entities have a much higher level of activity considered to be de minimis, currently $8 billion, and our level of activity is well under this limit; therefore, we will not be classified as a swap dealer under the Dodd-Frank Act. While we believe the impact on our liquidity will not be material, we expect to be required to report our swap transactions as part of the Dodd-Frank Act. We may at times have direct credit exposure in our short-term wholesale and commodity trading activity to various financial institutions trading for their own accounts or issuing collateral support on behalf of other counterparties. We may also have some indirect credit exposure due to participation in organized markets, such as PJM and MISO, in which any credit losses are socialized to all market participants.
Table of Contents
38

We do have additional indirect credit exposures to various domestic and foreign financial institutions in the form of letters of credit provided as security by power suppliers under various long-term physical purchased power contracts. If any of the credit ratings of the letter of credit issuers were to drop below the designated investment grade rating stipulated in the underlying long-term purchased power contracts, the supplier would need to replace that security with an acceptable substitute. If the security were not replaced, the party could be in technical default under the contract, which would enable us to exercise our contractual rights. Increasing costs associated with our defined benefit retirement plans and other employee benefits may adversely affect our results of operations, financial position or liquidity. We have defined benefit pension and postretirement plans that cover substantially all of our employees. Assumptions related to future costs, return on investments, interest rates and other actuarial assumptions have a significant impact on our funding requirements related to these plans. These estimates and assumptions may change based on economic conditions, actual stock and bond market performance, changes in interest rates and changes in governmental regulations. In addition, the Pension Protection Act of 2006 changed the minimum funding requirements for defined benefit pension plans beginning in 2008 with modifications to these funding requirements in 2012 that allowed additional flexibility in the timing of contributions. Therefore, our funding requirements and related contributions may change in the future. Also, the payout of a significant percentage of pension plan liabilities in a single year due to high retirements or employees leaving the company would trigger settlement accounting and could require the company to recognize material incremental pension expense related to unrecognized plan losses in the year these liabilities are paid. Increasing costs associated with health care plans may adversely affect our results of operations. Our self-insured costs of health care benefits for eligible employees and costs for retiree health care plans have increased substantially in recent years. Increasing levels of large individual health care claims and overall health care claims could have an adverse impact on our operating results, financial position, and liquidity. We believe that our employee benefit costs, including costs related to health care plans for our employees and former employees, will continue to rise. Legislation related to health care could also significantly change our benefit programs and costs. We must rely on cash from our subsidiaries to make dividend payments. We are a holding company and our investments in our subsidiaries are our primary assets. Substantially all of our operations are conducted by our subsidiaries. Consequently, our operating cash flow and our ability to service our indebtedness and pay dividends depends upon the operating cash flows of our subsidiaries and the payment of funds by them to us in the form of dividends. Our subsidiaries are separate legal entities that have no obligation to pay any amounts due pursuant to our obligations or to make any funds available for that purpose or for dividends on our common stock, whether by dividends or otherwise. In addition, each subsidiary’s ability to pay dividends to us depends on any statutory and/or contractual restrictions that may be applicable to such subsidiary, which may include requirements to maintain minimum levels of equity ratios, working capital or assets. Also, our utility subsidiaries are regulated by various state utility commissions, which generally possess broad powers to ensure that the needs of the utility customers are being met. If our utility subsidiaries were to cease making dividend payments, our ability to pay dividends on our common stock or otherwise meet our financial obligations could be adversely affected. Operational Risks We are subject to commodity risks and other risks associated with energy markets and energy production. We engage in wholesale sales and purchases of electric capacity, energy and energy-related products and are subject to market supply and commodity price risk. Commodity price changes can affect the value of our commodity trading derivatives. We mark certain derivatives to estimated fair market value on a daily basis (mark-to-market accounting), which may cause earnings volatility. Actual settlements can vary significantly from these estimates, and significant changes from the assumptions underlying our fair value estimates could cause significant earnings variability.
Table of Contents
39

If we encounter market supply shortages or our suppliers are otherwise unable to meet their contractual obligations, we may be unable to fulfill our contractual obligations to our retail, wholesale and other customers at previously authorized or anticipated costs. Any such disruption, if significant, could cause us to seek alternative supply services at potentially higher costs or suffer increased liability for unfulfilled contractual obligations. Any significantly higher energy or fuel costs relative to corresponding sales commitments would have a negative impact on our cash flows and could potentially result in economic losses. Potential market supply shortages may not be fully resolved through alternative supply sources and such interruptions may cause short-term disruptions in our ability to provide electric and/or natural gas services to our customers. The impact of these cost and reliability issues vary in magnitude for each operating subsidiary depending upon unique operating conditions such as generation fuels mix, availability of water for cooling, availability of fuel transportation, electric generation capacity, transmission, etc. Our subsidiary, NSP-Minnesota, is subject to the risks of nuclear generation. NSP-Minnesota’s two nuclear stations, Prairie Island and Monticello, subject it to the risks of nuclear generation, which include:
The NRC has authority to impose licensing and safety-related requirements for the operation of nuclear generation facilities. In the event of non-compliance, the NRC has the authority to impose fines or shut down a unit, or both, depending upon its assessment of the severity of the situation, until compliance is achieved. Revised NRC safety requirements could necessitate substantial capital expenditures or a substantial increase in operating expenses at NSP-Minnesota’s nuclear plants. In addition, the Institute for Nuclear Power Operations reviews NSP-Minnesota’s nuclear operations and nuclear generation facilities. Compliance with the Institute for Nuclear Power Operations’ recommendations could result in substantial capital expenditures or a substantial increase in operating expenses. If an incident did occur, it could have a material effect on our results of operations or financial condition. Furthermore, the non-compliance of other nuclear facilities operators with applicable regulations or the occurrence of a serious nuclear incident at other facilities could result in increased regulation of the industry as a whole, which could then increase NSP-Minnesota’s compliance costs and impact the results of operations of its facilities. NSP-Wisconsin’s production and transmission system is operated on an integrated basis with NSP-Minnesota’s production and transmission system, and NSP-Wisconsin may be subject to risks associated with NSP-Minnesota’s nuclear generation. Our utility operations are subject to long-term planning risks. On a periodic basis our utility operations file long-term resource plans with our regulators. These plans are based on numerous assumptions over the relevant planning horizon such as: sales growth, customer usage patterns, economic activity, costs, regulatory mechanisms, impact of technology on energy efficiency on sales and production, customer behavioral response and continuation of the existing utility business model. Given the uncertainty in these planning assumptions, there is a risk that the magnitude and timing of resource additions and demand may not coincide. This could lead to under recovery of costs or insufficient resources to meet customer demand. In some of our state jurisdictions, large industrial customers may leave our system and invest in their own on-site distributed generation or seek law changes to give them the authority to purchase directly from other suppliers or organized markets. The recent low natural gas price environment has caused some customers to consider their options in this area, particularly customers with industrial processes using steam. Wholesale customers may purchase directly from other suppliers and procure only transmission service from our utility subsidiaries. These circumstances provide for greater long-term planning uncertainty related to future load growth. Similarly, distributed solar generation may become an economic competitive threat to our load growth in the future, however we believe the economics, absent significant subsidies, do not support such a trend in the near term unless a state mandates the purchase of such generation. Some state legislatures have considered such legislation.
Table of Contents
• The risks associated with use of radioactive material in the production of energy, the management, handling, storage and disposal of these radioactive materials and the current lack of a long-term disposal solution for radioactive materials;
• Limitations on the amounts and types of insurance commercially available to cover losses that might arise in connection with nuclear operations; and • Uncertainties with respect to the technological and financial aspects of decommissioning nuclear plants at the end of licensed lives.
40

Our natural gas transmission and distribution operations involve numerous risks that may result in accidents and other operating risks and costs. Our natural gas transmission and distribution activities include a variety of inherent hazards and operating risks, such as leaks, explosions and mechanical problems, which could cause substantial financial losses. In addition, these risks could result in loss of human life, significant damage to property, environmental pollution, impairment of our operations and substantial losses to us. In accordance with customary industry practice, we maintain insurance against some, but not all, of these risks and losses. The occurrence of any of these events not fully covered by insurance could have a material effect on our financial position and results of operations. For our natural gas transmission or distribution lines located near populated areas, including residential areas, commercial business centers, industrial sites and other public gathering areas, the level of potential damages resulting from these risks is greater. Additionally, the cost of potential regulations related to pipeline safety could be significant. Public Policy Risks We may be subject to legislative and regulatory responses to climate change and emissions, with which compliance could be difficult and costly. Increased public awareness and concern regarding climate change may result in more regional and/or federal requirements to reduce or mitigate the effects of GHGs. Numerous states have announced or adopted programs to stabilize and reduce GHGs, and federal legislation has been introduced in both houses of Congress. The U.S. continues to participate in international negotiations related to the United Nations Framework Convention on Climate Change. Such legislative and regulatory responses related to climate change and new interpretations of existing laws through climate change litigation create financial risk as our electric generating facilities are likely to be subject to regulation under climate change laws introduced at either the state or federal level within the next few years. The EPA has taken steps to regulate GHGs under the CAA. In December 2009, the EPA issued a finding that GHG emissions endanger public health and welfare, and that motor vehicle emissions contribute to the GHGs in the atmosphere. This endangerment finding created a mandatory duty for the EPA to regulate GHGs from light duty motor vehicles. In January 2011, new EPA permitting requirements became effective for GHG emissions of new and modified large stationary sources, which are applicable to construction of new power plants or power plant modifications that increase emissions above a certain threshold. The EPA has also announced that it will propose GHG regulations applicable to emissions from existing power plants, although it is not known when the EPA will initiate this rulemaking. We are also currently a party to climate change lawsuits and may be subject to additional climate change lawsuits, including lawsuits similar to those described in Note 13 to the consolidated financial statements. An adverse outcome in any of these cases could require substantial capital expenditures that cannot be determined at this time and could possibly require payment of substantial penalties or damages. Defense costs associated with such litigation can also be significant. Such payments or expenditures could affect results of operations, cash flows, and financial condition if such costs are not recovered through regulated rates. There are many uncertainties regarding when and in what form climate change legislation or regulations will be enacted. The impact of legislation and regulations, on us and our customers will depend on a number of factors, including whether GHG sources in multiple sectors of the economy are regulated, the overall GHG emissions cap level, the degree to which GHG offsets are recognized as compliance options, the allocation of emission allowances to specific sources and the indirect impact of carbon regulation on natural gas and coal prices. While we do not have operations outside of the U.S., any international treaties or accords could have an impact to the extent they lead to future federal or state regulations. Another important factor is our ability to recover the costs incurred to comply with any regulatory requirements that are ultimately imposed. We may not be able to timely recover all costs related to complying with regulatory requirements imposed on us. If our regulators do not allow us to recover all or a part of the cost of capital investment or the O&M costs incurred to comply with the mandates, it could have a material effect on our results of operations. We are also subject to a significant number of proposed and potential rules that will impact our coal-fired and other generation facilities. These include, but are not limited to, rules associated with emissions of SO2 and NOx, mercury, regional haze, ozone, ash management and cooling water intake systems. The costs of
investment to comply with these rules could be substantial. We may not be able to timely recover all costs related to complying with regulatory requirements imposed on us.
Table of Contents
41

Increased risks of regulatory penalties could negatively impact our business. The Energy Act increased the FERC’s civil penalty authority for violation of FERC statutes, rules and orders. The FERC can now impose penalties of $1 million per violation per day. In addition, electric reliability standards are now mandatory and subject to potential financial penalties by regional entities, the NERC or the FERC for violations. If a serious reliability incident did occur, it could have a material effect on our operations or financial results. The FERC has provided NOVs of its market manipulation rules to several market participants during the year. The potential penalties in one pending case exceed $400 million. As with all regulatory requirements, we attempt to mitigate this risk through formal training on such prohibited practices and a compliance function that reviews our interaction with the markets under FERC and CFTC jurisdictions. However, there is no guarantee our compliance program will be sufficient to ensure against violations. Macroeconomic Risks Economic conditions could negatively impact our business. Our operations are affected by local, national and worldwide economic conditions. The consequences of a prolonged economic recession and uncertainty of recovery may result in a sustained lower level of economic activity and uncertainty with respect to energy prices and the capital and commodity markets. A sustained lower level of economic activity may also result in a decline in energy consumption, which may adversely affect our revenues and future growth. Instability in the financial markets, as a result of recession or otherwise, also may affect the cost of capital and our ability to raise capital, which are discussed in greater detail in the capital market risk section above. Current economic conditions may be exacerbated by insufficient financial sector liquidity leading to potential increased unemployment, which may impact customers’ ability to pay timely, increase customer bankruptcies, and may lead to increased bad debt. Further, worldwide economic activity has an impact on the demand for basic commodities needed for utility infrastructure, such as steel, copper, aluminum, etc., which may impact our ability to acquire sufficient supplies. Additionally, the cost of those commodities may be higher than expected. Our operations could be impacted by war, acts of terrorism, threats of terrorism or disruptions in normal operating conditions due to localized or regional events. Our generation plants, fuel storage facilities, transmission and distribution facilities and information systems may be targets of terrorist activities that could disrupt our ability to produce or distribute some portion of our energy products. Any such disruption could result in a significant decrease in revenues and significant additional costs to repair and insure our assets, which could have a material impact on our financial condition and results of operations. The potential for terrorism has subjected our operations to increased risks and could have a material effect on our business. While we have already incurred increased costs for security and capital expenditures in response to these risks, we may experience additional capital and operating costs to implement security for our plants, including our nuclear power plants under the NRC’s design basis threat requirements, such as additional physical plant security and additional security personnel. We have also already incurred increased costs for compliance with NERC reliability standards associated with critical infrastructure protection, and may experience additional capital and operating costs to comply with the NERC critical infrastructure protection standards as they are implemented and clarified. The insurance industry has also been affected by these events and the availability of insurance may decrease. In addition, the insurance we are able to obtain may have higher deductibles, higher premiums and more restrictive policy terms. For example, wildfire events, particularly in the geographic areas we serve, may cause insurance for wildfire losses to become difficult or expensive to obtain. A disruption of the regional electric transmission grid, interstate natural gas pipeline infrastructure or other fuel sources, could negatively impact our business. Because our generation, transmission systems and local natural gas distribution companies are part of an interconnected system, we face the risk of possible loss of business due to a disruption caused by the actions of a neighboring utility or an event (severe storm, severe temperature extremes, generator or transmission facility outage, pipeline rupture, railroad disruption, sudden and significant increase or decrease in wind generation, or any disruption of work force such as may be caused by flu epidemic) within our operating systems or on a neighboring system. Any such disruption could result in a significant decrease in revenues and significant additional costs to repair assets, which could have a material impact on our financial condition and results.
Table of Contents
42

The degree to which we are able to maintain day-to-day operations in response to unforeseen events, potentially through the execution of our business continuity plans, will in part determine the financial impact of certain events on our financial condition and results. It’s difficult to predict the magnitude of such events and associated impacts. A cyber incident or cyber security breach could have a material effect on our business. We operate in a highly regulated industry that requires the continued operation of sophisticated information technology systems and network infrastructure. In addition, in the ordinary course of business, we use our systems and infrastructure to create, collect, use, disclose, store, dispose of and otherwise process sensitive information, including company data, customer energy usage data, and personal information regarding customers, employees and their dependents, contractors, shareholders and other individuals. Our generation, transmission, distribution and fuel storage facilities, information technology systems and other infrastructure or physical assets, as well as the information processed in our systems, infrastructure and assets could be directly or indirectly affected by unintentional or deliberate cyber security incidents, including those caused by human error. Cyber security incidents could harm our businesses by limiting our generating, transmitting and distributing capabilities, delaying our development and construction of new facilities or capital improvement projects to existing facilities, disrupting our customer operations, or exposing us to liability. As generation and transmission systems as well as natural gas pipelines are part of an interconnected system, a disruption caused by the impact of a cyber security incident of the regional electric transmission grid, natural gas pipeline infrastructure or other fuel sources or of our third party service providers’ operations, could also negatively impact our business. In addition, we also anticipate that such an event would receive regulatory scrutiny at both the Federal and State level. We are unable to quantify the potential impact of such cyber security threats or subsequent related actions. These potential cyber security incidents and corresponding regulatory action could result in a material decrease in revenues and may cause significant additional costs (e.g., penalties, third party claims, repairs, insurance or compliance) and potentially disrupt our supply and markets for natural gas, oil and other fuels. Although we maintain security measures designed to protect our information technology systems, network infrastructure and other assets, these assets as well as the information they process may be vulnerable to cyber security incidents, including the resulting disability, or failures of assets or unauthorized access to assets or information. If our technology systems were to fail or be breached, or those of our third-party service providers, we may be unable to fulfill critical business functions, including effectively maintaining certain internal controls over financial reporting. We are unable to quantify the potential impact of cyber security incidents on our business. Rising energy prices could negatively impact our business. Higher fuel costs could significantly impact our results of operations if requests for recovery are unsuccessful. In addition, higher fuel costs could reduce customer demand and/or increase bad debt expense, which could also have a material impact on our results of operations. Delays in the timing of the collection of fuel cost recoveries as compared with expenditures for fuel purchases could have an impact on our cash flows. We are unable to predict future prices or the ultimate impact of such prices on our results of operations or cash flows. Our operating results may fluctuate on a seasonal and quarterly basis and can be adversely affected by milder weather. Our electric and natural gas utility businesses are seasonal, and weather patterns can have a material impact on our operating performance. Demand for electricity is often greater in the summer and winter months associated with cooling and heating. Because natural gas is heavily used for residential and commercial heating, the demand for this product depends heavily upon weather patterns throughout our service territory, and a significant amount of natural gas revenues are recognized in the first and fourth quarters related to the heating season. Accordingly, our operations have historically generated less revenues and income when weather conditions are milder in the winter and cooler in the summer. Unusually mild winters and summers could have an adverse effect on our financial condition, results of operations, or cash flows. Item 1B — Unresolved Staff Comments None. Item 2 — Properties Virtually all of the utility plant property of NSP-Minnesota and NSP-Wisconsin is subject to the lien of their first mortgage bond indentures. Virtually all of the electric utility plant property of PSCo and SPS is subject to the lien of their first mortgage bond indentures.
Table of Contents
43
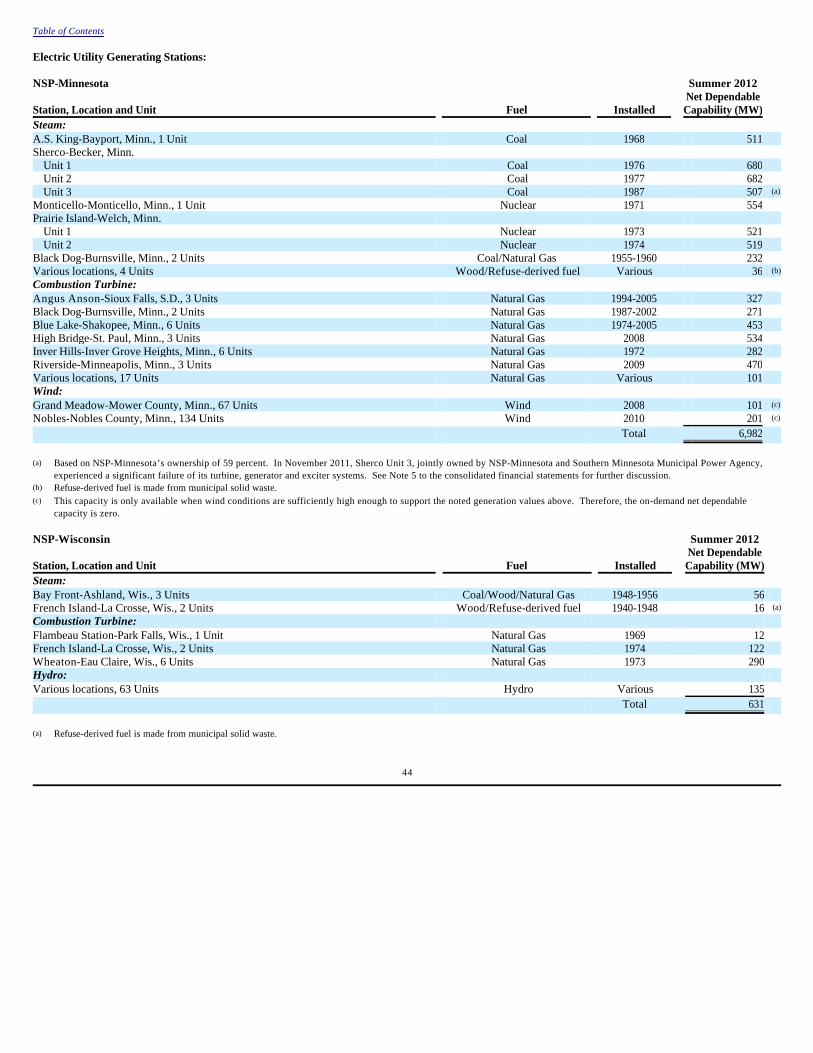
Electric Utility Generating Stations:
Table of Contents
NSP-Minnesota Summer 2012 Net Dependable Station, Location and Unit Fuel Installed Capability (MW) Steam: A.S. King-Bayport, Minn., 1 Unit Coal 1968 511 Sherco-Becker, Minn.
Unit 1 Coal 1976 680 Unit 2 Coal 1977 682 Unit 3 Coal 1987 507 (a)
Monticello-Monticello, Minn., 1 Unit Nuclear 1971 554 Prairie Island-Welch, Minn.
Unit 1 Nuclear 1973 521 Unit 2 Nuclear 1974 519
Black Dog-Burnsville, Minn., 2 Units Coal/Natural Gas 1955-1960 232 Various locations, 4 Units Wood/Refuse-derived fuel Various 36 (b) Combustion Turbine: Angus Anson-Sioux Falls, S.D., 3 Units Natural Gas 1994-2005 327 Black Dog-Burnsville, Minn., 2 Units Natural Gas 1987-2002 271 Blue Lake-Shakopee, Minn., 6 Units Natural Gas 1974-2005 453 High Bridge-St. Paul, Minn., 3 Units Natural Gas 2008 534 Inver Hills-Inver Grove Heights, Minn., 6 Units Natural Gas 1972 282 Riverside-Minneapolis, Minn., 3 Units Natural Gas 2009 470 Various locations, 17 Units Natural Gas Various 101 Wind: Grand Meadow-Mower County, Minn., 67 Units Wind 2008 101 (c) Nobles-Nobles County, Minn., 134 Units Wind 2010 201 (c) Total 6,982
(a) Based on NSP-Minnesota’s ownership of 59 percent. In November 2011, Sherco Unit 3, jointly owned by NSP-Minnesota and Southern Minnesota Municipal Power Agency, experienced a significant failure of its turbine, generator and exciter systems. See Note 5 to the consolidated financial statements for further discussion.
(b) Refuse-derived fuel is made from municipal solid waste. (c) This capacity is only available when wind conditions are sufficiently high enough to support the noted generation values above. Therefore, the on-demand net dependable
capacity is zero.
NSP-Wisconsin Summer 2012 Net Dependable Station, Location and Unit Fuel Installed Capability (MW) Steam: Bay Front-Ashland, Wis., 3 Units Coal/Wood/Natural Gas 1948-1956 56 French Island-La Crosse, Wis., 2 Units Wood/Refuse-derived fuel 1940-1948 16 (a) Combustion Turbine: Flambeau Station-Park Falls, Wis., 1 Unit Natural Gas 1969 12 French Island-La Crosse, Wis., 2 Units Natural Gas 1974 122 Wheaton-Eau Claire, Wis., 6 Units Natural Gas 1973 290 Hydro: Various locations, 63 Units Hydro Various 135 Total 631
(a) Refuse-derived fuel is made from municipal solid waste.
44

Table of Contents
PSCo Summer 2012 Net Dependable Station, Location and Unit Fuel Installed Capability (MW) Steam: Arapahoe-Denver, Colo., 2 Units Coal 1951-1955 144 Cherokee-Denver, Colo., 2 Units Coal 1957-1968 504 (a) Comanche-Pueblo, Colo.
Unit 1 Coal 1973 325 Unit 2 Coal 1975 335 Unit 3 Coal 2010 511 (b)
Craig-Craig, Colo., 2 Units Coal 1979-1980 83 (c) Hayden-Hayden, Colo., 2 Units Coal 1965-1976 237 (d) Pawnee-Brush, Colo., 1 Unit Coal 1981 505 Valmont-Boulder, Colo., 1 Unit Coal 1964 184 Zuni-Denver, Colo., 1 Unit Coal 1948-1954 60 Combustion Turbine: Blue Spruce-Aurora, Colo., 2 Units Natural Gas 2003 264 Fort St. Vrain-Platteville, Colo., 6 Units Natural Gas 1972-2009 969 Rocky Mountain-Keenesburg, Colo., 3 Units Natural Gas 2004 580 Various locations, 6 Units Natural Gas Various 172 Hydro: Cabin Creek-Georgetown, Colo.
Pumped Storage, 2 Units Hydro 1967 210 Various locations, 9 Units Hydro Various 26 Wind: Ponnequin-Weld County, Colo., 37 Units Wind 1999-2001 25 (e) Total 5,134
(a) Cherokee Unit 2 was taken out of service in October 2011. Cherokee Unit 1 was taken out of service in May 2012. (b) Based on PSCo’s ownership interest of 67 percent of Unit 3. (c) Based on PSCo’s ownership interest of 10 percent. (d) Based on PSCo’s ownership interest of 76 percent of Unit 1 and 37 percent of Unit 2. (e) This capacity is only available when wind conditions are sufficiently high enough to support the noted generation values above. Therefore, the on-demand net dependable
capacity is zero.
SPS Summer 2012 Net Dependable Station, Location and Unit Fuel Installed Capability (MW) Steam: Harrington-Amarillo, Texas, 3 Units Coal 1976-1980 1,018 Tolk-Muleshoe, Texas, 2 Units Coal 1982-1985 1,067 Cunningham-Hobbs, N.M., 2 Units Natural Gas 1957-1965 254 Jones-Lubbock, Texas, 2 Units Natural Gas 1971-1974 486 Maddox-Hobbs, N.M., 1 Unit Natural Gas 1967 112 Moore County-Amarillo, Texas, 1 Unit Natural Gas 1954 46 Nichols-Amarillo, Texas, 3 Units Natural Gas 1960-1968 457 Plant X-Earth, Texas, 4 Units Natural Gas 1952-1964 412 Combustion Turbine: Carlsbad-Carlsbad, N.M., 1 Unit Natural Gas 1968 10 Cunningham-Hobbs, N.M., 2 Units Natural Gas 1998 212 Jones-Lubbock, Texas, 1 Unit Natural Gas 2011 171 (a) Maddox-Hobbs, N.M., 1 Unit Natural Gas 1963-1976 61 Total 4,306
(a) Construction of Jones Unit 3 was completed in 2011.
45

Electric utility overhead and underground transmission and distribution lines (measured in conductor miles) at Dec. 31, 2012:
Electric utility transmission and distribution substations at Dec. 31, 2012:
Natural gas utility mains at Dec. 31, 2012:
Item 3 — Legal Proceedings In the normal course of business, various lawsuits and claims have arisen against Xcel Energy. Xcel Energy has recorded an estimate of the probable cost of settlement or other disposition for such matters. Additional Information See Note 13 to the consolidated financial statements for further discussion of legal claims and environmental proceedings. See Item 1, Item 7 and Note 12 to the consolidated financial statements for a discussion of proceedings involving utility rates and other regulatory matters. Item 4 — Mine Safety Disclosures None.
PART II Item 5 — Market for Registrant’s Common Equity, Related Stockholder Matters and Issuer Purchases of Equity Securities Quarterly Stock Data Xcel Energy Inc.’s common stock is listed on the New York Stock Exchange (NYSE). The trading symbol is XEL. The number of common shareholders of record as of Dec. 31, 2012 was approximately 73,414. The following are the reported high and low sales prices based on the NYSE Composite Transactions for the quarters of 2012 and 2011 and the dividends declared per share during those quarters.
Table of Contents
Conductor Miles NSP-Minnesota NSP-Wisconsin PSCo SPS 500 KV 2,917 - - - 345 KV 6,388 1,152 1,614 6,805 230 KV 1,801 - 12,228 9,684 161 KV 281 1,568 - - 138 KV - - 92 - 115 KV 7,129 1,737 4,923 11,479 Less than 115 KV 82,963 32,090 73,813 22,067
NSP-Minnesota NSP-Wisconsin PSCo SPS Quantity 349 204 230 426
Miles NSP-Minnesota NSP-Wisconsin PSCo WGI Transmission 137 - 2,236 11 Distribution 9,732 2,243 21,542 -
2012 High Low Dividends First quarter $ 27.93 $ 25.92 $ 0.2600 Second quarter 29.12 25.89 0.2700 Third quarter 29.92 27.25 0.2700 Fourth quarter 28.34 25.84 0.2700
46

Xcel Energy Inc.’s Articles of Incorporation place restrictions on the amount of common stock dividends it can pay when preferred stock is outstanding. On Oct. 31, 2011, Xcel Energy Inc. redeemed all series of its preferred stock. See Item 7 and Note 4 to the consolidated financial statements for further discussion of Xcel Energy Inc.’s dividend policy. The following compares our cumulative TSR on common stock with the cumulative total return of the EEI Investor-Owned Electrics Index and the Standard & Poor’s 500 Composite Stock Price Index over the last five fiscal years (assuming a $100 investment in each vehicle on Dec. 31, 2007, and the reinvestment of all dividends). The EEI Investor-Owned Electrics Index currently includes 51 companies and is a broad measure of industry performance.
COMPARISON OF 5 YEAR CUMULATIVE TOTAL RETURN* Among Xcel Energy Inc., the EEI Investor-Owned Electrics,
and the S&P 500
Securities Authorized for Issuance Under Equity Compensation Plans Information required under Item 5 — Securities Authorized for Issuance Under Equity Compensation Plans is contained in Xcel Energy Inc.’s Proxy Statement for its 2013 Annual Meeting of Shareholders, which is incorporated by reference.
Table of Contents
2011 High Low Dividends First quarter $ 24.67 $ 23.17 $ 0.2525 Second quarter 25.39 23.38 0.2600 Third quarter 25.60 21.20 0.2600 Fourth quarter 27.78 23.48 0.2600
* $100 invested on Dec. 31, 2007 in stock and index — including reinvestment of dividends. Fiscal years ending Dec. 31.
2007 2008 2009 2010 2011 2012 Xcel Energy Inc. $ 100 $ 86 $ 104 $ 120 $ 147 $ 148 EEI Investor-Owned Electrics 100 74 82 88 105 108 S&P 500 100 63 80 92 94 109
47

UNREGISTERED SALES OF EQUITY SECURITIES AND USE OF PROCEEDS Purchases of Equity Securities by the Issuer and Affiliated Purchasers The following table provides information about our purchases of equity securities that are registered by Xcel Energy Inc. pursuant to Section 12 of the Exchange Act for the year ended Dec. 31, 2012:
Item 6 — Selected Financial Data
Table of Contents
Issuer Purchases of Equity Securities Maximum Number Total Number of (or Approximate Shares Purchased as Dollar Value) of Shares Total Number Part of Publicly That May Yet Be of Shares Average Price Announced Plans or Purchased Under the Period Purchased Paid per Share Programs Plans or Programs Jan. 1, 2012 — Jan. 31, 2012 (a) 17,487 $ 26.69 - - Feb. 1, 2012 — Feb. 29, 2012 - - - - March 1, 2012 — March 31, 2012 (b) 700,000 26.42 - - April 1, 2012 — Dec. 31, 2012 - - - -
Total 717,487 - -
(a) Xcel Energy Inc. or one of its agents periodically purchases common shares in order to satisfy obligations under the Stock Equivalent Plan for Non-Employee Directors. (b) The Xcel Energy Inc. Board of Directors approved the repurchase of up to 700,000 shares of common stock for the issuance of shares in connection with the vesting of awards
under the Xcel Energy Inc. 2005 Long-Term Incentive Plan. Purchases were authorized to be made in the open market pursuant to Rule 10b-18.
(Millions of Dollars, Thousands of Shares, Except Per Share Data) 2012 2011 2010 2009 2008 Operating revenues $ 10,128 $ 10,655 $ 10,311 $ 9,644 $ 11,203 Operating expenses 8,306 8,873 8,691 8,176 9,812 Income from continuing operations 905 841 752 686 646 Net income 905 841 756 681 646 Earnings available to common shareholders 905 834 752 677 641 Weighted average common shares outstanding:
Basic 487,899 485,039 462,052 456,433 437,054 Diluted 488,434 485,615 463,391 457,139 441,813
Earnings per share from continuing operations: Basic $ 1.86 $ 1.72 $ 1.62 $ 1.49 $ 1.47 Diluted 1.85 1.72 1.61 1.49 1.46
Earnings per share: Basic 1.86 1.72 1.63 1.48 1.47 Diluted 1.85 1.72 1.62 1.48 1.46
Dividends declared per common share 1.07 1.03 1.00 0.97 0.94 Total assets 31,141 29,497 27,388 25,306 24,805 Long-term debt (a) 10,144 8,849 9,263 7,889 7,732 Book value per share 18.19 17.44 16.76 15.92 15.35 Return on average common equity 10.4 % 10.1 % 9.8 % 9.5 % 9.7%Ratio of earnings to fixed charges (b) 2.8 2.8 2.7 2.5 2.5
(a) Includes capital lease obligations. (b) See Exhibit 12.01.
48

Item 7 — Management’s Discussion and Analysis of Financial Condition and Results of Operations Business Segments and Organizational Overview Continuing Operations Xcel Energy Inc. is a public utility holding company. In 2012, Xcel Energy’s continuing operations included the activity of four utility subsidiaries that serve electric and natural gas customers in eight states. These utility subsidiaries are NSP-Minnesota, NSP-Wisconsin, PSCo and SPS. These utilities serve customers in portions of Colorado, Michigan, Minnesota, New Mexico, North Dakota, South Dakota, Texas and Wisconsin. Along with WYCO, a joint venture formed with CIG to develop and lease natural gas pipelines, storage and compression facilities, and WGI, an interstate natural gas pipeline company, these companies comprise the continuing regulated utility operations. Xcel Energy Inc.’s nonregulated subsidiary is Eloigne, which invests in rental housing projects that qualify for low-income housing tax credits. Forward-Looking Statements Except for the historical statements contained in this report, the matters discussed in the following discussion and analysis are forward-looking statements that are subject to certain risks, uncertainties and assumptions. Such forward-looking statements, including the 2013 full year EPS guidance and assumptions, are intended to be identified in this document by the words “anticipate,” “believe,” “estimate,” “expect,” “intend,” “may,” “objective,” “outlook,” “plan,” “project,” “possible,” “potential,” “should” and similar expressions. Actual results may vary materially. Forward-looking statements speak only as of the date they are made, and we do not undertake any obligation to update them to reflect changes that occur after that date. Factors that could cause actual results to differ materially include, but are not limited to: general economic conditions, including inflation rates, monetary fluctuations and their impact on capital expenditures and the ability of Xcel Energy Inc. and its subsidiaries to obtain financing on favorable terms; business conditions in the energy industry, including the risk of a slow down in the U.S. economy or delay in growth recovery; trade, fiscal, taxation and environmental policies in areas where Xcel Energy has a financial interest; customer business conditions; actions of credit rating agencies; competitive factors, including the extent and timing of the entry of additional competition in the markets served by Xcel Energy Inc. and its subsidiaries; unusual weather; effects of geopolitical events, including war and acts of terrorism; state, federal and foreign legislative and regulatory initiatives that affect cost and investment recovery, have an impact on rates or have an impact on asset operation or ownership or impose environmental compliance conditions; structures that affect the speed and degree to which competition enters the electric and natural gas markets; costs and other effects of legal and administrative proceedings, settlements, investigations and claims; actions by regulatory bodies impacting our nuclear operations, including those affecting costs, operations or the approval of requests pending before the NRC; financial or regulatory accounting policies imposed by regulatory bodies; availability or cost of capital; employee work force factors; the items described under Factors Affecting Results of Continuing Operations; and the other risk factors listed from time to time by Xcel Energy Inc. in reports filed with the SEC, including “Risk Factors” in Item 1A of this Annual Report on Form 10-K and Exhibit 99.01 hereto. Management’s Strategic Plans Xcel Energy’s corporate strategy focuses on three core objectives:
Achievement of these strategic plans is designed to provide our investors with an attractive total return and our customers with clean, safe, reliable energy at a reasonable price. Below is a discussion of our three primary objectives and how they support our overall strategy.
Table of Contents
• Obtain stakeholder alignment; • Invest in our regulated utility businesses; and • Earn a fair return on our utility investments.
49

Obtain stakeholder alignment Successful execution of our strategy begins with obtaining stakeholder support for long-term decisions and for large investment initiatives, prior to taking action. To avoid excessive risk, it is critical that Xcel Energy reduce regulatory and legislative uncertainty before making long-term critical decisions or large capital investments. We believe stakeholder alignment is achieved by:
Invest in our utility business After obtaining stakeholder support, the next phase of our strategy is to invest in our regulated utility businesses. Xcel Energy projects that it will invest approximately $13 billion in its utility businesses from 2013 through 2017. Our capital investment plan is intended to modernize our infrastructure, improve system reliability, reduce our impact on the environment, expand the amount of renewable energy available to our customers and meet customer demand. We work hard to make sure these investments provide value to our customers by selecting cost effective projects and striving to complete these projects on time, safely and within established budgets. As a result of these investments, Xcel Energy projects that the rate base, or the amount on which Xcel Energy earns a return, will grow at a compounded average annual rate of approximately 6 percent through 2014 and approximately 4 to 5 percent through 2017. Earn a fair return on our utility investment The third phase of our strategy is to earn a fair return on our utility investments. Xcel Energy’s regulatory strategy is based on filing reasonable base rate requests designed to provide recovery of costs necessary to operate our business and to earn a reasonable return on investment, along with obtaining regulatory approval for rate riders and DSM programs. A rate rider is a mechanism that allows for recovery of certain costs and returns on investments, without filing a rate case. Xcel Energy believes that our public utility commissions will provide reasonable and timely recovery, and this is a key assumption to achieving our financial objectives. We believe constructive regulatory outcomes over the last several years are evidence of reasonable regulatory treatment and provide us confidence that we are pursuing the right strategy. Provide an attractive total return Successful execution of the corporate strategic plan should allow Xcel Energy to deliver an attractive total return to our shareholders. Our value proposition is to deliver an attractive total return through a combination of earnings growth and dividend yield. Since 2005, our financial objectives have been to:
We have successfully achieved these financial objectives. Our ongoing earnings have grown approximately 6.8 percent and our dividend has grown approximately 3.3 percent annually since 2005. In addition, our current senior unsecured debt credit ratings for Xcel Energy and it utility subsidiaries are in the BBB+ to A range. We believe we are positioned to continue earnings growth of 5 percent to 7 percent and dividend growth of 2 percent to 4 percent at least through 2013 or 2014. Beyond this timeframe, we anticipate that rate base and earnings growth could moderate. Should this occur, we anticipate having flexibility to increase the dividend at a faster rate in the future, while ensuring a strong balance sheet. Therefore, we believe we are positioned to continue to deliver an attractive total return.
Table of Contents
• Delivering operational excellence related to reliability outage performance and customer satisfaction; • Proactively taking actions to ensure public and employee safety related to our power plants, natural gas pipelines, and our transmission and
distribution system; • Pursuing environmental leadership by reducing emissions, and expanding renewable energy in a cost-effective manner; and • Creating value for our customers by modernizing our infrastructure and reducing our environmental impact at a reasonable cost, while providing
customers with choices like DSM, conservation and renewable energy programs.
• Deliver a long-term annual EPS growth rate of 5 percent to 7 percent; • Deliver an annual dividend increases of 2 percent to 4 percent; and • Maintain senior unsecured debt credit ratings in the BBB+ to A range.
50

Financial Review The following discussion and analysis by management focuses on those factors that had a material effect on Xcel Energy’s financial condition, results of operations and cash flows during the periods presented, or are expected to have a material impact in the future. It should be read in conjunction with the accompanying consolidated financial statements and the related notes to consolidated financial statements. The only common equity securities that are publicly traded are common shares of Xcel Energy Inc. The earnings and EPS of each subsidiary discussed below do not represent a direct legal interest in the assets and liabilities allocated to such subsidiary but rather represent a direct interest in our assets and liabilities as a whole. EPS by subsidiary is a financial measure not recognized under GAAP that is calculated by dividing the net income or loss attributable to the controlling interest of each subsidiary by the weighted average fully diluted Xcel Energy Inc. common shares outstanding for the period. Xcel Energy’s management uses this non-GAAP financial measure to evaluate and provide details of earnings results. Xcel Energy’s management believes that this measurement is useful to investors to evaluate the actual and projected financial performance and contribution of our subsidiaries. This non-GAAP financial measure should not be considered as an alternative to Xcel Energy’s consolidated fully diluted EPS determined in accordance with GAAP as an indicator of operating performance. Results of Operations The following table summarizes the diluted EPS for Xcel Energy:
Xcel Energy’s management believes that ongoing earnings provide a meaningful comparison of earnings results and is representative of Xcel Energy’s fundamental core earnings power. Xcel Energy’s management uses ongoing earnings internally for financial planning and analysis, for reporting results to the Board of Directors and when communicating its earnings outlook to analysts and investors. 2012 Adjustment to GAAP Earnings Prescription drug tax benefit — In the third quarter of 2012, Xcel Energy implemented a tax strategy related to the allocation of funding of Xcel Energy’s retiree prescription drug plan. This strategy restored a portion of the tax benefit associated with federal subsidies for prescription drug plans that had been accrued since 2004 and was expensed in 2010. As a result, Xcel Energy recognized approximately $17 million, or $0.03 per share, of income tax benefit. 2010 Adjustment to GAAP Earnings Medicare Part D — In March 2010, the Patient Protection and Affordable Care Act was signed into law. The law includes provisions to generate tax revenue to help offset the cost of the new legislation. One of these provisions reduces the deductibility of retiree health care costs to the extent of federal subsidies received by plan sponsors that provide retiree prescription drug benefits equivalent to Medicare Part D coverage, beginning in 2013. Xcel Energy expensed approximately $17 million, or $0.04 per share, of previously recognized tax benefits relating to the federal subsidies during the first quarter of 2010.
Table of Contents
Diluted Earnings (Loss) Per Share 2012 2011 2010 PSCo $ 0.90 $ 0.82 $ 0.86 NSP-Minnesota 0.70 0.73 0.60 SPS 0.22 0.18 0.17 NSP-Wisconsin 0.10 0.10 0.09 Equity earnings of unconsolidated subsidiaries 0.04 0.04 0.04 Regulated utility — continuing operations 1.96 1.87 1.76 Xcel Energy Inc. and other costs (0.14) (0.15) (0.14)Ongoing diluted earnings per share 1.82 1.72 1.62 Prescription drug tax benefit, Medicare Part D and COLI settlement 0.03 - (0.01)Earnings per share from continuing operations 1.85 1.72 1.61 Earnings per share from discontinued operations - - 0.01 GAAP diluted earnings per share $ 1.85 $ 1.72 $ 1.62
51

COLI settlement — During 2007, Xcel Energy Inc. and PSCo reached a settlement with the IRS related to a dispute associated with its COLI program. These COLI policies were owned and managed by PSRI. As a follow on to the 2007 IRS COLI settlement, during 2010, the IRS reached an agreement in principle of Xcel Energy Inc.’s and PSCo’s statements of account, dating back to tax year 1993. Upon completion of this review, PSRI recorded a net non-recurring tax and interest charge of approximately $9.4 million in 2010. The Tax Court proceedings were dismissed in December 2010 and January 2011. Upon final cash settlement in 2011, Xcel Energy received $0.7 million and recognized a further reduction of expense of $0.3 million. A closing agreement covering tax years 2003 through 2007 was finalized with the IRS in January 2012. In 2010, Xcel Energy Inc., PSCo and PSRI entered into a settlement agreement with Provident related to all claims asserted by Xcel Energy Inc., PSCo and PSRI against Provident in a lawsuit associated with the discontinued COLI program. Under the terms of the settlement, Xcel Energy Inc., PSCo and PSRI were paid $25 million by Provident and Reassure America Life Insurance Company resulting in approximately $0.05 of EPS in 2010. The $25 million proceeds were not subject to income taxes. Earnings Adjusted for Certain Items (Ongoing Earnings) 2012 Comparison with 2011 Xcel Energy — Overall, ongoing earnings increased $0.10 per share for 2012. Ongoing earnings increased largely due to increases in electric margins driven by the conclusion of various rate cases, which reflect our continued investment in our utility business and a lower ETR. Partially offsetting these positive factors were warmer than normal winter weather, increases in depreciation expense, O&M expenses and property taxes. PSCo — PSCo’s ongoing earnings increased $0.08 per share for 2012. The increase is primarily due to an electric rate increase, effective May 2012, and the impact of warmer summer weather. The increase was partially offset by decreased wholesale revenue due to the expiration of a long-term power sales agreement with Black Hills Corp, higher depreciation expense and O&M expenses. NSP-Minnesota — NSP-Minnesota’s 2012 ongoing earnings decreased $0.03 per share. The decrease is primarily due to the unfavorable impact of warmer than normal winter weather during the first quarter, electric sales decline, higher property taxes, higher O&M expenses and depreciation expense. These decreases were partially offset by the 2012 rate increase and a lower ETR. SPS — SPS’ ongoing earnings increased $0.04 per share for 2012. The increase is the result of rate increases in New Mexico and Texas, effective January 2012, partially offset by the impact of milder weather during the second half of the year, higher depreciation expense and property taxes. NSP-Wisconsin — NSP-Wisconsin’s ongoing earnings were flat for 2012. Ongoing earnings were positively impacted by rate increases, effective January 2012, offset by higher O&M expenses. 2011 Comparison with 2010 Xcel Energy — Overall, ongoing earnings increased $0.10 per share for 2011. Ongoing earnings increased primarily due to higher electric margins as a result of warmer than normal summer weather across Xcel Energy’s service territories and rate increases in various states. The higher margins were partially offset by expected increases in O&M expenses, depreciation, interest expense and property taxes. The increase in expenses was largely driven by capital investment in Xcel Energy’s utility business. PSCo — PSCo earnings decreased $0.04 per share for 2011. The decrease is due to the implementation of seasonal rates in June 2010 (seasonal rates were higher in the summer months and lower throughout the other months of the year), higher O&M expenses, depreciation expense and property taxes, partially offset by the favorable impact of warmer temperatures in the summer. NSP-Minnesota — NSP-Minnesota earnings increased $0.13 per share for 2011. The increase is primarily due to higher interim electric rates effective in early 2011, subject to refund, in Minnesota and North Dakota, and conservation program incentives partially offset by higher O&M expenses, depreciation expense (net of regulatory adjustments) and property taxes.
Table of Contents
52

SPS — SPS earnings increased $0.01 per share for 2011. The increase is due to higher electric revenues, primarily due to the Texas retail rate increase effective in the first quarter of 2011, and warmer summer weather, partially offset by higher O&M expenses, depreciation expense and property taxes. NSP-Wisconsin — NSP-Wisconsin earnings increased $0.01 per share for 2011. The increase is primarily due to higher electric rates, partially offset by higher O&M expenses and depreciation expense. Changes in Diluted EPS The following table summarizes significant components contributing to the changes in the diluted EPS compared with prior periods, which are discussed in more detail later.
Table of Contents
Diluted Earnings (Loss) Per Share Dec. 31 2011 GAAP and ongoing diluted earnings per share $ 1.72 Components of change — 2012 vs. 2011
Higher electric margins 0.15 Lower effective tax rate 0.04 Lower conservation and DSM expenses (generally offset in revenues) 0.03 Higher AFUDC - Equity 0.02 Higher natural gas margins 0.01 Higher operating and maintenance expenses (0.05)Higher depreciation and amortization (0.04)Higher taxes (other than income taxes) (0.04)Higher interest charges (0.01)Other, net (including interest and premium on redemption of preferred stock) (0.01)
2012 ongoing diluted earnings per share 1.82 Prescription drug tax benefit 0.03 2012 GAAP diluted earnings per share $ 1.85
Diluted Earnings (Loss) Per Share Dec. 31 2010 GAAP diluted earnings per share $ 1.62 Earnings per share from discontinued operations (0.01)2010 diluted earnings per share from continuing operations 1.61 Medicare Part D and COLI settlement 0.01 2010 ongoing diluted earnings per share 1.62 Components of change — 2011 vs. 2010
Higher electric margins 0.44 Higher natural gas margins 0.04 Higher operating and maintenance expenses (0.11)Dilution from DSPP, benefit plans and the 2010 common equity issuance (0.08)Higher taxes (other than income taxes) (0.06)Higher conservation and DSM expenses (generally offset in revenues) (0.05)Higher depreciation and amortization (0.04)Other, net (including interest and premium on redemption of preferred stock) (0.04)
2011 GAAP and ongoing diluted earnings per share $ 1.72
53

The following table provides a reconciliation of ongoing and GAAP earnings and earnings per diluted share for the years ended Dec. 31:
Continuing operations consist of the following:
The following table summarizes the earnings contributions of Xcel Energy’s business segments.
Table of Contents
(Millions of Dollars) 2012 2011 2010 Ongoing earnings $ 888.3 $ 840.9 $ 756.4 Prescription drug tax benefit, Medicare Part D and COLI settlement 16.9 0.5 (4.5)Total continuing operations 905.2 841.4 751.9 (Loss) income from discontinued operations - (0.2) 3.9 GAAP earnings $ 905.2 $ 841.2 $ 755.8
Diluted Earnings (Loss) Per Share 2012 2011 2010 Ongoing diluted earnings per share (a) $ 1.82 $ 1.72 $ 1.62 Prescription drug tax benefit, Medicare Part D and COLI settlement 0.03 - (0.01)Earnings per share from continuing operations (a) 1.85 1.72 1.61 Earnings per share from discontinued operations - - 0.01 GAAP diluted earnings per share (a) $ 1.85 $ 1.72 $ 1.62
(a) Includes the dividend requirements on preferred stock.
• Regulated utility subsidiaries, operating in the electric and natural gas segments; and • Other nonregulated subsidiaries and Xcel Energy Inc.
Contributions to Income (Millions of Dollars) 2012 2011 2010 Regulated electric income $ 851.9 $ 789.0 $ 665.2 Regulated natural gas income 98.1 101.8 114.6 All other (a) 22.1 17.9 32.4 Xcel Energy Inc. and other costs (a) (66.9) (67.3) (60.3)
Total income — continuing operations 905.2 841.4 751.9 (Loss) income from discontinued operations - (0.2) 3.9
Total net income $ 905.2 $ 841.2 $ 755.8
Contributions to Diluted Earnings (Loss) Per Share Contributions to Diluted Earnings (Loss) Per Share 2012 2011 2010 Regulated electric $ 1.74 $ 1.62 $ 1.43 Regulated natural gas 0.20 0.21 0.24 All other (a) 0.05 0.04 0.08 Xcel Energy Inc. and other costs (a) (b) (0.14) (0.15) (0.14)
Total earnings per share — continuing operations (b) 1.85 1.72 1.61 Discontinued operations - - 0.01
Total earnings per share - diluted (b) $ 1.85 $ 1.72 $ 1.62
(a) Not a reportable segment. Included in all other segment results in Note 16 to the consolidated financial statements. (b) Includes the dividend requirements on preferred stock.
54

Statement of Income Analysis The following discussion summarizes the items that affected the individual revenue and expense items reported in the consolidated statements of income. Estimated Impact of Temperature Changes on Regulated Earnings — Unusually hot summers or cold winters increase electric and natural gas sales while, conversely, mild weather reduces electric and natural gas sales. The estimated impact of weather on earnings is based on the number of customers, temperature variances and the amount of natural gas or electricity the average customer historically uses per degree of temperature. Accordingly, deviations in weather from normal levels can affect Xcel Energy’s financial performance, from both an energy and demand perspective. Degree-day or Temperature-Humidity Index (THI) data is used to estimate amounts of energy required to maintain comfortable indoor temperature levels based on each day’s average temperature and humidity. Heating degree-days (HDD) is the measure of the variation in the weather based on the extent to which the average daily temperature falls below 65° Fahrenheit, and cooling degree-days (CDD) is the measure of the variation in the weather based on the extent to which the average daily temperature rises above 65° Fahrenheit. Each degree of temperature above 65° Fahrenheit is counted as one cooling degree-day, and each degree of temperature below 65° Fahrenheit is counted as one heating degree-day. In Xcel Energy’s more humid service territories, a THI is used in place of CDD, which adds a humidity factor to CDD. HDD, CDD and THI are most likely to impact the usage of Xcel Energy’s residential and commercial customers. Industrial customers are less weather sensitive. Normal weather conditions are defined as either the 20-year or 30-year average of actual historical weather conditions. The historical period of time used in the calculation of normal weather differs by jurisdiction based on the time period used by the regulator in establishing estimated volumes in the rate setting process. To calculate the impact of weather on demand, a demand factor is applied to the weather impact on sales as defined above to derive the amount of demand associated with the weather impact. The percentage increase (decrease) in normal and actual HDD, CDD and THI are provided in the following table:
Weather — The following table summarizes the estimated impact of temperature variations on EPS compared with sales under normal weather conditions:
In 2012, Xcel Energy refined its estimate to incorporate the impact of weather on demand charges. As a result, the estimated weather impact on EPS for prior periods has been adjusted for comparison purposes. Sales Growth (Decline) — The following tables summarize Xcel Energy’s sales growth (decline) for actual and weather-normalized sales for the years ended Dec. 31, compared with the previous year:
Table of Contents
2012 vs. 2011 vs. 2012 vs. 2010 vs. 2011 vs. Normal Normal 2011 Normal (a) 2010 (a) HDD (15.9) % (1.0) % (14.8) % (4.3) % 3.5 %CDD 46.1 38.1 5.7 11.9 23.4 THI 36.1 37.9 0.2 29.9 6.1
(a) Adjusted for the October 2010 sale of SPS electric distribution assets to the city of Lubbock, Texas.
2012 vs. 2011 vs. 2012 vs. 2010 vs. 2011 vs. Normal Normal 2011 Normal 2010 Retail electric $ 0.081 $ 0.080 $ 0.001 $ 0.040 $ 0.040 Firm natural gas (0.033) 0.002 (0.035) (0.010) 0.012
Total $ 0.048 $ 0.082 $ (0.034) $ 0.030 $ 0.052
Dec. 31, 2012 Dec. 31, 2012 (Without Leap Day) Weather Weather Actual Normalized Actual Normalized Electric residential (1.0) % (0.1) % (1.2) % (0.4) %Electric commercial and industrial 0.1 0.0 (0.2) (0.2)
Total retail electric sales (0.3) 0.0 (0.5) (0.3)Firm natural gas sales (10.6) (0.3) (11.0) (0.8)
55

Weather-normalized sales for 2013 are projected to grow approximately 0.5 percent for retail electric customers and to decline by approximately 1 percent for retail firm natural gas customers. Electric Revenues and Margin Electric revenues and fuel and purchased power expenses are largely impacted by the fluctuation in the price of natural gas, coal and uranium used in the generation of electricity, but as a result of the design of fuel recovery mechanisms to recover current expenses, these price fluctuations have little impact on electric margin. The following table details the electric revenues and margin:
The following tables summarize the components of the changes in electric revenues and electric margin for the years ended Dec. 31: Electric Revenues
2012 Comparison with 2011 — Electric revenues decreased primarily due to lower fuel and purchased power cost recovery, which is offset in operating expense. This decrease was partially offset by the various rate increases across all of the utility subsidiaries.
Table of Contents
Dec. 31, 2011 Weather Weather Normalized Actual Normalized Lubbock (a) Electric residential 0.5 % (0.5) % 0.2 %Electric commercial and industrial 0.3 0.0 0.7
Total retail electric sales 0.4 (0.1) 0.6 Firm natural gas sales 0.9 (2.5) N/A
(a) Adjusted for the October 2010 sale of SPS electric distribution assets to the city of Lubbock, Texas.
(Millions of Dollars) 2012 2011 2010 Electric revenues $ 8,517 $ 8,767 $ 8,452 Electric fuel and purchased power (3,624) (3,992) (4,011)
Electric margin $ 4,893 $ 4,775 $ 4,441
(Millions of Dollars) 2012 vs. 2011 Fuel and purchased power cost recovery $ (394)Firm wholesale (a) (58)Retail sales decrease, excluding weather impact (6)Conservation and DSM revenue (offset by expenses) (5)Retail rate increases (Colorado, Texas, New Mexico, Wisconsin, South Dakota, North Dakota, Michigan and Minnesota) 125 Transmission revenue 44 Demand revenue 13 Conservation and DSM incentive 12 Estimated impact of weather 1 Other, net 18
Total decrease in electric revenue $ (250)
(a) Decrease is primarily due to the expiration of a long-term wholesale power sales agreement with Black Hills Corp., effective Jan. 1, 2012.
56

Electric Margin
2012 Comparison to 2011 — The increase in electric margin was primarily due to the various rate increases across all of the utility subsidiaries. Electric Revenues
2011 Comparison with 2010 — Electric revenues increased primarily due to the cost recovery of the acquisition of the Rocky Mountain and Blue Spruce natural gas facilities at PSCo and retail rate increases in Minnesota, Wisconsin, Texas, North Dakota and Michigan.
Table of Contents
(Millions of Dollars) 2012 vs. 2011 Retail rate increases (Colorado, Texas, New Mexico, Wisconsin, South Dakota, North Dakota, Michigan and Minnesota) $ 125 Demand revenue 13 Transmission revenue, net of costs 13 Conservation and DSM incentive 12 Estimated impact of weather 1 Firm wholesale (a) (48)Retail sales decrease, excluding weather impact (6)Conservation and DSM revenue (offset by expenses) (5)Other, net 13
Total increase in electric margin $ 118
(a) Decrease is primarily due to the expiration of a long-term wholesale power sales agreement with Black Hills Corp., effective Jan. 1, 2012.
(Millions of Dollars) 2011 vs. 2010 Revenue requirements for PSCo gas generation acquisition (a) $ 124 Retail rate increases (net of revenue subject to refund) (b) 102 Transmission revenue 45 Conservation and DSM revenue (offset by expenses) 31 Fuel and purchased power cost recovery 19 Estimated impact of weather 18 Conservation and DSM incentive 14 Trading, including PSCo renewable energy credit sales (19)Other, net (19)
Total increase in electric revenue $ 315
(a) The increase in revenue requirements for PSCo generation reflects the acquisition of the Rocky Mountain and Blue Spruce natural gas facilities in late 2010. These revenue requirements are partially offset by higher O&M expense, depreciation expense, property taxes and financing costs.
(b) The retail rate increases include final rates in Wisconsin, Texas, Minnesota and North Dakota.
57

Electric Margin
2011 Comparison to 2010 — The increase in electric margin was primarily due to the cost recovery of the acquisition of the Rocky Mountain and Blue Spruce natural gas facilities at PSCo and retail rate increases in Minnesota, Wisconsin, Texas, North Dakota and Michigan. Natural Gas Revenues and Margin The cost of natural gas tends to vary with changing sales requirements and the cost of natural gas purchases. However, due to the design of purchased natural gas cost recovery mechanisms to recover current expenses for sales to retail customers, fluctuations in the cost of natural gas have little effect on natural gas margin. The following table details natural gas revenues and margin:
The following tables summarize the components of the changes in natural gas revenues and natural gas margin for the years ended Dec. 31: Natural Gas Revenues
2012 Comparison to 2011 — Natural gas revenues decreased primarily due to the purchased natural gas adjustment clause recovery, which is offset in operating expense.
Table of Contents
(Millions of Dollars) 2011 vs. 2010 Revenue requirements for PSCo gas generation acquisition (a) $ 124 Retail rate increases (net of revenue subject to refund) (b) 102 Conservation and DSM revenue (offset by expenses) 31 Transmission revenue, net of costs 20 Estimated impact of weather 18 Conservation and DSM incentive 14 Non-fuel riders (5)Other, net (including firm wholesale and deferred fuel adjustments) 30
Total increase in electric margin $ 334
(a) The increase in revenue requirements for PSCo generation reflects the acquisition of the Rocky Mountain and Blue Spruce natural gas facilities in late 2010. These revenue requirements are partially offset by higher O&M expense, depreciation expense, property taxes and financing costs.
(b) The retail rate increases include final rates in Wisconsin, Texas, Minnesota and North Dakota.
(Millions of Dollars) 2012 2011 2010 Natural gas revenues $ 1,537 $ 1,812 $ 1,783 Cost of natural gas sold and transported (881) (1,164) (1,163)
Natural gas margin $ 656 $ 648 $ 620
(Millions of Dollars) 2012 vs. 2011 Purchased natural gas adjustment clause recovery $ (282)Estimated impact of weather (26)Conservation and DSM revenue (offset by expenses) (17)PSIA rider (Colorado), offset by expenses 29 Retail rate increase (Colorado, Wisconsin) 16 Other, net 5
Total decrease in natural gas revenues $ (275)
58

Natural Gas Margin
2012 Comparison to 2011 — Natural gas margins increased primarily due to the PSIA rider, which is offset in operating expense. Natural Gas Revenues
2011 Comparison to 2010 — Natural gas revenues increased primarily due to higher conservation and DSM rates at NSP-Minnesota and colder weather in 2011 at PSCo and NSP-Minnesota. Natural Gas Margin
2011 Comparison to 2010 — Natural gas margins increased primarily due to increased due to higher conservation and DSM rates at NSP-Minnesota and colder weather in 2011 at PSCo and NSP-Minnesota.
Table of Contents
(Millions of Dollars) 2012 vs. 2011 PSIA rider (Colorado) offset by expenses $ 29 Retail rate increase (Colorado, Wisconsin) 16 Estimated impact of weather (26)Conservation and DSM revenue (offset by expenses) (17)Other, net 6
Total increase in natural gas margin $ 8
(Millions of Dollars) 2011 vs. 2010 Conservation and DSM revenue (offset by expenses) $ 13 Estimated impact of weather 9 Return on PSCo gas in storage 4 Retail rate increase (Colorado) 3 Purchased natural gas adjustment clause recovery 3 Retail sales decrease (excluding weather impact) (5)Conservation and DSM incentive (2)Other, net 4
Total increase in natural gas revenues $ 29
(Millions of Dollars) 2011 vs. 2010 Conservation and DSM revenue (offset by expenses) $ 13 Estimated impact of weather 9 Return on PSCo gas in storage 4 Retail rate increase (Colorado) 3 Retail sales decrease (excluding weather impact) (5)Conservation and DSM incentive (2)Other, net 6
Total increase in natural gas margin $ 28
59

Non-Fuel Operating Expenses and Other Items O&M Expenses — O&M expenses increased $35.8 million, or 1.7 percent, for 2012, compared with 2011, and by $83.0 million, or 4.0 percent for 2011, compared with 2010. The following tables summarize the changes in O&M expenses:
2012 Comparison to 2011 — The increase in O&M expenses for 2012 was largely driven by the following:
2011 Comparison to 2010 — The increase in O&M expenses for 2011 was largely driven by the following:
Conservation and DSM Program Expenses — Conservation and DSM program expenses decreased $20.9 million, or 7.4 percent, for 2012, compared with 2011. The lower expenses are primarily attributable to lower gas rider rates, as well as the timing of recovery of electric CIP expenses at NSP-Minnesota. Conservation and DSM program expenses are generally recovered in our major jurisdictions concurrently through riders and base rates. Overall, the programs are designed to encourage the operating companies and their retail customers to conserve energy or change energy usage patterns in order to reduce peak demand on the gas or electric system. This, in turn, reduces the need for additional plant capacity, reduces emissions, serves to achieve other environmental goals as well as reduces energy costs to participating customers. Conservation and DSM program expenses increased $41.6 million, or 17.3 percent for 2011, compared with 2010. The higher expense is primarily attributable to an increase in the rider rates used to recover the program expenses.
Table of Contents
(Millions of Dollars) 2012 vs. 2011 Employee benefits $ 36 Pipeline system integrity costs 20 SmartGridCity 11 Prairie Island EPU 10 Plant generation costs (17)Bad debt expense (10)Labor and contract labor (2)Other, net (12)
Total increase in O&M expenses $ 36
• Higher employee benefits are mainly due to increased pension expenses. • Higher pipeline system integrity costs relate to increased compliance and inspection initiatives, which in Colorado are recovered through the pipeline
system integrity rider. • See Item I – Business and Note 12 to the consolidated financial statements for further discussion of SmartGridCity and Prairie Island EPU. • Lower plant generation costs are primarily attributable to fewer plant overhauls in 2012. • Higher fourth quarter labor and contract labor costs are largely driven by vegetation management and substation maintenance.
(Millions of Dollars) 2011 vs. 2010 Higher plant generation costs $ 22 Higher labor and contract labor costs 18 Higher employee benefit expense 13 Higher nuclear plant operation costs 12 Higher insurance costs 4 Other, net 14
Total increase in O&M expenses $ 83
• Higher plant generation costs are attributable to incremental costs associated with new generation placed in service and a higher level of scheduled maintenance and overhaul work.
• Higher labor and contract labor costs are primarily due to maintenance on our distribution facilities and the impact of annual wage increases. • Higher employee benefit costs are largely driven by higher pension expense. • Higher nuclear plant operation costs were largely driven by outages.
60

Depreciation and Amortization — Depreciation and amortization increased $35.4 million, or 4.0 percent, for 2012, compared with 2011. The increase is primarily due to a portion of the Monticello EPU going into service in May 2011 at NSP-Minnesota, the Jones Unit 3 going into service in June 2011 at SPS and normal system expansion across Xcel Energy’s service territories. Depreciation and amortization expense increased $31.7 million, or 3.7 percent for 2011, compared with 2010. This increase in depreciation expense is primarily due to several capital projects going into service, including a portion of the Monticello EPU going into service in May 2011, the Nobles wind project commencing commercial operations in late 2010, the acquisition of two PSCo gas generation facilities in December 2010, Jones Unit 3 going into service in June 2011 and normal system expansion. The increase was partially offset due to NSP-Minnesota reducing depreciation expense by approximately $30 million in the fourth quarter of 2011 to reflect the proposed settlement in the Minnesota electric rate case. Taxes (Other Than Income Taxes) — Taxes (other than income taxes) increased $34.1 million, or 9.1 percent, for 2012, compared with 2011. The increases are due to an increase in property taxes primarily in Minnesota. Higher property taxes in Colorado related to the electric retail business are being deferred, based on the multi-year rate settlement approved by the CPUC in May 2012. Taxes (other than income taxes) increased $42.9 million, or 12.9 percent for 2011, compared with 2010. The change is primarily due to an increase in 2011 for property taxes of approximately $29.6 million in Colorado and $8.8 million in Minnesota. Other Income, Net — Other income, net decreased $21.9 million for 2011, compared with 2010, primarily due to the COLI settlement in July 2010. AFUDC — AFUDC increased $18.8 million for 2012, compared with 2011. The increase is primarily due to the expansion of PSCo’s transmission facilities, additional construction related to the Colorado CACJA and life extension work at the Prairie Island nuclear generating plant. AFUDC decreased $5.4 million, or 6.4 percent for 2011, compared with 2010. The decrease is primarily due to lower AFUDC rates and lower average CWIP. The lower average CWIP is attributed to Comanche Unit 3 and the Nobles wind project going into service in 2010, offset by Monticello EPU and work at the Jones plant, as well as SPS transmission projects in 2011. Interest Charges — Interest charges increased $10.5 million, or 1.8 percent for 2012, compared with 2011, and $13.8 million, or 2.4 percent for 2011, compared with 2010. The increase is due to higher long-term debt levels to fund investment in utility operations, partially offset by lower interest rates. Income Taxes — Income tax expense for continuing operations decreased $18.1 million for 2012, compared with 2011. The decrease in income tax expense was primarily due to a tax benefit associated with a carryback and a tax benefit related to the restoration of a portion of the tax benefit written off in 2010 associated with federal subsidies for prescription drug plans. As a result, Xcel Energy recognized discrete tax benefits of approximately $14.9 million for the carryback and $17 million for the tax benefit associated with the federal subsidies. These were partially offset by higher pretax income in 2012. The ETR for continuing operations was 33.2 percent for 2012, compared with 35.8 percent for 2011. The lower ETR for 2012 was primarily due to the adjustments referenced above. The ETR would have been 35.6 percent for 2012 without these tax benefits. Income tax expense for continuing operations increased $31.7 million for 2011, compared with 2010. The increase is primarily due to higher pretax income, a net change in tax valuation allowances of $8.9 million, and the non-taxability of the Provident settlement in 2010. These were partially offset by the 2010 write-off of the tax benefit for Medicare Part D subsidies, an adjustment related to COLI and an increase in 2011 wind PTCs. The ETR for continuing operations was 35.8 percent for 2011, compared with 36.7 percent for 2010. The higher ETR for 2010 was primarily due to the Medicare Part D, COLI, and the valuation allowance adjustments referenced above. Without these adjustments, the ETR for continuing operations for 2010 would have been 35.1 percent. See Note 10 in the notes to consolidated financial statements for further discussion on COLI. Premium on Redemption of Preferred Stock — Xcel Energy Inc. redeemed all series of its preferred stock on Oct. 31, 2011, at an aggregate purchase price of $108 million, plus accrued dividends. As such, the redemption premium of $3.3 million and accrued dividends are reflected as reductions to earnings available to common shareholders for 2011.
Table of Contents
61

Xcel Energy Inc. and Other Results The following tables summarize the net income and EPS contributions of the continuing operations of Xcel Energy Inc. and its nonregulated businesses:
Xcel Energy Inc.’s results include interest expense and the EPS impact of preferred dividends, which are incurred at Xcel Energy Inc. and are not directly assigned to individual subsidiaries. Factors Affecting Results of Operations Xcel Energy’s utility revenues depend on customer usage, which varies with weather conditions, general business conditions and the cost of energy services. Various regulatory agencies approve the prices for electric and natural gas service within their respective jurisdictions and affect Xcel Energy’s ability to recover its costs from customers. The historical and future trends of Xcel Energy’s operating results have been, and are expected to be, affected by a number of factors, including those listed below. General Economic Conditions Economic conditions may have a material impact on Xcel Energy’s operating results. Management cannot predict the impact of a prolonged economic recession, fluctuating energy prices, terrorist activity, war or the threat of war. However, Xcel Energy could experience a material impact to its results of operations, future growth or ability to raise capital resulting from a sustained general slowdown in economic growth or a significant increase in interest rates. Fuel Supply and Costs Xcel Energy Inc.’s operating utilities have varying dependence on coal, natural gas and uranium. Changes in commodity prices are generally recovered through fuel recovery mechanisms and have very little impact on earnings. However, availability of supply, the potential implementation of a carbon tax and unanticipated changes in regulatory recovery mechanisms could impact our operations. See Item 1 for further discussion of fuel supply and costs. Pension Plan Costs and Assumptions Xcel Energy has significant net pension and postretirement benefit costs that are measured using actuarial valuations. Inherent in these valuations are key assumptions including discount rates and expected return on plan assets. Xcel Energy evaluates these key assumptions at least annually by analyzing current market conditions, which include changes in interest rates and market returns. Changes in the related net pension and postretirement benefits costs and funding requirements may occur in the future due to changes in assumptions. For further discussion and a sensitivity analysis on these assumptions, see “Employee Benefits” under Critical Accounting Policies and Estimates.
Table of Contents
Contribution to Xcel Energy's Earnings (Millions of Dollars) 2012 2011 2010 Xcel Energy Inc. financing costs $ (71.5) $ (63.8) $ (68.7)Eloigne (a) 3.8 (2.9) 5.4 Xcel Energy Inc. taxes and other results 0.8 (0.6) 3.0
Total Xcel Energy Inc. and other costs — continuing operations (66.9) (67.3) (60.3)Preferred dividends - (6.8) (4.2)
Total Xcel Energy Inc. and other costs, available to common shareholders $ (66.9) $ (74.1) $ (64.5)
Contribution to Xcel Energy's Earnings per Share (Earnings per Share) 2012 2011 2010 Xcel Energy Inc. financing costs $ (0.15) $ (0.13) $ (0.15)Eloigne (a) 0.01 (0.01) 0.01 Xcel Energy Inc. taxes and other results - - 0.01 Preferred dividends - (0.01) (0.01)
Total Xcel Energy Inc. and other costs — continuing operations $ (0.14) $ (0.15) $ (0.14)
(a) Amounts include gains or losses associated with sales of properties held by Eloigne.
62

Regulation FERC and State Regulation — The FERC and various state regulatory commissions regulate Xcel Energy Inc.’s utility subsidiaries. Decisions by these regulators can significantly impact Xcel Energy’s results of operations. Xcel Energy expects to periodically file for rate changes based on changing energy market and general economic conditions. The electric and natural gas rates charged to customers of Xcel Energy Inc.’s utility subsidiaries are approved by the FERC or the regulatory commissions in the states in which they operate. The rates are designed to recover plant investment, operating costs and an allowed return on investment. Xcel Energy requests changes in rates for utility services through filings with the governing commissions. Changes in operating costs can affect Xcel Energy’s financial results, depending on the timing of filing general rate cases and the implementation of final rates. In addition to changes in operating costs, other factors affecting rate filings are new investments, sales growth, which is affected by overall economic conditions, conservation and DSM efforts and the cost of capital. In addition, the regulatory commissions authorize the ROE and capital structure in rate proceedings. Wholesale Energy Market Regulation — Wholesale energy markets in the Midwest and South Central U.S. are operated by MISO and SPP, respectively, to centrally dispatch all regional electric generation and apply a regional transmission congestion management system. NSP-Minnesota and NSP-Wisconsin are members of MISO and SPS is a member of SPP. NSP-Minnesota, NSP-Wisconsin and SPS expect to recover energy charges through either base rates or various recovery mechanisms. See Note 12 to the consolidated financial statements for further discussion. Capital Expenditure Regulation — Xcel Energy Inc.’s utility subsidiaries make substantial investments in plant additions to build and upgrade power plants, and expand and maintain the reliability of the energy transmission and distribution systems. In addition to filing for increases in base rates charged to customers to recover the costs associated with such investments, the CPUC, MPUC, SDPUC, NDPSC and PUCT approved proposals to recover, through a rate rider, costs to upgrade generation plants and lower emissions, and/or increase transmission investment cost. These non-fuel rate riders are expected to provide significant cash flows to enable recovery of costs incurred on a timely basis. For wholesale electric transmission services, Xcel Energy has, consistent with FERC policy, implemented or proposed to establish formula rates for each of the utility subsidiaries that will provide annual rate changes as transmission investments increase in a manner similar to the rate riders. Environmental Matters Environmental costs include accruals for nuclear plant decommissioning and payments for storage of spent nuclear fuel, disposal of hazardous materials and waste, remediation of contaminated sites, monitoring of discharges to the environment and compliance with laws and permits with respect to emissions. A trend of greater environmental awareness and increasingly stringent regulation may continue to cause higher operating expenses and capital expenditures for environmental compliance. In addition to nuclear decommissioning and spent nuclear fuel disposal expenses, costs charged to operating expenses for environmental monitoring and disposal of hazardous materials and waste were approximately:
Xcel Energy estimates an average annual expense of approximately $305 million from 2013 through 2017 for similar costs. However, the precise timing and amount of environmental costs, including those for site remediation and disposal of hazardous materials, are currently unknown. Additionally, the extent to which environmental costs will be included in and recovered through rates may fluctuate. Capital expenditures for environmental improvements at regulated facilities were approximately:
See Item 7 — Capital Requirements for further discussion.
Table of Contents
• $263 million in 2012; • $265 million in 2011; and • $256 million in 2010.
• $180 million in 2012; • $48 million in 2011; and • $473 million in 2010.
63

Xcel Energy’s operations are subject to federal and state laws and regulations related to air emissions, water discharges, and waste management. These laws and regulations regulate air emissions from various sources, including electrical generating units, and impose certain monitoring and reporting requirements. Such laws and regulations may require Xcel Energy to obtain pre-approval for the construction or modification of certain projects that increase air emissions, obtain and strictly comply with air permits that contain emission and operational limitations or mandate the installation and operation of pollution control equipment at facilities. Xcel Energy will likely be required to incur capital expenditures in the future to comply with these requirements for remediation plans of MGP sites and various regulations for air emissions and water intake. Actual expenditures could be higher or lower than the estimates presented, and the scope and timing of these expenditures cannot be fully determined until any new or revised regulations become final. In July 2011, the EPA issued the CSAPR, to address long-range transport of PM and ozone by requiring reductions in SO
2 and NOx from utilities located in the
eastern half of the U.S. In August 2012, the D.C. Circuit issued an opinion that vacated the CSAPR, but required continued implementation of the CAIR pending the EPA’s development of a replacement program. In January 2013, the D.C. Circuit denied all requests for rehearing. It is not yet known whether the D.C. Circuit’s decision will be appealed, or how the EPA might approach a replacement rule. Therefore, it is not known what requirements may be imposed in the future. In addition, there are emission controls, known as BART, for industrial facilities releasing emissions that reduce visibility in certain national parks and wilderness areas. Xcel Energy generating facilities in Minnesota and Colorado are subject to BART requirements. Further, generating facilities throughout the Xcel Energy territory are subject to mercury reduction requirements at the state level. In December 2011, the EPA adopted a regulation setting national emission limits for EGUs for mercury, certain metals, and acid gas emissions. See Note 13 to the consolidated financial statements for further discussion of Xcel Energy’s environmental contingencies. Inflation Inflation at its current level is not expected to materially affect Xcel Energy’s prices or returns to shareholders. However, potential future inflation could result from economic conditions or the economic and monetary policies of the U.S. Government and the Federal Reserve. This could lead to future price increases for materials and services required to deliver electric and natural gas services to customers. These potential cost increases could in turn lead to increased prices to customers. CRITICAL ACCOUNTING POLICIES AND ESTIMATES Preparation of the consolidated financial statements and related disclosures in compliance with GAAP requires the application of accounting rules and guidance, as well as the use of estimates. The application of these policies involves judgments regarding future events, including the likelihood of success of particular projects, legal and regulatory challenges and anticipated recovery of costs. These judgments could materially impact the consolidated financial statements and disclosures, based on varying assumptions. In addition, the financial and operating environment also may have a significant effect on the operation of the business and on the results reported even if the nature of the accounting policies applied have not changed. The following is a list of accounting policies and estimates that are most significant to the portrayal of Xcel Energy’s financial condition and results, and that require management’s most difficult, subjective or complex judgments. Each of these has a higher likelihood of resulting in materially different reported amounts under different conditions or using different assumptions. Each critical accounting policy has been discussed with the Audit Committee of Xcel Energy Inc.’s Board of Directors. Regulatory Accounting Xcel Energy Inc. is a holding company with rate-regulated subsidiaries that are subject to the accounting for Regulated Operations, which provides that rate-regulated entities account for and report assets and liabilities consistent with the recovery of those incurred costs in rates, if the rates established are designed to recover the costs of providing the regulated service and if the competitive environment makes it probable that such rates will be charged and collected. Xcel Energy’s rates are derived through the ratemaking process, which results in the recording of regulatory assets and liabilities based on the probability of future cash flows. Regulatory assets represent incurred or accrued costs that have been deferred because they are probable of future recovery from customers. Regulatory liabilities represent amounts that are expected to be refunded to customers in future rates or amounts collected in current rates for future costs. In other businesses or industries, regulatory assets and regulatory liabilities would generally be charged to net income or OCI.
Table of Contents
64

As of Dec. 31, 2012 and 2011, Xcel Energy has recorded regulatory assets of $3.1 billion and $2.8 billion and regulatory liabilities of $1.2 billion and $1.4 billion, respectively. Each subsidiary is subject to regulation that varies from jurisdiction to jurisdiction. If future recovery of costs, in any such jurisdiction, ceases to be probable, Xcel Energy would be required to charge these assets to current net income or OCI. There are no current or expected proposals or changes in the regulatory environment that impact the probability of future recovery of these assets. However, if the SEC should mandate the use of IFRS and the lack of an accounting standard for rate-regulated entities under IFRS could require us to charge certain regulatory assets and regulatory liabilities to net income or OCI. See Note 15 to the consolidated financial statements for further discussion of regulatory assets and liabilities. Income Tax Accruals Judgment, uncertainty, and estimates are a significant aspect of the income tax accrual process that accounts for the effects of current and deferred income taxes. Uncertainty associated with the application of tax statutes and regulations and the outcomes of tax audits and appeals require that judgment and estimates be made in the accrual process and in the calculation of the ETR. Changes in tax laws and rates may affect recorded deferred tax assets and liabilities and our ETR in the future. ETRs are also highly impacted by assumptions. ETR calculations are revised every quarter based on best available year end tax assumptions (income levels, deductions, credits, etc.); adjusted in the following year after returns are filed, with the tax accrual estimates being trued-up to the actual amounts claimed on the tax returns; and further adjusted after examinations by taxing authorities have been completed. In accordance with the interim period reporting guidance, income tax expense for the first three quarters in a year are based on the forecasted ETR. Accounting for income taxes also requires that only tax benefits that meet the more likely than not recognition threshold can be recognized or continue to be recognized. The change in the unrecognized tax benefits needs to be reasonably estimated based on evaluation of the nature of uncertainty, the nature of event that could cause the change and an estimated range of reasonably possible changes. At any period end, and as new developments occur, management will use prudent business judgment to derecognize appropriate amounts of tax benefits. Unrecognized tax benefits can be recognized as issues are favorably resolved and loss exposures decline. As disputes with the IRS and state tax authorities are resolved over time, we may adjust our unrecognized tax benefits and interest accruals to the updated estimates needed to satisfy tax and interest obligations for the related issues. These adjustments may increase or decrease earnings. See Note 6 to the consolidated financial statements for further discussion. Employee Benefits Xcel Energy’s pension costs are based on an actuarial calculation that includes a number of key assumptions, most notably the annual return level that pension and postretirement health care investment assets will earn in the future and the interest rate used to discount future pension benefit payments to a present value obligation. In addition, the pension cost calculation uses an asset-smoothing methodology to reduce the volatility of varying investment performance over time. See Note 9 to the consolidated financial statements for further discussion on the rate of return and discount rate used in the calculation of pension costs and obligations. Pension costs are expected to increase in 2013 and then gradually decline in the following few years while funding requirements are expected to be flat in 2013 and decline in the following years. While investment returns exceeded the assumed levels from 2009 through 2012, investment returns in 2008 were significantly below the assumed levels. The pension cost calculation uses a market-related valuation of pension assets. Xcel Energy uses a calculated value method to determine the market-related value of the plan assets. The market-related value is determined by adjusting the fair market value of assets at the beginning of the year to reflect the investment gains and losses (the difference between the actual investment return and the expected investment return on the market-related value) during each of the previous five years at the rate of 20 percent per year. As these differences between the actual investment returns and the expected investment returns are incorporated into the market-related value, the differences are recognized in pension cost over the expected average remaining years of service for active employees. Based on current assumptions and the recognition of past investment gains and losses, Xcel Energy currently projects the pension costs recognized for financial reporting purposes will increase from an expense of $127.1 million in 2012 and $81.0 million in 2011 to an expense of $158.5 million in 2013 and $132.9 million in 2014. The expected increase in the 2013 expense is due primarily to the continued phase in of unrecognized plan losses primarily resulting from the market decline in 2008.
Table of Contents
65

At Dec. 31, 2012, Xcel Energy set the rate of return used to measure pension costs at 6.88 percent, which is a 22 basis point decrease from Dec. 31, 2011. The rate of return used to measure postretirement health care costs of 7.11 percent at Dec. 31, 2012 is a 36 basis point increase from Dec. 31, 2011. Xcel Energy set the discount rates used to value the Dec. 31, 2012 pension and postretirement health care obligations at 4.00 percent and 4.10 percent, which represent a 100 basis point and 90 basis point decrease from Dec. 31, 2011, respectively. Xcel Energy uses a bond matching study as its primary basis for determining the discount rate used to value pension and postretirement health care obligations. The bond matching study utilizes a portfolio of high grade (Aa or higher) bonds that matches the expected cash flows of Xcel Energy’s benefit plans in amount and duration. The effective yield on this cash flow matched bond portfolio determines the discount rate for the individual plans. The bond matching study is validated for reasonableness against the Citigroup Pension Liability Discount Curve and the Citigroup Above Median Curve. At Dec. 31, 2012, these reference points supported the selected rate. In addition to these reference points, Xcel Energy also reviews general actuarial survey data to assess the reasonableness of the discount rate selected. The Pension Protection Act changed the minimum funding requirements for defined benefit pension plans beginning in 2008. The following are the pension funding contributions, both voluntary and required, made by Xcel Energy for 2011 through 2013:
For future years, we anticipate contributions will be made as necessary. These contributions are summarized in Note 9 to the consolidated financial statements. Future year amounts are estimates and may change based on actual market performance, changes in interest rates and any changes in governmental regulations. Therefore, additional contributions could be required in the future. If Xcel Energy were to use alternative assumptions at Dec. 31, 2012, a one-percent change would result in the following impact on 2013 pension expense:
Effective Dec. 31, 2012, the initial medical trend assumption was increased from 6.3 percent to 7.5 percent. The ultimate trend assumption was reduced from 5.0 percent to 4.5 percent. The period until the ultimate rate is reached is seven years. Xcel Energy bases its medical trend assumption on the long-term cost inflation expected in the health care market, considering the levels projected and recommended by industry experts, as well as recent actual medical cost increases experienced by Xcel Energy’s retiree medical plan.
Xcel Energy recovers employee benefits costs in its regulated utility operations consistent with accounting guidance with the exception of the areas noted below.
See Note 9 to the consolidated financial statements for further discussion.
Table of Contents
• In January 2013, contributions of $191.5 million were made across four of Xcel Energy’s pension plans; • In 2012, contributions of $198.1 million were made across four of Xcel Energy’s pension plans; • In 2011, contributions of $137.3 million were made across three of Xcel Energy’s pension plans.
Pension Costs (Millions of Dollars) +1% -1% Rate of return $ (29.2) $ 29.8 Discount rate (14.1) 17.6
• Xcel Energy contributed $47.1 million and $49.0 million during 2012 and 2011, respectively, to the postretirement health care plans. • Xcel Energy expects to contribute approximately $21.8 million during 2013.
• NSP-Minnesota recognizes pension expense in all regulatory jurisdictions based on expense as calculated using the aggregate normal cost actuarial method. Differences between aggregate normal cost and expense as calculated by pension accounting standards are deferred as a regulatory liability.
• Colorado, Texas, New Mexico and FERC jurisdictions allow the recovery of other post retirement benefit costs only to the extent that recognized expense is matched by cash contributions to an irrevocable trust. Xcel Energy has consistently funded at a level to allow full recovery of costs in these jurisdictions.
66

Nuclear Decommissioning Xcel Energy recognizes liabilities for the expected cost of retiring tangible long-lived assets for which a legal obligation exists. These AROs are recognized at fair value as incurred and are capitalized as part of the cost of the related long-lived assets. In the absence of quoted market prices, Xcel Energy estimates the fair value of its AROs using present value techniques, in which it makes various assumptions including estimates of the amounts and timing of future cash flows associated with retirement activities, credit-adjusted risk free rates and cost escalation rates. When Xcel Energy revises any assumptions used to estimate AROs, it adjusts the carrying amount of both the ARO liability and the related long-lived asset. Xcel Energy accretes ARO liabilities to reflect the passage of time using the interest method. A significant portion of Xcel Energy’s AROs relates to the future decommissioning of NSP-Minnesota’s nuclear facilities. The total obligation for nuclear decommissioning currently is expected to be funded 100 percent by the external decommissioning trust fund. The difference between regulatory funding (including depreciation expense less returns from the external trust fund) and amounts recorded under current accounting guidance are deferred as a regulatory asset. The amounts recorded for AROs related to future nuclear decommissioning were $1,546.4 million and $1,482.7 million as of Dec. 31, 2012 and 2011, respectively. Based on their significance, the following discussion relates specifically to the AROs associated with nuclear decommissioning. NSP-Minnesota obtains periodic cost studies in order to estimate the cost and timing of planned nuclear decommissioning activities. These independent cost studies are based on relevant information available at the time performed. Estimates of future cash flows for extended periods of time are by nature highly uncertain and may vary significantly from actual results. In December 2011, NSP-Minnesota submitted to the MPUC its triennial nuclear decommissioning filing. The filing included a decommissioning study, which covered all expenses over the decommissioning period of the nuclear plants, including decontamination and removal of radioactive material. The estimated future costs were initially determined in nominal amounts (2011 dollars) prior to escalation adjustments, then future periods’ costs were escalated using decommissioning-specific cost escalators and finally discounted using risk-free, credit adjusted interest rates. In November 2012, the MPUC approved NSP-Minnesota’s most recent nuclear decommissioning study which used 2011 cost data. The MPUC approved the use of a 60-year decommissioning scenario. This resulted in an approved annual accrual for 2013 of $14.2 million for Minnesota retail customers to be offset by funds received in 2012 of $15.3 million from the DOE settlement, which was deposited into the external decommissioning trust fund in December 2012. The following key assumptions have a significant effect on these estimates:
Table of Contents
• Timing — Decommissioning cost estimates are impacted by each facility’s retirement date, as well as the expected timing of the actual decommissioning activities. Currently, the estimated retirement dates coincide with each units operating license with the NRC (i.e., 2030 for Monticello and 2033 and 2034 for Prairie Island’s Unit 1 and 2, respectively). The estimated timing of the decommissioning activities is based upon the DECON method, which is required by the MPUC. By utilizing this method, which assumes prompt removal and dismantlement, these activities are expected to begin at the end of the license date and be completed for both facilities by 2091.
• Technology and Regulation — There is limited experience with actual decommissioning of large nuclear facilities. Changes in technology and experience as well as changes in regulations regarding nuclear decommissioning could cause cost estimates to change significantly. NSP-Minnesota’s 2011 nuclear decommissioning filing assumed current technology and regulations.
• Escalation Rates — Escalation rates represent projected cost increases over time due to both general inflation and increases in the cost of specific decommissioning activities. NSP-Minnesota used an escalation rate of 3.63 percent in calculating the AROs related to nuclear decommissioning for the remaining operational period through the radiological decommissioning period. An escalation rate of 2.63 percent was utilized for the period of operating costs related to interim dry cask storage of spent nuclear fuel and site restoration.
67

Significant uncertainties exist in estimating the future cost of nuclear decommissioning including the method to be utilized, the ultimate costs to decommission, and the planned method of disposing spent fuel. If different cost estimates, life assumptions or cost escalation rates were utilized, the AROs could change materially. However, changes in estimates have minimal impact on results of operations as NSP-Minnesota expects to continue to recover all costs in future rates. Xcel Energy continually makes judgments and estimates related to these critical accounting policy areas, based on an evaluation of the varying assumptions and uncertainties for each area. The information and assumptions underlying many of these judgments and estimates will be affected by events beyond the control of Xcel Energy, or otherwise change over time. This may require adjustments to recorded results to better reflect the events and updated information that becomes available. The accompanying financial statements reflect management’s best estimates and judgments of the impact of these factors as of Dec. 31, 2012. Derivatives, Risk Management and Market Risk In the normal course of business, Xcel Energy Inc. and its subsidiaries are exposed to a variety of market risks. Market risk is the potential loss that may occur as a result of adverse changes in the market or fair value of a particular instrument or commodity. All financial and commodity-related instruments, including derivatives, are subject to market risk. See Note 11 to the consolidated financial statements for further discussion of market risks associated with derivatives. Xcel Energy is exposed to the impact of adverse changes in price for energy and energy-related products, which is partially mitigated by the use of commodity derivatives. In addition to ongoing monitoring and maintaining credit policies intended to minimize overall credit risk, when necessary, management takes steps to mitigate changes in credit and concentration risks associated with its derivatives and other contracts, including parental guarantees and requests of collateral. While Xcel Energy expects that the counterparties will perform under the contracts underlying its derivatives, the contracts expose Xcel Energy to some credit and nonperformance risk. Though no material non-performance risk currently exists with the counterparties to Xcel Energy’s commodity derivative contracts, distress in the financial markets may in the future impact that risk to the extent it impacts those counterparties. Distress in the financial markets may also impact the fair value of the securities in the nuclear decommissioning fund and master pension trust, as well as Xcel Energy’s ability to earn a return on short-term investments of excess cash. Commodity Price Risk — Xcel Energy Inc.’s utility subsidiaries are exposed to commodity price risk in their electric and natural gas operations. Commodity price risk is managed by entering into long- and short-term physical purchase and sales contracts for electric capacity, energy and energy-related products and for various fuels used in generation and distribution activities. Commodity price risk is also managed through the use of financial derivative instruments. Xcel Energy’s risk management policy allows it to manage commodity price risk within each rate-regulated operation to the extent such exposure exists. Wholesale and Commodity Trading Risk — Xcel Energy Inc.’s utility subsidiaries conduct various wholesale and commodity trading activities, including the purchase and sale of electric capacity, energy and energy-related instruments. Xcel Energy’s risk management policy allows management to conduct these activities within guidelines and limitations as approved by its risk management committee, which is made up of management personnel not directly involved in the activities governed by this policy.
Table of Contents
• Discount Rates — Changes in timing or estimated expected cash flows that result in upward revisions to the ARO are calculated using the then-current credit-adjusted risk-free interest rate. The credit-adjusted risk-free rate in effect when the change occurs is used to discount the revised estimate of the incremental expected cash flows of the retirement activity. If the change in timing or estimated expected cash flows results in a downward revision of the ARO, the undiscounted revised estimate of expected cash flows is discounted using the credit-adjusted risk-free rate in effect at the date of initial measurement and recognition of the original ARO. The estimated expected cash flows that changed in 2012 due to the change to a 60 year decommissioning assumption resulted in an immaterial revision to the ARO. Discount rates ranging from approximately 4 percent and 7 percent have been used to calculate the net present value of the expected future cash flows over time.
68

At Dec. 31, 2012, the fair values by source for net commodity trading contract assets were as follows:
1 — Prices actively quoted or based on actively quoted prices. 2 — Prices based on models and other valuation methods. Changes in the fair value of commodity trading contracts before the impacts of margin-sharing mechanisms for the years ended Dec. 31, were as follows:
At Dec. 31, 2012, a 10 percent increase in market prices for commodity trading contracts would increase pretax income from continuing operations by approximately $0.5 million, whereas a 10 percent decrease would decrease pretax income from continuing operations by approximately $0.5 million. At Dec. 31, 2011, a 10 percent increase in market prices for commodity trading contracts would increase pretax income from continuing operations by approximately $0.2 million, whereas a 10 percent decrease would decrease pretax income from continuing operations by approximately $0.2 million. Xcel Energy Inc.’s utility subsidiaries’ wholesale and commodity trading operations measure the outstanding risk exposure to price changes on transactions, contracts and obligations that have been entered into, but not closed, including transactions that are not recorded at fair value, using an industry standard methodology known as Value at Risk (VaR). VaR expresses the potential change in fair value on the outstanding transactions, contracts and obligations over a particular period of time under normal market conditions. The VaRs for the NSP-Minnesota and PSCo commodity trading operations, calculated on a consolidated basis using a Monte Carlo simulation with a 95 percent confidence level and a one-day holding period, were as follows:
Interest Rate Risk — Xcel Energy is subject to the risk of fluctuating interest rates in the normal course of business. Xcel Energy’s risk management policy allows interest rate risk to be managed through the use of fixed rate debt, floating rate debt and interest rate derivatives such as swaps, caps, collars and put or call options.
Table of Contents
Futures / Forwards Maturity Maturity Total Futures/ Source of Less Than Maturity Maturity Greater Than Forwards (Thousands of Dollars) Fair Value 1 Year 1 to 3 Years 4 to 5 Years 5 Years Fair Value NSP-Minnesota 1 $ 7,207 $ 16,207 $ 1,251 $ 1,201 $ 25,866 NSP-Minnesota 2 50 - 277 612 939 PSCo 1 474 318 - - 792 $ 7,731 $ 16,525 $ 1,528 $ 1,813 $ 27,597
Options Maturity Maturity Source of Less Than Maturity Maturity Greater Than Total Options (Thousands of Dollars) Fair Value 1 Year 1 to 3 Years 4 to 5 Years 5 Years Fair Value NSP-Minnesota 2 $ 641 $ 76 $ - $ - $ 717
(Thousands of Dollars) 2012 2011 Fair value of net commodity trading contract assets outstanding at Jan. 1 $ 20,424 $ 20,249 Contracts realized or settled during the period (12,185) (10,672)Unrealized commodity trading transactions during the period 20,075 10,847 Fair value of net commodity trading contract assets outstanding at Dec. 31 $ 28,314 $ 20,424
Year Ended (Millions of Dollars) Dec. 31 VaR Limit Average High Low 2012 $ 0.45 $ 3.00 $ 0.36 $ 1.56 $ 0.06 2011 0.09 3.00 0.14 0.33 0.04
69

In conjunction with the NSP-Minnesota debt issuance in August 2012, NSP-Minnesota settled interest rate hedging instruments with a notional amount of $225 million with cash payments of $45.0 million. In conjunction with the PSCo debt issuance in September 2012, PSCo settled interest rate hedging instruments with a notional amount of $250 million with cash payments of $44.7 million. These losses are classified as a component of accumulated other comprehensive loss on the consolidated balance sheet, net of tax, and are being reclassified to earnings over the term of the hedged interest payments. See Note 4 for further discussion of long-term borrowings. At Dec. 31, 2012 and 2011, a 100-basis-point change in the benchmark rate on Xcel Energy’s variable rate debt would impact pretax interest expense annually by approximately $6.0 million and $2.9 million, respectively. See Note 11 to the consolidated financial statements for a discussion of Xcel Energy Inc. and its subsidiaries’ interest rate derivatives. NSP-Minnesota also maintains a nuclear decommissioning fund, as required by the NRC. The nuclear decommissioning fund is subject to interest rate risk and equity price risk. At Dec. 31, 2012, the fund was invested in a diversified portfolio of cash equivalents, debt securities, equity securities, and other investments. These investments may be used only for activities related to nuclear decommissioning. Given the purpose and legal restrictions on the use of nuclear decommissioning fund assets, realized and unrealized gains on fund investments over the life of the fund are deferred as an offset of NSP-Minnesota’s regulatory asset for nuclear decommissioning costs. Consequently, any realized and unrealized gains and losses on securities in the nuclear decommissioning fund, including any other-than-temporary impairments, are deferred as a component of the regulatory asset for nuclear decommissioning. Since the accounting for nuclear decommissioning recognizes that costs are recovered through rates, fluctuations in equity prices or interest rates do not have an impact on earnings. Credit Risk — Xcel Energy Inc. and its subsidiaries are also exposed to credit risk. Credit risk relates to the risk of loss resulting from counterparties’ nonperformance on their contractual obligations. Xcel Energy Inc. and its subsidiaries maintain credit policies intended to minimize overall credit risk and actively monitor these policies to reflect changes and scope of operations. At Dec. 31, 2012, a 10 percent increase in commodity prices would have resulted in a decrease in credit exposure of $11.6 million, while a decrease of 10 percent in prices would have resulted in an increase in credit exposure of $12.6 million. At Dec. 31, 2011, a 10 percent increase in commodity prices would have resulted in a increase in credit exposure of $1.3 million, while a decrease of 10 percent in prices would have resulted in an increase in credit exposure of $4.3 million. Xcel Energy Inc. and its subsidiaries conduct standard credit reviews for all counterparties. Xcel Energy employs additional credit risk control mechanisms when appropriate, such as letters of credit, parental guarantees, standardized master netting agreements and termination provisions that allow for offsetting of positive and negative exposures. Credit exposure is monitored and, when necessary, the activity with a specific counterparty is limited until credit enhancement is provided. Distress in the financial markets could increase Xcel Energy’s credit risk. Fair Value Measurements Xcel Energy follows accounting and disclosure guidance on fair value measurements that contains a hierarchy for inputs used in measuring fair value and requires disclosure of the observability of the inputs used in these measurements. See Note 11 to the consolidated financial statements for further discussion of the fair value hierarchy and the amounts of assets and liabilities measured at fair value that have been assigned to Level 3. Commodity Derivatives — Xcel Energy continuously monitors the creditworthiness of the counterparties to its commodity derivative contracts and assesses each counterparty’s ability to perform on the transactions set forth in the contracts. Given this assessment and the typically short duration of these contracts, the impact of discounting commodity derivative assets for counterparty credit risk was not material to the fair value of commodity derivative assets at Dec. 31, 2012. Adjustments to fair value for credit risk of commodity trading instruments are recorded in electric revenues. Credit risk adjustments for other commodity derivative instruments are deferred as OCI or regulatory assets and liabilities. The classification as a regulatory asset or liability is based on commission approved regulatory recovery mechanisms. Xcel Energy also assesses the impact of its own credit risk when determining the fair value of commodity derivative liabilities. The impact of discounting commodity derivative liabilities for credit risk was immaterial to the fair value of commodity derivative liabilities at Dec. 31, 2012. Commodity derivative assets and liabilities assigned to Level 3 typically consist of FTRs, as well as forwards and options that are long-term in nature. Level 3 commodity derivative assets and liabilities represent 1.1 percent and 3.1 percent of total assets and liabilities, respectively, measured at fair value at Dec. 31, 2012.
Table of Contents
70

Determining the fair value of FTRs requires numerous management forecasts that vary in observability, including various forward commodity prices, retail and wholesale demand, generation and resulting transmission system congestion. Given the limited observability of management’s forecasts for several of these inputs, these instruments have been assigned a Level 3. Level 3 commodity derivatives assets and liabilities included $17.5 million and $0.8 million of estimated fair values, respectively, for FTRs held at Dec. 31, 2012. Determining the fair value of certain commodity forwards and options can require management to make use of subjective price and volatility forecasts which extend to periods beyond those readily observable on active exchanges or quoted by brokers. When less observable forward price and volatility forecasts are significant to determining the value of commodity forwards and options, these instruments are assigned to Level 3. There were immaterial Level 3 commodity forwards and no Level 3 options held at Dec. 31, 2012. Nuclear Decommissioning Fund — Nuclear decommissioning fund assets assigned to Level 3 consist of asset-backed and mortgage-backed securities, private equity investments and real estate investments. To the extent appropriate, observable active market inputs are utilized to estimate the fair value of asset-backed and mortgage-backed securities. However, less observable and subjective inputs that may be used in conjunction with available pricing of similar securities in active markets can be significant to these valuations. These inputs include estimated principal prepayments and risk-based adjustments to the interest rate used to discount expected future cash flows in a discounted cash flow model. Given the potential significant impacts that unobservable inputs may have on the valuations of asset-backed and mortgage-backed securities, and based on an evaluation of NSP-Minnesota’s ability to redeem private equity investments and real estate investment funds measured at net asset value, estimated fair values for these investments totaling $104.6 million in the nuclear decommissioning fund at Dec. 31, 2012 (approximately 6.7 percent of total assets measured at fair value) are assigned to Level 3. Realized and unrealized gains and losses on nuclear decommissioning fund investments are deferred as a regulatory asset. Liquidity and Capital Resources Cash Flows
Net cash provided by operating activities decreased by $401 million for 2012 as compared to 2011. The decrease was the result of changes in working capital due to the timing of payments and receipts, higher pension contributions, interest rate swap settlements and the effect of income taxes paid in 2012 compared to a refund received in 2011, partially offset by higher net income. Net cash provided by operating activities increased by $512 million for 2011 as compared to 2010. The increase was a result of higher net income, changes in working capital due to timing of payments and the receipt of the nuclear waste disposal settlement of $100 million. These increases were partially offset by a $103 million increase between the periods in pension contributions.
Net cash used in investing activities increased by $85 million for 2012 as compared to 2011. The increase was the result of higher capital expenditures, partially offset by the change in restricted cash due to customer refunds associated with the nuclear waste disposal settlement with the U.S. Department of Energy and insurance proceeds related to Sherco Unit 3 received in 2012. Net cash used in investing activities decreased by $559 million for 2011 as compared to 2010. The decrease was mainly due to the acquisition of generation assets in 2010 partially offset by a change in restricted cash due to the receipt of the $100 million nuclear waste disposal settlement.
Table of Contents
(Millions of Dollars) 2012 2011 2010 Net cash provided by operating activities $ 2,005 $ 2,406 $ 1,894
(Millions of Dollars) 2012 2011 2010 Net cash used in investing activities $ (2,333) $ (2,248) $ (2,807)
71

Net cash provided by financing activities increased by $555 million for 2012 as compared to 2011. The increase was primarily due to higher proceeds from short-term borrowings and the issuance of long-term debt, partially offset by repayments of previously existing long-term debt, repurchases of common stock and higher dividend payments. Net cash used in financing activities increased by $1.1 billion during 2011 as compared to 2010. The increase was primarily due to lower proceeds from the issuance of long-term debt and common stock in 2011 and the redemption of preferred stock during 2011. See discussion of trends, commitments and uncertainties with the potential for future impact on cash flow and liquidity under Capital Sources. Capital Requirements Xcel Energy expects to meet future financing requirements by periodically issuing short-term debt, long-term debt, common stock, hybrid and other securities to maintain desired capitalization ratios. Capital Expenditures — The current estimated capital expenditure programs of Xcel Energy Inc. and its subsidiaries for the years 2013 through 2017 are shown in the table below. The capital expenditure forecast reflects the termination of the Prairie Island EPU.
The capital expenditure programs of Xcel Energy are subject to continuing review and modification. Actual utility construction expenditures may vary from the estimates due to changes in electric and natural gas projected load growth, regulatory decisions, legislative initiatives, reserve margins, the availability of purchased power, alternative plans for meeting long-term energy needs, compliance with future environmental requirements, RPS, and merger, acquisition and divestiture opportunities to support corporate strategies.
Table of Contents
(Millions of Dollars) 2012 2011 2010 Net cash provided by (used in) financing activities $ 350 $ (205) $ 906
Actual Forecast (Millions of Dollars) 2012 2013 2014 2015 2016 2017 By Subsidiary NSP-Minnesota $ 1,018 $ 1,395 $ 1,135 $ 910 $ 925 $ 1,080 PSCo 887 1,075 1,000 850 800 840 SPS 389 490 400 305 300 345 NSP-Wisconsin 155 180 240 245 230 235 WYCO 1 15 - - - -
Total capital expenditures $ 2,450 $ 3,155 $ 2,775 $ 2,310 $ 2,255 $ 2,500
By Function 2012 2013 2014 2015 2016 2017 Electric generation $ 772 $ 1,025 $ 710 $ 550 $ 465 $ 570 Electric transmission 734 1,010 870 650 635 770 Electric distribution 486 515 525 525 535 545 Natural gas 247 355 365 335 325 320 Nuclear fuel 53 95 155 100 140 145 Other 158 155 150 150 155 150
Total capital expenditures $ 2,450 $ 3,155 $ 2,775 $ 2,310 $ 2,255 $ 2,500
By Project 2012 2013 2014 2015 2016 2017 Other capital expenditures $ 1,720 $ 1,710 $ 1,610 $ 1,555 $ 1,600 $ 1,755 PSCo CACJA 189 345 235 90 15 - Other major transmission projects 179 245 260 175 320 415 CapX2020 transmission project 170 350 295 140 - - Natural gas pipeline replacement 100 140 170 190 130 135 Nuclear fuel 53 95 155 100 140 145 Nuclear capacity increases and life extension 39 270 50 60 50 50
Total capital expenditures $ 2,450 $ 3,155 $ 2,775 $ 2,310 $ 2,255 $ 2,500
72

Contractual Obligations and Other Commitments — In addition to its capital expenditure programs, Xcel Energy has contractual obligations and other commitments that will need to be funded in the future. The following is a summarized table of contractual obligations and other commercial commitments at Dec. 31, 2012. See the statements of capitalization and additional discussion in Notes 4 and 13 to the consolidated financial statements.
Common Stock Dividends — Future dividend levels will be dependent on Xcel Energy’s results of operations, financial position, cash flows, reinvestment opportunities and other factors, and will be evaluated by the Xcel Energy Inc. Board of Directors. Xcel Energy’s objective is to continue to grow earnings 5 percent to 7 percent and to grow the dividend 2 percent to 4 percent annually, at least through 2013 or 2014. Beyond this timeframe, we anticipate that rate base and earnings growth could be moderate. Should this occur, we anticipate having flexibility to increase the dividend at a faster rate in the future. Xcel Energy’s dividend policy balances:
In addition, there are certain statutory limitations that could affect dividend levels. Federal law places certain limits on the ability of public utilities within a holding company system to declare dividends. Specifically, under the Federal Power Act, a public utility may not pay dividends from any funds properly included in a capital account. The utility subsidiaries’ dividends may be limited directly or indirectly by state regulatory commissions or bond indenture covenants.
Table of Contents
Payments Due by Period Less than 1 1 to 3 4 to 5 After 5 (Thousands of Dollars) Total Year Years Years Years Long-term debt, principal and interest payments (a) $ 20,342,487 $ 772,251 $ 1,531,410 $ 1,550,113 $ 16,488,713 Capital lease obligations 378,580 18,035 35,867 32,356 292,322 Operating leases (b)(c) 2,909,139 208,494 419,339 383,957 1,897,349 Unconditional purchase obligations 12,917,688 1,996,749 3,013,183 2,206,759 5,700,997 Other long-term obligations, including current portion (d) 268,441 68,530 84,285 70,244 45,382 Payments to vendors in process 21,227 21,227 - - - Short-term debt 602,000 602,000 - - -
Total contractual cash obligations (e) (f) (g) (h) $ 37,439,562 $ 3,687,286 $ 5,084,084 $ 4,243,429 $ 24,424,763
(a) Includes interest payments over the terms of the debt. Interest is calculated using the applicable interest rate at Dec. 31, 2012, and outstanding principal for each investment with the terms ending at each instrument’s maturity.
(b) Under some leases, Xcel Energy would have to sell or purchase the property that it leases if it chose to terminate before the scheduled lease expiration date. Most of Xcel Energy’s railcar, vehicle and equipment and aircraft leases have these terms. At Dec. 31, 2012, the amount that Xcel Energy would have to pay if it chose to terminate these leases was approximately $81.0 million. In addition, at the end of the equipment lease terms, each lease must be extended, equipment purchased for the greater of the fair value or unamortized value of equipment sold to a third party with Xcel Energy making up any deficiency between the sales price and the unamortized value.
(c) Included in operating lease payments are $181.3 million, $367.9 million, $344.7 million and $1.7 billion, for the less than 1 year, 1-3 years, 4-5 years and after 5 years categories, respectively, pertaining to PPAs that were accounted for as operating leases.
(d) Other long-term obligations relate primarily to amounts associated with technology agreements as well as uncertain tax positions. (e) Xcel Energy Inc. and its subsidiaries have contracts providing for the purchase and delivery of a significant portion of its current coal, nuclear fuel and natural gas
requirements. Additionally, the utility subsidiaries of Xcel Energy Inc. have entered into agreements with utilities and other energy suppliers for purchased power to meet system load and energy requirements, replace generation from company-owned units under maintenance and during outages, and meet operating reserve obligations. Certain contractual purchase obligations are adjusted on indices. The effects of price changes are mitigated through cost of energy adjustment mechanisms.
(f) Xcel Energy also has outstanding authority under O&M contracts to purchase up to approximately $2.7 billion of goods and services through the year 2050, in addition to the amounts disclosed in this table.
(g) In January 2013, contributions of $191.5 million were made across four of Xcel Energy’s pension plans. Obligations of this type are dependent on several factors, including management discretion, and therefore, they are not included in the table.
(h) Xcel Energy expects to contribute approximately $21.8 million to the postretirement health care plans during 2013. Obligations of this type are dependent on several factors, including management discretion, and therefore, they are not included in the table.
• Projected cash generation from utility operations; • Projected capital investment in the utility businesses; • A reasonable rate of return on shareholder investment; and • The impact on Xcel Energy’s capital structure and credit ratings.
73

Xcel Energy Inc.’s Articles of Incorporation place restrictions on the amount of common stock dividends it can pay when preferred stock is outstanding. Xcel Energy Inc. redeemed all outstanding preferred stock in 2011. In addition, Xcel Energy Inc.’s Junior Subordinated Indenture places restrictions on its ability to declare and pay dividends in the event Xcel Energy Inc. defers the payment of all or part of the current and accrued interest on its Junior Subordinated Notes due 2068. As of Dec. 31, 2012, Xcel Energy Inc. was current on all interest payments due on the notes. Regulation of Derivatives — In July 2010, financial reform legislation was passed, which provides for the regulation of derivative transactions amongst other provisions. Provisions within the bill provide the CFTC and SEC with expanded regulatory authority over derivative and swap transactions. Regulations effected under this legislation could preclude or impede some types of over-the-counter energy commodity transactions and/or require clearing through regulated central counterparties, which could negatively impact the market for these transactions or result in extensive margin and fee requirements. There will be material increased reporting requirements for certain volumes of derivative and swap activity. In April 2012, the CFTC ruled that swap dealing activity conducted by entities under a notional limit, initially set at $8 billion with further potential reduction to $3 billion after five years, will fall under the de minimis exemption level and will not subject an entity to registering as a swap dealer. Xcel Energy’s current and projected swap activity is below this de minimis level. The CFTC has set an $800 million de minimis volume exemption for swaps with “Utility Special Entities,” defined by the CFTC as primarily entities owning or operating electric or natural gas facilities government entities, after which the entity would have to register as a swap dealer. The bill also contains provisions that should exempt certain derivatives end users from much of the clearing and margin requirements. Although the CFTC’s proposed rules would extend the end user exemption to margin requirements, a requirement would be imposed to have credit support agreements in their place. The full implications for Xcel Energy cannot yet be determined until all the definitions and rulemakings are completed and legal reviews are conducted by Xcel Energy. As currently proposed, Xcel Energy will be subject to reporting requirements on April 10, 2013. Pension Fund — Xcel Energy’s pension assets are invested in a diversified portfolio of domestic and international equity securities, short-term to long-duration fixed income securities, and alternative investments, including, private equity, real estate, hedge fund and commodity investments.
The funded status and pension assumptions are summarized in the following tables:
Long-Term Contracts — In August 2012, PSCo entered into a 10-year physical gas supply contract for the period between November 2013 and October 2023; this contract will help meet a portion of the annual natural gas supply requirements for both PSCo’s electric utility and natural gas utility. The purchase price for natural gas under the contract is indexed-based. Given current input assumptions, the notional value of the transaction over the duration of the contract is approximately $1.0 billion. Capital Sources Short-Term Funding Sources — Xcel Energy uses a number of sources to fulfill short-term funding needs, including operating cash flow, notes payable, commercial paper and bank lines of credit. The amount and timing of short-term funding needs depend in large part on financing needs for construction expenditures, working capital and dividend payments. Short-Term Investments — Xcel Energy Inc., NSP-Minnesota, NSP-Wisconsin, PSCo and SPS maintain cash operating and short-term investment accounts. At Dec. 31, 2012, approximately $5.7 million of cash was held in these accounts.
Table of Contents
• In January 2013, contributions of $191.5 million were made across four of Xcel Energy’s pension plans. • In 2012, contributions of $198.1 million were made across four of Xcel Energy’s pension plans. • In 2011, contributions of $137.3 million were made across three of Xcel Energy’s pension plans. • For future years, we anticipate contributions will be made as necessary.
(Millions of Dollars) Dec. 31, 2012 Dec. 31, 2011 Fair value of pension assets $ 2,944 $ 2,670 Projected pension obligation (a) 3,640 3,226
Funded status $ (696) $ (556)
(a) Excludes nonqualified plan of $39 million and $55 million at Dec. 31, 2012 and 2011, respectively.
Pension Assumptions 2013 2012 Discount rate 4.00 % 5.00 %Expected long-term rate of return 6.88 7.10
74

Commercial Paper — Xcel Energy Inc., NSP-Minnesota, NSP-Wisconsin, PSCo and SPS each have individual commercial paper programs. The authorized levels for these commercial paper programs are:
Commercial paper outstanding for Xcel Energy was as follows:
Credit Facilities — In July 2012, NSP-Minnesota, NSP-Wisconsin, PSCo, SPS and Xcel Energy Inc. entered into amended five-year credit agreements with a syndicate of banks, replacing their previous four-year credit agreements. The amended credit agreements have substantially the same terms and conditions as the prior credit agreements with an improvement in pricing and an extension of maturity from March 2015 to July 2017. The Eurodollar borrowing margins on these lines of credit were reduced from a range of 100 to 200 basis points per year, to a range of 87.5 to 175 basis points per year based on applicable long-term credit ratings. The commitment fees, calculated on the unused portion of the lines of credit, were reduced from a range of 10 to 35 basis points per year, to a range of 7.5 to 27.5 basis points per year, also based on applicable long-term credit ratings. NSP-Minnesota, PSCo, SPS and Xcel Energy Inc. have the right to request an extension of the revolving termination date for two additional one-year periods. NSP-Wisconsin has the right to request an extension of the revolving termination date for an additional one-year period. All extension requests are subject to majority bank group approval. As of Feb. 19, 2013, Xcel Energy Inc. and its utility subsidiaries had the following committed credit facilities available to meet liquidity needs:
Table of Contents
• $800 million for Xcel Energy Inc.; • $700 million for PSCo; • $500 million for NSP-Minnesota; • $300 million for SPS; and • $150 million for NSP-Wisconsin.
Three Months
Ended (Amounts in Millions, Except Interest Rates) Dec. 31, 2012 Borrowing limit $ 2,450 Amount outstanding at period end 602 Average amount outstanding 398 Maximum amount outstanding 602 Weighted average interest rate, computed on a daily basis 0.36 % Weighted average interest rate at end of period 0.36
Twelve Months
Ended Twelve Months
Ended Twelve Months
Ended (Amounts in Millions, Except Interest Rates) Dec. 31, 2012 Dec. 31, 2011 Dec. 31, 2010 Borrowing limit $ 2,450 $ 2,450 $ 2,177 Amount outstanding at period end 602 219 466 Average amount outstanding 403 430 263 Maximum amount outstanding 634 824 653 Weighted average interest rate, computed on a daily basis 0.35% 0.36% 0.36%Weighted average interest rate at end of period 0.36 0.40 0.40
(Millions of Dollars) Facility (a) Drawn (b) Available Cash Liquidity Xcel Energy Inc. $ 800.0 $ 441.0 $ 359.0 $ 0.4 $ 359.4 PSCo 700.0 4.0 696.0 1.0 697.0 NSP-Minnesota 500.0 257.2 242.8 0.6 243.4 SPS 300.0 25.0 275.0 0.2 275.2 NSP-Wisconsin 150.0 3.0 147.0 0.8 147.8
Total $ 2,450.0 $ 730.2 $ 1,719.8 $ 3.0 $ 1,722.8
(a) These credit facilities expire in July 2017. (b) Includes outstanding commercial paper and letters of credit.
75

Money Pool — Xcel Energy received FERC approval to establish a utility money pool arrangement with the utility subsidiaries, subject to receipt of required state regulatory approvals. The utility money pool allows for short-term investments in and borrowings between the utility subsidiaries. Xcel Energy Inc. may make investments in the utility subsidiaries at market-based interest rates; however, the money pool arrangement does not allow the utility subsidiaries to make investments in Xcel Energy Inc. The money pool balances are eliminated in consolidation. NSP-Minnesota, PSCo and SPS participate in the money pool pursuant to approval from their respective state regulatory commissions. NSP-Wisconsin does not participate in the money pool. Registration Statements — Xcel Energy Inc.’s Articles of Incorporation authorize the issuance of one billion shares of $2.50 par value common stock. As of Dec. 31, 2012 and 2011, Xcel Energy Inc. had approximately 488 million shares and 486 million shares of common stock outstanding, respectively. In addition, Xcel Energy Inc.’s Articles of Incorporation authorize the issuance of seven million shares of $100 par value preferred stock. Xcel Energy Inc. had no shares of preferred stock outstanding on Dec. 31, 2012 and 2011. Xcel Energy Inc. and its subsidiaries have the following registration statements on file with the SEC, pursuant to which they may sell, from time to time, securities:
Long-Term Borrowings — See the consolidated statements of capitalization and a discussion of the long-term borrowings in Note 4 to the consolidated financial statements. During 2012, Xcel Energy Inc. and its utility subsidiaries completed the following financings:
Financing Plans — Xcel Energy issues debt and equity securities to refinance retiring maturities, reduce short-term debt, fund construction programs, infuse equity in subsidiaries, fund asset acquisitions and for other general corporate purposes.
Table of Contents
• Xcel Energy Inc. has an effective automatic shelf registration statement filed in August 2012, which does not contain a limit on issuance capacity. However, Xcel Energy Inc.’s ability to issue securities is limited by authority granted by the Board of Directors, which currently authorizes the issuance of up to an additional $2.0 billion of debt and common equity securities.
• NSP-Minnesota has $400 million of debt securities remaining under its currently effective shelf registration statement, which was filed in July 2012. • NSP-Wisconsin has $50 million of debt securities remaining under its currently effective shelf registration statement, which was filed in July 2012. • PSCo has an automatic shelf registration statement filed in October 2010, which does not contain a limit on issuance capacity. However, PSCo’s ability
to issue securities is limited by authority granted by its Board of Directors, which currently authorizes the issuance of up to an additional $1.5 billion of debt securities.
• SPS has $50 million of debt securities remaining under its currently effective shelf registration statement, which was filed in April 2012.
• In June 2012, SPS issued an additional $100 million of its 4.50 percent first mortgage bonds due Aug. 15, 2041. SPS used a portion of the net proceeds from the sale of the first mortgage bonds to repay short-term debt borrowings incurred to fund daily operational needs. Including the $200 million of this series previously issued in August 2011, total principal outstanding for this series is $300 million.
• In August 2012, NSP-Minnesota issued $300 million of 10-year first mortgage bonds with a coupon of 2.15 percent due Aug. 15, 2022, and $500 million of 30-year first mortgage bonds with a coupon of 3.40 percent due Aug. 15, 2042. NSP-Minnesota used a portion of the net proceeds from the first mortgage bonds to repay $450 million of 8.0 percent first mortgage bonds maturing on Aug. 28, 2012 and to redeem the following series of pollution control bonds: $100 million of 8.50 percent bonds due Sept. 1, 2019, $27.9 million of 8.50 percent bonds due March 1, 2019 and $69 million of 8.50 percent bonds due April 1, 2030.
• In September 2012, PSCo issued $300 million of 10-year first mortgage bonds with a coupon of 2.25 percent due Sept. 15, 2022, and $500 million of 30-year first mortgage bonds with a coupon of 3.60 percent due Sept. 15, 2042. PSCo used a portion of the net proceeds from the first mortgage bonds to repay $600 million of 7.875 percent first mortgage bonds maturing on Oct. 1, 2012, and redeemed $48.75 million of 5.10 percent bonds due Jan. 1, 2019.
• In October 2012, NSP-Wisconsin issued $100 million of 30-year first mortgage bonds with a coupon of 3.70 percent due Oct. 1, 2042. NSP-Wisconsin used a portion of the net proceeds from the sale of the first mortgage bonds to repay short-term debt borrowings incurred to fund daily operational needs.
76

During 2013, Xcel Energy Inc. and its utility subsidiaries anticipate issuing the following:
Financing plans are subject to change, depending on capital expenditures, internal cash generation, market conditions and other factors. Credit Ratings — Access to reasonably priced capital markets is dependent in part on credit and ratings. In 2011, Moody’s placed SPS on negative outlook. On Oct. 8, 2012, Moody's downgraded SPS by one notch, based on the expected moderation of SPS’ credit metrics due to high levels of capital expenditures and regulatory lag. The outlook is now stable. Off-Balance-Sheet Arrangements Xcel Energy does not have any off-balance-sheet arrangements, other than those currently disclosed, that have or are reasonably likely to have a current or future effect on financial condition, changes in financial condition, revenues or expenses, results of operations, liquidity, capital expenditures or capital resources that is material to investors. Earnings Guidance Xcel Energy’s 2013 earnings guidance is $1.85 to $1.95 per share. Key assumptions related to 2013 earnings are detailed below:
Item 7A — Quantitative and Qualitative Disclosures About Market Risk See Item 7, incorporated by reference. Item 8 — Financial Statements and Supplementary Data See Item 15-1 for an index of financial statements included herein. See Note 17 to the consolidated financial statements for summarized quarterly financial data.
Table of Contents
• NSP-Minnesota may issue approximately $400 million of first mortgage bonds in the first half of 2013. • PSCo may issue approximately $500 million of first mortgage bonds in the first half of 2013. • SPS may issue approximately $100 million of first mortgage bonds in the first half of 2013.
• Constructive outcomes in all rate case and regulatory proceedings. • Normal weather patterns are experienced for the year. • Weather-adjusted retail electric utility sales are projected to grow approximately 0.5 percent. • Weather-adjusted retail firm natural gas sales are projected to decline by approximately 1 percent. • Rider revenue recovery for certain projects have been rolled into base rates, therefore the change is no longer meaningful. • O&M expenses are projected to increase approximately 4 percent to 5 percent over 2012 levels. • Depreciation expense is projected to increase $75 million to $85 million over 2012 levels. • Property taxes are projected to increase approximately $35 million to $40 million over 2012 levels. • Interest expense (net of AFUDC — debt) is projected to decrease $30 million to $35 million from 2012 levels. • AFUDC — equity is projected to increase approximately $15 million to $20 million over 2012 levels. • The ETR is projected to be approximately 34 percent to 36 percent. • Average common stock and equivalents are projected to be approximately 490 million to 500 million shares.
77

Management Report on Internal Controls Over Financial Reporting The management of Xcel Energy Inc. is responsible for establishing and maintaining adequate internal control over financial reporting. Xcel Energy Inc.’s internal control system was designed to provide reasonable assurance to Xcel Energy Inc.’s management and board of directors regarding the preparation and fair presentation of published financial statements. All internal control systems, no matter how well designed, have inherent limitations. Therefore, even those systems determined to be effective can provide only reasonable assurance with respect to financial statement preparation and presentation. Xcel Energy Inc. management assessed the effectiveness of Xcel Energy Inc.’s internal control over financial reporting as of Dec. 31, 2012. In making this assessment, it used the criteria set forth by the Committee of Sponsoring Organizations of the Treadway Commission (COSO) in Internal Control — Integrated Framework. Based on our assessment, we believe that, as of Dec. 31, 2012, Xcel Energy Inc.’s internal control over financial reporting is effective based on those criteria. Xcel Energy Inc.’s independent auditors have issued an audit report on the Xcel Energy Inc.’s internal control over financial reporting. Their report appears herein.
Table of Contents
/S/ BENJAMIN G.S. FOWKE III /S/ TERESA S. MADDEN Benjamin G.S. Fowke III Teresa S. Madden Chairman, President and Chief Executive Officer Senior Vice President and Chief Financial Officer Feb. 22, 2013 Feb. 22, 2013
78

REPORT OF INDEPENDENT REGISTERED PUBLIC ACCOUNTING FIRM
To the Board of Directors and Stockholders of Xcel Energy Inc. We have audited the accompanying consolidated balance sheets and consolidated statements of capitalization of Xcel Energy Inc. and subsidiaries (the “Company”) as of December 31, 2012 and 2011, and the related consolidated statements of income, comprehensive income, common stockholders' equity and cash flows for each of the three years in the period ended December 31, 2012. Our audits also included the financial statement schedules listed in the Index at Item 15. These financial statements and financial statement schedules are the responsibility of the Company's management. Our responsibility is to express an opinion on the financial statements and financial statement schedules based on our audits. We conducted our audits in accordance with the standards of the Public Company Accounting Oversight Board (United States). Those standards require that we plan and perform the audit to obtain reasonable assurance about whether the financial statements are free of material misstatement. An audit includes examining, on a test basis, evidence supporting the amounts and disclosures in the financial statements. An audit also includes assessing the accounting principles used and significant estimates made by management, as well as evaluating the overall financial statement presentation. We believe that our audits provide a reasonable basis for our opinion. In our opinion, such consolidated financial statements present fairly, in all material respects, the financial position of Xcel Energy Inc. and subsidiaries as of December 31, 2012 and 2011, and the results of their operations and their cash flows for each of the three years in the period ended December 31, 2012, in conformity with accounting principles generally accepted in the United States of America. Also, in our opinion, such financial statement schedules, when considered in relation to the basic consolidated financial statements taken as a whole, present fairly, in all material respects, the information set forth therein. We have also audited, in accordance with the standards of the Public Company Accounting Oversight Board (United States), the Company's internal control over financial reporting as of December 31, 2012, based on the criteria established in Internal Control—Integrated Framework issued by the Committee of Sponsoring Organizations of the Treadway Commission and our report dated February 22, 2013 expressed an unqualified opinion on the Company's internal control over financial reporting. /s/ DELOITTE & TOUCHE LLP Minneapolis, Minnesota February 22, 2013
Table of Contents
79

REPORT OF INDEPENDENT REGISTERED PUBLIC ACCOUNTING FIRM
To the Board of Directors and Stockholders of Xcel Energy Inc. We have audited the internal control over financial reporting of Xcel Energy Inc. and subsidiaries (the "Company") as of December 31, 2012, based on criteria established in Internal Control — Integrated Framework issued by the Committee of Sponsoring Organizations of the Treadway Commission. The Company's management is responsible for maintaining effective internal control over financial reporting and for its assessment of the effectiveness of internal control over financial reporting, included in the accompanying Management Report on Internal Controls over Financial Reporting. Our responsibility is to express an opinion on the Company's internal control over financial reporting based on our audit. We conducted our audit in accordance with the standards of the Public Company Accounting Oversight Board (United States). Those standards require that we plan and perform the audit to obtain reasonable assurance about whether effective internal control over financial reporting was maintained in all material respects. Our audit included obtaining an understanding of internal control over financial reporting, assessing the risk that a material weakness exists, testing and evaluating the design and operating effectiveness of internal control based on the assessed risk, and performing such other procedures as we considered necessary in the circumstances. We believe that our audit provides a reasonable basis for our opinion. A company's internal control over financial reporting is a process designed by, or under the supervision of, the company's principal executive and principal financial officers, or persons performing similar functions, and effected by the company's board of directors, management, and other personnel to provide reasonable assurance regarding the reliability of financial reporting and the preparation of financial statements for external purposes in accordance with generally accepted accounting principles. A company's internal control over financial reporting includes those policies and procedures that (1) pertain to the maintenance of records that, in reasonable detail, accurately and fairly reflect the transactions and dispositions of the assets of the company; (2) provide reasonable assurance that transactions are recorded as necessary to permit preparation of financial statements in accordance with generally accepted accounting principles, and that receipts and expenditures of the company are being made only in accordance with authorizations of management and directors of the company; and (3) provide reasonable assurance regarding prevention or timely detection of unauthorized acquisition, use, or disposition of the company's assets that could have a material effect on the financial statements. Because of the inherent limitations of internal control over financial reporting, including the possibility of collusion or improper management override of controls, material misstatements due to error or fraud may not be prevented or detected on a timely basis. Also, projections of any evaluation of the effectiveness of the internal control over financial reporting to future periods are subject to the risk that the controls may become inadequate because of changes in conditions, or that the degree of compliance with the policies or procedures may deteriorate. In our opinion, the Company maintained, in all material respects, effective internal control over financial reporting as of December 31, 2012, based on the criteria established in Internal Control — Integrated Framework issued by the Committee of Sponsoring Organizations of the Treadway Commission. We have also audited, in accordance with the standards of the Public Company Accounting Oversight Board (United States) the consolidated financial statements and financial statement schedules as of and for the year ended December 31, 2012 of the Company and our report dated February 22, 2013 expressed an unqualified opinion on those financial statements and financial statement schedules. /s/ DELOITTE & TOUCHE LLP Minneapolis, Minnesota February 22, 2013
Table of Contents
80

XCEL ENERGY INC. AND SUBSIDIARIES
CONSOLIDATED STATEMENTS OF INCOME (amounts in thousands, except per share data)
See Notes to Consolidated Financial Statements
Table of Contents
Year Ended Dec. 31 2012 2011 2010 Operating revenues
Electric $ 8,517,296 $ 8,766,593 $ 8,451,845 Natural gas 1,537,374 1,811,926 1,782,582 Other 73,553 76,251 76,520
Total operating revenues 10,128,223 10,654,770 10,310,947 Operating expenses
Electric fuel and purchased power 3,623,935 3,991,786 4,010,660 Cost of natural gas sold and transported 880,939 1,163,890 1,162,926 Cost of sales — other 29,067 30,391 29,540 Operating and maintenance expenses 2,176,095 2,140,289 2,057,249 Conservation and demand side management program expenses 260,527 281,378 239,827 Depreciation and amortization 926,053 890,619 858,882 Taxes (other than income taxes) 408,924 374,815 331,894
Total operating expenses 8,305,540 8,873,168 8,690,978 Operating income 1,822,683 1,781,602 1,619,969 Other income, net 6,175 9,255 31,143 Equity earnings of unconsolidated subsidiaries 29,971 30,527 29,948 Allowance for funds used during construction — equity 62,840 51,223 56,152 Interest charges and financing costs
Interest charges — includes other financing costs of $24,087, $24,019, and $20,638, respectively 601,582 591,098 577,291
Allowance for funds used during construction — debt (35,315) (28,181) (28,670)Total interest charges and financing costs 566,267 562,917 548,621
Income from continuing operations before income taxes 1,355,402 1,309,690 1,188,591 Income taxes 450,203 468,316 436,635 Income from continuing operations 905,199 841,374 751,956 Income (loss) from discontinued operations, net of tax 30 (202) 3,878 Net income 905,229 841,172 755,834 Dividend requirements on preferred stock - 3,534 4,241 Premium on redemption of preferred stock - 3,260 - Earnings available to common shareholders $ 905,229 $ 834,378 $ 751,593
Weighted average common shares outstanding:
Basic 487,899 485,039 462,052 Diluted 488,434 485,615 463,391
Earnings per average common share — basic:
Income from continuing operations $ 1.86 $ 1.72 $ 1.62 Income from discontinued operations - - 0.01
Earnings per share $ 1.86 $ 1.72 $ 1.63
Earnings per average common share — diluted:
Income from continuing operations $ 1.85 $ 1.72 $ 1.61 Income from discontinued operations - - 0.01
Earnings per share $ 1.85 $ 1.72 $ 1.62
Cash dividends declared per common share $ 1.07 $ 1.03 $ 1.00
81

XCEL ENERGY INC. AND SUBSIDIARIES
CONSOLIDATED STATEMENTS OF COMPREHENSIVE INCOME (amounts in thousands)
See Notes to Consolidated Financial Statements
Table of Contents
Year Ended Dec. 31 2012 2011 2010 Net income $ 905,229 $ 841,172 $ 755,834 Other comprehensive (loss) income Pension and retiree medical benefits:
Net pension and retiree medical benefit losses arising during the period net of tax of $(4,898), $(4,442) and $(2,647), respectively (7,005) (6,367) (3,606)
Amortization of losses included in net periodic benefit cost, net of tax of $2,567, $2,195 and $1,231, respectively 3,694 3,162 1,751
(3,311) (3,205) (1,855) Derivative instruments:
Net fair value decrease, net of tax of $(12,593), $(25,086) and $(3,159), respectively (19,200) (38,292) (4,289)
Reclassification of losses to net income, net of tax of $2,687, $598 and $1,951, respectively 3,697 648 2,630
(15,503) (37,644) (1,659) Marketable securities:
Net fair value increase (decrease), net of tax of $135, $(63) and $89, respectively 196 (93) 130
Other comprehensive loss (18,618) (40,942) (3,384)Comprehensive income $ 886,611 $ 800,230 $ 752,450
82

XCEL ENERGY INC. AND SUBSIDIARIES
CONSOLIDATED STATEMENTS OF CASH FLOWS (amounts in thousands)
See Notes to Consolidated Financial Statements
Table of Contents
Year Ended Dec. 31 2012 2011 2010 Operating activities
Net income $ 905,229 $ 841,172 $ 755,834 Remove (income) loss from discontinued operations (30) 202 (3,878)Adjustments to reconcile net income to cash provided by operating activities:
Depreciation and amortization 943,702 908,853 872,186 Conservation and demand side management program amortization 7,258 9,816 21,700 Nuclear fuel amortization 102,651 100,902 105,369 Deferred income taxes 508,094 466,567 414,460 Amortization of investment tax credits (6,610) (6,194) (6,353)Allowance for equity funds used during construction (62,840) (51,223) (56,152)Equity earnings of unconsolidated subsidiaries (29,971) (30,527) (29,948)Dividends from unconsolidated subsidiaries 33,470 34,034 32,538 Provision for bad debts 33,808 44,521 44,068 Share-based compensation expense 26,970 45,006 35,807 Prairie Island EPU and SmartGridCity 20,766 - - Net realized and unrealized hedging and derivative transactions (85,308) 9,966 (35,552)Changes in operating assets and liabilities:
Accounts receivable (197,236) (79,701) (29,749)Accrued unbilled revenues 25,377 19,951 (14,642)Inventories 82,658 (57,432) 9,239 Other current assets (30,707) 62,458 10,461 Accounts payable (100,327) 13,748 (188,855)Net regulatory assets and liabilities 5,866 149,282 36,096 Other current liabilities 42,914 112,353 13,192 Pension and other employee benefit obligations (183,922) (150,717) (62,625)
Change in other noncurrent assets (33,151) 24,069 5,936 Change in other noncurrent liabilities (3,905) (61,584) (35,190)
Net cash provided by operating activities 2,004,756 2,405,522 1,893,942 Investing activities
Utility capital/construction expenditures (2,570,209) (2,205,567) (2,216,193)Proceeds from insurance recoveries 97,835 - - Allowance for equity funds used during construction 62,840 51,223 56,152 Merricourt refund - 101,261 - Merricourt deposit - (90,833) (1,134)Purchases of investments in external decommissioning fund (1,102,025) (2,098,642) (3,781,438)Proceeds from the sale of investments in external decommissioning fund 1,087,076 2,098,642 3,786,373 Proceeds from the sale of assets - - 87,823 Acquisition of generation assets - - (732,495)Investment in WYCO Development LLC (980) (2,446) (8,046)Change in restricted cash 95,287 (95,287) 89 Other, net (2,766) (6,152) 2,145
Net cash used in investing activities (2,332,942) (2,247,801) (2,806,724)Financing activities
Proceeds from (repayments of) short-term borrowings, net 383,000 (247,400) 7,400 Proceeds from issuance of long-term debt 1,790,131 688,598 1,433,406 Repayments of long-term debt, including reacquisition premiums (1,302,763) (105,623) (560,383)Proceeds from issuance of common stock 8,050 38,691 457,258 Repurchase of common stock (18,529) - - Purchase of common stock for settlement of equity awards (23,307) - - Redemption of preferred stock - (104,980) - Dividends paid (486,757) (474,760) (432,110)
Net cash provided by (used in) financing activities 349,825 (205,474) 905,571 Net change in cash and cash equivalents 21,639 (47,753) (7,211)Cash and cash equivalents at beginning of period 60,684 108,437 115,648 Cash and cash equivalents at end of period $ 82,323 $ 60,684 $ 108,437
Supplemental disclosure of cash flow information: Cash paid for interest (net of amounts capitalized) $ (563,517) $ (531,148) $ (530,072)Cash (paid) received for income taxes, net (9,570) 55,764 (16,635)
Supplemental disclosure of non-cash investing and financing transactions: Property, plant and equipment additions in accounts payable $ 289,802 $ 137,558 $ 174,903 Issuance of common stock for reinvested dividends and 401(k) plans 67,723 71,715 63,905
83


XCEL ENERGY INC. AND SUBSIDIARIES
CONSOLIDATED BALANCE SHEETS (amounts in thousands, except share and per share data)
See Notes to Consolidated Financial Statements
Table of Contents
Dec. 31 2012 2011 Assets Current assets
Cash and cash equivalents $ 82,323 $ 60,684 Restricted cash - 95,287 Accounts receivable, net 718,046 753,120 Accrued unbilled revenues 663,363 688,740 Inventories 535,574 618,232 Regulatory assets 352,977 402,235 Derivative instruments 69,013 64,340 Deferred income taxes 32,528 178,446 Prepayments and other 171,315 121,480
Total current assets 2,625,139 2,982,564 Property, plant and equipment, net 23,809,348 22,353,367 Other assets
Nuclear decommissioning fund and other investments 1,617,865 1,463,515 Regulatory assets 2,762,029 2,389,008 Derivative instruments 126,297 152,887 Other 200,008 155,926
Total other assets 4,706,199 4,161,336 Total assets $ 31,140,686 $ 29,497,267
Liabilities and Equity Current liabilities
Current portion of long-term debt $ 258,155 $ 1,059,922 Short-term debt 602,000 219,000 Accounts payable 959,093 902,078 Regulatory liabilities 168,858 275,095 Taxes accrued 334,441 289,713 Accrued interest 162,494 177,111 Dividends payable 131,748 126,487 Derivative instruments 32,482 157,414 Other 287,802 381,819
Total current liabilities 2,937,073 3,588,639 Deferred credits and other liabilities
Deferred income taxes 4,434,909 4,020,377 Deferred investment tax credits 82,761 86,743 Regulatory liabilities 1,059,939 1,101,534 Asset retirement obligations 1,719,796 1,651,793 Derivative instruments 242,866 263,906 Customer advances 252,888 248,345 Pension and employee benefit obligations 1,163,265 1,001,906 Other 229,207 203,313
Total deferred credits and other liabilities 9,185,631 8,577,917 Commitments and contingencies Capitalization
Long-term debt 10,143,905 8,848,513 Common stock — 1,000,000,000 shares authorized of $2.50 par value; 487,959,516 and
486,493,933 shares outstanding at Dec. 31, 2012 and Dec. 31, 2011, respectively 1,219,899 1,216,234 Additional paid in capital 5,353,015 5,327,443 Retained earnings 2,413,816 2,032,556 Accumulated other comprehensive loss (112,653) (94,035)
Total common stockholders’ equity 8,874,077 8,482,198 Total liabilities and equity $ 31,140,686 $ 29,497,267
84

XCEL ENERGY INC. AND SUBSIDIARIES
CONSOLIDATED STATEMENTS OF COMMON STOCKHOLDERS’ EQUITY (amounts in thousands)
See Notes to Consolidated Financial Statements
Table of Contents
Common Stock Issued Accumulated Total Additional Other Common Paid In Retained Comprehensive Stockholders’ Shares Par Value Capital Earnings Loss Equity Balance at Dec. 31, 2009 457,509 $ 1,143,773 $ 4,769,980 $ 1,419,201 $ (49,709) $ 7,283,245 Comprehensive income:
Net income 755,834 755,834 Other comprehensive loss (3,384) (3,384)
Comprehensive income for 2010 752,450 Dividends declared:
Cumulative preferred stock (4,241) (4,241)Common stock (469,091) (469,091)
Issuances of common stock 24,825 62,061 426,717 488,778 Share-based compensation 32,378 32,378 Balance at Dec. 31, 2010 482,334 $ 1,205,834 $ 5,229,075 $ 1,701,703 $ (53,093) $ 8,083,519
Comprehensive income: Net income 841,172 841,172 Other comprehensive loss (40,942) (40,942)
Comprehensive income for 2011 800,230 Dividends declared:
Cumulative preferred stock (3,534) (3,534)Common stock (503,525) (503,525)
Premium on redemption of preferred stock (3,260) (3,260)Issuances of common stock 4,160 10,400 54,514 64,914 Share-based compensation 43,854 43,854 Balance at Dec. 31, 2011 486,494 $ 1,216,234 $ 5,327,443 $ 2,032,556 $ (94,035) $ 8,482,198
Comprehensive income: Net income 905,229 905,229 Other comprehensive loss (18,618) (18,618)
Comprehensive income for 2012 886,611 Dividends declared on common stock (523,969) (523,969)Issuances of common stock 2,166 5,415 28,219 33,634 Repurchase of common stock (700) (1,750) (16,779) (18,529)Purchase of common stock for
settlement of equity awards (23,307) (23,307)Share-based compensation 37,439 37,439 Balance at Dec. 31, 2012 487,960 $ 1,219,899 $ 5,353,015 $ 2,413,816 $ (112,653) $ 8,874,077
85

XCEL ENERGY INC. AND SUBSIDIARIES
CONSOLIDATED STATEMENTS OF CAPITALIZATION (amounts in thousands, except share and per share data)
See Notes to Consolidated Financial Statements
Table of Contents
Dec. 31 2012 2011 Long-Term Debt NSP-Minnesota First Mortgage Bonds, Series due:
Aug. 28, 2012, 8% $ - $ 450,000 Aug. 15, 2015, 1.95% 250,000 250,000 March 1, 2018, 5.25% 500,000 500,000 March 1, 2019, 8.5% (a) - 27,900 Sept. 1, 2019, 8.5% (a) - 100,000 Aug. 15, 2022, 2.15% 300,000 - July 1, 2025, 7.125% 250,000 250,000 March 1, 2028, 6.5% 150,000 150,000 April 1, 2030, 8.5% (a) - 69,000 July 15, 2035, 5.25% 250,000 250,000 June 1, 2036, 6.25% 400,000 400,000 July 1, 2037, 6.2% 350,000 350,000 Nov. 1, 2039, 5.35% 300,000 300,000 Aug. 15, 2040, 4.85% 250,000 250,000 Aug. 15, 2042, 3.4% 500,000 -
Other 2 8 Unamortized discount (11,362) (8,011)
Total 3,488,640 3,338,897 Less current maturities 2 450,000
Total NSP-Minnesota long-term debt $ 3,488,638 $ 2,888,897
PSCo First Mortgage Bonds, Series due:
Oct. 1, 2012, 7.875% $ - $ 600,000 March 1, 2013, 4.875% 250,000 250,000 April 1, 2014, 5.5% 275,000 275,000 Sept. 1, 2017, 4.375% (a) 129,500 129,500 Aug. 1, 2018, 5.8% 300,000 300,000 Jan. 1, 2019, 5.1% (a) - 48,750 June 1, 2019, 5.125% 400,000 400,000 Nov. 15, 2020, 3.2% 400,000 400,000 Sept. 15, 2022, 2.25% 300,000 - Sept. 1, 2037, 6.25% 350,000 350,000 Aug. 1, 2038, 6.5% 300,000 300,000 Aug. 15, 2041, 4.75% 250,000 250,000 Sept. 15, 2042, 3.6% 500,000 -
Capital lease obligations, through 2060, 11.2% — 14.3% 185,741 191,374 Unamortized discount (9,468) (8,349)
Total 3,630,773 3,486,275 Less current maturities 256,297 605,633
Total PSCo long-term debt $ 3,374,476 $ 2,880,642
SPS First Mortgage Bonds, Series due:
Aug. 15, 2041, 4.5% $ 300,000 $ 200,000 Unsecured Senior E Notes, due Oct. 1, 2016, 5.6% 200,000 200,000 Unsecured Senior G Notes, due Dec. 1, 2018, 8.75% 250,000 250,000 Unsecured Senior C and D Notes, due Oct. 1, 2033, 6% 100,000 100,000 Unsecured Senior F Notes, due Oct. 1, 2036, 6% 250,000 250,000 Unamortized premium (discount) 3,684 (6,686)
Total 1,103,684 993,314 Less current maturities - -
Total SPS long-term debt $ 1,103,684 $ 993,314
86

XCEL ENERGY INC. AND SUBSIDIARIES
CONSOLIDATED STATEMENTS OF CAPITALIZATION — (Continued) (amounts in thousands, except share and per share data)
See Notes to Consolidated Financial Statements
Table of Contents
Dec. 31 2012 2011 Long-Term Debt — continued NSP-Wisconsin First Mortgage Bonds, Series due:
Oct. 1, 2018, 5.25% $ 150,000 $ 150,000 Sept. 1, 2038, 6.375% 200,000 200,000 Oct. 1, 2042, 3.7% 100,000 -
City of La Crosse Resource Recovery Bond, Series due Nov. 1, 2021, 6% (b) 18,600 18,600 Fort McCoy System Acquisition, due Oct. 15, 2030, 7% 591 625 Other 1,829 1,892 Unamortized discount (2,457) (1,748)
Total 468,563 369,369 Less current maturities 1,246 1,286
Total NSP-Wisconsin long-term debt $ 467,317 $ 368,083
Other Subsidiaries Various Eloigne Co. Affordable Housing Project Notes, due 2013-2050, 0% — 10.5% $ 39,984 $ 53,728
Total 39,984 53,728 Less current maturities 2,881 4,974
Total other subsidiaries long-term debt $ 37,103 $ 48,754
Xcel Energy Inc. Unsecured Senior Notes, Series due:
April 1, 2017, 5.613% $ 253,979 $ 253,979 May 15, 2020, 4.7% 550,000 550,000 July 1, 2036, 6.5% 300,000 300,000 Sept. 15, 2041, 4.8% 250,000 250,000
Junior Subordinated Notes, Series due: Jan. 1, 2068, 7.6% 400,000 400,000
Elimination of PSCo capital lease obligation with affiliates (74,358) (76,329)Unamortized discount (9,205) (10,798)
Total 1,670,416 1,666,852 Less current maturities (including elimination of PSCo capital lease obligation) (2,271) (1,971)
Total Xcel Energy Inc. long-term debt $ 1,672,687 $ 1,668,823
Total long-term debt $ 10,143,905 $ 8,848,513
Common Stockholders’ Equity Common stock — 1,000,000,000 shares authorized of $2.50 par value; 487,959,516 and 486,493,933
shares outstanding at Dec. 31, 2012 and 2011, respectively $ 1,219,899 $ 1,216,234 Additional paid in capital 5,353,015 5,327,443 Retained earnings 2,413,816 2,032,556 Accumulated other comprehensive loss (112,653) (94,035)
Total common stockholders’ equity $ 8,874,077 $ 8,482,198
(a) Pollution control financing. (b) Resource recovery financing.
87

XCEL ENERGY INC. AND SUBSIDIARIES
NOTES TO CONSOLIDATED FINANCIAL STATEMENTS 1. Summary of Significant Accounting Policies Business and System of Accounts — Xcel Energy Inc.’s utility subsidiaries are principally engaged in the regulated generation, purchase, transmission, distribution and sale of electricity and in the regulated purchase, transportation, distribution and sale of natural gas. Xcel Energy’s consolidated financial statements and disclosures are presented in accordance with GAAP. All of the utility subsidiaries’ underlying accounting records also conform to the FERC uniform system of accounts or to systems required by various state regulatory commissions, which are the same in all material respects. Principles of Consolidation — In 2012, Xcel Energy’s operations included the activity of NSP-Minnesota, NSP-Wisconsin, PSCo and SPS. These utility subsidiaries serve electric and natural gas customers in portions of Colorado, Michigan, Minnesota, New Mexico, North Dakota, South Dakota, Texas and Wisconsin. Also included in Xcel Energy’s operations are WGI, an interstate natural gas pipeline company, and WYCO, a joint venture with CIG to develop and lease natural gas pipelines, storage and compression facilities. Xcel Energy Inc.’s nonregulated subsidiary is Eloigne, which invests in rental housing projects that qualify for low-income housing tax credits. Xcel Energy Inc. owns the following additional direct subsidiaries, some of which are intermediate holding companies with additional subsidiaries: Xcel Energy Wholesale Group Inc., Xcel Energy Markets Holdings Inc., Xcel Energy Ventures Inc., Xcel Energy Retail Holdings Inc., Xcel Energy Communications Group, Inc., Xcel Energy International Inc., and Xcel Energy Services Inc. Xcel Energy Inc. and its subsidiaries collectively are referred to as Xcel Energy. Xcel Energy’s consolidated financial statements include its wholly-owned subsidiaries and variable interest entities for which it is the primary beneficiary. In the consolidation process, all intercompany transactions and balances are eliminated. Xcel Energy uses the equity method of accounting for its investment in WYCO. Xcel Energy’s equity earnings in WYCO are included on the consolidated statements of income as equity earnings of unconsolidated subsidiaries. Xcel Energy has investments in several plants and transmission facilities jointly owned with nonaffiliated utilities. Xcel Energy’s proportionate share of jointly owned facilities is recorded as property, plant and equipment on the consolidated balance sheets, and Xcel Energy’s proportionate share of the operating costs associated with these facilities is included in its consolidated statements of income. See Note 5 for further discussion of jointly owned generation, transmission, and gas facilities and related ownership percentages. Xcel Energy evaluates its arrangements and contracts with other entities, including but not limited to, investments, PPAs and fuel contracts to determine if the other party is a variable interest entity, if Xcel Energy has a variable interest and if Xcel Energy is the primary beneficiary. Xcel Energy follows accounting guidance for variable interest entities which requires consideration of the activities that most significantly impact an entity’s financial performance and power to direct those activities, when determining whether Xcel Energy is a variable interest entity’s primary beneficiary. See Note 13 for further discussion of variable interest entities. Use of Estimates — In recording transactions and balances resulting from business operations, Xcel Energy uses estimates based on the best information available. Estimates are used for such items as plant depreciable lives, AROs, regulatory assets and liabilities, tax provisions, uncollectible amounts, environmental costs, unbilled revenues, jurisdictional fuel and energy cost allocations and actuarially determined benefit costs. The recorded estimates are revised when better information becomes available or when actual amounts can be determined. Those revisions can affect operating results. Regulatory Accounting — Our regulated utility subsidiaries account for certain income and expense items in accordance with accounting guidance for regulated operations. Under this guidance:
Estimates of recovering deferred costs and returning deferred credits are based on specific ratemaking decisions or precedent for each item. Regulatory assets and liabilities are amortized consistent with the treatment in the rate setting process.
Table of Contents
• Certain costs, which would otherwise be charged to expense or OCI, are deferred as regulatory assets based on the expected ability to recover the costs in future rates; and
• Certain credits, which would otherwise be reflected as income, are deferred as regulatory liabilities based on the expectation the amounts will be returned to customers in future rates, or because the amounts were collected in rates prior to the costs being incurred.
88

If restructuring or other changes in the regulatory environment occur, regulated utility subsidiaries may no longer be eligible to apply this accounting treatment, and may be required to eliminate regulatory assets and liabilities from their balance sheets. Such changes could have a material effect on Xcel Energy’s financial condition, results of operations and cash flows. See Note 15 for further discussion of regulatory assets and liabilities. Revenue Recognition — Revenues related to the sale of energy are generally recorded when service is rendered or energy is delivered to customers. However, the determination of the energy sales to individual customers is based on the reading of their meter, which occurs on a systematic basis throughout the month. At the end of each month, amounts of energy delivered to customers since the date of the last meter reading are estimated and the corresponding unbilled revenue is recognized. Xcel Energy presents its revenues net of any excise or other fiduciary-type taxes or fees. NSP-Minnesota participates in MISO, and SPS participates in SPP. The revenues and charges from these RTOs related to serving retail and wholesale electric customers comprising the native load of NSP-Minnesota and SPS are recorded on a net basis within cost of sales. Revenues and charges for short term wholesale sales of excess energy transacted through RTOs are recorded on a gross basis in electric revenues and cost of sales. Xcel Energy Inc.’s utility subsidiaries have various rate-adjustment mechanisms in place that provide for the recovery of natural gas, electric fuel and purchased energy costs. These cost-adjustment tariffs may increase or decrease the level of revenue collected from customers and are revised periodically for differences between the total amount collected under the clauses and the costs incurred. When applicable, under governing regulatory commission rate orders, fuel cost over-recoveries (the excess of fuel revenue billed to customers over fuel costs incurred) are deferred as regulatory liabilities and under-recoveries (the excess of fuel costs incurred over fuel revenues billed to customers) are deferred as regulatory assets. Conservation Programs — Xcel Energy Inc.’s utility subsidiaries have implemented programs in many of their retail jurisdictions to assist customers in conserving energy and reducing peak demand on the electric and natural gas systems. These programs include, but are not limited to, efficiency and redesign programs, as well as rebates for the purchase of items such as compact fluorescent bulbs, saver switches and energy-efficient heating and cooling appliances. The costs incurred for DSM and CIP programs are deferred if it is probable future revenue will be provided to permit recovery of the incurred cost. For incentive programs designed to allow adjustments of future rates for recovery of lost margins and/or conservation performance incentives, recorded revenues are limited to those amounts expected to be collected within 24 months following the end of the annual period in which they are earned. For PSCo, SPS and NSP-Minnesota, DSM and CIP program costs are recovered through a combination of base rate revenue and rider mechanisms. The revenue billed to customers recovers incurred costs for conservation programs and also incentive amounts that are designed to encourage Xcel Energy’s achievement of energy conservation goals and compensate for related lost sales margin. For these utility subsidiaries, regulatory assets are recognized to reflect the amount of costs or earned incentives that have not yet been collected from customers. NSP-Wisconsin recovers approved conservation program costs in base rate revenue, without the use of rider mechanisms. Property, Plant and Equipment and Depreciation — Property, plant and equipment is stated at original cost. The cost of plant includes direct labor and materials, contracted work, overhead costs and AFUDC. The cost of plant retired is charged to accumulated depreciation and amortization. Amounts recovered in rates for future removal costs are recorded as regulatory liabilities. Significant additions or improvements extending asset lives are capitalized, while repairs and maintenance costs are charged to expense as incurred. Maintenance and replacement of items determined to be less than a unit of property are charged to operating expenses as incurred. Planned major maintenance activities are charged to operating expense unless the cost represents the acquisition of an additional unit of property or the replacement of an existing unit of property. Property, plant and equipment also includes costs associated with property held for future use. The depreciable lives of certain plant assets are reviewed annually and revised, if appropriate. Property, plant and equipment that is to be early decommissioned is reclassified as plant to be retired. Property, plant and equipment is tested for impairment when it is determined that the carrying value of the assets may not be recoverable. Recently completed property, plant and equipment that is disallowed for cost recovery is expensed in the current period. For investments in property, plant and equipment that are not expected to go into service, incurred costs and related deferred tax amounts are compared to the discounted estimated future rate recovery, and a loss on abandonment is recognized, if necessary.
Table of Contents
89

Xcel Energy records depreciation expense related to its plant using the straight-line method over the plant’s useful life. Actuarial and semi-actuarial life studies are performed on a periodic basis and submitted to the state and federal commissions for review. Upon acceptance by the various commissions, the resulting lives and net salvage rates are used to calculate depreciation. Depreciation expense, expressed as a percentage of average depreciable property, was approximately 2.8, 2.9, and 3.0 percent for the years ended Dec. 31, 2012, 2011 and 2010, respectively. Leases — Xcel Energy evaluates a variety of contracts for lease classification at inception, including PPAs and rental arrangements for office space, vehicles and equipment. Contracts determined to contain a lease because of per unit pricing that is other than fixed or market price, terms regarding the use of a particular asset, and other factors are evaluated further to determine if the arrangement is a capital lease. See Note 13 for further discussion of leases. AFUDC — AFUDC represents the cost of capital used to finance utility construction activity. AFUDC is computed by applying a composite pretax rate to qualified CWIP. The amount of AFUDC capitalized as a utility construction cost is credited to other nonoperating income (for equity capital) and interest charges (for debt capital). AFUDC amounts capitalized are included in Xcel Energy’s rate base for establishing utility service rates. In addition to construction-related amounts, cost of capital also is recorded to reflect returns on capital used to finance conservation programs in Minnesota. Generally, AFUDC costs are recovered from customers as the related property is depreciated. However, in some cases commissions have approved a more current recovery of the cost of capital associated with large capital projects, resulting in a lower recognition of AFUDC. In other cases, some commissions have allowed an AFUDC calculation greater than the FERC-defined AFUDC rate, resulting in higher recognition of AFUDC. Asset Retirement Obligations — Xcel Energy Inc.’s utility subsidiaries account for AROs under accounting guidance that requires a liability for the fair value of an ARO to be recognized in the period in which it is incurred if it can be reasonably estimated, with the offsetting associated asset retirement costs capitalized as a long-lived asset. The liability is generally increased over time by applying the interest method of accretion, and the capitalized costs are depreciated over the useful life of the long-lived asset. Changes resulting from revisions to the timing or amount of expected asset retirement cash flows are recognized as an increase or a decrease in the ARO. Xcel Energy Inc.’s utility subsidiaries also recover through rates certain future plant removal costs in addition to AROs. The accumulated removal costs for these obligations are reflected in the balance sheets as a regulatory liability. See Note 13 for further discussion of AROs. Nuclear Decommissioning — Nuclear decommissioning studies estimate NSP-Minnesota’s ultimate costs of decommissioning its nuclear power plants and are performed at least every three years and submitted to the MPUC and other state commissions for approval. NSP-Minnesota filed its most recent triennial nuclear decommissioning studies with the MPUC in December 2011 and received approval in December 2012. These studies reflect NSP-Minnesota’s plans, under the current operating licenses, for prompt dismantlement of the Monticello and Prairie Island facilities. These studies assume that NSP-Minnesota will be storing spent fuel on site pending removal to a U.S. government facility. For rate making purposes, NSP-Minnesota recovers the total decommissioning costs related to its nuclear power plants, including operating costs associated with spent fuel, over each facility’s expected service life based on the triennial decommissioning studies filed with the MPUC. The studies consider estimated future costs of decommissioning and the market value of investments in trust funds, and recommend annual funding amounts. Amounts collected in rates are deposited in the trust funds. See Note 14 for further discussion of the approved nuclear decommissioning studies and funded amounts. For financial reporting purposes, NSP-Minnesota accounts for nuclear decommissioning as an ARO as described above. Restricted funds for the payment of future decommissioning expenditures for NSP-Minnesota’s nuclear facilities are included in the nuclear decommissioning fund on the consolidated balance sheets. See Note 11 for further discussion of the nuclear decommissioning fund. Nuclear Fuel Expense — Nuclear fuel expense, which is recorded as NSP-Minnesota’s nuclear generating plants use fuel, includes the cost of fuel used in the current period (including AFUDC), as well as future disposal costs of spent nuclear fuel and costs associated with the end-of-life fuel segments. Nuclear Refueling Outage Costs — Xcel Energy uses a deferral and amortization method for nuclear refueling O&M costs. This method amortizes refueling outage costs over the period between refueling outages consistent with how the costs are recovered ratably in electric rates.
Table of Contents
90

Income Taxes — Xcel Energy accounts for income taxes using the asset and liability method, which requires the recognition of deferred tax assets and liabilities for the expected future tax consequences of events that have been included in the financial statements. Xcel Energy defers income taxes for all temporary differences between pretax financial and taxable income, and between the book and tax bases of assets and liabilities. Xcel Energy uses the tax rates that are scheduled to be in effect when the temporary differences are expected to reverse. The effect of a change in tax rates on deferred tax assets and liabilities is recognized in income in the period that includes the enactment date. Deferred tax assets are reduced by a valuation allowance if it is more likely than not that some portion or all of the deferred tax asset will not be realized. In making such a determination, all available evidence is considered, including scheduled reversals of deferred tax liabilities, projected future taxable income, tax planning strategies and recent financial operations. Due to the effects of past regulatory practices, when deferred taxes were not required to be recorded due to the use of flow through accounting for ratemaking purposes, the reversal of some temporary differences are accounted for as current income tax expense. Investment tax credits are deferred and their benefits amortized over the book depreciable lives of the related property. Utility rate regulation also has resulted in the recognition of certain regulatory assets and liabilities related to income taxes, which are summarized in Note 15. Xcel Energy follows the applicable accounting guidance to measure and disclose uncertain tax positions that it has taken or expects to take in its income tax returns. Xcel Energy recognizes a tax position in its consolidated financial statements when it is more likely than not that the position will be sustained upon examination based on the technical merits of the position. Recognition of changes in uncertain tax positions are reflected as a component of income tax. Xcel Energy reports interest and penalties related to income taxes within the other income and interest charges sections in the consolidated statements of income. Xcel Energy Inc. and its subsidiaries file consolidated federal income tax returns as well as combined or separate state income tax returns. Federal income taxes paid by Xcel Energy Inc. are allocated to Xcel Energy Inc.’s subsidiaries based on separate company computations of tax. A similar allocation is made for state income taxes paid by Xcel Energy Inc. in connection with combined state filings. Xcel Energy Inc. also allocates its own income tax benefits to its direct subsidiaries based on the relative positive tax liabilities of the subsidiaries. See Note 6 for further discussion of income taxes. Types of and Accounting for Derivative Instruments — Xcel Energy uses derivative instruments in connection with its interest rate, utility commodity price, vehicle fuel price, short-term wholesale and commodity trading activities, including forward contracts, futures, swaps and options. All derivative instruments not designated and qualifying for the normal purchases and normal sales exception, as defined by the accounting guidance for derivatives and hedging, are recorded on the consolidated balance sheets at fair value as derivative instruments. This includes certain instruments used to mitigate market risk for the utility operations and all instruments related to the commodity trading operations. The classification of changes in fair value for those derivative instruments is dependent on the designation of a qualifying hedging relationship. Changes in fair value of derivative instruments not designated in a qualifying hedging relationship are reflected in current earnings or as a regulatory asset or liability. The classification as a regulatory asset or liability is based on commission approved regulatory recovery mechanisms. Gains or losses on commodity trading transactions are recorded as a component of electric operating revenues; hedging transactions for vehicle fuel costs are recorded as a component of capital projects or O&M costs; and interest rate hedging transactions are recorded as a component of interest expense. Certain utility subsidiaries are allowed to recover in electric or natural gas rates the costs of certain financial instruments purchased to reduce commodity cost volatility. For further information on derivatives entered to mitigate commodity price risk on behalf of electric and natural gas customers, see Note 11. Cash Flow Hedges — Certain qualifying hedging relationships are designated as a hedge of a forecasted transaction, or future cash flow (cash flow hedge). Changes in the fair value of a derivative designated as a cash flow hedge, to the extent effective, are included in OCI, or deferred as a regulatory asset or liability based on recovery mechanisms until earnings are affected by the hedged transaction. Normal Purchases and Normal Sales — Xcel Energy enters into contracts for the purchase and sale of commodities for use in its business operations. Derivatives and hedging accounting guidance requires a company to evaluate these contracts to determine whether the contracts are derivatives. Certain contracts that meet the definition of a derivative may be exempted from derivative accounting if designated as normal purchases or normal sales.
Table of Contents
91

Xcel Energy evaluates all of its contracts at inception to determine if they are derivatives and if they meet the normal purchases and normal sales designation requirements. None of the contracts entered into within the commodity trading operations qualify for a normal purchases and normal sales designation. See Note 11 for further discussion of Xcel Energy’s risk management and derivative activities. Commodity Trading Operations — All applicable gains and losses related to commodity trading activities, whether or not settled physically, are shown on a net basis in electric operating revenues in the consolidated statements of income. Xcel Energy’s commodity trading operations are conducted by NSP-Minnesota, PSCo and SPS. Commodity trading activities are not associated with energy produced from Xcel Energy’s generation assets or energy and capacity purchased to serve native load. Commodity trading contracts are recorded at fair market value and commodity trading results include the impact of all margin-sharing mechanisms. See Note 11 for further discussion. Fair Value Measurements — Xcel Energy presents cash equivalents, interest rate derivatives, commodity derivatives and nuclear decommissioning fund assets at estimated fair values in its consolidated financial statements. Cash equivalents are recorded at cost plus accrued interest; money market funds are measured using quoted net asset values. For interest rate derivatives, quoted prices based primarily on observable market interest rate curves are used as a primary input to establish fair value. For commodity derivatives, the most observable inputs available are generally used to determine the fair value of each contract. In the absence of a quoted price for an identical contract in an active market, Xcel Energy may use quoted prices for similar contracts or internally prepared valuation models to determine fair value. For the nuclear decommissioning fund, published trading data and pricing models, generally using the most observable inputs available, are utilized to estimate fair value for each class of security. See Note 11 for further discussion. Cash and Cash Equivalents — Xcel Energy considers investments in certain instruments, including commercial paper and money market funds, with a remaining maturity of three months or less at the time of purchase, to be cash equivalents. Accounts Receivable and Allowance for Bad Debts — Accounts receivable are stated at the actual billed amount net of an allowance for bad debts. Xcel Energy establishes an allowance for uncollectible receivables based on a policy that reflects its expected exposure to the credit risk of customers. Inventory — All inventory is recorded at average cost. Renewable Energy Credits — RECs are marketable environmental instruments that represent proof that energy was generated from eligible renewable energy sources. RECs are awarded upon delivery of the associated energy and can be bought and sold. RECs are typically used as a form of measurement of compliance to RPS enacted by those states that are encouraging construction and consumption from renewable energy sources, but can also be sold separately from the energy produced. Utility subsidiaries acquire RECs from the generation or purchase of renewable power. When RECs are purchased or acquired in the course of generation they are recorded as inventory at cost. The cost of RECs that are utilized for compliance purposes is recorded as electric fuel and purchased power expense. As a result of state regulatory orders, Xcel Energy reduces recoverable fuel costs for the cost of certain RECs and records that cost as a regulatory asset when the amount is recoverable in future rates. Sales of RECs that are purchased or acquired in the course of generation are recorded in electric utility operating revenues on a gross basis. The cost of these RECs, related transaction costs, and amounts credited to customers under margin-sharing mechanisms are recorded in electric fuel and purchased power expense. The sales of RECs for trading purposes are recorded in electric utility operating revenues, net of the cost of the RECs, transaction costs, and amounts credited to customers under margin-sharing mechanisms. Emission Allowances — Emission allowances, including the annual SO2 and NOx emission allowance entitlement received from the EPA, are recorded at cost
plus associated broker commission fees. Xcel Energy follows the inventory accounting model for all emission allowances. The sales of emission allowances are included in electric utility operating revenues and the operating activities section of the consolidated statements of cash flows. Environmental Costs — Environmental costs are recorded when it is probable Xcel Energy is liable for the costs and the liability can be reasonably estimated. Costs are deferred as a regulatory asset if it is probable that the costs will be recovered from customers in future rates. Otherwise, the costs are expensed. If an environmental expense is related to facilities currently in use, such as emission-control equipment, the cost is capitalized and depreciated over the life of the plant.
Table of Contents
92

Estimated remediation costs, excluding inflationary increases, are recorded. The estimates are based on experience, an assessment of the current situation and the technology currently available for use in the remediation. The recorded costs are regularly adjusted as estimates are revised and remediation proceeds. If other participating PRPs exist and acknowledge their potential involvement with a site, costs are estimated and recorded only for Xcel Energy’s expected share of the cost. Any future costs of restoring sites where operation may extend indefinitely are treated as a capitalized cost of plant retirement. The depreciation expense levels recoverable in rates include a provision for removal expenses, which may include final remediation costs. Removal costs recovered in rates are classified as a regulatory liability. See Note 13 for further discussion of environmental costs. Benefit Plans and Other Postretirement Benefits — Xcel Energy maintains pension and postretirement benefit plans for eligible employees. Recognizing the cost of providing benefits and measuring the projected benefit obligation of these plans under applicable accounting guidance requires management to make various assumptions and estimates. Based on the regulatory recovery mechanisms of Xcel Energy Inc.’s utility subsidiaries, certain unrecognized actuarial gains and losses and unrecognized prior service costs or credits are recorded as regulatory assets and liabilities, rather than OCI. See Note 9 for further discussion of benefit plans and other postretirement benefits. Guarantees — Xcel Energy recognizes, upon issuance or modification of a guarantee, a liability for the fair market value of the obligation that has been assumed in issuing the guarantee. This liability includes consideration of specific triggering events and other conditions which may modify the ongoing obligation to perform under the guarantee. The obligation recognized is reduced over the term of the guarantee as Xcel Energy is released from risk under the guarantee. See Note 13 for specific details of issued guarantees. Subsequent Events — Management has evaluated the impact of events occurring after Dec. 31, 2012 up to the date of issuance of these consolidated financial statements. These statements contain all necessary adjustments and disclosures resulting from that evaluation. 2. Accounting Pronouncements Recently Adopted Fair Value Measurement — In May 2011, the FASB issued Fair Value Measurement (Topic 820) — Amendments to Achieve Common Fair Value Measurement and Disclosure Requirements in U.S. GAAP and IFRSs (ASU No. 2011-04), which provides clarifications regarding existing fair value measurement principles and disclosure requirements, and also specific new guidance for items such as measurement of instruments classified within stockholders’ equity. These requirements were effective for interim and annual periods beginning after Dec. 15, 2011. Xcel Energy implemented the accounting and disclosure guidance effective Jan. 1, 2012, and the implementation did not have a material impact on its consolidated financial statements. For required fair value measurement disclosures, see Notes 9 and 11. Presentation of Comprehensive Income — In June 2011, the FASB issued Comprehensive Income (Topic 220) — Presentation of Comprehensive Income (ASU No. 2011-05), which requires the presentation of the components of net income, the components of OCI and total comprehensive income in either a single continuous financial statement of comprehensive income or in two separate, but consecutive financial statements of net income and comprehensive income. These updates do not affect the items reported in OCI or the guidance for reclassifying such items to net income. These requirements were effective for interim and annual periods beginning after Dec. 15, 2011. Xcel Energy implemented the financial statement presentation guidance effective Jan. 1, 2012.
Table of Contents
93

Recently Issued Balance Sheet Offsetting — In December 2011, the FASB issued Balance Sheet (Topic 210) — Disclosures about Offsetting Assets and Liabilities (ASU No. 2011-11), which requires disclosures regarding netting arrangements in agreements underlying derivatives, certain financial instruments and related collateral amounts, and the extent to which an entity’s financial statement presentation policies related to netting arrangements impact amounts recorded to the financial statements. In January 2013, the FASB issued Balance Sheet (Topic 210) – Clarifying the Scope of Disclosures about Offsetting Assets and Liabilities (ASU 2013-01) to clarify the specific instruments and activities that should be considered in these disclosures. These disclosure requirements do not affect the presentation of amounts in the consolidated balance sheets, and are effective for annual reporting periods beginning on or after Jan. 1, 2013, and interim periods within those annual reporting periods. Xcel Energy does not expect the implementation of this disclosure guidance to have a material impact on its consolidated financial statements. Comprehensive Income Disclosures — In February 2013, the FASB issued Comprehensive Income (Topic 220) -– Reporting of Amounts Reclassified Out of Accumulated Other Comprehensive Income (ASU No. 2013-02), which requires detailed disclosures of the amounts reclassified out of accumulated other comprehensive income. These disclosure requirements do not change how net income or comprehensive income are presented in the consolidated financial statements. These disclosure requirements are effective for annual reporting periods beginning on or after Dec. 15, 2012, and interim periods within those annual reporting periods. Xcel Energy does not expect the implementation of this disclosure guidance to have a material impact on its consolidated financial statements. 3. Selected Balance Sheet Data
Table of Contents
(Thousands of Dollars) Dec. 31, 2012 Dec. 31, 2011 Accounts receivable, net
Accounts receivable $ 769,440 $ 811,685 Less allowance for bad debts (51,394) (58,565)
$ 718,046 $ 753,120
(Thousands of Dollars) Dec. 31, 2012 Dec. 31, 2011 Inventories
Materials and supplies $ 213,739 $ 202,699 Fuel 189,425 236,023 Natural gas 132,410 179,510
$ 535,574 $ 618,232
(Thousands of Dollars) Dec. 31, 2012 Dec. 31, 2011 Property, plant and equipment, net
Electric plant $ 28,285,031 $ 27,254,541 Natural gas plant 3,836,335 3,676,754 Common and other property 1,480,558 1,546,643 Plant to be retired (a) 152,730 151,184 Construction work in progress 1,757,189 1,085,245
Total property, plant and equipment 35,511,843 33,714,367 Less accumulated depreciation (12,048,697) (11,658,351)Nuclear fuel 2,090,801 1,939,299 Less accumulated amortization (1,744,599) (1,641,948)
$ 23,809,348 $ 22,353,367
(a) In 2010, in response to the CACJA, the CPUC approved the early retirement of Cherokee Units 1, 2 and 3, Arapahoe Unit 3 and Valmont Unit 5 between 2011 and 2017. In 2011, Cherokee Unit 2 was retired and in 2012, Cherokee Unit 1 was retired. Amounts are presented net of accumulated depreciation. See Item 1 – Public Utility Regulation for further discussion.
94

4. Borrowings and Other Financing Instruments Short-Term Borrowings Money Pool — Xcel Energy Inc. and its utility subsidiaries have established a money pool arrangement that allows for short-term investments in and borrowings between the utility subsidiaries. NSP-Wisconsin does not participate in the money pool. Xcel Energy Inc. may make investments in the utility subsidiaries at market-based interest rates; however, the money pool arrangement does not allow the utility subsidiaries to make investments in Xcel Energy Inc. The money pool balances are eliminated in consolidation. Commercial Paper — Xcel Energy Inc. and its utility subsidiaries meet their short-term liquidity requirements primarily through the issuance of commercial paper and borrowings under their credit facilities. Commercial paper outstanding for Xcel Energy was as follows:
Letters of Credit — Xcel Energy Inc. and its subsidiaries use letters of credit, generally with terms of one year, to provide financial guarantees for certain operating obligations. At Dec. 31, 2012 and 2011, there were $14.2 million and $12.7 million of letters of credit outstanding, respectively, under the credit facilities. There were no letters of credit outstanding that were not issued under the credit facilities at Dec. 31, 2012. There were $1.1 million of letters of credit outstanding at Dec. 31, 2011 that were not issued under the credit facilities. The contract amounts of these letters of credit approximate their fair value and are subject to fees determined in the marketplace. Credit Facilities — In order to use their commercial paper programs to fulfill short-term funding needs, Xcel Energy Inc. and its utility subsidiaries must have revolving credit facilities in place at least equal to the amount of their respective commercial paper borrowing limits and cannot issue commercial paper in an aggregate amount exceeding available capacity under these credit facilities. The lines of credit provide short-term financing in the form of notes payable to banks, letters of credit and back-up support for commercial paper borrowings. At Dec. 31, 2012, Xcel Energy Inc. and its utility subsidiaries had the following committed credit facilities available:
Table of Contents
Three Months
Ended (Amounts in Millions, Except Interest Rates) Dec. 31, 2012 Borrowing limit $ 2,450 Amount outstanding at period end 602 Average amount outstanding 398 Maximum amount outstanding 602 Weighted average interest rate, computed on a daily basis 0.36%Weighted average interest rate at end of period 0.36
Twelve Months
Ended Twelve Months
Ended Twelve Months
Ended (Amounts in Millions, Except Interest Rates) Dec. 31, 2012 Dec. 31, 2011 Dec. 31, 2010 Borrowing limit $ 2,450 $ 2,450 $ 2,177 Amount outstanding at period end 602 219 466 Average amount outstanding 403 430 263 Maximum amount outstanding 634 824 653 Weighted average interest rate, computed on a daily basis 0.35% 0.36% 0.36%Weighted average interest rate at end of period 0.36 0.40 0.40
(Millions of Dollars) Credit Facility Drawn (a) Available Xcel Energy Inc. $ 800.0 $ 179.0 $ 621.0 PSCo 700.0 158.0 542.0 NSP-Minnesota 500.0 231.2 268.8 SPS 300.0 9.0 291.0 NSP-Wisconsin 150.0 39.0 111.0
Total $ 2,450.0 $ 616.2 $ 1,833.8
(a) Includes outstanding commercial paper and letters of credit.
95

All credit facility bank borrowings, outstanding letters of credit and outstanding commercial paper reduce the available capacity under the respective credit facilities. Xcel Energy Inc. and its subsidiaries had no direct advances on the credit facilities outstanding at Dec. 31, 2012 and 2011. Amended Credit Agreements — In July 2012, NSP-Minnesota, NSP-Wisconsin, PSCo, SPS and Xcel Energy Inc. entered into amended five-year credit agreements with a syndicate of banks, replacing their previous four-year credit agreements. The amended credit agreements have substantially the same terms and conditions as the prior credit agreements with an improvement in pricing and an extension of maturity from March 2015 to July 2017. The Eurodollar borrowing margins on these lines of credit were reduced from a range of 100 to 200 basis points per year, to a range of 87.5 to 175 basis points per year based on applicable long-term credit ratings. The commitment fees, calculated on the unused portion of the lines of credit, were reduced from a range of 10 to 35 basis points per year, to a range of 7.5 to 27.5 basis points per year, also based on applicable long-term credit ratings. NSP-Minnesota, PSCo, SPS, and Xcel Energy Inc. each have the right to request an extension of the revolving termination date for two additional one-year periods. NSP-Wisconsin has the right to request an extension of the revolving termination date for an additional one-year period. All extension requests are subject to majority bank group approval. Features of the credit facilities include:
If Xcel Energy Inc. or any of its utility subsidiaries do not comply with the covenant, an event of default may be declared, and if not remedied, any outstanding amounts due under the facility can be declared due by the lender.
Long-Term Borrowings and Other Financing Instruments Generally, all real and personal property of NSP-Minnesota and NSP-Wisconsin and all real and personal property used in or in connection with the electric utility business of PSCo and SPS are subject to the liens of their first mortgage indentures. Debt premiums, discounts and expenses are amortized over the life of the related debt. The premiums, discounts and expenses associated with refinanced debt are deferred and amortized over the life of the related new issuance, in accordance with regulatory guidelines. Maturities of long-term debt are as follows:
Table of Contents
• Xcel Energy Inc. may increase its credit facility by up to $200 million, NSP-Minnesota and PSCo may each increase their credit facilities by $100 million and SPS may increase its credit facility by $50 million. The NSP-Wisconsin credit facility cannot be increased.
• Each credit facility has a financial covenant requiring that the debt-to-total capitalization ratio of each entity be less than or equal to 65 percent. Each entity was in compliance at Dec. 31, 2012 and 2011, respectively, as evidenced by the table below:
Debt-to-Total Capitalization Ratio 2012 2011 Xcel Energy 56% 55%NSP-Wisconsin 50 50 NSP-Minnesota 48 48 SPS 49 48 PSCo 45 45
• The Xcel Energy Inc. credit facility has a cross-default provision that provides Xcel Energy Inc. will be in default on its borrowings under the facility if it or any of its subsidiaries, except NSP-Wisconsin as long as its total assets do not comprise more than 15 percent of Xcel Energy’s consolidated total assets, default on certain indebtedness in an aggregate principal amount exceeding $75 million.
(Millions of Dollars) 2013 $ 258 2014 281 2015 256 2016 206 2017 388
96

Xcel Energy has entered into a Replacement Capital Covenant (RCC). Under the terms of the RCC, Xcel Energy has agreed not to redeem or repurchase all or part of the $400 million of 7.60 percent junior subordinated notes due 2068 (Junior Subordinated Notes) prior to 2038 unless qualifying securities are issued to non-affiliates in a replacement offering in the 180 days prior to the redemption or repurchase date. Qualifying securities include those that have equity-like characteristics that are the same as, or more equity-like than, the applicable characteristics of the Junior Subordinated Notes at the time of redemption or repurchase. During 2012, Xcel Energy Inc. and its utility subsidiaries completed the following financings:
During 2011, Xcel Energy Inc. and its utility subsidiaries completed the following financings:
Deferred Financing Costs — Other assets included deferred financing costs of approximately $85 million and $75 million, net of amortization, at Dec. 31, 2012 and 2011, respectively. Xcel Energy is amortizing these financing costs over the remaining maturity periods of the related debt. Capital Stock — Xcel Energy Inc. has authorized 7,000,000 shares of preferred stock with a $100 par value. At Dec. 31, 2012 and 2011, there were no shares of preferred stock outstanding. In 2011, Xcel Energy Inc. redeemed all series of its preferred stock at an aggregate purchase price of $108 million, plus accrued dividends. The redemption premium of $3.3 million and accrued dividends are reflected as reductions of Xcel Energy’s earnings available to common shareholders in the consolidated statement of income for 2011. The charters of PSCo and SPS authorize each subsidiary to issue 10 million shares of preferred stock with par values of $0.01 and $1.00 per share, respectively. However, at Dec. 31, 2012 and 2011, there were no preferred shares of subsidiaries outstanding. Xcel Energy Inc. has authorized 1,000,000,000 shares of common stock with a $2.50 par value. Outstanding shares at Dec. 31, 2012 and 2011 were 487,959,516 and 486,493,933, respectively. Dividend and Other Capital-Related Restrictions — Xcel Energy Inc.’s Articles of Incorporation place restrictions on the amount of common stock dividends it can pay when preferred stock is outstanding. As there was no preferred stock outstanding at Dec. 31, 2012, the restrictions did not place any effective limit on Xcel Energy Inc.’s ability to pay dividends. Xcel Energy depends on its subsidiaries to pay dividends. All of Xcel Energy Inc.’s utility subsidiaries’ dividends are subject to the FERC’s jurisdiction under the Federal Power Act, which prohibits the payment of dividends out of capital accounts; payment of dividends is allowed out of retained earnings only. Due to certain restrictive covenants, Xcel Energy Inc. is required to be current on particular interest payments before dividends can be paid. As discussed below, the most restrictive dividend limitations for NSP-Minnesota, NSP-Wisconsin and SPS are imposed by their respective state regulatory commission. PSCo’s most restrictive dividend limitation is imposed by its credit facility, which requires that the debt-to-total capitalization ratio be less than or equal to 65 percent. NSP-Minnesota’s first mortgage indenture places certain restrictions on the amount of cash dividends it can pay to Xcel Energy Inc., the holder of its common stock. Even with these restrictions, NSP-Minnesota could have paid more than $1.3 billion and $1.2 billion in additional cash dividends to Xcel Energy Inc. at Dec. 31, 2012 and 2011, respectively.
Table of Contents
• In June 2012, SPS issued an additional $100 million of its 4.50 percent first mortgage bonds due Aug. 15, 2041. Including the $200 million of this series previously issued in August 2011, total principal outstanding for this series is $300 million.
• In August 2012, NSP-Minnesota issued $300 million of 2.15 percent first mortgage bonds due Aug. 15, 2022, and $500 million of 3.40 percent first mortgage bonds due Aug. 15, 2042.
• In September 2012, PSCo issued $300 million of 2.25 percent first mortgage bonds due Sept. 15, 2022, and $500 million of 3.60 percent first mortgage bonds due Sept. 15, 2042.
• In October 2012, NSP-Wisconsin issued $100 million of 3.70 percent first mortgage bonds due Oct. 1, 2042.
• In September 2011, Xcel Energy Inc. issued $250 million of 4.80 percent senior unsecured notes due Sept. 15, 2041. • In August 2011, PSCo issued $250 million of 4.75 percent first mortgage bonds due Aug. 15, 2041. • In August 2011, SPS issued $200 million of 4.50 percent first mortgage bonds due Aug. 15, 2041.
97

NSP-Minnesota’s state regulatory commissions indirectly limit the amount of dividends NSP-Minnesota can pay by requiring an equity-to-total capitalization ratio between 47.07 percent and 57.53 percent. NSP-Minnesota’s equity-to-total capitalization ratio was 52.1 percent at Dec. 31, 2012. Total capitalization for NSP-Minnesota was $7.75 billion at Dec. 31, 2012, which did not exceed the limit of $8.25 billion. NSP-Wisconsin cannot pay annual dividends in excess of approximately $31.8 million if its calendar year average equity-to-total capitalization ratio is or falls below the state commission authorized level of 52.5 percent. NSP-Wisconsin’s calendar year average equity-to-total capitalization ratio was 52.6 percent at Dec. 31, 2012. SPS’ state regulatory commissions indirectly limit the amount of dividends that SPS can pay Xcel Energy Inc. by requiring an equity-to-total capitalization ratio (excluding short-term debt) between 45.0 percent and 55.0 percent. In addition, SPS may not pay a dividend that would cause it to lose its investment grade bond rating. SPS’ equity-to-total capitalization ratio (excluding short-term debt) was 51.6 percent at Dec. 31, 2012. The issuance of securities by Xcel Energy Inc. generally is not subject to regulatory approval. However, utility financings and certain intra-system financings are subject to the jurisdiction of the applicable state regulatory commissions and/or the FERC under the Federal Power Act.
Xcel Energy believes these authorizations are adequate and will seek additional authorization when necessary; however, there can be no assurance that additional authorization will be granted on the timeframe or in the amounts requested. 5. Joint Ownership of Generation, Transmission and Gas Facilities Following are the investments by Xcel Energy Inc.’s utility subsidiaries in jointly owned generation, transmission and gas facilities and the related ownership percentages as of Dec. 31, 2012:
Table of Contents
• PSCo currently has authorization to issue up to an additional $350 million of long-term debt and up to $800 million of short-term debt. • SPS currently has authorization to issue up to an additional $200 million of long term debt and up to $400 million of short-term debt. • NSP-Wisconsin currently has authorization to issue up to an additional $50 million of long-term debt and up to $150 million of short-term debt. • NSP-Minnesota has authorization to issue long-term securities provided the equity-to-total capitalization ratio remains between 47.07 percent and
57.53 percent and to issue short-term debt provided it does not exceed 15 percent of total capitalization. Total capitalization for NSP-Minnesota cannot exceed $8.25 billion.
Construction Plant in Accumulated Work in (Thousands of Dollars) Service Depreciation Progress Ownership % NSP-Minnesota Electric Generation:
Sherco Unit 3 $ 572,357 $ 367,703 $ 14,753 59.0%Sherco Common Facilities Units 1, 2 and 3 140,368 85,607 1,076 80.0 Sherco Substation 4,790 2,743 - 59.0
Electric Transmission: Grand Meadow Line and Substation 11,204 1,086 - 50.0 CapX2020 Transmission 254,905 57,334 214,412 55.0
Total NSP-Minnesota $ 983,624 $ 514,473 $ 230,241
Construction Plant in Accumulated Work in (Thousands of Dollars) Service Depreciation Progress Ownership % NSP-Wisconsin Electric Transmission:
CapX2020 Transmission $ 9,630 $ 4,689 $ 1,235 76.6%Total NSP-Wisconsin $ 9,630 $ 4,689 $ 1,235
98

NSP-Minnesota and PSCo have approximately 500 MW and 830 MW of jointly owned generating capacity, respectively. NSP-Minnesota’s and PSCo’s share of operating expenses and construction expenditures are included in the applicable utility accounts. Each of the respective owners is responsible for providing its own financing. NSP-Minnesota is part owner of Sherco Unit 3, an 860 MW, coal – fueled electric generating unit. NSP-Minnesota is the operating agent under the joint ownership agreement. In November 2011, Sherco Unit 3 experienced a significant failure of its turbine, generator, and exciter systems. Repairs to Sherco Unit 3 are expected to be substantially complete in 2013, followed by an extended period of commissioning and testing. NSP-Minnesota maintains insurance policies for the entire unit, inclusive of the other joint owner’s proportionate share. Replacement and repair of damaged systems, and other significant costs of the failure in excess of a $1.5 million deductible are expected to be recovered through these insurance policies. For its proportionate share of expenditures in excess of insurance recoveries for components of the jointly owned facility, NSP-Minnesota will recognize additions to property, plant and equipment and O&M. Sherco Units 1 and 2, wholly owned by NSP-Minnesota, continue to operate. 6. Income Taxes American Taxpayer Relief Act of 2012 — On Jan. 2, 2013, President Obama signed into law the American Taxpayer Relief Act of 2012 (the “Act”). The Act provides for the following:
Because a change in tax law is accounted for in the period of enactment, the accounting related to the Act, including the provisions related to 2012, will be recorded beginning in the first quarter of 2013. Xcel Energy estimates that an R&E benefit of $4 million will be recorded in the first quarter of 2013. Additionally, Xcel Energy expects the Act’s extension of R&E through 2013 will reduce Xcel Energy’s 2013 estimated annual ETR by approximately 0.4 percent. Prescription drug tax benefit — In the third quarter of 2012, Xcel Energy implemented a tax strategy related to the allocation of funding of Xcel Energy’s retiree prescription drug plan. This strategy restored a portion of the tax benefit associated with federal subsidies for prescription drug plans that had been accrued since 2004 and was expensed in 2010. As a result, Xcel Energy recognized approximately $17 million of income tax benefit.
Table of Contents
Construction Plant in Accumulated Work in (Thousands of Dollars) Service Depreciation Progress Ownership % PSCo Electric Generation:
Hayden Unit 1 $ 94,977 $ 61,576 $ - 75.5%Hayden Unit 2 119,752 55,806 258 37.4 Hayden Common Facilities 34,876 15,132 162 53.1 Craig Units 1 and 2 56,091 33,800 1,507 9.7 Craig Common Facilities 1, 2 and 3 35,921 16,655 510 6.5 - 9.7 Comanche Unit 3 875,745 46,609 890 66.7 Comanche Common Facilities 17,127 401 573 82.0
Electric Transmission: Transmission and other facilities, including substations 149,624 58,657 1,759 Various
Gas Transportation: Rifle to Avon 16,278 6,324 - 60.0
Total PSCo $ 1,400,391 $ 294,960 $ 5,659
• The top tax rate for dividends increased from 15 percent to 20 percent. The 20 percent dividend rate is now linked with the tax rates for capital gains; • The research and experimentation (R&E) credit was extended for 2012 and 2013; • PTCs were extended for projects that begin construction before the end of 2013; and • 50 percent bonus depreciation was extended one year through 2013. Additionally, some longer production period property placed in service in 2014 is
also eligible for 50 percent bonus depreciation.
99

Medicare Part D — In March 2010, the Patient Protection and Affordable Care Act was signed into law. The law includes provisions to generate tax revenue to help offset the cost of the new legislation. One of these provisions reduces the deductibility of retiree health care costs to the extent of federal subsidies received by plan sponsors that provide retiree prescription drug benefits equivalent to Medicare Part D coverage, beginning in 2013. Xcel Energy expensed approximately $17 million of previously recognized tax benefits relating to the federal subsidies during the first quarter of 2010. Federal Audit — Xcel Energy files a consolidated federal income tax return. The statute of limitations applicable to Xcel Energy’s 2008 federal income tax return expired in September 2012. The statute of limitations applicable to Xcel Energy’s 2009 federal income tax return expires in September 2013. In the third quarter of 2012, the IRS commenced an examination of tax years 2010 and 2011. As of Dec. 31, 2012, the IRS had not proposed any material adjustments to tax years 2010 and 2011. State Audits— Xcel Energy files consolidated state tax returns based on income in its major operating jurisdictions of Colorado, Minnesota, Texas, and Wisconsin, and various other state income-based tax returns. As of Dec. 31, 2012, Xcel Energy’s earliest open tax years that are subject to examination by state taxing authorities in its major operating jurisdictions were as follows:
In the fourth quarter of 2012, the state of Colorado commenced an examination of tax years 2006 through 2009. As of Dec. 31, 2012, no material adjustments had been proposed for these years. As of Dec. 31, 2012, there were no other state income tax audits in progress. Unrecognized Tax Benefits —The unrecognized tax benefit balance includes permanent tax positions, which if recognized would affect the annual ETR. In addition, the unrecognized tax benefit balance includes temporary tax positions for which the ultimate deductibility is highly certain but for which there is uncertainty about the timing of such deductibility. A change in the period of deductibility would not affect the ETR but would accelerate the payment of cash to the taxing authority to an earlier period. A reconciliation of the amount of unrecognized tax benefit is as follows:
A reconciliation of the beginning and ending amount of unrecognized tax benefit is as follows:
The unrecognized tax benefit amounts were reduced by the tax benefits associated with NOL and tax credit carryforwards. The amounts of tax benefits associated with NOL and tax credit carryforwards are as follows:
Table of Contents
State Year Colorado 2006 Minnesota 2008 Texas 2008 Wisconsin 2008
(Millions of Dollars) Dec. 31, 2012 Dec. 31, 2011 Unrecognized tax benefit - Permanent tax positions $ 4.7 $ 4.3 Unrecognized tax benefit - Temporary tax positions 29.8 30.4
Total unrecognized tax benefit $ 34.5 $ 34.7
(Millions of Dollars) 2012 2011 2010 Balance at Jan. 1 $ 34.7 $ 40.5 $ 30.3 Additions based on tax positions related to the current year - continuing operations 5.2 11.9 13.4 Reductions based on tax positions related to the current year - continuing operations (5.7) (1.9) (0.6)Additions for tax positions of prior years - continuing operations 9.6 14.0 5.5 Reductions for tax positions of prior years - continuing operations (9.3) (2.4) (1.8)Reductions for tax positions of prior years - discontinued operations - - (6.3)Settlements with taxing authorities - continuing operations - (27.3) - Lapse of applicable statutes of limitations - continuing operations - (0.1) - Balance at Dec. 31 $ 34.5 $ 34.7 $ 40.5
(Millions of Dollars) Dec. 31, 2012 Dec. 31, 2011 NOL and tax credit carryforwards $ (33.5) $ (33.6)
100

It is reasonably possible that Xcel Energy’s amount of unrecognized tax benefits could significantly change in the next 12 months as the IRS audit progresses and state audits resume. At this time, due to the uncertain nature of the audit process, an overall range of possible change cannot be reasonably estimated. The payable for interest related to unrecognized tax benefits is partially offset by the interest benefit associated with NOL and tax credit carryforwards. The payables for interest related to unrecognized tax benefits at Dec. 31, 2012, 2011, and 2010 were not material. No amounts were accrued for penalties related to unrecognized tax benefits as of Dec. 31, 2012, 2011 or 2010. Federal Tax Loss Carryback Claims — Xcel Energy completed an analysis in the first quarter of 2012 on the eligibility of certain expenses that qualified for an extended carryback beyond the typical two-year carryback period. As a result of a higher tax rate in prior years, Xcel Energy recognized a discrete tax benefit of approximately $15 million in the first quarter of 2012. Other Income Tax Matters — NOL amounts represent the amount of the tax loss that is carried forward and tax credits represent the deferred tax asset. NOL and tax credit carryforwards as of Dec. 31 were as follows:
The federal carryforward periods expire between 2021 and 2032. The state carryforward periods expire between 2014 and 2031. Total income tax expense from continuing operations differs from the amount computed by applying the statutory federal income tax rate to income before income tax expense. The following reconciles such differences for the years ending Dec. 31:
Table of Contents
(Millions of Dollars) 2012 2011 Federal NOL carryforward $ 969 $ 1,710 Federal tax credit carryforwards 257 232 State NOL carryforwards 1,465 1,707 Valuation allowances for state NOL carryforwards (52) (51)State tax credit carryforwards, net of federal detriment (a) 17 22 Valuation allowances for state tax credit carryforwards, net of federal benefit - (2)
(a) State tax credit carryforwards are net of federal detriment of $9 million and $12 million as of Dec. 31, 2012 and 2011, respectively.
2012 2011 2010 Federal statutory rate 35.0 % 35.0 % 35.0 %Increases (decreases) in tax from:
Tax credits recognized, net of federal income tax expense (2.2) (2.6) (1.8)Prescription drug tax benefit and Medicare Part D (1.2) - 1.4 NOL carryback (1.1) - - Regulatory differences — utility plant items (1.0) (0.8) (1.1)Life insurance policies (0.1) (0.1) (0.8)State income taxes, net of federal income tax benefit 4.0 4.3 3.9 Change in unrecognized tax benefits - (0.1) 0.1 Other, net (0.2) 0.1 -
Effective income tax rate from continuing operations 33.2 % 35.8 % 36.7 %
101

The components of Xcel Energy’s income tax expense for the years ending Dec. 31 were:
The components of deferred income tax expense for the years ending Dec. 31 were:
The components of Xcel Energy’s net deferred tax liability (current and noncurrent) at Dec. 31 were as follows:
7. Earnings Per Share Basic EPS was computed by dividing the earnings available to Xcel Energy Inc.’s common shareholders by the weighted average number of common shares outstanding during the period. Diluted EPS was computed by dividing the earnings available to Xcel Energy Inc.’s common shareholders by the diluted weighted average number of common shares outstanding during the period. Diluted EPS reflects the potential dilution that could occur if securities or other agreements to issue common stock (i.e., common stock equivalents) were settled. The weighted average number of potentially dilutive shares outstanding used to calculate Xcel Energy Inc.’s diluted EPS is calculated based on the treasury stock method.
Table of Contents
(Thousands of Dollars) 2012 2011 2010 Current federal tax expense $ 7,876 $ 3,399 $ 16,657 Current state tax expense 31,478 9,971 11,636 Current change in unrecognized tax benefits (1,704) (8,266) (2,982)Deferred federal tax expense 366,409 383,931 362,393 Deferred state tax expense 50,741 78,770 50,643 Deferred change in unrecognized tax expense 2,013 6,705 4,641 Deferred investment tax credits (6,610) (6,194) (6,353)
Total income tax expense from continuing operations $ 450,203 $ 468,316 $ 436,635
(Thousands of Dollars) 2012 2011 2010 Deferred tax expense excluding items below $ 559,860 $ 446,893 $ 461,748 Tax benefit allocated to other comprehensive income 12,102 26,798 2,535 Amortization and adjustments to deferred income taxes on income tax
regulatory assets and liabilities (63,862) (7,108) (49,679)Other (6) (16) (144)
Deferred tax expense $ 508,094 $ 466,567 $ 414,460
(Thousands of Dollars) 2012 2011 Deferred tax liabilities:
Differences between book and tax bases of property $ 4,867,142 $ 4,558,951 Regulatory assets 293,367 253,162 Other 220,781 279,162
Total deferred tax liabilities $ 5,381,290 $ 5,091,275 Deferred tax assets:
NOL carryforward $ 430,765 $ 696,435 Tax credit carryforward 273,776 254,157 Unbilled revenue - fuel costs 60,068 73,912 Environmental remediation 44,549 45,551 Deferred investment tax credits 35,767 37,425 Regulatory liabilities 34,471 37,012 Rate refund 8,109 37,443 Other 95,308 73,092 NOL and tax credit valuation allowances (3,314) (5,683)
Total deferred tax assets $ 979,499 $ 1,249,344 Net deferred tax liability $ 4,401,791 $ 3,841,931
102

Common Stock Equivalents — Xcel Energy Inc. currently has common stock equivalents consisting of 401(k) equity awards. In 2010, Xcel Energy Inc. also had equity forward instruments outstanding. Share-Based Compensation Common stock equivalents related to share-based compensation causing dilutive impact to EPS include commitments to issue common stock as an employer match to 401(k) plan participants. Stock equivalent units granted to Xcel Energy Inc.’s Board of Directors are included in common shares outstanding upon grant date as there is no further service, performance or market condition associated with these awards. Restricted stock, granted to settle amounts due certain employees under the Xcel Energy Inc. Executive Annual Incentive Award Plan, is included in common shares outstanding when granted, pending remaining service conditions. Share-based compensation arrangements for which there is currently no dilutive impact to EPS include the following:
Equity Forward Agreements In August 2010, Xcel Energy Inc. entered into equity forward agreements in connection with a public offering of 21.85 million shares of its common stock. Under the equity forward agreements (Forward Agreements), Xcel Energy Inc. agreed to issue to the banking counterparty 21.85 million shares of its common stock. The equity forward instruments were accounted for as equity and recorded at fair value at the execution of the Forward Agreements, and were not subsequently adjusted for changes in fair value until settlement. Based upon the market terms of the equity forward instruments, including initial pricing of $20.855 per share based on the August 2010 offering price of Xcel Energy Inc.’s common stock of $21.50 per share less underwriting fees of $0.645 per share, and as no premium on the transaction was owed either party to the Forward Agreements at execution, no fair value was recorded to equity for the instruments when the Forward Agreements were entered. The Forward Agreements settled on Nov. 29, 2010 and the proceeds of $449.8 million were recorded to common stock and additional paid in capital. The dilutive impact of common stock equivalents affecting EPS was as follows for the years ended Dec. 31:
No stock options were outstanding during 2012. In 2011 and 2010, Xcel Energy Inc. had approximately 2.1 million and 5.4 million weighted average options outstanding, respectively, that were antidilutive, and therefore, excluded from the EPS calculation.
Table of Contents
• RSU equity awards subject to a performance condition; included in common shares outstanding when all necessary conditions for settlement have been satisfied by the end of the reporting period.
• PSP liability awards subject to a performance condition; any portions settled in shares are included in common shares outstanding upon settlement.
2012 2011 2010 Per Per Per (Amounts in thousands, Share Share Share except per share data) Income Shares Amount Income Shares Amount Income Shares Amount Net income $ 905,229 $ 841,172 $ 755,834 Less: Dividend requirements
on preferred stock - (3,534) (4,241) Less: Premium on redemption
of preferred stock - (3,260) - Basic earnings per share: Earnings available to common
shareholders 905,229 487,899 $ 1.86 834,378 485,039 $ 1.72 751,593 462,052 $ 1.63 Effect of dilutive securities:
Equity forward instruments - - - - - 700 401(k) equity awards - 535 - 576 - 639
Diluted earnings per share: Earnings available to common
shareholders $ 905,229 488,434 $ 1.85 $ 834,378 485,615 $ 1.72 $ 751,593 463,391 $ 1.62
103

Share Repurchase — In February 2012, Xcel Energy Inc.’s Board of Directors approved the repurchase of up to 0.7 million shares of common stock for the issuance of shares in connection with the vesting of awards under the Xcel Energy Inc. 2005 Long-Term Incentive Plan. In March 2012, Xcel Energy Inc. repurchased the approved 0.7 million shares in the open market at an average price of $26.42 per share. In addition, approximately 0.9 million shares of common stock were purchased in February 2012 through an agent independent of Xcel Energy to fulfill requirements for the employer match pursuant to the Xcel Energy 401(k) Savings Plan; the New Century Energies, Inc. Employees’ Savings and Stock Ownership Plan for Bargaining Unit Employees and Former Non-Bargaining Unit Employees; and the New Century Energies, Inc. Employee Investment Plan for Bargaining Unit Employees and Non-Bargaining Employees. 8. Share-Based Compensation Stock Options — Xcel Energy Inc. has incentive compensation plans under which stock options and other performance incentives are awarded to key employees. Xcel Energy Inc. has not granted stock options since December 2001. There were no stock options outstanding and no stock option activity during 2012. Activity in stock options for 2011 and 2010 was as follows:
The total market value and the total intrinsic value of stock options exercised were as follows for the years ended Dec. 31:
Cash received from stock options exercised and the actual tax benefit realized for the tax deductions from stock options exercised during the years ended Dec. 31 were as follows:
Restricted Stock — Certain employees may elect to receive shares of common or restricted stock under the Xcel Energy Inc. Executive Annual Incentive Award Plan. Restricted stock vests and settles in equal annual installments over a three-year period. Xcel Energy Inc. reinvests dividends on the restricted stock it holds while restrictions are in place. Restrictions also apply to the additional shares of restricted stock acquired through dividend reinvestment. If the restricted shares are forfeited, the employee is not entitled to the dividends on those shares. Restricted stock has a fair value equal to the market trading price of Xcel Energy Inc.’s stock at the grant date. Xcel Energy Inc. granted shares of restricted stock for the years ended Dec. 31 as follows:
Table of Contents
2011 2010 Average Average Exercise Exercise (Awards in Thousands) Awards Price Awards Price Outstanding and exercisable at Jan. 1 2,498 $ 30.42 6,657 $ 28.17 Exercised (1,173) 25.90 (51) 19.31 Expired (1,325) 34.42 (4,108) 26.91 Outstanding and exercisable at Dec. 31 - - 2,498 30.42
(Thousands of Dollars) 2011 2010 Market value of exercises $ 30,761 $ 1,087 Intrinsic value of options exercised (a) 380 93
(a) Intrinsic value is calculated as market price at exercise date less the option exercise price.
(Thousands of Dollars) 2011 2010 Cash received from stock options exercised $ 30,381 $ 1,033 Tax benefit realized for the tax deductions from stock options exercised 157 40
(Shares in Thousands) 2012 2011 2010 Granted shares 33 15 44 Grant date fair value $ 26.43 $ 23.62 $ 20.47
104

A summary of the changes of nonvested restricted stock for the year ended 2012 were as follows:
Restricted Stock Units — Xcel Energy Inc.’s Board of Directors has granted RSUs under the Xcel Energy Inc. 2005 Long-term Incentive Plan (as amended and restated in 2010). The plan allows the attachment of various performance goals to the RSUs granted. The performance goals may vary by plan year. At the end of the restricted performance period, the grants will be awarded if the performance goals are met. If the goals are not achieved by the end of the restricted performance period, all associated RSUs and dividend equivalents are forfeited. For RSUs issued in 2010, if the performance criteria have not been met within four years of the grant date, all RSUs, plus associated dividend equivalents, shall be forfeited. The performance conditions for RSUs granted in 2011 and 2012 will be measured three years after the grant date, at which time the RSUs, plus associated dividend equivalents, will either be settled or forfeited. Payout of the RSUs and the lapsing of restrictions on the transfer of units are based on one of two separate performance criteria. The performance conditions for a portion of the awarded units are based on EPS growth, with an additional condition that Xcel Energy Inc.’s annual dividend paid on its common stock remains at a specified amount per share or greater. RSUs issued in 2011 and 2012, plus associated dividend equivalents, will be settled or forfeited and the restricted period will lapse after three years, with potential payouts ranging from 0 percent to 150 percent, depending on the level of EPS growth. The performance conditions for the remaining awarded units are based on environmental performance. RSUs issued in 2011 and 2012, plus associated dividend equivalents, will be settled or forfeited and the restricted period will lapse after three years with potential payouts ranging from 0 percent to 150 percent, depending on the level of environmental performance, based on established indicators. The 2007 RSUs measured on EPS growth and all 2008 RSUs met their targets as of Dec. 31, 2010 and were settled in shares in February 2011. The 2010 RSUs measured on EPS growth and all 2009 RSUs met their targets as of Dec. 31, 2011, and were settled in shares in February 2012. The 2010 environmental RSUs met their targets as of Dec. 31, 2012 and will be settled in shares in February 2013. The RSUs granted for the years ended Dec. 31 were as follows:
A summary of the changes of nonvested RSUs for the year ended 2012, were as follows:
The total fair value of nonvested RSUs as of Dec. 31, 2012 was $30.9 million and the weighted average remaining contractual life was 1.7 years.
Table of Contents
(Shares in Thousands) Shares Weighted Average
Grant Date Fair Value Nonvested restricted stock at Jan. 1, 2012 47 $ 21.36 Granted 33 26.43 Forfeited (7) 20.47 Vested (21) 21.22 Dividend equivalents 2 27.78 Nonvested restricted stock at Dec. 31, 2012 54 24.85
(Units in Thousands) 2012 2011 2010 Granted units 591 828 601 Weighted average grant date fair value $ 27.35 $ 23.63 $ 21.26
(Units in Thousands) Units
Weighted Average
Grant Date Fair Value
Nonvested restricted stock units at Jan. 1, 2012 673 $ 23.46 Granted 591 27.35 Forfeited (105) 25.26 Vested (46) 21.57 Dividend equivalents 42 24.95 Nonvested restricted stock units at Dec. 31, 2012 1,155 25.41
105

Approximately 0.1 million RSUs vested during 2012 at a total fair value of $1.2 million. Approximately 1.1 million RSUs vested during 2011 at a total fair value of $30.1 million. Approximately 0.6 million RSUs vested during 2010 at a total fair value of $14.8 million. Stock Equivalent Unit Plan — Non-employee members of the Xcel Energy Inc. Board of Directors receive annual awards of stock equivalent units, with each unit having a value equal to one share of Xcel Energy Inc. common stock. The annual grants are vested as of the date of each member’s election to the board of directors; there is no further service or other condition attached to the annual grants after the member has been elected to the board. Additionally, directors may elect to receive their fees in stock equivalent units in lieu of cash, and similarly have no further service or other conditions attached. Dividends on Xcel Energy Inc.’s common stock are converted to stock equivalent units and granted based on the number of stock equivalent units held by each participant as of the dividend date. The stock equivalent units are payable as a distribution of Xcel Energy Inc.’s common stock upon a director’s termination of service. The stock equivalent units granted for the years ended Dec. 31 were as follows:
A summary of the stock equivalent unit changes for the year ended 2012 are as follows:
PSP Awards — Xcel Energy Inc.’s Board of Directors has granted PSP awards under the Xcel Energy Inc. 2005 Long-term Incentive Plan (as amended and restated effective in 2010). The plan allows Xcel Energy to attach various performance goals to the PSP awards granted. The PSP awards have been historically dependent on a single measure of performance, Xcel Energy Inc.’s TSR measured over a three-year period. Xcel Energy Inc.’s TSR is compared to the TSR of other companies in the EEI Investor-Owned Electrics index. At the end of the three-year period, potential payouts of the PSP awards range from 0 percent to 200 percent, depending on Xcel Energy Inc.’s TSR compared to the peer group. The PSP awards granted for the years ended Dec. 31 were as follows:
The total amounts of performance awards settled during the years ended Dec. 31 were as follows:
The amount of cash used to settle Xcel Energy’s PSP awards was $3.8 million, $3.6 million and $2.7 million in 2012, 2011 and 2010, respectively. Share-Based Compensation Expense — The vesting of the RSUs is predicated on the achievement of a performance condition, which is the achievement of an EPS or environmental measures target. RSU awards and restricted stock are considered to be equity awards, since the plan settlement determination (shares or cash) resides with Xcel Energy and not the participants. In addition, these awards have not been previously settled in cash and Xcel Energy plans to continue electing share settlement. The grant date fair value of RSUs and restricted stock is expensed as employees vest in their rights to those awards.
Table of Contents
(Units in Thousands) 2012 2011 2010 Granted units 65 60 66 Grant date fair value $ 27.41 $ 25.12 $ 21.14
(Units in Thousands) Units
Weighted Average
Grant Date Fair Value
Stock equivalent units at Jan. 1, 2012 522 $ 20.65 Granted 65 27.41 Units distributed (30) 19.82 Dividend equivalents 20 27.59 Stock equivalent units at Dec. 31, 2012 577 21.71
(In Thousands) 2012 2011 2010 Awards granted 161 311 225
(In Thousands) 2012 2011 2010 Awards settled 286 305 267 Settlement amount (cash and common stock) $ 7,554 $ 7,200 $ 5,460
106

The PSP awards have been historically settled partially in cash, and therefore, do not qualify as an equity award, but rather are accounted for as a liability award. As liability awards, the fair value on which ratable expense is based, as employees vest in their rights to those awards, is remeasured each period based on the current stock price and performance conditions, and final expense is based on the market value of the shares on the date the award is settled. The compensation costs related to share-based awards for the years ended Dec. 31 were as follows:
The maximum aggregate number of shares of common stock available for issuance under the Xcel Energy Inc. 2005 Long-term Incentive Plan (as amended and restated effective Feb. 17, 2010) is 8.3 million shares. Under the Xcel Energy Inc. Executive Annual Incentive Award Plan (as amended and restated effective Feb. 17, 2010), the total number of shares approved for issuance is 1.2 million shares. As of Dec. 31, 2012 and 2011, there was approximately $15.3 million and $15.4 million, respectively, of total unrecognized compensation cost related to nonvested share-based compensation awards. Xcel Energy expects to recognize that cost over a weighted average period of 1.7 years. 9. Benefit Plans and Other Postretirement Benefits Xcel Energy offers various benefit plans to its employees. Approximately 50 percent of employees that receive benefits are represented by several local labor unions under several collective-bargaining agreements. At Dec. 31, 2012:
The plans invest in various instruments which are disclosed under the accounting guidance for fair value measurements which establishes a hierarchical framework for disclosing the observability of the inputs utilized in measuring fair value. The three levels in the hierarchy and examples of each level are as follows:
Level 1 — Quoted prices are available in active markets for identical assets as of the reporting date. The types of assets included in Level 1 are highly liquid and actively traded instruments with quoted prices, such as common stocks listed by the New York Stock Exchange.
Level 2 — Pricing inputs are other than quoted prices in active markets, but are either directly or indirectly observable as of the reporting date. The types of assets included in Level 2 are typically either comparable to actively traded securities or contracts, or priced with models using highly observable inputs, such as corporate bonds with pricing based on market interest rate curves and recent trades of similarly rated securities.
Level 3 — Significant inputs to pricing have little or no observability as of the reporting date. The types of assets included in Level 3 are those with inputs requiring significant management judgment or estimation.
Table of Contents
(Thousands of Dollars) 2012 2011 2010 Compensation cost for share-based awards (a) (b) $ 26,970 $ 45,006 $ 35,807 Tax benefit recognized in income 10,513 17,559 13,964 Capitalized compensation cost for share-based awards 4,270 3,857 3,646
(a) Compensation costs for share-based payment arrangements is included in O&M expense in the consolidated statements of income. (b) Included in compensation cost for share-based awards are matching contributions related to the Xcel Energy 401(k) plan, which totaled $22.2 million, $21.6 million and $20.7
million for the years ended 2012, 2011 and 2010, respectively.
• NSP-Minnesota had 1,996 and NSP-Wisconsin had 405 bargaining employees covered under a collective-bargaining agreement, which expires at the end of 2013. NSP-Minnesota also had an additional 228 nuclear operation bargaining employees covered under several collective-bargaining agreements, which expire at various dates in 2013 and 2014.
• PSCo had 2,011 bargaining employees covered under a collective-bargaining agreement, which expires in May 2014. • SPS had 836 bargaining employees covered under a collective-bargaining agreement, which expires in October 2014.
107

Pension Benefits Xcel Energy has several noncontributory, defined benefit pension plans that cover almost all employees. Benefits are based on a combination of years of service, the employee’s average pay and social security benefits. Xcel Energy’s policy is to fully fund into an external trust the actuarially determined pension costs recognized for ratemaking and financial reporting purposes, subject to the limitations of applicable employee benefit and tax laws. In addition to the qualified pension plans, Xcel Energy maintains a supplemental executive retirement plan (SERP) and a nonqualified pension plan. The SERP is maintained for certain executives that were participants in the plan in 2008, when the SERP was closed to new participants. The nonqualified pension plan provides unfunded, nonqualified benefits for compensation that is in excess of the limits applicable to the qualified pension plans. The total obligations of the SERP and nonqualified plan as of Dec. 31, 2012 and 2011 were $39.4 million and $54.8 million, respectively. In 2012 and 2011, Xcel Energy recognized net benefit cost for financial reporting for the SERP and nonqualified plans of $15.6 million and $5.7 million, respectively. Benefits for these unfunded plans are paid out of Xcel Energy’s consolidated operating cash flows. Xcel Energy bases the investment-return assumption on expected long-term performance for each of the investment types included in its pension asset portfolio. Xcel Energy considers the historical returns achieved by its asset portfolio over the past 20-year or longer period, as well as the long-term return levels projected and recommended by investment experts. The pension cost determination assumes a forecasted mix of investment types over the long term. Investment returns were above the assumed levels of 7.10, 7.50 and 7.79 percent in 2012, 2011 and 2010, respectively. Xcel Energy continually reviews its pension assumptions. In 2013, Xcel Energy’s expected investment return assumption is 6.88 percent. The assets are invested in a portfolio according to Xcel Energy’s return, liquidity and diversification objectives to provide a source of funding for plan obligations and minimize the necessity of contributions to the plan, within appropriate levels of risk. The principal mechanism for achieving these objectives is the projected allocation of assets to selected asset classes, given the long-term risk, return, and liquidity characteristics of each particular asset class. There were no significant concentrations of risk in any particular industry, index, or entity. Market volatility can impact even well-diversified portfolios and significantly affect the return levels achieved by pension assets in any year. The following table presents the target pension asset allocations for Xcel Energy:
Xcel Energy’s ongoing investment strategy is based on plan-specific investment recommendations that seek to minimize potential investment and interest rate risk as a plan’s funded status increases over time. The investment recommendations result in a greater percentage of long-duration fixed income securities being allocated to specific plans having relatively higher funded status ratios, and a greater percentage of growth assets being allocated to plans having relatively lower funded status ratios. The aggregate projected asset allocation presented in the table above for the master pension trust results from the plan-specific strategies.
Table of Contents
2012 2011 Domestic and international equity securities 25 % 27 %Long-duration fixed income securities 40 31 Short-to-intermediate fixed income securities 10 12 Alternative investments 23 27 Cash 2 3
Total 100 % 100 %
108

Pension Plan Assets The following tables present, for each of the fair value hierarchy levels, Xcel Energy’s pension plan assets that are measured at fair value as of Dec. 31, 2012 and 2011:
The following tables present the changes in Xcel Energy’s Level 3 pension plan assets for the years ended Dec. 31, 2012, 2011 and 2010:
Table of Contents
Dec. 31, 2012 (Thousands of Dollars) Level 1 Level 2 Level 3 Total Cash equivalents $ 164,096 $ - $ - $ 164,096 Derivatives - 12,955 - 12,955 Government securities - 298,141 - 298,141 Corporate bonds - 622,597 - 622,597 Asset-backed securities - - 14,639 14,639 Mortgage-backed securities - - 39,904 39,904 Common stock 73,247 - - 73,247 Private equity investments - - 158,498 158,498 Commingled funds - 1,524,563 - 1,524,563 Real estate - - 64,597 64,597 Securities lending collateral obligation and other - (29,454) - (29,454)
Total $ 237,343 $ 2,428,802 $ 277,638 $ 2,943,783
Dec. 31, 2011 (Thousands of Dollars) Level 1 Level 2 Level 3 Total Cash equivalents $ 147,590 $ - $ - $ 147,590 Derivatives - 8,011 - 8,011 Government securities - 301,999 - 301,999 Corporate bonds - 606,001 - 606,001 Asset-backed securities - - 31,368 31,368 Mortgage-backed securities - - 73,522 73,522 Common stock 68,553 - - 68,553 Private equity investments - - 159,363 159,363 Commingled funds - 1,292,569 - 1,292,569 Real estate - - 37,106 37,106 Securities lending collateral obligation and other - (55,802) - (55,802)
Total $ 216,143 $ 2,152,778 $ 301,359 $ 2,670,280
Purchases, Net Realized Net Unrealized Issuances, and (Thousands of Dollars) Jan. 1, 2012 Gains (Losses) Gains (Losses) Settlements, Net Dec. 31, 2012 Asset-backed securities $ 31,368 $ 3,886 $ (5,363) $ (15,252) $ 14,639 Mortgage-backed securities 73,522 1,822 (2,127) (33,313) 39,904 Private equity investments 159,363 17,537 (22,587) 4,185 158,498 Real estate 37,106 19 6,048 21,424 64,597
Total $ 301,359 $ 23,264 $ (24,029) $ (22,956) $ 277,638
109

Benefit Obligations — A comparison of the actuarially computed pension benefit obligation and plan assets for Xcel Energy is presented in the following table:
Table of Contents
Purchases, Net Realized Net Unrealized Issuances, and (Thousands of Dollars) Jan. 1, 2011 Gains (Losses) Gains (Losses) Settlements, Net Dec. 31, 2011 Asset-backed securities $ 26,986 $ 2,391 $ (2,504) $ 4,495 $ 31,368 Mortgage-backed securities 113,418 1,103 (5,926) (35,073) 73,522 Private equity investments 122,223 3,971 12,412 20,757 159,363 Real estate 73,701 (629) 20,271 (56,237) 37,106
Total $ 336,328 $ 6,836 $ 24,253 $ (66,058) $ 301,359
Purchases, Net Realized Net Unrealized Issuances, and (Thousands of Dollars) Jan. 1, 2010 Gains (Losses) Gains (Losses) Settlements, Net Dec. 31, 2010 Asset-backed securities $ 47,825 $ 3,400 $ (7,078) $ (17,161) $ 26,986 Mortgage-backed securities 144,006 13,719 (19,095) (25,212) 113,418 Private equity investments 82,098 (1,008) (24) 41,157 122,223 Real estate 66,704 (1,135) 8,235 (103) 73,701
Total $ 340,633 $ 14,976 $ (17,962) $ (1,319) $ 336,328
(Thousands of Dollars) 2012 2011 Accumulated Benefit Obligation at Dec. 31 $ 3,475,154 $ 3,073,637 Change in Projected Benefit Obligation: Obligation at Jan. 1 $ 3,226,219 $ 3,030,292 Service cost 86,364 77,319 Interest cost 157,035 161,412 Plan amendments 6,240 - Actuarial loss 400,429 195,369 Benefit payments (236,757) (238,173)Obligation at Dec. 31 $ 3,639,530 $ 3,226,219
(Thousands of Dollars) 2012 2011 Change in Fair Value of Plan Assets: Fair value of plan assets at Jan. 1 $ 2,670,280 $ 2,540,708 Actual return on plan assets 312,167 230,401 Employer contributions 198,093 137,344 Benefit payments (236,757) (238,173)Fair value of plan assets at Dec. 31 $ 2,943,783 $ 2,670,280
Funded Status of Plans at Dec. 31: Funded status (a) $ (695,747) $ (555,939)
(a) Amounts are recognized in noncurrent liabilities on Xcel Energy’s consolidated balance sheets.
(Thousands of Dollars) 2012 2011 Amounts Not Yet Recognized as Components of Net Periodic Benefit Cost: Net loss $ 1,800,770 $ 1,610,946 Prior service (credit) cost (2,633) 18,432 Total $ 1,798,137 $ 1,629,378
110

Cash Flows — Cash funding requirements can be impacted by changes to actuarial assumptions, actual asset levels and other calculations prescribed by the funding requirements of income tax and other pension-related regulations. These regulations did not require cash funding for 2008 through 2010 for Xcel Energy’s pension plans. Required contributions were made in 2011 and 2012 to meet minimum funding requirements. The Pension Protection Act changed the minimum funding requirements for defined benefit pension plans beginning in 2008. The following are the pension funding contributions, both voluntary and required, made by Xcel Energy for 2011 through January 2013:
Plan Amendments — Xcel Energy amended the plan in 2012 to allow a one time transfer of a portion of qualifying obligations from the nonqualified pension plan into the qualified pension plans. Xcel Energy also modified the benefit formula for nonbargaining and some bargaining new hires beginning in 2012 to a reduced benefit level. Benefit Costs — The components of Xcel Energy’s net periodic pension cost were:
Pension costs include an expected return impact for the current year that may differ from actual investment performance in the plan. The return assumption used for 2013 pension cost calculations is 6.88 percent.
Table of Contents
(Thousands of Dollars) 2012 2011 Amounts Related to the Funded Status of the Plans Have Been Recorded as Follows Based Upon Expected Recovery in Rates: Current regulatory assets $ 115,811 $ 123,814 Noncurrent regulatory assets 1,606,524 1,435,372 Deferred income taxes 31,075 28,759 Net-of-tax accumulated other comprehensive income 44,727 41,433 Total $ 1,798,137 $ 1,629,378
Measurement date Dec. 31, 2012 Dec. 31, 2011
2012 2011 Significant Assumptions Used to Measure Benefit Obligations: Discount rate for year-end valuation 4.00 % 5.00 %Expected average long-term increase in compensation level 3.75 4.00 Mortality table RP 2000 RP 2000
• In January 2013, contributions of $191.5 million were made across four of Xcel Energy’s pension plans; • In 2012, contributions of $198.1 million were made across four of Xcel Energy’s pension plans; • In 2011, contributions of $137.3 million were made across three of Xcel Energy’s pension plans; • For future years, Xcel Energy anticipates contributions will be made as necessary.
(Thousands of Dollars) 2012 2011 2010 Service cost $ 86,364 $ 77,319 $ 73,147 Interest cost 157,035 161,412 165,010 Expected return on plan assets (207,095) (221,600) (232,318)Amortization of prior service cost 21,065 22,533 20,657 Amortization of net loss 108,982 78,510 48,315
Net periodic pension cost 166,351 118,174 74,811 Costs not recognized due to effects of regulation (39,217) (37,198) (27,027)
Net benefit cost recognized for financial reporting $ 127,134 $ 80,976 $ 47,784
2012 2011 2010 Significant Assumptions Used to Measure Costs: Discount rate 5.00 % 5.50 % 6.00 %Expected average long-term increase in compensation level 4.00 4.00 4.00 Expected average long-term rate of return on assets 7.10 7.50 7.79
111

Defined Contribution Plans Xcel Energy maintains 401(k) and other defined contribution plans that cover substantially all employees. Total contributions to these plans were approximately $28.0 million in 2012, $27.1 million in 2011 and $27.3 million in 2010. Postretirement Health Care Benefits Xcel Energy has a contributory health and welfare benefit plan that provides health care and death benefits to certain Xcel Energy retirees.
In 1993, Xcel Energy adopted accounting guidance regarding other non-pension postretirement benefits and elected to amortize the unrecognized APBO on a straight-line basis over 20 years. Regulatory agencies for nearly all of Xcel Energy’s retail and wholesale utility customers have allowed rate recovery of accrued postretirement benefit costs. The Colorado jurisdictional postretirement benefit costs deferred during the transition period were amortized to expense on a straight-line basis over the 15-year period from 1998 to 2012. PSCo transitioned to full accrual accounting for postretirement benefit costs between 1993 and 1997. Plan Assets — Certain state agencies that regulate Xcel Energy Inc.’s utility subsidiaries also have issued guidelines related to the funding of postretirement benefit costs. SPS is required to fund postretirement benefit costs for Texas and New Mexico jurisdictional amounts collected in rates and PSCo is required to fund postretirement benefit costs in irrevocable external trusts that are dedicated to the payment of these postretirement benefits. Also, a portion of the assets contributed on behalf of nonbargaining retirees has been funded into a sub-account of the Xcel Energy pension plans. These assets are invested in a manner consistent with the investment strategy for the pension plan. Xcel Energy bases its investment-return assumption for the postretirement health care fund assets on expected long-term performance for each of the investment types included in its asset portfolio. The assets are invested in a portfolio according to Xcel Energy’s return, liquidity and diversification objectives to provide a source of funding for plan obligations and minimize the necessity of contributions to the plan, within appropriate levels of risk. The principal mechanism for achieving these objectives is the projected allocation of assets to selected asset classes, given the long-term risk, return, correlation, and liquidity characteristics of each particular asset class. There were no significant concentrations of risk in any particular industry, index, or entity. Investment-return volatility is not considered to be a material factor in postretirement health care costs.
Table of Contents
• The former NSP, which includes NSP-Minnesota and NSP-Wisconsin, discontinued contributing toward health care benefits for nonbargaining employees retiring after 1998 and for bargaining employees of NSP-Minnesota and NSP-Wisconsin who retired after 1999.
• Xcel Energy discontinued contributing toward health care benefits for former NCE, which includes PSCo and SPS, nonbargaining employees retiring after June 30, 2003.
• Employees of NCE who retired in 2002 continue to receive employer-subsidized health care benefits. • Nonbargaining employees of the former NCE who retired after 1998, bargaining employees of the former NCE who retired after 1999 and nonbargaining
employees of NCE who retired after June 30, 2003, are eligible to participate in the Xcel Energy health care program with no employer subsidy.
112

The following tables present, for each of the fair value hierarchy levels, Xcel Energy’s postretirement benefit plan assets that are measured at fair value as of Dec. 31, 2012 and 2011:
The following tables present the changes in Xcel Energy’s Level 3 postretirement benefit plan assets for the years ended Dec. 31, 2012, 2011 and 2010:
Table of Contents
Dec. 31, 2012 (Thousands of Dollars) Level 1 Level 2 Level 3 Total Cash equivalents $ 91,278 $ - $ - $ 91,278 Derivatives - 4 - 4 Government securities - 73,449 - 73,449 Insurance contracts - 50,008 - 50,008 Corporate bonds - 43,810 - 43,810 Asset-backed securities - - 757 757 Mortgage-backed securities - - 39,958 39,958 Commingled funds - 228,423 - 228,423 Other - (46,845) - (46,845)
Total $ 91,278 $ 348,849 $ 40,715 $ 480,842
Dec. 31, 2011 (Thousands of Dollars) Level 1 Level 2 Level 3 Total Cash equivalents $ 58,037 $ - $ - $ 58,037 Derivatives - 13,178 - 13,178 Government securities - 65,746 - 65,746 Corporate bonds - 61,524 - 61,524 Asset-backed securities - - 7,867 7,867 Mortgage-backed securities - - 27,253 27,253 Preferred stock - 423 - 423 Common stock 351 - - 351 Private equity investments - - 479 479 Commingled funds - 202,912 - 202,912 Real estate - - 144 144 Securities lending collateral obligation and other - (11,079) - (11,079)
Total $ 58,388 $ 332,704 $ 35,743 $ 426,835
Purchases, Net Realized Net Unrealized Issuances, and (Thousands of Dollars) Jan. 1, 2012 Gains (Losses) Gains (Losses) Settlements, Net Dec. 31, 2012 Asset-backed securities $ 7,867 $ (331) $ 1,481 $ (8,260) $ 757 Mortgage-backed securities 27,253 (724) 3,301 10,128 39,958 Private equity investments 479 - (65) (414) - Real estate 144 - 35 (179) -
Total $ 35,743 $ (1,055) $ 4,752 $ 1,275 $ 40,715
113

Benefit Obligations — A comparison of the actuarially computed benefit obligation and plan assets for Xcel Energy is presented in the following table:
Table of Contents
Purchases, Net Realized Net Unrealized Issuances, and (Thousands of Dollars) Jan. 1, 2011 Gains (Losses) Gains (Losses) Settlements, Net Dec. 31, 2011 Asset-backed securities $ 2,585 $ (10) $ (664) $ 5,956 $ 7,867 Mortgage-backed securities 19,212 (1,669) 2,623 7,087 27,253 Private equity investments - 12 53 414 479 Real estate - (2) (34) 180 144
Total $ 21,797 $ (1,669) $ 1,978 $ 13,637 $ 35,743
Purchases, Net Realized Net Unrealized Issuances, and (Thousands of Dollars) Jan. 1, 2010 Gains (Losses) Gains (Losses) Settlements, Net Dec. 31, 2010 Asset-backed securities $ 8,293 $ (259) $ 2,073 $ (7,522) $ 2,585 Mortgage-backed securities 47,078 (927) 15,642 (42,581) 19,212
Total $ 55,371 $ (1,186) $ 17,715 $ (50,103) $ 21,797
(Thousands of Dollars) 2012 2011 Change in Projected Benefit Obligation: Obligation at Jan. 1 $ 776,847 $ 794,905 Service cost 4,203 4,824 Interest cost 37,861 42,086 Medicare subsidy reimbursements 3,741 3,518 Early Retiree Reinsurance Program proceeds shared with retirees - 4,269 Plan amendments (41,128) (26,630)Plan participants’ contributions 14,241 15,690 Actuarial loss 119,949 8,823 Benefit payments (63,762) (70,638)Obligation at Dec. 31 $ 851,952 $ 776,847
(Thousands of Dollars) 2012 2011 Change in Fair Value of Plan Assets: Fair value of plan assets at Jan. 1 $ 426,835 $ 432,230 Actual return on plan assets 56,385 535 Plan participants’ contributions 14,241 15,690 Employer contributions 47,143 49,018 Benefit payments (63,762) (70,638)Fair value of plan assets at Dec. 31 $ 480,842 $ 426,835
(Thousands of Dollars) 2012 2011 Funded Status of Plans at Dec. 31: Funded status $ (371,110) $ (350,012)
Current assets - 332 Current liabilities (6,070) (7,594)Noncurrent liabilities (365,040) (342,750)Net postretirement amounts recognized on consolidated balance sheets $ (371,110) $ (350,012)
(Thousands of Dollars) 2012 2011 Amounts Not Yet Recognized as Components of Net Periodic Benefit Cost: Net loss $ 321,946 $ 246,846 Prior service credit (84,228) (50,652)Transition obligation 827 15,147 Total $ 238,545 $ 211,341
114

Effective Dec. 31, 2012, the initial medical trend rate was increased from 6.3 percent to 7.5 percent. The ultimate trend assumption was reduced from 5.0 percent to 4.5 percent. The period until the ultimate rate is reached is seven years. Xcel Energy bases its medical trend assumption on the long-term cost inflation expected in the health care market, considering the levels projected and recommended by industry experts, as well as recent actual medical cost increases experienced by Xcel Energy’s retiree medical plan. A 1-percent change in the assumed health care cost trend rate would have the following effects on Xcel Energy:
Cash Flows — The postretirement health care plans have no funding requirements under income tax and other retirement-related regulations other than fulfilling benefit payment obligations, when claims are presented and approved under the plans. Additional cash funding requirements are prescribed by certain state and federal rate regulatory authorities, as discussed previously. Xcel Energy contributed $47.1 million during 2012 and $49.0 million during 2011 and expects to contribute approximately $21.8 million during 2013. Plan Amendments — The 2011 decrease of the projected Xcel Energy postretirement health and welfare benefit obligation for plan amendments is due to changes in the participant co-pay structure for certain retiree groups and the elimination of dental and vision benefits for some nonbargaining retirees. The 2012 decrease of the projected Xcel Energy postretirement health and welfare benefit obligation for plan amendments is due to the expected transition of certain participant groups to an external plan administrator. Benefit Costs — The components of Xcel Energy’s net periodic postretirement benefit costs were:
Table of Contents
(Thousands of Dollars) 2012 2011 Amounts Related to the Funded Status of the Plans Have Been Recorded as Follows Based Upon Expected Recovery in Rates: Current regulatory assets $ 6,930 $ 26,139 Noncurrent regulatory assets 226,052 176,730 Current regulatory liabilities (954) (1,866)Noncurrent regulatory liabilities (3,453) - Deferred income taxes 4,050 4,207 Net-of-tax accumulated other comprehensive income 5,920 6,131 Total $ 238,545 $ 211,341
Measurement date Dec. 31, 2012 Dec. 31, 2011
2012 2011 Significant Assumptions Used to Measure Benefit Obligations: Discount rate for year-end valuation 4.10 % 5.00 %Mortality table RP 2000 RP 2000 Health care costs trend rate - initial 7.50 % 6.31 %
One Percentage Point (Thousands of Dollars) Increase Decrease APBO $ 75,047 $ (60,326)Service and interest components 4,850 (3,904)
(Thousands of Dollars) 2012 2011 2010 Service cost $ 4,203 $ 4,824 $ 4,006 Interest cost 37,861 42,086 42,780 Expected return on plan assets (28,409) (31,962) (28,529)Amortization of transition obligation 14,320 14,444 14,444 Amortization of prior service cost (7,552) (4,932) (4,932)Amortization of net loss 16,906 13,294 11,643
Net periodic postretirement benefit cost 37,329 37,754 39,412 Additional cost recognized due to effects of regulation 3,891 3,891 3,891
Net benefit cost recognized for financial reporting $ 41,220 $ 41,645 $ 43,303
115

Projected Benefit Payments The following table lists Xcel Energy’s projected benefit payments for the pension and postretirement benefit plans:
Multiemployer Plans NSP-Minnesota and NSP-Wisconsin each contribute to several union multiemployer pension and other postretirement benefit plans, none of which are individually significant. These plans provide pension and postretirement health care benefits to certain union employees, including electrical workers, boilermakers, and other construction and facilities workers who may perform services for more than one employer during a given period and do not participate in the NSP-Minnesota and NSP-Wisconsin sponsored pension and postretirement health care plans. Contributing to these types of plans creates risk that differs from providing benefits under NSP-Minnesota and NSP-Wisconsin sponsored plans, in that if another participating employer ceases to contribute to a multiemployer plan, additional unfunded obligations may need to be funded over time by remaining participating employers. Contributions to multiemployer plans were as follows for the years ended Dec. 31, 2012, 2011 and 2010. There were no significant changes to the nature or magnitude of the participation of NSP-Minnesota and NSP-Wisconsin in multiemployer plans for the years presented:
10. Other Income, Net Other income, net for the years ended Dec. 31 consisted of the following:
Table of Contents
2012 2011 2010 Significant Assumptions Used to Measure Costs: Discount rate 5.00 % 5.50 % 6.00 %Expected average long-term rate of return on assets 6.75 7.50 7.50
(Thousands of Dollars)
Projected Pension Benefit
Payments
Gross Projected Postretirement
Health Care Benefit
Payments
Expected Medicare Part D
Subsidies
Net Projected Postretirement
Health Care Benefit
Payments 2013 $ 282,854 $ 56,249 $ 2,709 $ 53,540 2014 277,763 56,948 2,882 54,066 2015 265,965 58,430 3,060 55,370 2016 266,039 59,894 3,214 56,680 2017 267,264 60,329 3,374 56,955 2018-2022 1,335,384 305,235 18,829 286,406
(Thousands of Dollars) 2012 2011 2010 Multiemployer pension contributions:
NSP-Minnesota $ 14,984 $ 17,811 $ 13,461 NSP-Wisconsin 163 169 170
Total $ 15,147 $ 17,980 $ 13,631
Multiemployer other postretirement benefit contributions:
NSP-Minnesota $ 197 $ 336 $ 153 Total $ 197 $ 336 $ 153
(Thousands of Dollars) 2012 2011 2010 Interest income $ 10,327 $ 10,639 $ 11,023 COLI settlement - - 25,000 Other nonoperating income 3,483 3,722 1,689 Insurance policy expense (7,365) (4,785) (6,529)Other nonoperating expense (270) (321) (40)
Other income, net $ 6,175 $ 9,255 $ 31,143
116

COLI — In 2010, Xcel Energy Inc., PSCo and PSRI entered into a settlement agreement with Provident related to all claims asserted by Xcel Energy Inc., PSCo and PSRI against Provident in a lawsuit associated with the discontinued COLI program. Under the terms of the settlement, Xcel Energy Inc., PSCo and PSRI were paid $25 million by Provident and Reassure America Life Insurance Company in 2010. The $25 million proceeds were not subject to income taxes. 11. Fair Value of Financial Assets and Liabilities Fair Value Measurements The accounting guidance for fair value measurements and disclosures provides a single definition of fair value and requires certain disclosures about assets and liabilities measured at fair value. A hierarchical framework for disclosing the observability of the inputs utilized in measuring assets and liabilities at fair value is established by this guidance. The three levels in the hierarchy are as follows:
Level 1 — Quoted prices are available in active markets for identical assets or liabilities as of the reporting date. The types of assets and liabilities included in Level 1 are highly liquid and actively traded instruments with quoted prices.
Level 2 — Pricing inputs are other than quoted prices in active markets, but are either directly or indirectly observable as of the reporting date. The types of assets and liabilities included in Level 2 are typically either comparable to actively traded securities or contracts, or priced with discounted cash flow or option pricing models using highly observable inputs.
Level 3 — Significant inputs to pricing have little or no observability as of the reporting date. The types of assets and liabilities included in Level 3 are those valued with models requiring significant management judgment or estimation.
Specific valuation methods include the following: Cash equivalents — The fair values of cash equivalents are generally based on cost plus accrued interest; money market funds are measured using quoted net asset values. Investments in equity securities and other funds — Equity securities are valued using quoted prices in active markets. The fair values for commingled funds, international equity funds, private equity investments and real estate investments are measured using net asset values, which take into consideration the value of underlying fund investments, as well as the other accrued assets and liabilities of a fund, in order to determine a per share market value. The investments in commingled funds and international equity funds may be redeemed for net asset value with proper notice. Private equity investments require approval of the fund for any unscheduled redemption, and such redemptions may be approved or denied by the fund at its sole discretion. Unscheduled distributions from real estate investments may be redeemed with proper notice; however, withdrawals from real estate investments may be delayed or discounted as a result of fund illiquidity. Based on Xcel Energy’s evaluation of its ability to redeem private equity and real estate investments, fair value measurements for private equity and real estate investments have been assigned a Level 3. Investments in debt securities — Fair values for debt securities are determined by a third party pricing service using recent trades and observable spreads from benchmark interest rates for similar securities, except for asset-backed and mortgage-backed securities, for which the third party service may also consider additional, more subjective inputs. Since the impact of the use of these less observable inputs can be significant to the valuation of asset-backed and mortgage-backed securities, fair value measurements for these instruments have been assigned a Level 3. Inputs that may be considered in the valuation of asset-backed and mortgage-backed securities in conjunction with pricing of similar securities in active markets include the use of risk-based discounting and estimated prepayments in a discounted cash flow model. When these additional inputs and models are utilized, decreases in the risk-adjusted discount rates and any acceleration of the assumed future principal prepayment rates each have the impact of increasing reported fair values for these instruments. Interest rate derivatives — The fair values of interest rate derivatives are based on broker quotes that utilize current market interest rate forecasts.
Table of Contents
117

Commodity derivatives — The methods used to measure the fair value of commodity derivative forwards and options utilize forward prices and volatilities, as well as pricing adjustments for specific delivery locations, and are generally assigned a Level 2. When contractual settlements extend to periods beyond those readily observable on active exchanges or quoted by brokers, the significance of the use of less observable forecasts of long-term forward prices and volatilities on a valuation is evaluated, and may result in Level 3 classification. Electric commodity derivatives held by NSP-Minnesota include FTRs purchased from MISO. FTRs purchased from MISO are financial instruments that entitle or obligate the holder to one year of monthly revenues or charges based on transmission congestion across a given transmission path. The value of an FTR is derived from, and designed to offset, the cost of energy congestion, which is caused by overall transmission load and other transmission constraints. In addition to overall transmission load, congestion is also influenced by the operating schedules of power plants and the consumption of electricity pertinent to a given transmission path. Unplanned plant outages, scheduled plant maintenance, changes in the relative costs of fuels used in generation, weather and overall changes in demand for electricity can each impact the operating schedules of the power plants on the transmission grid and the value of an FTR. NSP-Minnesota’s valuation process for FTRs utilizes complex iterative modeling to predict the impacts of forecasted changes in these drivers of transmission system congestion on the historical pricing of FTR purchases. If forecasted costs of electric transmission congestion increase or decrease for a given FTR path, the value of that particular FTR instrument will likewise increase or decrease. Given the limited observability of management’s forecasts for several of the inputs to this complex valuation model – including expected plant operating schedules and retail and wholesale demand, fair value measurements for FTRs have been assigned a Level 3. Monthly FTR settlements are included in the FCA, and therefore changes in the fair value of the yet to be settled portions of FTRs are deferred as a regulatory asset or liability. Given this regulatory treatment and the limited magnitude of NSP-Minnesota’s FTRs relative to its electric utility operations, the numerous unobservable quantitative inputs to the complex model used for valuation of FTRs are insignificant to the consolidated financial statements of Xcel Energy. Non-Derivative Instruments Fair Value Measurements The NRC requires NSP-Minnesota to maintain a portfolio of investments to fund the costs of decommissioning its nuclear generating plants. Together with all accumulated earnings or losses, the assets of the nuclear decommissioning fund are legally restricted for the purpose of decommissioning the Monticello and Prairie Island nuclear generating plants. The fund contains cash equivalents, debt securities, equity securities and other investments – all classified as available-for-sale. NSP-Minnesota plans to reinvest matured securities until decommissioning begins. The MPUC approved NSP-Minnesota’s proposed change in escrow fund investment strategy in September 2012. The MPUC approved an asset allocation for the escrow and investment targets by asset class for both the escrow and qualified trust. NSP-Minnesota recognizes the costs of funding the decommissioning of its nuclear generating plants over the lives of the plants, assuming rate recovery of all costs. Given the purpose and legal restrictions on the use of nuclear decommissioning fund assets, realized and unrealized gains on fund investments over the life of the fund are deferred as an offset of NSP-Minnesota’s regulatory asset for nuclear decommissioning costs. Consequently, any realized and unrealized gains and losses on securities in the nuclear decommissioning fund, including any other-than-temporary impairments, are deferred as a component of the regulatory asset for nuclear decommissioning. Unrealized gains for the nuclear decommissioning fund were $135.8 million and $79.8 million at Dec. 31, 2012 and 2011, respectively, and unrealized losses and amounts recorded as other-than-temporary impairments were $46.4 million and $87.5 million at Dec. 31, 2012 and 2011, respectively.
Table of Contents
118

The following tables present the cost and fair value of Xcel Energy’s non-derivative instruments with recurring fair value measurements in the nuclear decommissioning fund at Dec. 31, 2012 and 2011:
Table of Contents
Dec. 31, 2012 Fair Value (Thousands of Dollars) Cost Level 1 Level 2 Level 3 Total Nuclear decommissioning fund (a)
Cash equivalents $ 246,904 $ 237,938 $ 8,966 $ - $ 246,904 Commingled funds 396,681 - 417,583 - 417,583 International equity funds 66,452 - 69,481 - 69,481 Private equity investments 27,943 - - 33,250 33,250 Real estate 32,561 - - 39,074 39,074 Debt securities:
Government securities 21,092 - 21,521 - 21,521 U.S. corporate bonds 162,053 - 169,488 - 169,488 International corporate bonds 15,165 - 16,052 - 16,052 Municipal bonds 21,392 - 23,650 - 23,650 Asset-backed securities 2,066 - - 2,067 2,067 Mortgage-backed securities 28,743 - - 30,209 30,209
Equity securities: Common stock 379,093 420,263 - - 420,263 Total $ 1,400,145 $ 658,201 $ 726,741 $ 104,600 $ 1,489,542
(a) Reported in nuclear decommissioning fund and other investments on the consolidated balance sheet, which also includes $91.2 million of equity investments in unconsolidated subsidiaries and $37.1 million of miscellaneous investments.
Dec. 31, 2011 Fair Value (Thousands of Dollars) Cost Level 1 Level 2 Level 3 Total Nuclear decommissioning fund (a)
Cash equivalents $ 26,123 $ 7,103 $ 19,020 $ - $ 26,123 Commingled funds 320,798 - 311,105 - 311,105 International equity funds 63,781 - 58,508 - 58,508 Private equity investments 9,203 - - 9,203 9,203 Real estate 24,768 - - 26,395 26,395 Debt securities:
Government securities 116,490 - 117,256 - 117,256 U.S. corporate bonds 187,083 - 193,516 - 193,516 International corporate bonds 35,198 - 35,804 - 35,804 Municipal bonds 60,469 - 64,731 - 64,731 Asset-backed securities 16,516 - - 16,501 16,501 Mortgage-backed securities 75,627 - - 78,664 78,664
Equity securities: Common stock 408,122 398,625 - - 398,625 Total $ 1,344,178 $ 405,728 $ 799,940 $ 130,763 $ 1,336,431
(a) Reported in nuclear decommissioning fund and other investments on the consolidated balance sheet, which also includes $92.7 million of equity investments in unconsolidated subsidiaries and $34.3 million of miscellaneous investments.
119

The following tables present the changes in Level 3 nuclear decommissioning fund investments:
The following table summarizes the final contractual maturity dates of the debt securities in the nuclear decommissioning fund, by asset class, at Dec. 31, 2012:
Derivative Instruments Fair Value Measurements Xcel Energy enters into derivative instruments, including forward contracts, futures, swaps and options, for trading purposes and to manage risk in connection with changes in interest rates, utility commodity prices and vehicle fuel prices. Interest Rate Derivatives — Xcel Energy enters into various instruments that effectively fix the interest payments on certain floating rate debt obligations or effectively fix the yield or price on a specified benchmark interest rate for an anticipated debt issuance for a specific period. These derivative instruments are generally designated as cash flow hedges for accounting purposes. At Dec. 31, 2012, accumulated other comprehensive losses related to interest rate derivatives included $2.4 million of net losses expected to be reclassified into earnings during the next 12 months as the related hedged interest rate transactions impact earnings, including forecasted amounts for any unsettled hedges.
Table of Contents
(Thousands of Dollars)
Jan. 1, 2012
Purchases
Settlements
Gains (Losses) Recognized as
Regulatory Assets and Liabilities
Dec. 31, 2012 Private equity investments $ 9,203 $ 20,671 $ (1,931) $ 5,307 $ 33,250 Real estate 26,395 9,777 (3,611) 6,513 39,074 Asset-backed securities 16,501 - (14,450) 16 2,067 Mortgage-backed securities 78,664 33,016 (79,899) (1,572) 30,209
Total $ 130,763 $ 63,464 $ (99,891) $ 10,264 $ 104,600
(Thousands of Dollars) Jan. 1, 2011 Purchases Settlements
Gains (Losses) Recognized as
Regulatory Assets and Liabilities Dec. 31, 2011
Private equity investments $ - $ 9,203 $ - $ - $ 9,203 Real estate - 24,768 - 1,627 26,395 Asset-backed securities 33,174 16,518 (32,560) (631) 16,501 Mortgage-backed securities 72,589 168,688 (161,134) (1,479) 78,664
Total $ 105,763 $ 219,177 $ (193,694) $ (483) $ 130,763
(Thousands of Dollars) Jan. 1, 2010 Purchases Settlements
Gains Recognized as
Regulatory Liabilities Dec. 31, 2010
Asset-backed securities $ 11,918 $ 38,871 $ (17,878) $ 263 $ 33,174 Mortgage-backed securities 81,189 63,497 (75,701) 3,604 72,589
Total $ 93,107 $ 102,368 $ (93,579) $ 3,867 $ 105,763
Final Contractual Maturity (Thousands of Dollars)
Due in 1 Year or Less
Due in 1 to 5 Years
Due in 5 to 10 Years
Due after 10 Years
Total
Government securities $ - $ 1,206 $ 12,072 $ 8,243 $ 21,521 U.S. corporate bonds - 31,932 87,659 49,897 169,488 International corporate bonds - 4,165 10,556 1,331 16,052 Municipal bonds - - 3,739 19,911 23,650 Asset-backed securities - 2,067 - - 2,067 Mortgage-backed securities - - 748 29,461 30,209
Debt securities $ - $ 39,370 $ 114,774 $ 108,843 $ 262,987
120

In conjunction with the NSP-Minnesota debt issuance in August 2012, NSP-Minnesota settled interest rate hedging instruments with a notional amount of $225 million with cash payments of $45.0 million. In conjunction with the PSCo debt issuance in September 2012, PSCo settled interest rate hedging instruments with a notional amount of $250 million with cash payments of $44.7 million. These losses are classified as a component of accumulated other comprehensive loss on the consolidated balance sheet, net of tax, and are being reclassified to earnings over the term of the hedged interest payments. See Note 4 for further discussion of long-term borrowings. Wholesale and Commodity Trading Risk — Xcel Energy Inc.’s utility subsidiaries conduct various wholesale and commodity trading activities, including the purchase and sale of electric capacity, energy and energy-related instruments. Xcel Energy’s risk management policy allows management to conduct these activities within guidelines and limitations as approved by its risk management committee, which is made up of management personnel not directly involved in the activities governed by this policy. Commodity Derivatives — Xcel Energy enters into derivative instruments to manage variability of future cash flows from changes in commodity prices in its electric and natural gas operations, as well as for trading purposes. This could include the purchase or sale of energy or energy-related products, natural gas to generate electric energy, natural gas for resale and vehicle fuel. At Dec. 31, 2012, Xcel Energy had various vehicle fuel related contracts designated as cash flow hedges extending through December 2016. Xcel Energy also enters into derivative instruments that mitigate commodity price risk on behalf of electric and natural gas customers but are not designated as qualifying hedging transactions. Changes in the fair value of non-trading commodity derivative instruments are recorded in OCI or deferred as a regulatory asset or liability. The classification as a regulatory asset or liability is based on commission approved regulatory recovery mechanisms. Xcel Energy recorded immaterial amounts to income related to the ineffectiveness of cash flow hedges for the years ended Dec. 31, 2012 and 2011. At Dec. 31, 2012, net gains related to commodity derivative cash flow hedges recorded as a component of accumulated other comprehensive losses included $0.1 million of net gains expected to be reclassified into earnings during the next 12 months as the hedged transactions occur. Additionally, Xcel Energy enters into commodity derivative instruments for trading purposes not directly related to commodity price risks associated with serving its electric and natural gas customers. Changes in the fair value of these commodity derivatives are recorded in electric operating revenues, net of amounts credited to customers under margin-sharing mechanisms. The following table details the gross notional amounts of commodity forwards, options and FTRs at Dec. 31, 2012 and 2011:
(a) Amounts are not reflective of net positions in the underlying commodities. (b) Notional amounts for options are included on a gross basis, but are weighted for the probability of exercise. Consideration of Credit Risk and Concentrations — Xcel Energy continuously monitors the creditworthiness of the counterparties to its interest rate derivatives and commodity derivative contracts prior to settlement, and assesses each counterparty’s ability to perform on the transactions set forth in the contracts. Given this assessment, as well as an assessment of the impact of Xcel Energy’s own credit risk when determining the fair value of derivative liabilities, the impact of considering credit risk was immaterial to the fair value of unsettled commodity derivatives presented in the consolidated balance sheets. Xcel Energy Inc. and its subsidiaries employ additional credit risk control mechanisms when appropriate, such as letters of credit, parental guarantees, standardized master netting agreements and termination provisions that allow for offsetting of positive and negative exposures. Credit exposure is monitored and, when necessary, the activity with a specific counterparty is limited until credit enhancement is provided.
Table of Contents
(Amounts in Thousands) (a)(b) Dec. 31, 2012 Dec. 31, 2011 MWh of electricity 55,976 38,822 MMBtu of natural gas 725 40,736 Gallons of vehicle fuel 682 600
121

Xcel Energy’s utility subsidiaries’ most significant concentrations of credit risk with particular entities or industries are contracts with counterparties to their wholesale, trading and non-trading commodity activities. At Dec. 31, 2012, five of Xcel Energy’s 10 most significant counterparties for these activities, comprising $67.1 million or 23 percent of this credit exposure at Dec. 31, 2012, had investment grade credit ratings from Standard & Poor’s, Moody’s or Fitch Ratings. The remaining five significant counterparties, comprising $75.3 million or 26 percent of this credit exposure at Dec. 31, 2012, were not rated by these agencies, but based on Xcel Energy’s internal analysis, had credit quality consistent with investment grade. All 10 of these significant counterparties are municipal or cooperative electric entities or other utilities, and no single counterparty comprised greater than 10 percent of Xcel Energy’s credit exposure at Dec. 31, 2012. Financial Impact of Qualifying Cash Flow Hedges — The impact of qualifying interest rate and vehicle fuel cash flow hedges on Xcel Energy’s accumulated other comprehensive loss, included in the consolidated statements of common stockholders’ equity and in the consolidated statements of comprehensive income, is detailed in the following table:
The following tables detail the impact of derivative activity during the years ended Dec. 31, 2012, 2011 and 2010, on accumulated other comprehensive loss, regulatory assets and liabilities, and income:
Table of Contents
(Thousands of Dollars) 2012 2011 2010 Accumulated other comprehensive loss related to cash flow hedges at Jan. 1 $ (45,738) $ (8,094) $ (6,435)After-tax net unrealized losses related to derivatives accounted for as hedges (19,200) (38,292) (4,289)After-tax net realized losses on derivative transactions reclassified into earnings 3,697 648 2,630 Accumulated other comprehensive loss related to cash flow hedges at Dec. 31 $ (61,241) $ (45,738) $ (8,094)
Year Ended Dec. 31, 2012 Pre-Tax Fair Value Pre-Tax (Gains) Losses Gains (Losses) Recognized Reclassified into Income During the Period in: During the Period from: Accumulated Accumulated Pre-Tax Gains (Losses) Other Regulatory Other Regulatory Recognized Comprehensive (Assets) and Comprehensive Assets and During the Period (Thousands of Dollars) Loss Liabilities Loss (Liabilities) in Income Derivatives designated as cash flow hedges
Interest rate $ (31,913) $ - $ 6,582 (a) $ - $ - Vehicle fuel and other commodity 120 - (198) (e) - -
Total $ (31,793) $ - $ 6,384 $ - $ -
Other derivative instruments
Commodity trading $ - $ - $ - $ - $ 12,226 (b)
Electric commodity - 44,162 - (39,999) (c) - Natural gas commodity - (10,809) - 80,902 (d) (137) (c)
Total $ - $ 33,353 $ - $ 40,903 $ 12,089
122

Table of Contents
Year Ended Dec. 31, 2011 Pre-Tax Fair Value Pre-Tax (Gains) Losses Gains (Losses) Recognized Reclassified into Income During the Period in: During the Period from: Accumulated Accumulated Pre-Tax Gains (Losses) Other Regulatory Other Regulatory Recognized Comprehensive (Assets) and Comprehensive Assets and During the Period (Thousands of Dollars) Loss Liabilities Loss (Liabilities) in Income Derivatives designated as cash flow hedges
Interest rate $ (63,573) $ - $ 1,424 (a) $ - $ - Vehicle fuel and other commodity 195 - (178) (e) - -
Total $ (63,378) $ - $ 1,246 $ - $ -
Other derivative instruments
Commodity trading $ - $ - $ - $ - $ 6,418 (b)
Electric commodity - 49,818 - (40,492) (c) - Natural gas commodity - (111,574) - 91,743 (d) (382) (c)
Total $ - $ (61,756) $ - $ 51,251 $ 6,036
Year Ended Dec. 31, 2010 Pre-Tax Fair Value Pre-Tax (Gains) Losses Gains (Losses) Recognized Reclassified into Income During the Period in: During the Period from: Accumulated Accumulated Pre-Tax Gains Other Regulatory Other Regulatory Recognized Comprehensive (Assets) and Comprehensive Assets and During the Period (Thousands of Dollars) Loss Liabilities Loss (Liabilities) in Income Derivatives designated as cash flow hedges
Interest rate $ (7,210) $ - $ 1,107 (a) $ - $ - Vehicle fuel and other commodity (238) - 3,474 (e) - -
Total $ (7,448) $ - $ 4,581 $ - $ -
Other derivative instruments
Commodity trading $ - $ - $ - $ - $ 11,004 (b)
Electric commodity - 3,969 - (21,840) (c) - Natural gas commodity - (105,396) - 51,034 (d) - Other - - - - 135 (b)
Total $ - $ (101,427) $ - $ 29,194 $ 11,139
(a) Amounts are recorded to interest charges. (b) Amounts are recorded to electric operating revenues. Portions of these gains and losses are subject to sharing with electric customers through margin-sharing mechanisms and
deducted from gross revenue, as appropriate. (c) Amounts are recorded to electric fuel and purchased power. These derivative settlement gains and losses are shared with electric customers through fuel and purchased energy cost-
recovery mechanisms, and reclassified out of income as regulatory assets or liabilities, as appropriate. (d) Amounts for the years ended Dec. 31, 2012, 2011 and 2010 include $5.0 million, $12.7 million and $9.8 million of settlement losses, respectively, on derivatives entered to
mitigate natural gas price risk for electric generation, recorded to electric fuel and purchased power, subject to cost-recovery mechanisms and reclassified to a regulatory asset, as appropriate. The remaining settlement losses for the years ended Dec. 31, 2012, 2011 and 2010 relate to natural gas operations and are recorded to cost of natural gas sold and transported. These losses are subject to cost-recovery mechanisms and reclassified to a regulatory asset, as appropriate.
(e) Amounts are recorded to O&M expenses.
123

Xcel Energy had no derivative instruments designated as fair value hedges during the years ended Dec 31, 2012, 2011 and 2010. Therefore, no gains or losses from fair value hedges or related hedged transactions were recognized for these periods. Credit Related Contingent Features — Contract provisions for derivative instruments that the utility subsidiaries enter, including those recorded to the consolidated balance sheet at fair value, as well as those accounted for as normal purchase-normal sale (NPNS) contracts and therefore not reflected on the balance sheet, may require the posting of collateral or settlement of the contracts for various reasons, including if the applicable utility subsidiary is unable to maintain its credit ratings. If the credit ratings of Xcel Energy Inc.’s utility subsidiaries were downgraded below investment grade, derivative instruments reflected in a $4.6 million and $8.3 million gross liability position on the consolidated balance sheets at Dec. 31, 2012 and 2011, respectively, would have required Xcel Energy Inc.’s utility subsidiaries to post collateral or settle outstanding contracts, including NPNS contracts, which would have resulted in payments of $4.6 million and $9.3 million at Dec. 31, 2012 and 2011, respectively, inclusive of the impacts of the offsetting asset positions with the applicable counterparties. At Dec. 31, 2012 and 2011, there was no collateral posted on these specific contracts. Certain derivative instruments are also subject to contract provisions that contain adequate assurance clauses. These provisions allow counterparties to seek performance assurance, including cash collateral, in the event that a given utility subsidiary’s ability to fulfill its contractual obligations is reasonably expected to be impaired. Xcel Energy had no collateral posted related to adequate assurance clauses in derivative contracts as of Dec. 31, 2012 and 2011. Recurring Fair Value Measurements — The following tables present for each of the fair value hierarchy levels, Xcel Energy’s derivative assets and liabilities measured at fair value on a recurring basis at Dec. 31, 2012:
Table of Contents
Dec. 31, 2012 Fair Value Fair Value Counterparty (Thousands of Dollars) Level 1 Level 2 Level 3 Total Netting (b) Total Current derivative assets Derivatives designated as cash flow hedges:
Vehicle fuel and other commodity $ - $ 95 $ - $ 95 $ - $ 95 Other derivative instruments:
Commodity trading - 26,303 692 26,995 (6,675) 20,320 Electric commodity - - 16,724 16,724 (843) 15,881 Natural gas commodity - 7 - 7 (7) -
Total current derivative assets $ - $ 26,405 $ 17,416 $ 43,821 $ (7,525) 36,296
PPAs (a) 32,717 Current derivative instruments $ 69,013
Noncurrent derivative assets Derivatives designated as cash flow hedges:
Vehicle fuel and other commodity $ - $ 86 $ - $ 86 $ (47) $ 39 Other derivative instruments:
Commodity trading - 41,282 77 41,359 (4,162) 37,197 Total noncurrent derivative assets $ - $ 41,368 $ 77 $ 41,445 $ (4,209) 37,236
PPAs (a) 89,061 Noncurrent derivative instruments $ 126,297
124

The following tables present for each of the fair value hierarchy levels, Xcel Energy’s derivative assets and liabilities measured at fair value on a recurring basis at Dec. 31, 2011:
Table of Contents
Dec. 31, 2012 Fair Value Fair Value Counterparty (Thousands of Dollars) Level 1 Level 2 Level 3 Total Netting (b) Total Current derivative liabilities Other derivative instruments:
Commodity trading $ - $ 18,622 $ 1 $ 18,623 $ (9,112) $ 9,511 Electric commodity - - 843 843 (843) - Natural gas commodity - 98 - 98 (7) 91
Total current derivative liabilities $ - $ 18,720 $ 844 $ 19,564 $ (9,962) 9,602
PPAs (a) 22,880 Current derivative instruments $ 32,482
Noncurrent derivative liabilities Other derivative instruments:
Commodity trading $ - $ 21,417 $ - $ 21,417 $ (4,210) $ 17,207 Total noncurrent derivative liabilities $ - $ 21,417 $ - $ 21,417 $ (4,210) 17,207
PPAs (a) 225,659 Noncurrent derivative instruments $ 242,866
(a) In 2003, as a result of implementing new guidance on the normal purchase exception for derivative accounting, Xcel Energy began recording several long-term PPAs at fair value due to accounting requirements related to underlying price adjustments. As these purchases are recovered through normal regulatory recovery mechanisms in the respective jurisdictions, the changes in fair value for these contracts were offset by regulatory assets and liabilities. During 2006, Xcel Energy qualified these contracts under the normal purchase exception. Based on this qualification, the contracts are no longer adjusted to fair value and the previous carrying value of these contracts will be amortized over the remaining contract lives along with the offsetting regulatory assets and liabilities.
(b) The accounting guidance for derivatives and hedging permits the netting of receivables and payables for derivatives and related collateral amounts when a legally enforceable master netting agreement exists between Xcel Energy and a counterparty. A master netting agreement is an agreement between two parties who have multiple contracts with each other that provides for the net settlement of all contracts in the event of default on or termination of any one contract.
Dec. 31, 2011 Fair Value Fair Value Counterparty (Thousands of Dollars) Level 1 Level 2 Level 3 Total Netting (b) Total Current derivative assets Derivatives designated as cash flow hedges:
Vehicle fuel and other commodity $ - $ 169 $ - $ 169 $ (76) $ 93 Other derivative instruments:
Commodity trading - 32,682 - 32,682 (13,391) 19,291 Electric commodity - - 13,333 13,333 (1,471) 11,862
Total current derivative assets $ - $ 32,851 $ 13,333 $ 46,184 $ (14,938) 31,246
PPAs (a) 33,094 Current derivative instruments $ 64,340
125

Table of Contents
Dec. 31, 2011 Fair Value Fair Value Counterparty (Thousands of Dollars) Level 1 Level 2 Level 3 Total Netting (b) Total Noncurrent derivative assets Derivatives designated as cash flow hedges:
Vehicle fuel and other commodity $ - $ 107 $ - $ 107 $ (59) $ 48 Other derivative instruments:
Commodity trading - 36,599 - 36,599 (5,540) 31,059 Total noncurrent derivative assets $ - $ 36,706 $ - $ 36,706 $ (5,599) 31,107
PPAs (a) 121,780 Noncurrent derivative instruments $ 152,887
Current derivative liabilities Derivatives designated as cash flow hedges:
Interest rate $ - $ 57,749 $ - $ 57,749 $ - $ 57,749 Other derivative instruments:
Commodity trading - 27,891 - 27,891 (14,417) 13,474 Electric commodity - 698 916 1,614 (1,471) 143 Natural gas commodity 418 70,119 - 70,537 (7,486) 63,051
Total current derivative liabilities $ 418 $ 156,457 $ 916 $ 157,791 $ (23,374) 134,417
PPAs (a) 22,997 Current derivative instruments $ 157,414
Noncurrent derivative liabilities Other derivative instruments:
Commodity trading $ - $ 20,966 $ - $ 20,966 $ (5,599) $ 15,367 Total noncurrent derivative liabilities $ - $ 20,966 $ - $ 20,966 $ (5,599) 15,367
PPAs (a) 248,539 Noncurrent derivative instruments $ 263,906
(a) In 2003, as a result of implementing new guidance on the normal purchase exception for derivative accounting, Xcel Energy began recording several long-term PPAs at fair value due to accounting requirements related to underlying price adjustments. As these purchases are recovered through normal regulatory recovery mechanisms in the respective jurisdictions, the changes in fair value for these contracts were offset by regulatory assets and liabilities. During 2006, Xcel Energy qualified these contracts under the normal purchase exception. Based on this qualification, the contracts are no longer adjusted to fair value and the previous carrying value of these contracts will be amortized over the remaining contract lives along with the offsetting regulatory assets and liabilities.
(b) The accounting guidance for derivatives and hedging permits the netting of receivables and payables for derivatives and related collateral amounts when a legally enforceable master netting agreement exists between Xcel Energy and a counterparty. A master netting agreement is an agreement between two parties who have multiple contracts with each other that provides for the net settlement of all contracts in the event of default on or termination of any one contract.
126
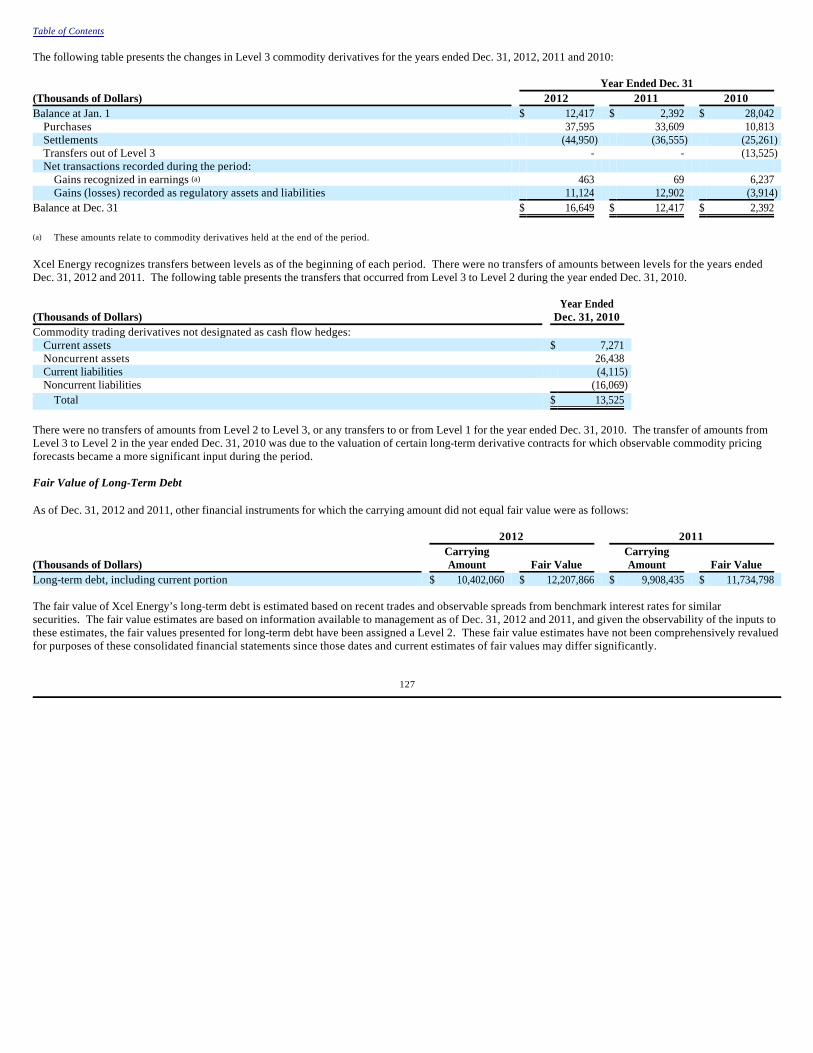
The following table presents the changes in Level 3 commodity derivatives for the years ended Dec. 31, 2012, 2011 and 2010:
Xcel Energy recognizes transfers between levels as of the beginning of each period. There were no transfers of amounts between levels for the years ended Dec. 31, 2012 and 2011. The following table presents the transfers that occurred from Level 3 to Level 2 during the year ended Dec. 31, 2010.
There were no transfers of amounts from Level 2 to Level 3, or any transfers to or from Level 1 for the year ended Dec. 31, 2010. The transfer of amounts from Level 3 to Level 2 in the year ended Dec. 31, 2010 was due to the valuation of certain long-term derivative contracts for which observable commodity pricing forecasts became a more significant input during the period. Fair Value of Long-Term Debt As of Dec. 31, 2012 and 2011, other financial instruments for which the carrying amount did not equal fair value were as follows:
The fair value of Xcel Energy’s long-term debt is estimated based on recent trades and observable spreads from benchmark interest rates for similar securities. The fair value estimates are based on information available to management as of Dec. 31, 2012 and 2011, and given the observability of the inputs to these estimates, the fair values presented for long-term debt have been assigned a Level 2. These fair value estimates have not been comprehensively revalued for purposes of these consolidated financial statements since those dates and current estimates of fair values may differ significantly.
Table of Contents
Year Ended Dec. 31 (Thousands of Dollars) 2012 2011 2010 Balance at Jan. 1 $ 12,417 $ 2,392 $ 28,042
Purchases 37,595 33,609 10,813 Settlements (44,950) (36,555) (25,261)Transfers out of Level 3 - - (13,525)Net transactions recorded during the period:
Gains recognized in earnings (a) 463 69 6,237 Gains (losses) recorded as regulatory assets and liabilities 11,124 12,902 (3,914)
Balance at Dec. 31 $ 16,649 $ 12,417 $ 2,392
(a) These amounts relate to commodity derivatives held at the end of the period.
Year Ended (Thousands of Dollars) Dec. 31, 2010 Commodity trading derivatives not designated as cash flow hedges:
Current assets $ 7,271 Noncurrent assets 26,438 Current liabilities (4,115)Noncurrent liabilities (16,069)
Total $ 13,525
2012 2011
(Thousands of Dollars) Carrying Amount Fair Value
Carrying Amount Fair Value
Long-term debt, including current portion $ 10,402,060 $ 12,207,866 $ 9,908,435 $ 11,734,798
127

12. Rate Matters NSP-Minnesota Pending and Recently Concluded Regulatory Proceedings — MPUC Base Rate NSP-Minnesota – Minnesota 2012 Electric Rate Case — In November 2012, NSP-Minnesota filed a request with the MPUC for an increase in annual revenues of approximately $285 million, or 10.7 percent. The rate filing is based on a 2013 forecast test year, a requested ROE of 10.6 percent, an average electric rate base of approximately $6.3 billion and an equity ratio of 52.56 percent. In December 2012, the MPUC accepted the filing as complete and approved the interim rates of approximately $251 million, as requested, effective Jan. 1, 2013, subject to refund. In addition, the MPUC ordered NSP-Minnesota to file supplemental testimony regarding its ability to refinance additional debt and to discuss the effects of certain changes to its equity ratio. The procedural schedule is as follows:
NSP-Minnesota - Minnesota 2010 Electric Rate Case — In November 2010, NSP-Minnesota filed a request with the MPUC to increase electric rates in Minnesota for 2011 by approximately $150 million, or an increase of 5.62 percent, and an additional increase of $48.3 million, or 1.81 percent, in 2012. The rate filing was based on a 2011 forecast test year, a requested ROE of 11.25 percent, an electric rate base of $5.6 billion and an equity ratio of 52.56 percent. The MPUC approved an interim rate increase of $123 million, subject to refund, effective Jan. 2, 2011. In August 2011, NSP-Minnesota submitted supplemental testimony, revising its requested rate increase to approximately $122 million for 2011 and an additional increase of approximately $29 million in 2012. In November 2011, NSP-Minnesota reached a settlement agreement with certain customer intervenors. In February 2012, NSP-Minnesota filed to reduce the interim rate request to $72.8 million to align with the settlement agreement. In March 2012, the MPUC approved the settlement. In May 2012, the MPUC issued an order approving the following:
NSP-Minnesota filed its final rate implementation and interim rate refund compliance filing in June 2012, which the MPUC approved in August 2012. Final rates were implemented Sept. 1, 2012, and interim refunds were completed during October 2012. NSP-Minnesota - 2012 Transmission Cost Recovery Rate Filing - In January 2012, the 2012 NSP-Minnesota TCR filing was submitted to the MPUC, requesting recovery of $29.6 million of transmission investment costs not included in base electric rates in the 2010 rate case settlement. In 2012, the Minnesota Department of Commerce (DOC) recommended that the MPUC exclude $1.5 million of capitalized labor costs from the TCR, based on a prior MPUC decision in a TCR filing by another Minnesota utility, and added that the costs NSP-Minnesota has incurred for its share of the CapX2020 Bemidji project should be capped for TCR consideration at the level estimated in the CON application, plus reasonable escalation. The DOC did not assert the costs are not recoverable in rates, but asserted the costs should not be eligible for recovery through the TCR adjustment mechanism. The DOC’s position remained that the capitalized labor costs should not be recovered through the TCR and NSP-Minnesota estimates that the DOC positions, if approved by the MPUC, would result in granting NSP-Minnesota approximately $26.3 million in revenue requirements for 2012 under the TCR. Final MPUC action is anticipated in the first half of 2013.
Table of Contents
• Intervenor Direct Testimony – Feb. 28, 2013 • Rebuttal Testimony – March 25, 2013 • Surrebuttal Testimony – April 12, 2013 • Evidentiary Hearing – April 18 – 24, 2013 • Initial Brief – May 15, 2013 • Reply Brief and Findings of Fact – May 30, 2013 • ALJ Report – July 3, 2013 • MPUC Order – Anticipated by September 2013
• A rate increase of approximately $58 million in 2011 and an incremental rate increase of $14.8 million in 2012 based on an ROE of 10.37 percent and an equity ratio of 52.56 percent.
• A reduction to depreciation expense and NSP-Minnesota’s rate request by $30 million.
128

Prairie Island Nuclear Plant EPU — In 2009, the MPUC granted NSP-Minnesota a CON for an EPU project at the Prairie Island nuclear generating plant. The total estimated cost of the EPU was $294 million, of which approximately $77.6 million has been incurred, including AFUDC of approximately $13.3 million. Subsequently, NSP-Minnesota filed a resource plan update and a change of circumstances filing notifying the MPUC that there were changes in the size, timing and cost estimates for this project, revisions to economic and project design analysis and changes due to the estimated impact of revised scheduled outages. The information indicated reductions to the estimated benefit of the uprate project. As a result, NSP-Minnesota concluded that further investment in this project would not benefit customers. In December 2012, the MPUC voted unanimously that no party had shown cause to prevent termination of the EPU CON. The MPUC is expected to issue an order terminating the EPU CON in the first half of 2013. NSP-Minnesota plans to address recovery of incurred costs in the next rate case for each of the NSP-Minnesota jurisdictions and to file a request with the FERC for approval to recover a portion of the costs from NSP-Wisconsin through the Interchange Agreement. NSP-Wisconsin plans to seek cost recovery in a future rate case. Based on the outcome of the MPUC decision, EPU costs incurred to date were compared to the discounted value of the estimated future rate recovery based on past jurisdictional precedent, resulting in a $10.1 million pretax charge in December 2012 which is included in O&M expense. Pending and Recently Concluded Regulatory Proceedings — NDPSC NSP-Minnesota – North Dakota 2012 Electric Rate Case — In December 2012, NSP-Minnesota filed a request with the NDPSC for an increase in annual retail electric revenues of approximately $16.9 million, or 9.25 percent. The rate filing is based on a 2013 forecast test year, a requested ROE of 10.6 percent, an electric rate base of approximately $377.6 million and an equity ratio of 52.56 percent. In January 2013, the NDPSC approved an interim electric increase of $14.7 million, effective Feb. 16, 2013, subject to refund. A final NDPSC decision on the case is expected in the third quarter of 2013. NSP-Minnesota – North Dakota 2010 Electric Rate Case — In December 2010, NSP-Minnesota filed a request with the NDPSC to increase 2011 electric rates in North Dakota by approximately $19.8 million, or 12 percent, and a step increase of $4.2 million, or 2.6 percent, in 2012. The rate filing was based on a 2011 forecast test year and included a requested ROE of 11.25 percent, an electric rate base of approximately $328 million and an equity ratio of 52.56 percent. The NDPSC approved an interim rate increase of approximately $17.4 million, subject to refund, effective Feb. 18, 2011. In May 2011, NSP-Minnesota revised its rate request to approximately $18.0 million, or an increase of 11 percent, for 2011 and $2.4 million, or 1.4 percent, for the additional step increase in 2012. In February 2012, the NDPSC approved the settlement agreement, which provided for a rate increase of $13.7 million in 2011 and an additional step increase of $2.0 million in 2012, based on a 10.4 percent ROE and black box settlement for all other issues. To address the unknown timing of economic recovery and the effect on sales, the settlement includes a true-up to 2012 non-fuel revenues plus the settlement rate increase. NSP-Minnesota implemented final rates in May 2012 and issued refunds in June 2012. Pending and Recently Concluded Regulatory Proceedings — SDPUC NSP-Minnesota – South Dakota 2012 Electric Rate Case — In June 2012, NSP-Minnesota filed a request with the SDPUC to increase electric rates by $19.4 million annually. The request was based on a 2011 historic test year adjusted for known and measurable changes for 2012 and 2013, a requested ROE of 10.65 percent, an average rate base of $367.5 million and an equity ratio of 52.89 percent. In December 2012, the procedural schedule was suspended to allow time to construct a potential settlement agreement between NSP-Minnesota and the SDPUC Staff. Interim rates of $19.4 million went into effect on Jan. 1, 2013, subject to refund. A SDPUC decision is expected in the first half of 2013. NSP-Minnesota – South Dakota 2011 Electric Rate Case — In June 2011, NSP-Minnesota filed a request with the SDPUC to increase electric rates by $14.6 million annually, effective in 2012. The request was based on a 2010 historic test year adjusted for known and measurable changes, a requested ROE of 11 percent, a rate base of $323.4 million and an equity ratio of 52.48 percent. On Jan. 2, 2012, interim rates of $12.7 million were implemented. In June 2012, the SDPUC authorized a rate increase of approximately $8.0 million, based on an ROE of 9.25 percent, and an equity ratio of 53 percent. Final rates became effective Aug. 1, 2012. Interim rate refunds of $2.9 million were completed in September 2012.
Table of Contents
129

Electric, Purchased Gas and Resource Adjustment Incentive Clauses CIP and CIP Rider —In December 2012, the MPUC approved reductions to the CIP financial incentive mechanisms effective for the 2013 through 2015 program years. Based on the approved savings goals, the estimated average annual electric and natural gas incentives are $30.6 million and $3.6 million, respectively. CIP expenses are recovered through base rates and a rider that is adjusted annually. In December 2012, the MPUC approved NSP-Minnesota’s 2011 CIP financial incentives of $51.4 million for electric and $2.8 million for natural gas, and NSP-Minnesota’s 2013 electric and natural gas rider requests. NSP-Minnesota estimates 2013 recovery of $54.7 million of electric CIP expenses and $12.6 million of natural gas CIP expenses. This proposed recovery through the riders is in addition to an estimated $77.9 million and $3.7 million through electric and gas base rates, respectively. NSP-Wisconsin Recently Concluded Regulatory Proceedings — PSCW Base Rate NSP-Wisconsin – 2012 Electric and Gas Rate Case — In June 2012, NSP-Wisconsin filed a request with the PSCW to increase rates for electric and natural gas service, effective Jan. 1, 2013. NSP-Wisconsin requested an overall increase in annual electric rates of $39.1 million, or 6.7 percent, and an increase in natural gas rates of $5.3 million, or 4.9 percent. The electric rate filing was based on a 2013 forecast test year, a ROE of 10.40 percent, an equity ratio of 52.50 percent and an average 2013 electric rate base of approximately $788.6 million. The natural gas rate request was solely due to a proposal to recover the initial costs associated with the environmental cleanup of the Ashland/Northern States Power Lakefront Superfund Site (the Ashland site) in Ashland, Wis. In December 2012, the PSCW approved an electric rate increase of approximately $35.5 million, or 6.1 percent, based on a 10.4 percent ROE and an equity ratio of 52.50 percent. The PSCW also approved a natural gas rate increase of $2.7 million, or 2.5 percent, to begin recovering costs associated with the cleanup of the Ashland site. Final rates were implemented on Jan. 1, 2013. PSCo Pending and Recently Concluded Regulatory Proceedings — CPUC Base Rate PSCo 2012 Gas and Steam Rate Case — In December 2012, PSCo filed a multi-year request with the CPUC to increase Colorado retail natural gas rates by $48.5 million in 2013 with subsequent step increases of $9.9 million in 2014 and $12.1 million in 2015. PSCo also requested to increase Colorado retail steam rates by $1.6 million in 2013 with subsequent step increases of $0.9 million in 2014 and $2.3 million in 2015. Both requests are based on a 2013 forecast test year, a 10.5 percent ROE, a rate base of $1.3 billion for natural gas and $21 million for steam and an equity ratio of 56 percent. Final rates are expected to be effective in the third quarter of 2013. PSCo is requesting an extension of its PSIA rider mechanism to collect the costs of accelerated pipeline integrity efforts, including system renewal projects. PSCo estimates that the PSIA will increase by $26.8 million in 2014 with a subsequent step increase of $24.7 million in 2015 in addition to the proposed changes in base rate revenue. In conjunction with the multi-year base rate step increases, PSCo is proposing a stay-out provision and an earnings test through the end of 2015. PSCo 2011 Electric Rate Case — In November 2011, PSCo filed a request with the CPUC to increase Colorado retail electric rates by $141.9 million. The request was based on a 2012 forecast test year, a 10.75 percent ROE, an electric rate base of $5.4 billion and an equity ratio of 56 percent. In April 2012, the CPUC approved a comprehensive multi-year settlement agreement, which covers 2012 through 2014. Key terms of the agreement include the following:
Table of Contents
• PSCo would implement an annual electric rate increase of $73 million in 2012. The rate increase was effective on May 1, 2012. In addition, PSCo will implement incremental electric rate increases of $16 million on Jan. 1, 2013 and $25 million on Jan. 1, 2014. These rate increases are net of the shift of the costs from the PCCA and the TCA clauses to base rates.
130

SmartGridCity (SGC) Cost Recovery — PSCo requested recovery of the revenue requirements associated with $45 million of capital and $4 million of annual O&M costs incurred to develop and operate SGC as part of its 2010 electric rate case. In February 2011, the CPUC allowed recovery of approximately $28 million of the capital cost and all of the O&M costs. In December 2011, PSCo requested CPUC approval for the recovery of the remaining capital investment in SGC and also provided the additional information requested. On Jan. 17, 2013, the ALJ recommended denial of PSCo’s request for recovery of the remaining portion of the SGC investment. On Feb. 6, 2013, PSCo filed exceptions to the ALJ recommendation requesting that the CPUC grant recovery of its investment. However, as a result of the ALJ’s recommended decision denying recovery, PSCo recognized a $10.7 million pre-tax charge in 2012, representing the net book value of the disallowed investment, which is included in O&M expense. Electric, Purchased Gas and Resource Adjustment Clauses DSM and the DSMCA — The CPUC approved higher savings goals and a slightly higher financial incentive mechanism for PSCo’s electric DSM energy efficiency programs starting in 2012. Savings goals are 330 GWh in 2012 and 356 GWh in 2013 with incentives awarded as one installment in the year following plan achievements. PSCo is able to earn an incentive on 11 percent of net economic benefits at an achievement level of 130 percent and a maximum annual incentive of $30 million. The CPUC approved the PSCo electric and gas DSM budget of $115.5 million and $13.3 million, respectively, effective Jan. 1, 2013. Energy efficiency and demand response related DSM costs are recovered through a combination of the DSMCA riders and base rates. Electric DSMCA rates are designed to collect $26.8 million in 2013 with the remainder of the electric DSM expenditures collected through base rates. DSMCA riders are adjusted biannually to capture program costs, performance incentives, and any over- or under-recoveries are trued-up in the following year. REC Sharing — In May 2011, the CPUC determined that margin sharing on stand-alone REC transactions would be shared 20 percent to PSCo and 80 percent to customers beginning in 2011 and ultimately becoming 10 percent to PSCo and 90 percent to customers by 2014. The CPUC also approved a change to the treatment of hybrid REC trading margins (RECs that are bundled with energy) that allows the customers’ share of the margins to be netted against the RESA regulatory asset balance. In March 2012, the CPUC approved an annual margin sharing on the first $20 million of margins on hybrid REC trades of 80 percent to the customers and 20 percent to PSCo. Margins in excess of the $20 million are to be shared 90 percent to the customers and 10 percent to PSCo. The CPUC authorized PSCo to return to customers unspent carbon offset funds by crediting the RESA regulatory asset balance. PSCo credited the RESA regulatory asset balance $46 million and $37 million in 2012 and 2011, respectively. The credits include the customers’ share of REC trading margins and the customers’ share of carbon offset funds.
Table of Contents
• The settlement reflects an authorized ROE of 10 percent and an equity ratio of 56 percent. • For 2012 through 2014, incremental property taxes in excess of $76.7 million (2010-2011 historic test year property taxes) will be deferred over a three-
year period with the amortization effective the first year after the deferral. To the extent that PSCo is successful in the manufacturer’s sales tax refund lawsuit, PSCo will credit such refunds first against legal fees incurred to obtain the refund and then against the deferred property tax balances outstanding at the end of the 2014. Regarding the manufacturer’s sales tax refund case, PSCo was successful in the District Court and Court of Appeals, but in January 2013 the Colorado Supreme Court agreed to review this matter following an appeal by the Colorado Department of Revenue. Briefing will be completed by both parties in the next few months. It is uncertain when the Colorado Supreme Court will issue its decision.
• The signing parties agreed to implement an earnings test, in which customers and shareholders will share weather normalized earnings above an ROE of 10 percent. The sharing mechanism is as follows:
ROE Shareholders Customers > 10.0% < 10.2% 40 % 60 %> 10.2% < 10.5% 50 50 > 10.5% - 100
• PSCo agreed that it will not file for an electric rate increase that would take effect prior to Jan. 1, 2015, provided that net revenue requirements increase or decrease in excess of $10 million caused by changes in tax law, government mandates, or natural disasters may be deferred or recovered through a modified rate adjustment. In the event normalized base revenues in either 2012 or 2013 are 2.0 percent below 2011 actual levels adjusted to reflect the rate increases allowed for 2012 and 2013, PSCo has the right to an additional rate adjustment in the next year for 50 percent of the shortfall. The parties acknowledged that PSCo may file an electric rate increase as early as May 1, 2014, so long as no rate increase takes effect on either an interim or permanent basis prior to Jan. 1, 2015.
131

This sharing mechanism will be effective through 2014 to provide the CPUC an opportunity to review the framework and to review evidence regarding actual deliveries in relatively more complex markets. Pending and Recently Concluded Regulatory Proceedings — FERC Base Rate PSCo Transmission Formula Rate Cases — In April 2012, PSCo filed with the FERC to revise the wholesale transmission formula rates from a historic test year formula rate to a forecast transmission formula rate and to establish formula ancillary services rates. PSCo proposed that the formula rates be updated annually to reflect changes in costs, subject to a true-up. The request would increase PSCo’s wholesale transmission and ancillary services revenue by approximately $2.0 million annually. Various transmission customers taking service under the tariff protested the filing. In June 2012, the FERC issued an order accepting the proposed transmission and ancillary services formula rates, suspending the increase to November 2012, subject to refund, and setting the case for settlement judge or hearing procedures. PSCo has been engaged in discovery and initial settlement discussions with the intervenors and the FERC Staff. Separately, several wholesale customers filed a complaint with the FERC in June 2012 seeking to have the transmission formula rate ROE reduced from 10.25 to 9.15 percent effective July 1, 2012. If implemented, the ROE reduction would reduce PSCo transmission and ancillary rate revenues by approximately $1.8 million annually. In October 2012, the FERC issued an order accepting the complaint, consolidating the complaint with the April 2012 formula rate change filing, establishing a refund effective date of July 1, 2012, and setting the complaint for settlement judge and hearing procedures. The consolidated dockets are now in settlement discussions. If PSCo, the FERC Staff and intervenors do not reach settlement, the dockets would proceed to a contested hearing. PSCo 2011 Wholesale Electric Rate Case — In February 2011, PSCo filed with the FERC to change Colorado wholesale electric rates to formula based rates with an expected annual increase of $16.1 million for 2011. The request was based on a 2011 forecast test year, a 10.9 percent ROE, a rate base of $407.4 million and an equity ratio of 57.1 percent. The formula rate would be estimated each year for the following year and then trued-up to actual costs after the conclusion of the calendar year. In September 2011, PSCo implemented an interim rate increase of $7.8 million, subject to refund. In April 2012, PSCo filed an unopposed settlement agreement with wholesale customers for an annual rate increase of $7.8 million, reflecting a reduction to depreciation expense of $5.8 million and a lower ROE, ranging from 10.1 percent to 10.4 percent. The settlement was approved by the FERC in June 2012. SPS Pending Regulatory Proceedings — PUCT Base Rate SPS - Texas 2012 Electric Rate Case — In November 2012, SPS filed an electric rate case in Texas with the PUCT for an increase in annual revenue of approximately $90.2 million. The rate filing is based on a historic 12 month test year ended June 30, 2012 adjusted for known and measurable changes, a requested ROE of 10.65 percent, an electric rate base of $1.15 billion and an equity ratio of 52 percent. The procedural schedule is as follows:
In an effort to pursue settlement, the parties have asked the ALJ for a four week extension for filing Intervenor Direct Testimony, but that in the event the ultimate decision is delayed beyond July 1, 2013, that SPS could implement a surcharge for any approved increase for the period from July 1 to final rate implementation.
Table of Contents
• Intervenor Direct Testimony – March 22, 2013 • Staff Direct Testimony – April 2, 2013 • SPS Rebuttal Testimony – April 12, 2013 • Hearing Starts – April 23, 2013 • The procedural order also establishes July 1, 2013 as the latest date rates from this case will become effective.
132
Pending Regulatory Proceedings — NMPRC SPS - New Mexico 2012 Electric Rate Case — In December 2012, SPS filed an electric rate case in New Mexico with the NMPRC for an increase in annual revenue of approximately $45.9 million. The rate filing is based on a 2014 forecast test year, a requested ROE of 10.65 percent, a jurisdictional electric rate base of $479.8 million and an equity ratio of 53.89 percent. A NMPRC decision is expected in the fourth quarter of 2013 with the implementation of final rates anticipated in the first quarter of 2014. The procedural schedule is as follows:
Pending Regulatory Proceedings — FERC SPS Wholesale Rate Complaint — In April 2012, Golden Spread Electric Cooperative, Inc. (Golden Spread) filed a rate complaint with the FERC alleging that SPS’ rates for wholesale service were excessive. Golden Spread alleges that the base ROE currently charged to them through the SPS production formula rate, of 10.25 percent, and the SPS transmission base formula rate, ROE of 10.77 percent, is unjust and unreasonable. Golden Spread alleges that the appropriate base ROE is 9.15 percent, or an annual difference of approximately $3.3 million. An additional 50 basis point incentive is added to the base ROE for the transmission formula rate for SPS’ participation in the SPP RTO. Golden Spread is not contesting this transmission incentive. The FERC has taken no action on this complaint. 13. Commitments and Contingencies Commitments Capital Commitments — Xcel Energy has made commitments in connection with a portion of its projected capital expenditures. Xcel Energy’s capital commitments primarily relate to the following major projects: Nuclear Lifecycle Management and EPU — NSP-Minnesota is pursuing capital improvements to enhance plant safety through the extended licensed life of the Monticello facility. Planned improvements are expected to result in capacity increases at the Monticello generating plant of up to approximately 71 MW. The MPUC approved the CON for the EPU for Monticello in 2008. The license amendment application was filed with the NRC in November 2008. NSP-Minnesota expects to receive approval of the EPU project by the NRC in the second half of 2013. Pending approval by the NRC, NSP-Minnesota plans to implement the equipment changes needed to support the Monticello life extension and EPU projects during the planned spring 2013 refueling outage. In addition to the Monticello projects, NSP-Minnesota is also implementing life cycle management improvements at the Prairie Island facilities to help ensure their safe and reliable operation through 2034. The major capital investments for these activities at the Monticello and Prairie Island nuclear generating plants are expected to be completed in the years 2013 through 2017. CapX2020 — CapX2020 is an alliance of electric cooperatives, municipals and investor-owned utilities in the upper Midwest, including NSP System that has proposed several groups of transmission projects to be completed by 2020. Group 1 project investments consist of four transmission lines. Major construction began in 2010 on the Group 1 transmission lines with an expected completion date in 2015. NSP System’s investment depends on the routes and configurations approved by affected state commissions and on the allocation of costs borne by other participating utilities in the upper Midwest. CACJA — The CACJA required PSCo to file a plan to reduce annual emissions of NOx
by at least 70 to 80 percent or greater from 2008 levels by 2017 from the
coal fired generation. In September 2012, the EPA formally approved the Colorado SIP for regional haze, including changes to PSCo plants that include various projects including early shut down, fuel switching and SCR installation. PSCo Gas Transmission Integrity Management Programs – PSCo is proactively identifying and addressing the safety and reliability of natural gas transmission pipelines. The pipeline integrity efforts include system renewal projects and increased maintenance. SPS Transmission NTC — SPS has accepted NTCs for several hundred miles of transmission line and related substation projects based on needs identified through SPP’s various planning processes, including those associated with economics, reliability, generator interconnection or the load addition processes. One of the major projects committed to is the TUCO to Woodward District Extra High Voltage Interchange, a 345 kV transmission line. This line connects the TUCO substation near Lubbock, Texas with the OGE substation in Woodward, Okla. The PUCT approved SPS’ CCN to build the line in 2012. It is anticipated to be complete in 2014.
Table of Contents
● Intervenor and Staff Direct Testimony - May 6, 2013 ● Rebuttal Testimony - May 20, 2013 ● Hearing Starts - June 3, 2013
133

Fuel Contracts — Xcel Energy has entered into various long-term commitments for the purchase and delivery of a significant portion of its current coal, nuclear fuel and natural gas requirements. These contracts expire in various years between 2013 and 2060. Xcel Energy is required to pay additional amounts depending on actual quantities shipped under these agreements. The estimated minimum purchases for Xcel Energy under these contracts as of Dec. 31, 2012 are as follows:
Estimated coal requirements at Dec. 31, 2012 have been adjusted to account for Sherco Unit 3, which was shut down in November 2011 after experiencing a significant failure of its turbine, generator and exciter systems. Repairs to Sherco Unit 3 are expected to be substantially complete in 2013, followed by an extended period of commissioning and testing. See Note 5 for further discussion. Additional expenditures for fuel and natural gas storage and transportation will be required to meet expected future electric generation and natural gas needs. Xcel Energy’s risk of loss, in the form of increased costs from market price changes in fuel, is mitigated through the use of natural gas and energy cost-rate adjustment mechanisms, which provide for pass-through of most fuel, storage and transportation costs to customers. PPAs — NSP Minnesota, PSCo and SPS have entered into PPAs with other utilities and energy suppliers with expiration dates through 2033 for purchased power to meet system load and energy requirements, replace generation from company-owned units under maintenance or during outages, and meet operating reserve obligations. In general, these agreements provide for energy payments based on actual power taken under the contracts, as well as capacity payments. Certain PPAs accounted for as executory contracts also contain minimum energy purchase commitments. Capacity and energy payments are typically contingent on the independent power producing entity meeting certain contract obligations, including plant availability requirements. Certain contractual payments are adjusted based on market indices; however, the effects of price adjustments are mitigated through purchased energy cost recovery mechanisms. Included in electric fuel and purchased power expenses for PPAs accounted for as executory contracts were payments for capacity of $261.9 million, $325.3 million and $426.7 million in 2012, 2011 and 2010, respectively. At Dec. 31, 2012, the estimated future payments for capacity and energy that the utility subsidiaries of Xcel Energy are obligated to purchase pursuant to these executory contracts, subject to availability, are as follows:
Additional energy payments under these PPAs and PPAs accounted for as operating leases will be required to meet expected future electric demand. Leases — Xcel Energy leases a variety of equipment and facilities used in the normal course of business. Three of these leases qualify as capital leases and are accounted for accordingly. The assets and liabilities at the inception of a capital lease are recorded at the lower of fair market value or the present value of future lease payments and are amortized over the term of the contract.
Table of Contents
(Millions of Dollars) Coal Nuclear fuel Natural gas supply
Natural gas storage and
transportation 2013 $ 860.2 $ 92.3 $ 426.9 $ 273.0 2014 656.7 143.6 187.0 262.5 2015 532.0 86.5 177.8 256.7 2016 329.1 131.2 189.0 200.0 2017 310.8 128.9 196.2 157.6 Thereafter 598.5 830.2 1,401.0 1,282.4
Total $ 3,287.3 $ 1,412.7 $ 2,577.9 $ 2,432.2
(Millions of Dollars) Capacity Energy (a) 2013 $ 230.3 $ 114.2 2014 242.1 110.4 2015 241.5 116.4 2016 202.0 98.5 2017 173.3 90.3 Thereafter 628.6 959.9
Total $ 1,717.8 $ 1,489.7
(a) Excludes contingent energy payments for renewable PPAs.
134
WYCO was formed as a joint venture with CIG to develop and lease natural gas pipeline, storage, and compression facilities. Xcel Energy Inc. has a 50 percent ownership interest in WYCO. WYCO leases the facilities to CIG, and CIG operates the facilities, providing natural gas storage services to PSCo under a service arrangement. PSCo accounts for its Totem natural gas storage service arrangement with CIG as a capital lease. As a result, PSCo had $148.7 million and $152.7 million of capital lease obligations recorded for the arrangement as of Dec. 31, 2012 and 2011, respectively. Xcel Energy Inc. eliminates 50 percent of the capital lease obligation related to WYCO in the consolidated balance sheet along with an equal amount of Xcel Energy Inc.’s equity investment in WYCO. PSCo records amortization for its capital leases as cost of natural gas sold and transported on the consolidated statements of income. Total amortization expenses under capital lease assets were approximately $5.7 million, $3.2 million, and $5.3 million for 2012, 2011 and 2010, respectively. Following is a summary of property held under capital leases:
The remainder of the leases, primarily for certain PPAs, office space, railcars, generating facilities, trucks, aircraft, cars and power-operated equipment, are accounted for as operating leases. Total expenses under operating lease obligations for Xcel Energy were approximately $217.8 million, $204.8 million, and $197.4 million for 2012, 2011 and 2010, respectively. These expenses included capacity payments for PPAs accounted for as operating leases of $174.4 million, $160.5 million, and $163.7 million in 2012, 2011 and 2010, respectively, recorded to electric fuel and purchased power expenses. Included in the future commitments under operating leases are estimated future capacity payments under PPAs that have been accounted for as operating leases in accordance with the applicable accounting guidance. Future commitments under operating and capital leases are:
Variable Interest Entities — The accounting guidance for consolidation of variable interest entities requires enterprises to consider the activities that most significantly impact an entity’s financial performance, and power to direct those activities, when determining whether an enterprise is a variable interest entity’s primary beneficiary. PPAs — Under certain PPAs, NSP-Minnesota, PSCo and SPS purchase power from independent power producing entities that own natural gas or biomass fueled power plants for which the utility subsidiaries are required to reimburse natural gas or biomass fuel costs, or to participate in tolling arrangements under which the subsidiaries procure the natural gas required to produce the energy that they purchase. These specific PPAs create a variable interest in the associated independent power producing entity. Xcel Energy has determined that certain independent power producing entities are variable interest entities. Xcel Energy is not subject to risk of loss from the operations of these entities, and no significant financial support has been, or is in the future required to be provided other than contractual payments for energy and capacity set forth in the PPAs.
Table of Contents
(Millions of Dollars) 2012 2011 Storage, leaseholds and rights $ 200.5 $ 200.5 Gas pipeline 20.7 20.7 Property held under capital lease 221.2 221.2 Accumulated depreciation (35.5) (29.8)Total property held under capital leases, net $ 185.7 $ 191.4
PPA Total Operating Operating Operating (Millions of Dollars) Leases Leases (a) (b) Leases Capital Leases 2013 $ 27.1 $ 181.4 $ 208.5 $ 18.0 2014 26.3 186.0 212.3 18.0 2015 25.2 182.0 207.2 17.9 2016 22.2 173.9 196.1 17.2 2017 17.1 170.7 187.8 15.2 Thereafter 159.4 1,738.0 1,897.4 292.3
Total minimum obligation 378.6 Interest component of obligation (267.2)
Present value of minimum obligation $ 111.4 (c)
(a) Amounts do not include PPAs accounted for as executory contracts. (b) PPA operating leases contractually expire through 2033. (c) Future commitments exclude certain amounts related to Xcel Energy’s 50 percent ownership interest in WYCO.
135

Xcel Energy has evaluated each of these variable interest entities for possible consolidation, including review of qualitative factors such as the length and terms of the contract, control over O&M, control over dispatch of electricity, historical and estimated future fuel and electricity prices, and financing activities. Xcel Energy has concluded that these entities are not required to be consolidated in its consolidated financial statements because it does not have the power to direct the activities that most significantly impact the entities’ economic performance. Xcel Energy had approximately 3,324 MW and 3,773 MW of capacity under long-term PPAs as of Dec. 31, 2012 and 2011, respectively, with entities that have been determined to be variable interest entities. These agreements have expiration dates through the year 2033. Fuel Contracts — SPS purchases all of its coal requirements for its Harrington and Tolk electric generating stations from TUCO under contracts for those facilities that expire in 2016 and 2017, respectively. TUCO arranges for the purchase, receiving, transporting, unloading, handling, crushing, weighing, and delivery of coal to meet SPS’ requirements. TUCO is responsible for negotiating and administering contracts with coal suppliers, transporters and handlers. No significant financial support has been, or is in the future, required to be provided to TUCO by SPS, other than contractual payments for delivered coal. However, the fuel contracts create a variable interest in TUCO due to SPS’ reimbursement of certain fuel procurement costs. SPS has determined that TUCO is a variable interest entity. SPS has concluded that it is not the primary beneficiary of TUCO because SPS does not have the power to direct the activities that most significantly impact TUCO’s economic performance. Low-Income Housing Limited Partnerships — Eloigne and NSP-Wisconsin have entered into limited partnerships for the construction and operation of affordable rental housing developments which qualify for low-income housing tax credits. Xcel Energy Inc. has determined Eloigne and NSP-Wisconsin’s low-income housing limited partnerships to be variable interest entities primarily due to contractual arrangements within each limited partnership that establish sharing of ongoing voting control and profits and losses that does not consistently align with the partners’ proportional equity ownership. These limited partnerships are designed to qualify for low-income housing tax credits, and Eloigne and NSP-Wisconsin generally receive a larger allocation of the tax credits than the general partners at inception of the arrangements. Xcel Energy Inc. has determined that Eloigne and NSP-Wisconsin have the power to direct the activities that most significantly impact these entities’ economic performance, and therefore Xcel Energy Inc. consolidates these limited partnerships in its consolidated financial statements. Equity financing for these entities has been provided by Eloigne and NSP-Wisconsin and the general partner of each limited partnership, and Xcel Energy’s risk of loss is limited to its capital contributions, adjusted for any distributions and its share of undistributed profits and losses; no significant additional financial support has been, or is in the future, required to be provided to the limited partnerships by Eloigne or NSP-Wisconsin. Mortgage-backed debt typically comprises the majority of the financing at inception of each limited partnership and is paid over the life of the limited partnership arrangement. Obligations of the limited partnerships are generally secured by the housing properties of each limited partnership, and the creditors of each limited partnership have no significant recourse to Xcel Energy Inc. or its subsidiaries. Likewise, the assets of the limited partnerships may only be used to settle obligations of the limited partnerships, and not those of Xcel Energy Inc. or its subsidiaries. Amounts reflected in Xcel Energy’s consolidated balance sheets for the Eloigne and NSP-Wisconsin low-income housing limited partnerships include the following:
Technology Agreements — Xcel Energy has an amended contract that extends through June 30, 2019 with International Business Machines Corp. (IBM) for information technology services. The contract is cancelable at Xcel Energy’s option, although Xcel Energy would be obligated to pay 50 percent of the contract value for early termination. Xcel Energy capitalized or expensed $86.5 million, $93.6 million and $95.6 million associated with the IBM contract in 2012, 2011, and 2010, respectively.
Table of Contents
(Thousands of Dollars) Dec. 31, 2012 Dec. 31, 2011 Current assets $ 3,380 $ 4,034 Property, plant and equipment, net 72,489 90,914 Other noncurrent assets 6,044 8,053
Total assets $ 81,913 $ 103,001
Current liabilities $ 8,458 $ 12,297 Mortgages and other long-term debt payable 37,720 48,863 Other noncurrent liabilities 7,678 8,278
Total liabilities $ 53,856 $ 69,438
136

Xcel Energy’s contract with Accenture for information technology services extends through Jan. 31, 2017. The contract is cancelable at Xcel Energy’s option, although there are financial penalties for early termination. Xcel Energy capitalized or expensed $18.3 million, $15.2 million and $22.7 million associated with the Accenture contract in 2012, 2011 and 2010, respectively. Committed minimum payments under these obligations are as follows:
Guarantees and Indemnifications Xcel Energy Inc. and its subsidiaries provide guarantees and bond indemnities under specified agreements or transactions. The guarantees and bond indemnities issued by Xcel Energy Inc. guarantee payment or performance by its subsidiaries. As a result, Xcel Energy Inc.’s exposure under the guarantees and bond indemnities is based upon the net liability of the relevant subsidiary under the specified agreements or transactions. Most of the guarantees and bond indemnities issued by Xcel Energy Inc. and its subsidiaries limit the exposure to a maximum amount stated in the guarantees and bond indemnities. As of Dec. 31, 2012 and 2011, Xcel Energy Inc. and its subsidiaries had no assets held as collateral related to their guarantees, bond indemnities and indemnification agreements. Guarantees and Surety Bonds The following table presents guarantees and bond indemnities issued and outstanding, including those guarantees related to Xcel Energy Wholesale Group Inc., Seren Innovations, Inc., Utility Engineering Corporation, Viking Gas Transmission Co., and Xcel Energy Argentina Inc., which are components of discontinued operations, as of Dec. 31, 2012:
Table of Contents
IBM Accenture (Millions of Dollars) Agreement Agreement 2013 $ 36.0 $ 9.0 2014 34.6 8.8 2015 31.5 8.7 2016 30.7 8.7 2017 30.9 - Thereafter 45.4 -
(Millions of Dollars) Guarantor Guarantee
Amount Current Exposure
Triggering Event
Guarantee of the indemnification obligations of Xcel Energy Wholesale
Group Inc. under a stock purchase agreement (e) Xcel Energy Inc. $ 17.5 $ 17.5 (b) Guarantee of the indemnification obligations of Xcel Energy Argentina
Inc. under a stock purchase agreement (f) Xcel Energy Inc. 14.7 - (b) Guarantee of the indemnification obligations of various Xcel Energy Inc
subsidiaries under different asset purchase agreements (d) Xcel Energy Inc. 25.5 - (b) Guarantee of customer loans for the Farm Rewiring Program (g) NSP-Wisconsin 1.0 0.4 (c) Guarantee of the indemnification obligations of Xcel Energy Services Inc.
under the aircraft leases (h) Xcel Energy Inc. 10.3 - (a) Guarantee benefiting Young Gas Storage Company Ltd. (d) Xcel Energy Inc. 0.5 - (a)
Total guarantees issued $ 69.5 $ 17.9
Guarantee performance and payment of surety bonds for Xcel Energy
Inc. and its subsidiaries (k) Xcel Energy Inc. $ 29.6 (i) (j)
(a) Nonperformance and/or nonpayment. (b) Losses caused by default in performance of covenants or breach of any warranty or representation in the purchase agreement. (c) The debtor becomes the subject of bankruptcy or other insolvency proceedings. (d) The terms of these guarantees are continuing. Certain representations and warranties relating to corporate existence, transaction authorization and/or tax matters survive
indefinitely. As of Dec. 31, 2012, no claims had been made. (e) The indemnification provisions of the guarantee expired in 2010. As of Dec. 31, 2012, there is a pending indemnification claim causing the guarantee liability to remain
outstanding until the final resolution. Pursuant to the terms of its professional liability policy, Utility Engineering Corporation is insured up to $35 million. (f) Certain representations and warranties relating to tax matters survive until the expiration of their respective statutes of limitations. As of Dec. 31, 2012, no claims had been
made. (g) The term of this guarantee expires in 2017, which is the final scheduled repayment date for the loans. As of Dec. 31, 2012, no claims had been made by the lender. (h) The term of this guarantee expires in 2017 when the associated leases expire. (i) Due to the magnitude of projects associated with the surety bonds, the total current exposure of this indemnification cannot be determined. Xcel Energy Inc. believes the
exposure to be significantly less than the total amount of the outstanding bonds. (j) Failure of Xcel Energy Inc. or one of its subsidiaries to perform under the agreement that is the subject of the relevant bond. In addition, per the indemnity agreement between
Xcel Energy Inc. and the various surety companies, the surety companies have the discretion to demand that collateral be posted. (k) The surety bonds primarily relate to workers compensation benefits and utility projects. The workers compensation bonds are renewed annually and the project based bonds
expire in conjunction with the completion of the related projects.
137

Indemnification Agreements In connection with the acquisition of the 201 MW Nobles wind project in 2011, NSP-Minnesota agreed to indemnify the seller for losses arising out of a breach of certain representations and warranties. NSP-Minnesota’s indemnification obligation is capped at $20 million, in the aggregate, at Dec. 31, 2012 and Dec. 31, 2011. The indemnification obligation expires in March 2013. NSP-Minnesota has not recorded a liability related to this indemnity at Dec. 31, 2012 or 2011. In connection with the acquisition of 900 MW of natural gas-fired generation from subsidiaries of Calpine Development Holdings Inc. in 2010, PSCo agreed to indemnify the seller for losses arising out of a breach of certain representations and warranties. The aggregate liability for PSCo pursuant to these indemnities is not subject to a capped dollar amount. The indemnification obligation expired in December 2012. PSCo has not recorded a liability related to this indemnity at Dec. 31, 2012 or 2011. Xcel Energy Inc. and its subsidiaries provide other indemnifications through contracts entered into in the normal course of business. These are primarily indemnifications against adverse litigation outcomes in connection with underwriting agreements, as well as breaches of representations and warranties, including corporate existence, transaction authorization and income tax matters with respect to assets sold. Xcel Energy Inc.’s and its subsidiaries’ obligations under these agreements may be limited in terms of time and amount. The maximum potential amount of future payments under these indemnifications cannot be reasonably estimated as the obligated amounts of these indemnifications often are not explicitly stated. Environmental Contingencies Xcel Energy has been or is currently involved with the cleanup of contamination from certain hazardous substances at several sites. In many situations, the subsidiary involved believes it will recover some portion of these costs through insurance claims. Additionally, where applicable, the subsidiary involved is pursuing, or intends to pursue, recovery from other PRPs and through the regulated rate process. New and changing federal and state environmental mandates can also create added financial liabilities for Xcel Energy, which are normally recovered through the regulated rate process. To the extent any costs are not recovered through the options listed above, Xcel Energy would be required to recognize an expense. Site Remediation — Various federal and state environmental laws impose liability, without regard to the legality of the original conduct, where hazardous substances or other regulated materials have been released to the environment. Xcel Energy Inc.’s subsidiaries may sometimes pay all or a portion of the cost to remediate sites where past activities of their predecessors or other parties have caused environmental contamination. Environmental contingencies could arise from various situations, including sites of former MGPs operated by Xcel Energy Inc.’s subsidiaries or their predecessors, or other entities; and third-party sites, such as landfills, for which one or more of Xcel Energy Inc.’s subsidiaries are alleged to be a PRP that sent hazardous materials and wastes to that site. MGP Sites Ashland MGP Site — NSP-Wisconsin has been named a PRP for contamination at a site in Ashland, Wis. The Ashland site includes property owned by NSP-Wisconsin, which was a site previously operated by a predecessor company as a MGP facility (the Upper Bluff), and two other properties: an adjacent city lakeshore park area (Kreher Park), on which an unaffiliated third party previously operated a sawmill and conducted creosote treating operations; and an area of Lake Superior’s Chequamegon Bay adjoining the park (the Sediments). The EPA issued its Record of Decision (ROD) in 2010, which describes the preferred remedy the EPA has selected for the cleanup of the Ashland site. In 2011, the EPA issued special notice letters identifying several entities, including NSP-Wisconsin, as PRPs, for future remediation at the site. The special notice letters requested that those PRPs participate in negotiations with the EPA regarding how the PRPs intended to conduct or pay for the remediation at the Ashland site. As a result of those settlement negotiations, the EPA agreed to segment the Ashland site into separate areas. The first area (Phase I Project Area) includes soil and groundwater in Kreher Park and the Upper Bluff. The second area includes the Sediments.
Table of Contents
138

In October 2012, a settlement among the EPA, the WDNR, the Bad River and Red Cliff Bands of the Lake Superior Tribe of Chippewa Indians and NSP-Wisconsin was approved by the U.S. District Court for the Western District of Wisconsin. This settlement resolves claims against NSP-Wisconsin for its alleged responsibility for the remediation of the Phase I Project Area. Under the terms of the settlement, NSP-Wisconsin agreed to perform the remediation of the Phase I Project Area, but does not admit any liability with respect to the Ashland site. The settlement reflects a cost estimate for the clean up of the Phase I Project Area of $40 million. The settlement also resolves claims by the federal, state and tribal trustees against NSP-Wisconsin for alleged natural resource damages at the Ashland site, including both the Phase I Project Area and the Sediments. As part of the settlement, NSP-Wisconsin will convey approximately 1,390 acres of land to the State of Wisconsin. Fieldwork to address the Phase I Project Area at the Ashland site began at the end of 2012 and will continue into 2013. Negotiations between the EPA and NSP-Wisconsin regarding who will pay or perform the cleanup of the Sediments are ongoing. The EPA’s ROD for the Ashland site includes estimates that the cost of the preferred remediation related to the Sediments is between $63 million and $77 million, with a potential deviation in such estimated costs of up to 50 percent higher to 30 percent lower. In August 2012, NSP-Wisconsin also filed litigation against other PRPs for their share of the cleanup costs for the Ashland site. Trial for this matter has been scheduled for June 2014. At Dec. 31, 2012 and 2011, NSP-Wisconsin had recorded a liability of $103.7 million and $104.3 million, respectively, for the Ashland site based upon potential remediation and design costs together with estimated outside legal and consultant costs; of which $20.1 million and $26.6 million, respectively, was considered a current liability. NSP-Wisconsin’s potential liability, the actual cost of remediation and the time frame over which the amounts may be paid are subject to change. NSP-Wisconsin also continues to work to identify and access state and federal funds to apply to the ultimate remediation cost of the entire site. Unresolved issues or factors that could result in higher or lower NSP-Wisconsin remediation costs for the Ashland site include the cleanup approach implemented for the Sediments, which party implements the cleanup, the timing of when the cleanup is implemented, potential contributions by other PRPs and whether federal or state funding may be directed to help offset remediation costs at the Ashland site. Historically, NSP-Wisconsin has deferred the estimated site remediation costs, as a regulatory asset, based on an expectation that the PSCW will continue to allow NSP-Wisconsin to recover payments for environmental remediation from its customers. The PSCW has consistently authorized in NSP-Wisconsin rates recovery of all remediation costs incurred at the Ashland site, and has authorized recovery of MGP remediation costs by other Wisconsin utilities. External MGP remediation costs are subject to deferral in the Wisconsin retail jurisdiction and are reviewed for prudence as part of the Wisconsin retail rate case process. Under an existing PSCW policy, utilities have recovered remediation costs for MGPs in natural gas rates, amortized over a four- to six-year period. The PSCW has not allowed utilities to recover their carrying costs on unamortized regulatory assets for MGP remediation. In a recent rate case decision, however, the PSCW recognized the potential magnitude of the future liability for the cleanup at the Ashland site. In December 2012, the PSCW granted an exception to its existing policy at the request of NSP-Wisconsin. The elements of this exception include: 1) approval to begin recovery of estimated Phase 1 Project costs beginning on Jan. 1, 2013; 2) approval to amortize these estimated costs over a ten-year period; and 3) approval to apply a 3 percent carrying cost to the unamortized regulatory asset and to recover these carrying costs from natural gas customers. Implementation of this exception will mitigate the rate impact to natural gas customers and the risk to NSP-Wisconsin for a longer amortization. Other MGP Sites — Xcel Energy is currently involved in investigating and/or remediating several other MGP sites where hazardous or other regulated materials may have been deposited. Xcel Energy has identified eight sites across all of its service territories, where former MGP activities have or may have resulted in site contamination and are under current investigation and/or remediation. At some or all of these MGP sites, there are other parties that may have responsibility for some portion of any remediation. Xcel Energy anticipates that the majority of the remediation at these sites will continue through at least 2014. Xcel Energy had accrued a total of $3.0 million and $3.9 million for all of these sites at Dec. 31, 2012 and 2011, respectively. There may be insurance recovery and/or recovery from other PRPs that will offset any costs incurred. Xcel Energy anticipates that any amounts spent will be fully recovered from customers. Asbestos Removal — Some of Xcel Energy’s facilities contain asbestos. Most asbestos will remain undisturbed until the facilities that contain it are demolished or removed. Xcel Energy has recorded an estimate for final removal of the asbestos as an ARO. It may be necessary to remove some asbestos to perform maintenance or make improvements to other equipment. The cost of removing asbestos as part of other work is not expected to be material and is recorded as incurred as operating expenses for maintenance projects, capital expenditures for construction projects or removal costs for demolition projects.
Table of Contents
139

Environmental Requirements EPA GHG Regulation — In 2009, the EPA issued its “endangerment” finding that GHG emissions pose a threat to public health and welfare. In 2011, new EPA permitting requirements became effective for GHG emissions of new and modified large stationary sources, which are applicable to the construction of new power plants or power plant modifications that increase emissions above a certain threshold. Xcel Energy is unable to determine the cost of compliance with these new EPA requirements as it is not clear whether these requirements will apply to future changes at Xcel Energy’s power plants. GHG New Source Performance Standard Proposal (NSPS) and Emission Guideline for Existing Sources — In April 2012, the EPA proposed a GHG NSPS for newly constructed power plants. The proposal requires that CO
2 emission rates be equal to a natural gas combined-cycle plant, even if the plant is coal-
fired. The EPA also proposed that NSPS not apply to modified or reconstructed existing power plants and that installation of control equipment on existing plants would not constitute a “modification” to those plants under the NSPS program. It is not possible to evaluate the impact of this regulation until its final requirements are known. The EPA also plans to propose GHG regulations applicable to emissions from existing power plants under the CAA. It is not known when the EPA will propose new standards for existing sources. New Mexico GHG Regulations — In 2010, the EIB adopted two regulations to limit GHG emissions, including CO2 emissions from power plants and other
industrial sources. The EIB repealed both regulations in the first quarter of 2012. Western Resource Advocates and New Energy Economy, Inc. have since filed appeals with the New Mexico Court of Appeals to challenge each of the EIB’s decisions to repeal the two GHG rules. CSAPR — In 2011, the EPA issued the CSAPR to address long range transport of PM and ozone by requiring reductions in SO
2 and NOx from utilities in the
eastern half of the United States. For Xcel Energy, the rule would have applied in Minnesota, Wisconsin and Texas. The CSAPR would have set more stringent requirements than the proposed Clean Air Transport Rule and specifically would have required plants in Texas to reduce their SO2 and annual NOx
emissions. The rule also would have created an emissions trading program. In August 2012, the U.S. Court of Appeals for the D.C. Circuit vacated the CSAPR and remanded it back to the EPA. The D.C. Circuit also stated that the EPA must continue administering the CAIR pending adoption of a valid replacement. In October 2012, the EPA, as well as state and local governments and environmental advocates, petitioned the D.C. Circuit to rehear the CSAPR appeal. In January 2013, the D.C. Circuit denied all requests for rehearing. It is not yet known whether the D.C. Circuit’s decision will be appealed, or how the EPA might approach a replacement rule. Therefore, it is not known what requirements may be imposed in the future. If the EPA continues administering the CAIR while the CSAPR or a replacement rule is pending, Xcel Energy expects to comply with the CAIR as described below. CAIR — In 2005, the EPA issued the CAIR to further regulate SO
2 and NOx emissions. The CAIR applies to Texas and Wisconsin. The CAIR does not apply
to Minnesota. Under the CAIR’s cap and trade structure, companies can comply through capital investments in emission controls or purchase of emission allowances from other utilities making reductions on their systems. NSP-Wisconsin purchased allowances in 2012 and plans to continue to purchase allowances in 2013 to comply with the CAIR. In the SPS region, installation of low-NOx combustion control technology was completed in 2012 on Tolk Unit 1. SPS plans to install the same combustion control technology on Tolk Unit 2 in 2014. These installations will reduce or eliminate SPS’ need to purchase NOx emission allowances. In addition, SPS has sufficient SO2 allowances to comply with the CAIR in 2013. At Dec. 31, 2012, the estimated annual CAIR NOx allowance cost
for Xcel Energy did not have a material impact on the results of operations, financial position or cash flows. Electric Generating Unit (EGU) Mercury and Air Toxics Standards (MATS) Rule — The final EGU MATS rule became effective in April 2012. The EGU MATS rule sets emission limits for acid gases, mercury and other hazardous air pollutants and requires coal-fired utility facilities greater than 25 MW to demonstrate compliance within three to four years of the effective date. Xcel Energy expects to comply with the EGU MATS rule through a combination of mercury and other emission control projects. Xcel Energy plans to cease coal combustion at Bay Front Unit 5 before the MATS compliance date, therefore the MATS rule will not be applicable for NSP-Wisconsin. Bay Front Unit 5 will become a natural gas-fired unit subject to the Industrial Boiler (IB) MACT. Xcel Energy believes EGU MATS costs will be recoverable through regulatory mechanisms and does not expect a material impact on results of operations, financial position or cash flows.
Table of Contents
140

Minnesota Mercury Legislation — NSP-Minnesota installed sorbent control systems at the Sherco Unit 3 and A.S. King generating plants and has obtained MPUC approval to install mercury controls on Sherco Units 1 and 2 by the end of 2014. NSP-Minnesota projects installation costs of $9.0 million for the mercury controls on the units and believes these costs would be recoverable through regulatory mechanisms. IB MACT Rules — In 2011, the EPA finalized IB MACT rules to regulate boilers and process heaters fueled with coal, biomass and liquid fuels, which would apply to NSP-Wisconsin’s Bay Front Units 1 and 2. The capital cost to install controls to meet the requirements in the final reconsidered rule is estimated to be $9.0 million per unit, which are targeted for completion in 2014. Regional Haze Rules — In 2005, the EPA finalized amendments to its regional haze rules, known as BART, which require the installation and operation of emission controls for industrial facilities emitting air pollutants that reduce visibility in certain national parks and wilderness areas. Xcel Energy generating facilities in several states are subject to BART requirements. Individual states were required to identify the facilities located in their states that will have to reduce SO
2, NOx and PM emissions under BART and then set emissions limits for those facilities.
PSCo In 2011, the Colorado Air Quality Control Commission (CAQCC) approved a BART SIP incorporating the Colorado CACJA emission reduction plan, which will satisfy regional haze requirements. The Colorado legislature enacted a statute approving the SIP (the Colorado SIP), which was signed into law in 2011. Subsequently, the Colorado Mining Association (CMA) challenged the Colorado SIP in a Colorado District Court. In June 2012, the CMA’s appeal was dismissed. The CMA appealed this decision to the Colorado Court of Appeals The CMA has requested that the Colorado Supreme Court hear the case directly, bypassing the Court of Appeals. The Supreme Court has not yet made a decision on the CMA’s petition. In September 2012, the EPA granted final approval of the Colorado SIP, including the CACJA emission reduction plan for PSCo, as satisfying BART requirements. The emission controls are expected to be installed between 2014 and 2017. Projected costs for emission controls at the Hayden and Pawnee plants are $334.2 million. PSCo expects the cost of any required capital investment will be recoverable from customers. In 2010, two environmental groups petitioned the DOI to certify that 12 coal-fired boilers and one coal-fired cement kiln in Colorado are contributing to visibility problems in Rocky Mountain National Park. The following PSCo plants are named in the petition: Cherokee, Hayden, Pawnee and Valmont. The groups allege that the Colorado BART rule is inadequate to satisfy the CAA mandate of ensuring reasonable further progress towards restoring natural visibility conditions in the park. It is not known when the DOI will rule on the petition. NSP-Minnesota In 2009, the MPCA approved the SIP for Minnesota (the Minnesota SIP), and submitted it to the EPA for approval. The MPCA selected the BART controls for Sherco Units 1 and 2 to improve visibility in the national parks. The MPCA concluded SCRs should not be required because the minor visibility benefits derived from SCRs do not outweigh the substantial costs. The MPCA’s source-specific BART controls for Sherco Units 1 and 2 consist of combustion controls for NOx and scrubber upgrades for SO2. The combustion controls have been installed on Sherco Units 1 and 2. The scrubber upgrades are underway
and scheduled to be completed by January 2015. The EPA’s preliminary review of the Minnesota SIP in 2011 indicated that SCR controls should be added to Sherco Units 1 and 2. Subsequently, the EPA and MPCA both determined that CSAPR meets BART requirements for purposes of the Minnesota SIP. In addition, the MPCA retained its source-specific BART determination for Sherco Units 1 and 2 from the 2009 Minnesota SIP. The EPA approved the Minnesota SIP for EGUs, and also approved the source-specific emission limits for Sherco Units 1 and 2 as strengthening the Minnesota SIP, but avoided characterizing them as BART limits. In August 2012, the National Parks Conservation Association, Sierra Club, Voyageurs National Park Association, Friends of the Boundary Waters Wilderness, Minnesota Center for Environmental Advocacy and Fresh Energy appealed the EPA’s approval of the Minnesota SIP to the U.S. Court of Appeals for the Eight Circuit. The Court denied intervention in the case to NSP-Minnesota and other regulated parties who petitioned to intervene. It is not yet known how the D.C. Circuit’s reversal of the CSAPR may impact the EPA’s approval of the Minnesota SIP.
Table of Contents
141

The estimated cost for meeting the BART, regional haze and other CAA requirements is approximately $50 million, of which $31 million has already been spent on projects to reduce NOx emissions on Sherco Units 1 and 2. Xcel Energy anticipates that all costs associated with BART compliance will be fully recoverable through regulatory recovery mechanisms. If the above litigation results in further EPA proceedings concerning the Minnesota SIP, such proceedings may consider whether SCRs should be required for Sherco Units 1 and 2. In addition to the regional haze rules, there are other visibility rules related to a program called the Reasonably Attributable Visibility Impairment (RAVI) program. In 2009, the DOI certified that a portion of the visibility impairment in Voyageurs and Isle Royale National Parks is reasonably attributable to emissions from NSP-Minnesota’s Sherco Units 1 and 2. The EPA is required to make its own determination as to whether Sherco Units 1 and 2 cause or contribute to RAVI and, if so, whether the level of controls required by the MPCA is appropriate. The EPA plans to issue a separate notice on the issue of BART for Sherco Units 1 and 2 under the RAVI program. It is not yet known when the EPA will publish a proposal under RAVI or what that proposal will entail. In December 2012, a lawsuit against the EPA was filed in the U.S. District Court for the District of Minnesota by the following organizations: National Parks Conservation Association, Minnesota Center for Environmental Advocacy, Friends of the Boundary Waters Wilderness, Voyageurs National Park Association, Fresh Energy and Sierra Club. The lawsuit alleges that the EPA has failed to perform a nondiscretionary duty to determine BART for the Sherco Units 1 and 2 under the RAVI program. The EPA filed an answer denying the allegations and asserting that it did not have a nondiscretionary duty under the RAVI program. NSP-Minnesota has asked the Court to allow it to intervene in this litigation. The Court is expected to rule on NSP-Minnesota’s request by mid-March 2013. SPS Harrington Units 1 and 2 are potentially subject to BART. Texas has developed a SIP (the Texas SIP) that finds the CAIR equal to BART for EGUs. As a result, no additional controls beyond CAIR compliance would be required. In May 2012, the EPA deferred its review of the Texas SIP in its final rule allowing states to find that CSAPR compliance meets BART requirements for EGUs. It is not yet known how the D.C. Circuit’s reversal of the CSAPR may impact the EPA’s approval of the Texas SIP. Revisions to National Ambient Air Quality Standards (NAAQS) for PM — In December 2012, the EPA lowered the primary health-based NAAQS for annual average fine PM and retained the current daily standard for fine PM. In areas where Xcel Energy operates power plants, current monitored air concentrations are below the level of the final annual primary standard. The EPA is expected to designate non-compliant locations by December 2014. States would then study the sources of the nonattainment and make emission reduction plans to attain the standards. It is not possible to evaluate the impact of this regulation further until the final designations have been made. Federal Clean Water Act (CWA) Section 316 (b) — The federal CWA requires the EPA to regulate cooling water intake structures to assure that these structures reflect the best technology available for minimizing adverse environmental impacts to aquatic species. In 2011, the EPA published the proposed rule that sets standards for minimization of aquatic species impingement, but leaves entrainment reduction requirements at the discretion of the permit writer and the regional EPA office. The proposed rule is expected to be finalized in July 2013. It is not possible to provide an accurate estimate of the overall cost of this rulemaking at this time due to the uncertainty of the final regulatory requirements. NSP-Minnesota submitted its Black Dog CWA compliance plan for MPCA review and approval in 2010. The MPCA is currently reviewing the proposal in consultation with the EPA. Proposed Coal Ash Regulation — Xcel Energy’s operations are subject to federal and state laws that impose requirements for handling, storage, treatment and disposal of hazardous waste. In 2010, the EPA published a proposed rule on whether to regulate coal combustion byproducts (coal ash) as hazardous or nonhazardous waste. Coal ash is currently exempt from hazardous waste regulation. Xcel Energy’s costs for the management and disposal of coal ash would significantly increase and the beneficial reuse of coal ash would be negatively impacted if the EPA ultimately issues a rule under which coal ash is regulated as hazardous waste. The EPA has not announced a planned date for a final rule. The timing, scope and potential cost of any final rule that might be implemented are not determinable at this time. PSCo Notice of Violation — In 2002, PSCo received an NOV from the EPA alleging violations of the New Source Review (NSR) requirements of the CAA at the Comanche Station and Pawnee Generating Station in Colorado. The NOV alleges that various maintenance, repair and replacement projects at the plants in the mid to late 1990s should have required a permit under the NSR process. PSCo believes it has acted in full compliance with the CAA and NSR process. PSCo also believes that the projects identified in the NOV fit within the routine maintenance, repair and replacement exemption contained within the NSR regulations or are otherwise not subject to the NSR requirements. PSCo disagrees with the assertions contained in the NOV and intends to vigorously defend its position. It is not known whether any costs would be incurred as a result of this NOV.
Table of Contents
142

NSP-Minnesota NOV — In 2011, NSP-Minnesota received an NOV from the EPA alleging violations of the NSR requirements of the CAA at the Sherco plant and Black Dog plant in Minnesota. The NOV alleges that various maintenance, repair and replacement projects at the plants in the mid 2000s should have required a permit under the NSR process. NSP-Minnesota believes it has acted in full compliance with the CAA and NSR process. NSP-Minnesota also believes that the projects identified in the NOV fit within the routine maintenance, repair and replacement exemption contained within the NSR regulations or are otherwise not subject to the NSR requirements. NSP-Minnesota disagrees with the assertions contained in the NOV and intends to vigorously defend its position. It is not known whether any costs would be incurred as a result of this NOV. Asset Retirement Obligations Recorded AROs — AROs have been recorded for plant related to nuclear production, steam production, wind production, electric transmission and distribution, natural gas transmission and distribution and office buildings. The steam production obligation includes asbestos, ash-containment facilities, radiation sources and decommissioning. The asbestos recognition associated with the steam production includes certain plants at NSP-Minnesota, NSP-Wisconsin, PSCo and SPS. NSP-Minnesota also recorded asbestos recognition for its general office building. This asbestos abatement removal obligation originated in 1973 with the CAA, which applied to the demolition of buildings or removal of equipment containing asbestos that can become airborne on removal. AROs also have been recorded for NSP-Minnesota, PSCo and SPS steam production related to ash-containment facilities such as bottom ash ponds, evaporation ponds and solid waste landfills. The origination dates on the ARO recognition for ash-containment facilities at steam plants was the in-service dates of the various facilities. Additional AROs have been recorded for NSP-Minnesota and PSCo steam production plant related to radiation sources in equipment used to monitor the flow of coal, lime and other materials through feeders. NSP-Minnesota and PSCo have also recorded AROs for the retirement and removal of assets at certain wind production facilities for which the land is leased and removal is required by contract, with the origination dates being the in-service date of the various facilities. Xcel Energy has recognized an ARO for the retirement costs of natural gas mains at NSP-Minnesota, NSP-Wisconsin and PSCo. In addition, an ARO was recognized for the removal of electric transmission and distribution equipment at NSP-Minnesota, NSP-Wisconsin, PSCo and SPS, which consists of many small potential obligations associated with PCBs, mineral oil, storage tanks, treated poles, lithium batteries, mercury and street lighting lamps. These electric and natural gas assets have numerous in-service dates for which it is difficult to assign the obligation to a particular year. Therefore, the obligation was measured using an average service life. For the nuclear assets, the ARO associated with the decommissioning of the NSP-Minnesota nuclear generating plants, Monticello and Prairie Island, originated with the in-service date of the facility. See Note 14 for further discussion of nuclear obligations. A reconciliation of Xcel Energy’s AROs is shown in the tables below for the years ended Dec. 31, 2012 and 2011:
The aggregate fair value of NSP-Minnesota’s legally restricted assets, for purposes of funding future nuclear decommissioning, was $1.5 billion as of Dec. 31, 2012, consisting of external investment funds.
Table of Contents
Beginning Revisions Ending Balance Liabilities Liabilities to Prior Balance (Thousands of Dollars) Jan. 1, 2012 Recognized Settled Accretion Estimates Dec. 31, 2012 Electric plant Steam and other production asbestos $ 54,342 $ 1,962 $ (9,372) $ 3,417 $ (4,888) $ 45,461 Steam and other production ash containment 41,158 - - 1,609 18,843 61,610 Steam production radiation sources 139 - - 10 - 149 Nuclear production decommissioning 1,482,741 - - 75,301 (11,684) 1,546,358 Wind production 40,515 2,928 - 2,068 (9,647) 35,864 Electric transmission and distribution 30,704 - - 1,114 (3,788) 28,030 Natural gas plant Gas transmission and distribution 1,059 - - 68 - 1,127 Common and other property Common general plant asbestos 1,135 - - 62 - 1,197
Total liability $ 1,651,793 $ 4,890 $ (9,372) $ 83,649 $ (11,164) $ 1,719,796
143

In 2012, revisions were made for nuclear decommissioning, asbestos, ash-containment facilities, wind facilities and electric transmission and distribution AROs due to revised estimated cash flows.
The aggregate fair value of NSP-Minnesota’s legally restricted assets, for purposes of funding future nuclear decommissioning, was $1.3 billion as of Dec. 31, 2011, including external and internal investment funds. In 2011, revisions were made for nuclear decommissioning, asbestos, ash-containment facilities, radiation sources and electric transmission and distribution AROs due to revised estimated cash flows. Indeterminate AROs — PSCo has underground natural gas storage facilities that have special closure requirements for which the final removal date cannot be determined; therefore, an ARO has not been recorded. Removal Costs — Xcel Energy records a regulatory liability for the plant removal costs of steam and other generation, transmission and distribution facilities of its utility subsidiaries. Generally, the accrual of future non-ARO removal obligations is not required. However, long-standing ratemaking practices approved by applicable state and federal regulatory commissions have allowed provisions for such costs in historical depreciation rates. These removal costs have accumulated over a number of years based on varying rates as authorized by the appropriate regulatory entities. Given the long time periods over which the amounts were accrued and the changing of rates over time, the utility subsidiaries have estimated the amount of removal costs accumulated through historic depreciation expense based on current factors used in the existing depreciation rates. The accumulated balances by entity were as follows at Dec. 31:
Nuclear Insurance NSP-Minnesota’s public liability for claims resulting from any nuclear incident is limited to $12.6 billion under the Price-Anderson amendment to the Atomic Energy Act. NSP-Minnesota has secured $375 million of coverage for its public liability exposure with a pool of insurance companies. The remaining $12.2 billion of exposure is funded by the Secondary Financial Protection Program, available from assessments by the federal government in case of a nuclear accident. NSP-Minnesota is subject to assessments of up to $117.5 million per reactor per accident for each of its three licensed reactors, to be applied for public liability arising from a nuclear incident at any licensed nuclear facility in the United States. The maximum funding requirement is $17.5 million per reactor during any one year. These maximum assessment amounts are both subject to inflation adjustment by the NRC and state premium taxes. The NRC’s last adjustment was effective April 2010.
Table of Contents
Beginning Revisions Ending Balance Liabilities Liabilities to Prior Balance (Thousands of Dollars) Jan. 1, 2011 Recognized Settled Accretion Estimates Dec. 31, 2011 Electric plant Steam and other production asbestos $ 93,629 $ - $ (514) $ 5,958 $ (44,731) $ 54,342 Steam and other production ash containment 19,688 - - 919 20,551 41,158 Steam production radiation sources 166 - - 12 (39) 139 Nuclear production decommissioning 809,474 - - 57,641 615,626 (a) 1,482,741 Wind production 38,553 - - 1,962 - 40,515 Electric transmission and distribution 5,727 - - 290 24,687 30,704 Natural gas plant Gas transmission and distribution 996 - - 63 - 1,059 Common and other property Common general plant asbestos 1,077 - - 58 - 1,135
Total liability $ 969,310 $ - $ (514) $ 66,903 $ 616,094 $ 1,651,793
(a) The increase is primarily due to the completion of NSP-Minnesota’s triennial nuclear decommissioning study, which reflects an increase in the estimated cost of retirement, increase in the escalation rates for each nuclear unit and a decrease in the discount rate used to calculate the net present value of the future cash flows.
(Millions of Dollars) 2012 2011 NSP-Minnesota $ 377 $ 382 NSP-Wisconsin 114 109 PSCo 365 380 SPS 67 74
Total Xcel Energy $ 923 $ 945
144

NSP-Minnesota purchases insurance for property damage and site decontamination cleanup costs from Nuclear Electric Insurance Ltd. (NEIL). The coverage limits are $2.25 billion for each of NSP-Minnesota’s two nuclear plant sites. NEIL also provides business interruption insurance coverage, including the cost of replacement power obtained during certain prolonged accidental outages of nuclear generating units. Premiums are expensed over the policy term. All companies insured with NEIL are subject to retroactive premium adjustments if losses exceed accumulated reserve funds. Capital has been accumulated in the reserve funds of NEIL to the extent that NSP-Minnesota would have no exposure for retroactive premium assessments in case of a single incident under the business interruption and the property damage insurance coverage. However, in each calendar year, NSP-Minnesota could be subject to maximum assessments of approximately $16.5 million for business interruption insurance and $35.8 million for property damage insurance if losses exceed accumulated reserve funds. Legal Contingencies Xcel Energy is involved in various litigation matters that are being defended and handled in the ordinary course of business. The assessment of whether a loss is probable or is a reasonable possibility, and whether the loss or a range of loss is estimable, often involves a series of complex judgments about future events. Management maintains accruals for such losses that are probable of being incurred and subject to reasonable estimation. Management is sometimes unable to estimate an amount or range of a reasonably possible loss in certain situations, including but not limited to when (1) the damages sought are indeterminate, (2) the proceedings are in the early stages, or (3) the matters involve novel or unsettled legal theories. In such cases, there is considerable uncertainty regarding the timing or ultimate resolution of such matters, including a possible eventual loss. For current proceedings not specifically reported herein, management does not anticipate that the ultimate liabilities, if any, arising from such current proceedings would have a material effect on Xcel Energy’s financial statements. Unless otherwise required by GAAP, legal fees are expensed as incurred. Environmental Litigation Native Village of Kivalina vs. Xcel Energy Inc. et al. — In February 2008, the City and Native Village of Kivalina, Alaska, filed a lawsuit in the U.S. District Court for the Northern District of California against Xcel Energy and 23 other utility, oil, gas and coal companies. Plaintiffs claim that defendants’ emission of CO
2 and other GHGs contribute to global warming, which is harming their village. Xcel Energy believes the claims asserted in this lawsuit are without merit and
joined with other utility defendants in filing a motion to dismiss in June 2008. In October 2009, the U.S. District Court dismissed the lawsuit on constitutional grounds. In November 2009, plaintiffs filed a notice of appeal to the U.S. Court of Appeals for the Ninth Circuit (Ninth Circuit). In October 2012, the Ninth Circuit affirmed the U.S. District Court’s dismissal and subsequently rejected plaintiffs’ request for rehearing. The amount of damages claimed by plaintiffs is unknown, but likely includes the cost of relocating the village of Kivalina. Plaintiffs’ alleged relocation is estimated to cost between $95 million to $400 million. Although Xcel Energy believes the likelihood of loss is remote based primarily on existing case law, it is not possible to estimate the amount or range of reasonably possible loss in the event of an adverse outcome of this matter. No accrual has been recorded for this matter. Comer vs. Xcel Energy Inc. et al. — In May 2011, less than a year after their initial lawsuit was dismissed, plaintiffs in this purported class action lawsuit filed a second lawsuit against more than 85 utility, oil, chemical and coal companies in the U.S. District Court in Mississippi. The complaint alleges defendants’ CO2
emissions intensified the strength of Hurricane Katrina and increased the damage plaintiffs purportedly sustained to their property. Plaintiffs base their claims on public and private nuisance, trespass and negligence. Among the defendants named in the complaint are Xcel Energy Inc., SPS, PSCo, NSP-Wisconsin and NSP-Minnesota. The amount of damages claimed by plaintiffs is unknown. The defendants believe this lawsuit is without merit and filed a motion to dismiss the lawsuit. In March 2012, the U.S. District Court granted this motion for dismissal. In April 2012, plaintiffs appealed this decision to the U.S. Court of Appeals for the Fifth Circuit. Although Xcel Energy believes the likelihood of loss is remote based primarily on existing case law, it is not possible to estimate the amount or range of reasonably possible loss in the event of an adverse outcome of this matter. No accrual has been recorded for this matter.
Table of Contents
145

Employment, Tort and Commercial Litigation Merricourt Wind Project Litigation — In April 2011, NSP-Minnesota terminated its agreements with enXco Development Corporation (enXco) for the development of a 150 MW wind project in southeastern North Dakota. NSP-Minnesota’s decision to terminate the agreements was based in large part on the adverse impact this project could have on endangered or threatened species protected by federal law and the uncertainty in cost and timing in mitigating this impact. NSP-Minnesota also terminated the agreements due to enXco’s nonperformance of certain other conditions, including failure to obtain a Certificate of Site Compatibility and the failure to close on the contracts by an agreed upon date of March 31, 2011. NSP-Minnesota recorded a $101 million deposit in the first quarter of 2011, which was collected in April 2011. In May 2011, NSP-Minnesota filed a declaratory judgment action in the U.S. District Court in Minnesota to obtain a determination that it acted properly in terminating the agreements. enXco also filed a separate lawsuit in the same court seeking approximately $240 million for an alleged breach of contract. NSP-Minnesota believes enXco’s lawsuit is without merit. On Oct. 22, 2012, NSP-Minnesota filed a motion for summary judgment, with a hearing set for March 1, 2013. If the U.S. District Court denies NSP-Minnesota’s motion, trial in this matter is expected to occur in 2013. Although Xcel Energy believes the likelihood of loss is remote based primarily on existing case law, it is not possible to estimate the amount or range of reasonably possible loss in the event of an adverse outcome of this matter. No accrual has been recorded for this matter. Exelon Wind (formerly John Deere Wind (JD Wind)) Complaint — Several lawsuits in Texas state and federal courts and regulatory proceedings have arisen out of a dispute concerning SPS’ payments for energy produced from the Exelon Wind subsidiaries’ projects. There are two main areas of dispute. First, Exelon Wind claims that it established legally enforceable obligations (LEOs) for each of its 12 wind facilities in 2005 through 2008 that require SPS to buy power based on SPS’ forecasted avoided cost as determined in 2005 through 2007. Although SPS has refused to accept Exelon Wind’s LEOs, SPS has paid Exelon Wind for energy under SPS’ PUCT QF Tariff. Second, Exelon Wind has raised various challenges to SPS’ PUCT QF Tariff, which became effective in August 2010. The state and federal lawsuits are in various stages of litigation. SPS believes the likelihood of loss in these lawsuits is remote based primarily on existing case law and while it is not possible to estimate the amount or range of reasonably possible loss in the event of an adverse outcome, SPS believes such loss would not be material based upon its belief that it would be permitted to recover such costs, if needed, through its various fuel clause mechanisms. No accrual has been recorded for this matter. Pacific Northwest FERC Refund Proceeding — In July 2001, the FERC ordered a preliminary hearing to determine whether there were unjust and unreasonable charges for spot market bilateral sales in the Pacific Northwest for December 2000 through June 2001. PSCo supplied energy to the Pacific Northwest markets during this period and has been a participant in the hearings. In September 2001, the presiding ALJ concluded that prices in the Pacific Northwest during the referenced period were the result of a number of factors, including the shortage of supply, excess demand, drought and increased natural gas prices. Under these circumstances, the ALJ concluded that the prices in the Pacific Northwest markets were not unreasonable or unjust and no refunds should be ordered. Subsequent to the ruling, the FERC has allowed the parties to request additional evidence. Parties have claimed that the total amount of transactions with PSCo subject to refund is $34 million. In June 2003, the FERC issued an order terminating the proceeding without ordering further proceedings. Certain purchasers filed appeals of the FERC’s orders in this proceeding with the U.S. Court of Appeals for the Ninth Circuit. In an order issued in August 2007, the U.S. Court of Appeals for the Ninth Circuit remanded the proceeding back to the FERC and indicated that the FERC should consider other rulings addressing overcharges in the California organized markets. The U.S. Court of Appeals denied a petition for rehearing in April 2009, and the mandate was issued. The FERC has issued an order on remand establishing principles for the review proceeding in October 2011. In September 2012, the City of Seattle filed its direct case against PSCo and other Pacific Northwest sellers and has expanded the period for which it seeks refunds to May 2000 through June 2001, during which PSCo had sales to the City of Seattle of approximately $50 million. The City of Seattle did not identify specific instances of unlawful market activity by PSCo, but rather based its claim for refunds on market dysfunction in the Western markets. PSCo submitted its answer case in December 2012. Preliminary calculations of the City of Seattle’s claim for refunds from PSCo are approximately $28 million not including interest. PSCo has concluded that a loss is reasonably possible with respect to this matter; however, given the surrounding uncertainties, PSCo is currently unable to estimate the amount or range of reasonably possible loss in the event of an adverse outcome of this matter. In making this assessment, PSCo considered two factors. First, not withstanding PSCo’s view that the City of Seattle has failed to apply the standard that the FERC has established in this proceeding, and the recognition that this case raises a novel issue and the FERC’s standard will likely be challenged on appeal to the U.S. Court of Appeals for the Ninth Circuit. The outcome of such an appeal cannot be predicted with any certainty. Second, PSCo would expect to make equitable arguments against refunds even if the City of Seattle were to establish that it was overcharged for transactions. In addition, if a loss were sustained, PSCo would attempt to recover those losses from other PRPs. No accrual has been recorded for this matter.
Table of Contents
146

Nuclear Power Operations and Waste Disposal Nuclear Waste Disposal Litigation — In 1998, NSP-Minnesota filed a complaint in the U.S. Court of Federal Claims against the United States requesting breach of contract damages for the DOE’s failure to begin accepting spent nuclear fuel by Jan. 31, 1998, as required by the contract between the United States and NSP-Minnesota. NSP-Minnesota sought contract damages in this lawsuit through Dec. 31, 2004. In September 2007, the court awarded NSP-Minnesota $116.5 million in damages. In August 2007, NSP-Minnesota filed a second complaint; this lawsuit claimed damages for the period Jan. 1, 2005 through Dec. 31, 2008. In July 2011, the United States and NSP-Minnesota executed a settlement agreement resolving both lawsuits, providing an initial $100 million payment from the United States to NSP-Minnesota, and providing a method by which NSP-Minnesota can recover its spent fuel storage costs through 2013, estimated to be an additional $100 million. The settlement does not address costs for used fuel storage after 2013; such costs could be the subject of future litigation. NSP-Minnesota received the initial $100 million payment in August 2011, the second installment of $18.6 million in March 2012, and the third installment of $20.7 million in October 2012. Amounts were subsequently credited to customers, except for approved reductions such as legal costs, customer credit amounts still in process at Dec. 31, 2012, and amounts set aside to be credited through another regulatory mechanism. In NSP-Wisconsin’s 2012 Electric and Gas Rate Case, the PSCW authorized NSP-Wisconsin to utilize the proceeds from the second and third installments to be included as a reduction of the 2013 electric rate increase. In December 2012, the MPUC approved NSP-Minnesota’s triennial nuclear decommissioning filing which required NSP-Minnesota to place the Minnesota retail portion of the DOE settlement payments for the third installment of $15.3 million and the anticipated fourth installment in 2013 into the nuclear decommissioning fund when received. The SDPUC required NSP-Minnesota to credit the settlement funds to customers rather than apply the credits to the revenue requirement in the pending 2012 rate case. South Dakota customers will receive credits for the third installment, beginning in February 2013. NSP-Minnesota proposed to contribute the second, third and fourth installments to the nuclear decommissioning fund to offset the increase in the decommissioning accrual that was included in the 2012 North Dakota electric rate case. That filing is pending NDPSC action. Other Contingencies See Note 12 for further discussion. 14. Nuclear Obligations Fuel Disposal — NSP-Minnesota is responsible for temporarily storing used or spent nuclear fuel from its nuclear plants. The DOE is responsible for permanently storing spent fuel from NSP-Minnesota’s nuclear plants as well as from other U.S. nuclear plants. NSP-Minnesota has funded its portion of the DOE’s permanent disposal program since 1981. The fuel disposal fees are based on a charge of 0.1 cent per KWh sold to customers from nuclear generation. Fuel expense includes the DOE fuel disposal assessments of approximately $12 million in 2012, $11 million in 2011 and $13 million in 2010. In total, NSP-Minnesota had paid approximately $434.2 million to the DOE through Dec. 31, 2012. See Note 13 — Nuclear Waste Disposal Litigation for further discussion. NSP-Minnesota has its own temporary on-site storage facilities for spent fuel at its Monticello and Prairie Island nuclear plants, which consist of storage pools and dry cask facilities at both sites. The amount of spent fuel storage capacity currently authorized by the NRC and the MPUC will allow NSP-Minnesota to continue operation of its Prairie Island nuclear plant until the end of its renewed licenses terms in 2033 for Unit 1 and 2034 for Unit 2 and its Monticello nuclear plant until the end of its renewed operating license in 2030. Other alternatives for spent fuel storage are being investigated until a DOE facility is available, including pursuing the establishment of a private facility for interim storage of spent nuclear fuel as part of a consortium of electric utilities. Regulatory Plant Decommissioning Recovery — Decommissioning of NSP-Minnesota’s nuclear facilities is planned for the period from cessation of operations through at least 2091, assuming the prompt dismantlement method. NSP-Minnesota is currently recording the regulatory costs for decommissioning over the MPUC-approved cost-recovery period and including the accruals in a regulatory liability account. Monticello received its initial operating license in 1970 and began commercial operation in 1971. With its renewed operating license and CON for spent fuel capacity to support 20 years of extended operation, Monticello can operate until 2030. The Monticello 20-year depreciation life extension until September 2030 was granted by the MPUC in 2007. The Monticello dry-cask storage facility currently stores 10 of the 30 canisters authorized by the MPUC.
Table of Contents
147

Prairie Island Units 1 and 2 received their initial operating license and began commercial operations in 1973 and 1974. In 2011, the NRC approved Prairie Island’s license renewal application for its nuclear reactors, allowing operations for an additional 20 years until 2033 and 2034, respectively. In 2011, the MPUC approved a depreciation life extension for Prairie Island bringing the depreciation remaining life in line with the NRC approved operating license. The Prairie Island dry-cask storage facility currently stores 29 casks, with MPUC approval for the use of 35 additional casks to support operations until the end of the renewed operating licenses in 2033 and 2034. NSP-Minnesota previously recorded annual decommissioning accruals based on periodic site-specific cost studies and a presumed level of dedicated funding consistent with cost-recovery in utility customer rates. Cost studies quantify decommissioning costs in current dollars. This study presumed that costs will escalate in the future at a rate of 3.63 percent per year during operations and radiological portion of decommissioning and 2.63 percent during the independent spent fuel storage installation and site restoration portion of decommissioning. The total estimated decommissioning costs that will ultimately be paid, net of income earned by the external decommissioning trust fund, is currently being accrued using an annuity approach over the approved plant-recovery period. This annuity approach uses an assumed rate of return on funding, which is an after-tax return between 4.57 percent and 5.53 percent, depending on production unit and time frame for external funding. The net unrealized gain or loss on nuclear decommissioning investments is deferred as a regulatory asset or liability. The total obligation for decommissioning currently is expected to be funded 100 percent by the external decommissioning trust fund, as approved by the MPUC, when decommissioning commences. In November 2012, the MPUC approved NSP-Minnesota’s most recent nuclear decommissioning study which used 2011 cost data. The MPUC approved the use of a 60-year decommissioning scenario. This resulted in an approved annual accrual for 2013 of $14.2 million for Minnesota retail customers to be offset by funds received in October 2012 of $15.3 million from the DOE settlement. The external funds are held in trust and in escrow. The portion in escrow is subject to refund if approved by the various commissions. In 2009, the MPUC authorized the return of funds associated with the Monticello plant for the Minnesota retail jurisdictions with refunds made on customers’ bills in 2010. In March 2010, approximately $5.9 million was also withdrawn from the Monticello plant portion of the escrow fund for a refund to Wisconsin and Michigan retail customers through general rates in 2011 and 2012. As of Dec. 31, 2012, NSP-Minnesota has recorded and recovered in rates cumulative decommissioning expense of $1.5 billion. The following table summarizes the funded status of NSP-Minnesota’s decommissioning obligation based on approved regulatory recovery parameters from the most recently approved decommissioning study. Xcel Energy believes future decommissioning cost expense, if necessary, will continue to be recovered in customer rates. These amounts are not those recorded in the financial statements for the ARO.
Decommissioning expenses recognized as a result of regulation include the following components:
Table of Contents
Regulatory Basis (Thousands of Dollars) 2012 2011 Estimated decommissioning cost obligation from most recently
approved study (2011 dollars for 2012 and 2008 dollars for 2011) $ 2,694,079 $ 2,308,196 Effect of escalating costs (to 2012 and 2011 dollars, respectively,
at 3.63/2.63 percent for 2012 and 2.89 percent for 2011) 93,327 205,960 Estimated decommissioning cost obligation (in current dollars) 2,787,406 2,514,156 Effect of escalating costs to payment date (3.63/2.63 percent for 2012
and 2.89 percent for 2011) 5,793,882 2,602,207 Estimated future decommissioning costs (undiscounted) 8,581,288 5,116,363 Effect of discounting obligation (using risk-free interest rate) (6,243,332) (3,187,914)Discounted decommissioning cost obligation 2,337,956 1,928,449 Assets held in external decommissioning trust 1,489,542 1,336,431 Underfunding of external decommissioning fund compared to
the discounted decommissioning obligation $ 848,414 $ 592,018
(Thousands of Dollars) 2012 2011 2010 Annual decommissioning recorded as depreciation expense: (a)
Externally funded $ - $ - $ 934 Internally funded (including interest costs) (1,251) (456) (777)
Net decommissioning expense recorded $ (1,251) $ (456) $ 157
(a) Decommissioning expense does not include depreciation of the capitalized nuclear asset retirement costs.
148

Reductions to expense for internally-funded portions in 2012, 2011 and 2010 are a direct result of the 2008 decommissioning study jurisdictional allocation and 100 percent external funding approval, effectively unwinding the remaining internal fund over the previously licensed operating life of the unit (2010 for Monticello, 2013 for Prairie Island Unit 1 and 2014 for Prairie Island Unit 2). Due to the immaterial amount remaining in the internal fund, the entire remaining amount was unwound for Prairie Island 1 and 2 in 2012. As of December 2012, there is no balance remaining in the internally funded decommissioning account. The 2011 nuclear decommissioning filing approved in 2012 has been used for the regulatory presentation. 15. Regulatory Assets and Liabilities Xcel Energy Inc. and subsidiaries prepare their consolidated financial statements in accordance with the applicable accounting guidance, as discussed in Note 1. Under this guidance, regulatory assets and liabilities are created for amounts that regulators may allow to be collected, or may require to be paid back to customers in future electric and natural gas rates. Any portion of Xcel Energy’s business that is not regulated cannot establish regulatory assets and liabilities. If changes in the utility industry or the business of Xcel Energy no longer allow for the application of regulatory accounting guidance under GAAP, Xcel Energy would be required to recognize the write-off of regulatory assets and liabilities in net income or OCI. The components of regulatory assets shown on the consolidated balance sheets at Dec. 31, 2012 and 2011 are:
Table of Contents
(Thousands of Dollars) See Note(s) Remaining
Amortization Period Dec. 31, 2012 Dec. 31, 2011 Regulatory Assets Current Noncurrent Current Noncurrent Pension and retiree medical obligations (a) 9 Various $ 100,713 $ 1,552,375 $ 130,764 $ 1,299,399 Recoverable deferred taxes on AFUDC recorded in
plant 1 Plant lives - 321,680 - 294,549
Contract valuation adjustments (b) 1, 11 Term of related contract 3,775 147,755 73,608 142,210
Net AROs (c) 1, 13, 14 Plant lives - 178,146 - 209,626 Conservation programs (d) 1 One to six years 60,956 84,146 46,769 80,981 Environmental remediation costs 1, 13 Various 3,986 109,377 2,309 109,720 Renewable resources and environmental initiatives 13 One to four years 59,518 38,138 51,622 25,378
Depreciation differences 1 One to seventeen years 5,274 50,057 4,150 54,892
Purchased power contract costs 13 Term of related contract - 63,134 - 54,471
Losses on reacquired debt 4 Term of related debt 5,917 42,060 5,554 43,729 Nuclear refueling outage costs 1 One to two years 56,035 22,647 40,365 8,810 Gas pipeline inspection and remediation costs 12 Various 5,416 27,560 13,779 27,511 Recoverable purchased natural gas and electric
energy costs 1 One to two years 32,098 8,340 17,031 9,867 State commission adjustments 1 Plant lives 374 12,181 311 9,399 Prairie Island EPU (e) 12 Pending rate cases - 67,590 - - Property tax Three years 6,005 12,010 - - Other Various 12,910 24,833 15,973 18,466
Total regulatory assets $ 352,977 $ 2,762,029 $ 402,235 $ 2,389,008
(a) Includes $330.3 million and $365.3 million for the regulatory recognition of the NSP-Minnesota pension expense of which $24.3 million and $35.2 million is included in the current asset at Dec. 31, 2012 and Dec. 31, 2011, respectively. The 2011 amounts are offset by $3.9 million for PSCo unamortized prior service costs at Dec. 31, 2011. Also included are $21.5 million and $27.2 million of regulatory assets related to the nonqualified pension plan of which $2.2 million and $12.1 million is included in the current asset at Dec. 31, 2012 and Dec. 31, 2011, respectively.
(b) Includes the fair value of certain long-term PPAs used to meet energy capacity requirements and valuation adjustments on natural gas commodity purchases. (c) Includes amounts recorded for future recovery of AROs, less amounts recovered through nuclear decommissioning accruals and gains from decommissioning investments. (d) Includes costs for conservation programs, as well as incentives allowed in certain jurisdictions. (e) For the cancelled Prairie Island EPU project, NSP-Minnesota plans to address recovery of incurred costs to date in the next rate case for each of the NSP-Minnesota jurisdictions
and to file a request with the FERC for approval to recover a portion of the costs from NSP-Wisconsin through the Interchange Agreement. NSP-Wisconsin plans to seek cost recovery in a future rate case. In December 2012, EPU costs incurred to date were compared to the discounted value of the estimated future rate recovery based on past jurisdictional precedent, and as a result, NSP-Minnesota recognized a $10.1 million pretax charge.
149

The components of regulatory liabilities shown on the consolidated balance sheets at Dec. 31, 2012 and 2011 are:
At Dec. 31, 2012, approximately $275 million of Xcel Energy's regulatory assets represented past expenditures not currently earning a return. This amount primarily includes Prairie Island EPU costs, recoverable purchased natural gas and electric energy costs and certain expenditures associated with renewable resources and environmental initiatives. 16. Segments and Related Information The regulated electric utility operating results of NSP-Minnesota, NSP-Wisconsin, PSCo and SPS, as well as the regulated natural gas utility operating results of NSP-Minnesota, NSP-Wisconsin and PSCo are each separately and regularly reviewed by Xcel Energy’s chief operating decision maker. Xcel Energy evaluates performance by each utility subsidiary based on profit or loss generated from the product or service provided. These segments are managed separately because the revenue streams are dependent upon regulated rate recovery, which is separately determined for each segment. Xcel Energy has the following reportable segments: regulated electric utility, regulated natural gas utility and all other.
Xcel Energy had equity investments in unconsolidated subsidiaries of $91.2 million and $92.7 million as of Dec. 31, 2012 and 2011, respectively, included in the regulated natural gas utility segment. Asset and capital expenditure information is not provided for Xcel Energy’s reportable segments because as an integrated electric and natural gas utility, Xcel Energy operates significant assets that are not dedicated to a specific business segment, and reporting assets and capital expenditures by business segment would require arbitrary and potentially misleading allocations which may not necessarily reflect the assets that would be required for the operation of the business segments on a stand-alone basis.
Table of Contents
(Thousands of Dollars) See Note(s) Remaining
Amortization Period Dec. 31, 2012 Dec. 31, 2011 Regulatory Liabilities Current Noncurrent Current Noncurrent Plant removal costs 1, 13 Plant lives $ - $ 922,963 $ - $ 945,377 Deferred electric, gas and steam
production costs 1 Less than one year 90,454 - 108,057 - DOE settlement 13 One to two years 22,700 1,131 94,734 - Investment tax credit deferrals 1, 6 Various - 59,052 - 61,710 Deferred income tax adjustment 1, 6 Various - 44,667 - 46,835 Conservation programs (b) 1, 12 Less than one year 6,292 - 15,898 -
Contract valuation adjustments (a) 1, 11 Term of related contract 29,431 11,159 25,268 15,450
Gain from asset sales 18 One to three years 7,318 10,311 5,780 18,696 Renewable resources and environmental
initiatives 12, 13 Various 256 1,412 4,358 8,525 Low income discount program Less than one year 6,164 - 8,696 347 Other Various 6,243 9,244 12,304 4,594
Total regulatory liabilities $ 168,858 $ 1,059,939 $ 275,095 $ 1,101,534
(a) Includes the fair value of certain long-term PPAs used to meet energy capacity requirements and valuation adjustments on natural gas commodity purchases. (b) Includes costs for conservation programs, as well as incentives allowed in certain jurisdictions.
• Xcel Energy’s regulated electric utility segment generates, transmits, and distributes electricity in Minnesota, Wisconsin, Michigan, North Dakota, South Dakota, Colorado, Texas and New Mexico. In addition, this segment includes sales for resale and provides wholesale transmission service to various entities in the United States. Regulated electric utility also includes commodity trading operations.
• Xcel Energy’s regulated natural gas utility segment transports, stores and distributes natural gas primarily in portions of Minnesota, Wisconsin, North Dakota, Michigan and Colorado.
• Revenues from operating segments not included above are below the necessary quantitative thresholds and are therefore included in the all other category. Those primarily include steam revenue, appliance repair services, nonutility real estate activities, revenues associated with processing solid waste into refuse-derived fuel and investments in rental housing projects that qualify for low-income housing tax credits.
150

To report income from continuing operations for regulated electric and regulated natural gas utility segments, the majority of costs are directly assigned to each segment. However, some costs, such as common depreciation, common O&M expenses and interest expense are allocated based on cost causation allocators. A general allocator is used for certain general and administrative expenses, including office supplies, rent, property insurance and general advertising. The accounting policies of the segments are the same as those described in Note 1.
Table of Contents
Regulated Regulated All Reconciling Consolidated (Thousands of Dollars) Electric Natural Gas Other Eliminations Total 2012 Operating revenues from external customers $ 8,517,296 $ 1,537,374 $ 73,553 $ - $ 10,128,223 Intersegment revenues 1,169 1,425 - (2,594) -
Total revenues $ 8,518,465 $ 1,538,799 $ 73,553 $ (2,594) $ 10,128,223
Depreciation and amortization $ 801,649 $ 115,038 $ 9,366 $ - $ 926,053 Interest charges and financing costs 397,457 49,456 119,354 - 566,267 Income tax expense (benefit) 465,626 50,322 (65,745) - 450,203 Income (loss) from continuing operations 851,929 98,061 (44,791) - 905,199
Regulated Regulated All Reconciling Consolidated (Thousands of Dollars) Electric Natural Gas Other Eliminations Total 2011 Operating revenues from external customers $ 8,766,593 $ 1,811,926 $ 76,251 $ - $ 10,654,770 Intersegment revenues 1,269 2,358 - (3,627) -
Total revenues $ 8,767,862 $ 1,814,284 $ 76,251 $ (3,627) $ 10,654,770
Depreciation and amortization $ 773,392 $ 106,870 $ 10,357 $ - $ 890,619 Interest charges and financing costs 402,668 52,115 108,134 - 562,917 Income tax expense (benefit) 473,848 57,408 (62,940) - 468,316 Income (loss) from continuing operations 788,967 101,842 (49,435) - 841,374
Regulated Regulated All Reconciling Consolidated (Thousands of Dollars) Electric Natural Gas Other Eliminations Total 2010 Operating revenues from external customers $ 8,451,845 $ 1,782,582 $ 76,520 $ - $ 10,310,947 Intersegment revenues 1,015 5,653 - (6,668) -
Total revenues $ 8,452,860 $ 1,788,235 $ 76,520 $ (6,668) $ 10,310,947
Depreciation and amortization $ 748,815 $ 99,220 $ 10,847 $ - $ 858,882 Interest charges and financing costs 380,074 49,314 119,233 - 548,621 Income tax expense (benefit) 434,756 59,790 (57,911) - 436,635 Income (loss) from continuing operations 665,155 114,554 (27,753) - 751,956
151

17. Summarized Quarterly Financial Data (Unaudited)
18. Asset Acquisition and Sale Acquisition of Generation Assets — In December 2010, PSCo purchased Blue Spruce Energy Center and Rocky Mountain Energy Center from Calpine Development Holdings, Inc. and Riverside Energy Center LLC. The net assets acquired were approximately $732 million. The Blue Spruce Energy Center is a 310 MW simple cycle natural gas-fired power plant that began commercial operations in 2003. The Rocky Mountain Energy Center is a 652 MW combined-cycle natural gas-fired power plant that began commercial operations in 2004. Both power plants previously provided energy and capacity to PSCo under PPAs, which were set to expire in 2013 and 2014, respectively. Sale of Lubbock Electric Distribution Assets — In November 2009, SPS entered into an asset purchase agreement with the city of Lubbock, Texas. This agreement had set forth that SPS would sell its electric distribution system assets within the city limits to Lubbock Power and Light (LP&L) for approximately $87 million. The sale and related transactions eliminate the inefficiencies of maintaining duplicate distribution systems, by both SPS and by the city-owned LP&L.
Table of Contents
Quarter Ended (Amounts in thousands, except per share data) March 31, 2012 June 30, 2012 Sept. 30, 2012 Dec. 31, 2012 Operating revenues $ 2,578,079 $ 2,274,668 $ 2,724,341 $ 2,551,135 Operating income 380,162 405,690 720,434 316,397 Income from continuing operations 183,769 183,075 398,147 140,208 Discontinued operations — income (loss) 124 (15) (41) (38)Net income 183,893 183,060 398,106 140,170 Earnings available to common shareholders 183,893 183,060 398,106 140,170 Earnings per share total — basic $ 0.38 $ 0.38 $ 0.82 $ 0.29 Earnings per share total — diluted 0.38 0.38 0.81 0.29 Cash dividends declared per common share 0.26 0.27 0.27 0.27
Quarter Ended (Amounts in thousands, except per share data) March 31, 2011 June 30, 2011 Sept. 30, 2011 Dec. 31, 2011 Operating revenues $ 2,816,540 $ 2,438,222 $ 2,831,598 $ 2,568,410 Operating income 426,663 359,442 651,496 344,001 Income from continuing operations 203,467 158,671 338,295 140,941 Discontinued operations — income (loss) 102 91 37 (432)Net income 203,569 158,762 338,332 140,509 Earnings available to common shareholders 202,509 157,702 333,658 140,509 Earnings per share total — basic $ 0.42 $ 0.33 $ 0.69 $ 0.29 Earnings per share total — diluted 0.42 0.33 0.69 0.29 Cash dividends declared per common share 0.25 0.26 0.26 0.26
152

Item 9 — Changes in and Disagreements with Accountants on Accounting and Financial Disclosure None. Item 9A — Controls and Procedures Disclosure Controls and Procedures Xcel Energy maintains a set of disclosure controls and procedures designed to ensure that information required to be disclosed in reports that it files or submits under the Securities Exchange Act of 1934 is recorded, processed, summarized, and reported within the time periods specified in SEC rules and forms. In addition, the disclosure controls and procedures ensure that information required to be disclosed is accumulated and communicated to management, including the chief executive officer (CEO) and chief financial officer (CFO), allowing timely decisions regarding required disclosure. As of Dec. 31, 2012, based on an evaluation carried out under the supervision and with the participation of Xcel Energy’s management, including the CEO and CFO, of the effectiveness of its disclosure controls and the procedures, the CEO and CFO have concluded that Xcel Energy’s disclosure controls and procedures were effective. Internal Control Over Financial Reporting No change in Xcel Energy’s internal control over financial reporting has occurred during the most recent fiscal quarter that has materially affected, or is reasonably likely to materially affect, Xcel Energy’s internal control over financial reporting. Xcel Energy maintains internal control over financial reporting to provide reasonable assurance regarding the reliability of the financial reporting. Xcel Energy has evaluated and documented its controls in process activities, general computer activities, and on an entity-wide level. During the year and in preparation for issuing its report for the year ended Dec. 31, 2012 on internal controls under section 404 of the Sarbanes-Oxley Act of 2002, Xcel Energy conducted testing and monitoring of its internal control over financial reporting. Based on the control evaluation, testing and remediation performed, Xcel Energy did not identify any material control weaknesses, as defined under the standards and rules issued by the Public Company Accounting Oversight Board and as approved by the SEC and as indicated in Management Report on Internal Controls herein. Item 9B — Other Information (e) Compensatory Arrangements. On Feb. 20, 2013, the Governance, Compensation and Nominating Committee (Committee), approved a special retention grant (Retention Grant) of 141,300 Restricted Stock Units, valued at approximately $4 million, to Benjamin G.S. Fowke III, Xcel Energy Inc.’s Chairman, President and Chief Executive Officer. The Committee, with the advice and recommendation of its independent compensation consultant and in consultation with the other independent members of the Board, considered factors including Xcel Energy Inc.’s strong performance on financial results, based on earnings per share growth, and strong operational performance on safety and reliability. The Committee, along with the other independent directors, believes that Mr. Fowke’s contributions in these areas will serve to increase long-term shareholder value, and that it is in the best interest of the shareholders to provide an additional incentive for Mr. Fowke to remain with Xcel Energy Inc. Pursuant to the Retention Grant, one-third of the grant will vest on the third anniversary of the grant date, provided that Mr. Fowke remains continuously employed by Xcel Energy Inc. through this initial vesting date. The other two-thirds of the grant will vest on the fifth anniversary of the grant date, provided that Mr. Fowke remains continuously employed with Xcel Energy Inc. through the final vesting date. The restricted stock units are subject to accelerated vesting either on a full or pro-rata basis under certain circumstances including death, disability or a change of control, however, no accelerated vesting will occur if Mr. Fowke retires or voluntarily resigns prior to the respective vesting dates. The award will be issued under Xcel Energy Inc.’s 2005 Long-Term Incentive Plan.
PART III Item 10 — Directors, Executive Officers and Corporate Governance Information required under this Item with respect to Directors and Corporate Governance is set forth in Xcel Energy Inc.’s Proxy Statement for its 2013 Annual Meeting of Shareholders, which is incorporated by reference. Information with respect to Executive Officers is included in Item 1 to this report.
Table of Contents
153

Item 11 — Executive Compensation
Information required under this Item is set forth in Xcel Energy Inc.’s Proxy Statement for its 2013 Annual Meeting of Shareholders, which is incorporated by reference.
Item 12 — Security Ownership of Certain Beneficial Owners and Management and Related Stockholder Matters
Information required under this Item is contained in Xcel Energy Inc.’s Proxy Statement for its 2013 Annual Meeting of Shareholders, which is incorporated by reference.
Item 13 — Certain Relationships and Related Transactions, and Director Independence
Information required under this Item is contained in Xcel Energy Inc.’s Proxy Statement for its 2013 Annual Meeting of Shareholders, which is incorporated by reference.
Item 14 — Principal Accountant Fees and Services
Information required under this Item is contained in Xcel Energy Inc.’s Proxy Statement for its 2013 Annual Meeting of Shareholders, which is incorporated by reference.
PART IV
Item 15 — Exhibits, Financial Statement Schedules
PSCo
Xcel Energy Inc.
Xcel Energy Inc.
Table of Contents
1. Consolidated Financial Statements: Management Report on Internal Controls Over Financial Reporting — For the year ended Dec. 31, 2012. Report of Independent Registered Public Accounting Firm — Financial Statements Report of Independent Registered Public Accounting Firm — Internal Controls Over Financial Reporting Consolidated Statements of Income — For the three years ended Dec. 31, 2012, 2011 and 2010. Consolidated Statements of Cash Flows — For the three years ended Dec. 31, 2012, 2011 and 2010. Consolidated Balance Sheets — As of Dec. 31, 2012 and 2011. 2. Schedule I — Condensed Financial Information of Registrant. Schedule II — Valuation and Qualifying Accounts and Reserves for the years ended Dec. 31, 2012, 2011 and 2010. 3. Exhibits
* Indicates incorporation by reference + Executive Compensation Arrangements and Benefit Plans Covering Executive Officers and Directors t Certain portions of this agreement have been omitted pursuant to a request for confidential treatment and have been filed separately with the SEC.
2.01* t
Purchase and Sale Agreement by and between Riverside Energy Center, LLC and Calpine Development Holdings, Inc., as Sellers, and PSCo, as Purchaser, dated as of April 2, 2010 (excluding certain schedules and exhibits referred to in the agreement, as amended, which the Registrant agrees to furnish supplemental to the SEC upon request) (Exhibit 2.01 to Form 10-Q for the quarter ended June 30, 2010 (file no. 001-03034)).
3.01*
Amended and Restated Articles of Incorporation of Xcel Energy Inc., as filed on May 17, 2012 (Exhibit 3.01 to Form 8-K dated May 16, 2012 (file no. 001-03034)).
3.02* Restated By-Laws of Xcel Energy Inc. (Exhibit 3.01 to Form 8-K dated Aug. 12, 2008 (file no. 001-03034)).
4.01*
Indenture dated Dec. 1, 2000, between Xcel Energy Inc. and Wells Fargo Bank, Minnesota, National Association (NA), as Trustee. (Exhibit 4.01 to Form 8-K (file no. 001-03034) dated Dec. 18, 2000).
4.02*
Supplemental Indenture No. 3 dated June 1, 2006 between Xcel Energy Inc. and Wells Fargo Bank, Minnesota, NA, as Trustee, creating $300 million principal amount of 6.5 percent Senior Notes, Series due 2036 (Exhibit 4.01 to Current Report on Form 8-K (file no. 001-03034) dated June 6, 2006).
4.03*
Supplemental Indenture No. 4 dated March 30, 2007 between Xcel Energy Inc. and Wells Fargo Bank, Minnesota, NA, as Trustee, creating $253.979 million aggregate principal amount of 5.613 percent Senior Notes, Series due 2017 (Exhibit 4.1 to Form 8-K (file no. 001-03034) dated March 30, 2007).
4.04*
Junior Subordinated Indenture, dated as of Jan. 1, 2008, by and between Xcel Energy Inc. and Wells Fargo Bank, Minnesota, NA, as Trustee (Exhibit 4.01 to Form 8-K (file no. 001-03034) dated Jan. 16, 2008).
4.05*
Supplemental Indenture No. 1, dated Jan. 16, 2008, by and between Xcel Energy Inc. and Wells Fargo Bank, Minnesota, NA, as Trustee, creating $400 million principal amount of 7.6 percent Junior Subordinated Notes, Series due 2068 (Exhibit 4.02 to Form 8-K (file no. 001-03034) dated Jan. 16, 2008).
4.06* Replacement Capital Covenant, dated Jan. 16, 2008 (Exhibit 4.03 to Form 8-K (file no. 001-03034) dated Jan. 16, 2008). 4.07*
Supplemental Indenture No. 5 dated as of May 1, 2010 between Xcel Energy Inc. and Wells Fargo Bank, NA, as Trustee, creating $550 million principal amount of 4.70 percent Senior Notes, Series due May 15, 2020 (Exhibit 4.01 to Form 8-K (file no. 001-03034) dated May 13, 2010).
4.08*
Supplemental Indenture No. 6 dated as of Sept. 1, 2011 between Xcel Energy Inc. and Wells Fargo Bank, National Association (NA), as Trustee, creating $250 million principal amount of 4.80 percent Senior Notes, Series due 2041 (Exhibit 4.01 to Form 8-K dated Sept. 12, 2011 (file no. 001-03034)).

154

NSP-Minnesota
NSP-Wisconsin
Table of Contents
4.09*
Supplemental and Restated Trust Indenture, dated May 1, 1988, from NSP-Minnesota to Harris Trust and Savings Bank, as Trustee, providing for the issuance of First Mortgage Bonds (Exhibit 4.02 to Form 10-K of NSP-Minnesota for the year 1988, file no. 001-03034). Supplemental Indentures between NSP-Minnesota and said Trustee, dated as follows:
Supplemental Indenture dated June 1, 1995, creating $250 million principal amount of 7.125 percent First Mortgage Bonds, Series due July 1, 2025 (Exhibit 4.01 to Form 8-K (file no. 001-03034) dated June 28, 1995, Rider A).
Supplemental Indenture dated April 1, 1997, creating $100 million principal amount of 8.5 percent First Mortgage Bonds, Series due Sept. 1, 2019 and $27.9 million principal amount of 8.5 percent First Mortgage Bonds, Series due March 1, 2019 (Exhibit 4.47 to Form 10-K (file no. 001-03034) dated Dec. 31, 1997).
Supplemental Indenture dated March 1, 1998, creating $150 million principal amount of 6.5 percent First Mortgage Bonds, Series due March 1, 2028 (Exhibit 4.01 to Form 8-K (file no. 001-03034) dated March 11, 1998, Rider A).
4.10*
Supplemental Indenture dated Aug. 1, 2000 (Assignment and Assumption of Trust Indenture) (Exhibit 4.51 to NSP-Minnesota Form 10-12G (file no. 000-31709) dated Oct. 5, 2000).
4.11*
Indenture, dated July 1, 1999, between NSP-Minnesota and Norwest Bank Minnesota, NA, as Trustee, providing for the issuance of Sr. Debt Securities. (Exhibit 4.01 to NSP-Minnesota Form 8-K (file no. 001-03034) dated July 21, 1999).
4.12*
Supplemental Indenture, dated Aug. 18, 2000, supplemental to the Indenture dated July 1, 1999, among Xcel Energy, NSP-Minnesota and Wells Fargo Bank Minnesota, NA, as Trustee (Assignment and Assumption of Indenture) (Exhibit 4.63 to NSP-Minnesota Form 10-12G (file no. 000-31709) dated Oct. 5, 2000).
4.13*
Supplemental Indenture dated July 1, 2002 between NSP-Minnesota and BNY Midwest Trust Company, as successor Trustee, creating $69 million principal amount of 8.5 percent First Mortgage Bonds, Series due April 1, 2030 (Exhibit 4.06 to NSP-Minnesota Current Report on Form 10-Q, (file no. 001-31387) dated Sept. 30, 2002).
4.14*
Supplemental Trust Indenture dated Aug. 1, 2002 between NSP-Minnesota and BNY Midwest Trust Company, as successor Trustee, creating $450 million principal amount of 8.0 percent First Mortgage Bonds, Series due Aug. 28, 2012 (Exhibit 4.01 to NSP-Minnesota Current Report on Form 8-K, (file no. 001-31387) dated Aug. 22, 2002).
4.15*
Supplemental Indenture dated July 1, 2005 between NSP-Minnesota and BNY Midwest Trust Company, as successor Trustee, creating $250 million principal amount of 5.25 percent First Mortgage Bonds, Series due July 15, 2035 (Exhibit 4.01 to NSP-Minnesota Current Report on Form 8-K, (file no. 001-31387) dated July 14, 2005).
4.16*
Supplemental Indenture dated May 1, 2006 between NSP-Minnesota and BNY Midwest Trust Company, as successor Trustee, creating $400 million principal amount of 6.25 percent First Mortgage Bonds, Series due June 1, 2036 (Exhibit 4.01 to NSP-Minnesota Current Report on Form 8-K, (file no. 001-31387) dated May 18, 2006).
4.17*
Supplemental Indenture, dated June 1, 2007, between NSP-Minnesota and BNY Midwest Trust Company, as successor Trustee (Exhibit 4.01 to NSP-Minnesota Form 8-K (file no. 001-31387) dated June 19, 2007).
4.18*
Supplemental Indenture dated March 1, 2008 between NSP-Minnesota and The Bank of New York Trust Company, NA, as successor Trustee (Exhibit 4.01 to Form 8-K (file no. 001-31387) dated March 11, 2008).
4.19*
Supplemental Indenture dated as of Nov. 1, 2009 between NSP-Minnesota and The Bank of New York Mellon Trust Co., NA, as successor Trustee, creating $300 million principal amount of 5.35 percent First Mortgage Bonds, Series due Sept. 1, 2039 (Exhibit 4.01 of Form 8-K of NSP-Minnesota dated Nov. 16, 2009 (file no. 001-31387)).
4.20*
Supplemental Indenture dated as of Aug. 1, 2010 between NSP-Minnesota and The Bank of New York Mellon Trust Company, NA, as successor Trustee, creating $250 million principal amount of 1.950 percent First Mortgage Bonds, Series due Aug. 15, 2015 and $250 million principal amount of 4.850 percent First Mortgage Bonds, Series due Aug. 15, 2040 (Exhibit 4.01 to Form 8-K dated Aug. 11, 2010 (file no. 001-31387)).
4.21*
Supplemental Indenture dated as of Aug. 1, 2012 between NSP-Minnesota and The Bank of New York Mellon Trust Company, NA, as successor Trustee, creating $300 million principal amount of 2.15 percent First Mortgage Bonds, Series due Aug. 15, 2022 and $500 million principal amount of 3.40 percent First Mortgage Bonds, Series due Aug. 15, 2042 (Exhibit 4.01 to NSP-Minnesota’s Form 8-K dated Aug. 13, 2012 (file no. 001-31387)).
4.22*
Supplemental and Restated Trust Indenture, dated March 1, 1991, between NSP-Wisconsin and First Wisconsin Trust company, providing for the issuance of First Mortgage Bonds (Exhibit 4.01 to Registration Statement 33-39831).
4.23* Supplemental Trust Indenture, dated April 1, 1991 (Exhibit 4.01 to Form 10-Q (file no. 001-03140) for the quarter ended March 31, 1991). 4.24* Supplemental Trust Indenture, dated Dec. 1, 1996 (Exhibit 4.01 to Form 8-K (file no. 001-03140) dated Dec. 12, 1996).
155

PSCo
Table of Contents
4.25*
Trust Indenture dated Sept. 1, 2000, between NSP-Wisconsin and Firstar Bank, NA as Trustee (Exhibit 4.01 to Form 8-K (file no. 001-03140) dated Sept. 25, 2000).
4.26*
Supplemental Trust Indenture dated Sept. 1, 2003 between NSP-Wisconsin and US Bank NA, supplementing indentures dated April 1, 1947 and March 1, 1991 (Exhibit 4.05 to Xcel Energy Form 10-Q (file no. 001-03034) dated Nov. 13, 2003).
4.27*
Supplemental Trust Indenture dated as of Sept. 1, 2008 between NSP-Wisconsin and U.S. Bank NA, as successor Trustee, creating $200 million principal amount of 6.375 percent First Mortgage Bonds, Series due Sept. 1, 2038 (Exhibit 4.01 of Form 8-K of NSP-Wisconsin dated Sept. 3, 2008 (file no. 001-03140)).
4.28*
Supplemental Indenture dated as of Oct. 1, 2012 between NSP-Wisconsin and U.S. Bank NA, as successor Trustee, creating $100 million principal amount of 3.700 percent First Mortgage Bonds, Series due Oct. 1, 2042 (Exhibit 4.01 of Form 8-K of NSP-Wisconsin dated Oct. 10, 2012 (file no. 001-03140)).
4.29*
Indenture, dated as of Oct. 1, 1993, between PSCo and Morgan Guaranty Trust Company of New York, as trustee, providing for the issuance of First Collateral Trust Bonds (Form 10-Q, Sept. 30, 1993 — Exhibit 4(a)).
4.30* Indentures supplemental to Indenture dated as of Oct. 1, 1993, between PSCo and Morgan Guaranty Trust Company of New York, as trustee,:
Dated as of Previous Filing: Form; Date or file no. Exhibit
No. Dated as of Previous Filing: Form; Date or file no. Exhibit
No. Nov. 1, 1993 S-3, (33-51167) 4(b)(2) Sept. 1, 2002 8-K, Sept. 18, 2002 (001-03280) 4.01 Jan. 1, 1994 10-K, 1993 4(b)(3) Sept. 15, 2002 10-Q, Sept. 30, 2002 (001-03280) 4.04 Sept. 2, 1994 8-K, September 1994 4(b) March 1, 2003 S-3, April 14, 2003 (333-104504) 4(b)(3) May 1, 1996 10-Q, June 30, 1996 4(b) April 1, 2003 10-Q May 15, 2003 (001-03280) 4.02 Nov. 1, 1996 10-K, 1996 (001-03280) 4(b)(3) May 1, 2003 S-4, June 11, 2003 (333-106011) 4.9 Feb. 1, 1997 10-Q, March 31, 1997 (001-03280) 4(a) Sept. 1, 2003 8-K, Sept. 2, 2003 (001-03280) 4.02 April 1, 1998 10-Q, March 31,1998 (001-03280) 4(b) Sept. 15, 2003 Xcel 10-K, March 15, 2004 (001-03034) 4.100 Aug. 15, 2002 10-Q, Sept. 30, 2002 (001-03280) 4.03 Aug. 1, 2005 PSCo 8-K, Aug. 18, 2005 (001-03280) 4.02
4.31*
Indenture dated July 1, 1999, between PSCo and The Bank of New York, providing for the issuance of Senior Debt Securities and Supplemental Indenture dated July 15, 1999, between PSCo and The Bank of New York (Exhibits 4.1 and 4.2 to Form 8-K (file no. 001-03280) dated July 13, 1999).
4.32*
Financing Agreement between Adams County, Colorado and PSCo, dated as of Aug. 1, 2005 relating to $129.5 million Adams County, Colorado Pollution Control Refunding Revenue Bonds, 2005 Series A (Exhibit 4.01 to PSCo Current Report on Form 8-K, dated Aug. 18, 2005, file no. 001-03280).
4.33*
Supplemental Indenture, dated Aug. 1, 2007, between PSCo and U.S. Bank Trust NA, as successor Trustee (Exhibit 4.01 to PSCo Form 8-K (file no. 001-03280) dated Aug. 14, 2007).
4.34*
Supplemental Indenture dated as of Aug. 1, 2008, between PSCo and U.S. Bank Trust NA, as successor Trustee, creating $300 million principal amount of 5.80 percent First Mortgage Bonds, Series No. 18 due 2018 and $300 million principal amount of 6.50 percent First Mortgage Bonds, Series No. 19 due 2038 (Exhibit 4.01 of Form 8-K of PSCo dated Aug. 6, 2008 (file no. 001-03280)).
4.35*
Supplemental Indenture dated as of May 1, 2009 between PSCo and U.S. Bank Trust NA, as successor Trustee, creating $400 million principal amount of 5.125 percent First Mortgage Bonds, Series No. 20 due 2019 (Exhibit 4.01 of Form 8-K of PSCo dated May 28, 2009 (file no. 001-03280)).
4.36*
Supplemental Indenture dated as of Nov. 1, 2010 between PSCo and U.S. Bank Trust NA, as successor Trustee, creating $400 million principal amount of 3.200 percent First Mortgage Bonds, Series No. 21 due 2020 (Exhibit 4.01 of Form 8-K of PSCo dated Nov. 16, 2010 (file no. 001-03280)).
4.37*
Supplemental Indenture dated as of Aug. 1, 2011 between PSCo and U.S. Bank NA, as successor Trustee, creating $250 million principal amount of 4.75 percent First Mortgage Bonds, Series No. 22 due 2041 (Exhibit 4.01 to Form 8-K dated Aug. 9, 2011 (file no. 001-03280)).
4.38*
Supplemental Indenture dated as of Sept. 1, 2012 between PSCo and U.S. Bank National Association, as successor Trustee, creating $300 million principal amount of 2.25 percent First Mortgage Bonds, Series No. 23 due 2022 and $500 million principal amount of 3.60 percent First Mortgage Bonds, Series No. 24 due 2042 (Exhibit 4.01 to PSCo’s Form 8-K dated Sept. 11, 2012 (file no. 001-03280)).
156

SPS
Xcel Energy Inc.
Table of Contents
4.39* Indenture dated Feb. 1, 1999 between SPS and The Chase Manhattan Bank (Exhibit 99.2 to Form 8-K (file no. 001-03789) dated Feb. 25, 1999). 4.40*
First Supplemental Indenture dated March 1, 1999 between SPS and The Chase Manhattan Bank (Exhibit 99.3 to Form 8-K (file no. 001-03789) dated Feb. 25, 1999).
4.41*
Second Supplemental Indenture dated Oct. 1, 2001 between SPS and The Chase Manhattan Bank (Exhibit 4.01 to Form 8-K (file no. 001-03789) dated Oct. 23, 2001).
4.42*
Third Supplemental Indenture dated Oct. 1, 2003 to the indenture dated Feb. 1, 1999 between SPS and JPMorgan Chase Bank, as successor Trustee, creating $100 million principal amount of Series C and Series D Notes, 6 percent due 2033 (Exhibit 4.04 to Xcel Energy Form 10-Q (file no. 001-03034) dated Nov. 13, 2003).
4.43*
Fourth Supplemental Indenture dated Oct. 1, 2006 between SPS and The Bank of New York, as successor Trustee (Exhibit 4.01 to Form 8-K (file no. 001-03789) dated Oct. 3, 2006).
4.44* Red River Authority for Texas Indenture of Trust dated July 1, 1991 (Form 10-K, Aug. 31, 1991 — Exhibit 4(b)). 4.45*
Supplemental Trust Indenture dated as of Nov. 1, 2008 between SPS and The Bank of New York Mellon Trust Company, NA, as successor Trustee, creating $250 million principal amount of Series G Senior Notes, 8.75 percent due 2018 (Exhibit 4.01 of Form 8-K of SPS, dated Nov. 14, 2008 (file no. 001- 03789)).
4.46* Indenture dated as of Aug. 1, 2011 between SPS and U.S. Bank NA, as Trustee (Exhibit 4.01 to Form 8-K dated Aug. 10, 2011 (file no. 001-03789)). 4.47*
Supplemental Indenture dated as of Aug. 3, 2011 between SPS and U.S. Bank NA, as Trustee, creating $200 million principal amount of 4.50 percent First Mortgage Bonds, Series No. 1 due 2041 (Exhibit 4.02 to Form 8-K dated Aug. 10, 2011 (file no. 001-03789)).
10.01*+
Xcel Energy Non-Qualified Pension Plan (2009 Restatement) (Exhibit 10.02 to Form 10-K of Xcel Energy (file no. 001-03034) for the year ended Dec. 31, 2008).
10.02*+
Xcel Energy Senior Executive Severance Policy (2009 Amendment and Restatement) (Exhibit 10.05 to Form 10-K of Xcel Energy (file no. 001-03034) for the year ended Dec. 31, 2008).
10.03*+
Xcel Energy Non-employee Directors’ Deferred Compensation Plan as amended and restated Jan. 1, 2009 (Exhibit 10.08 to Form 10-K of Xcel Energy (file no. 001-03034) for the year ended Dec. 31, 2008).
10.04*
Form of Services Agreement between Xcel Energy Services Inc. and utility companies (Exhibit H-1 to Form U5B (file no. 001-03034) dated Nov. 16, 2000).
10.05*+
Xcel Energy Supplemental Executive Retirement Plan as amended and restated Jan. 1, 2009 (Exhibit 10.17 to Form 10-K of Xcel Energy (file no. 001-03034) for the year ended Dec. 31, 2008).
10.06*+
Amendment dated Aug. 26, 2009 to the Xcel Energy Senior Executive Severance and Change-in-Control Policy (Exhibit 10.06 to Form 10-Q of Xcel Energy (file no. 001-03034) for the quarter ended Sept. 30, 2009).
10.07*+
Xcel Energy Inc. Executive Annual Incentive Award Plan Form of Restricted Stock Agreement (Exhibit 10.08 to Form 10-Q of Xcel Energy (file no. 001-03034) for the quarter ended Sept. 30, 2009).
10.08*+
Xcel Energy Executive Annual Incentive Award Plan (as amended and restated effective Feb. 17, 2010) (incorporated by reference to Appendix A to Schedule 14A, Definitive Proxy Statement to Xcel Energy Inc. (file no. 001-03034) dated April 6, 2010).
10.09*+
Xcel Energy 2010 Executive Annual Discretionary Award Plan (Exhibit 10.24 to Form 10-K of Xcel Energy (file no. 001-03034) for the year ended Dec. 31, 2009).
10.10*+
Xcel Energy 2005 Long-Term Incentive Plan (as amended and restated effective Feb. 17, 2010) (incorporated by reference to Appendix B to Schedule 14A, Definitive Proxy Statement to Xcel Energy Inc. (file no. 001-03034) dated April 6, 2010).
10.11*+
Xcel Energy 2010 Executive Annual Discretionary Award Plan (as amended and restated effective Dec. 15, 2010) (Exhibit 10.23 to Form 10-K of Xcel Energy (file no. 001-03034) for the year ended Dec. 31, 2010).
10.12*+
Xcel Energy 2005 Long-Term Incentive Plan Form of Bonus Stock Agreement (Exhibit 10.24 to Form 10-K of Xcel Energy (file no. 001-03034) for the year ended Dec. 31, 2010).
10.13*+
Xcel Energy 2005 Long-Term Incentive Plan Form of Performance Share Agreement (Exhibit 10.25 to Form 10-K of Xcel Energy (file no. 001-03034) for the year ended Dec. 31, 2010).
10.14a*+
Xcel Energy 2005 Long-Term Incentive Plan Form of Restricted Stock Unit Agreement (Exhibit 10.26 to Form 10-K of Xcel Energy (file no. 001-03034) for the year ended Dec. 31, 2010).
10.14b+ Xcel Energy 2005 Long-Term Incentive Plan Form of Time-Based Restricted Stock Unit Agreement.
157

NSP-Minnesota
NSP-Wisconsin
PSCo
SPS
Table of Contents
10.15*+
Stock Equivalent Plan for Non-Employee Directors of Xcel Energy as amended and restated effective Feb. 23, 2011 (Appendix A to the Xcel Energy Definitive Proxy Statement (file no. 001-03034) filed April 5, 2011).
10.16*+
Xcel Energy Inc. Nonqualified Deferred Compensation Plan (2009 Restatement) (as amended and restated effective Nov. 29, 2011) (Exhibit 10.17 to Form 10-K of Xcel Energy (file no. 001-03034) for the year ended Dec. 31, 2011).
10.17*+
Second Amendment dated Oct. 26, 2011 to the Xcel Energy Senior Executive Severance and Change-in-Control Policy (Exhibit 10.18 to Form 10-K of Xcel Energy (file no. 001-03034) for the year ended Dec. 31, 2011).
10.18*+
Amended and Restated Credit Agreement, dated as of July 27, 2012 among Xcel Energy Inc., as Borrower, the several lenders from time to time parties thereto, JPMorgan Chase Bank, N.A., as Administrative Agent, Bank of America, N.A., and Barclays Bank Plc, as Syndication Agents, and Wells Fargo Bank, National Association, as Documentation Agent (Incorporated by reference to Exhibit 99.01 to Form 8-K, dated July 27, 2012 (file no. 001-03034)).
10.19*
Ownership and Operating Agreement, dated March 11, 1982, between NSP-Minnesota, Southern Minnesota Municipal Power Agency and United Minnesota Municipal Power Agency concerning Sherburne County Generating Unit No. 3 (Exhibit 10.01 to Form 10-Q for the quarter ended Sept. 30, 1994, file no. 001-03034).
10.20*
Restated Interchange Agreement dated Jan. 16, 2001 between NSP-Wisconsin and NSP-Minnesota (Exhibit 10.01 to NSP-Wisconsin Form S-4 (file no. 333-112033) dated Jan. 21, 2004).
10.21*
Amended and Restated Credit Agreement, dated as of July 27, 2012 among NSP-Minnesota, as Borrower, the several lenders from time to time parties thereto, JPMorgan Chase Bank, N.A., as Administrative Agent, Bank of America, N.A., and Barclays Bank Plc, as Syndication Agents, and Wells Fargo Bank, National Association, as Documentation Agent (Incorporated by reference to Exhibit 99.02 to Form 8-K, dated July 27, 2012 (file no. 001-03034)).
10.22*
Restated Interchange Agreement dated Jan. 16, 2001 between NSP- Wisconsin and NSP-Minnesota (Exhibit 10.01 to Form S-4 (file no. 333-112033) dated Jan. 21, 2004).
10.23*
Amended and Restated Credit Agreement, dated as of July 27, 2012 among NSP-Wisconsin, as Borrower, the several lenders from time to time parties thereto, JPMorgan Chase Bank, N.A., as Administrative Agent, Bank of America, N.A., and Barclays Bank Plc, as Syndication Agents, and Wells Fargo Bank, National Association, as Documentation Agent (Incorporated by reference to Exhibit 99.05 to Form 8-K, dated July 27, 2012 (file no. 001-03034)).
10.24*
Amended and Restated Coal Supply Agreement entered into Oct. 1, 1984 but made effective as of Jan. 1, 1976 between PSCo and Amax Inc. on behalf of its division, Amax Coal Co. (Form 10-K (file no. 001-03280) Dec. 31, 1984 — Exhibit 10I (1)).
10.25*
First Amendment to Amended and Restated Coal Supply Agreement entered into May 27, 1988 but made effective Jan. 1, 1988 between PSCo and Amax Coal Co. (Form 10-K (file no. 001-03280) Dec. 31, 1988 — Exhibit 10I (2)).
10.26* Proposed Settlement Agreement excerpts, as filed with the CPUC (Exhibit 99.02 to Form 8-K (file no. 001-03034) dated Dec. 3, 2004). 10.27*
Settlement Agreement among PSCo and Concerned Environmental and Community Parties, dated Dec. 3, 2004 (Exhibit 99.03 to Form 8-K (file no. 001-03034) dated Dec. 3, 2004).
10.28*
Amended and Restated Credit Agreement, dated as of July 27, 2012 among PSCo, as Borrower, the several lenders from time to time parties thereto, JPMorgan Chase Bank, N.A., as Administrative Agent, Bank of America, N.A., and Barclays Bank Plc, as Syndication Agents, and Wells Fargo Bank, National Association, as Documentation Agent (Incorporated by reference to Exhibit 99.03 to Form 8-K, dated July 27, 2012 (file no. 001-03034)).
10.29* Coal Supply Agreement (Harrington Station) between SPS and TUCO, dated May 1, 1979 (Form 8-K (file no. 001-03789), May 14, 1979 — Exhibit 3). 10.30*
Master Coal Service Agreement between Swindell-Dressler Energy Supply Co. and TUCO, dated July 1, 1978 (Form 8-K, (file no. 001-03789) May 14, 1979 — Exhibit 5(A)).
10.31*
Guaranty of Master Coal Service Agreement between Swindell-Dressler Energy Supply Co. and TUCO (Form 8-K, (file no. 3789) May 14, 1979 — Exhibit 5(B)).
158

Xcel Energy Inc.
Table of Contents
10.32*
Coal Supply Agreement (Tolk Station) between SPS and TUCO dated April 30, 1979, as amended Nov. 1, 1979 and Dec. 30, 1981 (Form 10-Q, (file no. 3789) Feb. 28, 1982 — Exhibit 10(b)).
10.33*
Master Coal Service Agreement between Wheelabrator Coal Services Co. and TUCO dated Dec. 30, 1981, as amended Nov. 1, 1979 and Dec. 30, 1981 (Form 10-Q, (file no. 3789) Feb. 28, 1982 — Exhibit 10(c)).
10.34* Power Purchase Agreement dated May 23, 1997 between Borger Energy Associates, L.P, and SPS. 10.35*
Amended and Restated Credit Agreement, dated as of July 27, 2012 among SPS, as Borrower, the several lenders from time to time parties thereto, JPMorgan Chase Bank, N.A., as Administrative Agent, Bank of America, N.A., and Barclays Bank Plc, as Syndication Agents, and Wells Fargo Bank, National Association, as Documentation Agent (Incorporated by reference to Exhibit 99.04 to Form 8-K, dated July 27, 2012 (file no. 001-03034)).
12.01 Statement of Computation of Ratio of Earnings to Fixed Charges. 21.01 Subsidiaries of Xcel Energy Inc. 23.01 Consent of Independent Registered Public Accounting Firm. 24.01 Powers of Attorney. 31.01
Principal Executive Officer’s certification pursuant to 18 U.S. C. Section 1350, as adopted pursuant to Section 302 of the Sarbanes-Oxley Act of 2002.
31.02
Principal Financial Officer’s certification pursuant to 18 U.S. C. Section 1350, as adopted pursuant to Section 302 of the Sarbanes-Oxley Act of 2002.
32.01 Certification pursuant to 18 U.S.C. Section 1350, as adopted pursuant to Section 906 of the Sarbanes-Oxley Act of 2002. 99.01 Statement pursuant to Private Securities Litigation Reform Act of 1995. 101
The following materials from Xcel Energy Inc.’s Annual Report on Form 10-K for the year ended Dec. 31, 2012 are formatted in XBRL (eXtensible Business Reporting Language): (i) the Consolidated Statements of Income,(ii) the Consolidated Statements of Comprehensive Income, (iii) the Consolidated Statements of Cash Flows, (iv) the Consolidated Balance Sheets, (v) the Consolidated Statements of Common Stockholders’ Equity, (vi) Consolidated Statements of Capitalization, (vii) Notes to Consolidated Financial Statements, and (vii) document and entity information.
159

SCHEDULE I
XCEL ENERGY INC. CONDENSED STATEMENTS OF INCOME
(amounts in thousands, except per share data)
Table of Contents
Year Ended Dec. 31 2012 2011 2010 Income
Equity earnings of subsidiaries $ 976,395 $ 904,315 $ 818,212 Total income 976,395 904,315 818,212
Expenses and other deductions
Operating expenses 15,948 14,513 11,849 Other income (652) (760) (681)Interest charges and financing costs 116,761 104,297 112,510
Total expenses and other deductions 132,057 118,050 123,678 Income from continuing operations before income taxes 844,338 786,265 694,534 Income tax benefit (60,861) (55,109) (57,422)Income from continuing operations 905,199 841,374 751,956 Income (loss) from discontinued operations, net of tax 30 (202) 3,878 Net income 905,229 841,172 755,834 Dividend requirements on preferred stock - 3,534 4,241 Premium on redemption of preferred stock - 3,260 - Earnings available to common shareholders $ 905,229 $ 834,378 $ 751,593
Weighted average common shares outstanding:
Basic 487,899 485,039 462,052 Diluted 488,434 485,615 463,391
Earnings per average common share — basic:
Income from continuing operations $ 1.86 $ 1.72 $ 1.62 Income from discontinued operations - - 0.01
Earnings per share $ 1.86 $ 1.72 $ 1.63
Earnings per average common share — diluted:
Income from continuing operations $ 1.85 $ 1.72 $ 1.61 Income from discontinued operations - - 0.01
Earnings per share $ 1.85 $ 1.72 $ 1.62
Cash dividends declared per common share $ 1.07 $ 1.03 $ 1.00
160

XCEL ENERGY INC.
CONDENSED STATEMENTS OF CASH FLOWS (amounts in thousands)
Table of Contents
Year Ended Dec. 31 2012 2011 2010 Operating activities
Net cash provided by operating activities $ 815,209 $ 595,732 $ 537,840 Investing activities
Capital contributions to subsidiaries (366,783) (287,495) (523,369)Investments in the utility money pool (640,000) - - Return of investments in the utility money pool 658,000 - -
Net cash used in investing activities (348,783) (287,495) (523,369) Financing activities
Proceeds from (repayment of) short-term borrowings, net 52,000 (21,000) (216,000)Proceeds from issuance of long-term debt - 246,877 543,923 Repayment of long-term debt - - (358,636)Proceeds from issuance of common stock 8,050 38,691 457,258 Repurchase of common stock (18,529) - - Purchase of common stock for settlement of equity awards (23,307) - - Redemption of preferred stock - (104,980) - Dividends paid (486,757) (474,760) (432,110)
Net cash used in financing activities (468,543) (315,172) (5,565) Net change in cash and cash equivalents (2,117) (6,935) 8,906 Cash and cash equivalents at beginning of period 2,719 9,654 748 Cash and cash equivalents at end of period $ 602 $ 2,719 $ 9,654
161

XCEL ENERGY INC.
CONDENSED BALANCE SHEETS (amounts in thousands)
Table of Contents
Dec. 31 2012 2011 Assets Cash and cash equivalents $ 602 $ 2,719 Accounts receivable from subsidiaries 195,438 271,895 Other current assets 11,497 28,399
Total current assets 207,537 303,013 Investment in subsidiaries 10,643,694 10,089,116 Other assets 143,760 154,353
Total other assets 10,787,454 10,243,469 Total assets $ 10,994,991 $ 10,546,482
Liabilities and Equity Dividends payable $ 131,748 $ 126,487 Short-term debt 179,000 127,000 Other current liabilities 31,032 36,000
Total current liabilities 341,780 289,487 Other liabilities 34,360 31,616
Total other liabilities 34,360 31,616 Commitments and contingencies Capitalization Long-term debt 1,744,774 1,743,181 Common stockholders’ equity 8,874,077 8,482,198
Total capitalization 10,618,851 10,225,379 Total liabilities and equity $ 10,994,991 $ 10,546,482
162

NOTES TO CONDENSED FINANCIAL STATEMENTS
Incorporated by reference are Xcel Energy’s consolidated statements of common stockholders’ equity and OCI in Part II, Item 8. Basis of Presentation — The condensed financial information of Xcel Energy Inc. is presented to comply with Rule 12-04 of Regulation S-X. Xcel Energy Inc.’s investments in subsidiaries are presented under the equity method of accounting. Under this method, the assets and liabilities of subsidiaries are not consolidated. The investments in net assets of the subsidiaries are recorded in the balance sheets. The income from operations of the subsidiaries is reported on a net basis as equity in income of subsidiaries. Related Party Transactions — Xcel Energy Inc. presents its related party receivables net of payables. Accounts receivable and payable with affiliates at Dec. 31 were:
Dividends — Cash dividends paid to Xcel Energy Inc. by its subsidiaries were $757 million, $626 million, and $663 million for the years ended Dec. 31, 2012, 2011 and 2010, respectively. Money Pool — Xcel Energy received FERC approval to establish a utility money pool arrangement with the utility subsidiaries, subject to receipt of required state regulatory approvals. The utility money pool allows for short-term investments in and borrowings between the utility subsidiaries. Xcel Energy Inc. may make investments in the utility subsidiaries at market-based interest rates; however, the money pool arrangement does not allow the utility subsidiaries to make investments in Xcel Energy Inc. The following tables present money pool lending for Xcel Energy Inc.:
See Xcel Energy’s notes to the consolidated financial statements in Part II, Item 8 for other disclosures.
Table of Contents
2012 2011 Accounts Accounts Accounts Accounts (Thousands of Dollars) Receivable Payable Receivable Payable NSP-Minnesota $ 63,682 $ - $ 58,321 $ - NSP-Wisconsin 7,631 - 8,620 - PSCo - (3,362) 83,263 - SPS 15,806 - 17,440 - Xcel Energy Services Inc. 61,217 - 52,994 (1,690)Xcel Energy Ventures Inc. 20,427 - 37,700 - Other subsidiaries of Xcel Energy Inc. 30,037 - 20,574 (5,327) $ 198,800 $ (3,362) $ 278,912 $ (7,017)
(Amounts in Millions, Except Interest Rates)
Three Months Ended
Dec. 31, 2012 Lending limit $ 250 Loan outstanding at period end - Average loan outstanding 1.3 Maximum loan outstanding 26 Weighted average interest rate, computed on a daily basis 0.33 % Weighted average interest rate at end of period N/A Money pool interest income $ -
(Amounts in Millions, Except Interest Rates)
Twelve Months Ended
Dec. 31, 2012
Twelve Months Ended
Dec. 31, 2011
Twelve Months Ended
Dec. 31, 2010 Lending limit $ 250 $ 250 $ 250 Loan outstanding at period end - 18 - Average loan outstanding 26.1 0.4 4.0 Maximum loan outstanding 226 43 94 Weighted average interest rate, computed on a daily basis 0.33 % 0.35 % 0.35 % Weighted average interest rate at end of period N/A 0.35 N/A Money pool interest income $ 0.1 $ - $ -
163

SCHEDULE II
XCEL ENERGY INC. AND SUBSIDIARIES VALUATION AND QUALIFYING ACCOUNTS YEARS ENDED DEC. 31, 2012, 2011 AND 2010
(amounts in thousands)
Table of Contents
Additions
Balance at
Jan. 1
Charged to Costs and Expenses
Charged to Other
Accounts (a)
Deductions from
Reserves (b) (c) Balance at
Dec. 31 Allowance for bad debts: 2012 $ 58,565 $ 33,808 $ 16,033 $ 57,012 $ 51,394 2011 54,563 44,521 15,636 56,155 58,565 2010 56,103 44,068 15,202 60,810 54,563 NOL and tax credit valuation allowances: 2012 $ 5,683 $ 32 $ - $ 2,401 $ 3,314 2011 1,927 4,379 - 623 5,683 2010 9,324 240 - 7,637 1,927
(a) Recovery of amounts previously written off as related to allowance for bad debts. (b) Principally bad debts written off as related to allowance for bad debts. (c) Reductions to valuation allowances for NOL and tax credit carryforwards primarily due to changes in tax laws, expirations of certain carryforwards and identification of various
tax planning strategies.
164

SIGNATURES
Pursuant to the requirements of Section 13 or 15(d) of the Securities Exchange Act of 1934, the registrant has duly caused this annual report to be signed on its behalf by the undersigned thereunto duly authorized.
Pursuant to the requirements of the Securities Exchange Act of 1934, this report has been signed below by the following persons on behalf of the registrant and in the capacities on the date indicated above.
165
(Back To Top)
Table of Contents
XCEL ENERGY INC. Feb. 22, 2013 By: /s/ TERESA S. MADDEN Teresa S. Madden Senior Vice President and Chief Financial Officer (Principal Financial Officer)
/s/ BENJAMIN G.S. FOWKE III Chairman, President, Chief Executive Officer and Director Benjamin G.S. Fowke III (Principal Executive Officer) /s/ TERESA S. MADDEN Senior Vice President and Chief Financial Officer Teresa S. Madden (Principal Financial Officer) /s/ JEFFREY S. SAVAGE Vice President and Controller Jeffrey S. Savage (Principal Accounting Officer)
* Director Gail Koziara Boudreaux
* Director Fredric W. Corrigan
* Director Richard K. Davis
* Director Albert F. Moreno
* Director Richard T. O’Brien
* Director Christopher J. Policinski
* Director A. Patricia Sampson
* Director James J. Sheppard
* Director David A. Westerlund
* Director Kim Williams
* Director Timothy V. Wolf *By: /s/ TERESA S. MADDEN Attorney-in-Fact
Teresa S. Madden
Section 2: EX-10.14 B (EXHIBIT 10.14 B)

Exhibit 10.14 b
XCEL ENERGY INC. 2005 LONG-TERM INCENTIVE PLAN
RESTRICTED STOCK UNIT AGREEMENT This Agreement, dated and effective ___________, _____ by and between Xcel Energy Inc., a Minnesota corporation (together with its affiliates and subsidiaries, referred to as “Xcel Energy”) and [participant] (the “Participant”) evidences an award of restricted stock units and the applicable terms and conditions of the award. 1. Units Awarded Xcel Energy awards the Participant [#] restricted units of Common Stock of Xcel Energy (the “Units”) pursuant to the Xcel Energy Inc. 2005 Long-Term Incentive Plan as amended and restated effective February 17, 2010 (the “Plan”), subject to the terms and conditions of the Plan and this Agreement. As used in this Agreement, the term “Units” means the Units plus additional restricted stock units credited as dividend equivalents pursuant to Section 6 below. 2. Term of Participation; Restrictions on Transfer (a) The period during which the Participant will have opportunity to realize value from an award of Units commences on the effective date of this Agreement (the “Commencement Date”) and will expire in full on __________, ______. (b) The Governance, Compensation and Nominating Committee of the Board of Directors (the “Committee”) is designated as the Plan administrator. The Committee, however, has delegated certain administrative duties to the Chief Administrative Officer of Xcel Energy. (c) The Committee shall have the authority to determine at any time during the Restricted Period due to capitalization requirements of Xcel Energy or other factors that the Units may be converted to equivalent shares of Common Stock of Xcel Energy containing similar restrictions on transfer. (d) Units may not be sold, assigned, transferred, pledged or otherwise encumbered by the Participant if those units are unvested. 3. Termination of Service a) If the Participant’s employment with Xcel Energy terminates on a voluntary basis, including voluntary resignation and retirement, or on an involuntary basis due to Cause prior to either of the respective vesting dates, any remaining unvested Units shall be forfeited upon that termination. (b) If the Participant’s employment with Xcel Energy terminates due to death or permanent and total disability, the Participant (or their estate) shall vest in Units as determined on a pro rata basis as detailed in Section 4 below. (c) If the Participant’s employment is terminated on an involuntary basis without Cause, the Board of Directors in its discretion may, if it believes it is fitting and proper, vest Units as provided by the pro rata basis calculation described in Section 4 below. (d) All amounts that are vested upon termination, pursuant to this Section, if any, are subject to the recoupment provisions of Section 10. (e) For purposes of Section 3(a) above, the definition of termination for Cause is as follows: The willful and continued failure of the Participant to perform substantially the Participant’s duties with the Corporation or one of its subsidiaries (other than any such failure resulting from incapacity due to physical or mental illness), after a written demand for substantial performance is delivered to the Participant by the Board which specifically identifies the manner in which the Board believes that the Participant has not substantially performed the Participant’s duties, or b) the willful engaging by the Participant in illegal conduct or gross misconduct which is materially and demonstrably injurious to the Corporation, Subsidiaries, or one of its affiliates. For purposes of this provision, no act or failure to act, on the part of the Participant, shall be considered “willful” unless it is done, or omitted to be done, by the Participant in bad faith or without reasonable belief that the Participant’s action or omission was in the best interests of the Corporation, Subsidiaries or its affiliates, as the case may be. Any act, or failure to act, based upon authority given pursuant to a resolution duly adopted by the Board, or upon the advice of counsel for the Corporation, shall be conclusively presumed to be done, or omitted to be done, by the Participant in good faith and in the best interests of the Corporation, Subsidiaries or its affiliates.

4. Pro Rata Basis Calculation The pro-rata basis participation calculation will prorate the number of Units otherwise payable to the Participant as a Participant due to an occurrence of an event for which pro rata distribution is permitted under Section 3 above. The pro rata calculation will be applied following the pro rata schedule below in determining the number of unvested units that should be vested. (All percentages would be applied to the then number of remaining unvested units.)
If the Participant has completed a number of whole months of service between the established schedule provided in this Section 4, any pro rata basis calculation will be interpolated on a straight line basis between the established pro rata basis schedule (rounded to the nearest 10th decimal point). For example, if the Participant has completed __ months of services, the pro rata basis will be interpolated between __% and __% and would result in a pro rata basis calculation of ___%. 5. Accounting for Units Each Unit, representing a hypothetical share of Xcel Energy Common Stock, is designed to approximate and track the fair market value price of one share of Xcel Energy Common Stock that will be delivered upon completion of the requisite service period. Each Unit is intended to represent an unfunded, unsecured promise to pay a benefit, if and when the Units vests. Any monetary value represented by the Unit is designed to remain among Xcel Energy’s general assets. 6. Participant’s Rights An additional amount representing dividends payable (at the normal common stock declared dividend rate) on shares of Common Stock equal in number to the Units held by the Participant on a dividend record date after the Commencement Date and prior to to each of the respective Vesting dates shall be deemed credited as additional Units as of the dividend payment date. Any additional Units will be subject to the same terms and restrictions applicable to other Units in this Agreement. Aside from this right, the Participant has no other rights as a stockholder, including but not limited to the right to vote any Units. 7. Vesting and Settlement of Units (a) Subject to continued service with Xcel Energy and except for termination events described in Section 3, __% of the Units will vest on _______, ____ (the “Initial Vesting Date” and the remainder __% of the Units will vest on _______, _____ (the “Final Vesting Date”). (b) As soon as administratively feasible following each the Initial Vesting Date and the Final Vesting Date, Xcel Energy will pay to the Participant, in shares of Common Stock, an amount equal to the number of Units subject to each the Initial Vesting Date and the Final Vesting Date, with a cash component representing fractional shares. Although it is the intent is that upon vesting that shares of Company common stock will be delivered to the Participant, at the discretion of the Committee, Units may be delivered upon vesting, in cash or a combination of cash shares and shares of Company common stock of equivalent value. (c) If the Participant dies prior to payment, and under Section 3 or Section 9 below would otherwise be entitled to receive payment of an award, Xcel Energy shall pay, in cash, the Participant’s designated beneficiary (if under the Plan the Participant has designated a beneficiary in writing delivered to Xcel Energy’s Chief Administrative Officer) or if no beneficiary is designated, to the Participant’s estate the value of the awards. (d) Units are to be valued using the Fair Market Value of a share as defined in the Plan. 8. Changes in Capitalization of Xcel Energy If there is any change in the character of outstanding Common Stock by reason of a stock dividend or distribution, stock split, capital reorganization, reclassification, combination or exchange of shares, or by reason of merger, consolidation, or other corporate reorganization, the Committee shall determine the appropriate adjustment to the Participant’s Units, if any, needed to reflect such change. 9. General Restrictions In the event a Change in Control occurs, as defined in the Plan, the service period required under each the Initial Vesting Date and the Final Vesting Date will be deemed to have been met, and all outstanding Units shall be delivered to the Participant as equivalent shares of Company stock as soon as administratively feasible following the Change in Control, but in no event later than two and a half months after the end of the calendar year in which the Change in Control occurs, according to the terms of the Plan.
Completed Months of Service Pro Rata Basis
__ months __%
__ months __%
__ months __%
__ months __%
__ months ___%

10. Recoupment Xcel Energy may recover any cash or shares awarded under this Agreement, or proceeds from the sale of such shares, to the extent required by any rule of the SEC or any listing standard of the New York Stock Exchange, including any rule or listing standard requiring recovery of incentive compensation in connection with an accounting restatement due to material noncompliance of Xcel Energy with any financial reporting requirement under the securities laws, which recovery shall be subject to the terms of any policy of Xcel Energy implementing such rule or listing standard; provided that, in any event, Xcel Energy may recover cash or shares awarded under this Agreement, or proceeds from the sale of such shares, from the Participant if the Participant is terminated from Xcel Energy for fraud or misconduct. 11. Withholding Xcel Energy may require the Participant to remit to it, or may withhold from the award or from the Participant’s other compensation, an amount sufficient to satisfy any applicable federal, state, local tax, employment, FICA or other mandated withholding requirements in regard to the award in the year or years the award becomes taxable to the Participant. The Participant may elect in accordance with the Plan to satisfy the withholding requirement, in whole or in part, by having Xcel Energy withhold Units from the award at the rate the Committee determines satisfies applicable withholding requirements of the Code. For this purpose, Units are to be valued using the Fair Market Value of a share as defined in the Plan. If no election is made, the Participant will be deemed to have elected Units to be withheld. 12. Plan and Plan Interpretations as Controlling The Units hereby awarded and the terms and conditions herein set forth are subject in all respects to the terms and conditions of the Plan, which are controlling. All determinations and interpretations of the Committee or its designee shall be binding and conclusive upon the Participant or his legal representatives with regard to any question arising hereunder or under the Plan. 13. Participant Service Nothing in this Agreement shall limit the right of Xcel Energy or any of its subsidiaries to terminate the Participant’s service as an officer or employee, or otherwise impose upon Xcel Energy or any of its subsidiaries any obligation to employ or accept the services of the Participant. 14. Participant Acceptance The Participant must accept the terms and conditions of this Agreement by signing in the space provided below and returning a signed copy to Xcel Energy within the time frames specified by the Chief Administrative Officer. 15. Mandatory Binding Arbitration The Participant agrees that any and all disputes related to an award of Units including but not limited to, eligibility, vesting, distribution and payment, withholding, targets, effect of termination of employment or rights related to an amendment or termination of the Plan, will be subject to mandatory binding arbitration in Minneapolis, Minnesota before the American Arbitration Association. The Participant agrees that the Participant will be responsible for bearing his or her share of the costs to arbitrate. 16. Severability If any provision of this Agreement is held invalid, illegal or unenforceable, the validity, legality and enforceability of the remaining provisions will not be affected or impaired. IN WITNESS WHEREOF, the parties hereto have caused this Restricted Stock Unit Agreement to be executed as of the date first above written.
(Back To Top)
Exhibit 12.01
XCEL ENERGY INC. AND SUBSIDIARIES STATEMENT OF COMPUTATION OF
RATIO OF EARNINGS TO FIXED CHARGES (amounts in thousands, except ratio)
XCEL ENERGY INC. By:
ACCEPTED: Participant Signature
Date
Section 3: EX-12.01 (EXHIBIT 12.01)
Year Ended Dec. 31 2012 2011 2010 2009 2008 Earnings, as defined:
Pretax income from continuing operations $ 1,355,402 $ 1,309,690 $ 1,188,591 $ 1,056,838 $ 984,406 Add: Fixed charges 734,564 725,375 708,529 705,740 654,080 Add: Dividends from unconsolidated subsidiaries 33,470 34,034 32,538 29,059 - Deduct: Equity earnings of unconsolidated subsidiaries 29,971 30,527 29,948 24,664 3,571
Total earnings, as defined $ 2,093,465 $ 2,038,572 $ 1,899,710 $ 1,766,973 $ 1,634,915
Fixed charges, as defined:
Interest charges $ 601,582 $ 591,098 $ 577,291 $ 561,654 $ 552,919 Interest charges on life insurance policy borrowings 310 332 372 324 248

(Back To Top)
Exhibit 21.01
SUBSIDIARIES OF XCEL ENERGY INC.
(Back To Top)
Exhibit 23.01 CONSENT OF INDEPENDENT REGISTERED PUBLIC ACCOUNTING FIRM We consent to the incorporation by reference in:
Registration Statements on Form S-8: No. 333-185610 (relating to the Nuclear Management Company, LLC NMC Savings and Retirement Plan) No. 333-182136 (relating to the Xcel Energy Inc. Nonqualified Deferred Compensation Plan) No. 333-172407 (relating to the Xcel Energy 401(k) Savings Plan; and New Century Energies, Inc. Employees’ Savings and Stock Ownership plan for
Bargaining Unit Employees and Former Non-Bargaining Unit Employees; and New Century Energies, Inc. Employee Investment Plan for Bargaining Unit Employees and Former Non-Bargaining Unit Employees)
No. 333-127218 (relating to the Xcel Energy Inc. Executive Annual Incentive Award Plan) No. 333-48610 (relating to New Century Energies, Inc. Omnibus Incentive Plan; Public Service Company of Colorado Omnibus Incentive Plan;
Southwestern Public Service Company 1989 Stock Incentive Plan; Southwestern Public Service Company Employee Investment Plan; and Southwestern Public Service Company Directors’ Deferred Compensation Plan)
No. 333-127217 (relating to the Xcel Energy 2005 Omnibus Incentive Plan) No. 333-115754 and 333-175189 (relating to Stock Equivalent Plan for Non-Employee Directors) No. 333-84264 (relating to the NRG Energy, Inc. Tender Offer; Post-Effective Amendment No. A-1 on Form S-8 to Registration Statement on Form S-4)
Registration Statements on Form S-3:
No. 333-170041 (relating to the Xcel Energy Dividend Reinvestment and Cash Payment Plan) Post-Effective Amendment No. A-1 on Form S-8 to Registration Statement on Form S-4 No. 333-84264 (relating to the NRG, Inc. Tender Offer) No. 333-183536 (relating to senior debt securities, junior subordinated debt securities and common stock)
of our reports dated February 22, 2013, relating to the consolidated financial statements and financial statement schedules of Xcel Energy Inc. and subsidiaries,
Interest component of leases 132,672 133,945 130,866 143,762 100,913 Total fixed charges, as defined $ 734,564 $ 725,375 $ 708,529 $ 705,740 $ 654,080
Ratio of earnings to fixed charges 2.8 2.8 2.7 2.5 2.5
Section 4: EX-21.01 (EXHIBIT 21.01)
SUBSIDIARY (a) STATE OF
INCORPORATION PURPOSE
Northern States Power Company (a Minnesota corporation) Minnesota Electric and gas utility Northern States Power Company (a Wisconsin corporation) Wisconsin Electric and gas utility Public Service Company of Colorado Colorado Electric and gas utility Southwestern Public Service Company New Mexico Electric utility WestGas InterState, Inc. Colorado Natural gas transmission company
Xcel Energy Wholesale Group Inc. Minnesota Intermediate holding company for subsidiaries providing wholesale energy
Xcel Energy Markets Holdings Inc. Minnesota Intermediate holding company for subsidiaries providing energy marketing services
Xcel Energy International Inc. Delaware Intermediate holding company for international subsidiaries
Xcel Energy Ventures Inc. Minnesota Intermediate holding company for subsidiaries developing new businesses
Xcel Energy Retail Holdings Inc. Minnesota Intermediate holding company for subsidiaries providing services to retail customers
Xcel Energy Communications Group Inc. Minnesota Intermediate holding company for subsidiaries providing telecommunications and related services
Xcel Energy WYCO Inc. Colorado Intermediate holding company holding investment in WYCO Xcel Energy Services Inc. Delaware Service company for Xcel Energy system
(a) Certain insignificant subsidiaries are omitted.
Section 5: EX-23.01 (EXHIBIT 23.01)

and the effectiveness of Xcel Energy Inc. and subsidiaries’ internal control over financial reporting, appearing in this Annual Report on Form 10-K of Xcel Energy Inc. for the year ended December 31, 2012. /s/ DELOITTE & TOUCHE LLP Minneapolis, Minnesota February 22, 2013
(Back To Top)
Exhibit 24.01 POWER OF ATTORNEY
The undersigned director and/or officer of Xcel Energy Inc., a Minnesota corporation (the “Company”), does hereby make, constitute and appoint TERESA S. MADDEN and SCOTT M. WILENSKY, and each or any one of them, the undersigned’s true and lawful attorneys-in-fact and agents, with full power of substitution, for the undersigned and in the undersigned’s name, place and stead and in any and all capacities, to sign and affix the undersigned’s name as such director and/or officer of said Company to (i) a Form 10-K, Annual Report, or other applicable form, pursuant to the Securities Exchange Act of 1934, as amended (the “1934 Act”), including any and all exhibits, schedules, supplements, certifications and supporting documents thereto, including, but not limited to, the Form 11-K Annual Reports of the Company’s 401(k) Plans and similar plans pursuant to the 1934 Act, and all amendments, supplements and corrections thereto, to be filed by the Company with the Securities and Exchange Commission (the “SEC”), as required in connection with its registration under the 1934 Act, as amended; and (ii) one or more Registration Statements, on Form S-3, Form S-8 or other applicable forms, and all amendments, including post-effective amendments, thereto, to be filed by the Company with the SEC in connection with the registration under the Securities Act of 1933, as amended, of debt, equity or other securities of the Company, and to file the same, with all exhibits thereto and other supporting documents, with the SEC. IN WITNESS WHEREOF, the undersigned has caused this Power of Attorney to be executed as of this 20th day of February, 2013.
Section 6: EX-24.01 (EXHIBIT 24.01)
/s/ Benjamin G.S. Fowke III Benjamin G.S. Fowke III Chairman, President, Chief Executive Officer and Director

POWER OF ATTORNEY
The undersigned director and/or officer of Xcel Energy Inc., a Minnesota corporation (the “Company”), does hereby make, constitute and appoint BENJAMIN G.S. FOWKE III, TERESA S. MADDEN and SCOTT M. WILENSKY, and each or any one of them, the undersigned’s true and lawful attorneys-in-fact and agents, with full power of substitution, for the undersigned and in the undersigned’s name, place and stead and in any and all capacities, to sign and affix the undersigned’s name as such director and/or officer of said Company to (i) a Form 10-K, Annual Report, or other applicable form, pursuant to the Securities Exchange Act of 1934, as amended (the “1934 Act”), including any and all exhibits, schedules, supplements, certifications and supporting documents thereto, including, but not limited to, the Form 11-K Annual Reports of the Company’s 401(k) Plans and similar plans pursuant to the 1934 Act, and all amendments, supplements and corrections thereto, to be filed by the Company with the Securities and Exchange Commission (the “SEC”), as required in connection with its registration under the 1934 Act, as amended; and (ii) one or more Registration Statements, on Form S-3, Form S-8 or other applicable forms, and all amendments, including post-effective amendments, thereto, to be filed by the Company with the SEC in connection with the registration under the Securities Act of 1933, as amended, of debt, equity or other securities of the Company, and to file the same, with all exhibits thereto and other supporting documents, with the SEC. IN WITNESS WHEREOF, the undersigned has caused this Power of Attorney to be executed as of this 20th day of February, 2013.
/s/ Gail Koziara Boudreaux Gail Koziara Boudreaux Director
POWER OF ATTORNEY
The undersigned director and/or officer of Xcel Energy Inc., a Minnesota corporation (the “Company”), does hereby make, constitute and appoint BENJAMIN G.S. FOWKE III, TERESA S. MADDEN and SCOTT M. WILENSKY, and each or any one of them, the undersigned’s true and lawful attorneys-in-fact and agents, with full power of substitution, for the undersigned and in the undersigned’s name, place and stead and in any and all capacities, to sign and affix the undersigned’s name as such director and/or officer of said Company to (i) a Form 10-K, Annual Report, or other applicable form, pursuant to the Securities Exchange Act of 1934, as amended (the “1934 Act”), including any and all exhibits, schedules, supplements, certifications and supporting documents thereto, including, but not limited to, the Form 11-K Annual Reports of the Company’s 401(k) Plans and similar plans pursuant to the 1934 Act, and all amendments, supplements and corrections thereto, to be filed by the Company with the Securities and Exchange Commission (the “SEC”), as required in connection with its registration under the 1934 Act, as amended; and (ii) one or more Registration Statements, on Form S-3, Form S-8 or other applicable forms, and all amendments, including post-effective amendments, thereto, to be filed by the Company with the SEC in connection with the registration under the Securities Act of 1933, as amended, of debt, equity or other securities of the Company, and to file the same, with all exhibits thereto and other supporting documents, with the SEC. IN WITNESS WHEREOF, the undersigned has caused this Power of Attorney to be executed as of this 20th day of February, 2013.
/s/ Fredric W. Corrigan Fredric W. Corrigan Director

POWER OF ATTORNEY
The undersigned director and/or officer of Xcel Energy Inc., a Minnesota corporation (the “Company”), does hereby make, constitute and appoint BENJAMIN G.S. FOWKE III, TERESA S. MADDEN and SCOTT M. WILENSKY, and each or any one of them, the undersigned’s true and lawful attorneys-in-fact and agents, with full power of substitution, for the undersigned and in the undersigned’s name, place and stead and in any and all capacities, to sign and affix the undersigned’s name as such director and/or officer of said Company to (i) a Form 10-K, Annual Report, or other applicable form, pursuant to the Securities Exchange Act of 1934, as amended (the “1934 Act”), including any and all exhibits, schedules, supplements, certifications and supporting documents thereto, including, but not limited to, the Form 11-K Annual Reports of the Company’s 401(k) Plans and similar plans pursuant to the 1934 Act, and all amendments, supplements and corrections thereto, to be filed by the Company with the Securities and Exchange Commission (the “SEC”), as required in connection with its registration under the 1934 Act, as amended; and (ii) one or more Registration Statements, on Form S-3, Form S-8 or other applicable forms, and all amendments, including post-effective amendments, thereto, to be filed by the Company with the SEC in connection with the registration under the Securities Act of 1933, as amended, of debt, equity or other securities of the Company, and to file the same, with all exhibits thereto and other supporting documents, with the SEC. IN WITNESS WHEREOF, the undersigned has caused this Power of Attorney to be executed as of this 20th day of February, 2013.
/s/ Richard K. Davis Richard K. Davis Director

POWER OF ATTORNEY
The undersigned director and/or officer of Xcel Energy Inc., a Minnesota corporation (the “Company”), does hereby make, constitute and appoint BENJAMIN G.S. FOWKE III, TERESA S. MADDEN and SCOTT M. WILENSKY, and each or any one of them, the undersigned’s true and lawful attorneys-in-fact and agents, with full power of substitution, for the undersigned and in the undersigned’s name, place and stead and in any and all capacities, to sign and affix the undersigned’s name as such director and/or officer of said Company to (i) a Form 10-K, Annual Report, or other applicable form, pursuant to the Securities Exchange Act of 1934, as amended (the “1934 Act”), including any and all exhibits, schedules, supplements, certifications and supporting documents thereto, including, but not limited to, the Form 11-K Annual Reports of the Company’s 401(k) Plans and similar plans pursuant to the 1934 Act, and all amendments, supplements and corrections thereto, to be filed by the Company with the Securities and Exchange Commission (the “SEC”), as required in connection with its registration under the 1934 Act, as amended; and (ii) one or more Registration Statements, on Form S-3, Form S-8 or other applicable forms, and all amendments, including post-effective amendments, thereto, to be filed by the Company with the SEC in connection with the registration under the Securities Act of 1933, as amended, of debt, equity or other securities of the Company, and to file the same, with all exhibits thereto and other supporting documents, with the SEC. IN WITNESS WHEREOF, the undersigned has caused this Power of Attorney to be executed as of this 20th day of February, 2013.
/s/ Albert F. Moreno Albert F. Moreno Director

POWER OF ATTORNEY
The undersigned director and/or officer of Xcel Energy Inc., a Minnesota corporation (the “Company”), does hereby make, constitute and appoint BENJAMIN G.S. FOWKE III, TERESA S. MADDEN and SCOTT M. WILENSKY, and each or any one of them, the undersigned’s true and lawful attorneys-in-fact and agents, with full power of substitution, for the undersigned and in the undersigned’s name, place and stead and in any and all capacities, to sign and affix the undersigned’s name as such director and/or officer of said Company to (i) a Form 10-K, Annual Report, or other applicable form, pursuant to the Securities Exchange Act of 1934, as amended (the “1934 Act”), including any and all exhibits, schedules, supplements, certifications and supporting documents thereto, including, but not limited to, the Form 11-K Annual Reports of the Company’s 401(k) Plans and similar plans pursuant to the 1934 Act, and all amendments, supplements and corrections thereto, to be filed by the Company with the Securities and Exchange Commission (the “SEC”), as required in connection with its registration under the 1934 Act, as amended; and (ii) one or more Registration Statements, on Form S-3, Form S-8 or other applicable forms, and all amendments, including post-effective amendments, thereto, to be filed by the Company with the SEC in connection with the registration under the Securities Act of 1933, as amended, of debt, equity or other securities of the Company, and to file the same, with all exhibits thereto and other supporting documents, with the SEC. IN WITNESS WHEREOF, the undersigned has caused this Power of Attorney to be executed as of this 20th day of February, 2013.
/s/ Richard T. O’Brien Richard T. O’Brien Director

POWER OF ATTORNEY
The undersigned director and/or officer of Xcel Energy Inc., a Minnesota corporation (the “Company”), does hereby make, constitute and appoint BENJAMIN G.S. FOWKE III, TERESA S. MADDEN and SCOTT M. WILENSKY, and each or any one of them, the undersigned’s true and lawful attorneys-in-fact and agents, with full power of substitution, for the undersigned and in the undersigned’s name, place and stead and in any and all capacities, to sign and affix the undersigned’s name as such director and/or officer of said Company to (i) a Form 10-K, Annual Report, or other applicable form, pursuant to the Securities Exchange Act of 1934, as amended (the “1934 Act”), including any and all exhibits, schedules, supplements, certifications and supporting documents thereto, including, but not limited to, the Form 11-K Annual Reports of the Company’s 401(k) Plans and similar plans pursuant to the 1934 Act, and all amendments, supplements and corrections thereto, to be filed by the Company with the Securities and Exchange Commission (the “SEC”), as required in connection with its registration under the 1934 Act, as amended; and (ii) one or more Registration Statements, on Form S-3, Form S-8 or other applicable forms, and all amendments, including post-effective amendments, thereto, to be filed by the Company with the SEC in connection with the registration under the Securities Act of 1933, as amended, of debt, equity or other securities of the Company, and to file the same, with all exhibits thereto and other supporting documents, with the SEC. IN WITNESS WHEREOF, the undersigned has caused this Power of Attorney to be executed as of this 20th day of February, 2013.
/s/ Christopher J. Policinski Christopher J. Policinski Director

POWER OF ATTORNEY
The undersigned director and/or officer of Xcel Energy Inc., a Minnesota corporation (the “Company”), does hereby make, constitute and appoint BENJAMIN G.S. FOWKE III, TERESA S. MADDEN and SCOTT M. WILENSKY, and each or any one of them, the undersigned’s true and lawful attorneys-in-fact and agents, with full power of substitution, for the undersigned and in the undersigned’s name, place and stead and in any and all capacities, to sign and affix the undersigned’s name as such director and/or officer of said Company to (i) a Form 10-K, Annual Report, or other applicable form, pursuant to the Securities Exchange Act of 1934, as amended (the “1934 Act”), including any and all exhibits, schedules, supplements, certifications and supporting documents thereto, including, but not limited to, the Form 11-K Annual Reports of the Company’s 401(k) Plans and similar plans pursuant to the 1934 Act, and all amendments, supplements and corrections thereto, to be filed by the Company with the Securities and Exchange Commission (the “SEC”), as required in connection with its registration under the 1934 Act, as amended; and (ii) one or more Registration Statements, on Form S-3, Form S-8 or other applicable forms, and all amendments, including post-effective amendments, thereto, to be filed by the Company with the SEC in connection with the registration under the Securities Act of 1933, as amended, of debt, equity or other securities of the Company, and to file the same, with all exhibits thereto and other supporting documents, with the SEC. IN WITNESS WHEREOF, the undersigned has caused this Power of Attorney to be executed as of this 20th day of February, 2013.
/s/ A. Patricia Sampson A. Patricia Sampson Director

POWER OF ATTORNEY
The undersigned director and/or officer of Xcel Energy Inc., a Minnesota corporation (the “Company”), does hereby make, constitute and appoint BENJAMIN G.S. FOWKE III, TERESA S. MADDEN and SCOTT M. WILENSKY, and each or any one of them, the undersigned’s true and lawful attorneys-in-fact and agents, with full power of substitution, for the undersigned and in the undersigned’s name, place and stead and in any and all capacities, to sign and affix the undersigned’s name as such director and/or officer of said Company to (i) a Form 10-K, Annual Report, or other applicable form, pursuant to the Securities Exchange Act of 1934, as amended (the “1934 Act”), including any and all exhibits, schedules, supplements, certifications and supporting documents thereto, including, but not limited to, the Form 11-K Annual Reports of the Company’s 401(k) Plans and similar plans pursuant to the 1934 Act, and all amendments, supplements and corrections thereto, to be filed by the Company with the Securities and Exchange Commission (the “SEC”), as required in connection with its registration under the 1934 Act, as amended; and (ii) one or more Registration Statements, on Form S-3, Form S-8 or other applicable forms, and all amendments, including post-effective amendments, thereto, to be filed by the Company with the SEC in connection with the registration under the Securities Act of 1933, as amended, of debt, equity or other securities of the Company, and to file the same, with all exhibits thereto and other supporting documents, with the SEC. IN WITNESS WHEREOF, the undersigned has caused this Power of Attorney to be executed as of this 20th day of February, 2013.
/s/ James J. Sheppard James J. Sheppard Director

POWER OF ATTORNEY
The undersigned director and/or officer of Xcel Energy Inc., a Minnesota corporation (the “Company”), does hereby make, constitute and appoint BENJAMIN G.S. FOWKE III, TERESA S. MADDEN and SCOTT M. WILENSKY, and each or any one of them, the undersigned’s true and lawful attorneys-in-fact and agents, with full power of substitution, for the undersigned and in the undersigned’s name, place and stead and in any and all capacities, to sign and affix the undersigned’s name as such director and/or officer of said Company to (i) a Form 10-K, Annual Report, or other applicable form, pursuant to the Securities Exchange Act of 1934, as amended (the “1934 Act”), including any and all exhibits, schedules, supplements, certifications and supporting documents thereto, including, but not limited to, the Form 11-K Annual Reports of the Company’s 401(k) Plans and similar plans pursuant to the 1934 Act, and all amendments, supplements and corrections thereto, to be filed by the Company with the Securities and Exchange Commission (the “SEC”), as required in connection with its registration under the 1934 Act, as amended; and (ii) one or more Registration Statements, on Form S-3, Form S-8 or other applicable forms, and all amendments, including post-effective amendments, thereto, to be filed by the Company with the SEC in connection with the registration under the Securities Act of 1933, as amended, of debt, equity or other securities of the Company, and to file the same, with all exhibits thereto and other supporting documents, with the SEC. IN WITNESS WHEREOF, the undersigned has caused this Power of Attorney to be executed as of this 20th day of February, 2013.
/s/ David A. Westerlund David A. Westerlund Director

POWER OF ATTORNEY
The undersigned director and/or officer of Xcel Energy Inc., a Minnesota corporation (the “Company”), does hereby make, constitute and appoint BENJAMIN G.S. FOWKE III, TERESA S. MADDEN and SCOTT M. WILENSKY, and each or any one of them, the undersigned’s true and lawful attorneys-in-fact and agents, with full power of substitution, for the undersigned and in the undersigned’s name, place and stead and in any and all capacities, to sign and affix the undersigned’s name as such director and/or officer of said Company to (i) a Form 10-K, Annual Report, or other applicable form, pursuant to the Securities Exchange Act of 1934, as amended (the “1934 Act”), including any and all exhibits, schedules, supplements, certifications and supporting documents thereto, including, but not limited to, the Form 11-K Annual Reports of the Company’s 401(k) Plans and similar plans pursuant to the 1934 Act, and all amendments, supplements and corrections thereto, to be filed by the Company with the Securities and Exchange Commission (the “SEC”), as required in connection with its registration under the 1934 Act, as amended; and (ii) one or more Registration Statements, on Form S-3, Form S-8 or other applicable forms, and all amendments, including post-effective amendments, thereto, to be filed by the Company with the SEC in connection with the registration under the Securities Act of 1933, as amended, of debt, equity or other securities of the Company, and to file the same, with all exhibits thereto and other supporting documents, with the SEC. IN WITNESS WHEREOF, the undersigned has caused this Power of Attorney to be executed as of this 20th day of February, 2013.
/s/ Kim Williams Kim Williams Director
POWER OF ATTORNEY
The undersigned director and/or officer of Xcel Energy Inc., a Minnesota corporation (the “Company”), does hereby make, constitute and appoint BENJAMIN G.S. FOWKE III, TERESA S. MADDEN and SCOTT M. WILENSKY, and each or any one of them, the undersigned’s true and lawful attorneys-in-fact and agents, with full power of substitution, for the undersigned and in the undersigned’s name, place and stead and in any and all capacities, to sign and affix the undersigned’s name as such director and/or officer of said Company to (i) a Form 10-K, Annual Report, or other applicable form, pursuant to the Securities Exchange Act of 1934, as amended (the “1934 Act”), including any and all exhibits, schedules, supplements, certifications and supporting documents thereto, including, but not limited to, the Form 11-K Annual Reports of the Company’s 401(k) Plans and similar plans pursuant to the 1934 Act, and all amendments, supplements and corrections thereto, to be filed by the Company with the Securities and Exchange Commission (the “SEC”), as required in connection with its registration under the 1934 Act, as amended; and (ii) one or more Registration Statements, on Form S-3, Form S-8 or other applicable forms, and all amendments, including post-effective amendments, thereto, to be filed by the Company with the SEC in connection with the registration under the Securities Act of 1933, as amended, of debt, equity or other securities of the Company, and to file the same, with all exhibits thereto and other supporting documents, with the SEC. IN WITNESS WHEREOF, the undersigned has caused this Power of Attorney to be executed as of this 20th day of February, 2013.
(Back To Top)
Exhibit 31.01
CERTIFICATION I, Benjamin G.S. Fowke III, certify that:
Date: Feb. 22, 2013
/s/ Timothy V. Wolf Timothy V. Wolf Director
Section 7: EX-31.01 (EXHIBIT 31.01)
1. I have reviewed this report on Form 10-K of Xcel Energy Inc. (a Minnesota corporation);
2. Based on my knowledge, this report does not contain any untrue statement of a material fact or omit to state a material fact necessary to make the statements made, in light of the circumstances under which such statements were made, not misleading with respect to the period covered by this report;
3. Based on my knowledge, the financial statements, and other financial information included in this report, fairly present in all material respects the financial condition, results of operations and cash flows of the registrant as of, and for, the periods presented in this report;
4. The registrant’s other certifying officer and I are responsible for establishing and maintaining disclosure controls and procedures (as defined in Exchange Act Rules 13a-15(e) and 15d-15(e)) and internal control over financial reporting (as defined in Exchange Act Rules 13a-15(f) and 15d-15(f)) for the registrant and have:
a) Designed such disclosure controls and procedures, or caused such disclosure controls and procedures to be designed under our supervision, to ensure that material information relating to the registrant, including its consolidated subsidiaries, is made known to us by others within those entities, particularly during the period in which this report is being prepared;
b) Designed such internal control over financial reporting, or caused such internal control over financial reporting to be designed under our supervision, to provide reasonable assurance regarding the reliability of financial reporting and the preparation of financial statements for external purposes in accordance with generally accepted accounting principles;
c) Evaluated the effectiveness of the registrant’s disclosure controls and procedures and presented in this report our conclusions about the effectiveness of the disclosure controls and procedures, as of the end of the period covered by this report based on such evaluation; and
d) Disclosed in this report any change in the registrant’s internal control over financial reporting that occurred during the registrant’s most recent fiscal quarter (the registrant’s fourth fiscal quarter in the case of an annual report) that has materially affected, or is reasonably likely to materially affect, the registrant’s internal control over financial reporting; and
5. The registrant’s other certifying officer and I have disclosed, based on our most recent evaluation of internal control over financial reporting, to the registrant’s auditors and the audit committee of the registrant’s board of directors (or persons performing the equivalent functions):
a) All significant deficiencies and material weaknesses in the design or operation of internal control over financial reporting which are reasonably likely to adversely affect the registrant’s ability to record, process, summarize and report financial information; and
b) Any fraud, whether or not material, that involves management or other employees who have a significant role in the registrant’s internal control over financial reporting.
/s/ BENJAMIN G.S. FOWKE III Benjamin G.S. Fowke III

(Back To Top)
Exhibit 31.02
CERTIFICATION I, Teresa S. Madden, certify that:
Date: Feb. 22, 2013
(Back To Top)
Exhibit 32.01
OFFICER CERTIFICATION
CERTIFICATION PURSUANT TO 18 U.S.C. SECTION 1350,
AS ADOPTED PURSUANT TO SECTION 906 OF THE SARBANES-OXLEY ACT OF 2002
Chairman, President, Chief Executive Officer and Director
Section 8: EX-31.02 (EXHIBIT 31.02)
1. I have reviewed this report on Form 10-K of Xcel Energy Inc. (a Minnesota corporation);
2. Based on my knowledge, this report does not contain any untrue statement of a material fact or omit to state a material fact necessary to make the statements made, in light of the circumstances under which such statements were made, not misleading with respect to the period covered by this report;
3. Based on my knowledge, the financial statements, and other financial information included in this report, fairly present in all material respects the financial condition, results of operations and cash flows of the registrant as of, and for, the periods presented in this report;
4. The registrant’s other certifying officer and I are responsible for establishing and maintaining disclosure controls and procedures (as defined in Exchange Act Rules 13a-15(e) and 15d-15(e)) and internal control over financial reporting (as defined in Exchange Act Rules 13a-15(f) and 15d-15(f)) for the registrant and have:
a) Designed such disclosure controls and procedures, or caused such disclosure controls and procedures to be designed under our supervision, to ensure that material information relating to the registrant, including its consolidated subsidiaries, is made known to us by others within those entities, particularly during the period in which this report is being prepared;
b) Designed such internal control over financial reporting, or caused such internal control over financial reporting to be designed under our supervision, to provide reasonable assurance regarding the reliability of financial reporting and the preparation of financial statements for external purposes in accordance with generally accepted accounting principles;
c) Evaluated the effectiveness of the registrant’s disclosure controls and procedures and presented in this report our conclusions about the effectiveness of the disclosure controls and procedures, as of the end of the period covered by this report based on such evaluation; and
d) Disclosed in this report any change in the registrant’s internal control over financial reporting that occurred during the registrant’s most recent fiscal quarter (the registrant’s fourth fiscal quarter in the case of an annual report) that has materially affected, or is reasonably likely to materially affect, the registrant’s internal control over financial reporting; and
5. The registrant’s other certifying officer and I have disclosed, based on our most recent evaluation of internal control over financial reporting, to the registrant’s auditors and the audit committee of the registrant’s board of directors (or persons performing the equivalent functions):
a) All significant deficiencies and material weaknesses in the design or operation of internal control over financial reporting which are reasonably likely to adversely affect the registrant’s ability to record, process, summarize and report financial information; and
b) Any fraud, whether or not material, that involves management or other employees who have a significant role in the registrant’s internal control over financial reporting.
/s/ TERESA S. MADDEN Teresa S. Madden Senior Vice President and Chief Financial Officer
Section 9: EX-32.01 (EXHIBIT 32.01)

In connection with the Annual Report of Xcel Energy Inc. (Xcel Energy) on Form 10-K for the year ended Dec. 31, 2012, as filed with the SEC on the date hereof (Form 10-K), each of the undersigned officers of Xcel Energy certifies, pursuant to 18 U.S.C. Section 1350, as adopted pursuant to Section 906 of the Sarbanes-Oxley Act of 2002, that, to such officer’s knowledge:
Date: Feb. 22, 2013
The foregoing certification is being furnished solely pursuant to 18 U.S.C. Section 1350 and is not being filed as part of the Report or as a separate disclosure document. A signed original of this written statement required by Section 906, or other document authenticating, acknowledging or otherwise adopting the signature that appears in typed form within the electronic version of this written statement required by Section 906, has been provided to Xcel Energy and will be retained by Xcel Energy and furnished to the SEC or its staff upon request.
(Back To Top)
Exhibit 99.01 XCEL ENERGY CAUTIONARY FACTORS
The Private Securities Litigation Reform Act provides a “safe harbor” for forward-looking statements to encourage disclosures without the threat of litigation, providing those statements are identified as forward-looking and are accompanied by meaningful, cautionary statements identifying important factors that could cause the actual results to differ materially from those projected in the statement. Forward-looking statements are made in written documents and oral presentations of Xcel Energy Inc. or any of its subsidiaries. These statements are based on management’s beliefs as well as assumptions and information currently available to management. Such forward-looking statements are intended to be identified in this document by the words “anticipate,” “believe,” “estimate,” “expect,” “intend,” “may,” “objective,” “outlook,” “plan,” “project,” “possible,” “potential,” “should” and similar expressions. In addition to any assumptions and other factors referred to specifically in connection with such forward-looking statements, factors that could cause Xcel Energy’s actual results to differ materially from those contemplated in any forward-looking statements include, among others, the following:
(1) The Form 10-K fully complies with the requirements of Section 13(a) or 15(d) of the Securities Exchange Act of 1934; and
(2) The information contained in the Form 10-K fairly presents, in all material respects, the financial condition and results of operations of Xcel Energy as of the dates and for the periods expressed in the Form 10-K.
/s/ BENJAMIN G.S. FOWKE III Benjamin G.S. Fowke III Chairman, President, Chief Executive Officer and Director /s/ TERESA S. MADDEN Teresa S. Madden Senior Vice President and Chief Financial Officer
Section 10: EX-99.01 (EXHIBIT 99.01)
• Economic conditions, including inflation rates, monetary fluctuations and their impact on capital expenditures; • The risk of a significant slowdown in growth or decline in the U.S. economy, the risk of delay in growth recovery in the U.S. economy or the risk of
increased cost for insurance premiums, security and other items as a consequence of past or future terrorist attacks; • Trade, monetary, fiscal, taxation and environmental policies of governments, agencies and similar organizations in geographic areas where Xcel Energy
has a financial interest; • Customer business conditions, including demand for their products or services and supply of labor and materials used in creating their products and
services; • Financial or regulatory accounting principles or policies imposed by the FASB, the SEC, the FERC and similar entities with regulatory oversight; • Availability or cost of capital such as changes in: interest rates; market perceptions of the utility industry, Xcel Energy Inc. or any of its subsidiaries;
or security ratings; • Factors affecting utility and nonutility operations such as unusual weather conditions; catastrophic weather-related damage; unscheduled generation
outages, maintenance or repairs; unanticipated changes to fossil fuel, nuclear fuel or natural gas supply costs or availability due to higher demand, shortages, transportation problems or other developments; nuclear or environmental incidents; cyber incidents; or electric transmission or natural gas pipeline constraints;
• Employee workforce factors, including loss or retirement of key executives, collective-bargaining agreements with union employees, or work stoppages;
• Increased competition in the utility industry or additional competition in the markets served by Xcel Energy Inc. and its subsidiaries; • State, federal and foreign legislative and regulatory initiatives that affect cost and investment recovery, have an impact on rate structures and affect
the speed and degree to which competition enters the electric and natural gas markets; industry restructuring initiatives; transmission system operation and/or administration initiatives; recovery of investments made under traditional regulation; nature of competitors entering the industry; retail wheeling; a new pricing structure; and former customers entering the generation market;
• Environmental laws and regulations, including legislation and regulations relating to climate change, and the associated cost of compliance; • Rate-setting policies or procedures of regulatory entities, including environmental externalities, which are values established by regulators assigning
environmental costs to each method of electricity generation when evaluating generation resource options; • Nuclear regulatory policies and procedures, including operating regulations and spent nuclear fuel storage; • Social attitudes regarding the utility and power industries; • Cost and other effects of legal and administrative proceedings, settlements, investigations and claims; • Technological developments that result in competitive disadvantages and create the potential for impairment of existing assets;

Xcel Energy undertakes no obligation to publicly update or revise any forward-looking statements, whether as a result of new information, future events or otherwise. The foregoing review of factors should not be construed as exhaustive.
(Back To Top)
• Risks associated with implementations of new technologies; and • Other business or investment considerations that may be disclosed from time to time in Xcel Energy Inc.’s SEC filings, including “Risk Factors” in Item
1A of this Form 10-K, or in other publicly disseminated written documents.