xcel energy berenson wsa_secdec2007
TRANSCRIPT

Financial Success Through Financial Success Through Environmental LeadershipEnvironmental Leadership
George TysonGeorge TysonViceVice--President and TreasurerPresident and Treasurer
BerensonBerenson –– Wall Street AccessWall Street AccessWest Coast SeminarWest Coast SeminarDecember 12, 2007December 12, 2007

This material includes forwardThis material includes forward--looking statements that are subject to looking statements that are subject to certain risks, uncertainties and assumptions. Such forwardcertain risks, uncertainties and assumptions. Such forward--looking looking statements include projected earnings, cash flows, capital statements include projected earnings, cash flows, capital expenditures and other statements and are identified in this docexpenditures and other statements and are identified in this document ument by the words by the words ““anticipate,anticipate,”” ““estimate,estimate,”” ““expect,expect,”” ““projected,projected,””““objective,objective,”” ““outlook,outlook,”” ““possible,possible,”” ““potentialpotential”” and similar and similar expressions. Actual results may vary materially. Factors that expressions. Actual results may vary materially. Factors that could could cause actual results to differ materially include, but are not lcause actual results to differ materially include, but are not limited to: imited to: general economic conditions, including the availability of credigeneral economic conditions, including the availability of credit, t, actions of rating agencies and their impact on capital expendituactions of rating agencies and their impact on capital expenditures; res; business conditions in the energy industry; competitive factors;business conditions in the energy industry; competitive factors;unusual weather; effects of geopolitical events, including war aunusual weather; effects of geopolitical events, including war and acts nd acts of terrorism; changes in federal or state legislation; regulatioof terrorism; changes in federal or state legislation; regulation; actions n; actions of accounting regulatory bodies; and other risk factors listed fof accounting regulatory bodies; and other risk factors listed from rom time to time by Xcel Energy in reports filed with the SEC, inclutime to time by Xcel Energy in reports filed with the SEC, including ding Exhibit 99.01 to Xcel EnergyExhibit 99.01 to Xcel Energy’’s report on Form 10s report on Form 10--K for year 2006.K for year 2006.
Safe HarborSafe Harbor

Xcel Energy Corporate StrategyXcel Energy Corporate Strategy
Achieve annual EPS growth of 5 Achieve annual EPS growth of 5 –– 7%7%Increase dividend by 2 Increase dividend by 2 –– 4% annually4% annuallyReduce emissions by 2020Reduce emissions by 2020
Grow our core business andGrow our core business andmeet the environmental challengemeet the environmental challenge

Climate Change: the Disruptive PolicyClimate Change: the Disruptive Policy
Public policy and potential legislation highlights the Public policy and potential legislation highlights the need to address climate change need to address climate change
Climate change policy will require:Climate change policy will require:Significant emission reductionsSignificant emission reductionsSignificant capital investmentsSignificant capital investmentsTechnology transformationTechnology transformationPlant retirementsPlant retirements

Xcel Energy States at ForefrontXcel Energy States at Forefront
N/AN/A.2%.2%5% by 20155% by 2015TXTX
N/AN/AN/AN/A10% by 201510% by 2015WIWI
10% by 202010% by 2020(over 2000)(over 2000).3%.3%20% by 202020% by 2020NMNM
20% by 202020% by 2020.7%.7%20% by 202020% by 2020COCO
30% by 202530% by 2025(over 2005)(over 2005)1.5%1.5%30% by 202030% by 2020MNMN
Carbon Carbon ReductionReduction
DemandDemand--Side Side Management Management (annual MWh (annual MWh
savings)savings)
Renewable Renewable Portfolio Portfolio
Standards Standards StateState

Carbon StrategyCarbon Strategy
By 2020, reduce carbonBy 2020, reduce carbon emissions associated with emissions associated with electric serviceelectric serviceImplement strategy by operating companyImplement strategy by operating companyMaintain reasonable ratesMaintain reasonable ratesEnsure appropriate regulatory treatmentEnsure appropriate regulatory treatment

Actions to Reduce Carbon Actions to Reduce Carbon
Increase renewable energyIncrease renewable energy
Uprate and extend lives of nuclear plantsUprate and extend lives of nuclear plants
Expand DemandExpand Demand--Side Management (DSM),Side Management (DSM),energy efficiency and conservation effortsenergy efficiency and conservation efforts
Upgrade environmental systems and improve Upgrade environmental systems and improve generation plant efficiencygeneration plant efficiency
Replace/repower inefficient generationReplace/repower inefficient generation
Evaluate clean coal carbon capture and storageEvaluate clean coal carbon capture and storage
Scope and develop Smart Grid conceptScope and develop Smart Grid concept

Changing Supply Mix Changing Supply Mix
Coal Coal ****46%46%
GasGas17%17%
NuclearNuclear13%13%
Estimated 2020 Estimated 2020 Energy Supply Mix *Energy Supply Mix *
** Includes purchasesIncludes purchases**** LowLow--sulfur western coalsulfur western coal
20062006Energy Supply Mix *Energy Supply Mix *
NuclearNuclear12%12%
Coal Coal ****52% 52%
GasGas27%27%
RenewablesRenewables9%9%
Renewables Renewables 24%24%

Success FactorsSuccess Factors
Key components of past growthKey components of past growth—— Constructive rate case outcomesConstructive rate case outcomes—— MERPMERP—— Comanche 3Comanche 3
Key components of future growthKey components of future growth—— Transmission riders (MN, CO, ND, SD)Transmission riders (MN, CO, ND, SD)—— Favorable wind recovery (MN, CO)Favorable wind recovery (MN, CO)—— Environmental rider (MN)Environmental rider (MN)—— Planned forward test year (CO)Planned forward test year (CO)—— Nuclear recovery mechanism (MN)Nuclear recovery mechanism (MN)—— Southwestern Public Service (SPS)Southwestern Public Service (SPS)

Capital Expenditure ForecastCapital Expenditure Forecast
Dollars in millionsDollars in millionsDollars in millions Denotes enhanced recovery mechanismDenotes enhanced recovery mechanismDenotes enhanced recovery mechanism20072007 20082008 20092009 20102010 20112011
Base & Other Base & Other $1,080$1,080 $1,245$1,245 $1,285$1,285 $1,310$1,310 $1,300$1,300MERPMERP 290290 170170 2525 1010 00Comanche 3Comanche 3 360360 330330 6060 1010 00MN Wind Tran/CapX 2020MN Wind Tran/CapX 2020 160160 4040 6565 115115 270270Sherco UpgradeSherco Upgrade 55 55 2020 7575 230230MN Wind GenerationMN Wind Generation 8080 135135 00 00 00Nuclear Capacity/Life ExtNuclear Capacity/Life Ext 2525 7575 120120 180180 200200Fort St. Fort St. Vrain Vrain CTCT 9090 100100 2525 00 00Total CommittedTotal Committed $2,0902,090 $2,100$2,100 $1,600$1,600 $1,700$1,700 $2,000$2,000
Potential ProjectsPotential Projects 00 00--100100 200200--400400 200200--400 400 200200--500500RangeRange $2,090$2,090 $2,100$2,100-- $1,800$1,800-- $1,900$1,900-- $2,200$2,200--
$2,200$2,200 $2,000$2,000 $2,100$2,100 $2,500$2,500
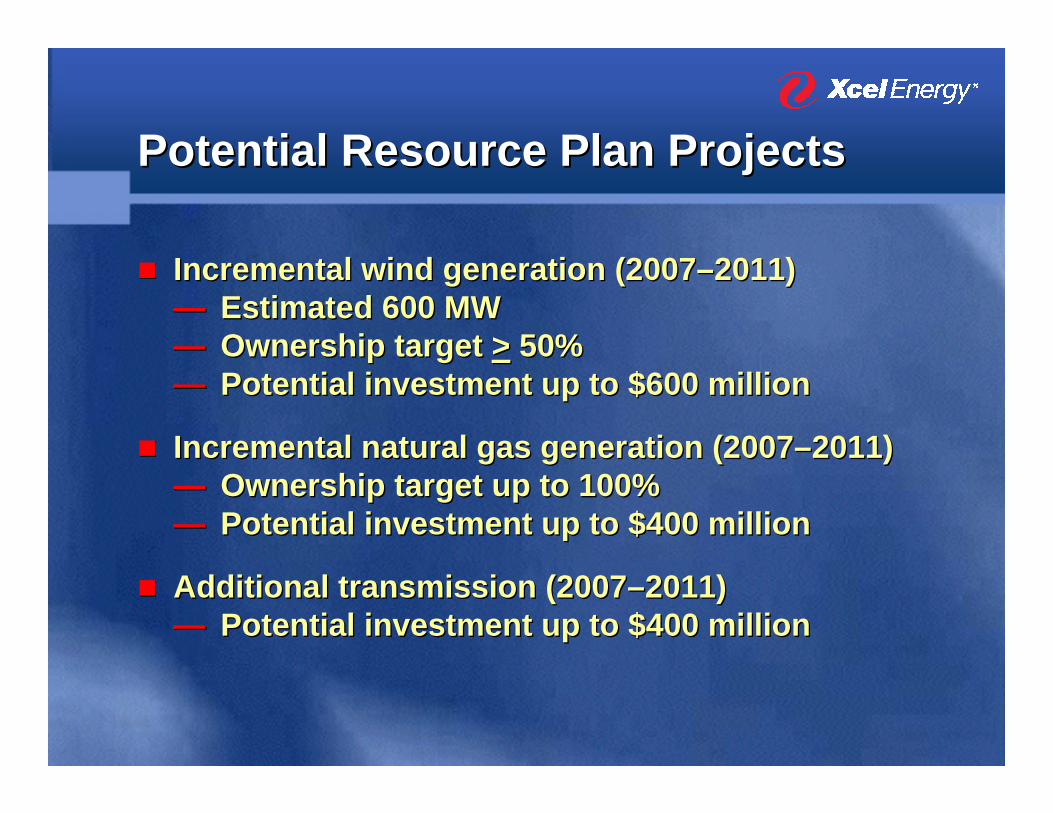
Potential Resource Plan Projects Potential Resource Plan Projects
Incremental wind generation (2007Incremental wind generation (2007––2011)2011)—— Estimated 600 MWEstimated 600 MW—— Ownership target Ownership target >> 50%50%—— Potential investment up to $600 million Potential investment up to $600 million
Incremental natural gas generation (2007Incremental natural gas generation (2007––2011)2011)—— Ownership target up to 100%Ownership target up to 100%—— Potential investment up to $400 millionPotential investment up to $400 million
Additional transmission (2007Additional transmission (2007––2011)2011)—— Potential investment up to $400 millionPotential investment up to $400 million

Recovery on Capital Investment *Recovery on Capital Investment *
* Capital forecast based on middle of range* Capital forecast based on middle of range
Depreciation
0
400
800
1,200
1,600
2,000
2,400
2,800
2007 2008 2009 2010 2011
Traditional Recovery Enhanced Recovery
Dollars in millionsDollars in millions
$2,090$2,090 $2,150$2,150$1,900$1,900 $2,000$2,000
$2,350$2,350

Potential Cash from Operations Potential Cash from Operations
* Net Income growth based on middle of range* Net Income growth based on middle of range
0
400
800
1,200
1,600
2,000
2,400
2007 2008 2009 2010 2011Net Income * Depreciation NOL
Dollars in millionsDollars in millions

Delivering on Rate Base Growth *Delivering on Rate Base Growth *
$16.9$15.7$14.9$14.0$12.8$11.7
2006 2007 2008 2009 2010 2011
CAGR = 7.5%CAGR = 7.5%
Dollars in billionsDollars in billions
* Growth based on middle of capital forecast range* Growth based on middle of capital forecast range
Regulated Utility $1.51 – $1.55 $1.61 – $1.71 Holding Company $(0.13) $(0.16) Earnings before PSRI/COLI $1.38 – $1.42 $1.45 – $1.55
PSRI/COLI $(0.08) –Continuing Operations $1.30 – $1.34 $1.45 - $1.55Disc Ops $0.01 –Total $1.31 – $1.35 $1.45 – $1.55
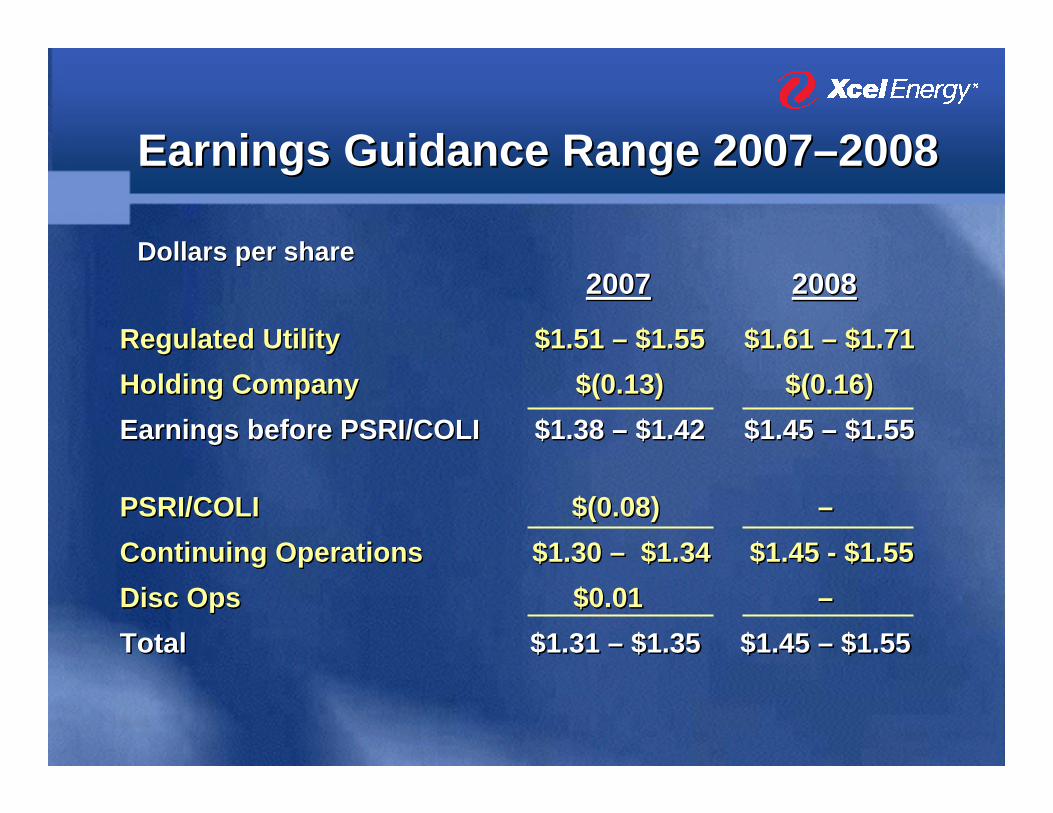
Regulated UtilityRegulated Utility $1.51 $1.51 –– $1.55$1.55 $1.61 $1.61 –– $1.71 $1.71 Holding CompanyHolding Company $(0.13)$(0.13) $(0.16) $(0.16) Earnings before PSRI/COLIEarnings before PSRI/COLI $1.38 $1.38 –– $1.42$1.42 $1.45 $1.45 –– $1.55$1.55
PSRI/COLIPSRI/COLI $(0.08)$(0.08) ––Continuing Operations Continuing Operations $1.30 $1.30 –– $1.34 $1.45 $1.34 $1.45 -- $1.55$1.55Disc Ops Disc Ops $0.01$0.01 ––Total Total $1.31 $1.31 –– $1.35$1.35 $1.45 $1.45 –– $1.55$1.55
Earnings Guidance Range 2007Earnings Guidance Range 2007––20082008
200720072007 200820082008Dollars per shareDollars per share

CatalystsCatalysts
Improve earned return on equityImprove earned return on equityColorado electric rate case in 2009Colorado electric rate case in 2009—— Request will be based on forecast test yearRequest will be based on forecast test yearMinnesota electric rate case in 2009Minnesota electric rate case in 2009—— Interim ratesInterim rates—— Potential nuclear recovery mechanismPotential nuclear recovery mechanismRate cases in smaller jurisdictionsRate cases in smaller jurisdictionsWYCO gas transmission pipelineWYCO gas transmission pipeline—— Operational in 2009Operational in 2009—— $145 million equity investment$145 million equity investment—— Potential EPS contribution of 2 Potential EPS contribution of 2 –– 3 cents 3 cents
per shareper share

Attractive Value PropositionAttractive Value Proposition
Low risk, fully regulated and integrated utilityLow risk, fully regulated and integrated utility
Constructive regulatory environment with enhanced Constructive regulatory environment with enhanced recovery of major capital projectsrecovery of major capital projects
Pipeline of investment opportunitiesPipeline of investment opportunities
Environmental leader, wellEnvironmental leader, well--positionedpositionedfor changing rulesfor changing rules
Attractive Total ReturnAttractive Total ReturnSustainable annual EPS growth of 5% Sustainable annual EPS growth of 5% –– 7%7%with upside potentialwith upside potentialStrong dividend yield of 4.2%Strong dividend yield of 4.2%Sustainable annual dividend growth of 2% Sustainable annual dividend growth of 2% –– 4%4%
~~

AppendixAppendix

Traditional RegulationTraditional Regulation
Operate in 8 StatesOperate in 8 States
Combination UtilityCombination UtilityElectric 85% of net incomeElectric 85% of net incomeGas 15% of net incomeGas 15% of net income
CustomersCustomers3.3 million electric3.3 million electric1.8 million gas1.8 million gas
2006 Financial Statistics2006 Financial StatisticsNI cont op: $548 millionNI cont op: $548 millionAssets: $22 billionAssets: $22 billionGAAP ROE: 10.1%GAAP ROE: 10.1%Equity ratio: 43%Equity ratio: 43%
Company ProfileCompany Profile
NSPNSP--WisconsinWisconsin7% of net income7% of net income
NSPNSP--MinnesotaMinnesota47% of net income47% of net income
SPSSPS8% of net income8% of net income
PSCoPSCo38% of net income38% of net income
2006 EPS $1.30 continuing operations2006 EPS $1.30 continuing operations2007 Dividend $0.92 per share annualized2007 Dividend $0.92 per share annualized

Regulated Utility $1.51 – $1.55 $1.61 – $1.71 Holding Company $(0.13) $(0.16) Continuing Operations $1.38 – $1.42 $1.45 – $1.55
Disc Ops – COLI ($0.07) –Total $1.31 – $1.35 $1.45 – $1.55
Regulated UtilityRegulated Utility $1.51 $1.51 –– $1.55$1.55 $1.61 $1.61 –– $1.71 $1.71 Holding CompanyHolding Company $(0.13)$(0.13) $(0.16) $(0.16) Continuing OperationsContinuing Operations $1.38 $1.38 –– $1.42$1.42 $1.45 $1.45 –– $1.55$1.55
Disc Ops Disc Ops –– COLICOLI ($0.07)($0.07) ––Total Total $1.31 $1.31 –– $1.35$1.35 $1.45 $1.45 –– $1.55$1.55
Earnings Guidance Range 2007Earnings Guidance Range 2007––20082008
200720072007 20082008Dollars per shareDollars per share

$0
$400
$800
$1,200
$1,600
$2,000
$2,400
$2,800
2007 2008 2009 2010 2011
Potential Projects
Common/Other
Nuclear Fuel
Gas
Elec Distribution
Elec Transmission
Elec Generation
Capital Investment Opportunities *Capital Investment Opportunities *
* Capital forecast based on middle of range* Capital forecast based on middle of range
Dollars in millionsDollars in millions

Capital ExpendituresCapital Expendituresby Operating Company *by Operating Company *
20072007 20082008 20092009 20102010 20112011
NSPMNSPM $1,025$1,025 $935$935 $955$955 $1,060$1,060 $1,380$1,380
PSCoPSCo 850850 945945 650650 680680 750750
SPS SPS 140140 170170 205 205 180 180 140140
NSPWNSPW 7575 100100 90 90 8080 80 80 TotalTotal $2,090$2,090 $2,150$2,150 $1,900$1,900 $2,000$2,000 $2,350$2,350
Dollars in millionsDollars in millions
* Capital forecast based on middle of range* Capital forecast based on middle of range

Capital Expenditures by Function *Capital Expenditures by Function *
20072007 20082008 20092009 20102010 20112011
Elec GenerationElec Generation $1,000$1,000 $935$935 $480$480 $525$525 $745$745Elec TransmissionElec Transmission 400400 300300 325325 390 390 500500Elec DistributionElec Distribution 330330 355355 345 345 355 355 360360GasGas 115115 140140 155 155 160160 155 155 Nuclear FuelNuclear Fuel 9090 145145 150150 140140 105105Common/OtherCommon/Other 155155 225225 145145 130130 135135Potential ProjectsPotential Projects 00 5050 300300 300300 350350TotalTotal $2,090$2,090 $2,150$2,150 $1,900$1,900 $2,000$2,000 $2,350$2,350
* Capital forecast based on middle of range* Capital forecast based on middle of range
Dollars in millionsDollars in millions

Debt MaturitiesDebt Maturities
$0
$200
$400
$600
$800
$1,000
$1,200
2007 2008 2009 2010 2011 2012 2013 2014 2015
SPSPSCoNSPWNSPMXcel Energy
Dollars in millionsDollars in millionsDollars in millions
Xcel Energy: $104 million due 11/27/2007 @ 7.50%Xcel Energy: $104 million due 11/27/2007 @ 7.50%

Senior Debt RatingsSenior Debt Ratings
SecuredSecured UnsecuredUnsecuredFitch Moody’s S&P Fitch Moody’s S&PFitch Moody’s S&P Fitch Moody’s S&P
Holding Co. BBB+ Baa1 BBBNSPM A+ A2 A A A3 BBBNSPW A+ A2 A A A3 BBB+ PSCo A A3 A A- Baa1 BBBSPS BBB+ Baa1 BBB+
Holding Co. BBB+ Baa1 BBBNSPM A+ A2 A A A3 BBBNSPW A+ A2 A A A3 BBB+ PSCo A A3 A A- Baa1 BBBSPS BBB+ Baa1 BBB+

2006 Rate Case Outcomes2006 Rate Case Outcomes
Colorado Electric $208 $151 11.0% 10.5%
Minnesota Electric $156 $131/115* 11.0% 10.54%
Wisconsin Electric $53.1 $43.4 11.9% 11.0%
Colorado Gas $34.5 $22.0 11.0% 10.5%
Wisconsin Gas $7.8 $3.9 11.9% 11.0%
Colorado Electric Colorado Electric $208$208 $151 $151 11.0%11.0% 10.5%10.5%
Minnesota ElectricMinnesota Electric $156$156 $131/115* $131/115* 11.0%11.0% 10.54%10.54%
Wisconsin ElectricWisconsin Electric $53.1$53.1 $43.4$43.4 11.9%11.9% 11.0%11.0%
Colorado GasColorado Gas $34.5$34.5 $22.0$22.0 11.0%11.0% 10.5%10.5%
Wisconsin GasWisconsin Gas $7.8$7.8 $3.9$3.9 11.9%11.9% 11.0%11.0%
Dollar IncreaseDollar IncreaseDollar Increase Return on EquityReturn on EquityReturn on EquityRequested GrantedRequestedRequested GrantedGranted Requested GrantedRequestedRequested GrantedGranted
* $131 million for 2006 reduced to $115 million in 2007 * $131 million for 2006 reduced to $115 million in 2007 for large customer coming onfor large customer coming on--line January 1, 2007 line January 1, 2007
Dollars in millionsDollars in millions

2007 Rate Case Outcomes 2007 Rate Case Outcomes
Texas Electric $48.0 $23.0 11.6% N/A
Colorado Gas $41.9 $32.3 11.0% 10.25%
Minnesota Gas $18.5 $11.9 11.0% 9.71%
North Dakota Gas $2.8 $2.3 11.3% 10.75%
Texas ElectricTexas Electric $48.0$48.0 $23.0$23.0 11.6% N/A 11.6% N/A
Colorado GasColorado Gas $41.9$41.9 $32.3$32.3 11.0%11.0% 10.25%10.25%
Minnesota GasMinnesota Gas $18.5$18.5 $11.9$11.9 11.0%11.0% 9.71%9.71%
North Dakota GasNorth Dakota Gas $2.8$2.8 $2.3 $2.3 11.3%11.3% 10.75%10.75%
Dollar IncreaseDollar Increase Return on EquityReturn on EquityRequested GrantedRequested Granted Requested GrantedRequested Granted
Dollars in millionsDollars in millions

Pending Rate CasesPending Rate Cases
RevenueRevenue RequestedRequested InterimInterimJurisdictionJurisdiction RequestRequest ROEROE RateRate DecisionDecision
Wisconsin ElectricWisconsin Electric $67.4$67.4 11.0%11.0% N/AN/A December 2007December 2007Wisconsin GasWisconsin Gas $5.3$5.3 11.0%11.0% N/AN/A December 2007December 2007New Mexico ElectricNew Mexico Electric $17.3$17.3 11.0%11.0% N/AN/A Summer 2008Summer 2008
Dollars in millionsDollars in millions

2006 Rate Base and ROE2006 Rate Base and ROE
Minnesota ElectricMinnesota Electric $3,599$3,599 10.3%10.3%Minnesota GasMinnesota Gas 441441 6.16.1North Dakota ElectricNorth Dakota Electric 188188 8.98.9North Dakota GasNorth Dakota Gas 4444 7.57.5South Dakota ElectricSouth Dakota Electric 232232 11.111.1Colorado ElectricColorado Electric 3,2923,292 7.77.7Colorado GasColorado Gas 1,1061,106 7.87.8Wisconsin ElectricWisconsin Electric 556556 10.810.8Wisconsin GasWisconsin Gas 7777 7.47.4Texas ElectricTexas Electric 977 977 6.56.5New Mexico ElectricNew Mexico Electric 311311 6.26.2WholesaleWholesale 879879 Not ReportedNot ReportedTotal Rate Base $11,702Total Rate Base $11,702
Weather NormalizedRate Base Earned ROE
Weather NormalizedWeather NormalizedRate BaseRate Base Earned ROEEarned ROE
Dollars in millionsDollars in millions