x-ray study of human dental tissues affected by ...for peer review 1 x-ray study of human dental...
TRANSCRIPT

University of Birmingham
X-ray Study of Human Dental Tissues Affected byErythroblastosis FetalisSui, T; Ying, S; Korsunsky, A M; Landini, G
DOI:10.1177/0022034515580987
License:Other (please specify with Rights Statement)
Document VersionPeer reviewed version
Citation for published version (Harvard):Sui, T, Ying, S, Korsunsky, AM & Landini, G 2015, 'X-ray Study of Human Dental Tissues Affected byErythroblastosis Fetalis', Journal of Dental Research, vol. 94, no. 7, pp. 1004-10.https://doi.org/10.1177/0022034515580987
Link to publication on Research at Birmingham portal
Publisher Rights Statement:Version of Record available at: http://dx.doi.org/10.1177/0022034515580987Copyright © 2015 by International & American Associations for Dental Research
Eligibility checked October 2015
General rightsUnless a licence is specified above, all rights (including copyright and moral rights) in this document are retained by the authors and/or thecopyright holders. The express permission of the copyright holder must be obtained for any use of this material other than for purposespermitted by law.
•Users may freely distribute the URL that is used to identify this publication.•Users may download and/or print one copy of the publication from the University of Birmingham research portal for the purpose of privatestudy or non-commercial research.•User may use extracts from the document in line with the concept of ‘fair dealing’ under the Copyright, Designs and Patents Act 1988 (?)•Users may not further distribute the material nor use it for the purposes of commercial gain.
Where a licence is displayed above, please note the terms and conditions of the licence govern your use of this document.
When citing, please reference the published version.
Take down policyWhile the University of Birmingham exercises care and attention in making items available there are rare occasions when an item has beenuploaded in error or has been deemed to be commercially or otherwise sensitive.
If you believe that this is the case for this document, please contact [email protected] providing details and we will remove access tothe work immediately and investigate.
Download date: 07. Mar. 2020

For Peer Review
X-ray study of human dental tissues affected by
erythroblastosis fetalis
Journal: Journal of Dental Research
Manuscript ID: JDR-14-1242.R2
Manuscript Type: Research Reports
Date Submitted by the Author: n/a
Complete List of Authors: Sui, Tan; University of Oxford, Department of Engineering Science Ying, Siqi; University of Oxford, Department of Engineering Science Korsunsky, Alexander; University of Oxford, Department of Engineering Science Landini, Gabriel; University of Birmingham, School of Dentistry
Keywords: Biomaterial(s), X-ray Crystallography, Microscopy
Abstract:
Numerous diseases are known to cause microstructural alteration of dental tissues structure. One type, in particular, is associated with neonatal jaundice and circulation of bilirubin in blood at high concentration due to increased haemolysis (e.g. in conditions such as erythroblastosis fetalis (EF), septicemia, biliary atresia and other causes of hyperbilirubinaemia). In those conditions, the products of the catabolism of haemoglobin end up deposited in various tissues, including teeth, where they can present clinically as visibly stained brown/green teeth. There is almost no information on the nature or extent of the structural changes taking place in these conditions. Here, advanced non-destructive wide angle synchrotron X-ray scattering (WAXS) techniques combined with scanning microscopy methods were used to investigate for the first time the
ultrastructure of the dental hard tissues in an archival case of intrinsically pigmented green teeth. Despite no obvious elemental variation across the pigmented tissue region, the high resolution crystallographic properties probed by WAXS revealed an ultrastructural variation (orientation, particle size and lattice parameter of hydroxyapatite crystallites) associated with a pigmentation line in dentine, and with a distinct neonatal line in enamel.
http://mc.manuscriptcentral.com/jdr
Journal of Dental Research

For Peer Review
1
X-ray study of human dental tissues affected by erythroblastosis fetalis
Tan Sui1, Siqi Ying
1, Alexander M. Korsunsky
1, Gabriel Landini
2
1 Multi-Beam Laboratory for Engineering Microscopy (MBLEM), Department of
Engineering Science, University of Oxford, Parks Road, Oxford OX1 3PJ, United
Kingdom.
2 School of Dentistry, College of Medical and Dental Sciences, University of
Birmingham, St Chad’s Queensway, Birmingham B4 6NN, United Kingdom.
Word count:
Abstract word count: 182
Total word count: 3147
Total number of figures: 5
Number of references: 18
Corresponding author:
Tan Sui
Department of Engineering Science, University of Oxford
Parks Road, Oxford, United Kingdom, OX1 3PJ
Tel: +44-18652-83447 Fax: +44-18652-73010 E-Mail: [email protected]
Keywords:
bilirubin, tooth, pigments, dental enamel, dentine, neonatal jaundice
Page 1 of 23
http://mc.manuscriptcentral.com/jdr
Journal of Dental Research
123456789101112131415161718192021222324252627282930313233343536373839404142434445464748495051525354555657585960
For Peer Review
2
Abstract
Numerous diseases are known to cause microstructural alteration of dental tissues
structure. One type, in particular, is associated with neonatal jaundice and circulation
of bilirubin in blood at high concentration due to increased haemolysis (e.g. in
conditions such as erythroblastosis fetalis (EF), septicemia, biliary atresia and other
causes of hyperbilirubinaemia). In those conditions, the products of the catabolism of
haemoglobin end up deposited in various tissues, including teeth, where they can
present clinically as visibly stained brown/green teeth. There is almost no information
on the nature or extent of the structural changes taking place in these conditions. Here,
advanced non-destructive wide angle synchrotron X-ray scattering (WAXS)
techniques combined with scanning microscopy methods were used to investigate for
the first time the ultrastructure of the dental hard tissues in an archival case of
intrinsically pigmented green teeth. Despite no obvious elemental variation across the
pigmented tissue region, the high resolution crystallographic properties probed by
WAXS revealed an ultrastructural variation (orientation, particle size and lattice
parameter of hydroxyapatite crystallites) associated with a pigmentation line in
dentine, and with a distinct neonatal line in enamel.
Page 2 of 23
http://mc.manuscriptcentral.com/jdr
Journal of Dental Research
123456789101112131415161718192021222324252627282930313233343536373839404142434445464748495051525354555657585960
For Peer Review
3
Introduction
Dental appearance and structure can be affected by substances circulating in blood
during odontogenesis, e.g. fluorine (dental fluorosis), tetracycline, porphyrins
(congenital erythropoietic porphyria) and bilirubin (in erythroblastosis fetalis (EF)
(Marsland and Gerrard, 1953), septicemia (Swann and Powls, 2012), biliary atresia or
hyperbilirubinaemia (Amaral et al., 2008)). Sometimes, these changes are
accompanied by enamel hypoplasia (e.g, in kernicterus cases (Forrester and Miller,
1955)).
Intrinsic bilirubin tooth staining without obvious enamel hypoplasia presents
clinically as a green/brown/yellow crown discolouration and a history of neonatal
jaundice (especially in EF). Green teeth associated with neonatal jaundice were first
reported in 1912 (Langmead, 1912; Thursfield, 1912). Since then, few reports were
published on the histology of “green teeth” (Carrillo et al., 2011; Marsland and
Gerrard, 1953). Typically, unstained sections reveal accumulated pigment in dentine
forming a chronological line running parallel to the incremental lines. In EF, the
pigmentation marks the time when the dentition was formed, therefore appearing at
some distance from the dentine-enamel-junction (DEJ), depending on the tooth
developmental stage. The chemical composition of these pigmented bands and the
local structure of dentine and enamel have not been thoroughly characterized and very
few papers discuss the possible processes involved (Bevis, 1956). Here we investigate
dental ultrastructure to clarify to what extent tissue formation is affected by bilirubin
(or biliverdin) (Bevis, 1956) in blood during the jaundice episode.
2. Materials and Methods
The green tooth sample used here is an unstained ground section of an upper left
Page 3 of 23
http://mc.manuscriptcentral.com/jdr
Journal of Dental Research
123456789101112131415161718192021222324252627282930313233343536373839404142434445464748495051525354555657585960

For Peer Review
4
first deciduous molar from the Oral Pathology slides archive, the School of Dentistry,
University of Birmingham (existing holdings, HTA license #12313). The sample
originates from Case 2 of a previous study (Marsland and Gerrard, 1953) with a
known history of EF and neonatal jaundice lasting 8 weeks . At least 7 teeth were
pigmented at eruption and several extractions were done on two occasions over 14
months. All extracted teeth showed dentinal staining, with varying intensities.
To facilitate manipulation, the sample was mounted between two plastic plates
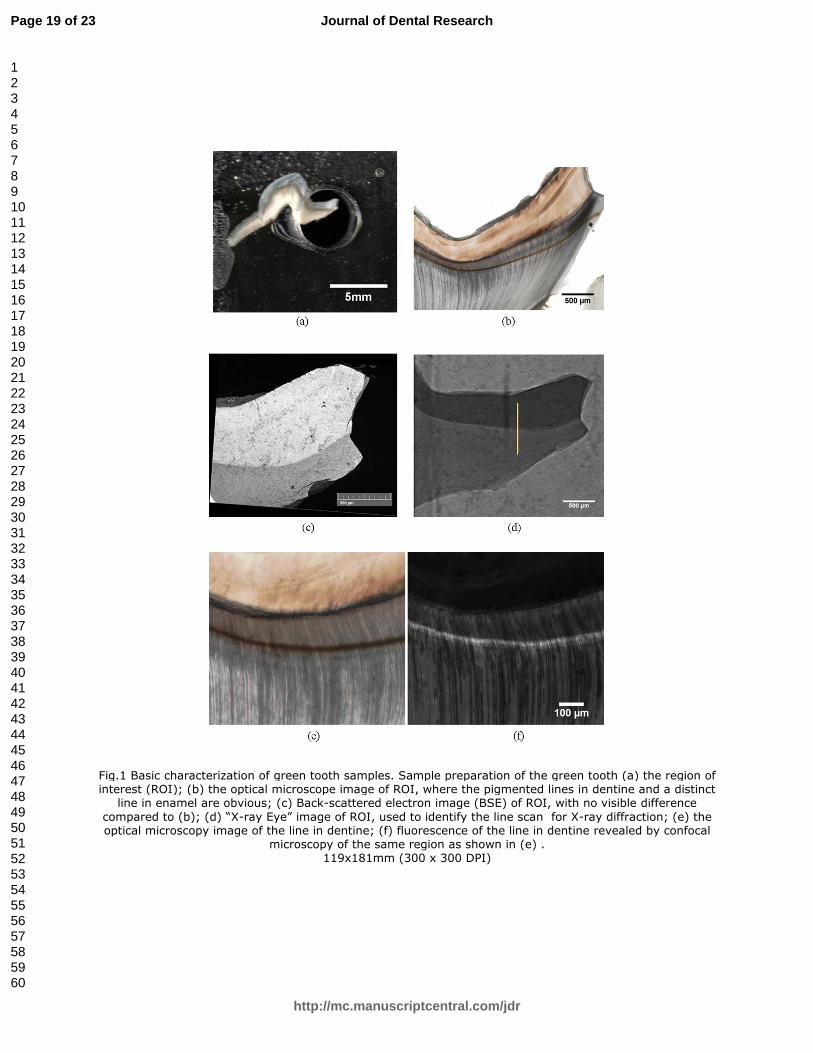
leaving a 5mm diameter window exposing the region of interest (ROI) (Fig. 1a) whilst
preventing other unwanted interference. Light microscopy inspection revealed a
brownish dentinal line (~25µm thickness, Fig. 1b) running at 80µm to 220µm from
the DEJ. Another band in enamel (30-40µm thick) appeared in places as a double line
coincident with the so-called neonatal line. SEM imaging using back-scattered
electrons detector was performed on the ROI (Fig. 1c). Previously reported SEM
studies of pigmented enamel in shrews’ teeth revealed structural changes (Dumont et
al., 2014). However, no obvious structure change (electron density or elemental
composition) in the enamel or dentine lines were detected.
Chronologically, the change in metabolism leading to formation of the neonatal
line (i.e. at birth) coincides with the time of neonatal haemolysis and jaundice in EF,
posing uncertainties over the nature of structural enamel features. For this reason, the,
sample was examined using a Zeiss LSM700 confocal microscope (10x objective)
and 555nm monochromatic laser light excitation. The sample showed auto-
fluorescence in the form of a bright line (Fig. 1f) corresponding to the pigmented
band in dentine (Fig. 1e), while no obvious bright line was visible in enamel.
<< Fig.1 here >>
Page 4 of 23
http://mc.manuscriptcentral.com/jdr
Journal of Dental Research
123456789101112131415161718192021222324252627282930313233343536373839404142434445464748495051525354555657585960

For Peer Review
5
2.1. Micro-focus X-ray diffraction analysis
Wide angle X-ray scattering (WAXS), an X-ray diffraction technique requiring
minimal sample preparation, allows non-destructive analysis of the crystal lattice
structure, microstructure and strain. The position, amplitude and width of the
diffraction peaks contain statistical information about the sample structure. Since each
peak corresponds to a certain family of lattice planes within a certain crystallographic
phase, quantitative diffraction pattern analysis can be used to identify crystallographic
phases and quantify structural parameters.
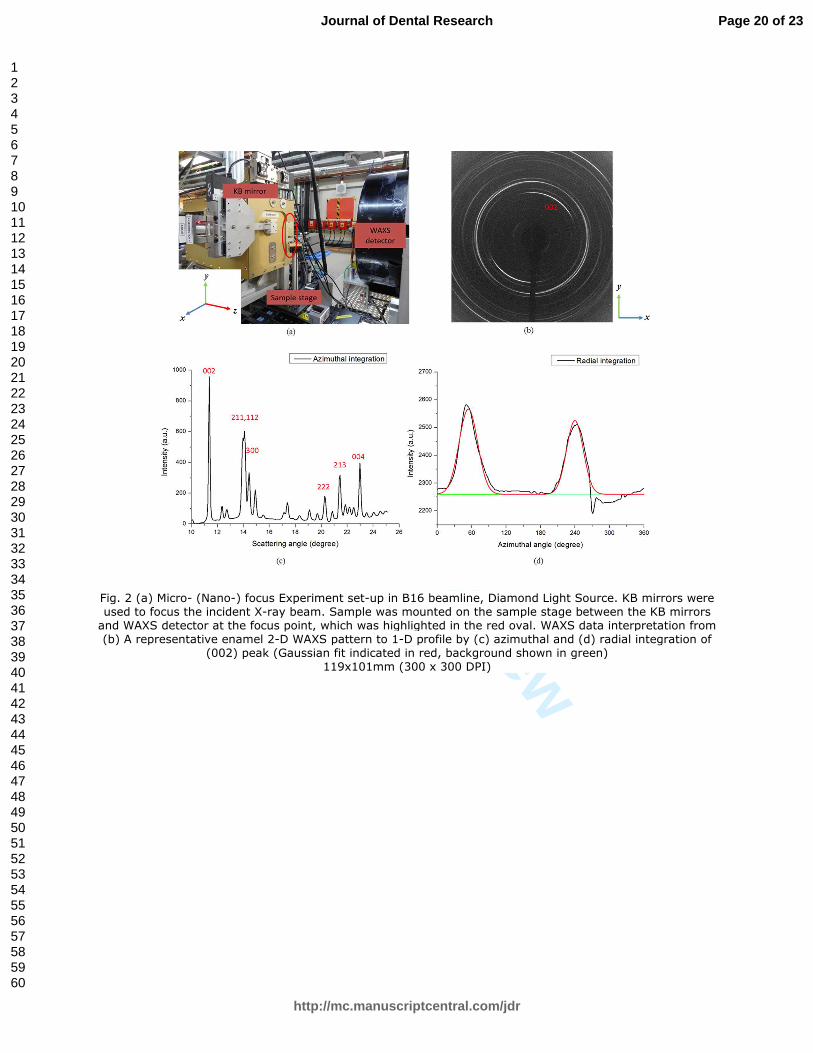
Micro-beam X-ray diffraction was performed on B16 beamline at Diamond Light
Source (Oxford, UK) using monochromatic X-rays at 18 KeV. As illustrated in Fig.
2a with the z-axis oriented along the beam direction, the “X-ray Eye” detector
(Photonic Science X-ray MiniFDI) was used to align the sample and collimation slits.
Figure 1d shows radiographic images of the sample. The slits were narrowed down to
obtain a small beam impinging on the sample ROI, and the 2D WAXS detector
(Photonic Science Image Star 9000) was used to collect the WAXS patterns in the x-y
plane in the global coordinates. Additionally, the beam spot was focused using a
Kirkpatrick-Baez (KB) mirror pair down to 0.53×0.39µm. When evaluating the
positional beam stability, a time-dependent drift of 2-3 µm was observed over 30min.
A high resolution acquisition line scan over 800 µm at 2.6 µm steps was performed
along the y-axis, as illustrated by the yellow line in Fig. 1d.
2.2. Data interpretation
Quantitation of WAXS patterns provides insights into the lattice parameters,
particle size, and preferred orientation of HAp crystallites. Interpretation involves
converting 2-D Debye-Scherrer diffraction images ( , )I q ϕ (q is scattering vector
Page 5 of 23
http://mc.manuscriptcentral.com/jdr
Journal of Dental Research
123456789101112131415161718192021222324252627282930313233343536373839404142434445464748495051525354555657585960

For Peer Review
6
related to the radial position, ϕ is azimuthal angle) (Fig. 2b) into 1-D intensity
profiles e.g. using Fit2D software package (Hammersley, 1997). Figure 2c illustrates
the results of azimuthal integration given by ( ) ( , ) dI q I q ϕ ϕ= ∫$ , and radial integration
given by ( ) ( , )dI I q qϕ ϕ= ∫% for the (002) peak in Fig. 2 d as described in detail
previously (Sui et al., 2013; Sui et al., 2014a; Sui et al., 2014b).
Crystallographic analysis of wide angle peaks is performed with the help of
Bragg’s law which establishes the relationship between crystal interplanar spacing
and the scattering angle of intense reflection:
02 sinhkln dλ θ= (Eq. 1)
where λ is the wavelength; 0
hkld is the strain-free spacing between planes with Miller
indices (hkl), 2θ is the scattering angle, and n is the reflection order.
The reflection of (002) plane gives information on the orientation of the hexagonal
c-axis of HAp crystallites (CIF file 1011242, Ca5 (PO4)3(OH),
hydroxylapatite/pentacalcium tris(phosphate) hydroxide). Quantitative analysis of 1-D
intensity profile of (002) peaks in Fig. 2c, (e.g. Gaussian curve fitting) reveals the
variation of the lattice parameter c within the line scan. The transition from enamel to
dentine at the DEJ is readily identified by the steep gradient.
The peak broadening in the 1-D radial diffraction pattern (Fig. 2c) is primarily
related to two microstructural factors: the average size of HAp crystallites, and the
root-mean-square (RMS) microstrain. The Williamson-Hall (W-H) method
(Williamson and Hall, 1953) can be used to interpret e.g. the (00n) family of peaks
using the equation: Bcosθ =kλL+C < ε > sinθ , (k ≅1, C ≅ 4) , where B is is the full-
width at half maximum (FWHM) of the peak analysed, < ε > is root-mean-square
strain, L is the particle size in the direction defined by the scattering vector, and λ and
Page 6 of 23
http://mc.manuscriptcentral.com/jdr
Journal of Dental Research
123456789101112131415161718192021222324252627282930313233343536373839404142434445464748495051525354555657585960
For Peer Review
7
θ have their usual meanings in Bragg’s law. The (004) reflection is relatively weak in
the dentine. Nevertheless, careful analysis shows that the crystal size contribution
(value) dominates over the RMS microstrain effect (slope): the intercept of the
Williamson-Hall plot based on the two (002) and (004) peaks equals 0.11 degrees,
whilst the single (002) peak value of the W-H parameter equals 0.12 degrees. Our
observations are strongly supported by the dental research literature (Egan et al.,
2013). This reasoning leads us to the conclusion that the Scherrer Equation (Patterson,
1939) (Eq.2) can be used to quantify the mean crystallite size and how it changes
using the (002) peak width analysis, as follows
cos
kL
B
λθ
= (Eq.2)
where k is a constant close to unity weakly dependent on crystallite shape, and other
symbols have their usual meanings. Due to the alignment of the c-axis in HAp in
enamel and dentine, L is often referred to as length (i.e. the longest dimension) of
HAp crystallites. Since other parameters (k, λ and θ) are almost constant, the variation
of the length of HAp crystallites can be derived by monitoring the variation of
FWHM of (002) peak.
The DEJ transition always manifests itself as a distinct change of crystallite sizes
between dentine and enamel. Interestingly, significant crystallite length changes were
also found near the EF lines of interest in the dentine and enamel. Thus, WAXS
pattern parameters display strong sensitivity to the structural features of dental tissue,
and may shed light on the processes caused by the underlying clinical events.
WAXS is also sensitive to the orientation distribution of crystallites (texture).
Instead of a complete, homogeneous circle, diffraction rings may consist of circular
arcs spanning limited angular ranges, with strong intensity variation as a function of
Page 7 of 23
http://mc.manuscriptcentral.com/jdr
Journal of Dental Research
123456789101112131415161718192021222324252627282930313233343536373839404142434445464748495051525354555657585960

For Peer Review
8
the azimuthal angle (Fig. 2d). The azimuthal centre position of the pronounced peaks
is used to define the preferred orientation direction of the (002) family of planes of
HAp crystallites. By tracing the azimuthal centre position of (002) circular arcs in the
2-D patterns, the HAp c-axis orientation variation with respect to the global
coordinates is obtained, as shown in Fig. 2.
<< Fig.2 here >>
3. Results
3.1. Microscopy characterization
The energy-dispersive X-ray spectroscopy (EDX) analysis of the ROI is shown in
Fig. 3a. Figures 3b-e illustrate the Ca, P, O and Fe EDX mapping, with the
corresponding energy spectrum. The mass fraction and atomic concentration of those
elements is shown in Fig. 3f. The Fe concentration in the stained material, if present,
was too low to be detected. Both bilirubin and biliverdin molecules (the likely
responsible candidates for the dentine pigmentation (Bevis, 1956)) contain C, H, N
and O but not Fe, (the enzyme heme-oxygenase converts the heme into Fe2+
and
biliverdin which is subsequently converted into bilirubin).
<< Fig.3 here >>
3.2. DEJ centre determination
Given the small beam size used, the line scan resolution depends on the sample
thickness (~300µm). Long time line scans (~11h, ~2min per point) can lead to drift.
DEJ can be identified from the sharp transition from enamel to dentine (Fig. 4a), but
its position needs to be reliably to serve as a point of reference.
Page 8 of 23
http://mc.manuscriptcentral.com/jdr
Journal of Dental Research
123456789101112131415161718192021222324252627282930313233343536373839404142434445464748495051525354555657585960

For Peer Review
9
To determine the precise DEJ position we employed differentiation of the
transition curve (a edge detection technique commonly employed in image processing
and analysis). The point of the maximum gradient (peak of the derivative curve) can
be identified with the centre of the transition region. It is also fairly common to use
the FWHM of the derivative curve as a measure of the transition width. This method
is used routinely to calculate the cross-sectional dimensions of micro-focused beams
at synchrotron beamlines (using a knife edge cross-scan), providing an accurate
quantitative measure. It is important not to confuse this with the FWHM of “real”
diffraction peaks discussed earlier.
By fitting the differentiated curves with a Gaussian function, the FWHM size of
the DEJ was found to be 37µm (Fig. 4b and 4c). The centre of the differentiated
curves was also calculated to be 487µm and 491µm (average 489µm). Thus, 489µm
in Fig.4 was defined zero reference position with respect to DEJ centre. Due to
difficulties in precise sample positioning and its internal geometry, the DEJ plane may
not be perfectly perpendicular to the sectioning plane, nor parallel to the incident
beam, causing a contribution to the apparent DEJ broadening. Taking these
considerations into account, scan positions below ~425µm can be safely identified as
'pure enamel', and beyond ~550µm as 'pure dentine'.
<< Fig.4 here >>
3.3. Ultrastructural characterization
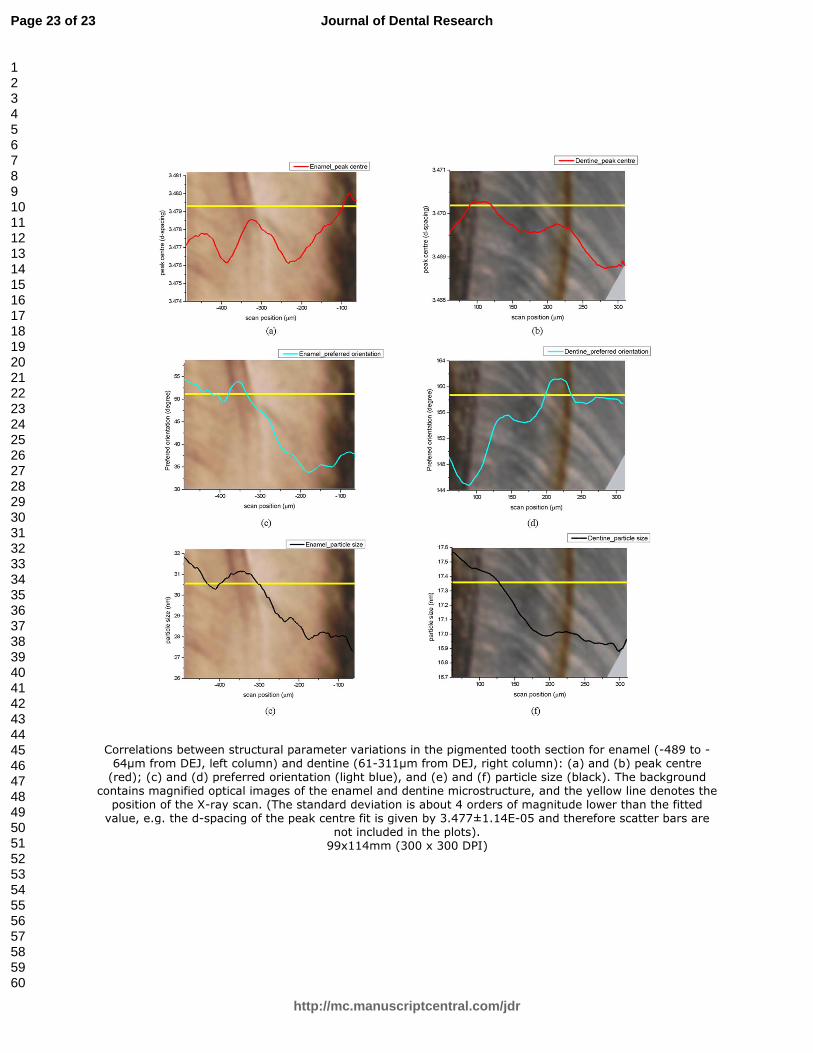
The 'peak centre', 'preferred orientation' and particle size ('peak width') derived
from the diffraction patterns in enamel are shown in Fig. 5a,c,e, superimposed on Fig.
1b. The yellow horizontal line refers to the scanning line in Fig. 1d. There is visible
and clear nonlinear region approximately -330µm from the DEJ centre. This appears
Page 9 of 23
http://mc.manuscriptcentral.com/jdr
Journal of Dental Research
123456789101112131415161718192021222324252627282930313233343536373839404142434445464748495051525354555657585960

For Peer Review
10
consistent with the optical microscope image (Fig. 1b) showing the distinct banded
enamel feature ~200-350µm from the DEJ. Note that the time of high bilirubin
exposure in EF coincides with the neonatal line development.
The diffraction pattern parameters labelled 'peak centre', 'preferred orientation' and
‘particle size’ (derived from the peak width) in dentine are plotted in Fig. 5b,d,f, also
superimposed on Fig. 1b, with the horizontal scanning line shown in yellow in Fig. 1d.
The stained band in dentine lies 220µm from the DEJ (Fig. 1b). The structural
changes are mostly reflected in the plots of preferred orientation and peak centre
position around the scan location at 211-236µm (on the stained line).
Structural parameter plots across banded features allow making deductions about
the effect of high bilirubin. In Fig. 5, the DEJ lies between the two image columns,
with the direction of enamel deposition to the left, and dentine to the right. In both
dentine and enamel, the position of the bands corresponds to the time of disruption of
tissue formation. Peak centre plots in Fig. 5a, b reveal that the overall systematic trend
is for the lattice spacing of HCP lattice basal planes to decrease as the tissues grow
away from the DEJ.
Fig. 5c-d show plots of the preferred orientation angle as a function of position.
Both enamel and dentine exhibit localised changes in the orientation angle of
crystallites.
Finally, Fig. 5e,f illustrate the variation in particle size (derived from the peak
width) with the distance from the DEJ. Two opposing trends are observed: the particle
size increases with distance from the junction in the enamel. At the same time, the
particle size in dentine becomes smaller further away from the DEJ. However, a
reversal of the respective trends is observed in both enamel and dentine within the EF
bands. These result in the appearance of a local maximum of crystal size. Once again,
Page 10 of 23
http://mc.manuscriptcentral.com/jdr
Journal of Dental Research
123456789101112131415161718192021222324252627282930313233343536373839404142434445464748495051525354555657585960

For Peer Review
11
the trend is reversed subsequently.
In summary, detailed analysis of the variation of structural parameters across the
stained band reveals localised changes consistent with other aspects of the structure. It
appears that during pigment deposition, a change in the tissue mineralization process
leads to temporary increase of the c-axis lattice spacing, accompanied by larger HAp
crystallites produced. These changes are temporary, and the prevailing growth trends
in dentine and enamel are eventually restored.
<< Fig.5 here >>
4. Discussion
A number of key conclusions can be drawn from the results.
There is a clear overall decreasing trend for the lattice spacing of HCP lattice basal
planes with the distance from the DEJ. Different hypotheses to explain this
phenomenon have been put forward, and a controversy regarding the underlying
mechanisms persists. Analysing calcite in seashell nacre, (Pokroy et al., 2006) state
that in biogenic calcite the unit cell parameters a and c were systematically larger than
those in the non-biogenic calcite. They suggest that it is caused by lattice swelling
from organic macromolecules incorporated within the crystals during
biomineralization. However, there are arguments against this mechanism being active
for HAp crystallites, due to their extremely small size. The incorporation of citrate
and carbonate ions may take place, but presently no firm proof of this hypothesis had
been found. In terms of crystal perfection, the maturation of hard tissues (Arnold et al.,
2001) is thought to lead to the decrease in the crystal lattice fluctuations in bone,
dentine and enamel that may be associated with changes in the content of ions such as
hydroxyl, carbonate, and sodium. The formation of more perfect inorganic crystallites
Page 11 of 23
http://mc.manuscriptcentral.com/jdr
Journal of Dental Research
123456789101112131415161718192021222324252627282930313233343536373839404142434445464748495051525354555657585960

For Peer Review
12
is accompanied by the reduction in the lattice parameter.
Given the maturation trends described above, our results reveal that in the EF-
affected bands the maturation is temporarily retarded or even reversed: local maxima
of HAp interplanar lattice spacing are observed in both dentine and enamel. We
surmise that disease led to a temporary decrease in the extent of mineralisation,
leaving the HAp crystal lattice less perfect and more widely spaced during the
haemolysis episode, followed by subsequent recovery, when the expected tissue
formation and mineralisation rates were restored.
Regarding the change in the preferred orientation of crystallites and the local
maximum that it exhibits at the pigmented bands, we note that underlying systematic
curvature of the tubules reflecting the continuous structural make-up of dentine or the
consequence of sectioning, might result in monotonic variation of orientation, but
would not lead to the appearance of local maxima. We interpret such localised
changes as consequence of a disruption in the normal dentinal growth and associated
with the haemolysis episode. Biliary pigments in blood are a likely cause of cellular
injury to odontoblasts and ameloblasts, affecting the rate of secretion and the
composition of the organic matrix. This, in turn, changes the rate of advance of the
tissue mineralisation front, resulting in alterated in crystal growth, packing and
orientation.
Our observations suggest an interesting explanation for the influence exerted by
haemolysis on hard mineralized tissues growth. Analysis of multiple samples would
be highly preferred, but was not possible due to the combination of extreme sample
scarcity ('green teeth' are rarely available for analysis: discolouration alone causes
only an aesthetic concern, and tooth extraction is not indicated) and limited
availability of facility beamtime. Although these considerations preclude
Page 12 of 23
http://mc.manuscriptcentral.com/jdr
Journal of Dental Research
123456789101112131415161718192021222324252627282930313233343536373839404142434445464748495051525354555657585960

For Peer Review
13
generalization, we feel nevertheless that the quantitative nature of our measurements
merits the presentation of the results as a hypothesis deserving further evaluation.
While no elemental composition changes were detected in dentine or enamel by
SEM or EDX analysis (Fig. 1b), X-ray diffraction, revealed morphological
differences at the (sub)nano-scale: particle orientation, size and lattice parameter
changes in the HAp crystallites.
The morphological information from enamel reveals a correlation between the
visible band and the underlying ultrastructural variation, even though there was no
detectable autofluorescence after laser excitation. We conclude that the enamel band
is not pigmented , but corresponds to changes in the enamel refraction index due to
the local variation of crystallite morphology.
The neonatal line, invariably present in deciduous teeth and first permanent molars,
represents mineralisation pattern changes associated with the physiological transition
from intra- to extra-uterine life. This event coincides with the possible interference of
odontogenesis by bilirubin because haemolysis in EF also occurs immediately after
birth. The appearance of green pigmented teeth, in this case, is therefore a
consequence of the pigment in dentine, perceived through the enamel translucency,
and not enamel pigmentation. Marsland and Gerrard (Marsland and Gerrard, 1953)
described a double neonatal line in some (but not all) of their EF tooth samples. Some
parts of the enamel in our sample showed this feature. However, these lines in ground
sections are again visible because of changes in the enamel refraction index; in reality
the 'lines' are finite 3-D layers of enamel, and oblique sectioning planes on a varying
thickness sections could create 'double line' effects when the layer forming the “line”
is thinner than the section (see Fig 1 of (Eli et al., 1989)). It has been suggested that if
bilirubin were temporarily deposited in the organic enamel matrix, it might be lost
Page 13 of 23
http://mc.manuscriptcentral.com/jdr
Journal of Dental Research
123456789101112131415161718192021222324252627282930313233343536373839404142434445464748495051525354555657585960

For Peer Review
14
during mineralisation and maturation. In dentine, the presence of structural changes
might be attributed to the larger proportion of retained organic content compared to
enamel (Marsland and Gerrard, 1953). This is also supported by the absence of auto-
fluorescence in the enamel.
5. Conclusions
The properties of distinct bands induced in dentine and enamel in EF were
investigated and correlated with ultrastructural variations in crystal lattice parameters,
size and orientation determined by WAXS, revealing quantitative changes associated
with EF at a level of detail not possible previously. Future investigations will concern
elucidating ultrastructural variations within neonatal lines in dentine and enamel and
the extent to which they affect tissues’ biomechanical properties.
Acknowledgement:
AMK acknowledges funding received for the MBLEM laboratory at Oxford
through EU FP7 project iSTRESS (604646). Diamond Light Source is acknowledged
for providing the beam time allocation under experiment number NT5038. The
authors have declared no conflict of interest.
References:
Arnold S, Plate U, Wiesmann HP, Stratmann U, Kohl H, Hohling HJ. 2001.
Quantitative analyses of the biomineralization of different hard tissues. J Microsc-
Oxford 202(Pt3):488-494.
Bevis DCA. 1956. Blood Pigments in Haemolytic Disease of the Newborn. J Obstet
Gynaecol 63(1):68-75.
Page 14 of 23
http://mc.manuscriptcentral.com/jdr
Journal of Dental Research
123456789101112131415161718192021222324252627282930313233343536373839404142434445464748495051525354555657585960

For Peer Review
15
Carrillo A, Rezende KMPEC, de Carrillo SR, Arana-Chavez VE, Bonecker M. 2011.
Hyperbilirubinemia and Intrinsic Pigmentation in Primary Teeth: A Case Report and
Histological Findings. Pediatr Devel Pathol 14(2):155-156.
Dumont M, Tutken T, Kostka A, Duarte MJ, Borodin S. 2014. Structural and
functional characterization of enamel pigmentation in shrews. J Struct Biol 186(1):38-
48.
Egan CK, Jacques SD, Di Michiel M, Cai B, Zandbergen MW, Lee PD, Beale AM,
Cernik RJ. 2013. Non-invasive imaging of the crystalline structure within a human
tooth. Acta Biomater 9(9):8337-8345.
Eli I, Sarnat H, Talmi E. 1989. Effect of the birth process on the neonatal line in
primary tooth enamel. Pediatr Dent 11(3):220-223.
Forrester RM, Miller J. 1955. The Dental Changes Associated with Kernikterus. Arch
Dis Child 30(151):224-231.
Hammersley AP. 1997. "FIT2D: An Introduction and Overview". ESRF Internal
Report.
Langmead F. 1912. Anomalous Jaundice, with Enlargement of Liver and Spleen, and
Bile-stained Teeth. Proc R Soc Med 5(Sect Study Dis Child):148-149.
Marsland EA, Gerrard JW. 1953. Intrinsic staining of teeth following icterus gravis.
Br Dent J 44(12):305-310.
Patterson A. 1939. The Scherrer Formula for X-ray particle size determination. Phys
Rev E Stat Nonlin Soft Matter Phys 56(10):978-982.
Pokroy B, Fitch AN, Marin F, Kapon M, Adir N, Zolotoyabko E. 2006. Anisotropic
lattice distortions in biogenic calcite induced by intra-crystalline organic molecules. J
Struct Biol 155(1):96-103.
Sui T, Sandholzer MA, Baimpas N, Dolbnya IP, Walmsley AD, Lumley PJ, Landini
G, Korsunsky AM. 2013. Multi-scale modelling and diffraction-based
characterization of elastic behaviour of human dentine. Acta Biomater 9(8):7937-
7947.
Sui T, Lunt AJ, Baimpas N, Sandholzer MA, Hu J, Dolbnya IP, Landini G,
Korsunsky AM. 2014a. Hierarchical modelling of in situ elastic deformation of
human enamel based on photoelastic and diffraction analysis of stresses and strains.
Acta Biomater 10(1):343-354.
Page 15 of 23
http://mc.manuscriptcentral.com/jdr
Journal of Dental Research
123456789101112131415161718192021222324252627282930313233343536373839404142434445464748495051525354555657585960

For Peer Review
16
Sui T, Sandholzer MA, Lunt AJG, Baimpas N, Smith A, Landini G, Korsunsky AM.
2014b. In situ X-ray scattering evaluation of heat-induced ultrastructural changes in
dental tissues and synthetic hydroxyapatite. J R Soc Interface 11(95).
Swann O, Powls A. 2012. Green Teeth in Neonatal Sepsis. New Engl J Med
367(6):E8-E8.
Thursfield H. 1912. Green Teeth, subsequent to a Prolonged Jaundice in the First
Weeks of Life. Proc R Soc Med 5(Sect Study Dis Child):147-148.
Williamson GK, Hall WH. 1953. X-Ray Line Broadening from Filed Aluminium and
Wolfram. Acta Metall Mater 1(1):22-31.
Page 16 of 23
http://mc.manuscriptcentral.com/jdr
Journal of Dental Research
123456789101112131415161718192021222324252627282930313233343536373839404142434445464748495051525354555657585960

For Peer Review
17
Figure caption
Fig.1 Basic characterization of green tooth samples. Sample preparation of the green
tooth (a) the region of interest (ROI); (b) the optical microscope image of ROI, where
the pigmented lines in dentine and a distinct line in enamel are obvious; (c) Back-
scattered electron image (BSE) of ROI, with no visible difference compared to (b); (d)
“X-ray Eye” image of ROI, used to identify the line scan for X-ray diffraction; (e) the
optical microscopy image of the line in dentine; (f) fluorescence of the line in dentine
revealed by confocal microscopy of the same region as shown in (e) .
Fig. 2 (a) Micro- (Nano-) focus Experiment set-up in B16 beamline, Diamond Light
Source. KB mirrors were used to focus the incident X-ray beam. Sample was mounted
on the sample stage between the KB mirrors and WAXS detector at the focus point,
which was highlighted in the red oval. WAXS data interpretation from (b) A
representative enamel 2-D WAXS pattern to 1-D profile by (c) azimuthal and (d)
radial integration of (002) peak (Gaussian fit indicated in red, background shown in
green)
Fig.3 EDX analysis of ROI. (a) The SEM image of ROI; (b)-(e) respective element
mapping of Ca, P, O and Fe in ROI; (f) the energy spectrum covering all element
lines, together with the table showing the mass percent and number density of
different elements.
Fig. 4 (a) (002) scattering angle peak centre (blue) and (002) peak width (black) plot
from enamel to dentine across the DEJ; Differentiation (blue) of (b) peak width
(black) and (c) peak centre (black) superimposed with the original curve; Gaussian
peak fitting curves (red) for peak width and peak centre are also shown in (b) and (c)
to determine the FWHM.
Fig. 5 Correlations between structural parameter variations in the pigmented tooth
section for enamel (-489 to -64µm from DEJ, left column) and dentine (61-311µm
from DEJ, right column): (a) and (b) peak centre (red); (c) and (d) preferred
orientation (light blue), and (e) and (f) particle size (black). The background contains
Page 17 of 23
http://mc.manuscriptcentral.com/jdr
Journal of Dental Research
123456789101112131415161718192021222324252627282930313233343536373839404142434445464748495051525354555657585960
For Peer Review
18
magnified optical images of the enamel and dentine microstructure, and the yellow
line denotes the position of the X-ray scan. (The standard deviation is about 4 orders
of magnitude lower than the fitted value, e.g. the d-spacing of the peak centre fit is
given by 3.477±1.14E-05 and therefore scatter bars are not included in the plots).
Page 18 of 23
http://mc.manuscriptcentral.com/jdr
Journal of Dental Research
123456789101112131415161718192021222324252627282930313233343536373839404142434445464748495051525354555657585960
For Peer Review
Fig.1 Basic characterization of green tooth samples. Sample preparation of the green tooth (a) the region of interest (ROI); (b) the optical microscope image of ROI, where the pigmented lines in dentine and a distinct
line in enamel are obvious; (c) Back-scattered electron image (BSE) of ROI, with no visible difference
compared to (b); (d) “X-ray Eye” image of ROI, used to identify the line scan for X-ray diffraction; (e) the optical microscopy image of the line in dentine; (f) fluorescence of the line in dentine revealed by confocal
microscopy of the same region as shown in (e) . 119x181mm (300 x 300 DPI)
Page 19 of 23
http://mc.manuscriptcentral.com/jdr
Journal of Dental Research
123456789101112131415161718192021222324252627282930313233343536373839404142434445464748495051525354555657585960
For Peer Review
Fig. 2 (a) Micro- (Nano-) focus Experiment set-up in B16 beamline, Diamond Light Source. KB mirrors were used to focus the incident X-ray beam. Sample was mounted on the sample stage between the KB mirrors and WAXS detector at the focus point, which was highlighted in the red oval. WAXS data interpretation from (b) A representative enamel 2-D WAXS pattern to 1-D profile by (c) azimuthal and (d) radial integration of
(002) peak (Gaussian fit indicated in red, background shown in green) 119x101mm (300 x 300 DPI)
Page 20 of 23
http://mc.manuscriptcentral.com/jdr
Journal of Dental Research
123456789101112131415161718192021222324252627282930313233343536373839404142434445464748495051525354555657585960

For Peer Review
EDX analysis of ROI. (a) The SEM image of ROI; (b)-(e) respective element mapping of Ca, P, O and Fe in ROI; (f) the energy spectrum covering all element lines, together with the table showing the mass percent
and number density of different elements. 119x127mm (300 x 300 DPI)
Page 21 of 23
http://mc.manuscriptcentral.com/jdr
Journal of Dental Research
123456789101112131415161718192021222324252627282930313233343536373839404142434445464748495051525354555657585960

For Peer Review
(a) (002) scattering angle peak centre (blue) and (002) peak width (black) plot from enamel to dentine across the DEJ; Differentiation (blue) of (b) peak width (black) and (c) peak centre (black) superimposed
with the original curve; Gaussian peak fitting curves (red) for peak width and peak centre are also shown in (b) and (c) to determine the FWHM.
119x93mm (300 x 300 DPI)
Page 22 of 23
http://mc.manuscriptcentral.com/jdr
Journal of Dental Research
123456789101112131415161718192021222324252627282930313233343536373839404142434445464748495051525354555657585960
For Peer Review
Correlations between structural parameter variations in the pigmented tooth section for enamel (-489 to -64µm from DEJ, left column) and dentine (61-311µm from DEJ, right column): (a) and (b) peak centre
(red); (c) and (d) preferred orientation (light blue), and (e) and (f) particle size (black). The background contains magnified optical images of the enamel and dentine microstructure, and the yellow line denotes the
position of the X-ray scan. (The standard deviation is about 4 orders of magnitude lower than the fitted value, e.g. the d-spacing of the peak centre fit is given by 3.477±1.14E-05 and therefore scatter bars are
not included in the plots). 99x114mm (300 x 300 DPI)
Page 23 of 23
http://mc.manuscriptcentral.com/jdr
Journal of Dental Research
123456789101112131415161718192021222324252627282930313233343536373839404142434445464748495051525354555657585960