x-ray absorption spectroscopy in coordination...
TRANSCRIPT

Coordination Chemistry Reviews190–192 (1999) 1101–1123
X-ray absorption spectroscopy in coordinationchemistry
James E. Penner-Hahn a,b,*a Section de Bioenergetique, CNRS URA 2096, DBCM, CEA Saclay,
F-91191 Gif-sur-Y6ette Cedex, Franceb Department of Chemistry, The Uni6ersity of Michigan, 930 N. Uni6ersity A6enue, Ann Arbor,
MI 48109-1055, USA
Contents
Abstract. . . . . . . . . . . . . . . . . . . . . . . . . . . . . . . . . . . . . . . . . . . . . . . . . . . . 11021. Introduction. . . . . . . . . . . . . . . . . . . . . . . . . . . . . . . . . . . . . . . . . . . . . . . . 11022. The physical basis of X-ray absorption . . . . . . . . . . . . . . . . . . . . . . . . . . . . . . . . 1103
2.1 EXAFS oscillations . . . . . . . . . . . . . . . . . . . . . . . . . . . . . . . . . . . . . . . . 11042.2 Fourier transformation . . . . . . . . . . . . . . . . . . . . . . . . . . . . . . . . . . . . . . 11062.3 Curve fitting . . . . . . . . . . . . . . . . . . . . . . . . . . . . . . . . . . . . . . . . . . . . 11062.4 XANES structure . . . . . . . . . . . . . . . . . . . . . . . . . . . . . . . . . . . . . . . . . 11062.5 Advantages of XAS . . . . . . . . . . . . . . . . . . . . . . . . . . . . . . . . . . . . . . . . 11082.6 Limitations of XAS . . . . . . . . . . . . . . . . . . . . . . . . . . . . . . . . . . . . . . . . 11092.7 Information content of EXAFS spectra. . . . . . . . . . . . . . . . . . . . . . . . . . . . . 11092.8 Multiple scattering . . . . . . . . . . . . . . . . . . . . . . . . . . . . . . . . . . . . . . . . . 1111
3. Applications. . . . . . . . . . . . . . . . . . . . . . . . . . . . . . . . . . . . . . . . . . . . . . . . 11133.1 Does a structure remain intact in solution? . . . . . . . . . . . . . . . . . . . . . . . . . . 11143.2 What is the structure in solution (de novo determination)? . . . . . . . . . . . . . . . . . 11153.3 What is the structure in the crystal (use of XAS to resolve crystallographic disorder)? . 11183.4 How does the structure evolve with time? . . . . . . . . . . . . . . . . . . . . . . . . . . . 11193.5 What is the electronic structure of the metal? . . . . . . . . . . . . . . . . . . . . . . . . . 1120
4. Prospects for the future . . . . . . . . . . . . . . . . . . . . . . . . . . . . . . . . . . . . . . . . . 1122Acknowledgements . . . . . . . . . . . . . . . . . . . . . . . . . . . . . . . . . . . . . . . . . . . . . 1122References . . . . . . . . . . . . . . . . . . . . . . . . . . . . . . . . . . . . . . . . . . . . . . . . . . 1122
www.elsevier.com/locate/ccr
* Correspondence address: Department of Chemistry, The University of Michigan. Fax: +1-734-647-4865.
E-mail address: [email protected] (J.E. Penner-Hahn)
0010-8545/99/$ - see front matter © 1999 Elsevier Science S.A. All rights reserved.PII: S0010 -8545 (99 )00160 -5

1102 J.E. Penner-Hahn / Coordination Chemistry Re6iews 190–192 (1999) 1101–1123
Abstract
X-ray absorption spectroscopy (XAS) is one of the premier tools for investigating the localstructural environment of metal ions. XAS can be divided into X-ray absorption near edgestructure (XANES), which provides information primarily about geometry and oxidationstate, and extended X-ray absorption fine structure (EXAFS) which provides informationabout metal site ligation. One of the key attractions of XAS is that it can be used regardlessof the physical form of the sample, and in particular it can be used to study non-crystallinematerials. Consequently, XAS has come to be widely utilized by the biochemistry andmaterials science communities. Recently, however, it has become clear that there arenumerous questions of interest to coordination chemists that can be addressed using XAS. Inthis contribution, the physical basis of XAS is reviewed, the advantages and limitations ofthe technique are discussed, and several examples of the applications of XAS to coordinationchemistry are presented. The prospects for future applications of XAS are summarized.© 1999 Elsevier Science S.A. All rights reserved.
Keywords: X-ray absorption spectroscopy; Coordination chemistry; Structural environment
1. Introduction
Structural characterization of metal complexes has played a crucial role in thedevelopment of coordination chemistry. Despite the tremendous advances that havetaken place in spectroscopic methods for structure elucidation, X-ray crystallogra-phy remains the method of choice for definitive determination of the structure of anew coordination complex.
Unfortunately, X-ray crystallography cannot always be used. Some samplessimply cannot be crystallized in diffraction quality crystals, despite the best effortsof skilled experimenters. In other cases, crystals may be available but the structuralquestions of interest involve solution structure. For example, it may be necessary todetermine whether a molecule remains structurally intact in solution. Finally, thereare a variety of situations, involving for example crystallographic disorder, in whichX-ray crystallography is unable to provide a complete structural description. In allof these cases, X-ray absorption spectroscopy (XAS) can provide unique structuralinformation.
XAS has been known for most of this century, and has been available as a usefulstructural probe for over 25 years. Much of the interest in XAS, however, hasfocused on its applications to biological systems and to amorphous materials [1–5].These were natural areas for early developments of XAS, since in both areas,almost all of the samples of interest are non-crystalline. In this context, anystructural information is valuable.
In contrast, XAS has found fewer applications in coordination chemistry,perhaps because X-ray crystallography is such a powerful tool for the structuralcharacterization of coordination complexes. The goal of this tutorial article is toreview the physical principles of XAS and to illustrate through selected examples

1103J.E. Penner-Hahn / Coordination Chemistry Re6iews 190–192 (1999) 1101–1123
why XAS should be thought of as a key tool in the toolkit of the coordinationchemist. A variety of excellent reviews of X-ray absorption have been written, ashave several monographs. It is not the intent of this review to repeat thisinformation; the interested reader should consult one of these sources for a moredetailed description of X-ray absorption [1–8]. Rather, it is the intent of this reviewto provide sufficient background information that the potential of X-ray absorptionfor solving problems in coordination chemistry will be clear.
2. The physical basis of X-ray absorption
X-ray energies are sufficiently high to eject, via the photoelectric effect, one ormore core electrons from an atom. Each core electron has a well-defined bindingenergy, and when the energy of the incident X-ray is scanned across one of theseenergies, there is an abrupt increase in the absorption coefficient. This is theso-called ‘absorption edge’ of the element. Absorption edges are named accordingto the electron that is excited (K=1s; LI=2s; LII, LIII=2p, etc.). There are two Ledges for the 2p initial state due to spin-orbit coupling, which splits the 2p1/2 and2p3/2 final states.
The importance of XAS derives from the fact that there is fine structuresuperimposed on the absorption edge. This fine structure is often divided intoextended X-ray absorption fine structure (EXAFS), referring to structure wellabove the absorption edge, and X-ray absorption near edge structure (XANES), forstructure in the immediate vicinity of the edge (see Fig. 1). The physical basis ofboth EXAFS and XANES is the scattering of the X-ray excited photoelectron by
Fig. 1. Schematic illustration of an X-ray absorption spectrum at the Mn K edge. The insets show theinterference phenomena that give rise to the modulations in absorption cross-section (see text). In theinset, A and S refer to the absorbing and scattering atoms, respectively. The concentric circles aroundA and S represent the maxima in the photoelectron wave that describes the propagation of the X-rayexcited photoelectron. The 1s�3d transition is the very small peak at ca. 6550 eV, before the risingedge.

1104 J.E. Penner-Hahn / Coordination Chemistry Re6iews 190–192 (1999) 1101–1123
Fig. 2. Schematic illustration of the information content of an EXAFS spectrum. Qualitatively, theavailable information is the amplitude, the frequency, and the phase of the EXAFS oscillations. To afirst approximation, amplitude is proportional to coordination number, while frequency is inverselyrelated to bond length (i.e. for longer distances, there are more ways to have constructive or destructiveinterference). The phase of the EXAFS and the shape of the amplitude envelope provide informationabout scatterer type.
the surrounding atoms, and thus, the distinction between the regions is some-what arbitrary. The acronym XAFS (X-ray absorption fine structure) has gainedsome currency as a reference to the entire structured absorption region(XANES+EXAFS).
2.1. EXAFS oscillations
The photoexcitation cross-section is modulated by the interference between theout-going and the back-scattered photoelectron waves. This is illustrated sche-matically in the insets to Fig. 1. As the X-ray energy increases, the kineticenergy of the photoelectron (i.e. the excess energy above the binding threshold)increases. This results in a decreasing photoelectron wavelength, and thus, inalternating destructive interference (energy E1 in Fig. 1) and constructive interfer-ence (energy E2 in Fig. 1). The physical origin of EXAFS is thus electronscattering, and EXAFS is best thought of as a spectroscopically-detected scatter-ing method, rather than as a more conventional spectroscopy.
For a single absorber–scatterer pair (e.g. for a diatomic gas) this alternatinginterference will give rise to sinusoidal oscillations in the absorption coefficient ifthe energy is given in units proportional to the inverse photoelectron wavelength(the photoelectron wavevector, or k, defined as in Eq. (1)). In Eq. (1), thethreshold energy, Eo, is the binding energy of the photoelectron.
k=2me(E−Eo)/'2 (1)
In XAS analyses, it is typical to define the EXAFS, x(k), as the fractionalmodulation in the X-ray absorption coefficient. The observed oscillations then

1105J.E. Penner-Hahn / Coordination Chemistry Re6iews 190–192 (1999) 1101–1123
have an appearance similar to that shown in Fig. 2, and can then be described byan equation similar to Eq. (2).
x(k)=%s
NsAs(k)S02
kRas2 exp(−2Ras/l(k))exp(−2k2sas
2 )·sin(2kRas+fas(k)) (2)
In Eq. (2), the parameters that are of principal interest to the coordination chemistare the number of scattering atoms, Ns and the absorber–scatterer distance, Ras. Toa first approximation, these can be related to the depth of modulation (i.e. theEXAFS amplitude) and the frequency of the modulations, respectively, as shown inFig. 2. There are, however, a variety of other parameters that must either bedetermined or be defined in order to extract the chemically relevant information.Chief among these are As(k) and fas(k). These represent, respectively, the energydependence of the photoelectron scattering, and the phase shift that the photoelec-tron wave undergoes when passing through the potential of the absorbing andscattering atoms. These amplitude and phase parameters contain the informationnecessary to identify the scattering atom. Thus, for example, sulfur and oxygenintroduce phase shifts, fas(k), that differ by approximately p. Unfortunately, bothAs(k) and fas(k) depend only weakly on scatterer identity, and thus, it is difficultto identify the scatterer with precision. For the coordination chemist, this typicallymeans that O and N, or S and Cl cannot be distinguished, while O and S can. Ofcourse, scatterers such as C and F also cannot be distinguished. However, inpractice this ambiguity seldom causes problems, since the chemical identity of thesample is (presumably) known.
The EXAFS amplitude falls off as 1/R2. This reflects the decrease in photoelec-tron amplitude per unit area as one moves further from the photoelectron source(i.e. the absorbing atom). The main consequence of this damping is that theEXAFS information is limited to atoms in the near vicinity, typically within 10 A,of the absorber. There are three additional damping terms in Eq. (2). The S0
2 termis introduced to allow for inelastic loss processes and is typically not refined inEXAFS analyses. The first exponential term is a damping factor that arises fromthe mean free path of the photoelectron (l(k)). This serves to limit further thedistance range that can be sampled by EXAFS. The second exponential term is theso-called ‘Debye–Waller’ factor. This damping reflects the fact that if there is morethan one absorber–scatterer distance, each distance will contribute EXAFS oscilla-tions of a slightly different frequency. The destructive interference between thesedifferent frequencies leads to damping in the EXAFS amplitude. The Debye–Waller factor, sas, is the root-mean-square deviation in absorber–scatterer distance.This damping is always present due to zero-point thermal motion, and may, forpolyatomic systems, also occur as a consequence of structural disorder.
The summation in Eq. (2) reflects the fact that all absorber–scatterer pairscontribute to the observed oscillations. In practice, however, it is not realistic torefine all of the different absorber–scatterer interactions. Consequently it is neces-sary to group absorber–scatterer interactions into ‘shells’. A shell is a group ofsimilar scatterers at approximately the same distance from the absorber.

1106 J.E. Penner-Hahn / Coordination Chemistry Re6iews 190–192 (1999) 1101–1123
2.2. Fourier transformation
Although Eq. (2) provides a complete description of the EXAFS oscillations, itis not a particularly convenient form for visualizing the information content of anEXAFS spectrum. As with NMR spectroscopy, Fourier transformation can be usedto decompose a frequency-space signal into its different constituent frequencies.This is illustrated for a CuCN solution in Fig. 3. For EXAFS, the canonicalvariables are k (in A, −1) and R (in A, ), and the Fourier transform (FT) of anEXAFS spectrum gives a pseudo-radial distribution function. It is pseudo in thatthe FT amplitude cannot be related directly to electron density around the absorberdue to the As(k) factor and the damping factors in Eq. (2), and because theapparent distances in the FT are shifted by about −0.5 A, due to the phase shiftfas(k). The FT is a useful way of judging qualitatively what shells may be presentin a system and for comparing a fit to the data. However, it is important toremember that Fourier transforms are subject to several potential artefacts. Inmany cases, multiple shells of scatterers do not give rise to multiple peaks in the FT[8]. Similarly, interference between two different peaks in the FT may give rise toa spurious third peak. The latter results from the fact that the FT of an EXAFSspectrum is actually a complex number, with both real and imaginary components.Typically, however, only the modulus of the FT is plotted. This is useful forvisualizing the major contributions to the EXAFS spectrum, but should never beused for quantitative data analysis.
2.3. Cur6e fitting
Quantitative analysis of EXAFS spectra typically involves using an equationsimilar to Eq. (2) to model the observed oscillations. The fitting can be done eitherin k space or in R (Fourier transform) space, with essentially equivalent results. Theparameters that define the scattering (As(k), S0
2, fas(k), and l(k)) are determinedeither from ab initio calculations or from model compounds of known structure. Inrecent years, the available theoretical methods for quickly and accurately calculat-ing these parameters have improved dramatically. Ab initio calculations are nowrelatively straightforward [9–11], although careful comparison with model com-pounds remains important for proper calibration of the calculated parameters [12].Once these parameters have been specified, the structurally related parameters (Ns,sas(k), and Ras) are refined, usually via a non-linear least-squares fitting procedure.
2.4. XANES structure
The physical principles that govern EXAFS apply equally in the XANES region.However, at low kinetic energy the photoelectron mean-free-path increases dramat-ically. Similarly, the exp(−k2) dependence of the Debye–Waller factor means thatthis damping factor is negligible in the XANES region. These effects combine torender the XANES region sensitive to a wide range of absorber–scatterer distances,as compared to the (relatively) simple short-range treatment that can be used for
1107J.E. Penner-Hahn / Coordination Chemistry Re6iews 190–192 (1999) 1101–1123
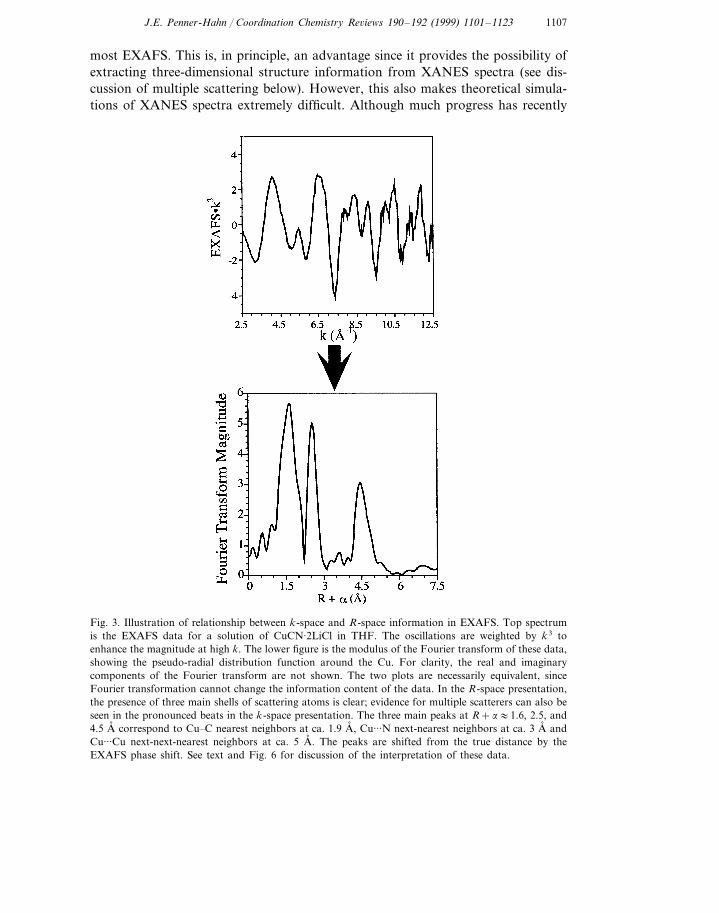
most EXAFS. This is, in principle, an advantage since it provides the possibility ofextracting three-dimensional structure information from XANES spectra (see dis-cussion of multiple scattering below). However, this also makes theoretical simula-tions of XANES spectra extremely difficult. Although much progress has recently
Fig. 3. Illustration of relationship between k-space and R-space information in EXAFS. Top spectrumis the EXAFS data for a solution of CuCN·2LiCl in THF. The oscillations are weighted by k3 toenhance the magnitude at high k. The lower figure is the modulus of the Fourier transform of these data,showing the pseudo-radial distribution function around the Cu. For clarity, the real and imaginarycomponents of the Fourier transform are not shown. The two plots are necessarily equivalent, sinceFourier transformation cannot change the information content of the data. In the R-space presentation,the presence of three main shells of scattering atoms is clear; evidence for multiple scatterers can also beseen in the pronounced beats in the k-space presentation. The three main peaks at R+a:1.6, 2.5, and4.5 A, correspond to Cu�C nearest neighbors at ca. 1.9 A, , Cu···N next-nearest neighbors at ca. 3 A, andCu···Cu next-next-nearest neighbors at ca. 5 A, . The peaks are shifted from the true distance by theEXAFS phase shift. See text and Fig. 6 for discussion of the interpretation of these data.
1108 J.E. Penner-Hahn / Coordination Chemistry Re6iews 190–192 (1999) 1101–1123
been made in the theoretical modeling of XANES, most of the applications of thisenergy region remain qualitative. Nevertheless, the ability to make fingerprint-likecomparisons of XANES spectra can be important in identifying an unknownstructure.
On the low energy side of the absorption edge one frequently observes severalweak transitions. In contrast with the electron-scattering model that is used todescribe the EXAFS and the other XANES features, these low energy transitionsarise from bound state transitions. For the first transition series metals, bound statetransitions include both 1s�3d and 1s�4p transitions. An exciting recent develop-ment in XAS has been the development of theoretical models that can use thebound-state transitions to extract information about the electronic structure of theabsorbing atom (see below).
2.5. Ad6antages of XAS
The principal advantage of XAS as a structural probe is that it is a local structureprobe. None of the discussion above requires the presence of long-range order. Thismeans that XAS can be used to study non-crystalline samples or to comparesolution structure with solid state structure. In ideal circumstances (see below forsome of the limitations), EXAFS data can be analyzed to determine the absorber–scatterer distance with an accuracy of ca. 0.02 A, and a precision that is substan-tially better (0.004 A, [13], and perhaps even better under carefully controlledconditions). Coordination numbers can be determined with an accuracy of ca. 25%and scatterer identity can typically be defined to the nearest row of the periodictable.
In comparison with small molecule crystallography, the information availablefrom XAS is relatively limited. However, for non-crystalline systems, XAS mayprovide the only available structural information. Even for crystalline systems,there are cases in which EXAFS can provide a different, and perhaps better,structural description than is available from crystallography. Several examples ofthis are discussed below. Finally, XAS has, through XANES transitions, the abilityto provide oxidation state and spin-state information that can be difficult orimpossible to extract from crystallographic measurements.
In comparison with other spectroscopic methods, XAS has the decided advantagethat it is always detectable, without the need for specific spin states or isotopicsubstitution, and that it is element specific. Every element has at least one uniqueabsorption edge, although for the very light elements, this edge energy may actuallybe in the UV, not in the X-ray region. For elements heavier than about phospho-rous, measurement of the X-ray absorption spectrum is relatively straightforwardusing modern synchrotron X-ray sources, and even the lighter elements are studiedfrequently. The universal detectability of XAS is, of course, a mixed blessing sinceit means that XAS is a bulk technique sensitive to all of the forms of an elementthat are present in a sample. If the element of interest occurs in multiple environ-ments only the average structure can be determined.

1109J.E. Penner-Hahn / Coordination Chemistry Re6iews 190–192 (1999) 1101–1123
2.6. Limitations of XAS
Any discussion of the advantages of XAS would be incomplete without asummary of the limitations of the technique. Ultimately, all of these involvedifferent limitations in experimental resolution. Several of these are widely recog-nized. As noted above, EXAFS provides only limited chemical resolution—scatter-ing atoms that differ by two or three in atomic number (e.g. C, O, N, and F)typically cannot be resolved. EXAFS, at least as described thus far, provides noangular resolution. It is thus not possible to learn anything directly about geometry.There are some possibilities for introducing angular resolution (see below) but thisremains a limitation in most XAS studies. Finally, the finite k range of the EXAFSspectrum limits the bond-length resolution of the method. Two scattering shells canonly be resolved if they differ sufficiently in frequency to cause a detectable changein the EXAFS amplitude, due to the interference between the two different EXAFScomponents. For small differences in distance, the interference simply introduces anexponential damping factor. This is indistinguishable from an increase in theDebye–Waller term in Eq. (2). For perfect data, two shells of the same scatterershould become resolvable when the difference in their distances, dR, is large enoughto cause a ‘beat’ in the EXAFS amplitude. This occurs for
dR]p/2kmax (3)
where kmax is the maximum value of k for which a signal can be measured. Typicalvalues of kmax range from 12 to 20 A, −1, depending on the composition and theconcentration of the sample, giving dR:0.08–0.13 A, . In reality, Eq. (3) gives asomewhat optimistic estimate of the minimum resolvable distance, since it assumesnoise free data at kmax. In practice, kmax is often defined as the point at which thenoise level of the data becomes too large to permit reliable analysis. This isillustrated, for example, in Fig. 4 of Ref. [8].
2.7. Information content of EXAFS spectra
There is one additional limitation to EXAFS that is not as widely appreciated.Like all spectra, EXAFS spectra contain only a finite amount of information. In thecase of EXAFS this information content is easily quantified. If dR in Eq. (3) givesthe minimum separation that can be detected, and if the useful data covers an Rrange of DR, then the number of independent data points is given simply byDR/dR. Since the useful k range does not extend to k=0 A, −1, a better expressionfor the number of independent data points, Nidp, is
Nidp=2Dk DR/p (4)
Using Eq. (4) with typical values of DR=2 A, (e.g. useful information for R=1–3A, ) and Dk=12 A, −1 (k=2–14 A, −1), there are approximately 16 degrees offreedom in a typical data set. More involved derivations give slightly different Nidp
values [14], but do not alter the essential result that the number of available degreesof freedom is severely limited. If one used crystallographic criteria that the
1110 J.E. Penner-Hahn / Coordination Chemistry Re6iews 190–192 (1999) 1101–1123
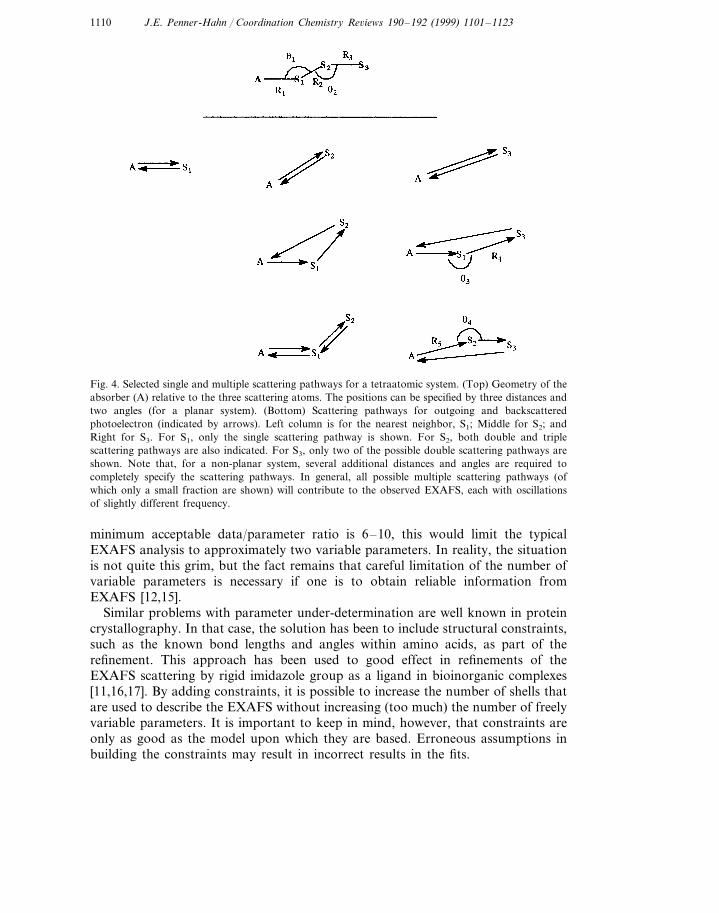
Fig. 4. Selected single and multiple scattering pathways for a tetraatomic system. (Top) Geometry of theabsorber (A) relative to the three scattering atoms. The positions can be specified by three distances andtwo angles (for a planar system). (Bottom) Scattering pathways for outgoing and backscatteredphotoelectron (indicated by arrows). Left column is for the nearest neighbor, S1; Middle for S2; andRight for S3. For S1, only the single scattering pathway is shown. For S2, both double and triplescattering pathways are also indicated. For S3, only two of the possible double scattering pathways areshown. Note that, for a non-planar system, several additional distances and angles are required tocompletely specify the scattering pathways. In general, all possible multiple scattering pathways (ofwhich only a small fraction are shown) will contribute to the observed EXAFS, each with oscillationsof slightly different frequency.
minimum acceptable data/parameter ratio is 6–10, this would limit the typicalEXAFS analysis to approximately two variable parameters. In reality, the situationis not quite this grim, but the fact remains that careful limitation of the number ofvariable parameters is necessary if one is to obtain reliable information fromEXAFS [12,15].
Similar problems with parameter under-determination are well known in proteincrystallography. In that case, the solution has been to include structural constraints,such as the known bond lengths and angles within amino acids, as part of therefinement. This approach has been used to good effect in refinements of theEXAFS scattering by rigid imidazole group as a ligand in bioinorganic complexes[11,16,17]. By adding constraints, it is possible to increase the number of shells thatare used to describe the EXAFS without increasing (too much) the number of freelyvariable parameters. It is important to keep in mind, however, that constraints areonly as good as the model upon which they are based. Erroneous assumptions inbuilding the constraints may result in incorrect results in the fits.
1111J.E. Penner-Hahn / Coordination Chemistry Re6iews 190–192 (1999) 1101–1123
For seriously under-determined systems, even constrained refinements may give adata:parameter ratio that is not much larger than 1 (or even smaller than 1 in someinstances). In such cases, it is better to think of the EXAFS simulation (Eq. (2)) asshowing that a particular structural model is consistent with the data, rather thanshowing that it is required by the data. Although genuine curve fitting and datasimulation are both legitimate approaches to interpreting EXAFS spectra, it isimportant to remember that they do not provide the same information. Curvefitting, when done properly, describes the structural parameters that are required bythe data. In contrast, a successful simulation gives only a model of the data, notnecessarily the correct model.
It is important to note that Eq. (4) is a general property of EXAFS, and is nota specific consequence of Fourier filtering. Some authors have concluded that DR iseffectively unlimited, or limited only by l, so long as the data are not filtered. Thisis analogous to assuming that the information content of an NMR experiment canbe doubled by sampling the FID at twice the frequency. The latter would only betrue if the width (chemical shift range) of the NMR spectrum was such that theFID was under-sampled. In the case of EXAFS, DR (and thus the informationcontent) is defined by the range of R space over which there is chemically usefulinformation.
An analogous error is to confuse the number of measured data points, Np, withthe number of independent data points, Nidp in Eq. (4). A widely quoted statisticaltest uses Np to calculate a x2 statistic which can be used with the F-test todetermine whether an added shell is significant [18]. Since Np is typically 10–15times larger than Nidp (i.e. EXAFS data are typically over-sampled by a factor of10–15), the use of Np rather than Nidp in the F-test dramatically overestimates thesignificance of an added shell.
Statistical tests, with the correct Nidp, can be used to judge whether an addedshell is required by the data [19,20]. However, several authors have noted [12,15]the need to exercise caution with these tests in order to avoid either false positives(inclusion of shells that are not actually present) or false negatives (exclusion ofshells that are present).
There are several possibilities for obtaining additional information from XAS,thereby avoiding some of the limitations discussed in the preceding paragraphs.Perhaps the most important of these is the possibility of using multiple scattering toobtain information about the geometry of an absorbing atom.
2.8. Multiple scattering
In the physical model presented above, the X-ray excited photoelectron travelsfrom the absorbing atom to the scattering atom and back. However, far morecomplex scattering pathways are also possible. For example (see Fig. 4), thephotoelectron may travel from the first scattering atom (S1) to a second (S2) andeven a third (S3) before returning to the absorbing atom. Each scattering interactiondefines an angle, e.g. u1 in Fig. 4, that determines the intensity, and hence thesignificance, of that multiple-scattering pathway. The scattering of an electron by

1112 J.E. Penner-Hahn / Coordination Chemistry Re6iews 190–192 (1999) 1101–1123
an atom is strongly focused in the forward direction (u:180°) and falls off veryrapidly for u�150°.
Multiple scattering depends on the simultaneous positions of three or moreatoms, i.e. on the distances and angles between the atoms. This means that multiplescattering can, at least in principle, provide information about the three-dimen-sional structure around the absorbing site. For this reason, there has been a greatdeal of interest in developing methods to use multiple scattering in XAS analyses,and thus to avoid the limitation that EXAFS provides only radial structureinformation.
Unfortunately, the situation is not quite so promising as the previous paragraphsmight suggest. Two obstacles confront attempts to use multiple-scattering todetermine molecular geometry. The first is computational: since hundreds, and eventhousands of multiple scattering pathways can contribute to the observed XAS, thetheoretical description of multiple scattering can be computationally formidable.This makes it difficult to perform effective refinements of complete multiplescattering. However, this has become a less important issue as multiple-scatteringprograms have improved and as computational power has increased.
A more fundamental problem is the limited information content of XAS spectra(e.g. Eq. (4)). Multiple scattering is most important for outer-shell atoms beyondthe first coordination sphere. In Eq. (4), the information content of XAS increaseslinearly as the R range of the data increases. Unfortunately, the number of possiblescattering atoms increases approximately as R2. It is thus apparent that at somepoint, the increase in information content is overwhelmed by the increase invariable parameters. This is illustrated schematically in Fig. 5. For an idealized,high symmetry system (A in Fig. 5), only three parameters are needed to completelydescribe the structure. In such a situation, it is quite feasible to analyze EXAFSdata measured over any reasonable k range to determine the geometry (in this case,the angle of the coordinated cyanide). In a lower symmetry, but perhaps morerealistic model (B in Fig. 5), the situation is much more complicated. The nearestneighbor M�N and M�O interactions may require as many as four distances for acomplete description, although only one (R1) is shown in Fig. 5. Depending on thestructure, it may be appropriate to group these nearest neighbor distance into oneor two average shells, each defined by a distance and a Debye–Waller factor;however, this still represents an increase in comparison to the one nearest-neighborparameter required in A. The description of the second shell is even morecomplicated. The carboxylate carbon alone may require as many as four additionalparameters (R2, R3, u1, and u2 in Fig. 5). A complete description of the multiplescattering for the second shell scattering for this hypothetical molecule couldrequire as many as ten additional parameters, beyond the four used to describe thefirst shell.
Due to this mismatch between available information and required parameters itis usually necessary to simplify the geometry used to model a site (for example, toassume high symmetry). Providing these approximations are valid, multiple scatter-

1113J.E. Penner-Hahn / Coordination Chemistry Re6iews 190–192 (1999) 1101–1123
ing can be used to provide detailed information about a metal site. An example ofthis is described below. However, it is important to keep in mind the possibility thatthe simplifying assumptions may not be valid, and may, as a consequence,introduce significant errors into the refined structural parameters.
3. Applications
Notwithstanding the dire warnings (above) regarding the limitations of XAS, thefact remains that XAS has the ability to provide unique information aboutcoordination compounds. In the following, several examples of the application ofXAS to coordination chemistry are discussed. There is no attempt to provide acomprehensive summary of all of the published applications. Rather, these areselected examples chosen to illustrate how XAS can be used to answer differentclasses of questions in coordination chemistry.
Fig. 5. (Top) Schematic illustration of the approximate relationship between information available andinformation required for analysis of data as a function of R range. (Bottom) Specific examplesillustrating the graph above. A is a high symmetry molecule; B is a lower symmetry, but perhaps morerealistic site. For A, detailed analysis of the multiple scattering is clearly possible; for B, the number ofvariables required for a complete analysis of the multiple scattering is likely to exceed the availableinformation unless constraints of some kind can be introduced.

1114 J.E. Penner-Hahn / Coordination Chemistry Re6iews 190–192 (1999) 1101–1123
Fig. 6. Schematic illustration of the Ga 12-metallacrown-4 cryptate structure. Only the core atoms of thetwo metallacrown rings are shown. The EXAFS detectable 3.54 A, inter-ring Ga�Ga distance and theEXAFS non-detectable 4.64 A, intra-ring Ga�Ga distance are shown by the arrows.
3.1. Does a structure remain intact in solution?
Although X-ray crystallography is extremely powerful as a structural probe, itprovides only a description of the structure in the solid state. In contrast, mostchemical reactions take place in solution. If structure is to be used to understandreactivity, it is essential to confirm that the crystallographic structure accuratelyrepresents the molecule of interest when it is in solution. This is particularlyimportant for multinuclear aggregates, which might be expected to dissociate intosmaller units when dissolved. In such cases, XAS can be used as a fingerprint forcomparing between solid state and solution structures. One example of such anapplication involves the solution structure of a Ga metallacrown complex synthe-sized by Pecoraro and co-workers [21]. Salicylhydroximate and Ga combine to formthe inorganic analog of a 12-crown-4 crown ether, and the crystal structure of thesodium salt of this metallacrown showed clearly that it self-assembles with hydrox-ide to form an inorganic analog of a cryptate (shown schematically in Fig. 6). Itwas not clear, however, that this structure remained intact in solution. In this case,EXAFS was able to provide unambiguous evidence that the 3.54 A, Ga�Gainteractions between Ga ions in different rings remain intact in solution. This isdiagnostic of the intact cryptate structure.
There are, of course, many other techniques that can be used to compare solidstate and solution structure. These include Mossbauer, EPR, NMR, FTIR, andUV–vis spectroscopy. All of these, together with EXAFS, are limited by thenecessity of assuming that the ‘fingerprint’ that is compared is a unique marker forthe structure of interest. EXAFS would not be a particularly useful technique fordetermining whether a nitrogen base remains coordinated in solution or is displacedby a solvent molecule (assuming an N- or O-coordinating solvent). However,EXAFS is extremely useful for detecting metal–metal interactions and determiningwhether they remain intact in solution.

1115J.E. Penner-Hahn / Coordination Chemistry Re6iews 190–192 (1999) 1101–1123
In the Ga example, the inter-ring Ga�Ga interaction (3.54 A, ) was readilydetectable. However, the longer 4.64 A, intra-ring Ga�Ga distance was not de-tectable in the EXAFS. In part, this reflects the greater detectability of shorterdistances. In addition, the inter-ring Ga�Ga pair is bridged by a single atom(hydroxide) while the intra-ring galliums have a multi-atom bridge which appar-ently results in much greater variation in the Ga�Ga distance (the s2 factor in Eq.(2)). In general, single-atom bridges are much more likely than other bridginggeometries to give detectable metal–metal interactions in EXAFS [8].
In the Ga example, EXAFS would not have been particularly useful fordemonstrating that the 12-metallacrown-4 ring remained intact in solution, sincethe intra-ring Ga�Ga interaction is not readily detectable even in the solid state. Ingeneral, it is always important to remember that the absence of a signal in theEXAFS is not necessarily evidence for the absence of the interaction in the sample.If the interaction is weak enough (s2 large enough), even nearest neighbors can benon-detectable in EXAFS [22,23].
In some cases, XANES may be a more useful fingerprint than EXAFS for solutestructure determination. For a series of bis(N-alkylsalicyladiminato)copper(II) com-plexes, the structural question was not ligation but geometry. From a variety ofother spectroscopies, it was clear that the Cu(II) was approximately tetragonal,with O2N2 ligation, but it was not clear to what extent the Cu site distorted towardsa tetrahedral structure as a function of changes in solvent [24]. There were nodifferences in Cu-ligand bond lengths as a function of solvent, but there werecharacteristic changes in the XANES region, particularly in the 1s�3d and 1s�4pregions, that could be interpreted in terms of geometric distortions.
A related application of EXAFS is to determine the solvation environment ofmetal cations in solution. This is superficially analogous to the comparison of solidand solution structure, but is in fact much more difficult. The structural question is,for example, whether or not a counter ion is coordinated. There have been severalrecent studies of Cu(II) coordination in aqueous solution [25,26]. These used anelaborate fitting procedure including a variety of multiple scattering interactions.The difficulty with this approach is that a reasonable description of the structuralpossibilities requires a very large number of variable parameters. For example,27–29 variable parameters were needed to describe the data for Cu(II)�glycinatecomplexes in solution [25]. Since the useful EXAFS signal only extends to R5:4A, , the number of variables in such a study is close to, and probably exceeds, thenumber of independent data points. Fits such as these are probably better thoughtof as simulations of the data—i.e. as representing one (perhaps of many) possiblestructural models for the data.
3.2. What is the structure in solution (de no6o determination)?
Structural characterization of a structurally unknown solute is probably the mostcommon application of XAS, especially in the context of coordination chemistry.Conceptually, the problem is straightforward; one measures the XAS spectra forone or more of the atoms in the solute and uses this information to determine the

1116 J.E. Penner-Hahn / Coordination Chemistry Re6iews 190–192 (1999) 1101–1123
structure of the solute. In practice, the situation can be substantially more compli-cated because of the limitations in the information content of XAS. Recent XASstudies of organocuprates illustrate the applications, and some of the difficulties, ofXAS as a probe of solution structure.
Organo-, cyano-cuprates are the reagents formed from the addition of alkylgroups to CuCN. Although these are extremely useful reagents in organic chem-istry, their structures are not well characterized. In particular, the nature of thereagent formed from adding two equivalents of alkyllithium to CuCN has beencontroversial. This reagent shows unique reactivity patterns. NMR spectra havebeen interpreted as providing evidence either for [27] or against [28] the presence ofa so-called ‘higher order’ cyanocuprate complex. The latter would contain athree-coordinate Cu(I), with the cyanide and both of the alkyl groups coordinatedto the Cu.
This is a straightforward question to answer using XAS [29]. The FTs of theEXAFS spectra for CuCN·2LiCl+nBuLi are shown in Fig. 7. In this case, evenqualitative examination is sufficient to answer the major structural questions. Thesalt CuCN is not by itself soluble in THF, however it can be solubilized by additionof LiCl. The peak at approximately 3 A, in the FT for CuCN·2LiCl (Fig. 7) is dueto Cu�C�N multiple scattering. The multiple scattering is intense due to thelinearity of the cyanide group. This spectrum thus clearly shows that the cyanideligands remain coordinated to the Cu in CuCN·2LiCl. The additional strong peakat about 4.5 A, can only arise from Cu�C�N�Cu multiple scattering, since there is
Fig. 7. Fourier transforms of the EXAFS data for CuCN·2LiCl+nBuLi (n=0, 1, 2). Redrawn fromdata in Ref. [29]. All spectra measured at 10 K. See text for interpretation of these data.

1117J.E. Penner-Hahn / Coordination Chemistry Re6iews 190–192 (1999) 1101–1123
nothing else in solution that can give rise to a strong scattering peak at thisdistance. This indicates that the CuCN is present as oligomers under theseconditions. On addition of one equivalent of BuLi the Cu···Cu interaction disap-pears, showing that the oligomeric structure is disrupted, and the amplitude of theCu···N interaction decreases. The latter suggests that some of the cyanide groupshave been displaced, presumably by butyl ligands. On addition of the secondequivalent of BuLi, all of the outer-shell interactions disappear. This is consistentwith formation of Bu2Cu−, and inconsistent with the presence of a linear cyanidegroup in the putative higher-order cuprate Bu2Cu(CN)2−.
It is important to note that qualitative examination of Fig. 7 does not, by itself,prove that cyanide is not coordinated to Cu in CuCN·2LiCl+2BuLi, but only thatcyanide is not coordinated in the linear fashion found in BuCuCN− andCuCN·2LiCl. A hypothetical side-bound cyanide [30] could also account for theabsence of the 3 A, peak for CuCN·2LiCl+2BuLi. Although this kind of cyanidep-bonding is unknown in Cu(I) chemistry, it cannot be excluded by Fig. 7.However, quantitative analysis of the EXAFS data shows that both CuCN·2LiCl+BuLi and CuCN·2LiCl+2BuLi contain two-coordinate Cu, as judged either by theEXAFS amplitude or by the Cu�C bond length [29]. In addition, the XANES datafor CuCN·2LiCl+2BuLi and for an authentic p-bound cuprate–alkene complexare dramatically different [31].
Several lessons can be taken from these data. One concerns the utility of multiplescattering. In these data, the only significant multiple scattering arises from thelinear cyanide. This means that the multiple scattering is intense and that only a fewparameters are necessary to describe it. Under these conditions, it was possible todefine the Cu�C�N and Cu···N�Cu angles, both of which must have average valuesof 180° in order to explain the relative distances and the large amplitude of theouter shell scattering. Even with linear Cu�C�N�Cu groups, however, the ability todetect EXAFS at such long distances is due in part to the fact all of themeasurements were made at 10 K, where thermal motion is minimized.
A more subtle lesson regards the availability of systematic chemical perturba-tions. The FT for CuCN·2LiCl+2BuLi alone does not provide as convincing astructural picture as is provided by comparing the effect of successive BuLiadditions. In general, EXAFS is more useful for relative structure comparisons(with respect to a solid state reference or between different solution structures) thanas an isolated experiment.
Finally, it is important to note what was not determined in this study. Thedetailed geometry of the CuCN aggregate in CuCN·2LiCl cannot be defined fromthis work. It is, in fact, not even possible to say from the EXAFS data what rolethe Cl− plays in solubilizing the CuCN. There is a small shoulder at R+a:2 A,that might be due to a Cu�Cl interaction, but based on quantitative curve fitting,it was not possible to show that Cl was required to model the EXAFS. In order todemonstrate that this shoulder does arise from Cl, it was necessary to make theLiBr substituted analog and show, using both Cu and Br EXAFS, that there is aCu�halide interaction (data not shown). It is also important to note that theEXAFS data do not demonstrate directly that CuCN·2LiCl+BuLi contains

1118 J.E. Penner-Hahn / Coordination Chemistry Re6iews 190–192 (1999) 1101–1123
BuCuCN− rather than a 50:50 mixture of Cu(CN)2− and Bu2Cu−, since these
would have equivalent average structures. Chemical logic, together with the sequen-tial effects of BuLi addition, dictate that it is BuCuCN− that is formed, butsolution speciation cannot be shown by a single EXAFS spectrum alone (althoughsee below for other approaches to the speciation problem). Finally, with regard tothe original question of what structural properties account for the unique reactivityof CuCN·2LiCl+2RLi, it is important to note that the data in Fig. 7 do not ruleout the possibility that there is a small amount of Bu2Cu(CN)2− present insolution. EXAFS only provides information about the bulk solution structure. Thiscannot address reactivity questions, since even a minor component could beresponsible for the reactivity. EXAFS is sufficient, however, to distinguish betweenthe different interpretations of the NMR data, since EXAFS and NMR both givebulk structure.
3.3. What is the structure in the crystal (use of XAS to resol6e crystallographicdisorder)?
The examples used thus far involve applications of XAS to non-crystallinesystems. However, XAS is also important for characterizing the structure of metalions in crystals. This is because of the fact that crystallographic structure determi-nation can suffer from resolution limitations analogous to those in EXAFS. Inparticular, the crystallographically determined structure for a metal ion thatoccupies a high symmetry site in a crystalline lattice is necessarily high symmetry.However, the structure of a single one of these metal sites may in fact have muchlower symmetry. In such cases both X-ray diffraction, which gives the structureaveraged over all unit cells, and XAS, which gives the structure averaged over allmetal sites, are necessary for a complete description of the structure.
A good example of this is provided by Cu(II), which is expected to undergo aJahn–Teller distortion to give an orbitally non-degenerate distorted structure, butwhich occasionally crystallizes in a high-symmetry lattice, inconsistent with such adistortion. For example, the tripodal ligand tris(2-pyridyl)methane gives a Cu(II)complex that crystallizes in R3( with 3( Cu site symmetry. This gives six identicalCu�N bond lengths of 2.10 A, , in apparent violation of the Jahn–Teller theorem.EXAFS studies [32] showed that the Cu site in bis[tris(2-pyridyl)methane]Cu(II)nitrate has the expected tetragonal distortion, with four short (2.04 A, ) and two long(2.25 A, ) Cu�N distances. The apparent discrepancy between the EXAFS and thecrystallographic structures can be resolved by recognizing that the orientation ofthe tetragonal elongation is disordered over the three different Cu�N directions.Consistent with this, the average Cu�N distances determined by EXAFS andcrystallography are the same.
An important lesson in this study is that crystallographic parameters alone maynot provide evidence for the presence of problems in the crystallographic refine-ment. A few of the ligand dimensions in the crystal structure of bis[tris(2-pyridyl)methane]Cu(II) nitrate showed significant (]3s) changes between 295 and

1119J.E. Penner-Hahn / Coordination Chemistry Re6iews 190–192 (1999) 1101–1123
173 K. However, in the absence of the EXAFS data, these might have beenexplained as due simply to an underestimate of the uncertainty. Moreover, variabletemperature X-ray diffraction is not routinely used in studies of coordinationcomplexes, thus in many crystal structures, even this anomaly would not have beennoted. The thermal parameters for the Cu and N atoms in bis[tris(2-pyridyl)methane]Cu(II) nitrate do not show particular evidence for the underlyingcrystallographic disorder. Without the use of both EXAFS and crystallography, itwould have been difficult or impossible to obtain a complete description of thestructure.
There are, of course, techniques other than EXAFS that could have indicatedthat the Cu did not have 3( symmetry. EPR, for example, is very useful in thisregard. However, EPR is not as structurally definitive. For example, crystallogra-phy indicated that the CuCl64− ion in (3-chloroanilinium)8(CuCl6)Cl4 had anunusual tetragonally compressed structure, with two short (2.28 A, ) and four long(2.61 A, ) Cu�Cl bond lengths, and the EPR spectra were interpreted as beingconsistent with this structure [33]. In contrast, EXAFS shows that the Cu site hasa more conventional elongated structure, with two pairs of short Cu�Cl bondlengths (2.28 and 2.38 A, ) and one pair of long Cu�Cl bond lengths (2.83 A, ) [34].In this case, the long Cu�Cl distance and the longer of the two short Cu�Cldistances are crystallographically disordered.
3.4. How does the structure e6ol6e with time?
An exciting new development in XAS is the ability to measure time resolvedspectra with a time resolution that extends, in principal, into the microsecondregime. This means that XAS can be used to determine the kinetics of a reaction.For many reactions, this is not particularly useful, since it may be substantiallyeasier to measure reaction kinetics using more conventional spectroscopies. Thereare, however, two important areas in which time-resolved XAS can provide uniqueinformation. The first is for spectroscopically ‘silent’ metals that do not have otheravailable spectroscopic signatures. Examples include Cu(I) and Zn(II). In thesecases, XAS may provide the only direct probe of the time dependence of thestructure. The importance of XAS in these cases is as a tool for measuring rateconstants.
A second area where XAS can contribute to kinetic studies is in the characteriza-tion of reactive intermediates. Reactive intermediates are, by definition, difficult orimpossible to crystallize. They may, however, be accessible to structural characteri-zation using XAS. The difficulty, as noted earlier, is that bulk techniques such asXAS cannot easily be used to measure structure for minor components in acomplex mixture. An elegant example of how time-resolution can be used tocircumvent this limitation is provided by a recent study of a vanadium oxidationcatalyst [35]. In this case, hundreds of XAS spectra were measured with 1 s timeresolution as the reaction (oxidation of n-butane over a vanadium phosphatecatalyst) took place. No single spectrum gave sufficient information that could be

1120 J.E. Penner-Hahn / Coordination Chemistry Re6iews 190–192 (1999) 1101–1123
Fig. 8. Schematic illustration of the transitions involved in the 1s�3d region for a tetrahedral Fe(II)site. Ground state is shown on the left, the two possible 1-electron excited configurations are shown onthe right. See Ref. [39] for detailed description of multiplet interpretations of 1s�3d data.
used to distinguish the different species that were present. However, by usingprincipal component analysis, it was possible to identify contributions from threedifferent species (one present at ca. 20 mol%) that contributed to the overall datavariation. From comparison with standards these components could be assigned toV5+, V4+, and V3+.
In this case, the ability to identify and characterize minor components rests onthe addition of a new dimension (i.e. time) to the data. Another way to increase theinformation content of XAS is to add spatial, rather than temporal, resolution.With modern synchrotron facilities it is now possible to record XAS spectra from1×1 mm square samples [36,37]. To date, this has largely been used by thegeological community to prepare maps of species distributions in complex samples(e.g. [38]). However, this could also be used, for example, to examine the productsof combinatorial inorganic reactions in order to characterize, for example, the mostpromising catalyst.
3.5. What is the electronic structure of the metal?
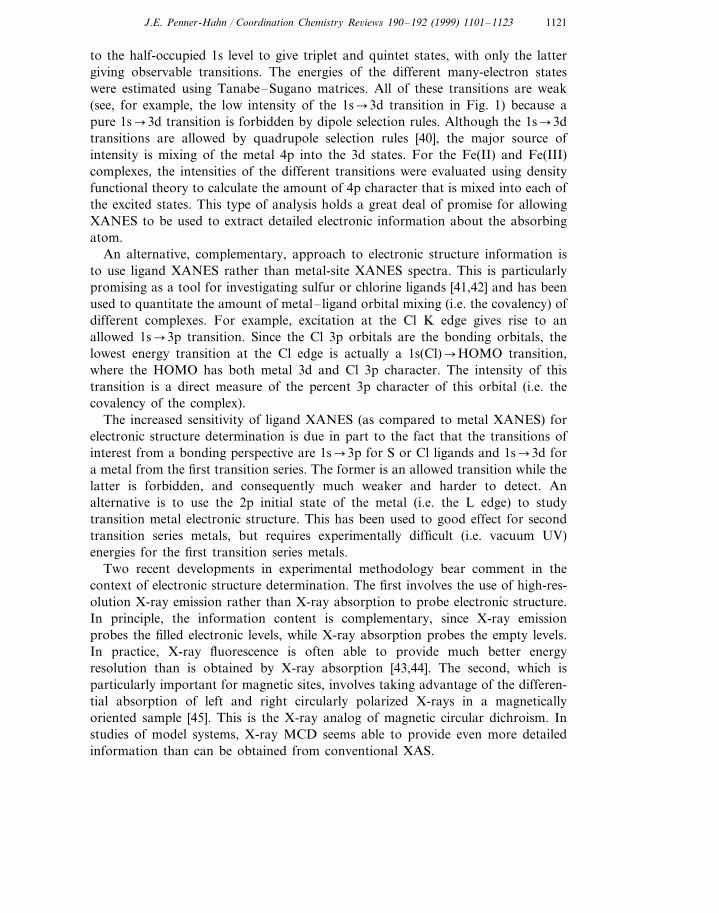
Thus far, reference has been made to the XANES region only as providing afingerprint for different structural environments. However, the bound-state transi-tions (e.g. 1s�3d, 1s�4p for the first transition series metals) can be analyzed toobtain direct insight into the electronic structure of the absorbing atom. Forexample, Solomon and co-workers have recently used Fe XANES spectra tocharacterize the electronic environment of Fe(II) and Fe(III) sites [39]. For tetrahe-dral Fe(II), there are two possible one-electron excited states that correspond to‘1s�3d’ transitions, as shown in Fig. 8. The (e)4(t2)3 configuration gives rise to a4A2 many-electron state, while the (e)3(t2)4 configuration gives rise to 4T1 and 4T2
many-electron states. In addition, a two-electron configuration (e)2(t2)5 also gives a4T1 state that will mix with the lower energy 4T1 state. These quartet states couple
1121J.E. Penner-Hahn / Coordination Chemistry Re6iews 190–192 (1999) 1101–1123
to the half-occupied 1s level to give triplet and quintet states, with only the lattergiving observable transitions. The energies of the different many-electron stateswere estimated using Tanabe–Sugano matrices. All of these transitions are weak(see, for example, the low intensity of the 1s�3d transition in Fig. 1) because apure 1s�3d transition is forbidden by dipole selection rules. Although the 1s�3dtransitions are allowed by quadrupole selection rules [40], the major source ofintensity is mixing of the metal 4p into the 3d states. For the Fe(II) and Fe(III)complexes, the intensities of the different transitions were evaluated using densityfunctional theory to calculate the amount of 4p character that is mixed into each ofthe excited states. This type of analysis holds a great deal of promise for allowingXANES to be used to extract detailed electronic information about the absorbingatom.
An alternative, complementary, approach to electronic structure information isto use ligand XANES rather than metal-site XANES spectra. This is particularlypromising as a tool for investigating sulfur or chlorine ligands [41,42] and has beenused to quantitate the amount of metal–ligand orbital mixing (i.e. the covalency) ofdifferent complexes. For example, excitation at the Cl K edge gives rise to anallowed 1s�3p transition. Since the Cl 3p orbitals are the bonding orbitals, thelowest energy transition at the Cl edge is actually a 1s(Cl)�HOMO transition,where the HOMO has both metal 3d and Cl 3p character. The intensity of thistransition is a direct measure of the percent 3p character of this orbital (i.e. thecovalency of the complex).
The increased sensitivity of ligand XANES (as compared to metal XANES) forelectronic structure determination is due in part to the fact that the transitions ofinterest from a bonding perspective are 1s�3p for S or Cl ligands and 1s�3d fora metal from the first transition series. The former is an allowed transition while thelatter is forbidden, and consequently much weaker and harder to detect. Analternative is to use the 2p initial state of the metal (i.e. the L edge) to studytransition metal electronic structure. This has been used to good effect for secondtransition series metals, but requires experimentally difficult (i.e. vacuum UV)energies for the first transition series metals.
Two recent developments in experimental methodology bear comment in thecontext of electronic structure determination. The first involves the use of high-res-olution X-ray emission rather than X-ray absorption to probe electronic structure.In principle, the information content is complementary, since X-ray emissionprobes the filled electronic levels, while X-ray absorption probes the empty levels.In practice, X-ray fluorescence is often able to provide much better energyresolution than is obtained by X-ray absorption [43,44]. The second, which isparticularly important for magnetic sites, involves taking advantage of the differen-tial absorption of left and right circularly polarized X-rays in a magneticallyoriented sample [45]. This is the X-ray analog of magnetic circular dichroism. Instudies of model systems, X-ray MCD seems able to provide even more detailedinformation than can be obtained from conventional XAS.

1122 J.E. Penner-Hahn / Coordination Chemistry Re6iews 190–192 (1999) 1101–1123
4. Prospects for the future
Given the potential range of applications of XAS in coordination chemistry, it isworth asking why the method has not received greater attention. One obviousfactor involves the difficulty of making XAS measurements. All of the spectradiscussed in this paper were measured at synchrotron radiation facilities. Untilrecently, it was extremely difficult to get access to the limited beam time availableat these facilities, and to some extent this may still limit the applications of XAS.In addition, the need to travel to a distant laboratory in order to make measure-ments represents a powerful social force limiting wider application of XAS. Both ofthese are changing, as the amount and quality of synchrotron beam time hasincreased, and as the scientific community has become more accustomed to usinglarge specialized facilities to make measurements. It is important to note that someof the methods that were discussed, for example time resolved measurements,high-resolution X-ray fluorescence and X-ray MCD are very new, and depend onthe capabilities of the newest synchrotron sources. As time advances, these arelikely to become both more accessible and more widely appreciated. This is reflectedin the increasing number of ‘non-XAS’ papers which make use of XAS as one ofthe tools for characterizing coordination complexes (including many papers whichhave not been mentioned here). There is every reason to believe that this trend willcontinue, and that XAS will become one of the standard tools used to characterizecoordination compounds.
Acknowledgements
I gratefully acknowledge support of our XAS studies by the NIH (GrantsGM-38047 and GM-45205) and of the US synchrotron sources by the US Depart-ment of Energy. The measurements discussed in this tutorial were made at theStanford Synchrotron Radiation Laboratory and the National Synchrotron LightSource. Finally, I thank Bill Rutherford and his group for support and hospitalityduring a sabbatical stay in Saclay.
References
[1] S.P. Cramer, Chem. Anal. 92 (1988) 257.[2] R.A. Scott, Methods Enzymol. 117 (1985) 414.[3] C.D. Garner, in: C.R.A. Catlow, G.N. Greaves, X-ray absorption spectroscopy of biological
molecules, Blackie, Glasgow, 1990, p. 268.[4] D.C. Koningsberger, R. Prins (Eds.), X-ray Absorption: Principles, Applications, Techniques of
EXAFS, SEXAFS, and XANES, Wiley, New York, 1988.[5] P.A. Lee, P.H. Citrin, P. Eisenberger, B.M. Kincaid, Rev. Mod. Phys. 53 (1981) 769.[6] E.D. Crozier, Nucl. Instrum. Methods Phys. Res. B 133 (1997) 134.[7] B.K. Teo, EXAFS: Basic Principles and Data Analysis, Springer, New York, 1986.[8] P.J. Riggs-Gelasco, T.L. Stemmler, J.E. Penner-Hahn, Coord. Chem. Rev. 144 (1995) 245.

1123J.E. Penner-Hahn / Coordination Chemistry Re6iews 190–192 (1999) 1101–1123
[9] M. Vaarkamp, I. Dring, R.J. Oldman, E.A. Stern, D.C. Koningsberger, Phys. Rev. B 50 (1994)7872.
[10] J.J. Rehr, D.L.J. Mustre, S.I. Zabinsky, R.C. Albers, J. Am. Chem. Soc. 113 (1991) 5135.[11] J.J. Rehr, R.C. Albers, S.I. Zabinsky, Phys. Rev. Lett. 69 (1992) 3397.[12] K. Clark-Baldwin, D.L. Tierney, N. Govindaswamy, E.S. Gruff, C. Kim, J. Berg, S.A. Koch, J.E.
Penner-Hahn, J. Am. Chem. Soc. 120 (1998) 8401.[13] P.J. Riggs-Gelasco, R. Mei, C.F. Yocum, J.E. Penner-Hahn, J. Am. Chem. Soc. 118 (1996) 2387.[14] E.A. Stern, Phys. Rev. B 48 (1993) 9825.[15] A. Michalowicz, G. Vlaic, J. Synchron. Rad. 5 (1998) 1317.[16] S. Wang, M.H. Lee, R.P. Hausinger, P.A. Clark, D.E. Wilcox, R.A. Scott, Inorg. Chem. 33 (1994)
1589.[17] R.W. Strange, N.J. Blackburn, P.F. Knowles, S.S. Hasnain, J. Am. Chem. Soc. 109 (1987) 7157.[18] R.W. Joyner, K.J. Martin, P. Meehan, J. Phys. C: Solid State Phys. 20 (1987) 4005.[19] G. Bunker, S. Hasnain, D. Sayers, in: S.S. Hasnain (Ed.), X-ray Absorption Fine Structure, Ellis
Horwood, New York, 1991, p. 751.[20] F.W. Lytle, D.E. Sayers, E.A. Stern, Physica B 158 (1988) 701.[21] M.S. Lah, B.R. Gibney, D.L. Tierney, J.E. Penner-Hahn, V.L. Pecoraro, J. Am. Chem. Soc. 115
(1993) 5857.[22] J.E. Penner-Hahn, M. Murata, K.O. Hodgson, H.C. Freeman, Inorg. Chem. 28 (1989) 1826.[23] R.A. Scott, J.E. Hahn, S. Doniach, H.C. Freeman, K.O. Hodgson, J. Am. Chem. Soc. 104 (1982)
5364.[24] M.D. Wirt, L. Bubacco, J. Peisach, Inorg. Chem. 34 (1995) 2377.[25] P. D’Angelo, E. Bottari, M.R. Festa, H.-F. Nolting, N.V. Pavel, J. Phys. Chem. B 102 (1998) 3114.[26] P. D’Angelo, E. Bottari, M.R. Festa, H.-F. Nolting, N.V. Pavel, J. Chem. Phys. 107 (1997) 2807.[27] B.H. Lipshutz, S. Sharma, E.L. Ellsworth, J. Am. Chem. Soc. 112 (1990) 4032.[28] S.H. Bertz, J. Am. Chem. Soc. 112 (1990) 4031.[29] T.L. Stemmler, T. Barnhart, J.E. Penner-Hahn, C.E. Tucker, P. Knochel, M. Bohme, G. Frenking,
J. Am. Chem. Soc. 117 (1995) 12489.[30] B.H. Lipshutz, B. James, J. Org. Chem. 59 (1994) 7585.[31] T.M. Barnhart, H. Huang, J.E. Penner-Hahn, J. Org. Chem. 60 (1995) 4310.[32] T. Astkey, P.J. Ellis, H.C. Freeman, M.A. Hitchman, F.R. Keene, E.R.T. Tiekink, J. Chem. Soc.
Dalton Trans. (1995) 595.[33] D. Tucker, P.S. White, K.L. Trojan, M.L. Kirk, W.E. Hatfield, Inorg. Chem. 30 (1991) 823.[34] P.J. Ellis, H.C. Freeman, M.A. Hitchman, D. Reinen, B. Wagner, Inorg. Chem. 33 (1994) 1249.[35] G.W. Coulston, S.R. Bare, H. Kung, K. Birkeland, G.K. Bethke, R. Harlow, N. Nerron, P.L. Lee,
Science 275 (1997) 191.[36] S.R. Sutton, M.L. Rivers, S. Bajt, K. Jones, J.V. Smith, Nucl. Instrum. Methods Phys. Res. Sect.
A 347 (1994) 412.[37] R.S. Sutton, S. Bajt, J. Delaney, D. Schulze, T. Tokunaga, Rev. Sci. Instrum. 66 (1995) 1464.[38] P.M. Bertsch, D.B. Hunter, S.R. Sutton, S. Bajt, M.L. Rivers, Environ. Sci. Technol. 28 (1994) 980.[39] T.E. Westre, P. Kennepohl, J.G. DeWitt, B. Hedman, K.O. Hodgson, E.I. Solomon, J. Am. Chem.
Soc. 119 (1997) 6297.[40] J.E. Hahn, R.A. Scott, K.O. Hodgson, S. Doniach, S.R. Desjardins, E.I. Solomon, Chem. Phys.
Lett. 88 (1982) 595.[41] I.J. Pickering, G.N. George, Inorg. Chem. 34 (1995) 3142.[42] S.E. Shadle, B. Hedman, K.O. Hodgson, E.I. Solomon, J. Am. Chem. Soc. 117 (1995) 2259.[43] K. Hamalainen, C.C. Kao, J.B. Hastings, D.P. Siddons, L.E. Berman, V. Stojanoff, S.P. Cramer,
Phys. Rev. B: Condens. Matter 46 (1992) 14274.[44] K. Hamalainen, D.P. Siddons, J.B. Hastings, L.E. Berman, Phys. Rev. Lett. 67 (1991) 2850.[45] J. van Elp, S.J. George, J. Chen, G. Peng, C.T. Chen, L.H. Tjeng, G. Meigs, H.J. Lin, Z.H. Zhou,
M.W.W. Adams, B.G. Searle, S.P. Cramer, Proc. Natl. Acad. Sci. USA 90 (1993) 9664.
.