wyld networks
TRANSCRIPT

WYLD NETWORKS
1 JANUARY–30 JUNE 2021Including Q2 2021
HALF-YEAR REPORT

COMMENTARY
A strong performance 4
Comments from the CEO 6
A view from the market on satellite IoT 8
FINANCIAL
Income statement 17
Balance sheet 18-19
Change in equity 20
Cash flow 21
ADDITIONAL INFORMATION 22
Table of contents
WYLD NETWORKS

Q2: A STRONG PERFORMANCE
page 4 page 5
The second quarter 2021 exceeded our expectations with us signing contracts with six new customers. These included Chevron, in the oil and gas sector, and Rijk Zwaan, in agricultural, who both signed up to test and demonstrate our satellite IoT solution ahead of its commercial launch.
Up until to the end of the Q2 2021 we have now secured agreements with nine com-panies to participate in the test phase of our IoT solution Wyld Connect.
The quarter also saw us deliver the first five satellite test terminals to Eutelsat, our satellite partner, as part of a commercial agreement valued at SEK 1.3 million.
As part of our product development activities, we are pleased to announce that in June, we received an R&D tax credit of SEK 1.6 million as a cash payment from the UK Government.
During preparations for the successful listing on the Nasdaq First North Growth Market, we strengthened the organisation at senior management level, with the appointment of Christopher J. Caswell, a PwC-trained chartered accountant and graduate engineer, who steps into the dual roles of Deputy CEO and CFO.
In June we completed an issue of units in connection with the listing on Nasdaq First North Growth Market. The offer was heavily oversubscribed, raising SEK 25 million before issue costs.
Preparations for the listing were resource intensive during this quarter, incurring non-recurring costs corresponding to SEK 4.1 million that are directly attributable to the listing process.
EVENTS POST Q2Wyld Networks’ shares began trading on the Nasdaq First North Growth Market.
In light of the strong response in establishing new contracts with significant custom-ers and the associated growth expansion, the company has put in place an acceler-ated operating plan and obtained a loan of SEK 12 million. In conjunction with the loan, the company has established an additional warrant program TO3 provided free of charge to existing shareholders. This finance will bring forward the recruitment of sales and development resources, to accelerate the commercialisation of our solution in global markets.
Q2 IN SUMMARY• Receipt (of second and final part) of 2020 UK R&D tax
credit as a cash payment of SEK 1.6m (SEK 3.3m received in 2021 in total)
• Total income of SEK 0.9m (1.6)• Net loss of SEK –9.7m (–1.6)• Earnings per share SEK -1.17
(Based on 8,267,308 Issued and Authorised shares)
WYLD NETWORKS IS SIGNING CONTRACTS WITH GLOBAL COMPANIES AHEAD OF THE LAUNCH OF ITS SATELLITE IoT SOLUTION

TO OUR SHAREHOLDERS
CHEVRON CORPORATIONOne of the world’s largest energy companies with revenues of approximately $98bn in 2020.
RIJK ZWAANDutch vegetable breeding and seed production company with a market share of 9% making it the number four vegetable breeding company worldwide.
EASTWEST SEEDSAsian seed supplier in the agricultural sector.
CFGAn association of fruit producers in South America that focuses on leveraging technology to improve production yield in crops.
AGRISOUND UK based IoT company, that combines acoustic technology with environmental sensors, to help maintain an optimal pollination environment to increase the yield from crops.
AGROCOGNITIVE South American company that provides data analytics for the agricultural sector.
In the second quarter we signed agreements to test our solution with the following companies:
We are very pleased to have been listed on the Nasdaq First North Growth Market this summer, realising funding that will allow Wyld Networks to further develop and commercialise our satellite Internet of Things (IoT) solution.
In principal
HALF–YEAR REPORT 1 January–30 June 2021 incl.Q2 2021www.wyldnetworks.com page 7 page 6
2022: THE YEAR OF SATELLITE IoT SOLUTIONS
COMMENTS FROM THE CEO
* https://rethinkresearch.biz/articles/nanosats-and-new-use-cases-will-propel-satellite-iot-to-5-9bn-by-2025/
Our product Wyld Connect is currently in the pre-commercial test phase in advance if the commercial launch. Our strategy in this phase has been to focus on signing agreements with companies as test and launch partners.
In Q1, we signed contracts with Fujitsu, a global technology company, KWS, a global agricultural seed supplier, and Wezen in Brazil.
In Q2, we secured six new agreements with companies in global oil and gas, environment, and agriculture industries (read more on the next page).
We will continue to expand engagement with new partners in these markets, as well as in water and electricity utilities and in the maritime sector.
In the quarter we hit a major milestone and delivered to Eutelsat, our satellite partner, the first five satellite IoT mod-ules for the test phase as part of our commercial agreement valued at SEK 1.3 million.
We have also continued to develop our technical solutions — the feedback from our partners in the test phase enabling us to ensure it will deliver optimal cus-tomer value in the commercial roll-out for each particular use cases.
Our mission is to provide affordable wireless connectivity to those global markets where there is currently zero or very poor wireless coverage. Terrestrial wireless networks only cover around 15 percent of the Earth’s surface, and this lack of global connectivity is preventing the growth of IoT networks from fulling contributing towards adding an antici-pated USD 2–3 trillion increase to global GDP over the next decade.
Wyld Networks provides affordable wireless solutions that connects IoT devices and sensors wherever they are located in the world, providing data directly to low earth orbiting satellites to provide 100% global coverage. This means companies can make informed decisions about processes that will significantly improve their operational efficiencies.
A new forecast from Rethink Research* predicts the global market for IoT- focused satellite services will grow to USD 5.9 billion in 2025, with 30.3 million IoT modules deployed as the sector is expected to expand significantly in the next few years.
Our current focus is in the agriculture, environment, maritime, water/electric-ity utilities markets as well as the oil and gas industries. Companies in these markets often have large operational activities in remote locations and so suffer from lack of affordable wireless connectivity, hampering their ability to deploy effective IoT technology to help connect their locations and improve operational efficiencies.
We look forward to providing our shareholders and other stakeholders with further updates as we continue to commercialise our solution.
Alastair WilliamsonCEO
FUTURE MARKETS
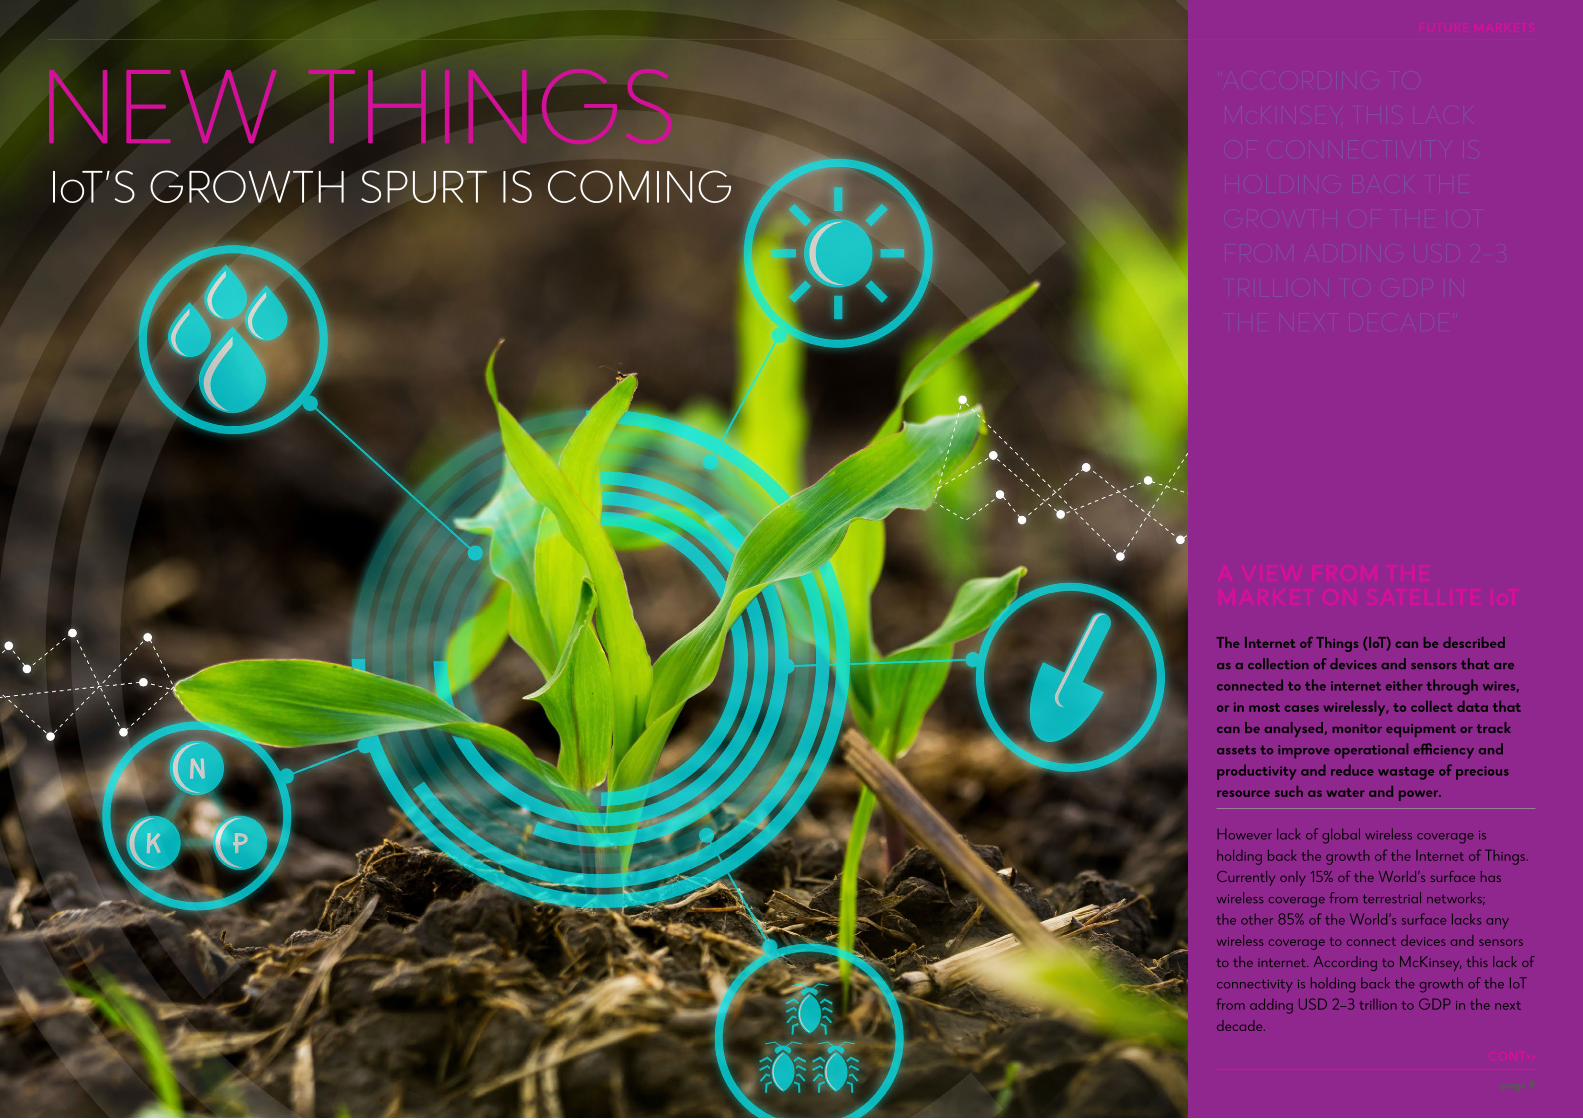
NEW THINGSIoT’S GROWTH SPURT IS COMING
A VIEW FROM THE MARKET ON SATELLITE IoT
The Internet of Things (IoT) can be described as a collection of devices and sensors that are connected to the internet either through wires, or in most cases wirelessly, to collect data that can be analysed, monitor equipment or track assets to improve operational efficiency and productivity and reduce wastage of precious resource such as water and power.
However lack of global wireless coverage is holding back the growth of the Internet of Things. Currently only 15% of the World’s surface has wireless coverage from terrestrial networks; the other 85% of the World’s surface lacks any wireless coverage to connect devices and sensors to the internet. According to McKinsey, this lack of connectivity is holding back the growth of the IoT from adding USD 2–3 trillion to GDP in the next decade.
CONT>>
page 9
“ ACCORDING TO McKINSEY, THIS LACK OF CONNECTIVITY IS HOLDING BACK THE GROWTH OF THE IOT FROM ADDING USD 2–3 TRILLION TO GDP IN THE NEXT DECADE”

Wyld Networks’ satellite IoT solution focuses on combining affordable low power terminals on the ground to connect IoT devices and sensors directly to Low Earth Orbiting (LEO) satellites to provide connectivity in the 85% of the World surface where currently there is no wireless coverage. The solution supports both connection to the satellite and connection to the 15% of the Worlds surface where there is coverage; thus enabling a solution to provide 100% global connectivity.
ReThink Technology Research predicts the global market for IoT-focused satellite services will grow to US $5.9 billion in 2025, taking into account end-device connectivity hardware and the annual connectivity fees, with the deployment of 30.3 million terminals once the sector starts to launch in 2021 to 2022.
The use cases of the our technology are focused on agriculture, environment, maritime and oil and gas sectors, specifically areas where there is currently no terrestrial wireless coverage.
SATELLITE IoT IN AGRICULTUREOne of the oldest industries must embrace a digital, connectivity-fueled transformation in order to overcome increasing demand and several disruptive forces.
Agriculture is in the early days of a revolution, at the heart of which lie data and connectivity.
Artificial intelligence, analytics, connected sensors, and other emerging technologies could further increase yields, improve the efficiency of water and other inputs, and build sustainability and resilience across crop cultivation and animal husbandry.
SMART CROP MONITORING Connected-irrigation and nutrient-distribution equipment based on connected-sensor data and imagery analysis, aimed at optimising resource usage and crop growth through real-time, precise, location-dependent adjustments.
DRONE FARMINGDrone surveillance and remote interventions based on image analysis and connected sensors communicating data with the drone, aimed at providing more frequent, cost-effective remote monitoring of large areas and enabling remote interventions to boost yield and reduce losses from pests as well as optimising deployment costs.
SMART LIVESTOCK MONITORINGIndividualised feeding-and-care plans based on connected-body-sensor data and movement tracking, aimed at detecting illnesses early and providing each animal with its optimal feed and medicine mix to maximise growth.
AUTONOMOUS FARMINGSelf-operated machinery and robots able to perform targeted interventions based on connected-sensor data, CPS data, and imagery analysis, aimed at optimising resource usage, reducing labor requirements, and boosting yield through more precise and individualised interventions.
SMART BUILDING AND EQUIPMENT MANAGEMENTPrescriptive maintenance and real-time environmental adjustments, aimed at improving performance and extending useful life of farm equipment and other assets as well as decreasing risk of mold, fire, and other threats.
AGRICULTURE CONNECTIVITY USE CASESWyld Networks’ satellite IoT solution provides the solid connectivity infrastructure to enable the following uses cases and help address the problems faced in agriculture.
ESTIMATED RANGE OF POTENTIAL ADDITIONAL NEW GLOBAL GDP VALUE$ BILLION
SMART CROP MONITORING
DRONEFARMING
SMART LIVESTOCK
MONITORING
AUTONOMOUSFARMING
SMART BUILDING AND EQUIPMENT MANAGEMENT
CONT>>
FUTURE MARKETS FUTURE MARKETS
www.wyldnetworks.com page 11 page 10 HALF–YEAR REPORT 1 January–30 June 2021 incl.Q2 2021
13085
11590
70 50 40
6060
175
13085
11590
70 50 40
6060
175

WYLD’S SENSOR- TO-SATELLITE SYSTEM
VERTICAL THINKINGENVIRONMENT
Air qualityRiver, lake, sea qualityDeforestationFlood riskGlobal warming
MARITIME
Container monitoringLocation trackingEntry to portsMonitoring buoys
TRANSPORTATION
Goods’ health (temp’, vibration)Roadside/trackside asset monitoringEntry to ports
PIPELINE MANAGEMENT
Leak detectionCrack detectionValve monitoringPressure & flow monitoring
MINING
Remote asset managementSafety monitoringStrata movementDust & noise monitoring
AGRICULTURE
Soil MoisturePollination healthAsset managementWater wastage managementLivestock monitoring
Demand for food is growing as the world’s population is on track to grow from 7 billion to9.7 billion by 2050, while even today we struggle to feed the existing population.
By 2030, the water supply will fall 40 percent short of meeting global water needs. It is reported that 30% of wasted water comes from agriculture.
About one-quarter of arable land is degraded and needs significant restoration before it can again sustain crops at scale. And then there are increasing environmental pressures, such as climate change and the economic impact of catastrophic weather events, and social pressures, including the push for
more ethical and sustainable farm practices, such as higher standards for farm-animal welfare and reduced use of chemicals and pesticides.
To address these problems agriculture must embrace a digital transformation enabled by IoT connectivity. Yet agriculture remains less digitised compared with many other industries globally.
Now much more sophisticated, digital tools are needed to deliver the next productivity leap. Some already exist to help farmers more efficiently and sustainably use resources, while more advanced ones are in development.
www.wyldnetworks.com page 13 page 12
These new technologies can upgrade decision making, allowing better risk and variability management to optimise yields and improve economics.
Deployed in animal husbandry, they can enhance the well-being of livestock, addressing the growing concerns over animal welfare.
However without a solid connectivity infrastructure, none of this is possible. If connectivity is implemented successfully in agriculture, the industry could add on $500 billion in additional value to the global gross domestic product by 2030, according to McKinsey research.
HALF–YEAR REPORT 1 January–30 June 2021 incl.Q2 2021
“IF CONNECTIVITY IS IMPLEMENTED SUCCESSFULLY IN AGRICULTURE, THE INDUSTRY COULD ADD ON $500 BILLION IN ADDITIONAL VALUE”
FUTURE MARKETS FUTURE MARKETS

Q2FINANCIAL RESULTS COMMENTARY
Q2 FINANCIAL
page 15 HALF–YEAR REPORT 1 January–30 June 2021 incl.Q2 2021
INCOME STATEMENT Sales in Q2 were almost totally due to a continuing project with Eutelsat which will continue strongly in the second half of 2021. Other Income relates to the accrued R&D Tax Credit paid by the UK government which will be paid out in early 2022, the amount received in 2021 for financial year 2020 was SEK 3,283k.
Amounts reported in Q1 and Q2 2021 are conservative estimates of the amounts to be received.
The other income reported for 2020 is the actual amount received in 2021 for the 2020 claim spread equally across all quarters. As investment in development in 2021 is significantly higher than in 2020 we expect the final 2021 claim to be well above the amount received for 2020, underlining the conservative revenue recognition in Q2 2021. Any underreporting of this income in 2021 will be corrected in Q4 2021.
Other external expenses in Q2 were heavily influenced by the costs of advi-sors and professional fees during the IPO process totalling SEK 4,089k. Also other external expenses in 2021 include outside development costs totalling SEK 3,563k of which SEK 1,940k were in Q2. The Q2 outside development was provided by about 11 development engineers.
Staff costs in Q2 represent 16 employees of which 9 were in Development and 5 in Sales and Marketing.
BALANCE SHEET AT 30 JUNE 2021The Other Receivables of SEK 28.2m include SEK 25.0m of funds raised in the IPO, which were paid into the company’s bank account in the first days of July.
The accrued expenses mainly represent the fees of IPO advisors and other professionals which were invoiced in July 2021.
CHANGE IN EQUITY The New Share Issue amount of SEK 54m, represents SEK 25m raised in the IPO in Q2 2021 and SEK 29m paid in by original shareholders prior to IPO in Q1 2021.
CASH FLOWThe Cash Flow statement covers the 6 months to 30 June 2021.
The Proceeds of SEK 28,778k relates to funds input by the pre IPO shareholders in January 2021.
Similarly the repayment of Shareholder loans relates to pre IPO shareholders.
The funds raised in the IPO will be shown in the Q3 report, as they did not arrive into the company’s bank account till early July 2021.
BALANCE SHEET COMPARATIVESThe Wyld Networks Group has only been in existence in its current form since March 2021 when Wyld Networks AB was formed.
Management have not included in this report Balance Sheet comparatives at 31 December as they consider them having little relevance to the current group especially in the Equity structure. Such comparatives will be included in quarter-ly reports in 2022.
On the Wyld Networks website, audited Combined Financial Statements for 2019 and 2020 are available in the K3 format.
In Q2 the company received SEK 1,584k from the UK government as the second part of the 2020 claim for support for Research and Development reported under Other Income. This followed a similar amount received in Q1 2021.

GROUP CONSOLIDATED INCOME STATEMENT
Amounts in SEK k Apr–Jun2021
Apr–Jun2020
Jan–Jun 2021
Jan–Jun2020
IncomeNet Sales 202 773 1,175 1,356Other Income 713 817 1,401 1,671
Total Income 915 1,590 2,576 3,027
CostsOther External expenses -7,400 -918 -11,218 -2,015Staff costs -3,057 -2,129 -5,750 -4,490Depreciation -68 -57 -133 -114Other operating costs -78 -7 -80 -9
Total -10,603 -3,111 -17,181 -6,628
Result -9,688 -1,521 -14,605 -3,601
Financial costsImpairment 0 -61Interest 0 -36 -74 -36
Total financial costs 0 -36 -74 -97
Result after financial costs -9,688 -1,557 -14,679 -3,699
Result before tax -9,688 -1,557 -14,679 -3,699
Tax 0 0 0 0
Result for period -9,688 -1,557 -14,679 -3,699
FINANCIAL DATA
page 17 HALF–YEAR REPORT 1 January–30 June 2021 incl.Q2 2021
Q2 FINANCIAL
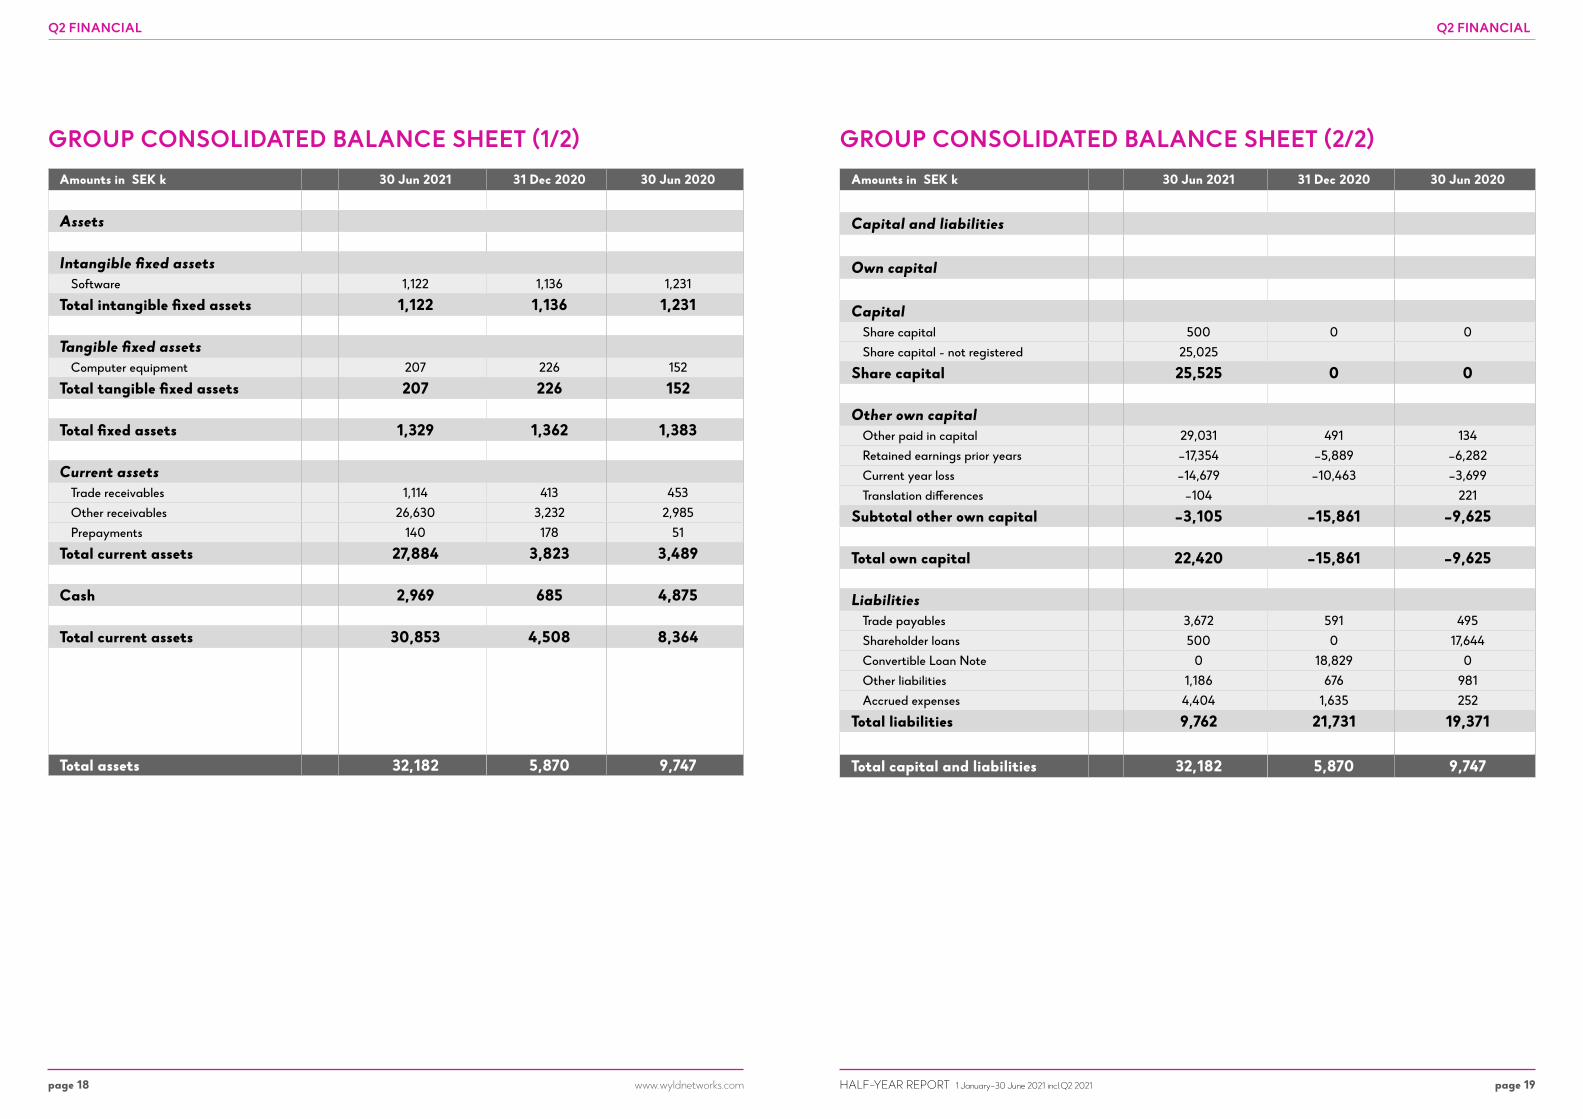
GROUP CONSOLIDATED BALANCE SHEET (1/2)Amounts in SEK k 30 Jun 2021 31 Dec 2020 30 Jun 2020
Assets
Intangible fixed assetsSoftware 1,122 1,136 1,231
Total intangible fixed assets 1,122 1,136 1,231
Tangible fixed assetsComputer equipment 207 226 152
Total tangible fixed assets 207 226 152
Total fixed assets 1,329 1,362 1,383
Current assetsTrade receivables 1,114 413 453Other receivables 26,630 3,232 2,985Prepayments 140 178 51
Total current assets 27,884 3,823 3,489
Cash 2,969 685 4,875
Total current assets 30,853 4,508 8,364
Total assets 32,182 5,870 9,747
GROUP CONSOLIDATED BALANCE SHEET (2/2)Amounts in SEK k 30 Jun 2021 31 Dec 2020 30 Jun 2020
Capital and liabilities
Own capital
CapitalShare capital 500 0 0Share capital - not registered 25,025
Share capital 25,525 0 0
Other own capitalOther paid in capital 29,031 491 134Retained earnings prior years –17,354 –5,889 –6,282Current year loss –14,679 –10,463 –3,699Translation differences –104 221
Subtotal other own capital –3,105 –15,861 –9,625
Total own capital 22,420 –15,861 –9,625
LiabilitiesTrade payables 3,672 591 495Shareholder loans 500 0 17,644Convertible Loan Note 0 18,829 0Other liabilities 1,186 676 981Accrued expenses 4,404 1,635 252
Total liabilities 9,762 21,731 19,371
Total capital and liabilities 32,182 5,870 9,747
www.wyldnetworks.com page 19 page 18 HALF–YEAR REPORT 1 January–30 June 2021 incl.Q2 2021
Q2 FINANCIAL Q2 FINANCIAL

GROUP CONSOLIDATED CHANGE IN EQUITYAmounts in SEK k Jan–Jun 2021 Jan–Jun 2020
Opening balance –15,861 –6,544
New share issue 54,036 0Loss in purchase of minority shares 1 0Current year loss –14,679 –3,699
Translation differences PnL –104 221Translation differences equity –973 397Translation differences –1,076 618
Closing balance 22,420 –9,625
GROUP CONSOLIDATED CASH FLOWAmounts in SEK k Jan–Jun 2021 Jan–Jun 2020
Cash flow from operationsProfit (loss) after financial result –14,679 –3,699Adjustments for non-cash activities:Depreciation 133 113Impairment 0 61
Cash flow before working capital –14,546 –3,524
Changes in working capitalIncrease (-)/decrease(+) in trade receivables –670 –116Increase (-)/decrease(+) in prepayments 49 14Increase (-)/decrease(+) in current receivables 1,924 506Increase (+)/decrease(-) in trade payables 3,019 –181Increase (+)/decrease(-) in other liabilities 462 356Increase (+)/decrease(-) in accrued expenses 2,657 –360
Total change in working capital +7,442 +219
Cash flow after working capital –7,104 –3,306
Investing activityAcquisition of tangible assets –19 –80Acquisition of intangible assets 0 0
Cash flow due to investing –19 –80
Financing activityChange in loan from shareholders –19,323 8,355Proceeds from issues of shares 28,778 0Costs of share buy back of minority shareholders 1 0
Cash flow from financing activity 9,456 8,355
Total cash flow 2,333 4,970
Cash and cash equivalents at beginning of year 685 215Exchange rate differences –49 –310
Cash and cash equivalents at end of period 2,969 4,875
www.wyldnetworks.com page 21 page 20 HALF–YEAR REPORT 1 January–30 June 2021 incl.Q2 2021
Q2 FINANCIAL Q2 FINANCIAL

FINANCIAL CALENDAR30 November 2021 Interim report for the third quarter
28 February 2022 Year-End Report 2021
31 March 2022 Annual Report 2021
TRANSACTIONS WITH RELATED PARTIESNo transactions with related parties have taken place.
EMPLOYEESThe average number of employees in the Group, including consultants, during and at the end of the quarter was 27.
The average number of employees (full-time positions excluding consultants) during and at the end of the second quarter was 14.
SHAREHOLDERS AND SHARE CAPITALOn 30 June 2021, Wyld Networks AB had 9 shareholders. On the 2 July 2021 at the time of the IPO Wyld Networks AB had 291 shareholders.
Wyld Networks`s share capital per 30 June 2021 amounted to SEK 25,525,000 (including SEK 25,025,000 share capital not yet registered with the Swedish Companies Registration Office as of 30 June 2021).
ADDITIONAL INFORMATION
www.wyldnetworks.compage 22
At the beginning of the quarter there were 5,992,308 shares outstanding. During the Quarter 2,275,000 shares were issued. The number of shares outstanding as of 30 June 2021 was 8,267,308.
The average number of shares out-standing during the second Quarter was 6,242,308.
AUDITORThe company’s auditor is Mazars AB. This report has not been subject to review by the company’s auditor.
ACCOUNTING PRINCIPLESWyld Networks prepares its accounts in accordance with the Swedish Annual Accounts Act and BFNAR 2012:1 (K3) Annual Accounts and Consolidated Accounts
ADDITIONAL NOTEIn the event of any discrepency between the English and the Swedish versions of the report, the Swedish version takes precedent.
FORWARD-LOOKING STATEMENTSThis interim report may contain state-ments concerning, among other things, Wyld Networks’ financial situation and profitability, as well as statements about growth and long-term market potential that may be forward-looking.
Wyld Networks believes that the expectations reflected in these forward- looking statements are based on reasonable assumptions. However, forward-looking statements include risks and uncertainties, and the actual results or consequences may differ significantly from those made.
In addition to what is required by appli-cable law, forward-looking statements apply only on the day they are made and Wyld Networks does not undertake to update any of them in the light of new information or future events.
CERTIFIED ADVISERMangold Fondkommission AB is acting as the company’s Certified Adviser and can be reached on +46 8-5030 1550 and [email protected].
CONTACTAlastair Williamson, CEO
E-mail: alastair.williamson@ wyldnetworks.com
Tel: +44 7 824 997 689
Wyld Networks AB (publ)
Corporate registration number: 559307-1102
Registered office: Stockholm
www.wyldnetworks.com
WYLD NETWORKS AB (PUBL)
www.wyldnetworks.com
WYLD NETWORKS