www.randstadholding.com analyst day, london london may 16, 2003
TRANSCRIPT

www.randstadholding.com
Analyst day, LondonAnalyst day, London
London
May 16, 2003
WelcomeWelcome
Program aimed at providing better
insight into Randstad concepts
Zoom into developments in the UK and
North America
In-depth look at tax structure
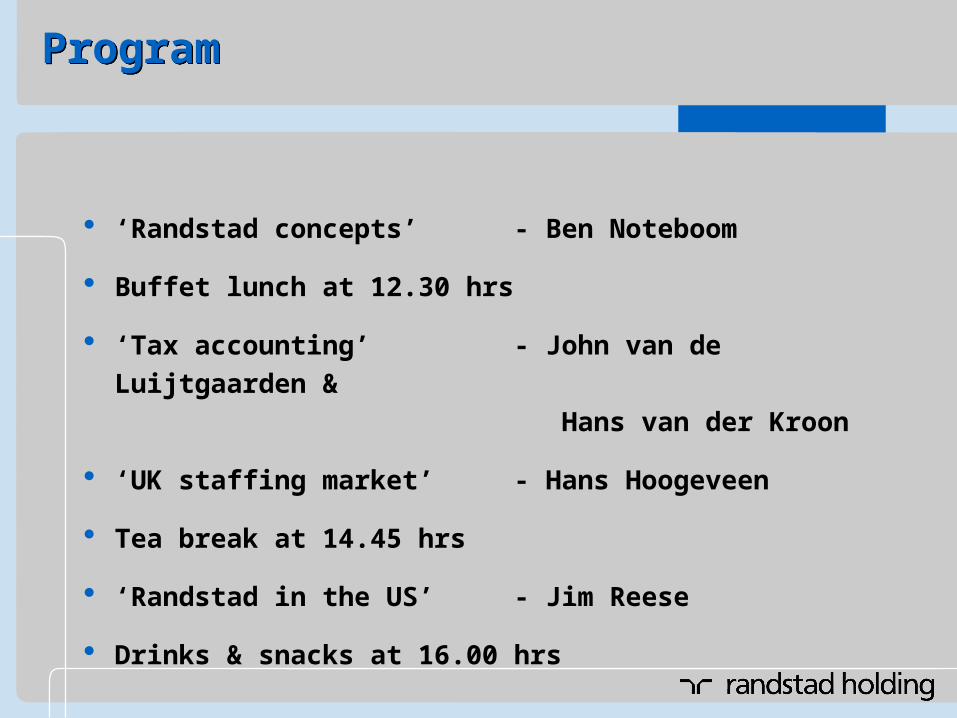
ProgramProgram
‘Randstad concepts’ - Ben Noteboom
Buffet lunch at 12.30 hrs
‘Tax accounting’ - John van de Luijtgaarden &
Hans van der Kroon
‘UK staffing market’ - Hans Hoogeveen
Tea break at 14.45 hrs
‘Randstad in the US’ - Jim Reese
Drinks & snacks at 16.00 hrs
Ben Noteboom
Chairman of the Executive Board and CEO
Randstad conceptsRandstad concepts
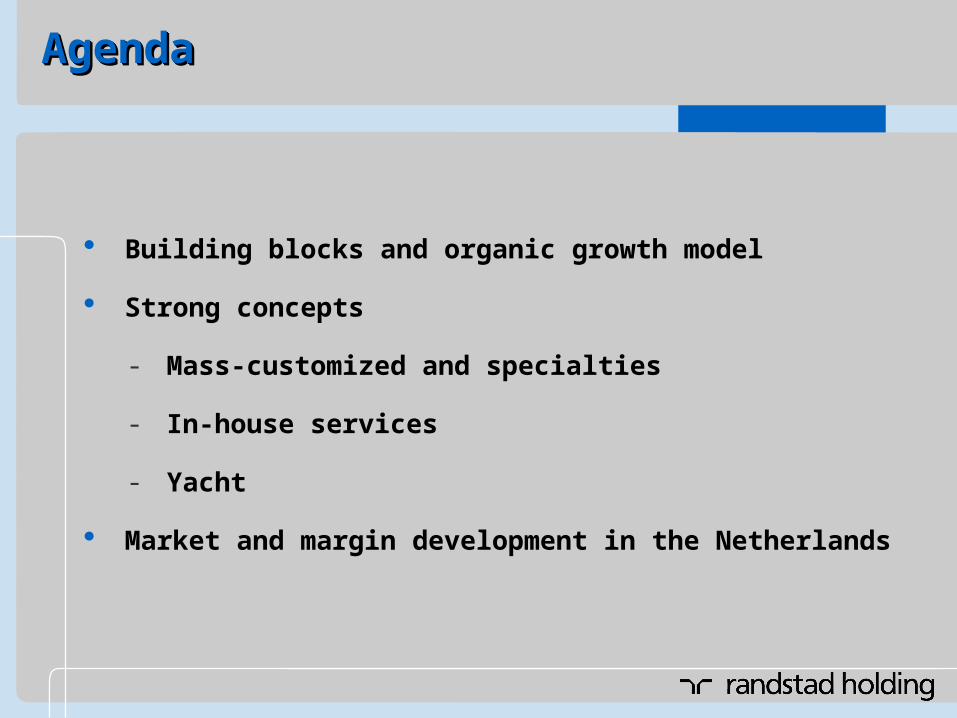
Building blocks and organic growth model
Strong concepts
- Mass-customized and specialties
- In-house services
- Yacht
Market and margin development in the Netherlands
AgendaAgendaAgendaAgenda
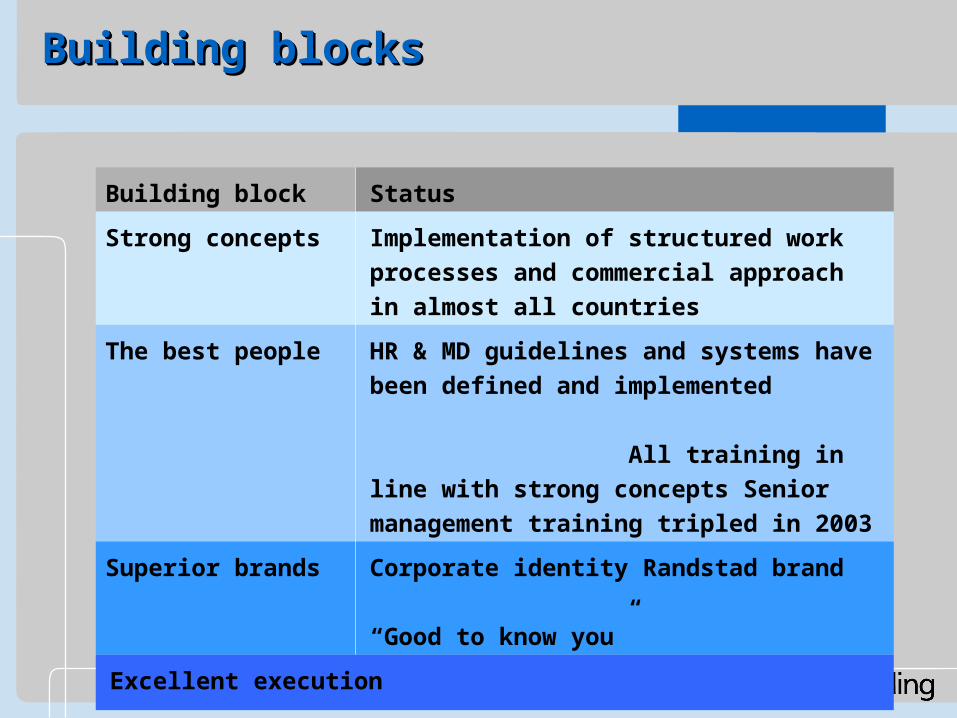
Building blocksBuilding blocksBuilding blocksBuilding blocks
Building block Status
Strong concepts Implementation of structured work
processes and commercial approach in
almost all countries
The best people HR & MD guidelines and systems have been
defined and implemented
All training in line with
strong concepts Senior management
training tripled in 2003
Superior brands Corporate identity Randstad brand
“Good to know you”
Excellent execution
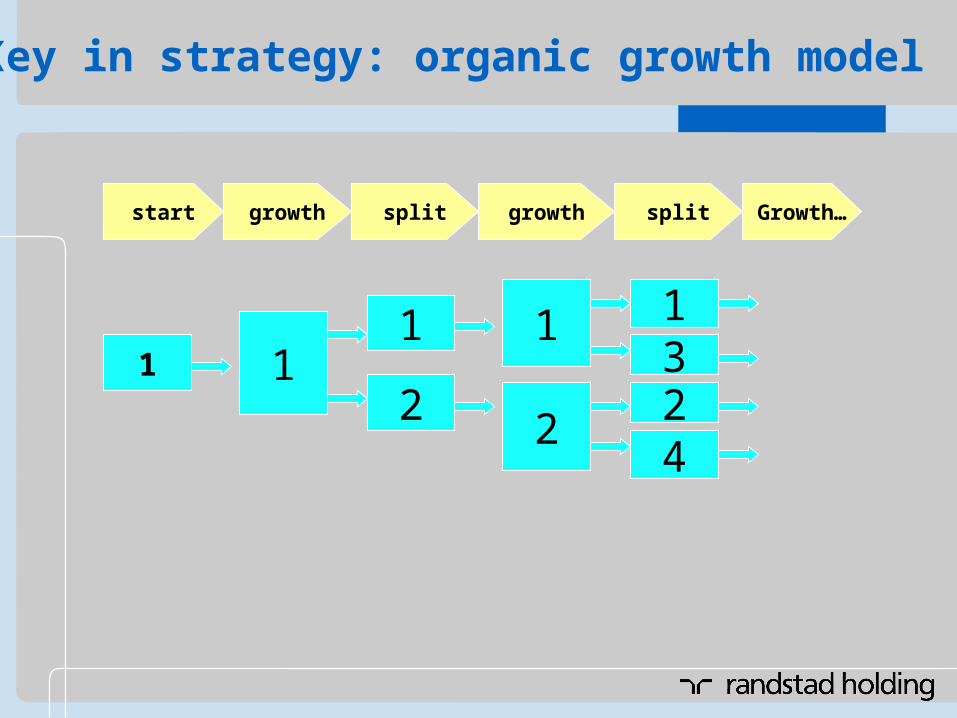
1 11
24231
2
1
growth split growth split Growth…start
Key in strategy: organic growth model
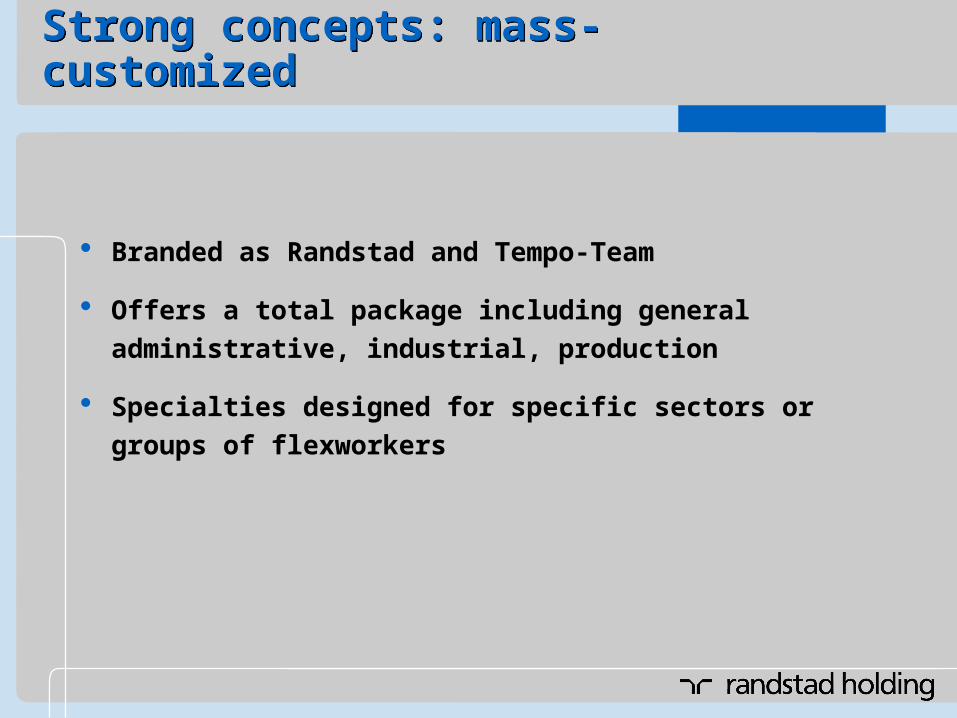
Strong concepts: mass-customizedStrong concepts: mass-customized
Branded as Randstad and Tempo-Team
Offers a total package including general administrative,
industrial, production
Specialties designed for specific sectors or groups of
flexworkers
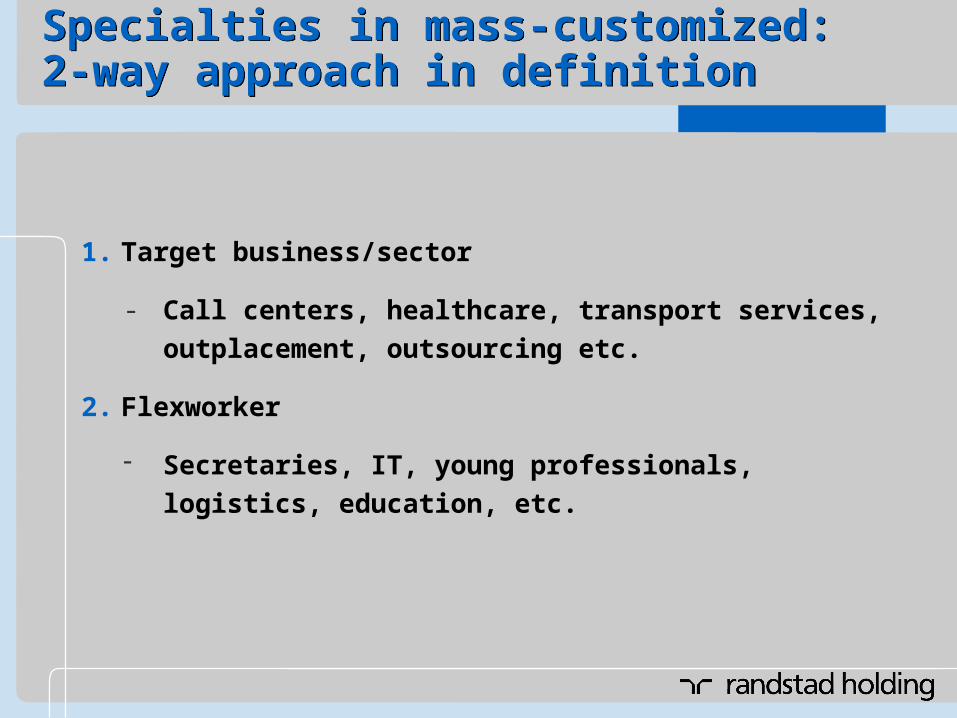
Specialties in mass-customized: 2-way approach in definitionSpecialties in mass-customized: 2-way approach in definition
1. Target business/sector
- Call centers, healthcare, transport services, outplacement,
outsourcing etc.
2. Flexworker
Secretaries, IT, young professionals, logistics, education,
etc.
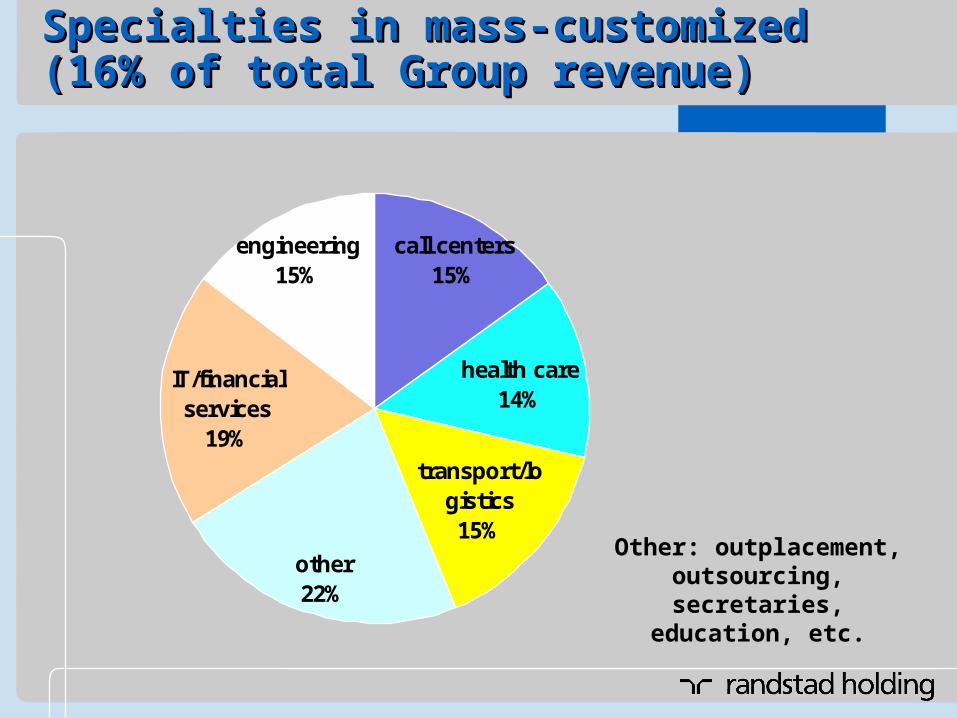
Specialties in mass-customized Specialties in mass-customized (16% of total Group revenue)(16% of total Group revenue)Specialties in mass-customized Specialties in mass-customized (16% of total Group revenue)(16% of total Group revenue)
call centers15%
health care14%
transport/logistics15%
other22%
IT/financial services
19%
engineering15%
Other: outplacement, outsourcing, secretaries,
education, etc.
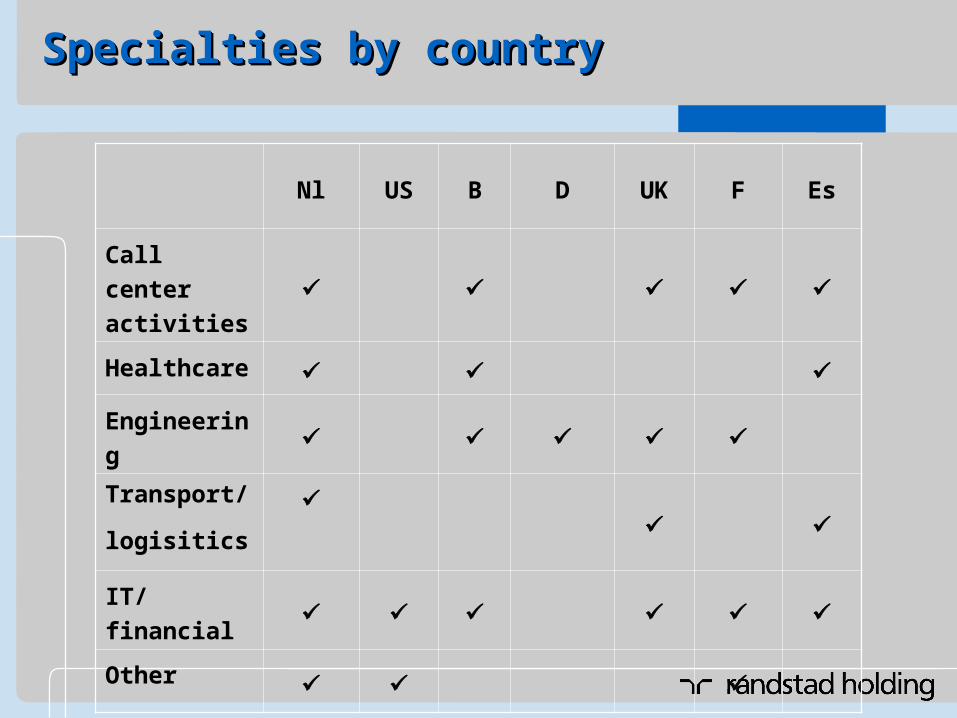
Specialties by country Specialties by country Specialties by country Specialties by country
Nl US B D UK F Es
Call center
activities
Healthcare
Engineering
Transport/
logisitics
IT/financial
Other
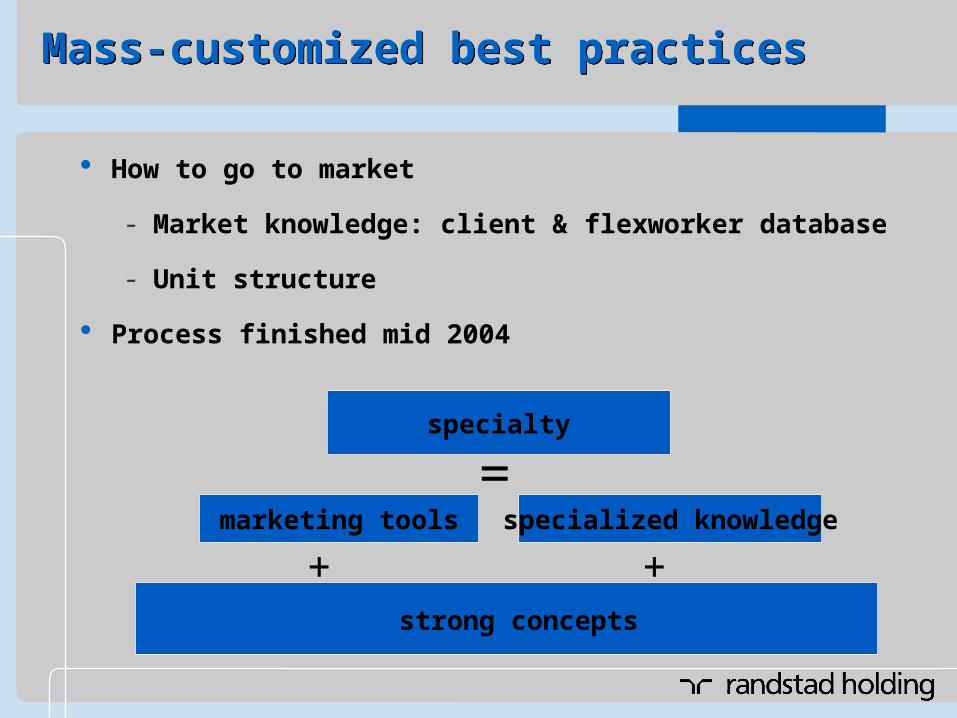
Mass-customized best practicesMass-customized best practices
How to go to market
- Market knowledge: client & flexworker database
- Unit structure
Process finished mid 2004
marketing tools specialized knowledge
strong concepts
specialty
+ +
Rationale for development in-house services concept
- Service to client and flexworker
- Low cost model
- Capacity in existing branches
Part of growth strategy targeting large customers
Start of copying behavior competitors
In-house servicesIn-house servicesIn-house servicesIn-house services
Capac videoCapac videoCapac videoCapac video
Market leader in the Netherlands and Belgium
Professionals market historically very profitable and very
volatile
Service offering: delivery of knowledge, productivity and direct
availability
Profitability to be achieved through aggressive reduction idle
time in all LoB´s and adjustment cost base
Start-up Germany according to schedule, small loss, 100
interim professionals working
Professional staffing: YachtProfessional staffing: YachtProfessional staffing: YachtProfessional staffing: Yacht
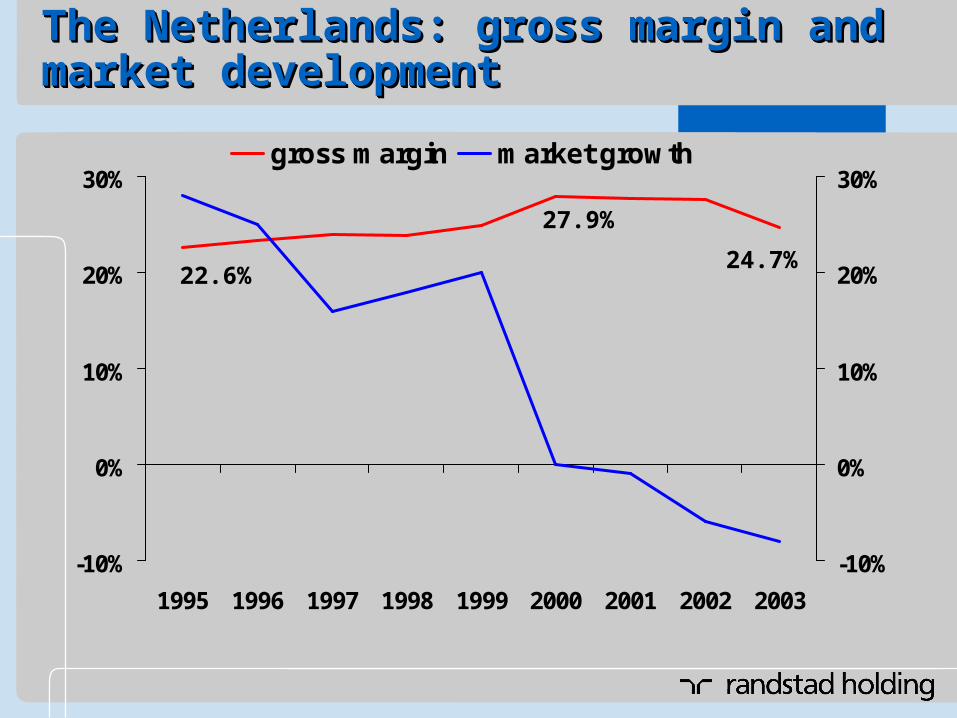
The Netherlands: gross margin and market The Netherlands: gross margin and market developmentdevelopmentThe Netherlands: gross margin and market The Netherlands: gross margin and market developmentdevelopment
-10%
0%
10%
20%
30%
1995 1996 1997 1998 1999 2000 2001 2002 2003
-10%
0%
10%
20%
30%gross margin market growth
22.6%24.7%
27.9%

> 1200 new staffing companies since abolishment license system
Non-associated companies have taken market share
Market data “Flexmarkt”: smaller companies disappearing
2 factors behind decline in market
- Scarcity on labor market
- Price elasticity
Larger companies organize their own flexibility
Changed market structure in the Changed market structure in the NetherlandsNetherlandsChanged market structure in the Changed market structure in the NetherlandsNetherlands
3 components in cost price flexworker
- Pay rate
- Social security
- Margin
No price war: Randstad as market leader always involved in tenders
Decline in market causes erratic price behavior by competition
Importance of market share gain biggest in declining market
Price elasticityPrice elasticityPrice elasticityPrice elasticity

New decline in market was largely unexpected
Identifying cost saving opportunities
Maintain external focus
Maintain branch network
The Netherlands: optimizing unit structure through unit clustering
IT costs
Further adjustments to cost base in Germany and North America
Cost base adjustmentsCost base adjustmentsCost base adjustmentsCost base adjustments

Thank you!
Any questions?
Thank you!
Any questions?
John van de Luijtgaarden
Managing director corporate accounting
& tax affairs
Hans van der Kroon
Head of corporate tax department
Tax accounting & IFRSTax accounting & IFRS

Tax aspects of group structure
Presentation in annual report
Short introduction of IFRS issues
AgendaAgenda
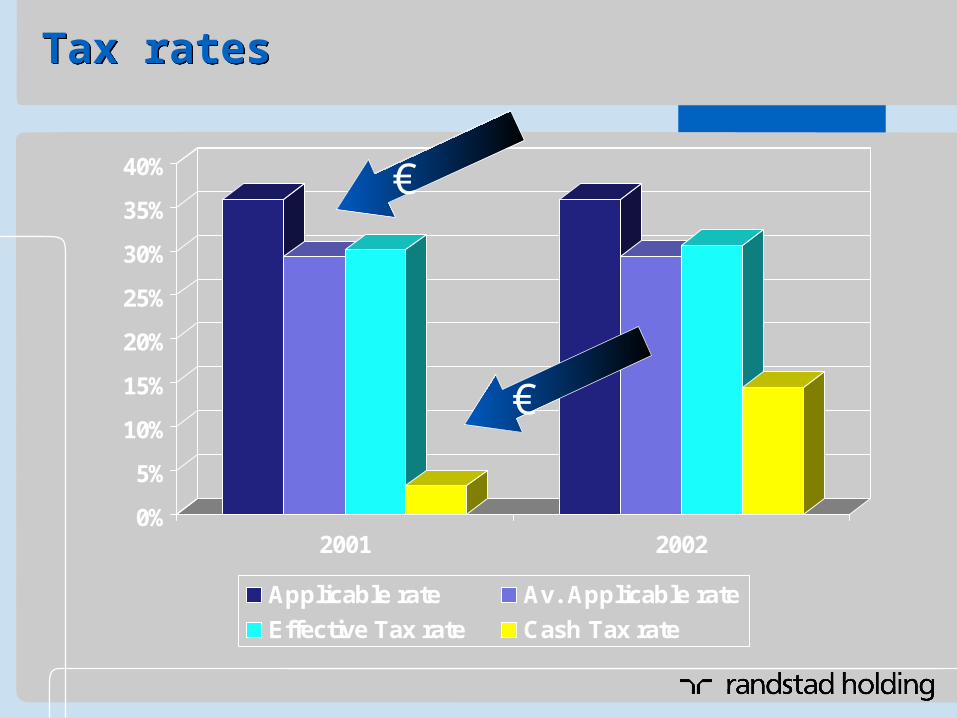
Tax ratesTax rates
0%
5%
10%
15%
20%
25%
30%
35%
40%
2001 2002
Applicable rate Av. Applicable rate
Effective Tax rate Cash Tax rate
€
€
1) From Average Rate to Effective Tax rate1) From Average Rate to Effective Tax rate
The majority of the difference between the average rate the
Effective Tax Rate results out of “permanent differences”;
Such as:
1. Concern Finance Regime
2. Intercompany Interest shelter
3. Extra tax deductible items (Option- education costs)
4. Movement in valuation allowance on tax assets w.r.t. NOL’s
5. Movement in valuation of tax assets w.r.t. goodwill paid
6. Other permanent non deductible or extra deductible items
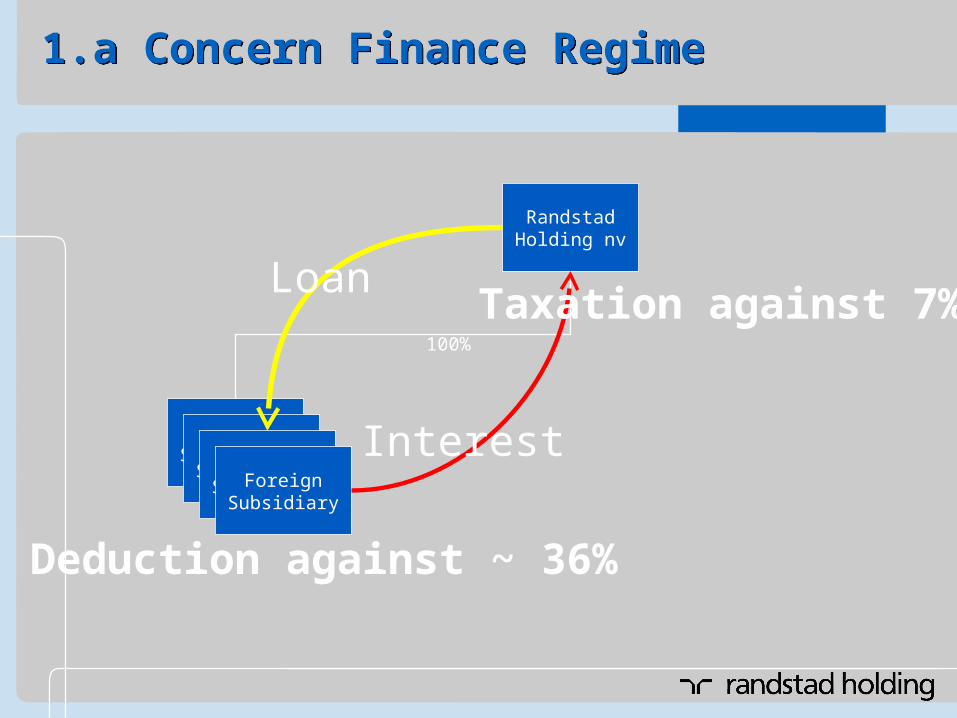
1.a Concern Finance Regime1.a Concern Finance Regime
RandstadHolding nv
ForeignSubsidiaryForeign
SubsidiaryForeignSubsidiaryForeign
Subsidiary
100%
Loan
Interest
Deduction against ~ 36%
Taxation against 7%
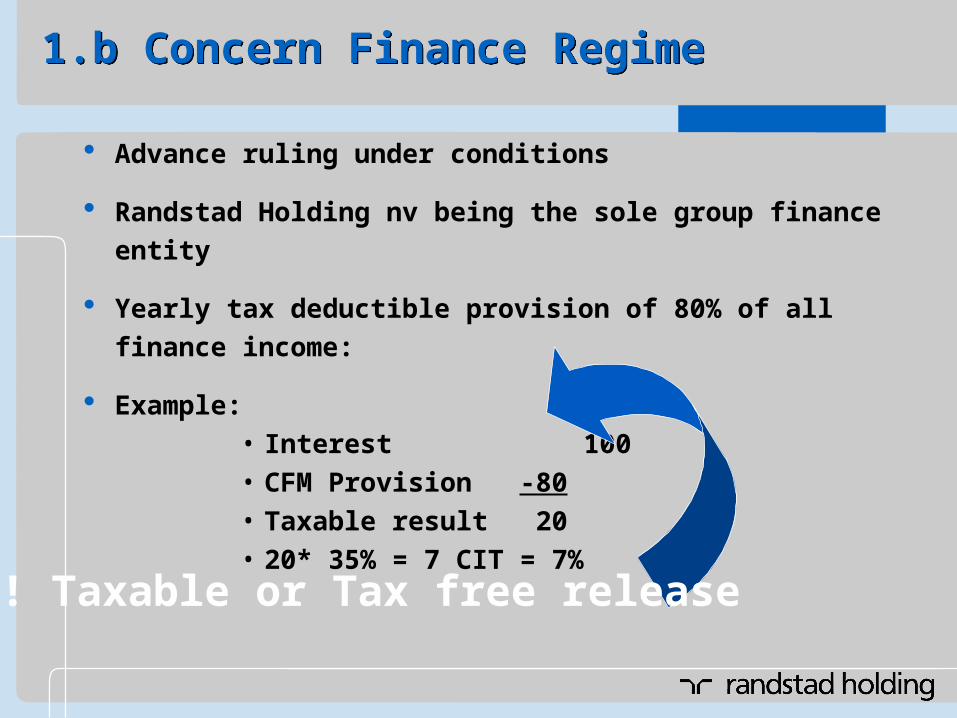
1.b Concern Finance Regime1.b Concern Finance Regime
Advance ruling under conditions
Randstad Holding nv being the sole group finance entity
Yearly tax deductible provision of 80% of all finance income:
Example:• Interest 100 • CFM Provision -80• Taxable result 20 • 20* 35% = 7 CIT = 7%
! Taxable or Tax free release

1.c Intercompany interest shelter1.c Intercompany interest shelter
RandstadHolding nv
ForeignSubsidiaryForeign
SubsidiaryForeignSubsidiaryForeign
Subsidiary
100%
RandstadHolding
Nederland bv
RandstadNorth America
LP
RandstadDeutschland
KG
LoanInterest
US Tax deduction
No Dutch taxation

1.d Tax assets w.r.t NOL’s & Goodwill1.d Tax assets w.r.t NOL’s & Goodwill
In various countries group companies are generating taxable
losses (also due to goodwill amortization and interest
deduction). Most of the countries do provide for a so called
carry forward of those losses to the future to be offset against
future profits (some countries even a carry back).
This future setting off of losses is reflected in the annual
account as an asset.
Upon acquisition of some companies in the past goodwill paid
has been made tax amortizable but for accounting purposes
this goodwill amount has been deducted from equity.
The future tax amortization has been booked as an asset in the
annual account.
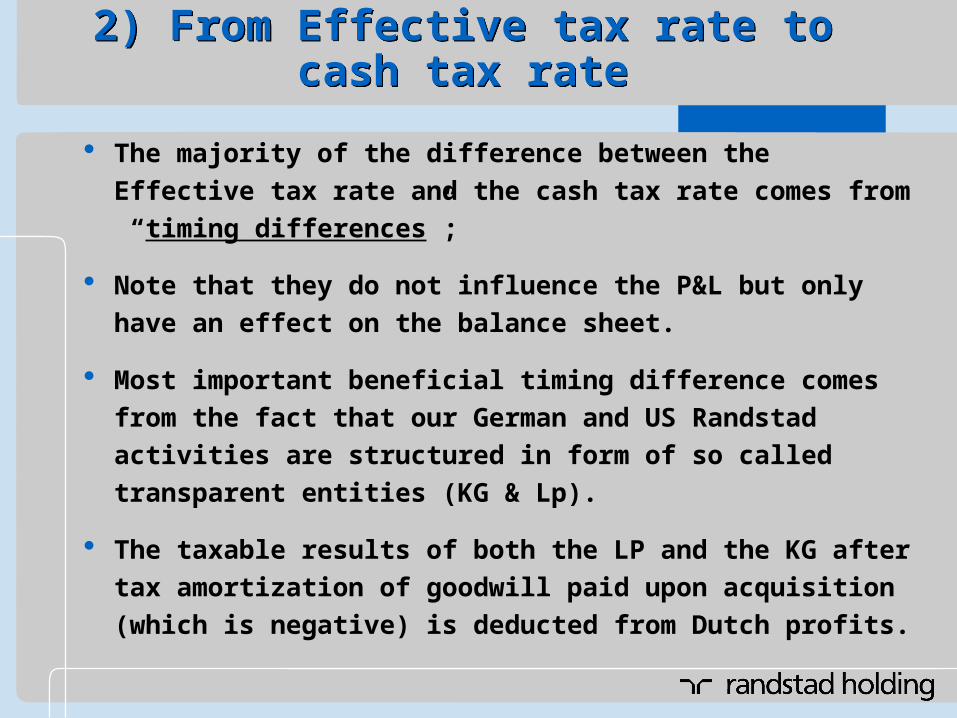
2) From Effective tax rate to cash tax rate2) From Effective tax rate to cash tax rate
The majority of the difference between the Effective tax rate
and the cash tax rate comes from “timing differences”;
Note that they do not influence the P&L but only have an effect
on the balance sheet.
Most important beneficial timing difference comes from the
fact that our German and US Randstad activities are structured
in form of so called transparent entities (KG & Lp).
The taxable results of both the LP and the KG after tax
amortization of goodwill paid upon acquisition (which is
negative) is deducted from Dutch profits.

2.a. US and German transparent structure2.a. US and German transparent structure
RandstadHolding nv
ForeignSubsidiaryForeign
SubsidiaryForeignSubsidiaryForeign
Subsidiary
100%
RandstadHolding
Nederland bv
RandstadNorth America
LP
RandstadDeutschland
KG
Tax losses including to goodwill amortization -/-
Taxable profits from Dutch operations +/+
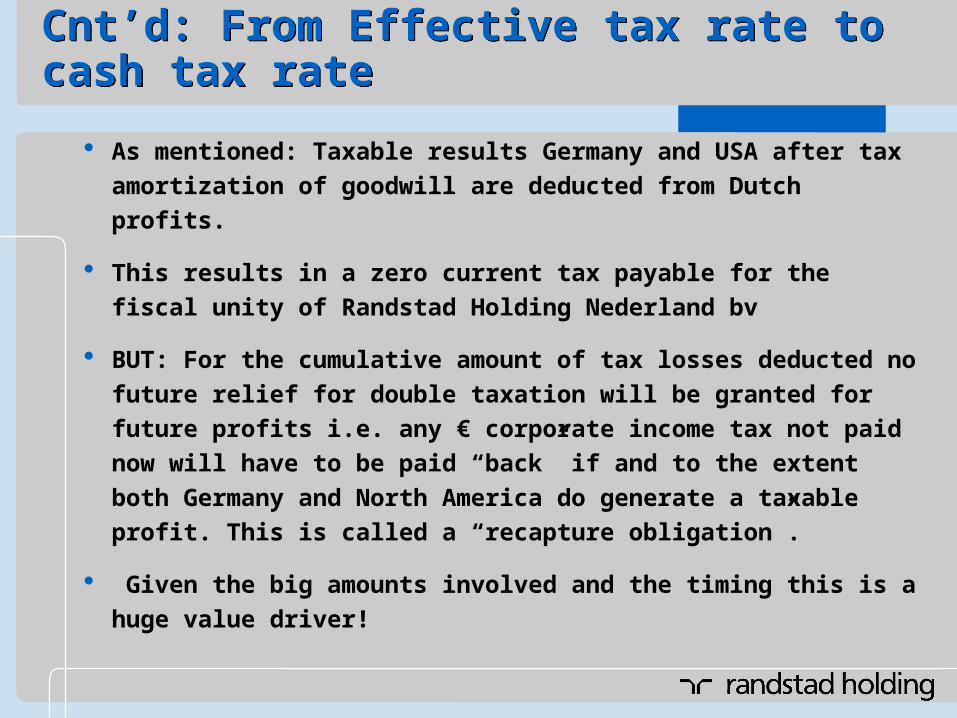
Cnt’d: From Effective tax rate to cash tax rateCnt’d: From Effective tax rate to cash tax rate
As mentioned: Taxable results Germany and USA after tax
amortization of goodwill are deducted from Dutch profits.
This results in a zero current tax payable for the fiscal unity of
Randstad Holding Nederland bv
BUT: For the cumulative amount of tax losses deducted no
future relief for double taxation will be granted for future
profits i.e. any € corporate income tax not paid now will have to
be paid “back” if and to the extent both Germany and North
America do generate a taxable profit. This is called a
“recapture obligation”.
Given the big amounts involved and the timing this is a huge
value driver!
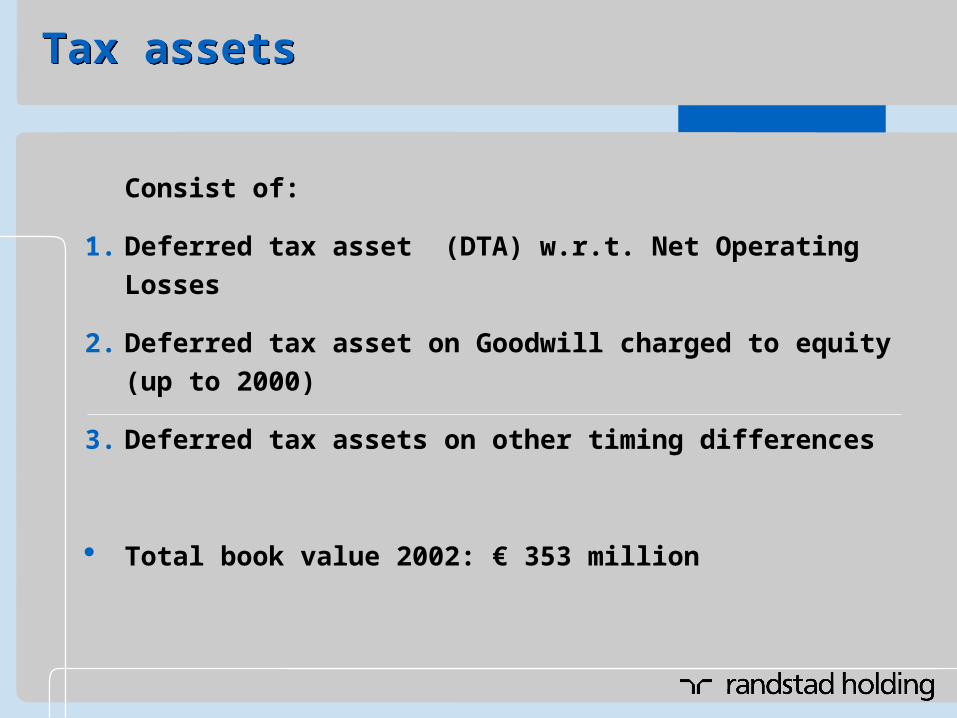
Tax assetsTax assets
Consist of:
1. Deferred tax asset (DTA) w.r.t. Net Operating Losses
2. Deferred tax asset on Goodwill charged to equity (up to 2000)
3. Deferred tax assets on other timing differences
Total book value 2002: € 353 million

Valuation Valuation
Valuation allowance as per ultimo 2002:
1. DTA on Goodwill: At acquisition a valuation allowance was made with a view to the long amortization period for tax purposes (being 15 years in Germany and the USA).
2. DTA Net Operating Losses: prudent valuation, based on annual estimation of future taxable results over a reasonable period
Up to 2002 this resulted in:
Partial release of valuation allowance on DTA w.r.t. Goodwill;
Additions to valuation allowance on DTA w.r.t. NOL’s
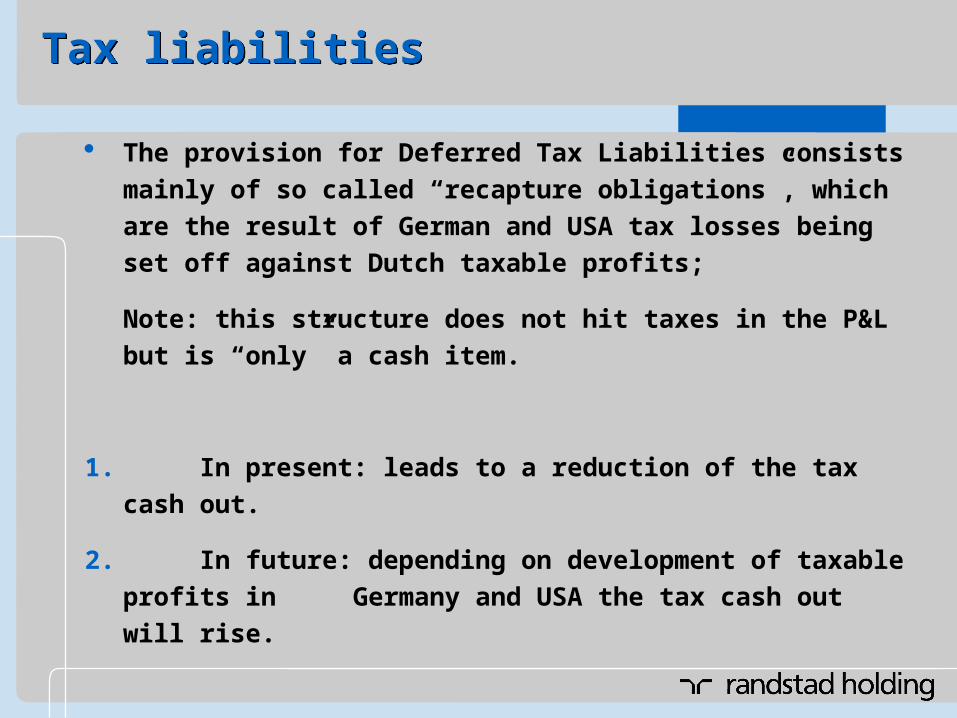
Tax liabilitiesTax liabilities
The provision for Deferred Tax Liabilities consists mainly of
so called “recapture obligations”, which are the result of
German and USA tax losses being set off against Dutch
taxable profits;
Note: this structure does not hit taxes in the P&L but is “only”
a cash item.
1. In present: leads to a reduction of the tax cash out.
2. In future: depending on development of taxable profits
in Germany and USA the tax cash out will rise.

Effective tax rate 2002Effective tax rate 2002
Effective tax rate 2002 30.2%
Average applicable rate 29.2%
Permanent Differences (tax exempt) -22.7%
Changes in valuation of tax losses 34.6%
Release of val. all. On DTA wrt Goodwill -17.8%
Non-deductible items 6.6%
Total 30.2%

IFRS implementationIFRS implementation
Randstad has to apply IFRS as from 2005
Starting with the first quarterly report 2005
Comparative figures 2004 must be “comparable”
Material effects of differences between present GAAP and IFRS on equity and P&L to be communicated with interim results 2004
A number of changes of international standards and interpretations are pending or still expected between today and early 2004. These changes will effect final transition.
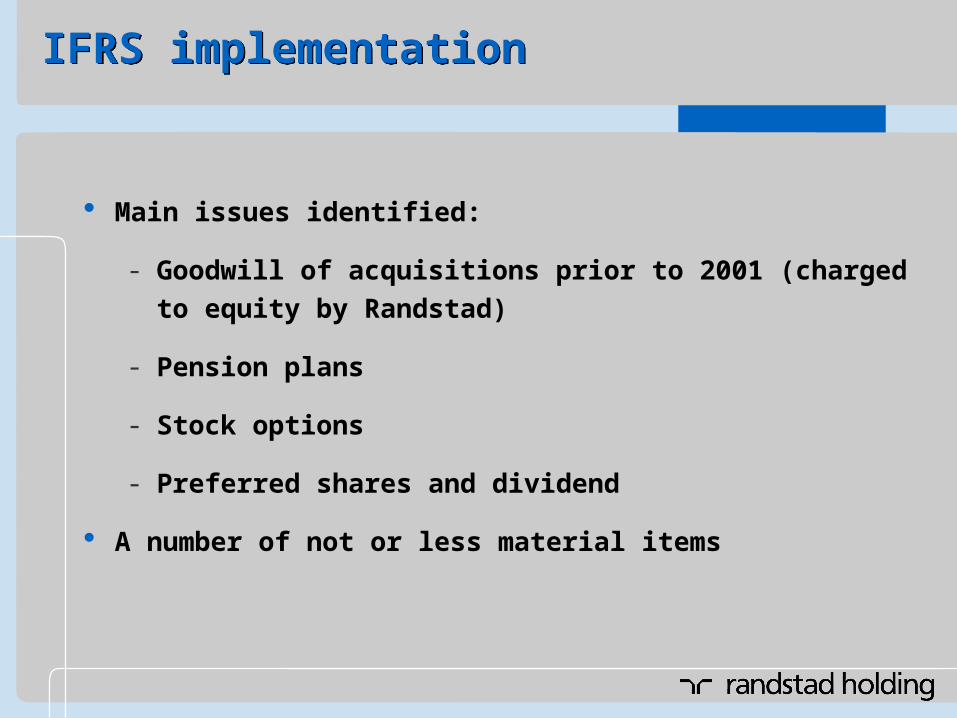
IFRS implementationIFRS implementation
Main issues identified:
- Goodwill of acquisitions prior to 2001 (charged to equity by
Randstad)
- Pension plans
- Stock options
- Preferred shares and dividend
A number of not or less material items

Thank you!
Any questions?
Thank you!
Any questions?
The UK staffing marketThe UK staffing market
Hans Hoogeveen
Managing director Randstad UK

UK marketUK market
Market volume: € 30.8 billion
92% temporary business, 8% permanent business
>3% penetration
Market mature but unprofessional
Fragmented market: 85% of companies independent
Top 10 players only 36% market share
Image flexwork and flexworker very low
UK flexible labor market increasingly driven by EU labor legislation

History of Randstad UKHistory of Randstad UK
Established in the UK in 1989
1999: 18 branches and £ 18 million turnover
2001: 36 branches and £ 34.5 million turnover
2001: acquisition of Securicor Recruitment Services
2002: over 85 branches and £ 104 million turnover
Top 25 recruitment company
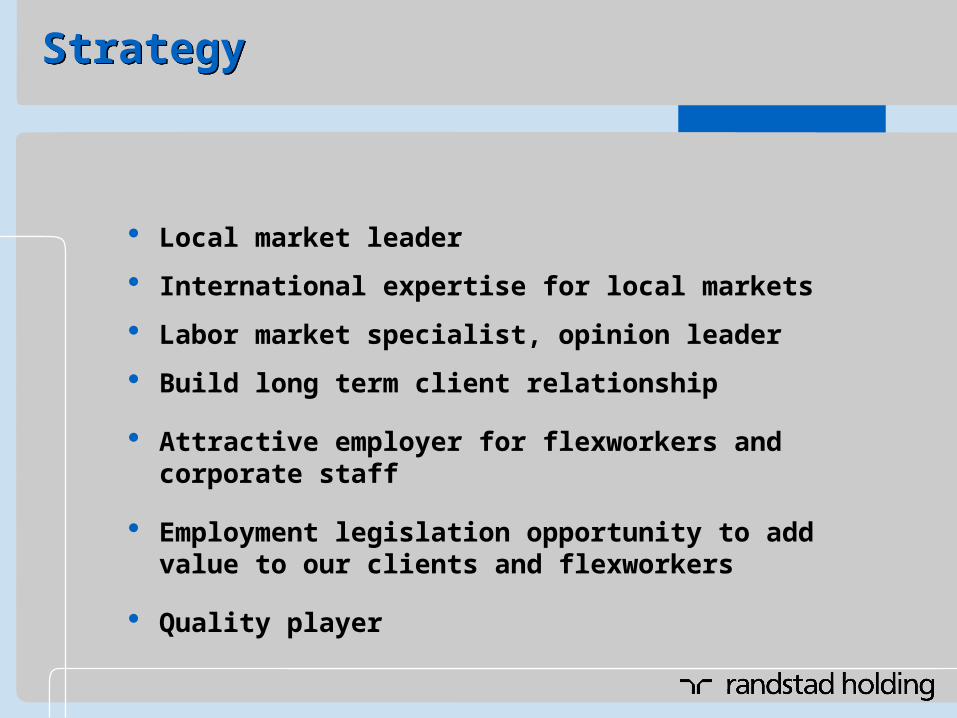
StrategyStrategy
Local market leader
International expertise for local markets
Labor market specialist, opinion leader
Build long term client relationship
Attractive employer for flexworkers and corporate staff
Employment legislation opportunity to add value to our clients and flexworkers
Quality player
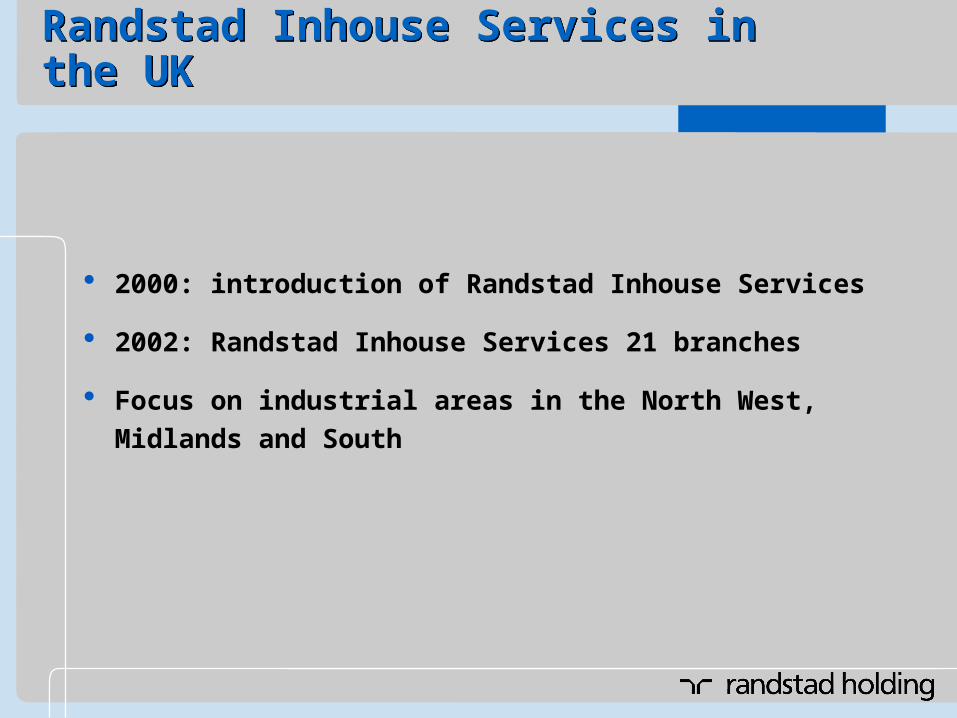
Randstad Inhouse Services in the UKRandstad Inhouse Services in the UK
2000: introduction of Randstad Inhouse Services
2002: Randstad Inhouse Services 21 branches
Focus on industrial areas in the North West, Midlands and
South

Yacht in the UKYacht in the UK
Restart in the UK in 2003
Solely focused on attracting engineers in the utilities and
infrastructure sectors
Concentrating on clients in North West, North East and
West Midlands

Superior BrandSuperior Brand
Implementation of corporate identity with tag line ‘good to
know you’ completed
Cardiff branch pilot for new branch corporate identity
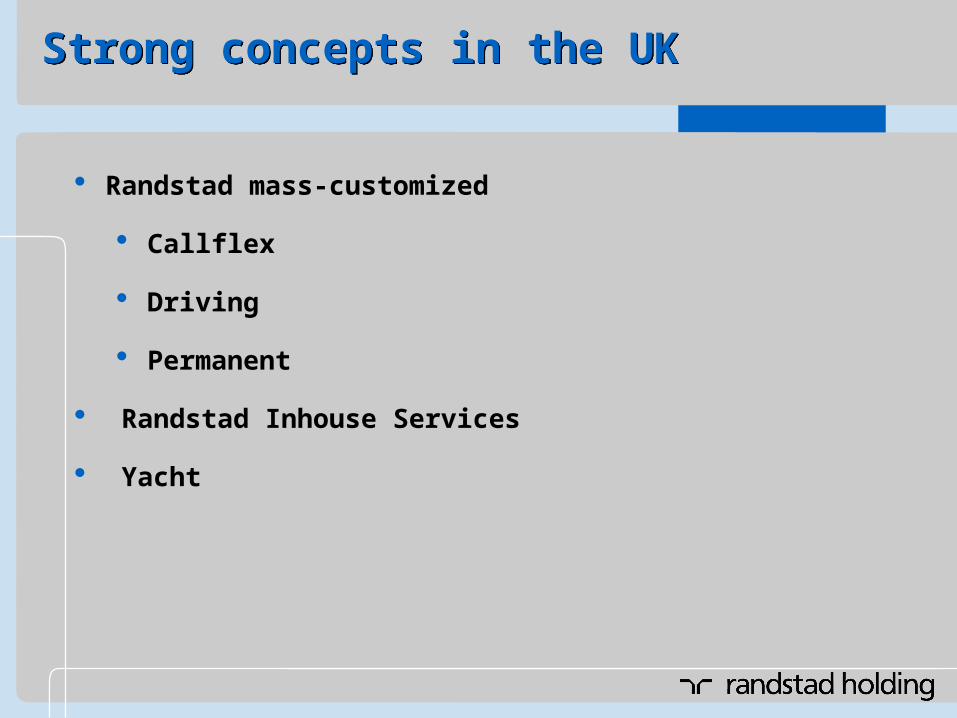
Strong concepts in the UKStrong concepts in the UK
Randstad mass-customized
Callflex
Driving
Permanent
Randstad Inhouse Services
Yacht
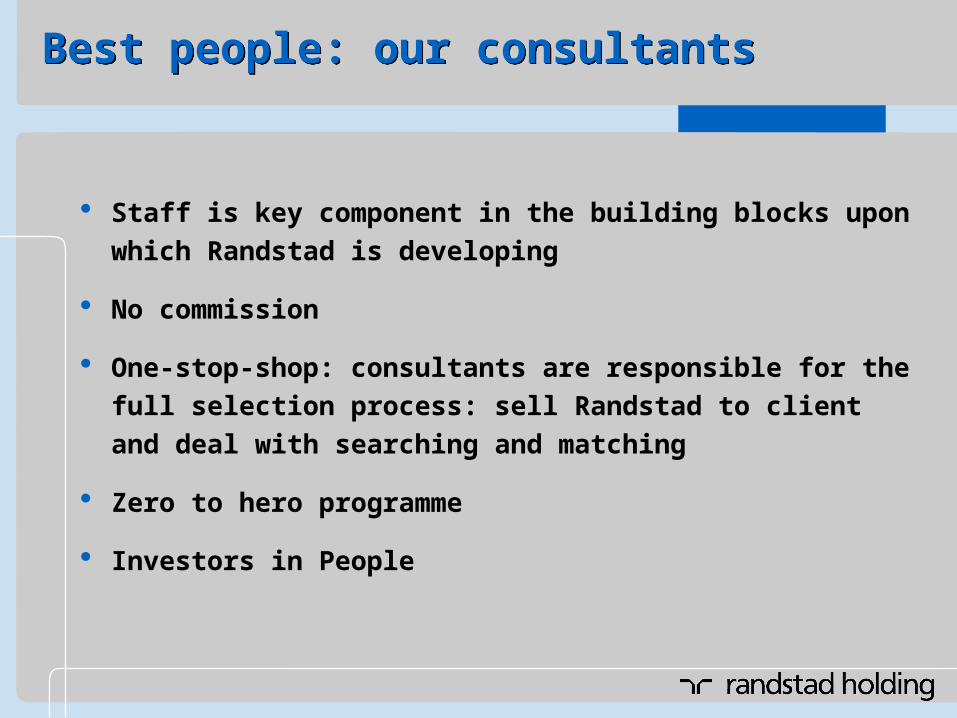
Best people: our consultantsBest people: our consultants
Staff is key component in the building blocks upon which
Randstad is developing
No commission
One-stop-shop: consultants are responsible for the full
selection process: sell Randstad to client and deal with
searching and matching
Zero to hero programme
Investors in People
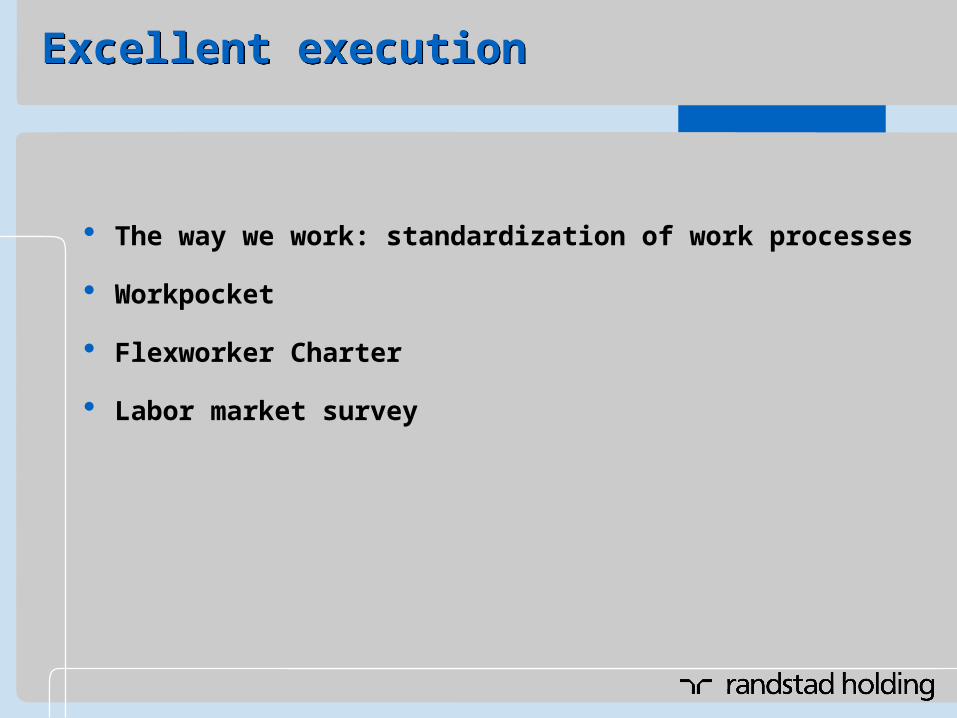
Excellent executionExcellent execution
The way we work: standardization of work processes
Workpocket
Flexworker Charter
Labor market survey
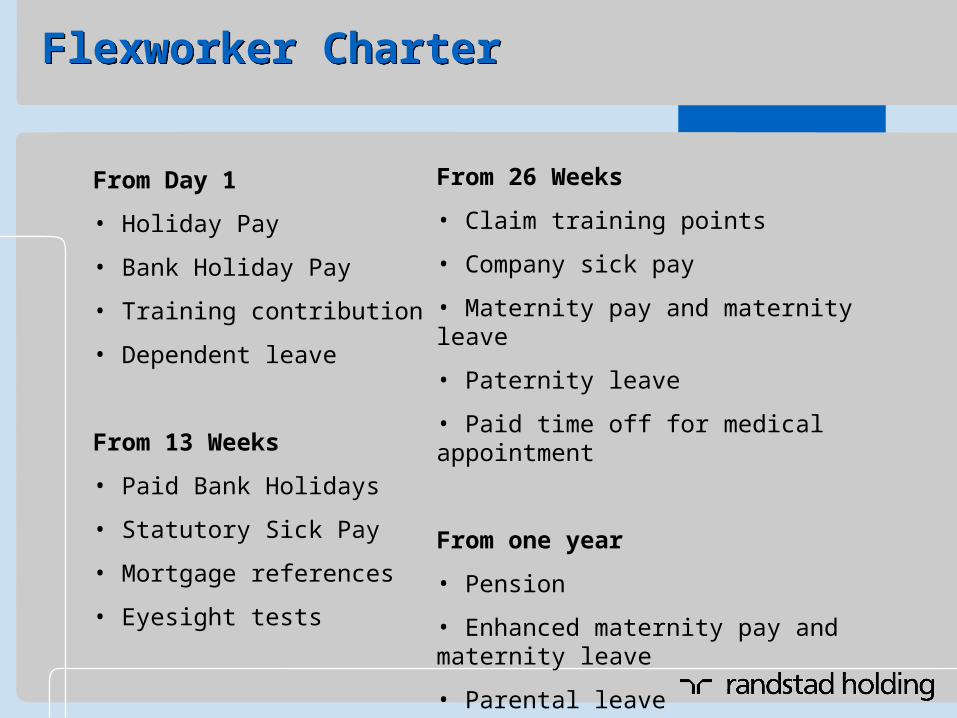
Flexworker CharterFlexworker Charter
From Day 1
• Holiday Pay
• Bank Holiday Pay
• Training contribution
• Dependent leave
From 13 Weeks
• Paid Bank Holidays
• Statutory Sick Pay
• Mortgage references
• Eyesight tests
From 26 Weeks
• Claim training points
• Company sick pay
• Maternity pay and maternity leave
• Paternity leave
• Paid time off for medical appointment
From one year
• Pension
• Enhanced maternity pay and maternity leave
• Parental leave
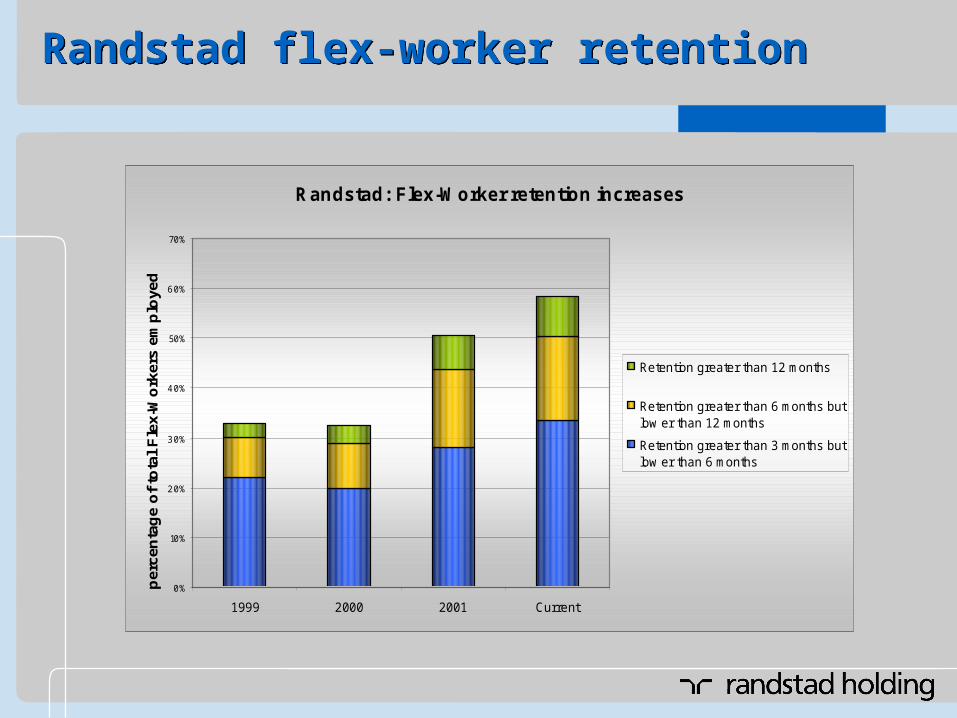
Randstad flex-worker retentionRandstad flex-worker retention
Randstad: Flex-Worker retention increases
0%
10%
20%
30%
40%
50%
60%
70%
1999 2000 2001 Current
per
cen
tag
e o
f to
tal
Fle
x-W
ork
ers
emp
loye
d
Retention greater than 12 months
Retention greater than 6 months butlow er than 12 months
Retention greater than 3 months butlow er than 6 months
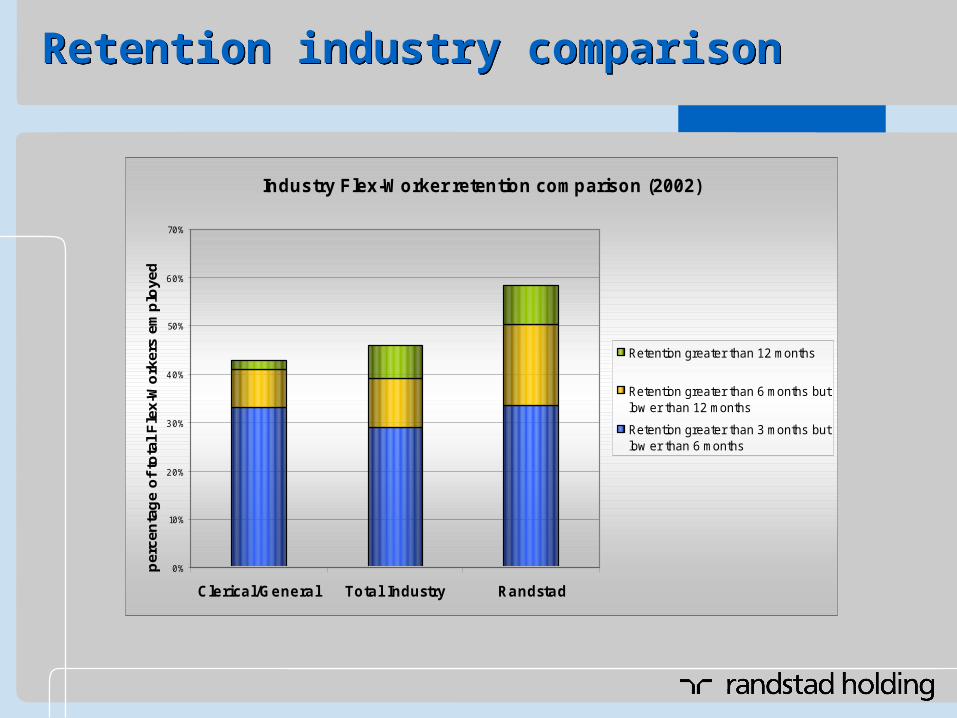
Retention industry comparisonRetention industry comparison
Industry Flex-Worker retention comparison (2002)
0%
10%
20%
30%
40%
50%
60%
70%
Clerica l/Genera l Tota l Industry Randstad
per
cen
tag
e o
f to
tal
Fle
x-W
ork
ers
emp
loye
d
Retention greater than 12 months
Retention greater than 6 months butlow er than 12 months
Retention greater than 3 months butlow er than 6 months
Randstad labor market surveyRandstad labor market survey
Positive outlook on employment market
Use of non-permanent workers
Ways to attract and retain staff
The UK working week
Staff loyalty
Impact of legislation

Thank you!
Any questions?
Thank you!
Any questions?
Randstad in the USRandstad in the US
Jim Reese
Member of the Executive Board
CEO Randstad North America
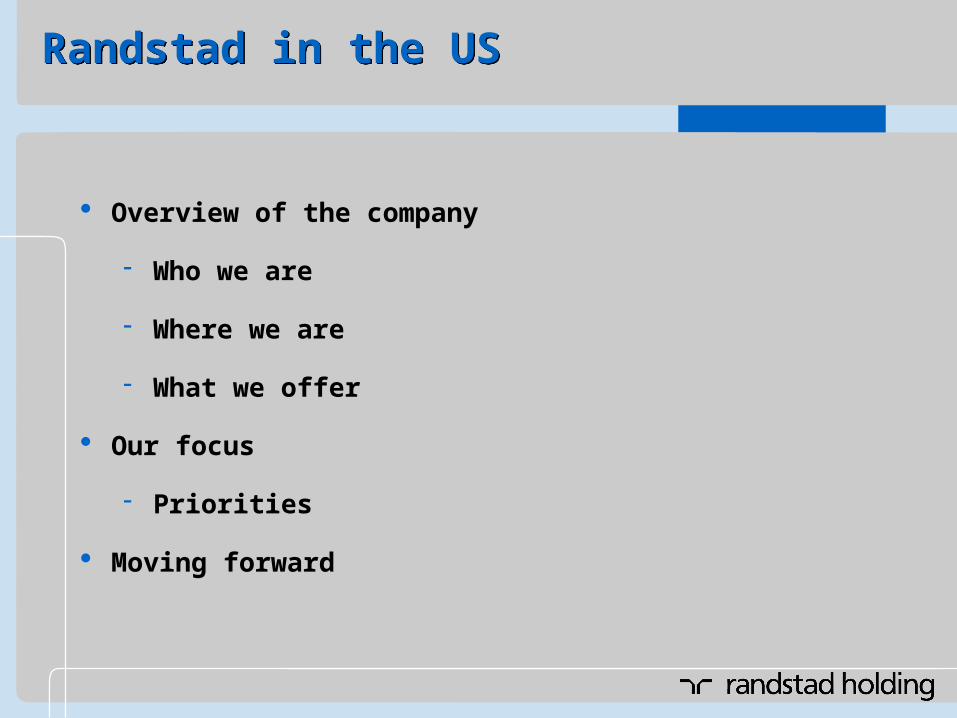
Randstad in the USRandstad in the US
Overview of the company
Who we are
Where we are
What we offer
Our focus
Priorities
Moving forward
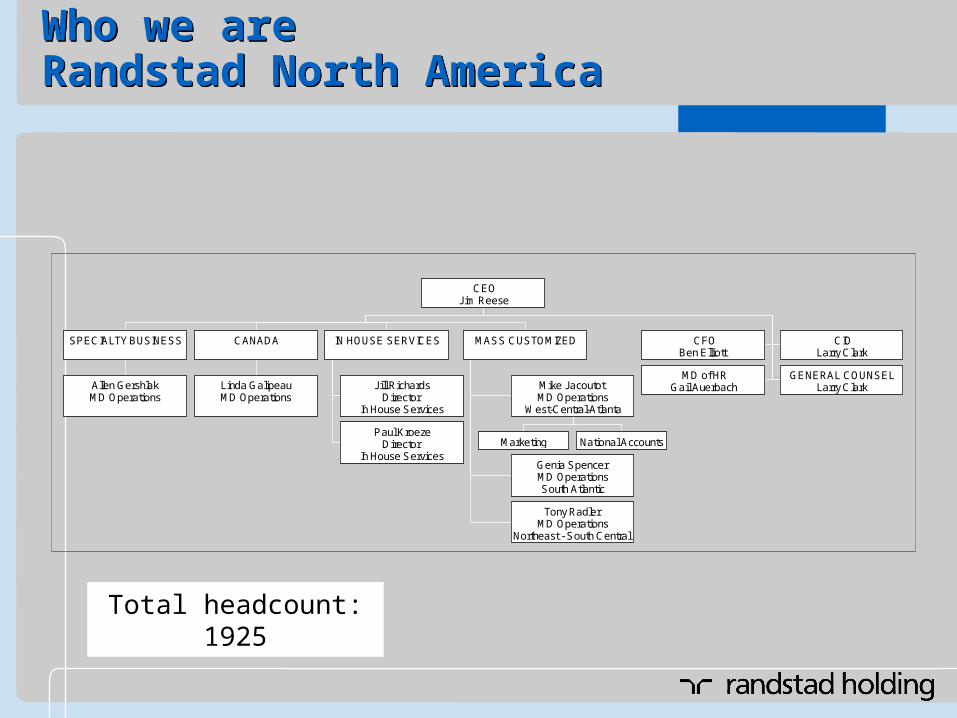
Who we are Randstad North AmericaWho we are Randstad North America
CEOJim Reese
SPECIALTY BUSINESS
Allen GershlakMD Operations
CANADA
Linda GalipeauMD Operations
IN HOUSE SERVICES
Jill RichardsDirector
In House Services
Paul KroezeDirector
In House Services
MASS CUSTOMIZED
Mike JacoutotMD Operations
West-Central-Atlanta
Marketing National Accounts
Genia SpencerMD OperationsSouth Atlantic
Tony RadlerMD Operations
Northeast - South Central
CFOBen Elliott
CIOLarry Clark
MD of HRGail Auerbach
GENERAL COUNSELLarry Clark
Total headcount: 1925

Randstad North America Divisions
357 TOTAL BRANCHES
113 TOTAL ON-SITES
West/Atlanta/Central Division (106)
South Atlantic Division (141)
Northeast South/Central Division (96)
Canadian Division (14)
States/ provinces w/o RNA Offices
Randstad North America On-sites (113)
521
3
2
20
4
5
20
1
6
1
2
7
15
4
2
12
9
7
6
35
2 2 40
17
8
221
2
6
18(1) 3 (3)
14(5)
16
31
DC: 6(1)
9(7)
(6)
(1)
(1)
(6)
(1)(2)
(1)
(1) (3)(18)
(18)
(6)
(2)(18)
(1)
(1)
(4)
(2)
(2)
(2)
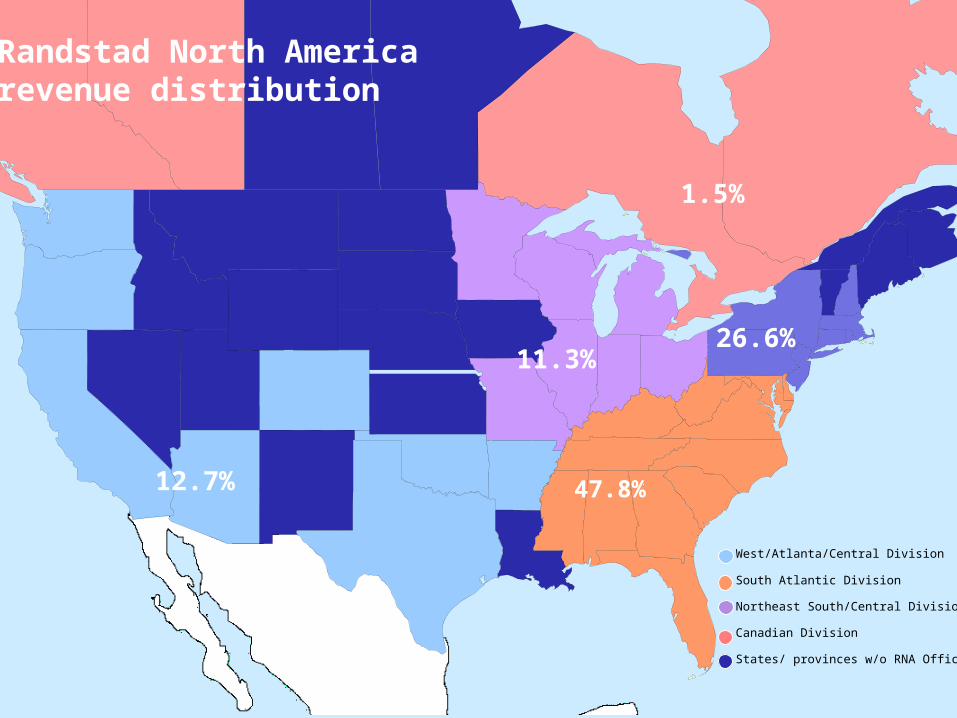
Randstad North America revenue distribution
West/Atlanta/Central Division
South Atlantic Division
Northeast South/Central Division
Canadian Division
States/ provinces w/o RNA Offices
1.5%
47.8%12.7%
11.3%26.6%

What we offerWhat we offer
Mass-customized concept: Office, Industrial, IT, Creative and Professional
Randstad Inhouse Services:Manufacturing, Logistics, Warehousing
STRATEGY: DIFFERENTIATORS:
Strong concepts Same people – Sell and service
Best people Local people – Local decisions
Excellence in execution Right people – Talent focus
Superior brands Smart people – Better solutions
Must compete with local, regional and national competitors
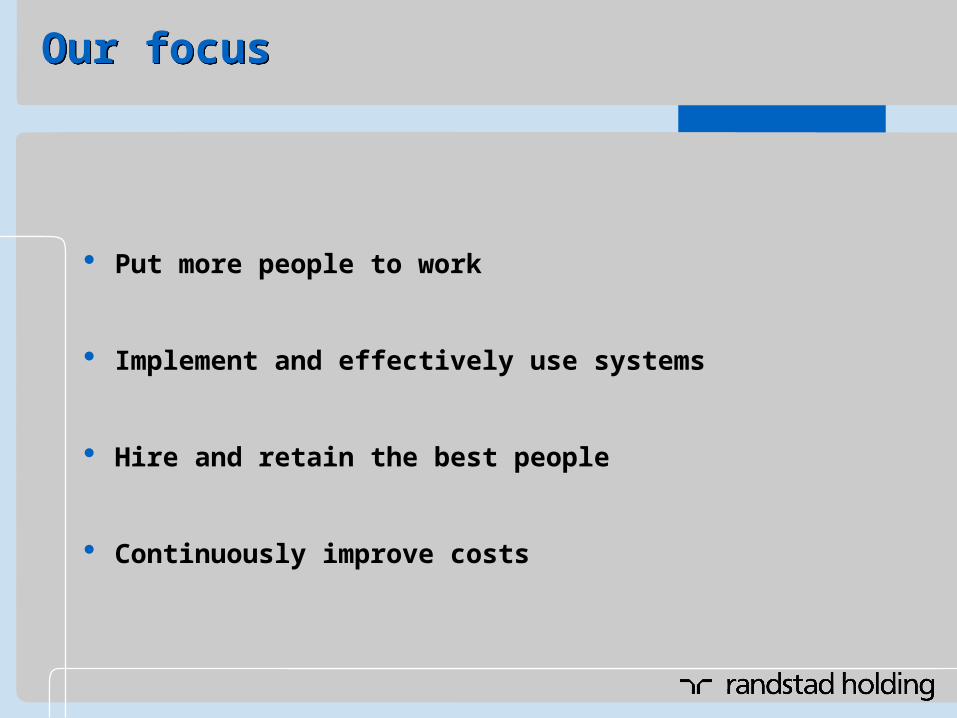
Our focusOur focus
Put more people to work
Implement and effectively use systems
Hire and retain the best people
Continuously improve costs
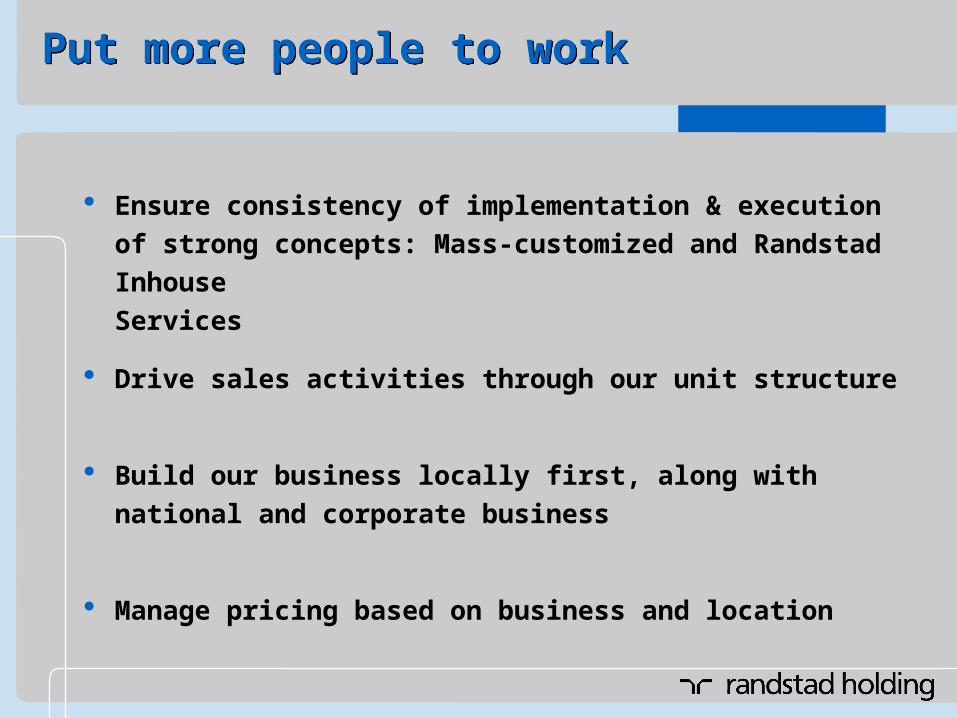
Put more people to workPut more people to work
Ensure consistency of implementation & execution
of strong concepts: Mass-customized and Randstad Inhouse
Services
Drive sales activities through our unit structure
Build our business locally first, along with national and
corporate business
Manage pricing based on business and location
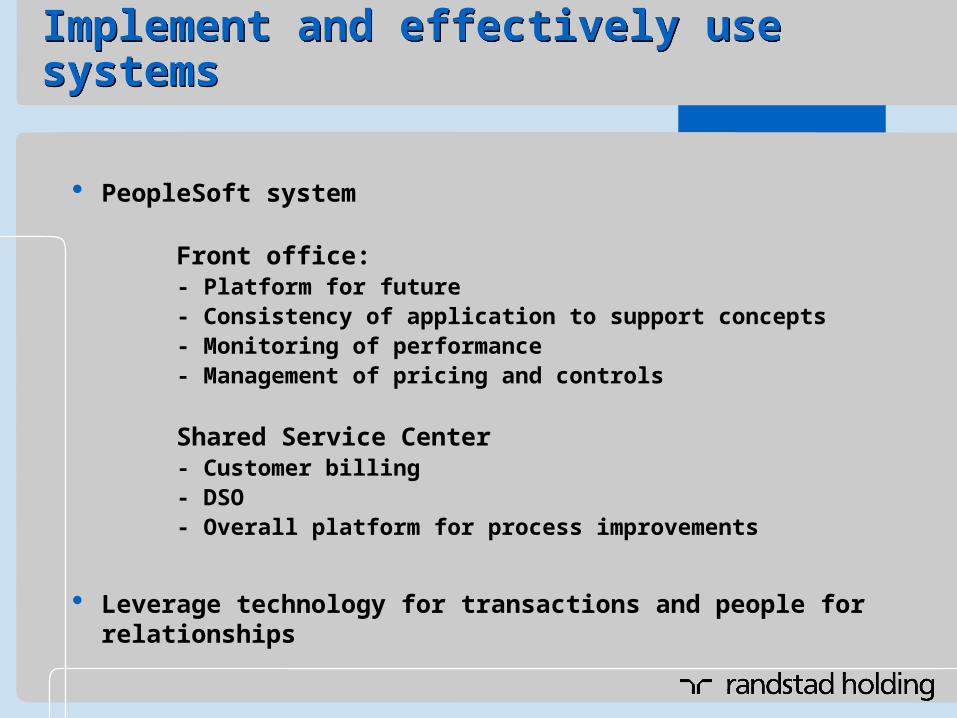
Implement and effectively use systemsImplement and effectively use systems
PeopleSoft system
Front office:- Platform for future- Consistency of application to support concepts- Monitoring of performance- Management of pricing and controls
Shared Service Center- Customer billing- DSO- Overall platform for process improvements
Leverage technology for transactions and people for relationships

Retain and hire the best peopleRetain and hire the best people
Hire the best people to match concept expectations
Training and development
- New hires- Managers- High performers
Communication
Rewards and recognition
Staff retention

Continuously improve costsContinuously improve costs
Drive efficiency with technology platform
Shared Service Center
- Continue to drive DSO improvement
Improve overall productivity
Leverage purchasing power
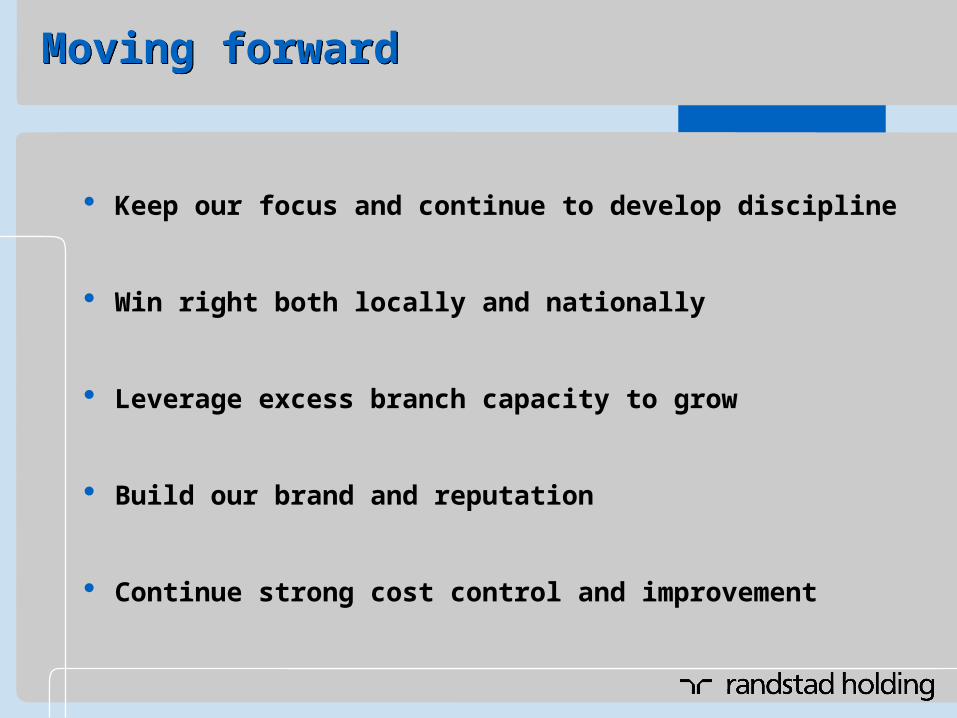
Moving forwardMoving forward
Keep our focus and continue to develop discipline
Win right both locally and nationally
Leverage excess branch capacity to grow
Build our brand and reputation
Continue strong cost control and improvement

Thank you!
Any questions?
Thank you!
Any questions?
Concluding remarksConcluding remarks
DisclaimerDisclaimerDisclaimerDisclaimer
Certain statements in this document comprise forecasts on Randstad Holding’s future financial condition and results from operations and certain plans and goals. By their nature, such forecasts generate risk and uncertainty because they concern events in the future and depend on circumstances which then apply.
Any number of factors can cause actual results and developments to deviate from those expressed in the forecasts stated here. Such factors can be, but are not limited to, general economic conditions, scarcity on the employment market, the variation in the demand for (flexible) personnel, changes in employment legislation, future currency exchange rates and interest rates, future corporate mergers, acquisitions and divestments and the speed of technical change.
The forecasts speak only as at the date of this document.