www.its.berkeley.edu/volvocenter environmental impacts of e-bikes in chinese cities baq 2006...
TRANSCRIPT

www.its.berkeley.edu/volvocenter
Environmental Impacts of E-bikes in Chinese Cities
BAQ 2006Sub-workshop 16: Tailpipe Emissions from 2-3 WheelersDecember 14, 2006
Christopher R. CherryPhD CandidateInstitute of Transportation StudiesUniversity of California, Berkeley
Jonathan WeinertPhD CandidateInstitute of Transportation StudiesUniversity of California, Davis
Chaktan MaGraduate ResearcherInstitute of Transportation EngineeringTsinghua University
Partnership with: Pan Haixiao-Tongji University Xiong Jian-Kunming University of Science and Technology Yang Xinmiao-Tsinghua University

www.its.berkeley.edu/volvocenter
Outline
• Brief Introduction
• Research Objective
• Approach, Methodology, Data
• Results
• Future Research

www.its.berkeley.edu/volvocenter
Emergence of Electric Two-Wheelers in large Chinese Cities
Most large Chinese cities have banned or heavily restricted gasoline motorcycles in the city center. In response, electric bicycles and scooters that can ride in the bike lane have gained popularity and mode share.
0
2,000,000
4,000,000
6,000,000
8,000,000
10,000,000
12,000,000
Pro
duct
ion (unit) .
E-bikes
All Autos
Personal Cars
Sources: Jamerson (2004) LuYuan Electric Bike Company (2006), Yu (2004), China Statistical Yearbook (2005)

www.its.berkeley.edu/volvocenter
Emergence of Electric Bicycles in large Chinese Cities
• Several cities have (attempted) bans on e-bikes– Guangzhou, Beijing, Fuzhou
• What are the effects of these bikes on the transportation system? – Environmental implications
• Energy use and emissions– -Production and Use
• Hazardous Waste-Lead Acid Batteries
– Safety of electric bikes and others in lanes– Congestion– Increased mobility and accessibility
• Compared to what modes?

www.its.berkeley.edu/volvocenter
Research Objective-Approach
• Identify Life-cycle environmental impacts of e-bikes in Chinese cities (production, use, disposal)– Energy– Emissions
• Compared to what modes? Bus and Bike

www.its.berkeley.edu/volvocenter
Environmental Impacts-Production
• Production Energy Use and Emissions
– Raw Materials – Energy intensities
and emission intensities from raw material production
– Assembly Processes
– Assumes 5 batteries over lifespan, and 3 sets of tires (10 year lifespan)
Sources: China statistical yearbook (2004, 2005), China industrial yearbook (2004), China Data Online, Mao et al. (2006), Price et al. (2001)
TABLE 1: Material Inventory, Emissions and Energy Use
Associated Energy and Emissions of Manufacturing Processes
BSEB SSEB
Energy Use (tonne SCE) 0.178 0.260
Energy Use (kWh) 1449 2117
Greenhouse Gas (Tonne CO2eq) 0.599 0.865
Air Pollution (SO2) (kg) 1.561 2.194
Air Pollution (PM) (kg) 5.817 8.158
Waste Water (kg) 1486 2086
Solid Waste (kg) 4.457 7.127

www.its.berkeley.edu/volvocenter
Environmental Impacts-Use • SSEB E-bike Energy Use
1.3kWh/100km– 6.6% electricity transmission loss (national
average), 6.1% in-plant electricity use– 50,000 km life=735kWh=0.09 tonne SCE
• Emissions from Electricity Production– Kunming1: 52% hydro, 48% coal– Shanghai: 2% hydro, 98% coal– All China: 15% hydro, 75% coal, 8% gas,
2% nuclear
1. China Statistical Yearbook 2005, Energy Foundation China 2005
Electric bike Emissions (g km-1)
Kunming Shanghai All China
SO2 0.076 0.156 0.119
NOX 0.017 0.035 0.027
PM 0.004 0.008 0.006
CO2 6.961 14.342 11.474
www.its.berkeley.edu/volvocenter
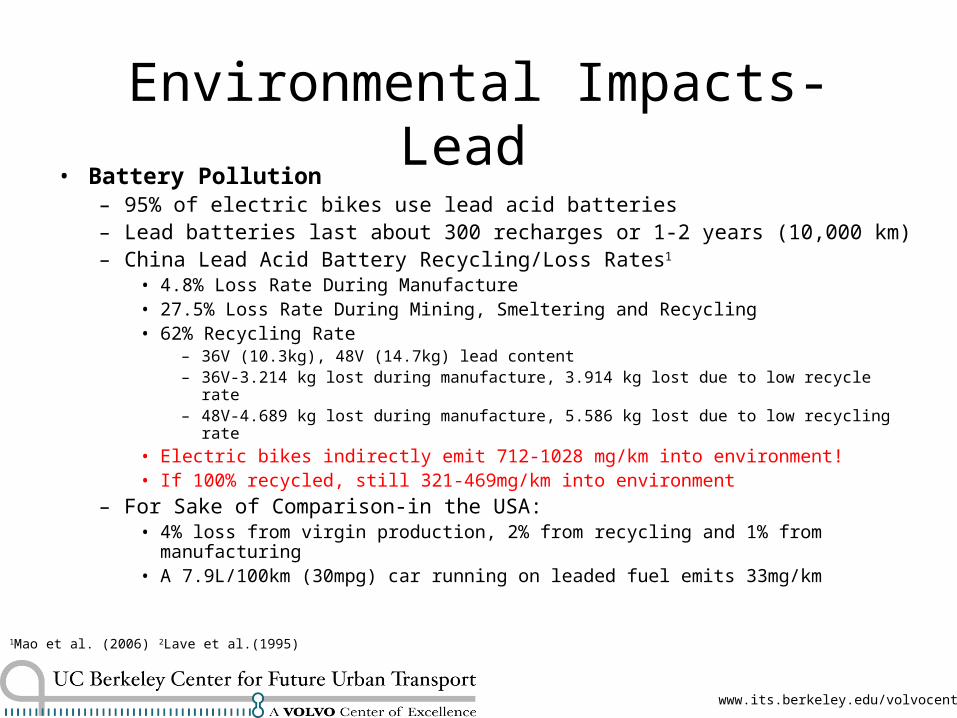
Environmental Impacts-Lead • Battery Pollution
– 95% of electric bikes use lead acid batteries – Lead batteries last about 300 recharges or 1-2 years (10,000 km)– China Lead Acid Battery Recycling/Loss Rates1
• 4.8% Loss Rate During Manufacture• 27.5% Loss Rate During Mining, Smeltering and Recycling• 62% Recycling Rate
– 36V (10.3kg), 48V (14.7kg) lead content– 36V-3.214 kg lost during manufacture, 3.914 kg lost due to low recycle rate– 48V-4.689 kg lost during manufacture, 5.586 kg lost due to low recycling rate
• Electric bikes indirectly emit 712-1028 mg/km into environment!• If 100% recycled, still 321-469mg/km into environment
– For Sake of Comparison-in the USA: • 4% loss from virgin production, 2% from recycling and 1% from manufacturing• A 7.9L/100km (30mpg) car running on leaded fuel emits 33mg/km
1Mao et al. (2006) 2Lave et al.(1995)

www.its.berkeley.edu/volvocenter
Lifecycle Impacts Figure 4: Life Cycle Energy and Emissions-SSEB
0%
10%
20%
30%
40%
50%
60%
70%
80%
90%
100%
En
erg
y U
se(t
on
ne
SC
E)
Gre
en
ho
use
Ga
s (T
on
ne
CO
2e
q)
Air
Po
llutio
n(S
O2
) (k
g)
Air
Po
llutio
n(P
M)
(kg
)
Wa
ste
Wa
ter
(kg
)
So
lid W
ast
e(k
g)
Ha
zard
ou
sW
ast
e (
kg)
Disposal
Use
Fuel Production
Production
0.37 1.53 8.20 8.75 2234 38.87 50.67

www.its.berkeley.edu/volvocenter
What Are E-biker’s Alternatives? • The net environmental impacts are relative
to the next best alternatives.– 3 E-bike surveys conducted in Spring 2006
• Shanghai, Kunming, Shijiazhuang
– Vast majority of respondents would shift to bus or bicycle if e-bikes banned
– Bicycles are most benign-zero use emissions and low production emissions
– Buses are big polluters, but also big people movers
Image source: Cervero (2005)

www.its.berkeley.edu/volvocenter
Bus Emissions Comparative Emissions of Chinese Buses and E-bikes
Use Phase Only Full Lifecycle
Bus 1
(g km-1)Bus
(g pax-1 km-1)
SSEB(all China)
(g pax-1 km-1)
SSEB(all China)
(g pax-1 km-1 )
CO 7.97 0.159 Unknown Unknown
CO2 1275 25.49 11.47 30.60
HC 0.728 0.015 Unknown Unknown
NOX 13.51 0.270 0.027 Unknown
SO2 0.073 0.0015 0.119 0.164
PM 0.769 0.015 0.006 0.175
Lead (Pb) 0.248 0.005 0.862 0.862
• Majority of E-bike environmental impact during production phase
• Majority of Bus impact during use phase
1 Air Resources Board (2001, 2002), Nylund and Erkkila (2005), Embarq (2006)

www.its.berkeley.edu/volvocenter
Other Impacts of E-bikes• Other impacts:
– contribution to congestion?• Are e-bikes any worse than bicycles?
– safety?• Crash/fatality rate much lower than cars, slightly higher than
bicycles
– mobility and accessibility?• Buses cannot provide equal levels of personal mobility in Chinese
cities-access and egress lost time

www.its.berkeley.edu/volvocenter
Job Accessibility in Kunming-20 Min

www.its.berkeley.edu/volvocenter
Conclusions• Rather than ban e-bikes, target regulation toward
problematic areas– Lead battery tax=“pull” industry toward better batteries
• E-bikes in infancy and performance will improve– Need predictable standards/regulation for industry to invest in R&D– Longer lifespan and better technology
• Could delay car ownership• Must consider benefits of e-bikes in policy analysis• Some things e-bike industry cannot fix
– Electricity production industry– Raw material production industries (lead and steel)

www.its.berkeley.edu/volvocenter
Future Work• Public Health Effects of Local vs. Regional Emissions• Investigate Full Life Cycle of Alternative Modes• Identify Regional Impact of E-bike Use and Project Future
Technologies (battery, power plant) and Impacts• Investigate Other Externalities
– Safety– Congestion– Accessibility
• Questions?• Contact: [email protected]
www.ce.berkeley.edu/~cherry