www.cfib.ca communities in boom: ted mallett vp & chief economist feb 19, 2013 levering growth...
TRANSCRIPT

www.cfib.ca
Communities in Boom:
Ted MallettVP & Chief Economist
Feb 19, 2013
Levering growth through entrepreneurship

www.cfib.ca
About CFIB
Non-partisan lobby group representing privately owned businesses
109,000 members, all industry sectors, regions
100% financed by membership, no government or sponsorship revenues

www.cfib.ca
Recent CFIB accomplishments
Raising public awareness of value of entrepreneurship
Regulatory budget with hard targets
Tax credit for expanded payrolls
Protection or enhancement of small biz tax CIT
Protection of lifetime capital gains exemptions.
Holding lid on damaging CPP reforms
Small Business Saturday

www.cfib.ca
What Main Street looks like
Not just the retail strip, includes industrial parks, class B office towers and rural backyards
Roughly half the economy
99% of businesses
An entrepreneur lives next door

www.cfib.ca
SMEs defy generalization
Not a homogeneous sector
Leaders and followers
All personality types: Forward lookers, backward lookers, child geniuses, the naïve, anti-socials, über-socials, money-driven, cause-driven, technophiles, technophobes
There are winners and losers at any point of the business cycle
Boom Recession

www.cfib.ca
Axioms
Business churns, 30-60% every 5 years
Most jobs created in next ten years will be from businesses not yet started
<1% of businesses are fast growing
High growth firms are more common in low and medium tech sectors
How do we know? Can one pick winners?
Opportunity based entrepreneurship outranks necessity-based by 6 to 1
Entrepreneurial sweet spot age 45-65

www.cfib.ca
Reasons for Self-employment gains Technology for big business: doing more with
fewer employees
Technology for small businesses: more mobile, smaller unit sizes, better pricing
Demographics
Tax structure

www.cfib.ca
Employment trends, by org size
90
92
94
96
98
100
102
104
106
108
110
Employment indexed to pre-recession levels
Public Sector
Private sector 500+ empl
Private sector 20-499 empl
Private sector 0-19 empl
Self-employed
2008/Q3=100
www.cfib.ca
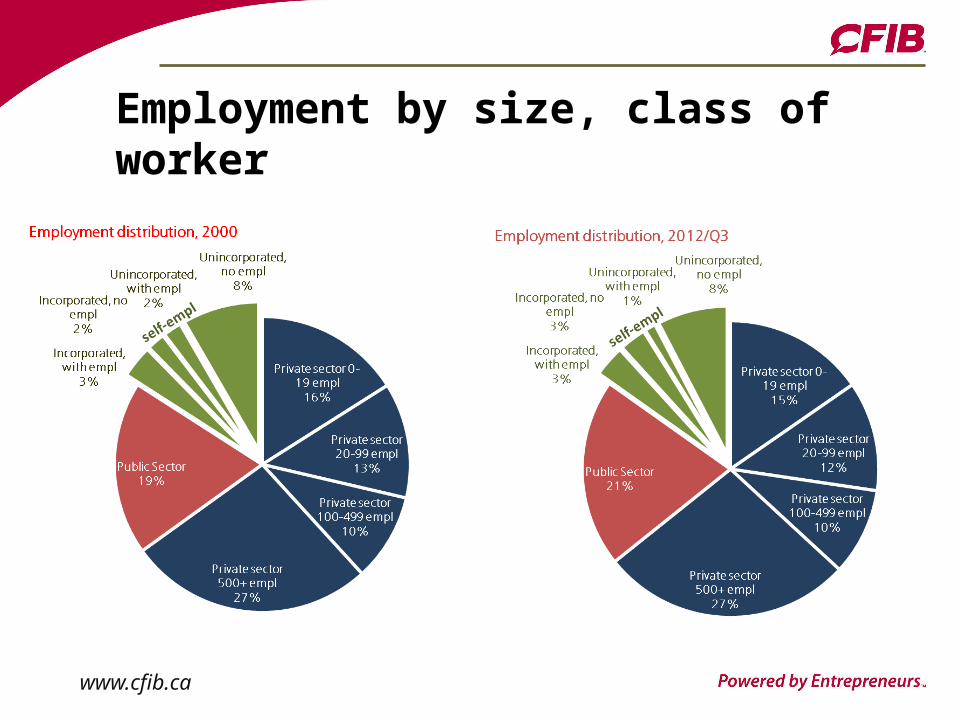
Employment by size, class of worker

www.cfib.ca
Employment Dynamics – Employees, 2008
Source: Statistics Canada, Longitudinal Employment Analysis Prgm, Cat 11-622-M no.025

www.cfib.ca
Employment Dynamics – 2008 data
Source: Statistics Canada, Longitudinal Employment Analysis Prgm, Cat 11-622-M no.025

www.cfib.ca
Employment Dynamics – 2008 data
Source: Statistics Canada, Longitudinal Employment Analysis Prgm, Cat 11-622-M no.025

www.cfib.ca
Employment Dynamics – 2008 data
Source: Statistics Canada, Longitudinal Employment Analysis Prgm, Cat 11-622-M no.025

www.cfib.ca
Entrepreneurship and GDP
Complex relationship
-’ve correlation with factor, efficiency based economies
+’ve correlation with innovation based economies
Source: Global Entrepreneurship Monitor

www.cfib.ca
Economy tied to small business confidence

www.cfib.ca
www.cfib.ca
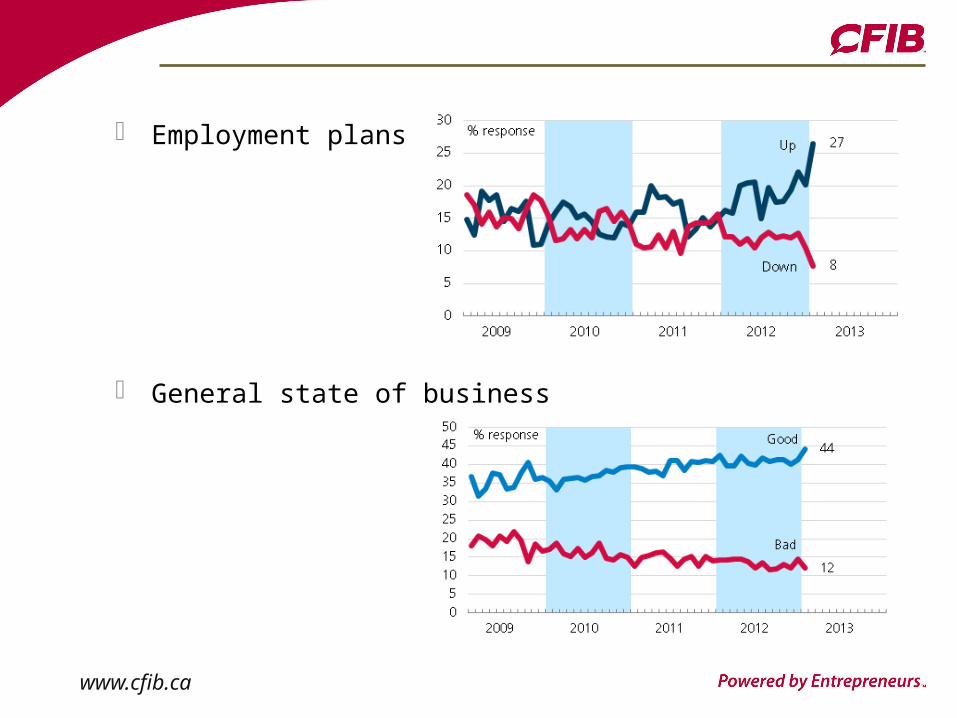
Employment plans
General state of business

www.cfib.ca
Communities in Boom
CFIB was approached by National Post to create an objective measurement of community entrepreneurship
We questioned if it was even possible
Recognized that success has many colours
Step 1 capture data
Step 2 organize
Emphasize high scores, not low ones

www.cfib.ca
Data Criteria
Connection with entrepreneurship
Available for all local economic regions (CMAs and CAs)
Consistent over time
Updated regularly
Unique dimension
Open to critique, new suggestions

www.cfib.ca
Standardization of data
Standardization ensures numbers are compared on same scale
Source data: highest figure given value of 100, lowest: zero. Middle scores given relative placement within that range

www.cfib.ca
Variables
Presence: 25pts % growth in #business establishments
Business establishments/capita
Self-employment / total employment
Industry diversity (goods-services mix)

www.cfib.ca
Variables
Perspective: 35pts 1-yr expected business performance
(%resp=stronger)
3-month full-time hiring expectations (%resp=‘add’)
Overall state of business (%resp=‘good)’
#building permits issued/capita
Life satisfaction (%resp=‘satisfied’)

www.cfib.ca
Variables
Policy: 40pts Concern – cost of local govt (%resp)
Concern – local govt awareness of smallbiz (%resp)
Concern – local govt regulations
Commercial /residential property tax
BizPal

www.cfib.ca
Results2012
Overall Score
Relative Strengths
Rank
Presence Perspective Policy
0-100
0-25 0-35 0-40 1 Grande Prairie 65
17 23 25
2 Saskatoon 64
13 22 29 3 Regina 62
11 25 26
4 Moose Jaw 61
12 19 30 5 Lloydminster 60
13 18 29
6 Red Deer 60 12 21 27 7 Prince Albert 59
11 18 30
8 Edmonton 59
15 19 25 9 Lethbridge 59
15 19 25
10 St. John's 57
9 22 26 11 Saint-Georges 57
11 21 25
12 Saint-Hyacinthe 57
12 22 23 13 Calgary 57
16 20 21
14 Wood Buffalo 55
10 21 24 15 Victoriaville 54 11 18 25 16 Sudbury 54 10 20 24 17 Québec 54
11 23 20
18 Alma 53
11 17 25 19 Shawinigan 53
11 17 25
20 Drummondville 53
12 16 25 21 Val-d'Or 53
10 20 23
22 Saguenay 53
10 23 20 23 Sault Ste. Marie 52
11 14 27
24 Toronto, excl. City 52
13 15 24 25 Rivière-du-Loup 52 11 18 23 26 Miramichi 52
11 18 23
27 Brandon 52
12 17 23 28 Granby 52
10 20 22
29 Sherbrooke 52
11 19 22 30 Rouyn-Noranda 52
11 19 22
31 Kelowna 52
16 14 22 32 Joliette 52
13 18 21
33 Charlottetown 51
11 14 26 34 Orillia 51 12 13 26 35 Corner Brook 51
10 16 25
36 Prince George 51
12 14 25 37 Salaberry-de-Valleyfield 51
10 18 23
38 Kentville 50
9 16 25 39 Timmins 50
10 15 25
40 Fredericton 50
9 17 24 41 Trois-Rivières 50
11 15 24
42 Penticton 50
14 13 23 43 Parksville 50 14 13 23 44 Baie-Comeau 50
7 21 22
45 Moncton 50
9 19 22 46 Sorel-Tracy 50
9 19 22
47 Rimouski 50
10 18 22 48 Saint-Jean-sur-Richelieu 50
11 17 22
49 Kawartha Lakes 49
9 15 25 50 London 49
10 16 23
51 Abbotsford 49
12 14 23 52 Vernon 49 14 13 22 53 Guelph 48
9 15 24
54 Bathurst 48
9 16 23 55 Halifax 48
10 15 23
56 St. Catharines - Niagara 48
11 14 23 57 Campbell River 48
12 15 21
58 Fort St. John 48
14 13 21 59 Thetford Mines 48
10 18 20
60 Sept-Îles 48
10 18 20 61 Montréal, excl. City 48 13 15 20 62 Thunder Bay 47 9 12 26 63 Chatham-Kent 47
6 16 25
64 Brantford 47
9 14 24 65 Port Alberni 47
10 13 24
66 Chilliwack 47
12 11 24 67 Hamilton 47
11 13 23
68 Winnipeg 47
11 14 22 69 Kamloops 47
14 11 22
70 Peterborough 47
12 16 19 71 Montréal, City 47 12 19 16 72 Windsor 46
9 12 25

www.cfib.ca
ResultsSaint John
Bathurst
Fredericton,Moncton
Miramichi

www.cfib.ca
Results
Presence (25)
Perspective (35)
Policy (40) Total (rank)
Grande Prairie AB
17 23 25 65 (1)
Miramichi 11 18 23 52 (26)
Fredericton 9 17 24 50 (40)
Moncton 9 19 22 50 (45)
Bathurst 9 16 23 48 (54)
Saint John 11 12 22 45 (78)
Sarnia ON 7 10 17 34 (103)

www.cfib.ca
Stay tuned – Oct 2013
www.cfib.ca
@CFIBeconomics