superfund
DESCRIPTION
Superfund Investment from First AdvisoryTRANSCRIPT

PAST PERFORMANCE IS NO GUARANTEE OF FUTURE RESULTS

The Investment Universe
• Managed futures are an asset class in their own right separate from traditional investments such as stocks and bonds.
Investment Universe
Traditional Asset Classes Alternative Asset Classes
CashBonds
EquitiesReal Estate
Hedge FundsManaged Futures
Private EquityCredit Derivatives

Long Term Dow Jones Cycle

Managed Futures vs Equities vs Commodities
Source: Bloomberg
From Beginning of 1/1980To End of 1/2009
CISDM CTA Equal Weighted Index
S&P 500 (Index) S&P Goldman Sachs Comm.
Index
Return Total performance +6,009.13 +665.13 +41.38
Return p.a. +15.22 +7.24 +1.20
Risk Maximum drawdown -15.40 -46.70 -61.03
Longest time off peak 20 months 81 months 282 months
Correlation 1.00 -0.10 -0.02

Managed Futures – An Established Asset Class
Donchian
Campbell
Dunn
•The first Managed futures fund or CTA (Commodity Trading Advisor) was founded by Richard Donchian (“father of trend following”) in 1948.
•Many CTAs have 30+ yrs of successful track record: Dunn, Campbell …
•Over 800 CTAs and 1500 CPOs (Commodity Pool Operator) registered in the US alone. (CBOT)
•Many leading endowment funds (Harvard, Stanford, Notre Dame) and state pension funds (Detroit, San Diego) have long been CTA investors.
•All four pictured on this page are featured in the bestselling book Trend Following by Michael Covel.
Baha

Advantages of Managed Futures
• Top performing long term investment
• Over 100 futures markets to choose from (commodities & financials)
• Managed Futures = most diversified + least correlated asset class
• Crashes protection when your portfolio needs it the most
• Profits in up or down markets
• Strict risk management
• Interest income on 100% of assets under management
• No predictions, only reactions to real events
• One of the best ways to get exposure to commodities

Managed Futures during Up-Market Cycles
*CASAM CISDM CTA Equal Weighted Index: An index of approximately 300 commodity trading advisers that voluntarily report their performance to CISDM. S&P 500 Total Return: A benchmark of U.S. common stock performance. It includes 500 of the largest stocks (by market value) listed in the U.S. It is considered to be the most important benchmark for market developments in the U.S. Time frame: 01/1980–12/2007

Managed Futures during Down-Market Cycles
*CASAM CISDM CTA Equal Weighted Index: An index of approximately 300 commodity trading advisers that voluntarily report their performance to CISDM. S&P 500 Total Return: A benchmark of U.S. common stock performance. It includes 500 of the largest stocks (by market value) listed in the U.S. It is considered to be the most important benchmark for market developments in the U.S. Time frame: 01/1980–12/2007
PAST PERFORMANCE IS NO GUARANTEE OF FUTURE RESULTS
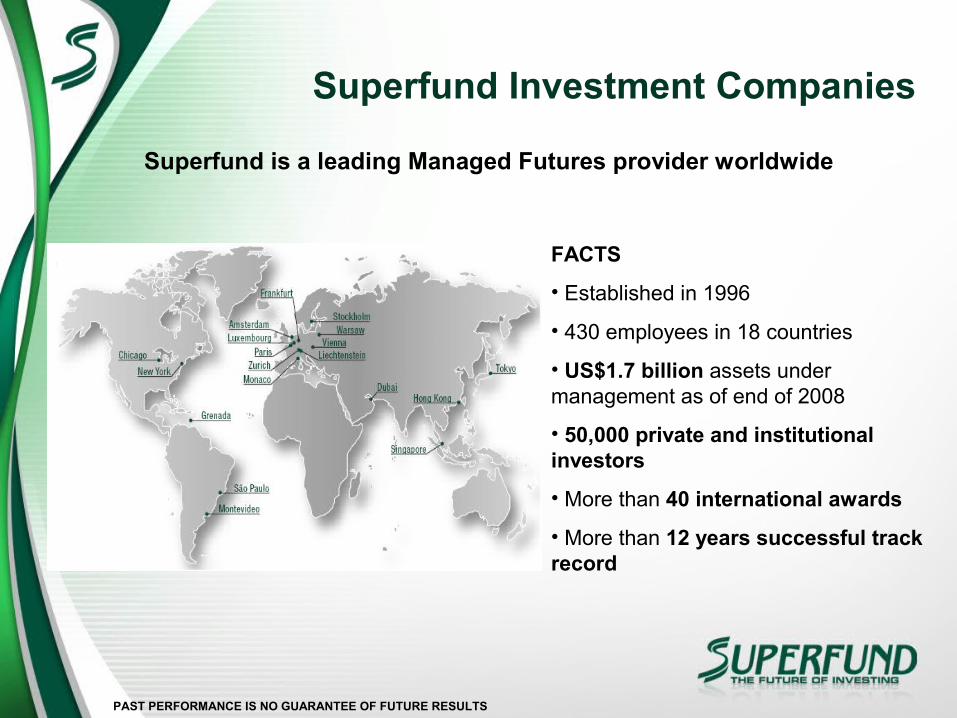
Superfund Investment Companies
Superfund is a leading Managed Futures provider worldwide
FACTS
• Established in 1996
• 430 employees in 18 countries
• US$1.7 billion assets under management as of end of 2008
• 50,000 private and institutional investors
• More than 40 international awards
• More than 12 years successful track record

Regulatory Authorities
AMERICA – USA
ASIAJapan
Securities and Exchange
Commission
Financial Industry Regulatory Authority
National Futures Association
Commodity Futures Trading Commission
Financial Services Agency
Austria Germany Liechtenstein
Luxembourg
Holland
Poland Sweden Switzerland
Financial Market Authority
Federal Financial Supervisory Authority
Financial Market Authority
Supervisory Commission of the Financial Sector
Financial Market Authority
Financial Market Authority
Financial Supervisory Authority
Federal Banking Commission
EUROPEFrance
Financial Markets Authority
Singapore
Hong Kong
Monetary Authority of Singapore
Securities and Futures Commission
PAST PERFORMANCE IS NO GUARANTEE OF FUTURE RESULTS
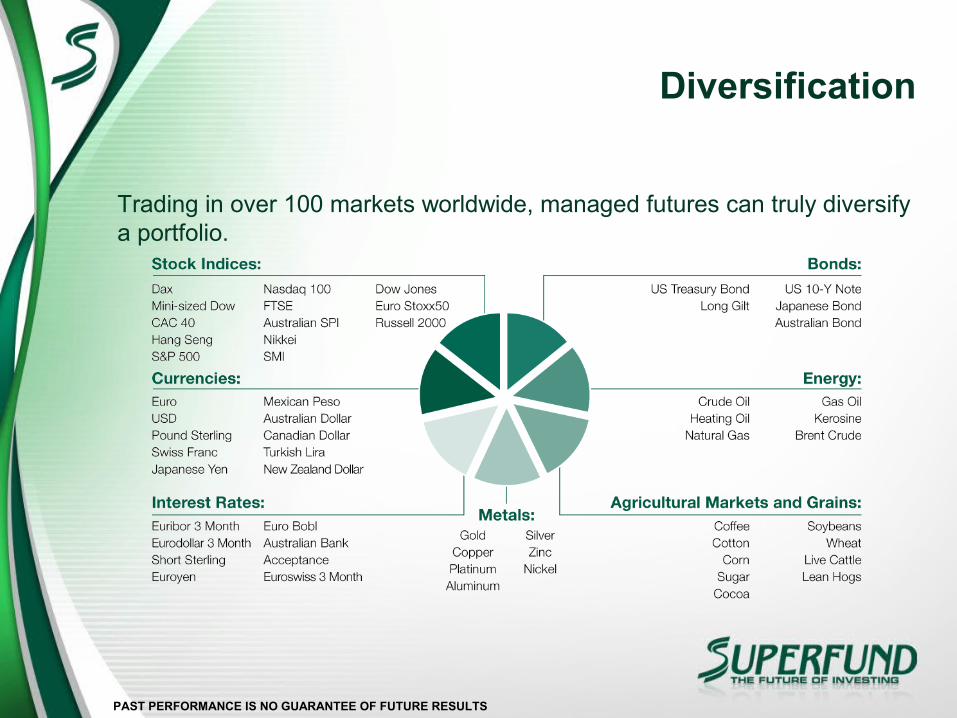
Diversification
Trading in over 100 markets worldwide, managed futures can truly diversify a portfolio.

Trend Following Strategies
Trendless period Entrance
Exit
Strong trendEntrance
Exit
Entrance
Exit
Trend trap
Trend reversal
Exit
Trend trap
Source: Teletrader
Entrance
Entrance
ProfitProfit
Strong Trend
Trend reversal
Trend trap
Exit
Entrance
Trend traps
ProfitProfit
Trendless period
Trend reversal
Trend reversal
Trendless periodTrend reversal

Fund Performance
Since 2000: +567.58%, 23.25% p.a.
Since 2001: +744.40%, 31.67% p.a.
Superfund GOLD A TRADITIONAL & GOLDSince 10/05: +159.96%, 33.56% p.a.
Superfund GOLD B DYNAMIC & GOLDSince 10/05: +202.97%, 39.90% p.a.
Above-average net-performance between 18.35% and 39.90% p.a.1
Since 1996: +780.38%, 18.35% p.a.
1Up to 1/2009. Past performance is not indicative of future results.

Superfund A vs Major Hedge Fund indices
Source: Bloomberg
* Superfund Q-AG is a closed fund. Performance results are net of all fees. Past performance is not indicative of future performance.
Superfund A CASAM CISDM Equal Weighted
Hedge Fund Index
Credit Suisse Hedge Fund MF
Index
Return Total performance +783.64 +242.97 +176.74
Return p.a. +18.39 +10.00 +8.19
Risk Maximum drawdown -19.93 -21.12 -14.23
Volatility p.a. 23.30 8.04 11.77
MAR Ratio +0.92 +0.47 +0.58
Correlation 1.00 0.06 0.76
From: Beginning of 3/1996
To: End of 1/2009

PAST PERFORMANCE IS NO GUARANTEE OF FUTURE RESULTS
Superfund A & Superfund B vs MSCI Asia Pacific ex Japan
Source: Bloomberg
Note: Superfund Q-AG andSuperfund GCT USD are closed funds. Performance results are net of all fees. Past performance is not indicative of future performance.
Superfund A Superfund B MSCI ac Asia Pacific ex Japan
Return Total performance +300.44 +567.58 -10.71
Return p.a. +16.49 +23.26 -1.24
Risk Maximum drawdown -19.93 -28.22 -52.39
Volatility p.a. 24.76 36.01 17.74
MAR Ratio +0.83 +0.82 -0.02
Correlation 1.00 0.96 -0.15
From: Beginning of 1/2000
To: End of 1/2009

PAST PERFORMANCE IS NO GUARANTEE OF FUTURE RESULTS
Traditional Portfolio WITHOUT Superfund A Strategy
Source: Bloomberg
From Beginning of 3/2000To End of 1/2009
MSCI World (Index)
JP Morgan Government Bond Global
DJ Wilshire Global Real Estate Sec.
Sum33 %|33%|34%
Return Total performance -37.43 +84.93 +20.64 +23.34
Return p.a. -5.12 +2.12 +7.13 +2.38
Risk Maximum drawdown -50.14 -8.08 -64.86 -40.09
Volatility p.a. 15.70 7.37 18.64 11.43
MAR Ratio -0.10 +0.03 +0.88 +0.06
Correlation 1.00 0.05 0.71 0.81
-40%
+23%

PAST PERFORMANCE IS NO GUARANTEE OF FUTURE RESULTS
Traditional Portfolio WITH Superfund A Strategy
Source: Bloomberg
Note: Superfund Q-AG is a closed fund. Performance results are net of all fees. Past performance is not indicative of future performance.
From Beginning of 3/2000To End of 1/2009
Superfund A MSCI World (Index)
JP Morgan Government Bond Global
DJ Wilshire Global Real Estate Sec.
Sum25%|25%|25%|25%
Return Total performance +297.72 -37.43 +84.93 +20.64 +91.47
Return p.a. +16.73 -5.12 +7.13 +2.12 +7.55
Risk Maximum drawdown -19.93 -50.14 -8.08 -64.86 -17.17
Volatility p.a. 24.98 15.70 7.37 18.64 10.89
MAR Ratio +0.84 -0.10 +0.88 0.03 +0.44
Correlation 1.00 -0.23 0.22 -0.13 0.75
+91%
-17%
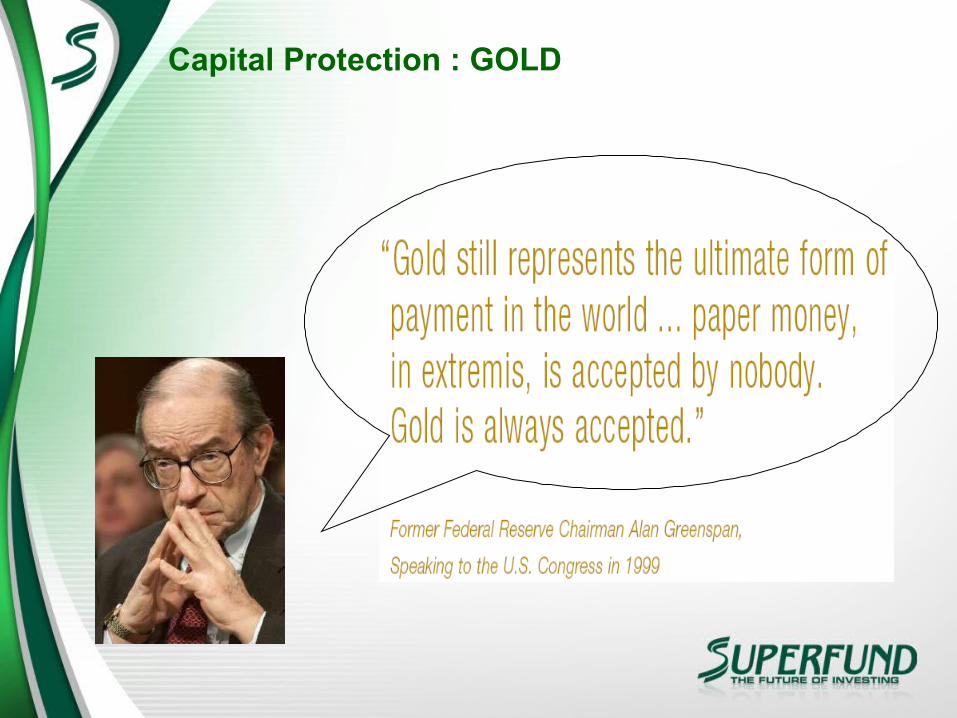
Capital Protection : GOLD

Superfund + Gold = Superfund Gold
Source: Bloomberg
Note: Superfund Q-AG is a closed fund. Performance results of Hybrid: Superfund Q-AG *Gold represent simulated results based on historical data, and are provided for information purposes only to indicate historical performance had the new product strategy been available over the relevant period. Past and simulated performance is not indicative of future performance.
From: Beginning of 3/1996To: End of 12/2008
Superfund A Hybrid: Superfund Q-AG * Gold
Gold Spot $/OZ
Return Total performance +783.64 +1,943.10 +131.53
Return p.a. +18.39 +26.33 +6.71
Risk Maximum drawdown -19.93 -26.25 -36.20
Volatility p.a. 23.30 30.17 15.82

PAST PERFORMANCE IS NO GUARANTEE OF FUTURE RESULTS
Superfund Gold – How it worksGold Funds Performance: FUND PERF. + GOLD OZ PERF.
January 2009 1996
780.38%
2,196.55
784.11
2,196.55
1,910,449 USD
869.75 +1,810 %

PAST PERFORMANCE IS NO GUARANTEE OF FUTURE RESULTS
Superfund Gold Performance
2005* +17.35% +21.49%2006 +32.92% +40.32%2007 +19.28% +16.28%2008 +32.29% +43.95%2009** +5.62% +6.17%
Return p.a.Return p.a. +33.56% +39.90%
* Since Inception Oct 05** As of January 09

Rankings and Awards : A Story of Success

Disclaimer This presentation has been prepared by Superfund Financial (Singapore) Pte Ltd for financial planners
only and is not intended for general public distribution. The information contained herein is for educational purposes only. This presentation does not constitute either investment advice or an offer or an invitation to offer to acquire, dispose of, subscribe for or underwrite any of the securities described herein. All information and data contained herein was obtained through careful evaluation of information provided by reliable internal and external sources. However Superfund Financial (Singapore) Pte Ltd or any other members of the Superfund group of investment companies cannot guarantee the complete validity and accuracy of all figures as well as the illustrated graphs/diagrams.
Performance results shown in this document are net of all fees. Past performance of the financial products contained in this presentation, especially performance figures of Superfund Q-AG (closed fund), Superfund GCT (closed fund) and Superfund Cayman (closed fund), are not indicative of future results for these or any other products. They exclusively serve as a historical presentation of the performance of their respective trading managers and of certain members of the Superfund Group. No subscriptions or follow-up subscriptions from existing investors are possible or will be accepted in closed funds. Fee structures of open Superfund funds may differ from those of closed Superfund funds identified herein, in which event the future performance of such open funds will likewise differ from said closed funds.
Financial products managed by members of the Superfund group of affiliated investment companies are speculative investments. There is a substantial risk of loss in trading futures and options. Every capital investment contains risks. The value of an investment may fall as well as rise.

Disclaimer
Some performance results indicated herein represent simulated results based on historical data, and not the results of actual trading. The simulated performance of Superfund Gold A strategy is based first on the actual past performance of Superfund Q-AG (closed fund) since 1996, which is denominated in EUR. This performance has then been valorized based on the actual performance of gold (in USD/ounce) on the London Metal Exchange on the respective valuation dates for Superfund Q-AG (the last banking day of each month). Superfund Gold A strategy, however, did not yet exist during the time period cited. Your attention is specifically drawn to the fact that this simulated performance is based on the price of gold in USD and that fluctuations during this time in the USD/EUR exchange rate have not been considered or included in the simulated performance. The simulated performance results are provided for informational purposes only to indicate historical performance had the new product strategies been available over the relevant period. No representation is being made that any investment will or is likely to achieve results similar to those shown. Past and simulated performance is not indicative of future results. Although the simulation includes adjustments for certain fees payable by the new strategies, the simulated performance results may vary once actual fees are taken into account. Hypothetical performance results have many inherent limitations. No representation is being made that any investment will or is likely to achieve profits or losses similar to those shown.
THE AUTHOR AND DISTRIBUTORS OF THIS MATERIAL EXPRESSLY DISCLAIM ANY AND ALL LIABILITY FOR ANY INACCURACIES CONTAINED IN THIS DOCUMENT, AND SHALL NOT BE HELD LIABLE FOR THE SAME.