wwrp/wcrp sub seasonal to seasonal prediction … climate and society (iri), columbia university....
TRANSCRIPT
1
WWRP/WCRP Sub‐seasonal to Seasonal Prediction Project (S2S)
Progress Report (Nov 2013 – July 2017)
Executive Summary
The World Weather Research Programme (WWRP) and Wolrd Climate Research Programme (WCRP) Sub‐seasonal to Seasonal Prediction Project (S2S) was launched in November 2013, with the primary goals of improving forecast skill and understanding on the sub‐seasonal to seasonal timescale (from 2 weeks to a season) with special emphasis on high‐impact weather events, developing coordination among operational centres, and promoting utilization by the applications communities. S2S is one of three post‐THORPEX activities of WWRP—along with the Polar Prediction Project (PPP) and the High Impact Weather project (HIWeather)—and is the first joint research project between WWRP and WCRP. A major motivation of S2S was to capitalize on the expertise of the weather and climate research communities and WMO/WWRP/WCRP programs—filling the gap between medium‐range and seasonal forecasting—to address issues of importance to the Global Framework for Climate Services (GFCS), http://www.wmo.int/gfcs/overview. The Implementation Plan for S2S ( http://www.s2sprediction.net/file/documents_reports/S2S_Implem_plan_en.pdf ) was written by the planning group that convened several times 2011–2013 and was published in 2013. The plan proposed the following set of activities toward realizing the S2S project goals, to be carried out over
a 5‐year period initially, with the option of extension for a further 5 years: • The establishment of a project Steering Group representing both the research and operational weather and climate communities, and an International Project Office to coordinate the day to day
activities of the project and manage the logistics of workshops and meetings; • The establishment of a multi‐model database consisting of ensembles of sub‐seasonal (up to
60 days) forecasts and supplemented with an extensive set of reforecasts following TIGGE protocols (https://www.ecmwf.int/en/research/projects/tigge);
• A major research activity on evaluating the potential predictability of sub‐seasonal events, including identifying windows of opportunity for increased forecast skill with a special emphasis on
events with high societal or economic impacts, and relevance to developing countries;
• A series of science workshops on sub‐seasonal to seasonal prediction, and • Appropriate demonstration projects based on some recent extreme events and their impacts, in conjunction with the WWRP Societal and Economic Research Applications (SERA) Working Group.
This report describes the project’s progress and main achievements to date (up to July 2017), and outlines some of the outstanding challenges. All the main activities foreseen by the implementation plan have been carried out to some degree. The signature achievement of S2S has been the creation of the S2S database of sub‐seasonal forecasts (3 weeks behind real time) and re‐forecasts, archived at European Centre for Medium‐Range Weather Forecasts (ECMWF) and the China Meteorological Administration (CMA). The S2S database was launched publicly in May 2015 and has spurred major research activity on S2S predictability, modeling, and forecast verification and product development. Several regional S2S research activities have been established, including a major National Oceanic and Atmospheric Administration (NOAA) initiative in the United States of America (USA), for which S2S has been a catalyst. The project has fostered S2S research by organizing/co‐organizing 18 science workshops/sessions in the project’s first 4 years, together with 8 training courses. Six S2S

2
sub‐projects were established as a means to coordinate research and to develop the global S2S climate and weather research community; each of these is reported on below. A series of case studies has been carried out as part of the sub‐project on extremes. The science findings are rapidly evolving, with the database launched only two years ago, and several are highlighted in this report. To date and to our knowledge, eleven articles have been published that use the S2S database. Several of the findings relate to the Madden‐Julian Oscillation (MJO), a primary source of sub‐seasonal predictability:
The skill of MJO forecasts in 7 of 10 S2S models exceeds a bivariate correlation skill of 0.5 at 20‐day lead, while one model reaches that level by 30 days (Fig 12);
MJO teleconnections over the North Atlantic are of realistic sign, but too weak in all the models (Fig.13);
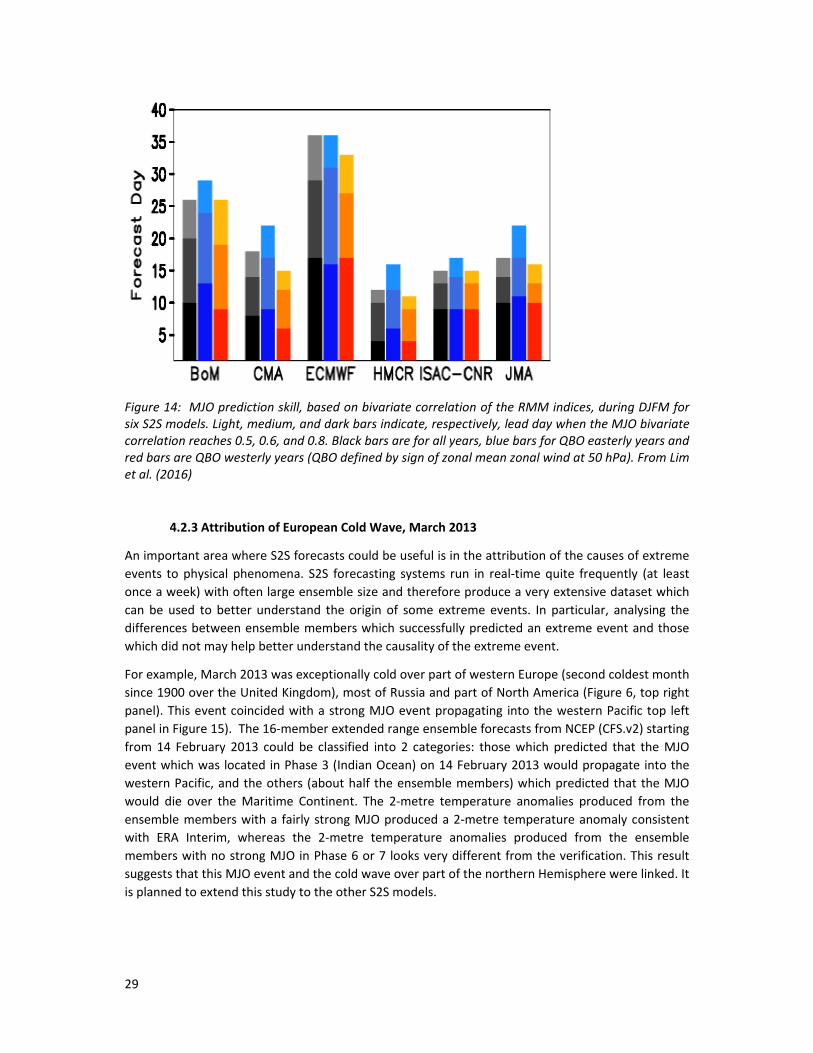
MJO skill is enhanced by up to a week during the easterly phase of the stratospheric Quasi‐Biennial Oscillation (QBO) in several S2S models (Fig. 14);
Evidence from the S2S database forecast ensembles suggests that the severe cold spell that afflicted western Europe in March 2013 was at least in part attributable to a strong MJO event propagating into the western Pacific;
The skill of the S2S models to predict Euro‐Atlantic weather regimes and their transitions has been assessed. Results indicate predictive skill up to about 3 weeks for the positive and negative North Atlantic Oscillations (NAO), and up to about 16 days for the other weather regimes. The S2S models display skill to predict weather regime transitions up to about 16 days.
Coordination among operational centres fostered by S2S led the WMO Lead Center for Long‐range Forecasts in 2015 to begin a pilot real‐time sub‐seasonal MME prediction system for its members, taking advantage of the S2S database at ECMWF. The Lead Center is able to access the S2S database without the 3‐week delay placed on public access. Further coordination across the GPCs has taken place such that all of 11 operational centers now issue forecasts on Thursdays (including the 4 models with daily forecast starts); this compares with only 7 of 11 models at the project’s outset and greatly facilitates the generation of multi‐model ensemble forecasts. S2S was born into a complex landscape of research and operational forecasting programs and institutions within and external to WMO. The project was created as a nexus between WCRP and WWRP, strongly linked to WMO‐Commission for Basic Systems (CBS) (http://www.wmo.ch/pages/prog/www/BAS/CBS‐info.html), which focuses on the development, implementation and operation of integrated systems for observing, data processing, data communication and data management, and to the provision of public weather services. S2S also aspires to make a significant contribution to the GFCS. While this report can point to major achievements and project successes, there is a clear recognition that much of the research, product development and uptake by the applications communities are still at quite early stages. Much remains to be done to fully realize the S2S vision of seamless forecasting both in terms improving the skill of the forecasts, developing the operational infrastructure, as well as creating forecast products to help inform user‐decisions in the two‐weeks‐to‐two‐months range. A focus on a combination of such upstream and downstream issues is foreseen in second 5‐year phase of S2S.
1 The S2S Database

3
A primary goal of the first phase of the S2S project was to assess the current capabilities of state‐of‐
the‐art operational sub‐seasonal to seasonal forecasts and identify gaps and issues in sub‐seasonal
to seasonal forecasts and evaluate the potential usefulness of S2S forecasts for various applications.
Therefore, the first effort and major achievement of this project has been the establishment of a
database containing near real‐time and re‐forecasts up to 60 days from 11 centres: Australian
Bureau of Meteorology (BoM), China Meteorological Administration (CMA), European Centre for
Medium‐Range Weather Forecasts (ECMWF), Environment and Climate Change Canada (ECCC), the
Institute of Atmospheric Sciences and Climate (CNR‐ISAC), Hydrometeorological Centre of Russia
(HMCR), Japan Meteorological Agency (JMA), Korea Meteorological Administration (KMA), Météo‐
France/Centre National de Recherche Meteorologiques (CNRM), National Centers for Environmental
Prediction (NCEP) and the United Kingdom’s Met Office (UKMO). All except CNR‐ISAC are WMO
Global Producing Centres of Long‐Range Forecasts (GPCs). Because S2S is a research project, the
real‐time forecasts are only available with a 3‐week delay. The data is archived at ECMWF and CMA,
and an increasingly large subset of the S2S data is available from the International Research Institute
for Climate and Society (IRI), Columbia University. Users are required to sign the S2S Terms and
Conditions which stipulate non‐commercial use of the S2S data.
The first 2 years of the project were dedicated to agreeing on the main characteristics of the data
archive (e.g. the list of archived variables), defining the GRIB2 format for S2S data and some of the
variables which were not already defined in GRIB2, producing test data from each centre, testing the
archiving, and setting up the data portals. Based on the Implementation Plan, it was decided at an
early stage that the S2S database would consist of a “database of opportunity” of sub‐seasonal
forecasts and hindcasts produced routinely by each centre, rather than requiring a common
forecasting protocol, and that the forecasts would be released through the database after a 3‐week
delay to avoid conflicts with the data policies of some of the GPCs. It was originally proposed that
the 3‐week requirement be revisited after 1 year, or that it could be lifted for a limited period of
time. These discussions were subsequently postponed for a potential Phase 2 of S2S. The S2S
database has been documented in an article in the Bulletin of the American meteorological Society
(Vitart et al., 2017). The database contains most of the atmospheric and land variables proposed in
the Implementation Plan (Annex 4). Work is ongoing at ECMWF to include additional ocean and ice
fields.
1.1 ECMWF data portal
The ECMWF data portal was opened to the research community in May 2015 via the Data Portal and
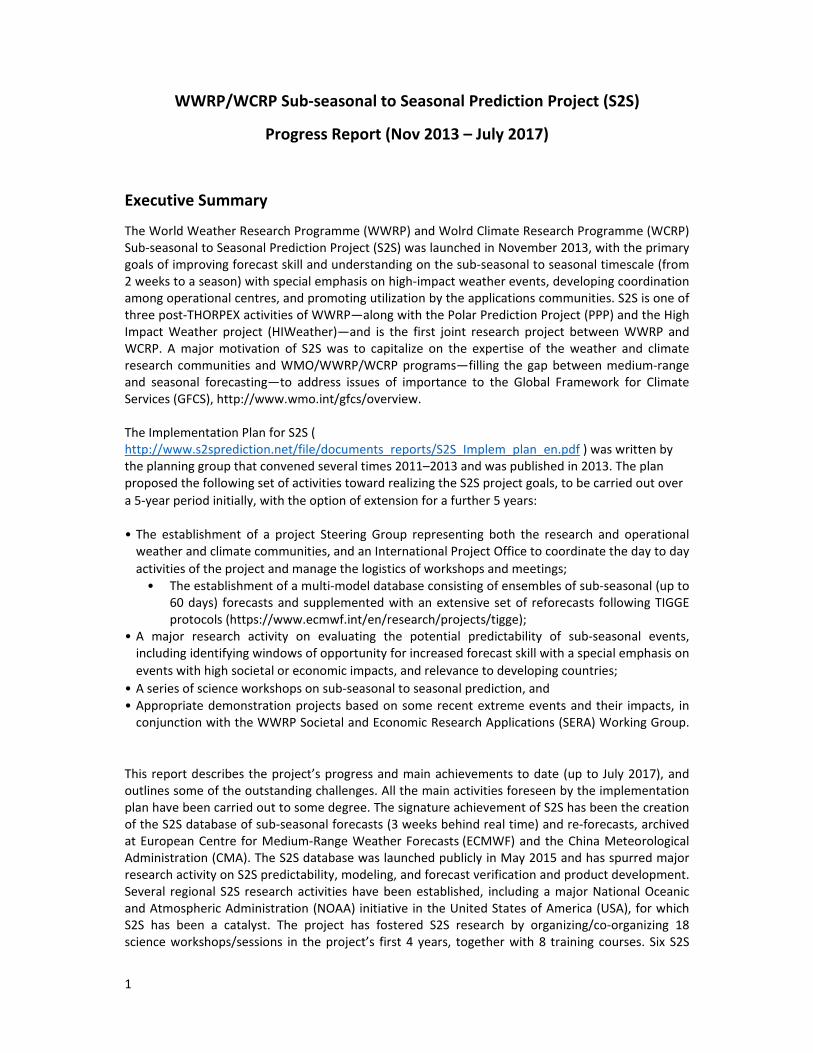
ECMWF Web API (Application Programming Interface). The number of active users per month is
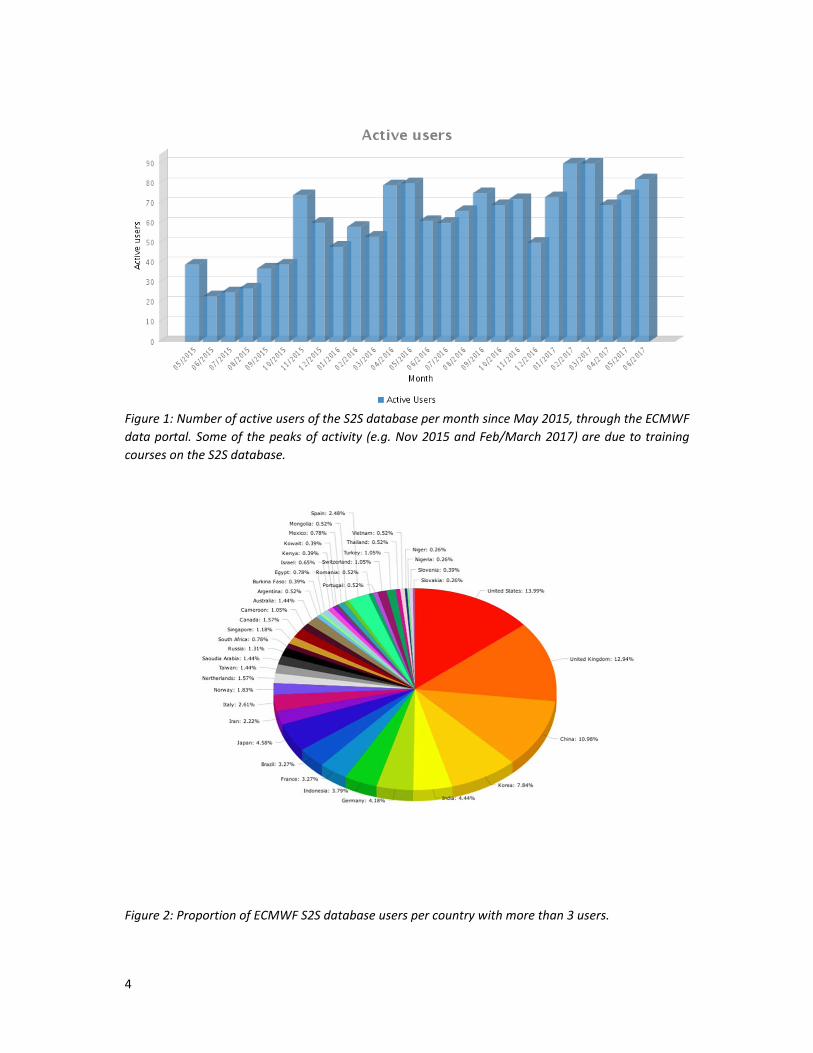
increasing and reaches up to 90 different active users per month in 2017 (Fig. 1) By June 2017, 843
users from 88 countries (Fig. 2) had registered and had executed over 5,000,000 requests to extract
165 Terabytes of data from ECMWF. ECMWF and CMA are working together closely to ensure the
timely synchronization of the two databases. To assess the user satisfaction with the S2S database
and the quality of the service provided by ECMWF to access the S2S data, a survey was sent in 2017
to all S2S database registered users. About 120 people replied. The overall level of satisfaction is high
(45.4% are satisfied and 27.8 % are very satisfied), although the percentage of "very satisfied" is not
high enough. The survey highlighted the need to improve the speed of data retrieval and also the
need for more training on use of the database (survey results can be found at
www.s2sprediction.net). Work is ongoing to add the possibility of retrieving the data directly in
Network Common Data Form (NetCDF) from the ECMWF data portal.
4
Figure 1: Number of active users of the S2S database per month since May 2015, through the ECMWF
data portal. Some of the peaks of activity (e.g. Nov 2015 and Feb/March 2017) are due to training
courses on the S2S database.
Figure 2: Proportion of ECMWF S2S database users per country with more than 3 users.

5
1.2 CMA data portal
The China Meteorological Administration (CMA) Sub‐seasonal to Seasonal (S2S) Archive Centre, one
of the two S2S Archive Centres, aims to collect and archive real‐time ensemble forecast and re‐
forecast data from all S2S data‐provided centres, and deliver the data to users through the web‐
based data download services. Up to June 11, 2017, CMA S2S Archive Centre had collected and
archived about 42.5 TB of the S2S data. The original forecast data from each S2S data provider are
directly sent to ECMWF. All available S2S data in CMA are acquired from ECMWF S2S archive centre,
and checked to ensure integrity and synchronization with the data at ECMWF, then finally archived
at CMA in an online disc storage system using the MARS system archiving as a backup. CMA is
making continuous effort to keep synchronization of the S2S database with the ECMWF’s data portal
(http://apps.ecmwf.int/datasets/data/s2s/).
The CMA’s S2S data portal was developed by CMA and officially launched on November 16, 2015
and all the data made accessible freely at http://s2s.cma.cn. It provides the sub‐seasonal to seasonal
weather forecast data to the researchers worldwide for studying the predictability on time‐scales up
to 60 days. Based on shell scripts and ecFlow software, the CMA’s S2S data portal provides users
seamless services from online data storage to online acquisition. Users can view details of the S2S
models and parameters by visiting the website: http://s2s.cma.cn/dmodels. Based on the statistics
for the S2S database usage, 222 users have registered at the CMA’s S2S data portal so far, and the
total visits are 135710 since Nov, 2015. Registered users originate from more than 40 countries, but
most from China. Up to now, there are about 4.5 TB downloaded by users. Top five centres are
ECMWF, JMA, NCEP, CMA and UKMO. Data downloaded for the top five parameters are
Temperature, Surface air temperature, Total precipitation, Surface air maximum temperature,
Surface air minimum temperature.
At present, CMA S2S data portal mainly provides the online data download service. Data download
service in GRIB2 and NetCDF format are available. The NetCDF format is obtained through online
conversion. A system of online data visualization and analysis service is under development. All the
S2S data is expected to be accessed by Hypertext Transfer Protocol (HTTP) and Open‐source Project
for a Network Data Access Protocol (OPeNDAP) by the end of 2017.
1.3 IRI Data library
A significant fraction (nearly half; about 35TB as of June 2017) of the S2S Database has been
downloaded at IRI, Columbia University, from the ECMWF server, and has been archived on disk in
the IRI Climate Data Library (IRIDL): http://iridl.ldeo.columbia.edu/SOURCES/.ECMWF/.S2S/. This has
been possible through collaboration with projects funded by NOAA’s MAPP and NGGPS programs.
IRIDL enables a flexible on‐line interface to the data, which can be downloaded in a variety of
formats (including NetCDF), or post‐processed and visualized without the need to download. In
addition to the raw S2S daily fields, derived weekly‐ and ensemble‐averaged fields are in the process
of being pre‐computed for selected variables, together with an online maproom for visualization of
weekly fields and anomalies. The S2S model MJO indices computed by ECMWF (see Sect 3.2 below)
are also available via IRIDL. These developments have largely taken place in 2016‐2017 and are
ongoing. There were 815 unique visitors to the S2S data in IRIDL in 2016, and 865 in Jan‐Apr 2017.

6
The IRIDL S2S data has been used for teaching at Columbia University and in S2S training courses,
where students have analyzed the performance of the ECMWF model for particular high‐impact
weather events. Figure 3 shows an example for an active phase of the Indian summer monsoon in
July 2015 in Bihar, northern India, visualized using the IRI Data Library. The calculations to obtain the
anomaly maps in Figure 3 are encapsulated URLs, enabling the maps to be created “on the fly” and
without having to download the data first.
Figure 3: Weekly precipitation anomalies (mm/day) for July 6‐12 2015. (a) CHIRPS data, and ECMWF
forecasts ensemble mean at increasing leads from Monday starts: (b) July 6 “Week 1", (c) June 29
“Week 2", (d) June 22 “Week 3", and (e) June 15 “Week 4".
2. Operational links
2.1 Changes to operational production of sub‐seasonal forecasts
Annexe 4 of the S2S implementation plan provides a table describing all the operational sub‐
seasonal forecasting systems which were planned for inclusion in the S2S database before the S2S
project started in November 2013. A more recent model description table can be found in
https://software.ecmwf.int/wiki/display/S2S/Models . The comparison of these two tables shows
that most operational centres have upgraded their S2S systems since 2013. Some centres like UK
Met Office and ECMWF have considerably increased the size of their re‐forecasts. Other centres like
Korea Meteorological Administration (KMA) have increased the frequency of their sub‐seasonal

7
forecasts. In 2013, four models were producing sub‐seasonal forecasts on a monthly basis, while in
2017 all models in the S2S database have a daily or weekly real‐time frequency. Although the re‐
forecast set‐up still varies greatly between operational centres, the configuration of the real‐time
forecasts is more consistent in 2017 that it used to be in 2013. Some of these changes can be directly
attributed to the S2S project:
‐ CNRM produces real‐time forecasts once a week instead of once a month since March 2016
‐ Some centres (CNR‐ISAC, CNRM, HMCR) chose or moved the start date of their real‐time
forecasts to Thursdays.
S2S has improved the coordination between the production of real‐time forecasts between S2S
models: since May 2017, all S2S models produce real‐time forecasts on Thursdays, which greatly
improved the possibility to produce a multi‐model combination from the 11 S2S models. There are
still many differences between model re‐forecasts and more time and more studies will be needed
before S2S will be in position to provide recommendations to the operational centres regarding re‐
forecasts (recommended ensemble size, re‐forecast length, frequency etc.).
S2S has also helped encourage other operational and research centres to produce sub‐seasonal
forecasts and participate to the S2S database, such as IITM (India) and Council for Scientific and
Industrial Research (CSIR, South Africa).
2.2 Data integration with the WMO Lead Centre for Long‐Range Forecast Multi‐Model Ensemble
The WMO Cg‐XVI in 2011 requested the WMO Lead‐Centre for Long‐Range Forecast Multi‐Model
Ensemble (LC‐LRFMME; https://www.wmolc.org/ ) LRFMME to explore the possibility of extending
its role to extended‐range predictions. Subsequently in 2013, the Implementation Coordination
Team of the Open Programme Area Group (OPAG) for the DPFS (ICT‐DPFS) set up a Task Team under
the joint CBS‐CCl Expert Team on Operational Predictions from Sub‐seasonal to Longer‐time Scales
(ET‐OPSLS) to scope the implementation of real‐time sub‐seasonal forecasts, and to establish the
necessary links with the then‐planned WWRP‐THORPEX/WCRP research project on sub‐seasonal to
seasonal prediction. Availability of hindcasts and real‐time forecast data archive from various
operational centres, developed as part of the S2S Project, provided the catalyst to move forward
with the development of an operational capability by the LC‐LRFMME for predictions on sub‐
seasonal time‐scales.
In December 2015, the pilot real‐time sub‐seasonal MME prediction system was developed with a
subset of S2S models. The initial choice of model – ECMWF, NCEP and JMA – was guided by the day
of the week when the sub‐seasonal forecasts by multiple models are initiated. Currently, WMO LC‐
LRFMME is downloading the real‐time data forecast data from a sub‐set of six models in the S2S
archive and producing MME products on a regular basis. A recent development where the forecast
centres were encouraged by the S2S Project to initiate at least one of their forecast ensembles from
Thursday of the week will lead to the inclusion of larger number of models in the multi‐model
extended‐range forecasts by the LC‐LRFMME. Currently, displays at the website of WMO LC‐
LRFMME (Fig. 4) are available about a week delay from starting date of MME prediction because of
the time required for data collection. However, in future a tighter data integration between the LC‐
LRFMME and ECMWF will reduce the lead‐time, and is highly desired given the lead‐time
dependence in skill of forecasts on weeks 2‐4 time scale.

8
Figure 5 illustrates how the S2S database at ECMWF underpins both the S2S data portal (with access
to the research and applications communities delayed 3 weeks behind real time), and WMO LC‐
LRFMME real‐time access for WMO users. The operational effort led by the LC‐LRFMMF would not
have been possible without the initiation, S2S database infrastructure at ECMWF, and the efforts of
the S2S Project.
Figure 4: Deterministic forecast of Outgoing Longwave Radiation (OLR) based on six participating S2S
models averaged between 8oS‐8oS. Forecast OLR anomaly from 19 June – 30 July, 2017 is blended
with the observed OLR anomaly from 19 February – 18 June, 2017, and is indicative of intra‐seasonal
variability in the equatorial latitude. Forecast data is downloaded from the S2S data archives from
the ECMWF and is processed by the WMO LC‐LRFMME as part of the pilot real‐time sub‐seasonal
forecast effort.

9
Figure 5: Schematic illustrating how the S2S database at ECMWF underpins both the S2S data portal
(with access to the research and applications communities delayed 3 weeks behind real time), and
WMO LC‐LRFMME real‐time access for WMO users.
3. Service to the community
3.1 Improved communication across the S2S community through the ICO, including S2S
website, mailing list, Newsletter
The primary function of S2S International Coordination Office (ICO), kindly hosted and resourced by KMA, is to provide support to planning and implementation of S2S priorities, to ensure appropriate international coordination between the S2S participating members and collaboration with related WMO programs and other international programs.
A principal accomplishment over the past years is setting up an improved communication environment among the S2S communities and liaison groups through S2S ICO, in order to remove barriers between S2S research, forecast, and applications. To foster enhanced communication, ICO has established the following communication environment which provides a forum for S2S communities to nurture expanded collaboration and discuss recent advances related to sub‐seasonal to seasonal timescales:
1) The S2S project web site (http://s2sprediction.net): Open access to S2S information and user friendly interaction space are important requirements for S2S Communities. The S2S ICO developed the S2S homepage, including creating the S2S project logo, which makes possible the exchange of information and includes links to the S2S data portals at ECMWF and CMA. The S2S web site provides:
The latest news from S2S communities including workshops and meetings, recent S2S articles, reports and books.
Wiki pages for each of the S2S sub‐projects whose role is to coordinate S2S activities with relevant bodies and to prepare reports for the regular S2S steering group meetings.
2) The S2S Mailing List ([email protected], [email protected]): The S2S Mailing List is operated under the Google Group. It offers a virtual space to communicate among people who are interested in sub‐seasonal to seasonal time scales. As of 12 June 2017, there are 342 subscribers to the Mailing List.
3) S2S Newsletter: This has been published every 4 months, with six issues to date since September 2015. It contains News (introduction of sub‐projects, some meeting/events outcomes, S2S database update), Upcoming Events, Publications, S2S SG/LG membership update, and Special Scientific Articles.
10
4) Workshops/Meetings/Capacity buildings: It is of primary importance for S2S communities to interact with each other. These events are an opportunity to communicate, to exchange the outputs of the projects, and to raise community awareness of the value of S2S project to WMO Member countries.
3.2 FTP site for MJO Indices
The S2S database is a very large database and downloading data from all the S2S models can take a
significant amount of time and can be quite complex because of the different model configurations.
There is also a limit in the number of people who can download S2S data simultaneously. Therefore,
there is a benefit in rationalizing the use of the S2S database to avoid as much as possible
duplications in its usage. For example, many research groups are interested in calculating MJO
indices for model inter‐comparison but also to assess the impact of the MJO on various fields. By far
the most popular MJO index is the Real‐time Multivariate MJO (RMM) index from Wheeler and
Hendon (2004). To avoid many people doing the same data retrievals and calculations, The S2S SG
decided to compute the RMM indices and make them available through an ftp site. Later on, the
same procedure could be applied to other popular weather indices, such as sudden stratospheric
warming (SSW) indices, weather regimes indices, tropical cyclone tracks, etc. This ftp site should
provide an important service to the S2S research community.
The first example of weather index provided from an ftp site are the MJO RMM indices. The RMM
indices from ten of the S2S models (at the time of writing KMA did not provide outgoing long wave
radiation used in the computation of the index) have been computed following Wheeler and Hendon
(2003) and Gottschalk et. al. (2009). The calculation has been applied to the re‐forecasts as well as
real‐time forecasts. This RMM index database is updated routinely (3 weeks behind real‐time). The
indices are produced in a text format which has been agreed by the S2S Steering Group. The RMM
files contain the RMM principal components, amplitude and phase of the MJO for each forecast day,
ensemble member. Verification from ERA Interim (also updated near real‐time) have also been
produced. The RMM indices are now available to the research community from the ftp site
s2sidx@lanpds‐dm1.ecmwf.int since March 2017. These indices have also been copied into the IRI
data library http://iridl.ldeo.columbia.edu/SOURCES/.ECMWF/.S2S/ and work is ongoing to develop
graphic tools to automatically plot the RMM indices.
Work is currently underway to follow the same procedure for Sudden Stratospheric Warming indices
(work done at U. Reading by Andrew Charlton‐Perez for SPARC/SNAP), European weather regimes
(Laura Ferranti, ECMWF), American weather regimes (Angel Munoz, Columbia University) and
tropical cyclone tracks (Frederic Vitart, ECMWF).
3.3 Products websites (ECMWF/S2S museum)
Another service provided by the S2S project to the research community has been the creation of two
websites containing 3‐week behind real time graphical products from the S2S models. These
websites are an important resource for people interested in assessing how operational models
predicted past events.
3.3.1 ECMWF S2S product website
11
A range of near‐real time forecast charts based on the S2S database is openly available at:
www.ecmwf.int/en/research/projects/s2s/charts/s2s/.
They can be used to monitor the S2S data and assess the quality of the forecasts, as well as providing
a testbed for the development of new products, for example to identify signals for extreme events at
the sub‐seasonal timescale. The products include ensemble mean anomalies for some
meteorological parameters, Extreme Forecast Index (EFI) for 2m temperature and forecasts of the
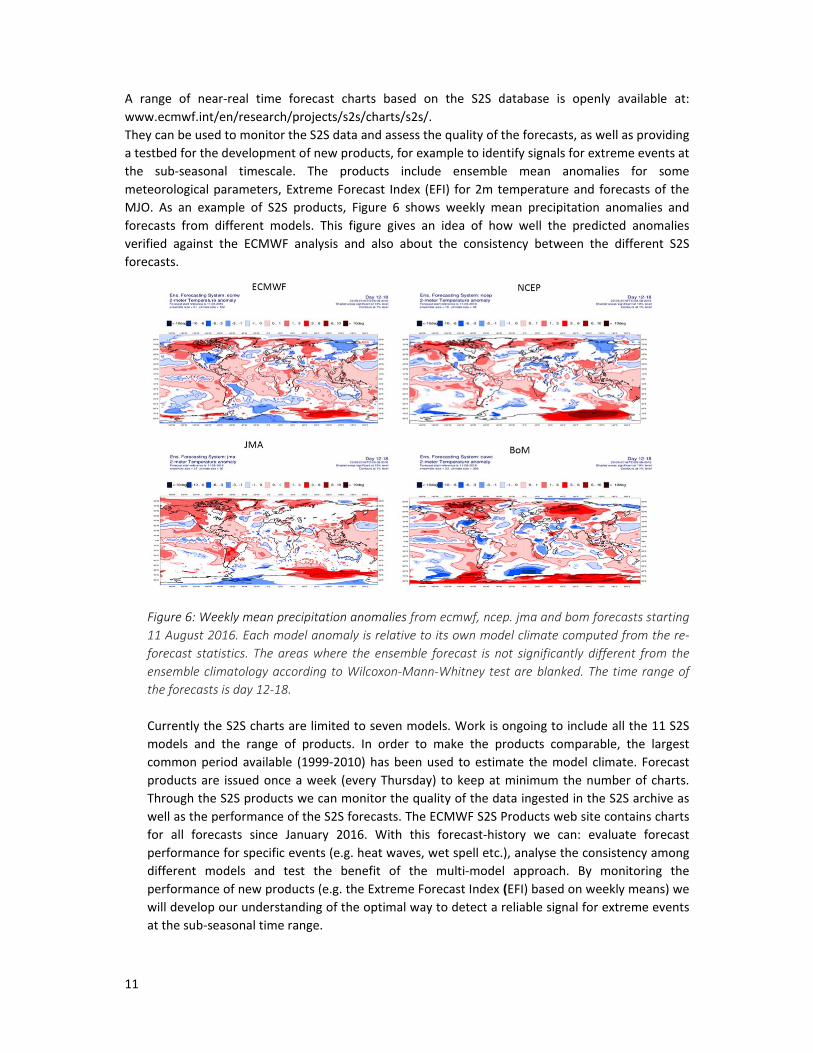
MJO. As an example of S2S products, Figure 6 shows weekly mean precipitation anomalies and
forecasts from different models. This figure gives an idea of how well the predicted anomalies
verified against the ECMWF analysis and also about the consistency between the different S2S
forecasts.
Figure 6: Weekly mean precipitation anomalies from ecmwf, ncep. jma and bom forecasts starting
11 August 2016. Each model anomaly is relative to its own model climate computed from the re‐
forecast statistics. The areas where the ensemble forecast is not significantly different from the
ensemble climatology according to Wilcoxon‐Mann‐Whitney test are blanked. The time range of
the forecasts is day 12‐18.
Currently the S2S charts are limited to seven models. Work is ongoing to include all the 11 S2S
models and the range of products. In order to make the products comparable, the largest
common period available (1999‐2010) has been used to estimate the model climate. Forecast
products are issued once a week (every Thursday) to keep at minimum the number of charts.
Through the S2S products we can monitor the quality of the data ingested in the S2S archive as
well as the performance of the S2S forecasts. The ECMWF S2S Products web site contains charts
for all forecasts since January 2016. With this forecast‐history we can: evaluate forecast
performance for specific events (e.g. heat waves, wet spell etc.), analyse the consistency among
different models and test the benefit of the multi‐model approach. By monitoring the
performance of new products (e.g. the Extreme Forecast Index (EFI) based on weekly means) we
will develop our understanding of the optimal way to detect a reliable signal for extreme events
at the sub‐seasonal time range.

12
3.3.2 S2S Museum
The S2S museum (http://gpvjma.ccs.hpcc.jp/S2S/) is hosted at the University of Tsukuba (Japan)
and has been developed by Mio Matsueda (University of Tsukuba and University of Oxford) as an
extension of the “TIGGE museum” with support from the ArCS (Arctic Challenge for
Sustainability) Project of the Ministry of Education, Culture, Sports, Science and Technology
(MEXT) of Japan. This website is updated daily from all the new forecasts available from the S2S
database. The website contains plots of specific atmospheric phenomena: AO/AAO
(Arctic/Antarctic Oscillations) index, SLP and Z500 anomalies, teleconnection indices (NAO, EA,
PNA, WA, WP, and EU), Wave Activity Flux at 200 hPa, SSW (Sudden Stratospheric Warming)
(only November‐April), Temperature at 10 hPa, MJO, SST (60S–60N), and sea‐ice cover (see
example in Figure 7).
Figure 7: Antarctic sea‐ice cover ensemble mean and spread from S2S models starting on 8 August
2016 and valid for the time range week 4 (day 22‐28).
4. Science (research and Modelling)
4.1 S2S sub‐project achievements
4.1.1 Extreme Weather

13
The S2S sub‐project on extreme weather’s science plan and membership are available at:
http://www.s2sprediction.net/xwiki/bin/view/Main/Extremes. The main goals of the S2S sub‐project
on extreme weather are:
1. Assess the predictability of extreme events such as heat, cold waves, floods at the sub‐
seasonal to seasonal time scale
2. Assess the predictability of tropical storms.
3. Produce case studies of extreme weather with strong societal impact
To address 1) and 2), past and ongoing studies include:
Predictability of tropical storms and their modulation by MJO and El Niño–Southern
Oscillation (ENSO) (F. Vitart, ECMWF; Chia‐Ying Lee, Columbia University)
Predictability of weather regimes, heat waves and cold waves over Europe and their
relationship to large‐scale circulation patterns (L. Ferranti, ECMWF)
Prediction of California drought index and its link to ENSO in coupled forecast system model
version 2 (CFSv2) (Mingyue Chen, NCEP/CPC)
Drought forecasting using probabilistic precipitation and predictor fields in Europe (C.
Lavaysse, JRC)
Modulation of extreme events in the USA by the MJO (C. Jones, UCSB )
Use of Extreme Forecast Index in S2S models (L. Ferranti, ECMWF)
Predictability of atmospheric rivers (M. DeFlorio, NASA JPL)
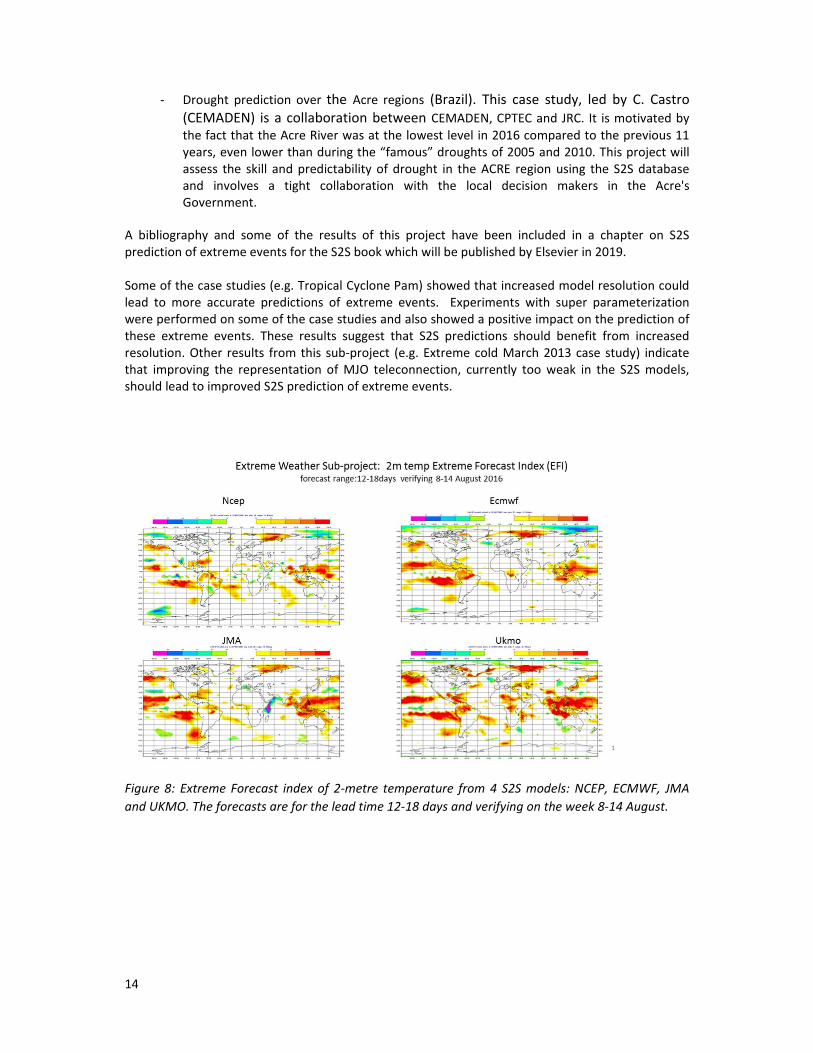
Most of these studies make use of the S2S database and some of them have already led to
publication in the peer reviewed literature. For instance, the Extreme Forecast Index (EFI) (Lalaurette
et al. 2003) has been applied to the weekly means of the S2S forecasts (see example in Figure 8).
Verification of the EFI of 2‐metre temperature for weeks 3 and 4 against ERI Interim showed
statistically significant skill up to week 4, suggesting that the extended range forecasts could be
potentially useful for the prediction of some extreme events.
Over the past years, several cases studies of extreme weather have been investigated. They include:
‐ The exceptionally cold March 2013 over most of Europe (second coldest March in the UK
since 1910). The cold temperature anomalies also extended over large portions of North
America and Asia. This cold event lasted for about a month, and was associated with a
negative phase of the North Atlantic Oscillation (NAO). An article published in
Meteoworld (April 2014 issue), described the results of the investigation on its sub‐
seasonal predictability and causality.
‐ Severe Tropical Cyclone Pam of 2015 which was the most intense tropical cyclone in the
southern hemisphere in 2015 and one of the worst natural disasters in the history of
Vanuatu. Figure 9 suggests that this event had some extended‐range predictability, the
multi‐model combination indicating an increased risk of tropical cyclone strike probability
in the vicinity of Vanuatu (indicated by a black dot in Figure 9) 2 to 3 weeks in advance.
‐ Sub‐seasonal variability of precipitation in the US west coast during the 2015 El‐Nino
event. This case study, led by C. Jones (UCSB) is still ongoing.
14
‐ Drought prediction over the Acre regions (Brazil). This case study, led by C. Castro (CEMADEN) is a collaboration between CEMADEN, CPTEC and JRC. It is motivated by the fact that the Acre River was at the lowest level in 2016 compared to the previous 11 years, even lower than during the “famous” droughts of 2005 and 2010. This project will assess the skill and predictability of drought in the ACRE region using the S2S database and involves a tight collaboration with the local decision makers in the Acre's Government.
A bibliography and some of the results of this project have been included in a chapter on S2S prediction of extreme events for the S2S book which will be published by Elsevier in 2019. Some of the case studies (e.g. Tropical Cyclone Pam) showed that increased model resolution could lead to more accurate predictions of extreme events. Experiments with super parameterization were performed on some of the case studies and also showed a positive impact on the prediction of these extreme events. These results suggest that S2S predictions should benefit from increased resolution. Other results from this sub‐project (e.g. Extreme cold March 2013 case study) indicate that improving the representation of MJO teleconnection, currently too weak in the S2S models, should lead to improved S2S prediction of extreme events.
Figure 8: Extreme Forecast index of 2‐metre temperature from 4 S2S models: NCEP, ECMWF, JMA
and UKMO. The forecasts are for the lead time 12‐18 days and verifying on the week 8‐14 August.

15
Figure 9: Probability anomalies of a tropical storm strike within 300 km radius from the multi‐model
ensemble (combination of ECMWF, NCEP, CMA, JMA and BoM forecasts). The forecasts were
initialized on 26 February 2015 (top panel), 19 February 2015 (bottom panel) and cover the weekly
period 9‐15 March 2015, which corresponds to a forecast range of day 12‐18 (top panel) and day 19‐
26 (bottom panel). The black dot in each panel represents the location of landfall of tropical cyclone
Pam over Vanuatu islands.
4.1.2 Monsoons
The Monsoon subproject aims to assess the current capability to forecast monsoon sub‐seasonal
variability, including break/active episodes and onset across all of the major monsoon regions. A
monsoon sub‐project wiki page was developed, along with the project plan, and both are available
at: http://s2sprediction.net/xwiki/bin/view/Main/Monsoon. A project team was established: Harry
Hendon and Andrew Marshall (BoM), A.K. Sahai (IITM, India), Bin Wang (U Hawaii), Alice Grimm
(Federal University of Parana, Brazil). The Asian‐Australian Monsoon Working Group
(http://www.clivar.org/asian‐australian‐monsoon), under the Climate and Ocean: Variability,
Predictability and Change Global Energy and Water cycle Exchanges (CLIVAR‐GEWEX) Monsoon
Panel, agreed to promote the sub‐project, especially to promote systematic evaluation of monsoon
S2S predictions across all S2S models and to act as a source for analysis code and other tools.
16
The initial phase of the project focused on assessing predictive capability for active/brake episodes
in the Australian and Indian summer monsoons. In order to provide a standard verification metric,
daily indices for area‐mean rainfall in the Australian summer monsoon (based on Marshall and
Hendon, 2016) and for the core zone of the Indian summer monsoon (based on Rajeevan et al. 2010)
have been computed for 1980‐present. These indices, updated in real time, can be downloaded
from http://s2sprediction.net/xwiki/bin/view/Main/Monsoon .
The index for the Australian summer monsoon was used to assess S2S skill with the Bureau of
Meteorology (BoM) POAMA S2S model (Marshall and Hendon 2015). The role of the MJO for
modulating the monsoon and the POAMA model’s capability to depict this modulation was also
assessed. This study showed that the MJO produces about an 8 to 1 modulation of the occurrence of
monsoon wet episodes across its life cycle, with wet periods preferentially occurring in MJO phase 6.
The POAMA S2S model faithfully captured this modulation and is able to predict the MJO to at least
3 weeks lead. However, skilful prediction of monsoon‐mean rainfall was limited to less than 2 week
lead time (Marshall and Hendon 2015), which emphasises that although the MJO is a primary driver
of monsoon variability, many other processes are involved.
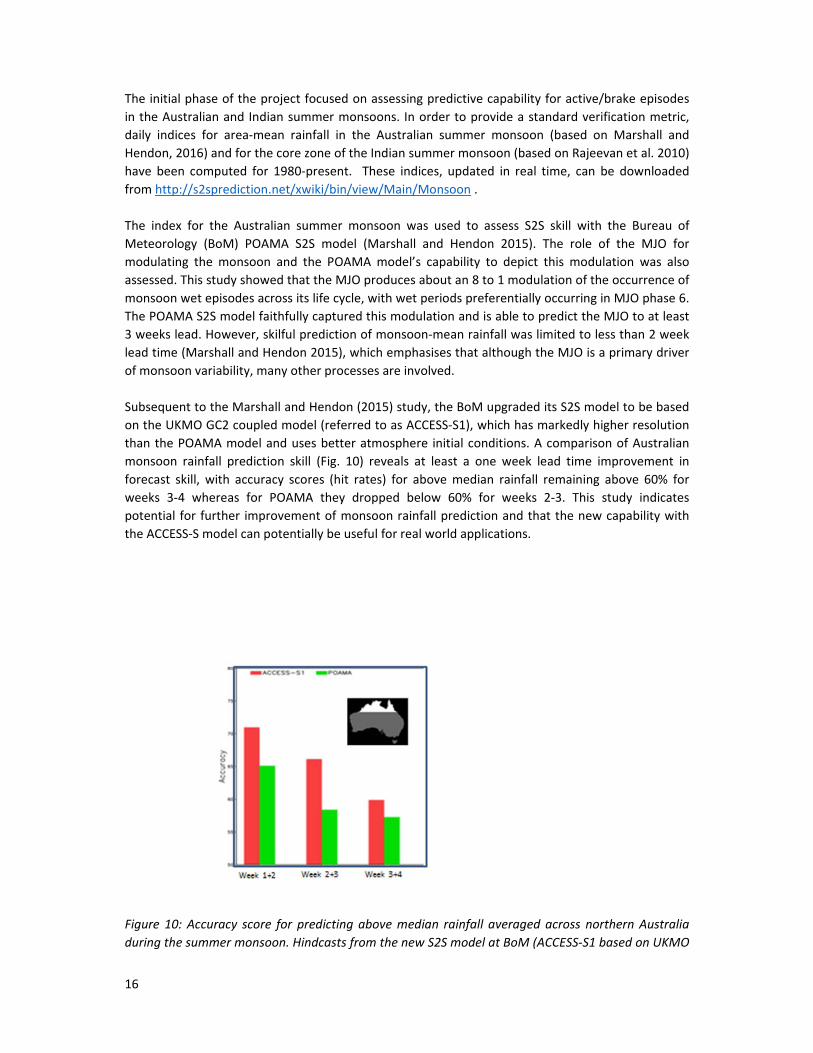
Subsequent to the Marshall and Hendon (2015) study, the BoM upgraded its S2S model to be based
on the UKMO GC2 coupled model (referred to as ACCESS‐S1), which has markedly higher resolution
than the POAMA model and uses better atmosphere initial conditions. A comparison of Australian
monsoon rainfall prediction skill (Fig. 10) reveals at least a one week lead time improvement in
forecast skill, with accuracy scores (hit rates) for above median rainfall remaining above 60% for
weeks 3‐4 whereas for POAMA they dropped below 60% for weeks 2‐3. This study indicates
potential for further improvement of monsoon rainfall prediction and that the new capability with
the ACCESS‐S model can potentially be useful for real world applications.
Figure 10: Accuracy score for predicting above median rainfall averaged across northern Australia
during the summer monsoon. Hindcasts from the new S2S model at BoM (ACCESS‐S1 based on UKMO

17
GLOSEA5) and the older S2S POAMA system are used for forecasts initialized on 1 Oct, 1 Nov, 1 Dec, 1
Jan, 1 Feb, and 1 Mar 1990‐2012. The ACCESS‐S1 system has much improved skill over POAMA due to
improved atmospheric initial and model.
Similar assessment of S2S predictions for the Indian summer monsoon using the CFS S2S model
implemented at IITM was provided in Sahai et al. (2016). Forecast skill for pentad mean core‐zone
rainfall was found to extend to ~3 pentad lead time, similar to that found by Marshall and Hendon
(2015) for the Australian summer monsoon using the POAMA S2S model. Joseph et al. (2015)
developed an index to monitor monsoon onset for the Indian summer monsoon, which is suitable to
be used to assess S2S predictions of onset.
The Marshall and Hendon (2015) and Sahai et al (2016) assessments of S2S forecast skill for the
Australian and Indian summer monsoons, respectively, are envisioned to be prototype studies for
assessments of all other models in the S2S data base and for other monsoon regions. A project to
assess predictive skill for monsoon onset, which is a societally important event, has been designed
and can be executed in the upcoming year. This project will be coordinated with the GEWEX/CLVAR
Asian‐Australian Monsoon Working Group.
Publications
Joseph S., Sahai A.K., Abhilash S., Chattopadhyay R., Borah N., Mapes B.E., Rajeevan M., Kumar A.
2015: Development and evaluation of an objective criterion for the Real‐Time Prediction of Indian
Summer Monsoon onset in a coupled model framework, J. Climate, 28, 6234‐6248.
Marshall, A.G. and Hendon, H.H., 2015. Subseasonal prediction of Australian summer monsoon
anomalies. Geophysical Research Letters, 42(24).
Sahai A.K., Abhilash S., Chattopadhyay R., Borah N., Joseph S., Sharmila S, Rajeevan M., 2015: High‐
resolution operational monsoon forecasts: an objective assessment. Clim Dyn., 44, 3129‐3140
4.1.3 Teleconnections
The teleconnection sub‐project was established in 2015 due to the emerging evidence of
atmospheric teleconnections being an important modulator of high‐impact weather events and
representing an untapped source of subseasonal‐to‐seasonal predictability. The scientific objective
of the teleconnection sub‐project is to advance the understanding of the basic science underlying
the two‐way tropical‐midlatitude interactions, and to use this understanding to advance prediction
of weather in general and of high impact events in particular. The goals of the project include: (a)
coordinating of scattered information on observational sources of tropical heating (satellite based
observations and radiative fluxes and modern reanalysis); (b) designing and coordinating innovative
numerical experiments; (c) developing metrics and process level diagnostics for evaluation of
teleconnections and their associated mechanisms; and (c) identifying particular applications and
improved forecast products.
The Teleconnection sub‐project identified the lack of a conceptual framework allowing the potential
predictability from translating into a germane skill score authored a review article “Review of
Tropical‐Extratropical Teleconnections on Intra‐seasonal Time Scale”. The article synthesizes the
development over time of the progress in understanding the observed characteristics of intra‐

18
seasonal tropical – extratropical interactions and their associated mechanisms, identifies the
significant gaps, and recommends new research endeavors to address the remaining challenges.
To achieve the sated goals the Teleconnection sub‐project developed an international, virtual field
campaign “The Year of Tropics‐Midlatitudes Interactions and Teleconnections” (YTMIT) taking place
between Mid 2017–Mid 2019. The YTMIT held its first workshop in June 2016 at George Mason
University in Fairfax Virginia, USA. The purposes of this preparatory meeting were to: (1) Focus on
the key tropical interactions which are either not understood, not observed or missing in numerical
models, with the clear goal of improving the simulation and prediction of the large scale tropical
organization of diabatic heating; (2) Understand those properties of the diabatic heating which are
critical for the generation of remote teleconnections; and (3) Further our understanding of tropical‐
extratropical interactions. The meeting also serve as a venue for connecting with the MJO Task force
and identify common interests.
The kick off meeting of the YTMIT project was held in connection with the 5th WGNE workshop on
systematic errors in weather and climate models hosted by Environment and Climate Change
Canada (ECCC) in Montreal, Canada, from 19‐23 June 2017.
A number of S2S‐related research projects addressing the science objectives of YTMIT are unfolding
in US and Europe: Advanced diagnostics for tropical‐midlatitude interactions and teleconnections on
intra‐seasonal time scales supported by NOAA/NWS/NGGPS; YTMIT‐CalWater2015 Atmospheric
Rivers and their teleconnections sponsored by U.S. Department of Energy; Influence of Polar and
Tropical latitude linkage with the mid‐latitude flow within the DYNAMITE project supported by the
European Union; BITMAP and InterDec supported by Belmont Forum.
The Teleconnection sub‐project is the organizer of the training activity “Advanced school on
Tropical‐Extratropical Interactions on Intra‐seasonal Time scales”. The school is hosted by ICTP
(Trieste, Italy) and co‐sponsored by WMO.
The Teleconnection sub‐project organized a poster‐session dedicated to YTMIT at the AGU Fall 2016
meeting.
The Teleconnection sub‐project is coordinating its activities with WMO projects with synergistic
activities. A suite of diagnostics for evaluating the mid‐latitude large–scale weather regimes is being
developed collaboratively with WGSIP which will provide a useful tool to analyse the S2S database,
and relaxation‐type numerical experiments are coordinated with YOPP. With the S2S database,
studies are being conducted to evaluate the impact of teleconnections on forecast skill. An example
of ECMWF forecast evaluation with respect to weather regimes in the North Atlantic sector is shown
in Figure 11.

19
Figure 11: Euro‐Atlantic cluster verification of S2S ensemble forecasts from ECMWF initialized on 15
Feb 2000. The four panels correspond to the 500 hPa geopotential height circulation regimes
indicated: Scandinavian Block (upper left), Atlantic Ridge (upper right), NAO‐ (lower left), NAO+
(lower right). The x‐axis indicates forecast day (with 1 being the initial time). The black (blue) bars
indicate the number of ensemble members with anomaly pattern correlation over 0.4 (0.5) with the
appropriate regime. Short red lines indicate that the verifying analysis is assigned to the particular
regime by the cluster analysis. The solid red curves indicate the pattern correlation between the
verifying analysis and the regime pattern indicated on the panel. (Figure courtesy of David Straus and
Laura Ferranti.)
4.1.4 Africa
The goal of the S2S Africa sub‐project is to develop skillful forecasts on the S2S time scale over Africa
and to encourage their uptake by national meteorological services and other stakeholder groups.
This is the only continent‐specific S2S sub‐project, and was created to address the potentially large
demand for skillful S2S forecasts in Africa, tailored to the needs of various stakeholders ‐ to provide
early warning for high‐impact weather events that often have large societal impacts there. Seasonal
climate forecasts are established tools for the development of climate services in Africa, promoted
by the WMO through the creation of regular Regional Climate Forums (RCOFs) in Africa, and through
WMO Regional Climate Centers in West, East, Southern and North Africa. This time scale gives an
overall view of the season statistics but doesn’t allow approximating in time the occurrence of
severe weather events. The Africa Climate Conference in 2013 witnessed a great deal of interest

20
from the African climate communities in the potential of S2S, for expanding seasonal forecast
information to sub‐seasonal scale.
The objectives of the Africa sub‐project are:
1 Assess the performance of forecasts for 5‐40 days ahead using the S2S forecast
archive, with focus on daily weather characteristics including rain‐day frequency,
heavy rainfall events, dry spells and monsoon onset/cessation dates, with relevance
to agriculture, water resources and public health.
2 Develop metrics for measuring the success of forecasts in ways that are useful to
farmers and other stakeholder communities, and that allow verification and
improvement of model skill through bias correction and better model diagnostics.
3 Work with the post‐Africa Climate Conference 2013 framework to connect
international with African climate science communities, as well as with operational
and user communities in a participatory two‐way process.
Several funding proposals were written to pursue these objectives, to the Norway GFCS fund (2014),
FutureEarth (2014), ClimDev/CR4D Africa (2015), and DFID‐SHEAR (2015). While the GFCS fund and
Department for International Development (DFID) proposals were unsuccessful, the S2S
FutureEarth/ClimDev/CR4D proposals led CR4D (Climate Research for Development in Africa) to
create pilot activities on S2S in Africa, directed toward the S2S Africa sub‐project objectives,
beginning from the end‐user context. CR4D was launched to strengthen links between climate
science research and climate information needs in support development planning in Africa, and grew
out of the Africa Climate Conference 2013. Two regional pilots were funded, one each in Central and
West Africa.
The Central Africa project (PI: W. Pokam, U. Yaoundé, Cameroon) activities were (1) to present the
current state of climate service for agriculture over CA; (2) highlight climate information needed by
farmers; (3) define meaningful climate index related to information need by farmers; and to (4)
assess the skill of climate model predictions at S2S timescales over Central Africa. An S2S training
event was organized in 2016, after which 5 models from the S2S database were analyzed (BoM,
NCEP, ECMWF, HMCR and CMA), and forecast performance assessed targeting the onset date of
growing season, and maximum dry spell duration during the rainy season. Broadly, models show
better skill to depict dry spell duration during the rainy season. All Models show in general good skill
in forecasting the maximum dry spell duration, except some area like southern humid forest in
Cameroon and coastal part of DRC where they tend to show very weak skill. For onset date of the
growing season, models show highest skills to capture mean climatological onset date of growing
season, and some of them present deficiencies in forecasting earlier and latter onset date events.
Broadly, considering criteria used in operational, some models present good scores up to lead time
3‐4 week in Cameroon, while in DRC predictability is of order of 2‐3 Week. However, application of
less rigid criteria on models improve their skills, leading to predictability up to 3‐4 week for the two
countries.
Work plan for further investigation on S2S prediction over Central Africa includes extend the study
to others countries in the region, using countries climate zone analysis approach rather than local

21
(station observation’s scale) analysis approach. Moreover, methods used to estimate onset date of
growing season were using an agricultural definition are only locally applicable. It is necessary to use
a method suitable for region with different rainfall totals and which can ingest local specificities. A
method taking into account potential biases from data set will be consider.
Over West Africa, a tentative study was initiated under the coordination of ACPC. The proposal aimed to assess skill of S2S models of extreme events. The rainfall events during September 2009 was identified as case study. Due to administrative problems, the project did not get through. It is important to note also the training workshop co‐organized by ICTP and Senegalese National weather service during 21‐25 November 2016. This training used the WGSIP expert meeting to have faculties participated in the training. More than 30 fellows coming from mostly from west Africa and beyond were trained with hands on S2S technics
In South Africa research proposals are being developed for funding provided by local institutions such as the Water Research Commission and the National Research Foundation. The main themes to be explored and the local institutions identified to do the work include: (i) Configuring models administered in South Africa to produce S2S output for contributing to the S2S archive [Council for Scientific and Industrial Research (CSIR)]; (ii) Predictability studies, including forecast verification [Universities of Pretoria (UP) and Cape Town (UCT), Agricultural Research Council (ARC), CSIR, South African Weather Service (SAWS)]; (iii) Statistical downscaling [SAWS, UP, UCT]; (iv) Applications models for crop, livestock and streamflows [ARC, UP, UCT, CSIR]; (v) S2S dynamics of atmospheric circulation [UP, UCT, ARC, CSIR, SAWS]; (vi) Sources of predictability (MJO, QBO, ENSO, external forcing) [CSIR, UP, UCT, ARC, SAWS]; (vii) Statistical and dynamical analysis of weather systems/regimes [ARC, UP, CSIR]; (viii) Information content and users sectors/communities [UCT]
New UK funding opportunities have arisen for research in support outcomes that promote the long‐
term sustainable growth of countries on the OECD Development Assistance Committee (DAC) list.
The National Centre for Atmospheric Science led a successful proposal, African‐SWIFT, which will
start in October 2017, to improve research capability and capacity in African Weather Forecasting
from hours to months in support of Decision Making and Hazard Early Warning. The African‐SWIFT
partners include Universities and Research Centres in the UK, the UK Met Office; partner Universities
and Met Services in each of Ghana, Kenya, Nigeria and Senegal; along with Regional Centres at IPCAC
and ACMAD; and the WMO. On S2S timescales the project includes research on the drivers of intra‐
seasonal variability for African weather; the skill of operational prediction systems on these
timescales, including “windows of opportunity”; the development on operational research products
exploit; and forecaster training and testbeds, and will make extensive use of the S2S database.
4.1.5 Verification and products
The S2S subproject on verification was established with the objective of recommending verification
metrics and datasets for assessing S2S forecasts quality, and also providing guidance for a potential
centralized effort for comparing the quality of different S2S forecast systems, including the
comparison of multi‐model and individual forecast systems, and considering linkages with users and
applications.
This sub‐project has links with the WMO Joint Working Group on Forecast Verification Research
(JWGFVR), the WMO CBS/CCl Expert Team on Operational Predictions from Sub‐seasonal to Longer
time scales (ET‐OPSLS), the WMO Lead Centre for Long‐Range Forecast Multi‐Model Ensemble (LC‐
LRFMME) and other S2S sub‐projects. A science plan was developed and is envisaged as a guidance

22
document to stimulate the scientific community to address S2S verification problems and questions.
The science plan is available at http://www.s2sprediction.net/resources/documents/sub‐
projects/Verification.pdf. The science community response was overwhelming, resulting in a number
of publications (Ardilouze et al, 2017; Coelho et al. 2017; DelSole et al., 2017; Drosdowsky and
Wheeler, 2017; Johnson et al., 2014; Li and Robertson, 2015; Liang and Lin, 2017; Liu et al., 2017;
Marshall et al., 2016; Mastrangelo and Malguzzi, 2017; Osman and Alvarez, 2017; Wheeler et al.,
2016).
A dedicated Wiki page was implemented as the main channel for the subproject activities
dissemination and is accessible at http://s2sprediction.net/xwiki/bin/view/Main/Verification.
Originally the subproject was focused solely on forecast verification aspects, but it was later decided
to also consider forecast products aspects, and therefore the subproject was re‐labelled to
verification and products. Several subproject activities have been performed and are disseminated
via the wiki including:
‐ A list of published literature on verification methods relevant to S2S verification, including
books, technical reports and scientific papers.
‐ A literature survey on S2S verification, including a list of publications on S2S verification
addressing the following topics: Assessment of S2S systems forecast skill, assessment of
MJO/ISO forecast skill, assessment of monsoon systems forecast skill and associated
characteristics, S2S applications, and seamless verification.
‐ The collaboration between S2S and WMO: A questionnaire on subseasonal verification
practices in operational centers (GPC) was developed and applied, with the purpose of
sharing current practices used to verify subseasonal forecasts (both for operations and
research) and also to help identify gaps and guide novel developments.
‐ The development of pilot real‐time sub‐seasonal multi‐model ensemble (MME) predictions:
The WMO LC‐LRFMME developed a pilot system for real‐time multi‐model subseasonal
forecasts using real‐time forecasts (and hindcasts) from a subset of models contributing to
the S2S project accessible via ECMWF data archive.
‐ The coordination of input for the WMO ET‐OPSLS on S2S application areas under
development and operational needs.
‐ The provision of a comprehensive collection of links to available datasets for S2S verification,
including links to the IRI data library and the KNMI Climate Explorer.
‐ The provision of links and instructions on how to access S2S project model datasets. This
includes a summary table of S2S project models, links for accessing S2S models data at
ECMWF and CMA data portals, links to instructions on how to extract S2S models data from
ECMWF S2S portal, and links to the IRI Data Library for accessing a subset of these data
(from ECMWF, NCEP and CMA models) in various file formats, including OpenDAP access.
‐ The provision of links to S2S forecast products webpages developed by ECMWF and the S2S
Museum (University of Tsukuba/Oxford).
‐ The 7th International Verification Methods Workshop (7IVMW), Berlin, Germany, 8‐11 May
2017, preceded by a tutorial on forecast verification methods, 3‐6 May 2017. This workshop
was organized by the WWRP/WGNE JWGFVR and featured a dedicated session on S2S
forecast verification (http://www.7thverificationworkshop.de/).
‐ A forecast verification chapter was produced with contributions of JWGFVR members for the
S2S book which will be published by Elsevier in 2019.
23
Two proposals were written to support the development of S2S verification and products. The
first proposal was submitted to a NOAA call in 2014 and included the development of a
verification portal to serve as a centralized verification facility for the 11 ensemble prediction
systems from operational centers that form the S2S data archive, but unfortunately this proposal
was unsuccessful. The second proposal was submitted to a Belmont forum climate services call
in 2015 and was successful having the "Climate services through knowledge co‐production: A
Euro‐South American initiative for strengthening societal adaptation response to extreme events
(CLIMAX)” project funded since 2016 for 4 years. The collaborating institutions involved in
CLIMAX are: CNRS, IRD and LSCE (France), CPTEC/INPE (Brazil), Wageningen University
(Netherlands), Technical University Munich (TUM) and Potsdam‐Institute for Climate Impact
Research (PIK), Germany. CLIMAX has a strong connection with the WMO Southern South
America Regional Climate Center (SSA‐RCC).
Publications
Ardilouze, C., Batté, L., Déqué, M., 2017: Subseasonal‐to‐seasonal (S2S) forecasts withCNRM‐
CM: a case study on the July 2015 West‐Europeanheat wave. Adv. Sci. Res., 14, 115–121.
doi:10.5194/asr‐14‐115‐2017
Coelho C.A.S. Firpo, M.A.F, Maia, A.H.N, MacLachlan, C., 2017: Exploring the feasibility of
empirical, dynamical and combined probabilistic rainy season onset forecasts for São Paulo,
Brazil. International Journal of Climatology.
http://onlinelibrary.wiley.com/doi/10.1002/joc.5010/abstract
DelSole, T., Trenary L., Tippett, M.K., Pegion, K., 2017: Predictability of Week‐3–4 Average
Temperature and Precipitation over the Contiguous United States. Journal of Climate. Vol 30,
3499‐3512. https://doi.org/10.1175/JCLI‐D‐16‐0567.1
Drosdowsky, W., Wheeler, M.C., 2017: Extended‐Range Ensemble Predictions of Convection in
the North Australian Monsoon Region. Fontiers in Earth Science. Vol 5. doi:
10.3389/feart.2017.00028
Johnson, N.C., Collins D.C., Feldstein, S.B., L’Heureux, M.L., Riddle, E.E., 2014: Skillful Wintertime
North American Temperature Forecasts out to 4 Weeks Based on the State of ENSO and the
MJO. Weather and Forecasting. Vol 29. 23‐38.
Li, S., Robertson A.W., 2015: Evaluation of Submonthly Precipitation Forecast Skill from Global
Ensemble Prediction Systems. Mon. Wea. Rev. Vol. 143. 2871‐2889.
Liang, P., Lin, H., 2017: Sub‐seasonal prediction over East Asia during boreal summer using the
ECCC monthly forecasting system. Climate Dynamics. DOI 10.1007/s00382‐017‐3658‐1
Liu, X., Wu, T., Yang, S., Li, T., Jie, W., Zhang, L., Wang, Z., Liang, X., Li, Q., Cheng, Y., Ren, H.,
Fang, Y., Nie, S., 2017: MJO prediction using the sub‑seasonal to seasonal forecast model of
Beijing Climate Center. Climate Dynamics, Vol. 48, 3283–3307. DOI 10.1007/s00382‐016‐3264‐7
Marshall, A.G., Hendon, H.H. and Hudson, D., 2016. Visualizing and verifying probabilistic
forecasts of the Madden‐Julian Oscillation. Geophysical Research Letters, 43(23).
Mastrangelo, D., Malguzzi, P., 2017: CNR‐ISAC 2m temperature monthly forecasts: a first
probabilistic evaluation. Adv. Sci. Res., 14, 85–88, doi:10.5194/asr‐14‐85‐2017
24
Osman, M., Alvarez, M.S., 2017: Subseasonal prediction of the heat wave of December 2013 in
Southern South America by the POAMA and BCC‐CPS models. Climate Dynamics. DOI:
10.1007/s00382‐016‐3474‐z
Wheeler, M.C., Zhu, H., Sobel, A.H., Hudson, D., Vitart, F., 2016: Seamless precipitation
prediction skill comparison between two global models. Q. J. R. Meteorol. Soc. (2016)
DOI:10.1002/qj.2928
4.1.6 Madden‐Julian Oscillation (MJO)
The science plan, membership and additional information on the MJO S2S sub‐project are available
at: http://s2sprediction.net/xwiki/bin/view/Main/MJO. Working in concert with the WCRP‐
WWRP/WGNE MJO Task Force, this subproject includes a focus on research, model evaluation
and predictability/prediction skill studies on the interactions between the Maritime Continent (MC)
and the MJO, including an effort to improve local MC forecast skill, resources and collaboration.
This additional focus is motivated by the perception that the MC represents a natural predictability
barrier for the MJO that is exacerbated by limited understanding of the MC as a natural
predictability barrier and also to a great extent by our limitations in model representations of the
MJO and MC interactions.
The main goals of the MJO sub‐project include:
1. Assess current model simulation fidelity and prediction skill, including identifying systematic model biases, over the Maritime Continent (MC) across time scales, with emphasis on the MJO.
2. Evaluate the roles of: a) multi‐scale interactions, b) topography and land‐sea contrast, and c) ocean/land‐atmosphere coupling in MC‐MJO interaction and how they influence predictability and prediction skill over the MC.
3. Consider the effects of the MJO‐MC interactions on extra‐tropical forecast skill. This will be in collaboration with the Teleconnections Subproject.
4. Develop a collaborative relationship between the S2S Project / MJO Task Force and one or more local MC meteorological agencies and their representatives in order to identify weaknesses in available sub‐seasonal forecasts and better target areas for forecast improvement and product generation.
The table below highlights a number of ongoing research efforts that include support for addressing
the above objectives:
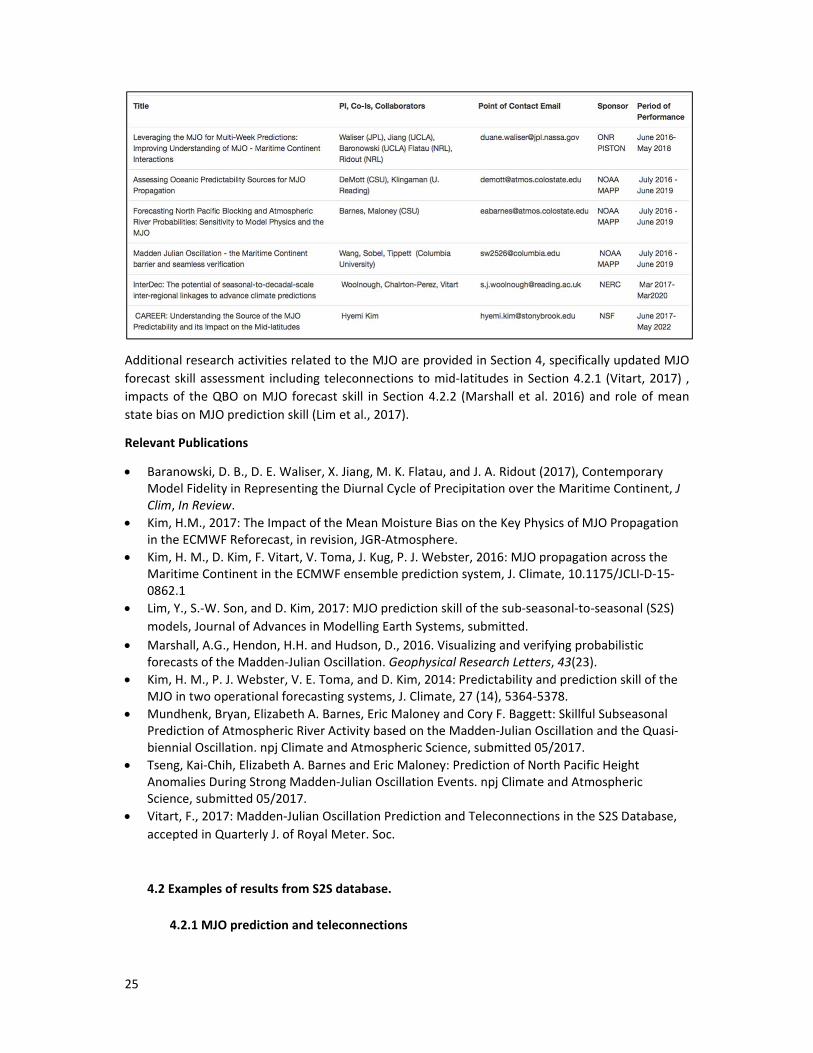
25
Additional research activities related to the MJO are provided in Section 4, specifically updated MJO
forecast skill assessment including teleconnections to mid‐latitudes in Section 4.2.1 (Vitart, 2017) ,
impacts of the QBO on MJO forecast skill in Section 4.2.2 (Marshall et al. 2016) and role of mean
state bias on MJO prediction skill (Lim et al., 2017).
Relevant Publications
Baranowski, D. B., D. E. Waliser, X. Jiang, M. K. Flatau, and J. A. Ridout (2017), Contemporary Model Fidelity in Representing the Diurnal Cycle of Precipitation over the Maritime Continent, J Clim, In Review.
Kim, H.M., 2017: The Impact of the Mean Moisture Bias on the Key Physics of MJO Propagation in the ECMWF Reforecast, in revision, JGR‐Atmosphere.
Kim, H. M., D. Kim, F. Vitart, V. Toma, J. Kug, P. J. Webster, 2016: MJO propagation across the Maritime Continent in the ECMWF ensemble prediction system, J. Climate, 10.1175/JCLI‐D‐15‐0862.1
Lim, Y., S.‐W. Son, and D. Kim, 2017: MJO prediction skill of the sub‐seasonal‐to‐seasonal (S2S)
models, Journal of Advances in Modelling Earth Systems, submitted. Marshall, A.G., Hendon, H.H. and Hudson, D., 2016. Visualizing and verifying probabilistic
forecasts of the Madden‐Julian Oscillation. Geophysical Research Letters, 43(23).
Kim, H. M., P. J. Webster, V. E. Toma, and D. Kim, 2014: Predictability and prediction skill of the MJO in two operational forecasting systems, J. Climate, 27 (14), 5364‐5378.
Mundhenk, Bryan, Elizabeth A. Barnes, Eric Maloney and Cory F. Baggett: Skillful Subseasonal Prediction of Atmospheric River Activity based on the Madden‐Julian Oscillation and the Quasi‐biennial Oscillation. npj Climate and Atmospheric Science, submitted 05/2017.
Tseng, Kai‐Chih, Elizabeth A. Barnes and Eric Maloney: Prediction of North Pacific Height Anomalies During Strong Madden‐Julian Oscillation Events. npj Climate and Atmospheric Science, submitted 05/2017.
Vitart, F., 2017: Madden‐Julian Oscillation Prediction and Teleconnections in the S2S Database,
accepted in Quarterly J. of Royal Meter. Soc.
4.2 Examples of results from S2S database.
4.2.1 MJO prediction and teleconnections

26
The S2S database represents an important resource for assessing the skill of current state‐of‐the‐art operational system to predict the Madden‐Julian Oscillation. In Vitart (2017), the MJO has been diagnosed using the index calculation described in Wheeler and Hendon (2004) and Gottschalk et al. (2010) and verified using the methodology described in Rashid et al. (2010). The index has been applied to re‐forecast anomalies relative to the common re‐forecast period 1999‐2010 in a cross‐validated way (the actual year of the re‐forecast is excluded from the index calculation). Figure 12 shows the evolution of the bivariate correlation for each model ensemble mean as a function of the lead forecast time for all seasons.
Figure 12: Evolution of the MJO bivariate correlation between the model ensemble means and ERA Interim as a function of lead time for 10 S2S models. The MJO bivariate correlations have been calculated over the period 1999‐2010 for all the seasons. The cyan shaded area represents the 95% level of confidence computed from a 10,000 bootstrap re‐sampling procedure.
Accurate predictions of MJO events are not sufficient for successful sub‐seasonal forecasts. The ability to predict the impact of MJO events on the global circulation is crucial. Using re‐analysis data, Cassou (2008) and Lin et al. (2009) showed that the impact of the MJO on European weather is the strongest about 10 days after the MJO is in Phase 3 or Phase 6. The probability of a positive phase of the NAO is significantly increased about 10 days after the MJO is in Phase 3 (Phase 3 + 10 days), and significantly decreased about 10 days after the MJO is in Phase 6 (Phase 6 + 10 days). The probability of a negative phase of the NAO is decreased (increased) about 10 days after the MJO is in Phase 3 (Phase 6). The impact of the MJO on two other Euro‐Atlantic weather regimes, the Atlantic Ridge and Scandinavian blocking, is much weaker. Vitart and Molteni (2010) showed a set of ECMWF reforecasts using cycle 32R3 displaying realistic MJO teleconnections over the Northern Extratropics, consistent with the impact Cassou (2008) and Lin et al. (2009) found in re‐analysis data and Lin et al.

27
(2010) found that the MJO has a significant impact on the intra‐seasonal NAO skill scores in the ECCC model. To assess if the S2S models can simulate adequately the MJO teleconnections, 500 hPa geopotential height composites 3 pentads after an MJO in Phase 3 have been produced for each S2S model (Fig. 13). Only the reforecasts covering the period from January to April have been considered.
Figure 13: MJO Phase 3 3‐pentad lagged composites of 500 hPa geopotential height anomaly from ECMWF, NCEP, JMA and BoM over the Northern Extratropics for the period January to April 1999 to 2010 (common re‐forecast period) and ERA‐Interim (left panel). Red colors indicate positive anomalies. Blue colors indicate negative anomalies. The contours are plotted every 10 meters.
Figure 13 shows that the models generally capture the spatial pattern of the teleconnection but tend to overestimate the intensity of the MJO teleconnections in the North Pacific and underestimate its projection onto the positive phase of the NAO over the North Atlantic basin. This underestimation could be explained by the analysis being based on a single observed realization whereas the model composites are averaged over several ensemble members. Since not a single ensemble member reproduced the intensity of the teleconnection in the North Atlantic sector as strongly as in the analysis, it follows that underestimation of the MJO impact over the Atlantic is a real deficiency, common to several models. The under‐representation of the MJO impact over the Euro‐Atlantic sector is likely to limit the predictability and predictive skill over Europe in the sub‐seasonal time range and therefore is an important aspect to be analyzed.
4.2.2 QBO‐MJO link in S2S Models
MJO activity varies strongly from year‐to‐year (e.g., Salby and Hendon 1994), meaning that in some years its impacts on local weather and climate (e.g. for modulating tropical cyclone formation and monsoon break episodes) will be stronger and in some years weaker. The cause of the year‐to‐year variability of MJO amplitude is not well understood. ENSO, which is the strongest modulator of interannual variations of tropical convection, has limited impact on the seasonal‐mean amplitude of MJO, although it does strongly act to shift the MJO into eastern Pacific during El Nino (e.g. Sone et al. 2017). Recently, however, a strong connection between the amplitude of the MJO during boreal

28
winter and the stratospheric Quasi Biennial Oscillation (QBO) has been detected (e.g. Yoo and Son 2016; Son et al. 2017), whereby during QBO east years (where the QBO is defined by the sign of the zonal mean zonal wind at 50 hPa) the MJO amplitude is increased. Since 1979, the QBO accounts for ~50% of the interannual variance of MJO amplitude. Although the mechanism for the impact of the QBO on the wintertime MJO is still being investigated, an immediate implication of this result is that the MJO should potentially be more predictable during QBO east years when the MJO is stronger.
Marshall et al. (2016) indeed show this to be the case using the BoM POAMA S2S model: for
hindcasts during 1980‐2015, the lead time for predictability of the MJO, assessed using the bivariate
correlation of the RMM indices, is about 1 week longer during east years than during west years. Lim
et al (2016) confirmed this result using 6 models from the S2S data base, which all had at least 15
years of hindcasts (Fig. 14). For all models, predictive skill extends to longer lead time during QBO
east years. Marshall et al. (2016) and Lim et al. (2016) show that this result is not simply due to the
MJO being overall stronger during QBO east years, such that there is stronger signal to noise in those
years, hence improved prediction. Rather, they show that for a given similar amplitude of the MJO at
the initial forecast time, the MJO is systematically better predicted during east years. That is, the
MJO behaves differently in the east years, such that it more systematically propagates eastward with
more coherence compared to west years.
The S2S models include models with well resolved stratospheres (e.g. ECMWF) and models with
limited depiction of the stratosphere (e.g., BoM POAMA). So, at this point it is unclear if an impact of
the QBO on the MJO is being simulated during the forecasts, or whether the improved skill derives
simply from the observed MJO exhibiting more predictable behavior during east years. This more
predictable behavior (ie the MJO is more cyclically persistence), presumably derives from the impact
of the QBO but does not necessarily have to be explicitly modelled in order for predictive skill to
benefit from the effect. Ongoing research is examining the possible mechanisms of the impact of the
QBO on the MJO and the potential benefit of resolving the QBO for improved S2S prediction of the
MJO.
References
Lim, Y., S. Son, A.G. Marshall, and H. Hendon: 2016: Predictability of Madden‐Julian Oscillation and
its relationship with Quasi‐Biennial Oscillation. Presented at the SPARC DynVar Workshop, Helsinki.
Marshall, A.G., Hendon, H.H., Son, S.W. and Lim, Y., 2016. Impact of the quasi‐biennial oscillation on
predictability of the Madden–Julian oscillation. Climate Dynamics, pp.1‐13, DOI: 10.1007/s00382‐
016‐3392‐0.
Salby, M.L. and Hendon, H.H., 1994. Intraseasonal behavior of clouds, temperature, and motion in the tropics. Journal of the Atmospheric Sciences, 51(15), pp.2207-2224.
Son, S., Y. Lim, C. Yoo, H.H. Hendon, and J. Kim, 2017: Stratospheric Control of the Madden–Julian
Oscillation. J. Climate, 30, 1909–1922, https://doi.org/10.1175/JCLI‐D‐16‐0620.1
29
Figure 14: MJO prediction skill, based on bivariate correlation of the RMM indices, during DJFM for six S2S models. Light, medium, and dark bars indicate, respectively, lead day when the MJO bivariate correlation reaches 0.5, 0.6, and 0.8. Black bars are for all years, blue bars for QBO easterly years and red bars are QBO westerly years (QBO defined by sign of zonal mean zonal wind at 50 hPa). From Lim et al. (2016)
4.2.3 Attribution of European Cold Wave, March 2013
An important area where S2S forecasts could be useful is in the attribution of the causes of extreme
events to physical phenomena. S2S forecasting systems run in real‐time quite frequently (at least
once a week) with often large ensemble size and therefore produce a very extensive dataset which
can be used to better understand the origin of some extreme events. In particular, analysing the
differences between ensemble members which successfully predicted an extreme event and those
which did not may help better understand the causality of the extreme event.
For example, March 2013 was exceptionally cold over part of western Europe (second coldest month
since 1900 over the United Kingdom), most of Russia and part of North America (Figure 6, top right
panel). This event coincided with a strong MJO event propagating into the western Pacific top left
panel in Figure 15). The 16‐member extended range ensemble forecasts from NCEP (CFS.v2) starting
from 14 February 2013 could be classified into 2 categories: those which predicted that the MJO
event which was located in Phase 3 (Indian Ocean) on 14 February 2013 would propagate into the
western Pacific, and the others (about half the ensemble members) which predicted that the MJO
would die over the Maritime Continent. The 2‐metre temperature anomalies produced from the
ensemble members with a fairly strong MJO produced a 2‐metre temperature anomaly consistent
with ERA Interim, whereas the 2‐metre temperature anomalies produced from the ensemble
members with no strong MJO in Phase 6 or 7 looks very different from the verification. This result
suggests that this MJO event and the cold wave over part of the northern Hemisphere were linked. It
is planned to extend this study to the other S2S models.

30
Figure 15: Weekly mean 2‐metre temperature anomalies (right panels) for the verifying week of 7‐13
March 2013 from ERA Interim (top panel), ensemble mean of all the NCEP forecasts starting on 14
February 2013 (lead time day 26‐32) which displayed a strong MJO (middle panel) and NCEP
forecasts with a weak MJO (bottom panel). The cold anomalies over North America and Asia (middle
right panel) are statistically significant within the 5% level of confidence. The left panel shows the
MJO forecasts using the Wheeler and Hendon index (2004) from 14 February to 14 March 2013 from
ERA interim (top), the 8 ensemble members from NCEP with the strongest MJOs (middle panel) and 8
weakest MJOs (bottom panel).
4.2.4 Multi‐model combinations/verification
Seasonal forecasting practice has highlighted the benefit of multi‐model ensembling and the need to calibrate the output of EPS models, in order to obtain forecast probabilities that are reliable (i.e. correct on average when averaged over large numbers of past forecasts or reforecasts). The S2S database presents challenges in applying the MME and calibration techniques developed for seasonal forecasts. Calibration requires the availability of sufficient reforecasts. The number of ensemble members in the S2S reforecasts is generally small, so that obtaining the forecast probabilities by simply counting the number of ensemble members that exceed a target threshold is subject to large sampling errors, while the reforecast start dates generally differ between the models, so averaging the reforecasts across models is difficult. To surmount these issues, Vigaud et al. (2017a,b) have used extended logistic regression to calibrate probabilistic precipitation forecasts for weekly and bi‐weekly averages, and to average these across 3 models for which reforecasts on Mondays and available. Figure 16 shows the RPSS week 3–4 precipitation skill for a 3‐model MME computed on the 1999–2010 period for North America in winter (a), and for boreal summer monsoon regions (c‐e), based on tercile categories. Areas of positive skill tend to be preferentially over oceans in all cases, though they do extend into some land areas. The calibration and MME is successful in yielding no areas of negative skill, so that the forecasts are on average better than climatology everywhere. The reliability diagram in panel b shows that forecast reliability in the N American case is increased by the MME compared to the individual models. The results in Fig. 16 highlight some of the challenges in developing forecasts that are sufficiently skillful to be of value.

31
Large numbers of reforecast years are needed to determine whether the skill is enhanced conditional on particular phases of the MJO, ENSO, and the QBO.
Figure 16: Ranked Probability Skill Score (RPSS) for week 3‐4 (days 15‐28) precipitation forecasts for
forecasts starts during (a) January–March, and (c–e) March–August, for the geographical regions
indicated. Panel (b) shows the reliability diagram for the JFM forecasts pooled geographically over
the domain in (a), for the 3 individual models and the MME (blue). Adapted from Vigaud et al.
(2017a,b).
4.2.5 Role of mean state bias on MJO prediction skill
Lim et al. (2017) highlighted the critical role of the mean state bias on MJO prediction. Figure 17
from Lim et al. (2017) shows that models with smaller bias in the horizontal moisture gradient tend
to have higher MJO prediction skill (left) and smaller errors in MJO amplitude (middle) and phase
(right). The meridional gradient shows tighter relationships than the zonal gradient, suggesting a
bigger role that the meridional moisture gradient might play in determining MJO performance. This
result is consistent with the collective evidence from theory, observations, and modelling that has
emphasized the role of the basic state moisture distribution on the propagation of the MJO. The bias
in the horizontal moisture gradient is associated with the dry bias near the Maritime Continent and
the eastern Indian Ocean, which is common to many S2S models (Lim et al. 2017). The results of Lim
et al. (2017) warrant efforts to identify process‐level causes of the common dry bias.
0 0.2 0.4 0.6 0.8 10
0.2
0.4
0.6
0.8
1
Forecast frequency
Ob
serv
ed
fre
qu
en
cy
Forecast probability
CC
ECMWF week 3‐4 MME week 3‐4
CMA week 3‐4 NCEP week 3‐4
(a) (b)
(c) (d) (e)

32
Figure 17: Relationship between the model mean biases in horizontal moisture gradient and the MJO
prediction skill, initialized in MJO phases 2‐3, at the forecast lead time of two weeks: (upper) scatter
plot between zonal‐moisture‐gradient bias versus (a) bivariate correlation skill of the real‐time
multivariate MJO index (BCOR), (b) mean‐squared MJO amplitude error ( ), and (c) mean‐squared
MJO phase error ( ). (d‐f) same as (a)‐(c) except with meridional‐moisture‐gradient bias. The zonal
moisture gradient is obtained by taking the difference between area‐averaged mean moisture over
the Eastern (100°he zonal moiS‐10°N) and Western (60°n‐80°E, 10°S‐10°N) Indian Ocean, while the
meridional moisture gradient is obtained as the difference between area‐averaged mean moisture
over equatorial (60°0an20°E, 5°S‐5°N) and subtropical (60°0an20°E, 25°S‐20°S and 60°0an20°E, 15°N‐
20°N) regions. The number in the left‐bottom corner indicates correlation coefficient between the
two quantities. Correlation coefficient that is statistically significant at the 95% confidence level is
denoted with asterisk.
5. Spawning of S2S regional research activities
A number programmatic efforts targeting S2S have emerged around the world since 2013:
Activities over Africa are summarized under the Africa sub‐project in Sect. 4.1.
In the USA, NOAA’s Climate Program Office (Modeling, Analysis, Prediction and Projections program
‐ MAPP) and National Weather Service have both initiated multi‐year research priorities on S2S
predictability and forecasting since 2014. NOAA MAPP has built a large S2S Task Force of PIs
(http://cpo.noaa.gov/Meet‐the‐Divisions/Earth‐System‐Science‐and‐Modeling/MAPP/MAPP‐Task‐
Forces/S2S‐Prediction‐Task‐Force), and launched a multi‐model sub‐seasonal Climate Test Bed

33
project (SubX) that will issue sub‐seasonal forecasts in real time in 2017–18; these initiatives have
explicitly reached out to collaborate with S2S and the MAPP Task Force PIs are making extensive use
of the S2S database. The White House issued an executive order to NOAA to develop extended
range forecasts in 2014, after which CPC began issuing week 3–4 experimental probabilistic outlooks
for the U.S. in late 2015. A National Research Council study on Developing a U.S. Research Agenda to
Advance Subseasonal to Seasonal Forecasting (National Academies of Sciences, Engineering, and
Medicine. 2016) made extensive reference to the S2S project, and extended the S2S range of
timescales from two weeks to 12 months. That study put forward an ambitious vision that “S2S
forecasts will be as widely used a decade from now as weather forecasts are today.”
In South East Asia, the ASEAN Specialized Meteorological Centre (ASMC) initiated a multi‐year S2S
programme in 2017, targeting the meteorological services in ASEAN countries. The makes explicit
reference to S2S and using the S2S database as a resource. The programme will be spread over 4
years, split into 2 phases and with 2 workshops in each phase. Activities in Phase 1 will focus on
familiarisation of the S2S concept and database, as well as extensive skill assessment of the models
available on the database. Activities in Phase 2 will focus on training in developing products for risk‐
and impact‐based predictions on the S2S timescale. The program is motivated by the anticipated
availability of real‐time S2S forecasts through the WMO Lead Centre in 2–3 years.
In South America, the CLIMAX project (funded over the 2016‐2020 period ‐ see section 4.1.5) is
investigating the skill of sub‐seasonal predictions available through the S2S project database, with
particular attention to South America. As part of CLIMAX, CIMA at the University of Buenos Aires
started producing experimental S2S monitoring and prediction tools/products
(http://climar.cima.fcen.uba.ar/) with focus on southern South America in support of the WMO SSA‐
RCC. CPTEC/INPE developed a website for monitoring daily rainfall over Brazil, with particular
attention devoted to characterizing the climatological distribution of rainy season onset and demise
dates (http://clima1.cptec.inpe.br/estacaochuvosa/pt) and also investigated the feasibility of
producing empirical, dynamical and combined probabilistic rainy season onset forecasts (Coelho et
al., 2017). The Latin American Extraordinary Events Observatory started producing experimental
sub‐seasonal monitoring and prediction products that are publicly available in their Datoteca
(http://datoteca.ole2.org/maproom/Sala_de_Mapas/index.html.es#tabs‐4), a local version of IRI’s
Data Library. The First South American School on Sub‐seasonal predictability and prediction was held
from 10‐14 Jul 2017 in Asuncion, Paraguay, bringing together experts from 10 South American
countries to discuss S2S predictability sources and physical mechanisms, data handling and
verification methods. The participants used IRI’s Climate Predictability Tool to assess the skill of
South American sub‐seasonal deterministic and probabilistic predictions of surface temperature and
rainfall, made available through the S2S project database. More information (in Spanish) is available
in the School
website: http://www.cmc.org.ve/mediawiki/index.php?title=I_Escuela_Sudamericana_de_Predicibili
dad_y_Pronóstico_Sub‐Estacional.
In India, the Indian Institute of Tropical Meteorology (IITM) has developed a multi‐model sub‐
seasonal forecasting system based on the NCEP CFSv2 model, and this was transitioned in 2016 to
operations at IMD. It is planned to include the in the S2S database. The forecasts are made year‐
round in real‐time every week on Thursday (Wed ICs) for next four weeks, using initial conditions are
from NCMRWF/INCOIS, with on the fly hindcasts for the same day from 2003 to 2016. NCMRWF
(National Center for Medium Range Weather Forecasts) has submitted a large flood forecasting
proposal to the Ministry of Earth Sciences, which will have an S2S component. Phase 2 of the

34
Monsoon Mission will include an applications focus, with an interest to develop S2S applications
over India.
6. Training activities
Eight training courses on S2S have taken place/planned since inception of the S2S project, many co‐
sponsored by the S2S project. These capacity building events have targeted young scientists in
developing countries working in national meteorological services and universities. Curricula have
included lectures on underlying S2S science, models, forecasting and verification methods, and
tailoring of forecasts for applications. Practical sessions have included accessing and downloading
data from the S2S database and analyzing skill and case studies of the sub‐seasonal predictability of
high impact weather events in the participants’ countries. Instructors have been drawn from the S2S
steering group and beyond, often with S2S members co‐developing the curricula. To date, over 100
scientists have been trained in 5 events in Italy, South Korea, Senegal, Cameroon, and Singapore,
with another two planned in 2017 in Rwanda and Paraguay.
2014
• APEC Climate Center Training Program on Subseasonal to Seasonal Prediction, 16–23 October,
2014, Busan, South Korea. Participants: 18 young scientists from National Meteorological and
Hydrological Services (NMHSs) in 16 developing countries.
2015
• Advanced School and Workshop on S2S Prediction and Application to Drought Prediction, 23
November to 4 December 2015, ICTP, Trieste, Italy. Participants: about 40 young scientist
trainees.
2016
• School on Climate System Prediction and Regional Climate Information November 21‐25, 2016,
ANACIM, Dakar, Senegal. Organized by ICTP, ANACIM, WCRP and S2S. Participants: about 25
young scientist trainees, and 10 lecturers and tutors.
• Workshop on Sub‐seasonal to Seasonal Prediction ‐ Central Africa, CIFOR‐Central Africa,
Yaounde, Cameroon, July 25–29, 2016. Participants: 9 Central African scientists.
2017
• First Workshop on Subseasonal‐to‐Seasonal Prediction for Southeast Asia (S2S‐SEA I),
Singapore, 27 Feb ‐ 3 Mar 2017. Participants: About 14 trainees from ASEAN country national
meteorological services.
• ICTP‐Rwanda Joint School on S2S Weather and Climate Prediction, 4–8 September 2017, Kigali,
Rwanda
• The First South American School on Sub‐Seasonal Predictability and Prediction was held in
Asunción (Paraguay), 10–14 July 2017 (in Spanish).
• ICTP Advanced School on Tropical‐Extratropical Interactions on Intra‐Seasonal Time Scales, 16‐
27 October 2017 http://indico.ictp.it/event/7998/

35
7. Workshops/conferences
A number of workshops and conferences have been organized (or co‐organized with other
groups) by S2S:
Feb, 2014: 1st International Conference on Subseasonal to Seasonal Prediction (College Park Maryland, USA)
Dec 2014: AGU Session on Sub-seasonal to Seasonal Prediction of Weather and Climate (AGU Fall Meeting, San Francisco, USA)
June, 2015: Workshop on Sub-seasonal to Seasonal Predictability of Monsoons (Jeju Island, Republic of Korea)
Nov, 2015: ECMWF Workshop on Sub-seasonal Predictability (ECMWF, UK)
Dec 2015: AGU Session on Sub-seasonal to Seasonal Prediction of Weather and Climate
(AGU Fall Meeting, San Francisco, USA)
Dec 2015: AGU Session on The Year of Tropics-Midlatitude Interactions and Teleconnections (AGU Fall Meeting, San Francisco, USA)
April, 2016: Workshop on Intraseasonal Processes and Prediction (S2S/MJO-TF) in the
Maritime Continent (Singapore)
April, 2016: EGU session on Sub-seasonal to Seasonal forecasting in hydrology and outlooks for water services (Vienna, Austria)
June, 2016: S2S Side Event at the WMO EC-68 (Geneva, WMO Headquarters)
July 2016: S2S workshop at Royal Meteorological Society Conference (Manchester, UK)
Sept, 2016: 16th Annual Meeting of the European Meteorological Society (EMS) and the 11th European Conference on Applied Climatology (ECAC) (Trieste, Italy)
Oct 2016: Coupled data assimilation workshop (co‐organized with DAOS, Toulouse,
France).
Dec, 2016: Workshop on Sub-Seasonal to Seasonal Predictability of Extreme Weather and Climate (Monell Building Columbia University at Lamont-Doherty Earth)
Dec, 2016: AGU 2016 Fall Session on Sub-seasonal to Seasonal Forecasting of High-
Impact Weather and Climate Events (San Francisco, USA)
Fifth International Conference on Climate Services (ICCS5), Cape Town, South Africa, 28 Feb – 2 Mar, 2017. http://www.climate-services.org/iccs/iccs5/
May, 2017: S2S verification session at the 7th International Verification Methods Workshop
(IVMW) (7IVMW) (Berlin, Germany)
36
June, 2017: S2S session on teleconnections at the 5th WGNE workshop on systematic errors in weather and climate models (Montreal, Canada).
Aug/Sept, 2017: The IAPSO-IAMAS-IAGA assembly (Cape Town, South Africa)
Sept, 2017: ICTP-Rwanda Joint School on S2S Weather and Climate Prediction (Kigali,
Rwanda)
Oct 2017: Advanced School on Tropical-Extratropical Interactions on Intraseasonal Time Scales (ICTP, Italy)
Nov, 2017: 6th WMO International Workshop on Monsoons (IWM-VI) (Singapore)
Dec 2017: AGU 2017 Fall Session on Sub-seasonal to Seasonal Forecasting of High-Impact Weather and Climate Events (New Orleans, USA)
Sept 2018: 2nd Conference on Sub-seasonal to Seasonal Prediction (NCAR, Boulder, USA).
8. Linkages with other groups
CBS: An important link has been established between S2S and the Lead Center for Long‐range
forecast Multi‐model Ensemble (LC‐LRFMME) at KMA (see section 2.2. for more details). A prototype
of real‐time sub‐seasonal multi‐model ensemble forecasts has been established at KMA who
accesses real‐time forecasts and re‐forecasts from NCEP, ECMWF, JMA and KMA using the S2S
database at ECMWF. The contribution of S2S to this project is the establishment of the S2S database
which can also be used for real‐time data exchange and research and verification of new S2S
products.
WGNE: A strong link has been established between the WGNE MJO task force and the S2S MJO sub‐
project. A common workshop was organized in April 2016 on the representation of convection over
the Maritime Continent. S2S is also supporting the Year of Maritime Continent initiative, which takes
place in 2017 and 2018. Representation of teleconnections in dynamical models (tropics‐
extratropics, high‐latitudes‐mid‐latitudes) has been identified as joint project between WGNE and
S2S. A session on S2S teleconnections has been organized at the WGNE workshop on systematic
errors in Montreal in June 2017.
PPP/YOPP: S2S plans to make available additional variables in the S2S database (e.g. sea ice
thickness) during the YOPP field campaign. The S2S sub‐project on teleconnections is coordinating
relaxation‐type experiments with YOPP to better understand the teleconnections between tropics
and high latitudes.
HIW: There are strong synergies between HIW and the S2S sub‐project on extremes. A member of
HIW (Brian Golding) is member of the S2S Extremes sub‐project. .
SPARC/SNAP: SNAP is using the S2S database to evaluate the skill of operational S2S models to
predict the stratospheric variability and its impact on the lower troposphere. An article on S2S has
been published in the Jan2016 SPARC newsletter to encourage the SPARC community to perform
more studies with the S2S database. So far 10 projects have been launched by members of the
SPARC community to analyze the S2S database for stratospheric studies

37
(http://www.met.reading.ac.uk/~stratclim/snap/projects.php), including the study mentioned in
4.2.2.
Joint WWRP/WGNE Working Group on Forecast Verification Research: Links have been established
with this working group through the verification and products sub‐project. A session on S2S was
organized at the Verification workshop (Berlin, May 2017).
DAOS: A member of DOAS is acting as liaison member in S2S. S2S was involved in the organization of
the DAOS workshop on coupled data assimilation (Toulouse, October 2016) through one of his
member being part of the conference scientific committee.
PDF: A member of PDF is acting as liaison member in S2S. A collaboration study between S2S and
PDF has also been launched. This study investigates the modulation by the Madden Julian Oscillation
of recurving tropical storms in the western North Pacific and the Rossby wave caused by these
tropical storms in the Northern Extratropics.
WGSIP: A strong relationship has been established with WGSIP. The teleconnection sub‐projects of
S2S and WGSIP are collaborating and the WGSIP sub‐project on systematic errors is using the S2S
database. S2S and WGSIP are also coordinating their next steering group meetings in Exeter (2017)
with common sessions and their next workshops in Boulder in 2018 (S2D conference).
GEWEX/GLASS is keenly interested in the role of land‐atmosphere feedbacks at S2S timescales, and
the potential for improved forecast skill by (1) improving land surface state initialization in forecast
models and (2) improving the representation of coupled land‐atmosphere processes in those
models. The GLASS Local Coupled (LoCo) effort is particularly congruent with S2S, and its Working
Group is pursuing research with output from the S2S data set to better understand how current
models represent coupled land‐atmosphere processes, which includes validation against
observational data: from the US Department of Energy Southern Great Plains (SGP) facility, FLUXNET
sites around the world, various field campaigns including LAFE (US Great Plains) and LIAISE (Spain),
reanalysis products and ultimately satellite‐derived observations of land‐atmosphere coupling
metrics.
9. Publications/Reports
S2S project:
Vitart, F., A. Robertson and D. Anderson, 2012: Subseasonal to Seasonal Prediction Project: bridging the gap between weather and climate. WMO Bulletin, 61(2), 23-28.
WMO, 2014: Brochure of the Sub-seasonal to Seasonal (S2S) Prediction (WMO Subseasonal to Seasonal Flyer)
Subseasonal to Seasonal Prediction Research Implementation Plan, WMO, 2014
Robertson, A. W., A. Kumar, M. Pena, and Fr. Vitart, 2015: Improving and Promoting Subseasonal to Seasonal Prediction. BAMS, 96, ES49-ES53
Vitart, F., A.W. Roberston and S2S steering group, 2015: Sub-seasonal to seasonal
prediction: linking weather and climate. World Meteorological Organization: Seamless Prediction of the Earth System: from Minutes to Months, (G Brunet, S Jones, PM Ruti Eds.), (WMO-No. 1156), (ISBN 978-92-63-11156-2), Geneva, 385-401.

38
Vitart,F., C. Ardilouze, A. Bonet, A. Brookshaw, M. Chen, C. Codorean, M. Déqué, L.
Ferranti, E. Fucile, M. Fuentes, H. Hendon, J. Hodgson, H.-S. Kang, A. Kumar, H. Lin, G. Liu, X. Liu, P. Malguzzi, I. Mallas, M. Manoussakis, D. Mastrangelo, C. MacLachlan, P.McLean, A. Minami, R. Mladek, T. Nakazawa, S. Najm, Y. Nie, M. Rixen, A. W. Robertson, P. Ruti, C. Sun, Y. Takaya, M. Tolstykh, F. Venuti, D. Waliser, S. Woolnough, T. Wu, D.-J. Won, H. Xiao, R. Zaripov, L. Zhang, 2017: The Subseasonal to Seasonal (S2S) PredictionProject Database. Bull. Amer. Meteor. Soc., 98(1), 163-176. doi: http://dx.doi.org/10.1175/BAMS-D-16-0017.1
White, C.J., Carlsen, H., Robertson, A.W., Klein, R.J.T., Lazo, J.K., Kumar, A., Vitart, F., Coughlan de Perez, E., Ray, A.J., Murray, V., Bharwani, S., MacLeod, D., James, R., Fleming, L., Morse, A.P., Eggen, B., Graham, R., Kjellström, E., Becker, E., Pegion, K.V., Holbrook, N.J., McEvoy, D., Depledge, M., Perkins-Kirkpatrick, S., Brown, T.B., Street, R., Jones, L., Remenyi, T.A., Hodgson-Johnston. I., Buontempo, C., Lamb, R., Meinke, H., Arheimer, B. and Zebiak, S.E. (2017). Potential applications of subseasonal-to-seasonal (S2S) predictions, Meteorological Applications, doi:10.1002/met.1654
Report, 2016: Spanish version of the S2S project overview
Book on Sub-seasonal to seasonal prediction (Eds. A. Robertson and F. Vitart), Elsevier, to be published in 2018.
Special issue of “Frontier” on sub-seasonal to seasonal prediction of monsoons
Special issue of “Nature Partner Journals (npj) Climate and Atmospheric Science” on sub-seasonal to seasonal prediction of extreme events.
Studies using the S2S database:
Doss-Gollin, J., Muñoz, Á.G., Pastén, M. (2016) Physical Mechanisms and S2S Predictability of 2015/16 Paraguay River Flooding. Conference: Sub-seasonal to Seasonal Workshop. Columbia University. doi: 10.13140/RG.2.2.24104.5760
Jie, W., F. Vitart, T. Wu and X, Liu, 2017: Simulations of Asian Summer Monsoon in the Sub-seasonal to Seasonal Prediction Project (S2S) database, Quarterly J. of Royal Meter. Soc., DOI: 10.1002/qj.3085.
Kim, H.-M., D. Kim, F. Vitart, V. Toma, J.-S. Kug and P. Webster, 2016: MJO propagation across the Maritime Continent in the ECMWF ensemble prediction system, J. Clim., 29(11), 3973–3988, DOI: 10.1175/JCLI-D-15-0862.1
Lim, Y., S.‐W. Son, and D. Kim, 2017: MJO prediction skill of the sub‐seasonal‐to‐seasonal (S2S) models, Journal of Advances in Modelling Earth Systems, submitted.
Liu, X., T. Wu, S. Yang, T. Li, W. Jie, L. Zhang, Z. Wang, X. Liang, Q. Li, Y. Cheng, H. Ren, Y.
Fang, S. Nie, 2017: MJO prediction using the sub‐seasonal to seasonal forecast model of Beijing Climate Center, Clim. Dyn, 48, 3283-3307, DOI 10.1007/s00382-016-3264-7.
Lowe, R., M. García-Díez, J. Ballester, J. Creswick, J.-M. Robine, F. R. Herrmann, and X. Rodó, 2016: Evaluation of an Early-Warning System for Heat Wave-Related Mortality in Europe: Implications for Sub-seasonal to Seasonal Forecasting and Climate Services, Int J Environ Res Public Health. 13(2): 206.
Vigaud, N., A. W. Robertson and M. K. Tippett, 2017a: Multi-model ensembling of
subseasonal precipitation forecasts over North America, Mon. Wea. Rev. Sub judice.

39
Vigaud, N., A. W. Robertson and M. K. Tippett, 2017b: Subseasonal predictability from a
multi-model ensemble of S2S forecasts over Northern Hemisphere summer monsoon regions, Frontiers in Atmospheric Science, submitted.
Vitart, F., 2017: Madden-Julian Oscillation Prediction and Teleconnections in the S2S Database, accepted in Quarterly J. of Royal Meter. Soc.
Osman, M. and M.S. Alvarez. (2017) Subseasonal prediction of the heat wave of December 2013 in Southern South America by the POAMA and BCC-CPS models. Climate Dynamics. DOI: 10.1007/s00382-016-3474-z
Wang, X., Zheng, Z. & Feng, 2017: Effects of air-sea interaction on extended-range prediction of geopotential height at 500 hPa over the northern extratropical region. G. Theor Appl Climatol (2017). doi:10.1007/s00704-017-2071-3
References
National Academies of Sciences, Engineering, and Medicine. 2016. Next Generation Earth System Prediction: Strategies for Subseasonal to Seasonal Forecasts. Washington, DC: The National Academies Press. doi: 10.17226/21873.
Acknowledgements
The S2S project is indebted to the many contributors, without whose generous support it would not
have been possible. In particular, we would like to thank the contributors to the S2S trust fund, KMA
for hosting the International Coordination Office, ECMWF, CMA for hosting and maintaining the
database, all the 11 forecasting centres for their efforts to contribute to the S2S database, and IRI for
including S2S data in the data library.