wv dep study on shale drill cuttings in landfills
TRANSCRIPT


Examination of Leachate, Drill Cuttings and Related Environmental, Economic and Technical Aspects Associated with Solid Waste Facilities in West Virginia
June 30, 2015
Prepared for:
West Virginia Department of Environmental Protection
Dr. Terry Polen, Ombudsman
601 57th Street, SE
Charleston, WV 25304
Submitted by:
Marshall University Center for Environmental, Geotechnical and Applied Sciences
Marshall University
Applied Engineering Complex
One John Marshall Drive
Huntington, WV 25755-2585
Research Contributors:
Marshall University Center for Environmental, Geotechnical and Applied Sciences
Glenville State University, Department of Land Resources
Marshall University, College of Information Technology and Engineering
West Virginia Department of Transportation, Division of Highways
Marshall University Center for Business and Economic Research

Table of Contents
Introduction / Background …………………………………………………………………… 1
Study Topic 1 …………………………………………………………………………………. 2
Background …………………………………………………………………………… 2
Field Activities ………………………………………………………………………… 4
Analytical Results of Landfill Leachate …………………………………………….. 4
Analytical Results of Drill Cuttings ………………………………………………….. 8
Ecotoxicology Study ………………………………………………………………….. 9
Statistical Analysis of Landfill Leachate Data ……………………………………… 9
Naturally Occurring Radioactive Material Evaluation ……………………………..10
Study Topic 1 Conclusions …………………………………………………………..11
Study Topic 1 Recommendations …………………………………………………..12
Study Topic 2 ………………………………………………………………………………….13
Study Topic 2 Conclusions …………………………………………………………. 15
Study Topic 2 Recommendation …..………………………………………………. 15
Study Topic 3 ………………………………………………………………………………… 16
Study Topic 3 Conclusions …………………………………………………………. 17
Study Topic 3 Recommendation ..…………………………………………………. 18
Study Topic 4 ………………………………………………………………………………… 18
Drill Cutting Geotechnical Characteristics ………………………………………… 18
Use of Drill Cuttings on Brownfields ……………………………………………….. 19
Study Topic 4 Conclusions …………………………………………………………. 20
Study Topic 4 Recommendation ….……………………………………………….. 21
Study Topic 5 ……………………………………………………………………………….... 21
Daily Cover on Landfills …………………………………………………………….. 21
Land Apply on Farmland ……………………………………………………………. 21
Mine Grout ……………………………………………………………………………. 22
Flowable Fill ………………………………………………………………………….. 22
ii

Dispose on Site of Generation …………………………………………………...... 23
Study Topic 5 Conclusions …………………………………………………………. 23
Study Topic 5 Recommendations …………………………………………………. 24
References …………………………………………………………………………………... 25
TABLES
Landfill Information ……………………………………………………………………………. 3
Wells Sampled for Drill Cutting Evaluation …………………………………………………. 4
Short Creek Landfill Analytical Data Compared to Water Quality Standard ..……..……. 5
Northwestern Landfill Analytical Data Compared to Water Quality Standard ........…….. 5
Meadowfill Landfill Analytical Data Compared to Water Quality Standard ..……..……... 6
Wetzel County Landfill Analytical Data Compared to Water Quality Standard ........…… 6
Charleston Landfill Analytical Data Compared to Water Quality Standard ............…….. 7
Raleigh County Landfill Analytical Data Compared to Water Quality Standard ….…….. 7
APPENDICES
Appendix A: Scope of Work
Appendix B: Analytical Parameter List
Appendix C: Drilling Location Map
Appendix D: Analytical Results of Landfill Leachate
Appendix E: Analytical Results of Drill Cuttings
Appendix F: Ecotoxicology Study (Compiled by Glenville State College, Department of Land Resources)
Appendix G: Statistical Analysis of Landfill Leachate Data (Compiled by Marshall University, College of Information Technology and Engineering)
Appendix H: Radioactivity Associated with Marcellus Shale Exploration and Disposal of Related Material (Compiled by Marshall University Center for Environmental, Geotechnical and Applied Sciences)
iii

Appendix I: Evaluation of the Feasibility of a Gas Industry Owned and Operated Dedicated Drill Cuttings Landfill (Compiled by Marshall University Center for Business and Economic Research)
Appendix J: Geotechnical Assessment and Recommendations – Marcellus Shale Reuse (Compiled by West Virginia Department of Transportation, Division of Highways)
iv

Introduction / Background
During the West Virginia 2014 legislative session, House Bill 4411 / Senate Bill 474 were passed, updating requirements for legal disposal of drill cuttings and associated drilling waste from natural gas well sites. This waste disposal is regulated by the West Virginia Department of Environmental Protection (WVDEP). This legislation charged the WVDEP to undertake horizontal drilling waste disposal studies, which included four specific topics. A fifth specific topic was added by the legislature after passage of the Bill. The five specific study topics are:
1. Hazardous characteristics of leachate collected from solid waste facilities receiving drill cuttings and drilling waste, including, at a minimum, the presence of heavy metals, petroleum related chemicals, barium, chlorides, radium and radon.
2. Potential negative impacts on the surface water or groundwater resources of West Virginia associated with the collection, treatment and disposal of leachate from such landfills.
3. Technical and economic feasibility and benefits of establishing additional and/or separate disposal locations which are funded, constructed, owned and/or operated by the oil and gas industry.
4. Viable alternatives for the handling, treatment and disposal of drill cuttings, including the potential for processing, reusing and reapplying a portion of the collected drill cuttings as suitable material for roads, brownfield development or other projects, instead of disposing of all collected materials into landfills.
5. A study of the feasibility of developing an alternative means of handling the disposal of drill cutting waste.
A report of findings was required by July 1, 2015. In order to meet this charge, The West Virginia Department of Environmental Protection identified Dr. Terry Polen, WVDEP Ombudsman, as the Project Manager. The WVDEP then entered into a contractual agreement with Marshall University’s Center for Environmental, Geotechnical and Applied Sciences (CEGAS) to provide technical and project management resources, including assemblage of a research study team to conduct planning stage activities to determine the best methods to accomplish the objectives of this study. These efforts included development of a Scope of Work (SOW) for each study topic that could be completed within the limited timeframe requirement. The WVDEP identified and approved each study team contributor, which included:
Marshall University, Center for Environmental, Geotechnical and Applied Sciences
Glenville State University, Department of Land Resources
Marshall University, College of Information Technology and Engineering
1

West Virginia Department of Transportation, Division of Highways
Marshall University, Center for Business and Economic Research
During the planning stages, team members reviewed multiple sets of existing applicable data provided by the WVDEP, researched existing data and resources to determine available relevant information that could be utilized in performance of the overall study, conducted informational exchange meetings, and participated in field visits to landfills and drilling sites to evaluate various aspects of drill cutting generation, processing, transport and disposal. Results of these efforts produced a SOW, approved by the WVDEP and presented to the WV Legislature in September, 2014. The SOW is provided in Appendix A.
Study Topic 1
Hazardous characteristics of leachate collected from solid waste facilities receiving drill cuttings and drilling waste, including, at a minimum, the presence of heavy metals, petroleum related chemicals, barium, chlorides, radium and radon
Background - As of early 2015, six landfills in West Virginia were actively accepting drill cutting materials, including in-state and out-of-state sources. Drill cuttings are either placed in a separate disposal cell or included in the municipal solid waste disposal location, and must pass disposal regulatory requirements in order to be accepted. Collected leachate from these facilities is either processed on-site and discharged to a stream or sent to a Publicly Owned Treatment Works (POTW) facility for processing and discharge to a receiving stream.
As part of this study topic, a base set of analytical parameters was compiled, based on WVDEP monthly monitoring leachate requirements for landfills accepting drilling waste, National Pollutant Discharge Elimination System (NPDES) discharge monitoring report requirements, and POTW effluent monitoring reporting requirements. The analytical parameter list is provided in Appendix B. This list included select heavy metals, volatile organic compounds, semi-volatile organic compounds, and radiological parameters, including gross alpha, gross beta, radium 226, radium 228, strontium 90, and radon. While this study is broad-based resulting in multiple conclusions, three particular areas of effort, each with components interrelated with the others, were focused on, including evaluation of the eco-toxicity of untreated and treated leachates, statistical analysis of historical leachate sampling, and naturally occurring radioactive material evaluation. Each of these aspects are discussed in later sections.
The four landfills with the highest monthly tonnages for drill cuttings were selected for evaluation. For comparison purposes, two additional landfills were selected that have
2

not historically received drill cutting materials. The waste water treatment systems that service these facilities were also evaluated as part of this study. The six landfills and associated information are provided on the following table:
Landfill / Location Waste Water Treatment Facility / Discharge Stream
Drill Cutting Disposal Information
Leachate Characteristics
Short Creek Landfill / Wheeling
Wheeling POTW / Ohio River
Drill cuttings mixed with municipal solid waste
Leachate collected separately from active disposal cell and closed cell1
Wetzel County Landfill / New Martinsville
On-site Waste Water Treatment Facility / Ohio River
Drill cuttings mixed with municipal solid waste
All leachate passes through on-site treatment facility
Northwestern Landfill / Parkersburg
Parkersburg POTW / Ohio River
Drill cuttings mixed with municipal solid waste
Leachate collected from active disposal cell
Meadowfill Landfill / Bridgeport
Bridgeport POTW / Simpson Creek
Drill cuttings placed in separate cell
Leachate collected from separate cell2
Charleston Landfill / Charleston
Charleston POTW / Kanawha River
Does not currently accept drill cutting materials
Leachate collected from active disposal cell
Raleigh County Landfill / Beckley
North Beckley POTW / Cranberry Creek
Does not currently accept drill cutting materials
Leachate collected from active disposal cell
1 Active cell includes drill cuttings; closed cell did not historically receive drill cuttings 2 Leachate not subject to municipal solid waste contact
Regarding the waste water treatment facilities, all of the POTW’s involved with this study, with the exception of the Parkersburg POTW, dispose of their biosolids at their respective landfill. The Parkersburg POTW landfills the majority of its biosolids at Northwestern Landfill, and also sells this material to area farmers for land application use.
For further comparison and evaluation, drill cuttings were collected and analyzed for the same parameters. Completing Marcellus gas wells involves two distinct types of drilling: air and mud. Air drilling uses compressed air to extend the well vertically, generally down to depths of up to approximately 3,000 feet. Some air drilling operations use air drilling techniques for the entire vertical well depth, up to depths of approximately 6,000 feet, prior to changing to mud drilling techniques to complete the vertical to horizontal section and horizontal extension of a well. Water is added during air drilling operations to drill cuttings as they reach the surface to control dust and related particulate in the atmosphere at the well pad. Once drill cuttings reach the surface and water has been added, the materials are placed in lined containers for transport to the landfill for disposal.
Mud drilling techniques use a mixture of water, clay materials and various additives to extend the well boring, keep the well boring open, and transfer drill cuttings to the
3
surface. Recovered mud materials are partially dewatered prior to placement in lined containers for transport to the landfill for disposal.
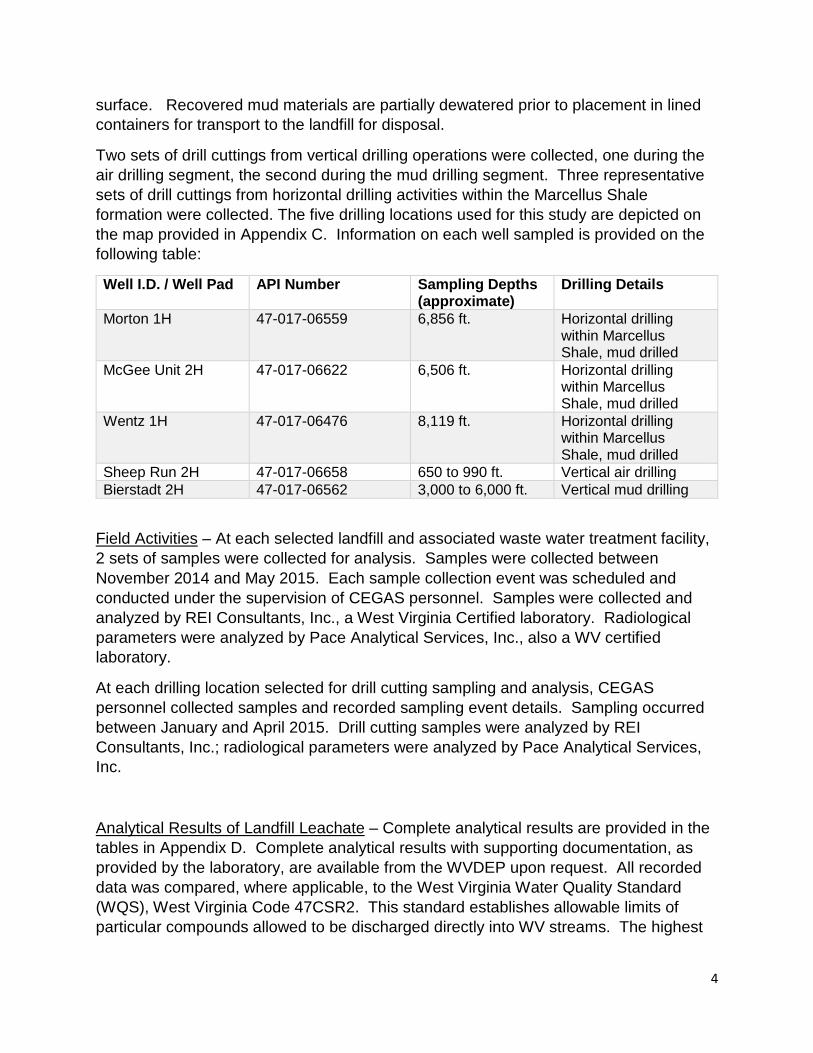
Two sets of drill cuttings from vertical drilling operations were collected, one during the air drilling segment, the second during the mud drilling segment. Three representative sets of drill cuttings from horizontal drilling activities within the Marcellus Shale formation were collected. The five drilling locations used for this study are depicted on the map provided in Appendix C. Information on each well sampled is provided on the following table:
Well I.D. / Well Pad API Number Sampling Depths (approximate)
Drilling Details
Morton 1H 47-017-06559 6,856 ft. Horizontal drilling within Marcellus Shale, mud drilled
McGee Unit 2H 47-017-06622 6,506 ft. Horizontal drilling within Marcellus Shale, mud drilled
Wentz 1H 47-017-06476 8,119 ft. Horizontal drilling within Marcellus Shale, mud drilled
Sheep Run 2H 47-017-06658 650 to 990 ft. Vertical air drilling Bierstadt 2H 47-017-06562 3,000 to 6,000 ft. Vertical mud drilling
Field Activities – At each selected landfill and associated waste water treatment facility, 2 sets of samples were collected for analysis. Samples were collected between November 2014 and May 2015. Each sample collection event was scheduled and conducted under the supervision of CEGAS personnel. Samples were collected and analyzed by REI Consultants, Inc., a West Virginia Certified laboratory. Radiological parameters were analyzed by Pace Analytical Services, Inc., also a WV certified laboratory.
At each drilling location selected for drill cutting sampling and analysis, CEGAS personnel collected samples and recorded sampling event details. Sampling occurred between January and April 2015. Drill cutting samples were analyzed by REI Consultants, Inc.; radiological parameters were analyzed by Pace Analytical Services, Inc.
Analytical Results of Landfill Leachate – Complete analytical results are provided in the tables in Appendix D. Complete analytical results with supporting documentation, as provided by the laboratory, are available from the WVDEP upon request. All recorded data was compared, where applicable, to the West Virginia Water Quality Standard (WQS), West Virginia Code 47CSR2. This standard establishes allowable limits of particular compounds allowed to be discharged directly into WV streams. The highest
4
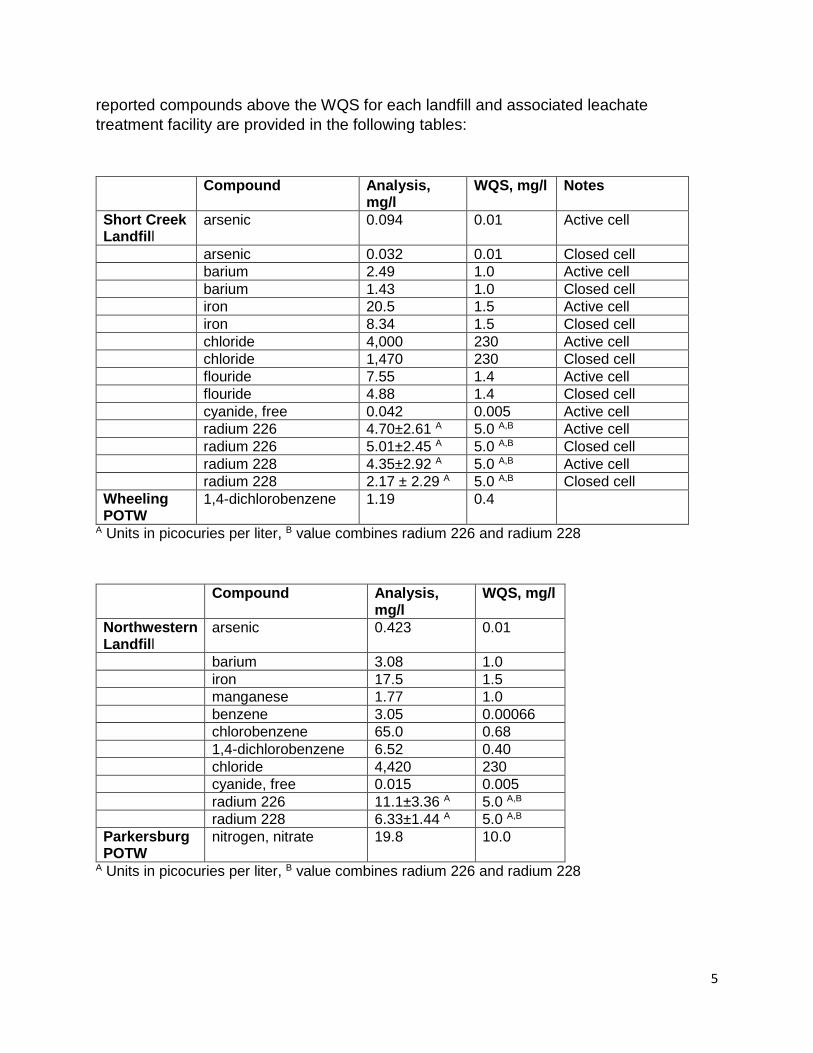
reported compounds above the WQS for each landfill and associated leachate treatment facility are provided in the following tables:
Compound Analysis, mg/l
WQS, mg/l Notes
Short Creek Landfill
arsenic 0.094 0.01 Active cell
arsenic 0.032 0.01 Closed cell barium 2.49 1.0 Active cell barium 1.43 1.0 Closed cell iron 20.5 1.5 Active cell iron 8.34 1.5 Closed cell chloride 4,000 230 Active cell chloride 1,470 230 Closed cell flouride 7.55 1.4 Active cell flouride 4.88 1.4 Closed cell cyanide, free 0.042 0.005 Active cell radium 226 4.70±2.61 A 5.0 A,B Active cell radium 226 5.01±2.45 A 5.0 A,B Closed cell radium 228 4.35±2.92 A 5.0 A,B Active cell radium 228 2.17 ± 2.29 A 5.0 A,B Closed cell Wheeling POTW
1,4-dichlorobenzene 1.19 0.4
A Units in picocuries per liter, B value combines radium 226 and radium 228
Compound Analysis, mg/l
WQS, mg/l
Northwestern Landfill
arsenic 0.423 0.01
barium 3.08 1.0 iron 17.5 1.5 manganese 1.77 1.0 benzene 3.05 0.00066 chlorobenzene 65.0 0.68 1,4-dichlorobenzene 6.52 0.40 chloride 4,420 230 cyanide, free 0.015 0.005 radium 226 11.1±3.36 A 5.0 A,B radium 228 6.33±1.44 A 5.0 A,B Parkersburg POTW
nitrogen, nitrate 19.8 10.0
A Units in picocuries per liter, B value combines radium 226 and radium 228
5

Compound Analysis, mg/l
WQS, mg/l Notes
Meadowfill Landfill
iron 18.9 1.5 Leachate collected from cell dedicated to drill cutting disposal only
manganese 16.8 1.0 benzene 3.26 0.00066 chlorobenzene 1.83 0.68 1,4-dichlorobenzene 11.1 0.40 chloride 6,100 230 flouride 2.75 1.4 Bridgeport POTW
antimony 0.033 0.014
1,4-dichlorobenzene 1.03 0.40 nitrogen, nitrate 16.5 10.0
Compound Analysis, mg/l
WQS, mg/l
Wetzel Co. Landfill
barium 1.04 1.0
iron 5.42 1.5 manganese 2.52 1.0 benzene 0.66 0.00066 chlorobenzene 3.23 0.68 chloride 1,840 230 nitrogen, nitrite 2.5 1.0 gross alpha 18.4±15.9 A 15.0 A radium 226 5.47±2.48 A 5.0 A,B radium 228 1.45±0.529 A 5.0 A,B Wetzel Co. Landfill Waste Water Treatment Facility
iron 3.32 1.5
iron 3.32 1.5 manganese 1.3 1.0 chloride 1,550 230 nitrogen, nitrate 35.0 10.0 nitrogen, nitrite 3.8 1.0 cyanide, free 0.018 0.005
A Units in picocuries per liter, B value combines radium 226 and radium 228
6

Compound Analysis, mg/l
WQS, mg/l
Charleston Landfill
arsenic 0.059 0.01
iron 22.0 1.5 manganese 1.72 1.0 benzene 3.48 0.00066 chlorobenzene 2.36 0.68 1,2-dichlorobenzene 12.5 2.7 1,3-dichlorobenzene 7.78 0.4 1,4-dichlorobenzene 11.9 0.40 chloride 312 230 cyanide, free 0.037 0.005 Charleston POTW
1,3-dichlorobenzene 0.84 0.40
1,4-dichlorobenzene 0.86 0.40 nitrogen, nitrite 1.39 1.0 cyanide, free 0.007 0.005
Compound Analysis, mg/l
WQS, mg/l
Raleigh Co. Landfill
antimony 0.027 0.014
arsenic 0.087 0.01 iron 29.2 1.5 manganese 3.32 1.0 benzene 1.28 0.00066 1,4-dichlorobenzene 3.07 0.40 chloride 420 230 flouride 34.5 0.005 nitrogen, nitrite 3.0 1.0 cyanide, free 0.019 0.005 radium 226 10.6±10.7 A 5.0 A,B radium 228 10.2±10.60 A 5.0 A,B North Beckley POTW
strontium 90 41.7±6.780 A 10.0 A
A Units in picocuries per liter, B value combines radium 226 and radium 228
No WQS exceedances at POTW’s that can be directly attributed to landfill leachate associated with drill cuttings have been observed. While 1,4-dichlorobenzene was detected above the WQS at the Bridgeport POTW and Meadowfill Landfill, this compound was also detected at the Wheeling POTW, while not detected at Short Creek Landfill. This same compound was detected above the WQS at the Charleston Landfill,
7

which does not accept drill cuttings, and the Charleston POTW. Radiological compounds were present in leachate from landfills that do accept drill cuttings, and those that have not accepted drill cuttings.
Treatment processes utilized at POTW’s do not treat for all of the compounds present in the landfill leachate that exceeds the WQS. Dilution of the landfill leachate with other fluids being received by the POTW is occurring.
At the Wetzel County Landfill, which utilizes its own leachate treatment system prior to discharge to the Ohio River, WQS exceedances were detected in the following compounds: iron, manganese, chloride, nitrogen-nitrate, nitrogen-nitrite, and free cyanide. Of these exceedances, chloride is the most prominent, with exceedances recorded at more than 6 times allowable WQS limits. Elevated chloride levels have been recorded in drill cuttings samples from mud drilled sections of wells (discussed in next section), which appear to be contributing to the high chloride levels recorded in the leachate and treated water samples from Wetzel County Landfill. Chloride levels in the leachate at the other three landfills which receive drill cuttings were also elevated, when compared to leachate from the two landfills that don’t accept drill cuttings. It is also noted that at the Short Creek Landfill, leachate from the open cell, which currently accepts drill cuttings, contained chloride levels at nearly three times the leachate from the closed cell, which historically did not accept drill cuttings.
Analytical Results of Drill Cuttings - Analytical results of drill cuttings are provided in the table in Appendix E. Complete analytical results with supporting documentation, as provided by the laboratory, are available from the WVDEP upon request. Results have been compared to the WV WQS to evaluate if drill cutting materials may be a potential contributing factor to increasing select compound levels detected in landfill leachate and associated leachate treatment facility. Chloride from the mud drilling phases are at levels extensively higher than from the air drilling phases, recorded at up to 57,000 milligrams per kilogram, evidently due to the addition of additives used in the mud drilling process.
In addition to chloride, arsenic, barium, iron, manganese, strontium, benzene, and fluoride were detected in drill cutting samples. These compounds were also detected in leachate from landfills accepting drill cuttings. Of these compounds, all except barium was also recorded in leachate from landfills that don’t accept drill cuttings.
Comparing vertical drill cuttings to horizontal drill cuttings, radioactivity is higher in the Marcellus Shale drill cuttings when compared to vertical drill cuttings. Gross alpha, gross beta, radium 226, and radium 228 levels are generally higher in the horizontal drill cuttings compared to vertical drill cuttings. Vertical drill cuttings using air drilling techniques had considerably lower radioactivity values compared to vertical drill cuttings using mud drilling methods. As drilling mud is reused, it is likely that radioactive
8

compound levels increase in the material. A discussion of radiological parameters and associated results is included in a following section.
Ecotoxicology Study – As part of this overall topic study, an ecotoxicology study was conducted on the same samples analyzed for chemical properties, which included drill cuttings, landfill leachate and associated waste water treatment facility effluent. This type of study evaluates the effects of compounds on biological systems to better determine associated potential risks. While chemical analysis are performed on individual compounds and compared to water quality standards, this evaluation method evaluates all compounds present to determine synergistic effects between the various compounds within a particular sample.
Results indicate all drill cutting materials analyzed as part of this study are toxic to certain plants. Landfill leachate is toxic to certain plants and invertebrates. Treated landfill leachate is considered generally safe to certain plants and invertebrates. Based on these conclusions, landfilling of drill cutting materials appears to be an acceptable option at this time to protect the environment. Complete details of this study is provided in Appendix F.
Statistical Analysis of Landfill Leachate Data – The WVDEP provided study team members with data sets on landfill leachate sampling events at numerous landfills in WV, including the landfills accepting drill cuttings studied as part of this project. Data sets provided were from the timeframe of October 2010 through December 2014. A statistical analysis was performed on compounds provided by the WVDEP to determine if compounds in landfill leachate were exceeding applicable environmental standards, and if any trends were detectable that suggest that exceedances of particular compounds might occur in the future.
For this study, graphical systems were developed that display each compound present in a particular landfill leachate over time. Frequency analysis was used to determine if potential patterns in the data were present. Standard statistical measurements were calculated to determine baseline levels for each compound, comparing the results to published water quality standards. Trend lines were established for each compound to detect patterns of increase or decrease, if present.
Results of this study indicate that the majority of compounds evaluated showed no evidence of a pattern of increase over time. The majority of compounds studied displayed steady levels or fluctuations up and down over the time period evaluated. Chloride levels in leachate at the Wetzel County and Meadowfill landfills were observed as trending upward with time. Total dissolved solids were also noted as potentially trending upward at the Wetzel County Landfill. As previously discussed, at Meadowfill Landfill, leachate is treated at the Bridgeport POTW, and increasing chloride levels are
9

not an apparent concern at this time, as dilution of the leachate is occurring prior to reaching the POTW for treatment. At the Wetzel County Landfill, which utilizes its own leachate water treatment system, chloride levels have been recorded above the WQS. This factor, combined with the trending upward chloride levels observed, suggest that chloride levels will be a more significant problem in the future at the Wetzel County landfill facility.
A slight increase was seen in radiological parameters, specifically gross beta at two landfills, and radium 226 at one landfill. These slight increases are discussed in the next section. Complete details of this statistical analysis is provided in Appendix G.
Naturally Occurring Radioactive Material Evaluation –Naturally occurring radioactive materials (NORM) are found in many naturally-occurring materials, including rock strata encountered during well drilling activities. Technologically Enhanced NORM (TENORM) occurs in the drilling industry when drill cutting materials are brought to the surface. In organic-rich shale formations, like the Marcellus Shale, NORM levels have been recorded at higher concentrations than lower organic content formations (i.e. grey shale, sandstone, limestone), mainly due to the higher organic content and radioactivity association.
Samples collected for chemical evaluation as part of this study were analyzed for multiple radioactive parameters, including gross alpha and gross beta levels, which are indicators of radioactivity, radium 226, radium 228, strontium 90, and radon. Detailed information on each of these radioactive elements, including characteristics and related health concerns, is included in the report provided in Appendix H.
Drill cutting are known to contain radioactive compounds. Landfills accepting drill cuttings and related materials are required (33CSR1) to use equipment to monitor radioactivity of each load of drill cuttings that enters the landfill. If a particular load does not pass the initial screening, and is found to contain levels of radioactivity above allowable threshold limits of radium 226 and radium 228, it is rejected from being placed in the landfill. Leachate from landfills accepting drill cuttings are currently required to monitor levels of gross alpha, gross beta, radium 226, radium 228 and strontium 90 on a monthly basis. These landfills are not currently required to monitor radioactive compounds in their groundwater monitoring wells. Associated POTW’s or waste water treatment facilities are also not required to monitor for radioactive compounds.
The WV WQS includes allowable discharge limits on each of the radioactive elements analyzed, except radon. As stated in the previous analytical tables, radioactive compounds were recorded in leachate from landfills above the WQS at times, however, all recorded radioactive levels were within allowable discharge limits in the effluent from the associated POTW or waste water treatment facility.
10

During the limited statistical review of historical sampling of leachate from multiple landfills (see Appendix G), a slight increase was seen in two radiological parameters, specifically gross beta at two landfills (Northwestern and Short Creek), and radium 226 at one landfill (Wetzel County). There are no standards for radiological parameters in landfill leachate, and the rate of increase is nominal, and observed over a relative short timeframe. While these minimal increases may be associated with drill cutting materials, other landfilled materials may also be contributing to this trend.
Drill cutting samples from the vertical and lateral segments of the drilling phase were analyzed for gross alpha, gross beta, radium 226,radium 228, and strontium 90 (radon cannot be detected in solids). Results indicate that radium 226 and radium 228 are present in the samples collected from the lateral mud drilling segments. These levels are above the Solid Waste Management Act screening standards (WV Code 22-15-8) for drill cuttings entering a landfill. Vertical drill cuttings did not contain radioactive levels above any current standards.
The complete report of “Radioactivity Associated with Marcellus Shale Exploration and Disposal of Related Material” is provided in Appendix H.
Study Topic 1 Conclusions – Results of evaluating the “Hazardous characteristics of leachate collected from solid waste facilities receiving drill cuttings and drilling waste” has produced the following conclusions:
1. Leachate from landfills that accept drill cuttings, and from landfills that don’t accept drill cuttings, contain compounds above the WQS. This leachate is toxic to certain plants and invertebrates.
2. POTW’s studied that accept leachate from landfills produce effluent that is generally safe to plants and invertebrates.
3. Where exceedances have been recorded in the WQS at POTW’s, landfill leachate from landfills accepting drill cutting materials does not appear to be directly connected to these exceedances.
4. Chloride levels are significantly higher in landfill leachate impacted with drill cutting materials, likely associated with drill cuttings generated from mud-based drilling techniques.
5. At the Wetzel County Landfill, the wastewater treatment effluent contains compounds exceeding the WQS for disposal into the Ohio River. Some of the exceedances, like chloride, can likely be attributed to disposal of drill cutting materials at this facility.
6. Extensive sampling and analysis of landfill leachate has not produced results that indicate an accelerated increase in compound levels of concern over time. Chloride levels in leachate at the Wetzel County and Meadowfill landfills were observed as trending upward with time. Total dissolved solids were also noted as potentially trending upward at the Wetzel County Landfill.
11

7. Radioactive compounds are present in the leachate from landfills accepting drill cutting materials, as well as landfills that don’t accept drill cutting materials. Radioactive compounds, including radium 226 and radium 228, are at times above the WQS allowable levels. Radioactive levels can likely be attributed to drill cuttings, however, other landfilled materials are also contributing to these levels.
8. POTW’s studied that treat landfill leachate, whether impacted by drill cutting materials or not, have similar radioactive level discharges, and are within the WQS.
9. Drill cuttings produced from vertical air drilling segments have significantly lower chloride levels and radioactive values, compared to mud-drilled segments (vertical and horizontal).
Study Topic 1 Recommendations – Based on the results and conclusions produced for this study topic, the following recommendations have been generated:
1. As landfills continue to accept drill cutting materials, and biosolids from associated POTW’s, monitoring of leachate for compounds of concern should continue, as long-term results have not been studied. A reduction in the number of sampling events and compounds to be analyzed is recommended, as the current sampling schedule is not identifying accelerated compound level increases, and many of the compounds being analyzed have not been detected. As an example, semi-volatiles should be removed, as they’re not currently being detected.
2. For POTW’s that treat leachate from landfills that accept drill cutting materials, effluent monitoring should include additional compounds, including radiological parameters. It is suggested that, as part of the regular review process for facility permit updating, additional compounds should be analyzed and compared to the WQS. Adding additional compounds to the current POTW permitted sampling schedule does not appear to be required at this time
3. At POTW’s processing leachate from landfills accepting drill cutting materials, biosolids that are utilized for land application use should be further evaluated over time, as the future potential exists for subsequent leaching of certain compounds, including certain heavy metals and radiological compounds, into the environment.
4. The Wetzel County landfill waste water treatment facility treats its own leachate. As a result, leachate dilution does not occur prior to treatment, as is the case at POTW’s. Effluent from this treatment facility should be monitored for additional compounds not included in its current discharge permit, including radiological parameters, and evaluated over time to determine if permit discharge modifications and facility treatment component changes / modifications are needed to meet the WQS.
12

5. Drill cuttings generated from vertical air drilling segments should be considered for on-site or alternate disposal, instead of landfilling, as these materials aren’t expected to contain significant levels of chlorides or radioactive compounds (compared to mud drilling segments). Water used in the air drilling process must be of appropriate water quality, as water re-used in drilling processes may contain increased levels of compounds of concern.
6. Waste not associated with drill cuttings, such as frac sands and associated fluids, was not evaluated as part of this study, as this waste stream was not included in the specific legislative waste disposal topics. Separate evaluation of this waste stream is recommended.
Study Topic 2
Potential negative impacts on the surface water or groundwater resources of West Virginia associated with the collection, treatment and disposal of leachate from such landfills.
As presented in the previous study topic, leachate samples collected from landfills were found to contain compounds at levels above allowable West Virginia Water Quality Standards (47CRS2). Of the landfills evaluated, leachate from all but one facility is treated at a local permitted POTW prior to discharge into a stream. The only landfill without this arrangement is the Wetzel County Landfill, which uses its own permitted leachate water treatment system. Treated leachate from this system is pumped through approximately 15,000 feet of 4-inch High Density Polyethylene forced main to the Ohio River for discharge. The WVDEP discharge permit for this facility allows for a discharge volume not to exceed 80,000 gallons per day.
Currently, it is unlikely that significant amounts of leachate from these landfills would not be treated at a permitted facility prior to discharge to a stream. However, in the event this were to occur, then established State Water Quality Standards for discharges into streams would at times be violated. Overflow of leachate collection systems during heavy precipitation events, overflow of piping systems connecting the landfills to their respective waste water treatment facility, cracks in piping systems handling landfill leachate fluids, and leachate treatment system failures could impact surface water, and groundwater associated with surface water, in the general area of the leachate release.
Landfill liner failures is another potential avenue for leachate to come into contact with surface water and/or groundwater. Landfill liner failures have been studied extensively. Leakage of leachate due to liner degradation, material creep over time, stress cracking, faulty seams in liner construction, and/or tearing are a few examples known to occur (Reddy et. al., 1999). While a rate of failure over time has not been established, multiple sources state that most landfills will, at some point, experience leachate leakage into the environment (53 Federal Register, 1988 and 47 Federal Register, 1982).
13

As part of operating requirements at landfills, groundwater monitoring wells are required around the facility to monitor existing groundwater conditions, normally on a semiannual basis. Some compounds associated with landfill leachate, including radiological parameters, are not included in this groundwater monitoring process. It cannot be determined if or when landfill leachate might impact groundwater in the long-term. If landfill leachate were to impact groundwater, evaluating the aquifer for potential use by and exposure to humans and the environment would be necessary, including evaluation of radiological parameters
Potential surface water impacts from an untreated landfill leachate release could cause ecological problems, as stated in the previous study topic. Based on the results of the ecotoxicology study (provided in Appendix F) conducted on various landfill leachate samples, certain plants and invertebrates would be negatively impacted by a release of landfill leachate into a surface body of water, due to its toxic characteristics.
Surface water bodies impacted by leachate from landfills could also be an avenue for leachate to migrate and impact an associated groundwater aquifer. This would be a significant cause of concern if the groundwater aquifer impacted was a current or potential public drinking water source. National Primary Drinking Water Standards could be exceeded as a result, however mixing within the aquifer would also be occurring reducing compound levels. A review of analytical data collected from landfill leachate samples collected as part of this study suggests that the following compounds could be at sufficient levels to violate drinking water standards, in the event a release were to occur:
Arsenic
Barium
Benzene
Chlorobenzene
Fluoride
Nitrite
Gross alpha
Radium 226
Radium 228
National Secondary Drinking Water Regulations, non-enforceable guidelines on certain contaminants that may cause cosmetic or aesthetic effects in drinking water, would also be exceeded. The following compounds have been identified that could exceed these non-enforceable guidelines:
14
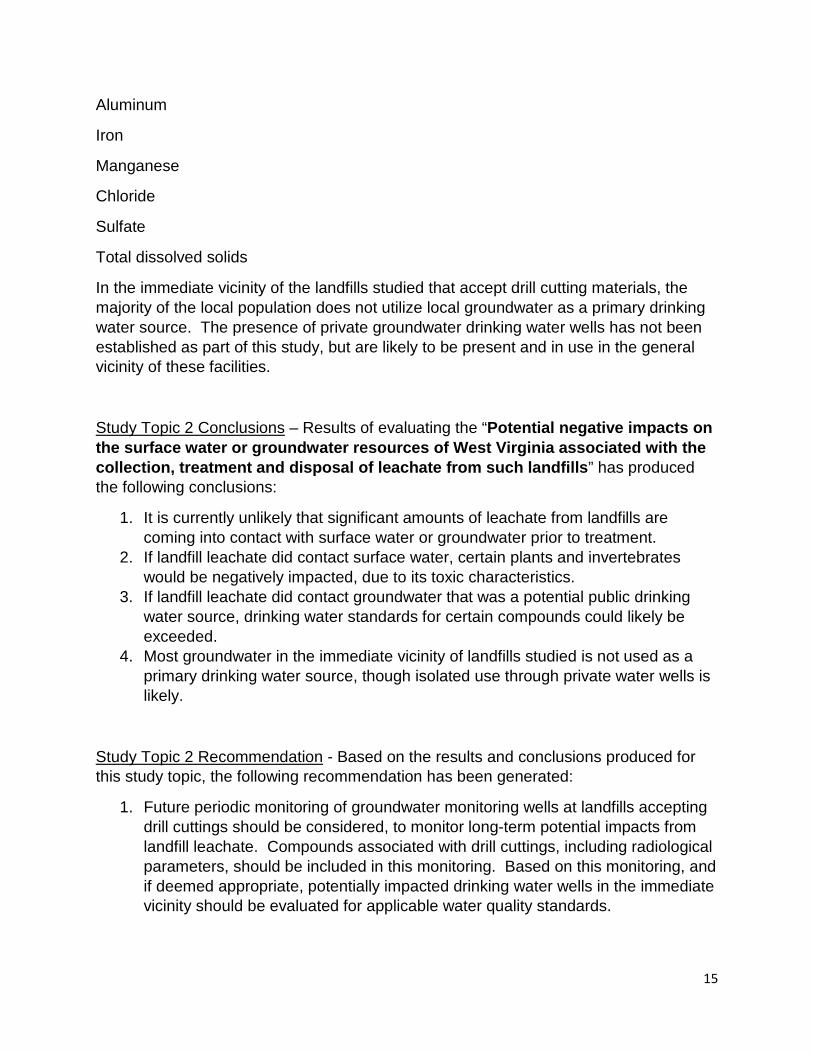
Aluminum
Iron
Manganese
Chloride
Sulfate
Total dissolved solids
In the immediate vicinity of the landfills studied that accept drill cutting materials, the majority of the local population does not utilize local groundwater as a primary drinking water source. The presence of private groundwater drinking water wells has not been established as part of this study, but are likely to be present and in use in the general vicinity of these facilities.
Study Topic 2 Conclusions – Results of evaluating the “Potential negative impacts on the surface water or groundwater resources of West Virginia associated with the collection, treatment and disposal of leachate from such landfills” has produced the following conclusions:
1. It is currently unlikely that significant amounts of leachate from landfills are coming into contact with surface water or groundwater prior to treatment.
2. If landfill leachate did contact surface water, certain plants and invertebrates would be negatively impacted, due to its toxic characteristics.
3. If landfill leachate did contact groundwater that was a potential public drinking water source, drinking water standards for certain compounds could likely be exceeded.
4. Most groundwater in the immediate vicinity of landfills studied is not used as a primary drinking water source, though isolated use through private water wells is likely.
Study Topic 2 Recommendation - Based on the results and conclusions produced for this study topic, the following recommendation has been generated:
1. Future periodic monitoring of groundwater monitoring wells at landfills accepting drill cuttings should be considered, to monitor long-term potential impacts from landfill leachate. Compounds associated with drill cuttings, including radiological parameters, should be included in this monitoring. Based on this monitoring, and if deemed appropriate, potentially impacted drinking water wells in the immediate vicinity should be evaluated for applicable water quality standards.
15

Study Topic 3
Technical and economic feasibility and benefits of establishing additional and/or separate disposal locations which are funded, constructed, owned and/or operated by the oil and gas industry.
Current regulations in West Virginia, under the “Natural Gas Horizontal Well Control Act”, allow for disposal of all drill cuttings and associated drilling mud from the Marcellus Shale and other shale formations using two options:
1. Disposal at an approved solid waste facility. 2. On-site disposal, if allowed by the landowner and approved by the WVDEP
Secretary.
West Virginia landfills currently accept drill cuttings from both in-state and out-of-state operations. Some facilities mix drill cutting materials with their daily municipal solid waste, while others utilize separate dedicated drill cutting material disposal cells. While on-site disposal of drill cutting materials is allowable, drilling operators are not utilizing this option.
An analysis was conducted regarding the feasibility of establishing separate disposal locations for drill cuttings from Marcellus Shale and similar shale formations which would be funded, constructed, owned and/or operated by the oil and gas industry in West Virginia. This analysis includes an estimate of the physical space required for future drill cuttings disposal as well as the cost of developing that space at current per well rates of disposal. A range of values for future well completions was calculated to determine the amount of landfill capacity that would be needed for the next 20 to 30 years. This estimated capacity includes an “average” volume of drill cuttings produced from a current typical Marcellus well, as actual vertical depths and horizontal extensions vary significantly throughout the Marcellus play. Over the next 20 to 30 year period, anticipated build out may generate from 14 million to 38 million tons of drill cuttings across West Virginia, Ohio and Pennsylvania for disposal in West Virginia landfills.
Future capacity estimates also include various factors that would influence the number of future wells completed, including natural gas prices, infrastructure for liquid-phase and dry gas locations and capacity, and future well spacing projections. A precise estimate of the required investment in a dedicated landfill is not possible due to high potential variability of future well completions. Due to this uncertainty, the analysis relies on a large range of possible acreage required. Results place the minimum amount of needed landfill capacity at 125 acres, with a cost of $40 million for construction, a minimum cost of $12 million per year for operations, plus approximately $40 million for closure costs. Obviously, larger landfill capacity would require additional construction and closure costs.
As part of this study, analysis was also conducted on existing landfills in WV that are the primary receiving facilities for Marcellus drill cutting materials. Overall, these landfills
16

are currently using approximately one percent of permitted acreage for drill cuttings disposal on an annual basis. The approximate minimum average distance drill cuttings are currently transported from the well site to a landfill is 22.3 miles. If new industry-operated landfills were substituted for existing ones at least two new fills would be needed to allow well operators access to disposal locations where average transit distances are not increased. If only one industry-operated landfill were in use, the average distance drill cuttings would be transported would increase by at least 12 miles. Having more than two new strategically located landfills would reduce the average transport distance.
Another uncertainty that must be considered in this evaluation is the time required to locate an appropriate site, complete the required permitting process, and construct a landfill. It has been estimated that a minimum of five years would be required to complete construction of a landfill permitted to receive drill cuttings. While this is occurring, the current disposal system would need to remain in place. The timeframe of landfill management for disposal and post-closure monitoring is also important as this monitoring will extend for years beyond the Marcellus build-out. The difficulties inherent when siting a new landfill have not been evaluated as part of this study, but factors including community resistance or receptiveness to the siting of a new facility are not known.
In order to be economically feasible, gas operators would need access to the necessary capital for construction, and revenues from operating the landfill would need to be sufficient to recover costs. Revenues will be determined by tipping fees charged and intensity of usage. It is possible that future demand for disposal may be different because of a new, specialty landfill(s) located in North Central West Virginia. Other factors to be considered include out-of-state drill cutting disposal allowance and associated competitiveness of a centrally located facility(ies), requirements for drilling operators on drill cutting disposal at a dedicated facility or other facility options, and feasibility of one or two larger facilities compared to multiple facilities across a larger area.
The complete report for this study topic is provided in Appendix I.
Study Topic 3 Conclusions – Results of evaluating the “Technical and economic feasibility and benefits of establishing additional and/or separate disposal locations which are funded, constructed, owned and/or operated by the oil and gas industry” has produced the following conclusions:
1. Siting and constructing a new landfill will take a minimum of five years. During this time, gas operators will have to rely on existing landfills for disposal.
17

2. At current rates of disposal, the minimum cost of investment estimated to be needed (for 125 acres of landfill capacity) is $40 million for construction plus another $40 million for closure costs.
3. The primary receiving landfills are using approximately one percent of permitted acreage for drill cuttings disposal annually.
4. The approximate minimum average distance drill cuttings are currently transported from the well site to a landfill is 22.3 miles.
5. At least two new industry-operated landfills would need to be constructed to allow well operators access to disposal locations where average transit distances do not exceed current distances. Having only one centrally located landfill could increase the average distance travelled from the gas well to the landfill by 12 miles or more. Having more than two new central landfills could reduce the average distance travelled, if optimally sited.
Study Topic 3 Recommendation - Based on the results and conclusions produced for this study topic, the following recommendation has been generated:
1. Evaluate policy options that would reduce disposal volume by disposing of some cuttings at the drilling site, specifically by allowing on-site disposal of drill cutting materials generated by air drilling methods.
Study Topic 4
Viable alternatives for the handling, treatment and disposal of drill cuttings, including the potential for processing, reusing and reapplying a portion of the collected drill cuttings as suitable material for roads, brownfield development or other projects, instead of disposing of all collected materials into landfills.
Drill Cutting Geotechnical Characteristics - WVDEP utilized expertise from the West Virginia Department of Transportation’s Department of Highways (DOH) to conduct appropriate material testing on drill cuttings to determine geotechnical-related characteristics. As discussed under Study Topic 1, a total of five sets of representative drill cutting materials were collected for chemical analysis, including two sets of drill cuttings from vertical sections of the well drilling phase, and three sets of drill cuttings from the horizontal drilling phase within the Marcellus Shale geological formation. Representative samples of these materials were collected and delivered to the DOH for review and analysis by DOH staff. Testing included moisture determinations, Atterberg Limits testing, and grain size analysis. The overall goal of this testing was to determine if drill cuttings could be utilized for road construction-related projects.
Results of the DOH study produced three major conclusions:
18

drill cuttings were found to contain an average moisture content of approximately 26%, a value far exceeding optimum moisture for construction use. Extensive drying of the material would be required prior to re-use.
drill cuttings were classified as a non-plastic silt (AASHTO A-4), a material not well suited for road construction related use.
drill cuttings would require repeated re-mixing during the drying process, and blending of other materials would be required to achieve a final usable product.
The DOH states that most of their road construction projects include a net surplus of materials. As a result, utilizing drill cuttings in these types of projects would not seem appropriate. Transport and handling costs of drill cuttings would also increase project cost. In addition, the DOH advises that additions of organic materials, like sawdust, to reduce moisture content could result in future settlement issues. The DOH geotechnical assessment study is provided in Appendix J.
Use of Drill Cuttings on Brownfields – Engineering controls are frequently used on brownfield properties to contain and/or prevent exposure to residual contamination on a site, in order for the site to be reused while protecting human health and the environment. Soil capping is one engineering control method utilized, a process of placement of a pre-determined thickness and type of clean, appropriate fill material over an area of known contamination. This method prevents contact with the contamination, reducing contaminant exposure potential while allowing the site to be reused. One form of this type of engineering control is an engineered cap, which is designed specifically to meet pre-determined performance and containment requirements.
The West Virginia DOH geotechnical assessment of drill cuttings, discussed previously, indicates drill cuttings are not generally suitable for use in road construction projects, due to high moisture content and silt-sized particles (report provided in Appendix J). The same is true for any type of engineered controlled fills that might be considered on brownfield redevelopments. In addition, radioactive parameters recorded on the horizontal drill cuttings indicate the material is not likely suitable for sites being developed for new use. Transportation costs are also a negative factor to consider, as brownfield sites may be lengthy distances from material generation locations, increasing material costs significantly. Local sources of suitable materials would provide substantial cost savings.
Reuse of drill cutting materials has been evaluated in other states in the Appalachian region. In Ohio, Ohio Soil Recycling, LLC obtained a permit from the Ohio EPA for a pilot-scale project in the Columbus, Ohio area to use drill cutting materials for engineered fill. In order to be approved, the material must contain contaminants below specified contaminant levels, including select heavy metals, certain volatile organics including gasoline, diesel and oil range organics, semi-volatile compounds, and chloride and fluoride. Comparing analytical results of drill cuttings sampled during this study to
19

the Ohio Soil Recycling permit requirements indicates that horizontal drill cuttings within the Marcellus Shale, and vertical drill cuttings using mud-based drilling methods, produces drill cuttings far exceeding the allowable limit for chloride. Chloride levels of up to 57,000 milligrams per kilogram (mg/kg) were detected in horizontal drill cuttings, and at 43,000 mg/kg in the vertical drill cuttings using mud-based drilling methods, compared to the allowable limit of 2,300 mg/kg in the Ohio Soil Recycling permit (Wolfe et al., 2002). This requirement dis-allows drill cuttings from mud-based drilling operations being utilized for this particular end-use; drill cuttings from air drilling operations appear to meet these permit requirements. While radioactive parameters were not a problem for this facility during the pilot stage, analysis of drill cuttings from Study Topic 1 of this project indicate this would be a likely problem in the future. The distance from the eastern Ohio source area where drill cuttings are being generated to Columbus resulted in transportation costs being another negative factor in this pilot project. This facility has not and is not accepting drill cuttings at this time (Elliott, June 2015).
In Pennsylvania, Clean Earth of Williamsport is the first permitted facility in that state to take drill cuttings. According to a company spokesman, this facility, in its fourth year of operation, has received approximately 200,000 tons of material. Material must meet certain chemical parameters designated by the State’s regulatory authority in order to be processed, including radioactive parameters less than 10 microroentgens per hour above background average levels, and 9,000 mg/kg chloride. Processed material has reportedly been reused on three PA Brownfield sites, including capping of contaminants in soil, and fill material on a former surface mine site. Material is mixed with portland cement as part of the re-use process. (Mueller, June 2015) Based solely on the chloride content, drill cuttings from mud-based drilling operations would not meet permit requirements for re-use. Drill cuttings generated from air drilling operation phases appear to meet allowable permitting requirements.
Evaluation of other States’ programs suggests that re-use of drill cuttings is not being currently conducted on a large scale. Permitting requirements suggest that the drill cuttings produced from air drilling methods could be considered for re-use.
Study Topic 4 Conclusions – Results of evaluating the “Viable alternatives for the handling, treatment and disposal of drill cuttings, including the potential for processing, reusing and reapplying a portion of the collected drill cuttings as suitable material for roads, brownfield development or other projects, instead of disposing of all collected materials into landfills” has produced the following conclusions:
1. Moisture content and classification of generated drill cuttings as a non-plastic silt indicate they’re not suitable for road building, or capping of brownfield sites.
20

2. Chloride content of drill cuttings generated from the mud-drilling phase (horizontal and vertical) are too high for re-use considerations.
3. Drill cuttings generated from the air drilling section, while they do not have high chloride contents when compared to drill cutting generated from the mud-drilling phase, have similar moisture and classification designations and are thereby not considered suitable for road building or capping of brownfield sites in their normal state. While drill cuttings have been used in small quantities in other states for capping and filling purposes, these materials were dried and mixed with Portland cement to obtain required material placement specifications. Repeated drying and mixing of the raw material for reuse will be problematic on a large-scale basis.
Study Topic 4 Recommendation – Based on the results and conclusions produced for this study topic, the following recommendation has been generated:
1. Drill cuttings generated from air-drilling phases should be considered for new use instead of disposal into landfills, however, re-use options should not include traditional road building or soil capping of brownfield sites, based on physical material characteristics.
Study Topic 5
A study of the feasibility of developing an alternative means of handling the disposal of drill cutting waste.
As presented in Study Topic 3 of this report, horizontal well drilling activities generate large volumes, up to 1,500 tons or more, of drill cuttings. Because of this factor, alternative handling and disposal options to be considered must be able to utilize large quantities of drill cutting materials. Based on a literature review, interaction with industry, and input / interaction from the project team, the following potential alternatives are discussed:
Daily Cover on Landfills – The general consensus from industry is that the majority of drill cutting materials received is often too wet to use; high moisture content makes it difficult to compact sufficiently to meet daily cover specifications. There are also industry concerns about the potential for higher chloride levels to occur in leachate as a result of daily cover use.
Land Apply on Farmland – During field activities of this study, drilling personnel were interviewed regarding use of drill cuttings in other parts of the U.S. Responses indicated that, in some other states, including Oklahoma, Louisiana and Texas, drill cuttings have been land applied on farmland. Analytical results of drill cuttings
21

generated from the mud drilling phase, provided in Appendix E, recorded elevated levels of compounds, including arsenic, chloride, and radiological compounds, that, upon release into the environment , would likely result in ecological and water quality issues in nearby surface water bodies and/or groundwater. Analytical results of drill cuttings generated from the air drilling phase, provided in Appendix E, recorded significantly lower levels of these same compounds of concern. While application of drill cuttings to farm land from mud-based drilling operations is not recommended, analytical data suggests that land application of drill cuttings generated from air drilling phases would not result in significant ecological or water quality issues.
Mine Grout – Abandoned mine lands are scattered throughout much of West Virginia, and parts of surrounding States. Approximately 60% of abandoned coal mines in the U.S. are found in Kentucky, Pennsylvania, and West Virginia. Many times, homes and other buildings have been constructed on top of underground mine workings and subsidence can be a problem (Abandoned Mine Lands Portal, 2015). Collapse of mine voids and associated surface subsidence issues, whether slow or rapid, is known to cause extensive damage to overlying roadways, buildings, and various structures. For perspective, a mine pool study was conducted by the WV Geological and Economic Survey that evaluated approximately 1.9 million acres of deep mines in WV. Only mines with greater than 500 acres of extent were included. (West Virginia Geological and Economic Survey, 2012).
Mine grouting involves pumping large volumes of a low compressive strength cement into mine voids to reduce mine void collapse. The grout must have flow characteristics to allow it to readily “flow” within the mine void. Due to the fine-grained nature of the drill cuttings analyzed in this study, this material could likely be incorporated into grout mix designs that would yield sufficient compressive strength and suitable flow characteristics. A possible positive of this alternative is that, in the case of mine voids with high iron / pyrite issues, the higher alkalinity found in drill cuttings may be beneficial. A possible concern of this alternative is the high chloride levels recorded in the drill cutting materials, which could result in leaching problems in the associated aquifer. Temporary storage of drill cutting materials will be required until the drill cuttings are utilized.
Flowable Fill – The term “flowable fill” is a slurry mixture of materials, including cement, water, fine aggregate and fillers, fly ash, sand and similar materials, used for various types of void-filling applications. These types of cement-based engineering materials are placed in a highly flowable state, with no compaction required, then hardens to produce load-bearing properties suitable for use in situations like filling abandoned underground structures (ie. sewers, basements, and underground storage tanks), and for bedding and backfill in applications including utility trenches, road sub-base and
22

various general back-filling uses. Flowable fills are sometimes referred to as controlled low strength materials, unshrinkable fills, or controlled density fills (U.S. Department of Transportation, 2015)
The silt-sized material found in drill cuttings could potentially be used as part of the fine aggregate / filler component of a flowable fill mix design. A possible concern is the high chloride levels present in mud-based drill cuttings and potential leaching problems that could occur, based on placement of the material. Radiological parameters also need to be considered, and temporary storage of the drill cuttings will be required until used. Drill cuttings from the air-based segment of drilling, based on analytical data recorded during this study, suggest this material may be more environmentally suitable for consideration in flowable fill mix designs.
Dispose on Site of Generation – Prior to the Natural Gas Horizontal Well Control Act, drill cuttings were usually placed on the site of generation. A simple excavation was dug, materials were placed in the excavation, and covered with excavated soils. With passage of this Act, all drill cuttings and associated drilling mud generated from horizontal well sites were required to be disposed of in an approved solid waste facility, or if the surface owner consents, materials could be managed on-site in a manner approved by the WVDEP Secretary. Drilling companies overwhelmingly choose to transfer these materials to regional landfills for disposal. The long-term effects of on-site disposal have not been studied extensively to date. Due to the presence of compounds found to occur in drill cuttings from mud-based drilling operations (provided in Appendix E), combined with compounds found to occur above water quality standards in leachate collected from landfills accepting drill cuttings (discussed in Study Topic 1), it is potentially feasible that surface water and/or groundwater in the immediate area of the disposal site could be impacted. Field studies on local areas with sites where on-site disposal has been previously conducted have not been performed to determine if this disposal option is environmentally sound.
Analytical results of drill cuttings generated from air-based drilling operations (provided in Appendix E) indicated compounds of concern, when compared to the WQS, are at levels that suggest on-site disposal may be a safe alternative. As stated previously, field studies on local areas with sites where on-site disposal has occurred has not been performed to date.
Study Topic 5 Conclusions – Results of evaluating the “study of the feasibility of developing an alternative means of handling the disposal of drill cutting waste” has produced the following conclusions:
1. Alternative disposal options must include the involvement of large volumes of drill cutting materials in order to be considered.
23

2. Evaluating the use of drill cuttings for mine grouting and flowable fill use should be considered, as these options have the potential to use large volumes of drill cutting materials. Elevated levels of compounds like chloride need to be considered in this evaluation process, including leaching potential into the subsurface. Temporary storage of drill cuttings will also be required.
3. Land application of drill cuttings generated from mud drilling operations should not be considered for land application.
Study Topic 5 Recommendations – Based on the results and conclusions produced for this study topic, the following recommendations have been generated:
1. Drill cuttings should be considered for abandoned mine grout mix design and flowable fill mix design, including potential volume usage. This recommendation includes evaluating temporary storage facilities and locations.
2. Drill cuttings generated from air drilling operations should be considered for land application and/or on-site disposal as a possible alternative to landfill disposal. This recommendation includes evaluating temporary storage facilities and locations.
3. Evaluate historical on-site disposal of drill cuttings and associated surface water and groundwater to determine if on-site disposal in the past has created ecological or related concerns.
24
References
Florida Atlantic University, Department of Ocean Engineering. A Comprehensive Literature Review of Liner Failures and Longevity, D.V. Reddy and Boris Butul. July 12, 1999
53 Federal Register 33314-33422 (Aug. 30, 1988), 47 Fed. Reg. (July 26, 1982), at pp. 32284-32285. See also 46 FR 11126, 11128 (1981); 53 FR 33314, 33344-33345 (1988).
Eastern Unconventional Oil & Gas Sumposium 2014. Characterization and Beneficial Use of Drill Cuttings in Ohio. Wolfe,Butalia, Mauger. The Ohio State University
Ohio Soil Recycling, LLC. Chris Elliott, President. Telephone Interview June 15, 2014.
Clean Earth of Williamsport. Dan Mueller, General Manager. Telephone Interview June 15, 2015
United States Department of Transportation, Federal Highway Administration. (June 2015) Fly Ash Facts for Highway Engineers. Retrieved from http://www.fhwa.dot.gov/pavement/recycling/fatoc.cfm
Federal Mining Dialogue. Abandoned Mine Lands Portal. Retrieved from www.abandonedmines.gov, Federal Mining Dialogue
West Virginia Geological and Economic Survey. (2012). West Virginia Mine Pool Atlas. Retrieved from http://www.dep.wv.gov/WWE/wateruse/Pages/MinePoolAtlas.aspx
25

Appendix A
Scope of Work

Examination of Drill Cuttings and Related Environmental, Economic and Technical Aspects Associated With Solid Waste Facilities in West Virginia
Scope of Work
Background: West Virginia Senate Bill 1007 was updated in 2014, creating requirements for legal disposal of drill cuttings and associated drilling waste from natural gas well sites. This waste disposal is regulated by the West Virginia Department of Environmental Protection (WVDEP). WVDEP is also charged to undertake horizontal drilling waste disposal studies mandated by the bill, which should examine four specific topics identified in the bill, plus a fifth specific topic which was added after passage of the Bill. The five specific study topics are:
1. Hazardous characteristics of leachate collected from solid waste facilities receiving drill cuttings and drilling waste, including, at a minimum, the presence of heavy metals, petroleum related chemicals, barium, chlorides, radium and radon.
2. Potential negative impacts on the surface water or groundwater resources of West Virginia associated with the collection, treatment and disposal of leachate from such landfills.
3. Technical and economic feasibility and benefits of establishing additional and/or separate disposal locations which are funded, constructed, owned and/or operated by the oil and gas industry.
4. Viable alternatives for the handling, treatment and disposal of drill cuttings, including the potential for processing, reusing and reapplying a portion of the collected drill cuttings as suitable material for roads, brownfield development or other projects, instead of disposing of all collected materials into landfills.
5. A study of the feasibility of developing an alternative means of handling the disposal of drill cutting waste.
A report of findings is required by July 1, 2015. In order to meet this charge, The West Virginia Department of Environmental Protection identified Dr. Terry Polen, WVDEP Ombudsman, as the Project Manager. The WVDEP then entered into a contractual agreement with Marshall University’s Center for Environmental, Geotechnical and Applied Sciences (CEGAS) to provide technical resources and assemble a research study team to conduct planning stage activities to determine the best methods to accomplish the objectives of this study, including development of a Scope of Work (SOW) for each study topic that could be completed within the limited timeframe requirement. The WVDEP identified and approved each study team member, which includes, in addition to CEGAS personnel, the following:
Glenville State University, Department of Land Resources
Marshall University, College of Information Technology and Engineering
West Virginia Department of Transportation, Division of Highways
Marshall University, Center for Business and Economic Research
Research Environmental & Industrial Consultants, Inc.
1
Note* The WVDEP will utilize additional resources and expertise, including input from industry, other relevant governmental agencies and entities as deemed necessary during performance of this project.
During the planning stages, team members reviewed multiple sets of existing applicable data provided by the WVDEP, researched existing data and resources to determine available relevant information that could be utilized in performance of the overall study, conducted informational exchange meetings, and participated in field visits to landfills and drilling sites to evaluate various aspects of drill cutting generation, processing, transport and disposal. Results of these efforts have produced the following SOW, presented by specific study topic:
Study Topic 1: “Hazardous characteristics of leachate collected from solid waste facilities receiving drill cuttings and drilling waste, including, at a minimum, the presence of heavy metals, petroleum related chemicals, barium, chlorides, radium and radon.”
Currently, six landfills in West Virginia accept drill cutting materials, which includes both in-state and out-of-state sources. Drill cuttings are either placed in a separate disposal cell or included in the municipal solid waste disposal location, and must pass disposal regulatory requirements in order to be accepted. Collected leachate from these facilities is either processed on-site and discharged to a stream or sent to a Publicly Owned Treatment Works (POTW) facility for processing and discharge. For this study, existing leachate analytical data from each of the six facilities will be studied. In addition, leachate analytical data from up to two West Virginia permitted landfills that don’t accept drill cutting materials will be evaluated for comparison purposes. Additional leachate sampling events will be conducted as part of the study for additional comparison and evaluation.
For this study, a base set of analytical parameters has been compiled (provided as an attachment). This set of parameters is based on WVDEP monthly monitoring leachate requirements for landfills accepting drilling waste, National Pollutant Discharge Elimination System (NPDES) discharge monitoring report requirements, and POTW effluent monitoring reporting requirements. This list may be adjusted during the performance of this project, as new information is obtained, and will include the minimum compounds identified for evaluation by Senate Bill 1007. While this study will be broad-based resulting in multiple conclusions, three particular areas of effort, each with components interrelated with the others, are being focused upon, including evaluation of the eco-toxicity of untreated and treated leachates, statistical analysis of leachate sampling, and naturally occurring radioactive material evaluation.
1. Evaluation of Ecotoxicity of Untreated and Treated Leachates
To better understand the risks associated with leachate from landfills accepting drill cuttings, physicochemical composition of current leachates need to be characterized and compared with historical data and with landfills that do not accept drill cuttings. Perhaps more importantly, ecotoxicity studies of the leachate from waste with drill cuttings is also necessary. Based on a review of information and research conducted during Stage One of this study, no ecotoxicological studies appear to have been employed to assess leachate from landfills accepting both municipal solid waste and shale drill cuttings. This study will provide a
2

mechanism to evaluate the chemical, radioactive, and ecotoxicity hazards of landfill leachate from waste that contains shale drill cuttings. Specific objectives incorporated in the study include:
i. Characterization of drill cuttings that enter West Virginia landfills Physicochemical and ecotoxicity analysis of the vertical and horizontal components of drill cuttings will be conducted. To encompass variability in geology, drill cuttings will be sampled from up to three different well pads.
ii. Characterization and comparison of leachate from landfills before and after accepting drill cuttings
Comparison of historical leachate physicochemical characterization with current physicochemical data will be completed using data collected by the landfills, as delineated by the permits. No additional sampling will be required.
iii. Characterization and comparison of leachate from landfills that accept and that do not accept drill cuttings
To ensure comparable sample and analytical quality, physicochemical and ecotoxicity analysis of leachates from up to three landfills that do not accept drill cuttings and up to three landfills with drill cuttings will be performed. Two seasonal samples will be taken from each landfill.
iv. Characterization of treated water released from POTWs To complete the pathway of drill cuttings from drill site to release into the environment, samples will be collected for analysis from two POTWs that receive leachate from landfills accepting drill cuttings and from two POTWs that receive leachate not potentially contaminated with drill cuttings.
To accomplish these objectives, historical leachate data, and assessment of drill cutting samples, current leachate samples, and POTW samples will be undertaken. Multiple landfills and drilling sites will be included. Sampling analysis will include inorganic compounds, heavy metals, complex organic compounds (e.g., petroleum-related chemicals), and radioactive compounds. A base list of parameters to be quantified in included as an attachment.
The ecotoxicity of untreated and treated leachates will be evaluated with the use of bioassays, encompassing aquatic species. Aquatic species to be analyzed will likely include a plant (Lemna minor) and a cladoceran freshwater water flea (Daphnia magna).
2. Statistical Analysis of Leachate Sampling
During project planning stages, team members were provided with multiple data sets that detail the names and concentrations of chemical compounds that were detected during sampling of the leachate at landfills that accepted drill cuttings. The overriding concern for the data analysis is to determine if the compounds in the leachate are present in quantities that exceed environmental standards.
This analysis will consist of several steps:
i. Data standardization
3

ii. Basic Reporting
iii. Basic Statistical Analysis of compounds in the leachate
iv. Developing Control Methods to monitor the amount of a compound in the leachate
v. Other Phase II Analysis
For most of the analysis, SAS (Statistical Analysis System) will be utilized. SAS is generally considered the standard for doing data analysis on a large scale.
Data Standardization
In order to facilitate analysis and reporting of the data, team members will attempt to develop – as much as is practical – a standard format for the spreadsheets produced after the leachate has been sampled. In particular, the team believes a standardization of reporting among facilities is important. The most important features of this standardization for team purposes are:
i. Standardization of compounds names
ii. Standardization of units
iii. Standardization of the list of compounds for which analysis will be conducted
iv. Other standardizations as deemed necessary, approved by the WVDEP Project Manager
In addition to the data supplied by the landfills, historical relevant rainfall data will be collected. This information will be used to study its effect on both the volume and concentrations of compounds in the leachate.
Once this standardization is complete, we will be able to do the reporting and analysis on the various compounds detected in the leachate. We expect this standardization to have minimal impact on landfill operators since we anticipate that much of the work can be done by writing scripts to convert individual data sets to the standard form. The reporting and analysis are detailed below.
Reporting
For each compound in the leachate, efforts will be made to find documentation that details:
i. The effect of the compound – at any level - on humans, animals, and the surrounding environment
ii. Acceptable levels – if such information exists -of the compound as prescribed by the State of WV, the United States Environmental Protection Agency, or other federal, state and local governments
iii. Tolerance limits for the concentrations. It may be possible that a compound is considered safe if it is present in some range such as zero (0) to L where L is the maximum safe level of the compound. These limits will be documented and used for further analysis. Similar sources from Number 2 above will be used.
4

Using historical data, as well as any pertinent data collected during the planning stage or this stage of the project, we will generate a set of simple statistics. These are important for several reasons including establishing baselines, comparisons to established limits, and eliciting questions about the data to be investigated. Our software will make it simple to generate such reports, as well as other datasets. The list below is not exhaustive and can easily be altered for new components. At a minimum, simple statistics to be provided include:
i. The mean (average value), maximum value, and minimum value
ii. Percentiles
iii. Other less common statistical measurements such as skewness, kurtosis, etc
The team is aware that some of the statistics proposed to be gathered are taken from time series and it cannot be stated that the samples from the lab analysis represent independent measurements. However, it is believed they will be useful in developing “snapshots” as well as an overall picture of the status of the leachates in the landfill.
Basic Statistic Analysis
In addition to the simple statistics discussed above, conversations with WVDEP and members of the project team have led to proposing performance of various statistical analyses to answer questions that have arisen about individual leachates and landfill sites.
ANOVA
Analysis of Variance (ANOVA) will be performed on the various data elements that are provided. ANOVA is a set of statistical techniques for determining if the mean (average) values of some quantity differs among two or more populations. For example, some members of the project team have expressed interest in comparing the average amounts of leachates found in landfills that accept drill cuttings with those that do not accept them. ANOVA can also be used to compare leachate concentrations among the various landfills for which data is available. The following actions are planned as part of this effort:
i. Solicit input from everyone on the project team for questions that could be answered by ANOVA techniques. It is expected that the list of questions to grow as this stage of the project progresses
ii. Perform the analysis in (1) and report the results
iii. Establish confidence intervals for leachate concentrations reported at each landfill evaluated
iv. Use the confidence intervals to determine if the acceptable or desired levels of a leachate are being met, assuming acceptable levels are available as described in the previous sections
5

Regression and Correlation
The project team will perform regression and correlation analysis on the continuous variables available to us. This analysis will allow the team to study how two or more continuous variables vary with each other. For example, the concentration of two leachates can be evaluated to determine if the amount of one leachate affects the amount of another. Similar to ANOVA, team members will provide input to make a list of questions that can be answered statistically. An initial analysis will be conducted, and results reported to the team members who have subject matter expertise. The expectation is that the initial analysis will allow the subject matter experts to develop more pertinent and relevant questions about the data.
Other Statistics
Measurement of a Random Variable (eg measuring the amount of a leachate in a landfill) over time is an example of a Stochastic Process (also referred to as time series analysis). Often the purpose of such an analysis is to make a future prediction of a measurement based on those of the past. Such analysis can provide insight into an evolving system whether or not prediction is a desired outcome.
Such analysis is rarely taught, even to engineers. Its use would require specialized training and education of the analysts. In conjunction with subject matter experts, project team members will perform analysis of the leachate concentrations as a time series. An initial analysis will be performed and let the results generate questions that subject matter experts need answered.
Control Methods
Many of the compounds found in the leachate are subject to tracking by the WVDEP. One of the very common ways for viewing a chemical process over time is through the use of Shewhart Control Charts. The following chart is an example that shows:
i. The desired or acceptable level (center line)
ii. Two and three standard deviation limits
6

Typically a chemical process will have a theoretical (acceptable) level and a measured value. The theoretical value is represented by the center line in the graph above. The measured values are plotted against the desired value over time as shown above. The process is generally considered under control or acceptable if the line graph falls between the two lines labeled UCL (upper control limit) and LCL (lower control limit).
If readings start to appear outside the control limits, the process must be investigated. The reasons can vary from simple – for example, incorrect data input – to complex – a true anomaly is taking place in the chemical process.
As part of this Scope of Work, the project team will develop methods that allow the data to be presented in the above graphical format. It is expected to provide quick, visual evidence of the state of a leachate in a landfill.
Miscellaneous Analysis Activities
The project team consists of people with different talents and strengths that may be applied to the study of leachates at landfills. The data analysts will do the “usual” initial analysis of the data and report it to the other group members whose strengths may lie somewhere besides analysis and statistics. Throughout this project, the analysts in the group will seek to answer questions posed by these other members. An attempt has been made to identify some of the questions here but the team fully expects analysis to be an ongoing part of this scope of work. To this end, the team has software and expertise to:
i. Create appropriate data sets
ii. Generate summary reports
iii. Analyze data statistically at the request of any group member
iv. Generate informatory charts and graphs
3. Naturally Occurring Radioactive Material Evaluation
A major concern of leachate associated with Marcellus shale drill cuttings is the naturally occurring radioactive material (NORM). It is known that Marcellus shale has higher levels of NORM compared to other shale formations. Black shale formations, like Marcellus, usually contain trace levels of 238U (Uranium), 235U, 40K (Potassium) and 232Th (Thorium). The elements have long half-lives and therefore are not very radioactive. Uranium and thorium are generally insoluble. This makes it more difficult to concentrate the elements. However, 238U decays to 226Ra (Radium) and 232Th decays to 228Ra, which are both radioactive products and are soluble. Radon (Rn), a radioactive noble gas, is also a decay product of Uranium and Thorium.
Because of the NORM levels associated with Marcellus shale, the project team will compile information and report on “the hazardous characteristics of leachate” associated with NORM, including:
• Comparison of Marcellus shale to other shale units and associated geologic layers regarding NORM levels
• Evaluating consistency of NORM levels recorded throughout the region
7

• Identification of elements associated with NORM, and the properties of such elements • Radioactivity effects of drill cuttings being collected/disposed in one location • Evaluation of radioactive monitoring required at landfills accepting drill cuttings
Study Topic 2: “Potential negative impacts on the surface water or groundwater resources of West Virginia associated with the collection, treatment and disposal of leachate from such landfills.”
Results and conclusions from Study Topic 1 will provide various elements for further evaluation and basis for addressing particular sections on this topic. Of particular interest is identification of surface waters and groundwater that may be affected in a potentially negative way, and their significance (drinking water source, protected water source, water source restrictions, etc.) Currently, five of the six landfill accepting drill cutting waste have agreements with local publically owned treatment works (POTW’s) for final leachate treatment and discharge. One landfill has an on-site leachate treatment facility with effluent discharge to the Ohio River. In each case, a particular surface water body is the final discharge point. Leachate treatment methods utilized at each landfill and associated POTW or on-site treatment system will be reviewed, comparing treatment methods, effluent discharge regulatory requirements, and historical associated chemical analysis. Chemical analysis will be conducted as part of this study at landfills and POTW’s for evaluation and further study. For comparison purposes, landfill leachate from up to two landfill that don’t accept drill cuttings, and their associated POTW or final treatment system, will also be subjected to chemical analysis.
Regarding final surface water discharge points of treated leachate, these water bodies will be evaluated for water use downstream of discharge locations. Where drinking water intake locations are present, additional studies will be undertaken to review water treatment methods and chemical analysis utilized, compared to applicable leachate discharge parameters.
Regarding potential negative impacts on groundwater resources, collection, treatment and disposal of leachate from landfills should not affect groundwater, as long as the systems in-place operate normally. In the event of a system failure, such as a landfill liner break or leachate piping leak, then groundwater can potentially be affected. The project team will evaluate groundwater resources associated with the applicable landfills and associated treatment systems to determine potential for negative impact, including use of subject groundwater as a drinking water source, and groundwater connected to surface water with special restrictions (i.e. protected stream status, specific stream load allocations, etc.). As part of this study, the project team will conduct a review of historical landfill liner failures and associated leachate impacts to the environment. Historical groundwater monitoring data from targeted landfills, required as part of landfill permit requirements, will also be reviewed to determine groundwater conditions in the immediate landfill area.
This study will include evaluation of radioactive components that are associated with drill cuttings that could negatively impact surface water and groundwater. At a minimum, the following aspects and associated study areas will be appraised:
• Collection of Leachate o Compare historical radioactive levels in landfill leachate, looking for trends over
time
8

o Compare levels of radioactivity recorded against water quality standards in leachate before being sent for treatment.
• Treatment of Leachate o Identify POTWs testing parameter requirements for radioactivity o Determine potential negative impacts of passing leachate thru treatment facilities
Determine if radioactivity in leachate may accumulate on equipment and surrounding area
• Disposal of Leachate o Determine radioactive levels of leachate after passing thru a POTW or onsite
treatment plant, comparing to radioactive drinking water standards and applicable stream quality designations.
Study Topic 3: “Technical and economic feasibility and benefits of establishing additional and/or separate disposal locations which are funded, constructed, owned and/or operated by the oil and gas industry.”
Completion of this study topic includes performance of two main tasks, plus associated sub-tasks, outlined as follows:
Task 1: Develop an approach to most accurately produce an estimate of the quantity and location of applicable drill cuttings that will be generated in the relevant future. Task 1.1: Develop a method of calculating the volume of applicable drill cuttings produced historically.
1. Define applicable natural gas wells based on characteristics of “6A” wells subject to the landfill disposal requirement, i.e. horizontal gas wells using more than 5,000 bbls of water in a 30-day period, including application to non-Marcellus wells.
2. Work with project team members, WVDEP and/or West Virginia Geological Survey (WVGES) staff to identify correct group of wells. Necessary classification will include well-level data on:
a. the geological pay zone, to identify wells producing in the Marcellus Shale that will have used a horizontal drilling process
b. well depth, to be used to estimate the volume of drill cuttings produced c. well location, to be used to group production in a specific area
3. Work with CEGAS to incorporate their Geographic Information System (GIS) /spatial analysis into volume calculations.
a. Using GIS to store and visualize volume totals b. GIS layers used to complete this task can serve as a base for other analysis (as
needed) throughout the project 4. Develop method of estimating the per well volume of drill cuttings disposed of in landfills:
a. Develop an average tons/well figure that can be applied to estimates of future wells drilled per year
b. Develop method to take into account any additives mixed in to dry out the material, e.g. sawdust, lime or fly ash, either at the permit site or at the landfill that increase volume. This will probably be based on interviews with industry.
9

5. Estimate total annual volume of cuttings and thickener produced that will be disposed of in landfills.
Data / information sources to be used in this study include: 1. Gas well data from WVDEP Office of Oil & Gas and WVGES, including well location,
year drilled, depth, targeted formation, gas production, operator, etc. 2. Drill cuttings data from Maloney & Yoxtheimer (2012) for rates and estimates of total
production in Pennsylvania, and Clean Earth for rates of production 3. Interviews with landfill operators 4. Interviews with gas industry
Task 1.2: Familiarize project team with drill cuttings disposal in practice and validate estimates of future volume.
1. Working with industry stakeholders, develop a survey to solicit information on the drill cuttings disposal process from gas well operators. Questions will cover:
a. Typical volume of cuttings produced per well. b. Materials added to the cuttings for solidification and associated costs. c. Information about temporary on-site storage of cuttings and the costs associated
with that storage. d. The cost to transport cuttings to landfills, separated by costs for contracted
transport vs. operator transport. e. Tonnage transported per trip. f. Tipping fees paid to landfills. g. Opportunities for alternative disposal, if any. h. Expectations of drilling activity over the study time horizon i. Other questions To Be Determined (TBD) after talking with WVDEP and project
team. 2. Conduct survey of the approximately 12 to 18 horizontal gas well operators in West
Virginia 3. Compile survey results to develop a set of data that accurately represents the gas
industry’s costs of disposing of drill cuttings.
Data / information sources to be used in the study include: 1. State regulations, such as the Natural Gas Horizontal Well Control Act and the Solid
Waste Management Act 2. Permit applications filed with the WVDEP 3. Industry interviews/surveys
Task 1.3: Estimate future rates of drilling and associated volume of cuttings 1. Establish level of geographic detail required, e.g. county-level, groups of counties, all
WV-based Marcellus, etc. to evaluate: a. the feasibility of continuing current disposal practices b. the size and number of new landfills that the gas industry would need to build to
dispose of cuttings if existing landfills were not utilized
10
2. Develop estimates of the number of wells drilled per year within each geographic boundary corresponding with landfills where waste is likely to be disposed of
3. Develop scenarios covering a range of potential volumes representing high, medium and low levels of future drilling activity
4. Validate projections based on interviews with industry and landfill operators
Data / information sources to be utilized as part of this effort include:
1. Other production/drilling forecasts, including U.S. Energy Information (EIA) shale production forecast, Nature Conservancy forecast of Marcellus build-out for PA (number of wells drilled), and National Energy Technology Laboratory (NETL) forecast of Marcellus production in WV through 2020
2. Resource volumes and rates of production 3. Industry projections/expectations
Task 2: Develop an approach to most accurately estimate the relative costs of disposing of drill cuttings in existing landfills vs. new fills to be developed by the industry.
Task 2.1: Estimate the cost of developing and operating a new landfill: 1. Develop an estimate of cost to construct and operate a new landfill. Costs are
dependent on acreage should include: a. Development/Construction Costs b. Operating costs c. Closure/capping costs: If it is determined that the study is of a time period long
enough to consider the cost of closing and capping the fill. d. Post-closure costs
2. Describe necessary considerations for a siting a new landfill. Issues to be explored may include landowner issues, location restrictions, proximity to water wells and transportation costs.
Data / information sources to be utilized as part of this effort include, but are not limited to:
1. the Association of State and Territorial Solid Waste Management Officials (ASTSWMO) 2. Municipal Solid Waste Management, the journal for the municipal solid waste
professionals 3. 40 CFR Part 258 (Subtitle D of RCRA) - federal regulations for landfills receiving
municipal solid waste (MSW) 4. Permitting documents filed with the WVDEP
Task 2.2: Estimate the current cost to industry of disposing of cuttings in existing landfills and geographic considerations for using the same routes and fills over the study horizon. Us the industry survey results to:
1. Develop an estimate of cuttings handling costs at the drill site. 2. Develop an estimate of transportation costs to and from the gas production sites to the
landfills.
11

a. Develop a method of assigning transport routes between well sites and landfills that can be used for future wells
b. With CEGAS, develop a GIS approach to averaging distance travelled based on road distance between fills and permits that can be used to estimate future costs
i. Using GIS routing and networking capabilities, road network, landfill locations, well locations and other GIS layers, a model will be developed to link past, current and estimated future cost
c. Develop a method to account for any cost variation between contract hauling or self-hauling
3. Apply costs per trip using collected data and data from industry surveys 4. Translate per trip costs to per well costs that can be applied to future volumes
Task 2.2 DATA/INFORMATION SOURCES: 1. “Fact Sheet” on each landfill, filed with the WVDEP. Provides physical location,
description of waste acceptance levels, list of applicable Federal and state rules, and point of contact.
2. Gas well drilling permitting documents filed with the WVDEP provide information on the landfill to be used for disposal.
3. Industry surveys 4. West Virginia Solid Waste Management Board (SWMB) planning documents
Task 2.3: Produce present value (PV) estimates of the costs to continue disposal in existing landfills compared to cost of building a new fill/fills in the Marcellus region.
1. Develop input assumptions for applicable variables with input from WVDEP and project team:
a. Length of time to evaluate, e.g. 20 years, 30 years, etc. b. Discount rate to apply to future expenditures c. Cost of capital, to apply to building the new landfill. Assuming a new landfill is
financed with equity and debt only, the weighted average cost of capital is the suggested manner for computing cost of capital. This analysis will require input from the project team, as well as input from current landfill owners.
d. Inflation rate, to apply to future costs 2. Develop estimates of the PV of aggregate costs to the industry of the two disposal
options. This will allow the team to compare the monetary values of the future costs of the two options, by discounting future costs to reflect the time value of money. The higher the discount rate, the lower is the present value of future cash flows.
Data / information sources to be used include: 1. Websites such as Finance Formulas - http://www.financeformulas.net/index.html 2. Office of Management & Budget Circular No. A-94 Revised on Guidelines and Discount
Rates for Benefit-Cost Analysis of Federal Programs 3. http://en.wikipedia.org/wiki/Weighted_average_cost_of_capital 4. Inflation data, specifically the Consumer Price Index, and Producer Prices Indexes if
determined to be applicable, are available from the Bureau of Labor Statistics website at http://www.bls.gov/bls/inflation.htm
12

Task 2.4: Evaluate the feasibility of continuing to use existing landfills to accept drill cuttings over the identified time period.
1. Survey landfill operators regarding future ability to accept drilling waste. Most of the answers to these questions are available online in filings made with the WVDEP and the SWMB. Questions for landfill operators on the disposal practices:
a. Volumes received per year over time b. Capacity of fill c. Territory served d. Expansions undertaken because of horizontal drilling e. Presence of a dedicated drill cuttings cells or fracking waste cell f. Planned expansions g. Expected date of closure based on certain rates of waste acceptance. h. Other Questions TBD after talking with WVDEP and project team.
2. Report on the feasibility based on capacity available in existing fills relative to the expected quantity of waste to be generated as estimated in Task 1. Evaluate longevity of existing landfills in terms of capacity to continue to accept waste for the identified relevant time period.
Data / information sources to be used for this task include: 1. Landfill permitting documents filed with the WVDEP show expected waste in place over
time and planning closure year. 2. WV Solid Waste Management Board
Study Topic 4: “Viable alternatives for the handling, treatment and disposal of drill cuttings, including the potential for processing, reusing and reapplying a portion of the collected drill cuttings as suitable material for roads, brownfield development or other projects, instead of disposing of all collected materials into landfills.”
The WVDEP is utilizing expertise from the West Virginia Department of Transportation’s Department of Highways (DOH) to conduct appropriate material testing on specific samples to determine geotechnical-related characteristics. Prior to the acceptance of any raw drill cuttings to the DOH Materials Lab, a chemical analysis of the material shall be performed in order to determine the type and quantity of any adverse chemicals and/or radioactivity which may be associated with the raw drill cuttings. Such chemical/radioactivity analysis shall be performed by an independent lab utilizing the criteria outlined in other sections on this SOW. Should the analysis indicate that the cuttings are contaminated pursuant to the criteria previously established, then the WVDOH will not accept the cuttings for further physical testing/analysis.
If the chemical/radioactivity analysis indicates that the cuttings are not contaminated pursuant to the criteria previously outlined, the DOH shall accept the cutting for further physical testing/analysis. Such testing/analysis may include, but not be limited to, moisture content, Atterberg Limits, grain size distribution and other testing that may be appropriate depending on the amount of liquid (water) contained in the sample being tested.
Based on information obtained during the planning stage of this project, it has been noted that drill cuttings as they come from the drilling site can have varying amounts of water/moisture. It
13
is anticipated that the volume of water associated with this material may make it unsuitable for use in highway construction projects. Mixing the drill cuttings with some dry, inert material such as fly ash is being utilized to reduce the relative moisture content of the cuttings for landfill disposal. This hybrid material may be subjected to the chemical/radioactive testing as described above. Should the chemical/radioactivity analysis indicate that this hybrid material is not contaminated pursuant to the criteria previously outlined, the DOH shall accept this hybrid material for further physical testing/analysis. Such testing/analysis may include, but not be limited to, moisture content, Atterberg Limits, grain size distribution and other testing that may be appropriate depending on the amount of liquid (water) contained in the sample being tested. If the sample is suitable, other tests may be performed to determine the strength parameters and the compaction criteria of the material.
Another alternative to be evaluated is drying of the subject material to a sufficient state prior to analysis. Testing and analysis would be similar to above-mentioned parameters. It should be noted that, in the event drill cuttings are analyzed for use as a Controlled Low Strength Material, cuttings will require conformance to Section 219.2 of the West Virginia Division of Highways “Standard Specifications Roads and Bridges” (2010) and related supplemental specifications. The DOH will compile a report of findings from the various materials tested.
The West Virginia Brownfields Assistance Center at Marshall University, a program of CEGAS, will be utilized for seeking viable alternatives for utilization of drill cutting materials on brownfield redevelopment projects. Results from the analytical and geotechnical testing of materials to be conducted as part of this overall study will be used as a basis for evaluating the potential for drill cutting materials to be used on brownfield properties as part of remediation and redevelopment options. Additional information obtained from economic evaluation results of this overall study will also be utilized. Research and Resources from the Environmental Protection Agency (EPA) Brownfields Program and WVDEP will be utilized to augment project study efforts.
Study Topic 5: “A study of the feasibility of developing an alternative means of handling the disposal of drill cutting waste.”
The main objective of this study topic is to develop an approach to evaluate the feasibility of alternatives to disposing of drill cuttings in landfills. A report on the feasibility of various alternatives to landfill disposal of drill cuttings will be compiled, excluding reuse. Based on an initial review of potential alternatives performed during the initial stage of this project, a minimum of five alternatives have been identified for evaluation. Additional disposal options may be evaluated as additional information is reviewed during the course of this study. Each disposal option and associated supporting research topics are provided below:
1. On-site disposal of drill cuttings with landowner approval: a. Describe history of on-site disposal and development of the Natural Gas
Horizontal Well Control Act and the “6A” well distinction. b. Describe the process for applying for a permit for on-site disposal with surface
owner’s approval. This is expected to include requirements to comply with environmental impact laws including:
i. Groundwater Protection Act ii. Storm water Protection Act
14

iii. National Pollutant Discharge Elimination Systems iv. Impact to streams v. Anti-degradation laws
2. Underground Injection/Re-injection: Describe these processes and establish whether they are options for drill cuttings in terms of applicable experiences, level of commercial availability and expected costs.
a. Annular injection (drill/inject simultaneously). b. Tubing injection w existing redundant well c. Tubing injection w dedicated injection well
3. Thermal treatment 4. Biological treatment 5. Out-of-State disposal options
Results from the previous study topics will be utilized to support resulting conclusions of this study topic, including results of chemical and material analyses conducted by project team members. Additional data / information sources will include the WVDEP, American Petroleum Institute, and “Environmental Studies Research” report on cuttings treatment published by the Canadian Government.
15

ATTACHMENT – Base Analytical Parameter List
Aluminum
Antimony
Arsenic
Barium
Beryllium
Boron
Cadmium
Chromium and Hexavalent Chromium
Copper
Lead
Lithium
Mercury
Nickel
Selenium
Silver
Strontium
Vanadium
Zinc
Chloride
Fluoride
Nitrogen (Nitrate and Nitrite)
Sulfate
Total Suspended Solids
Free Cyanide
Benzene
Chlorobenzene
Chlorodibromomethane
16

Semi-Volatile Organic Compounds (1,2-Dichlorobenzene, 1,3-Dichlorobenzene, 1,4-Dichlorobenzene, 1,4-Dinitrobenzene, 1,4-Naphthoquinone, 2,4=Dinitrotoluene, 2,6-Dinitrotoluene, 4-Nitroquinoline-1-oxide, bis(2-ethylhexyl) phthalate, Butyl benzylphthalate, Di-N-Butyl Phthalate, Di-N-Octylphthalate Diethyl Phthalate, Dimethyl Phthalate, Flouranthene, Nitrobenzene, Pentachloronitrobenzene)
Gross Alpha
Gross Beta
Radium 226
Radium 228
Strontium 90
pH
lab pH
Total Dissolved Solids
BOD 5-Day
Ammonia Nitrogen
Total Kjeldahl Nitrogen
Oil & Grease
Acidity to pH 8.3
Specific Conductance
Alkalinity to pH 4.5
Chemical Oxygen Demand
Dissolved Iron and Iron
Manganese and Dissolved Manganese
17

Appendix B
Analytical Parameter List

WVDEP Drill Cutting / Leachate Analysis List
Aluminum
Antimony
Arsenic
Barium
Beryllium
Boron
Cadmium
Chromium
Hexavalent Chromium
Copper
Lead
Lithium
Mercury
Nickel
Selenium
Silver
Strontium
Vanadium
Zinc
Chloride
Fluoride
Nitrate as Nitrogen
Nitrite as Nitrogen
Sulfate
Total Suspended Solids
Free Cyanide
Benzene
Chlorobenzene
Chlorodibromomethane

1,2-Dichlorobenzene
1,3-Dichlorobenzene
1,4-Dichlorobenzene
1,4-Dinitrobenzene
1,4-Naphthoquinone
2,4-Dinitrotoluene
2,6-Dinitrotoluene
4-Nitroquinoline-1-oxide
bis(2-ethylhexyl) phthalate
Butyl benzylphthalate
Di-N-Butyl Phthalate
Di-N-Octylphthalate Diethyl Phthalate
Dimethyl Phthalate
Flouranthene
Nitrobenzene
Pentachloronitrobenzene
Gross Alpha
Gross Beta
Radium 226
Radium 228
Strontium 90
Radon
pH
Total Dissolved Solids
Total Suspended Solids
BOD 5-Day
Ammonia as Nitrogen
Total Kjeldahl Nitrogen
Oil & Grease
Acidity to pH 8.3

Specific Conductance
Alkalinity to pH 4.5
Chemical Oxygen Demand
Dissolved Iron and Iron
Manganese and Dissolved Manganese

Appendix C
Drill Location Map

!.
!.
#0
#0
!.WENTZ UNIT 1H
MCGEE UNIT 2H
MORTON UNIT 1H
BIERSTADT UNIT 2H
SHEEP RUN UNIT 2H
Sources: Esri, DeLorme, NAVTEQ, USGS, NRCAN, METI, iPC,TomTom
Sampled Well Locations
LegendSampled Wells!. Horizontal#0 Vertical
±
0 0.85 1.7 2.55 3.40.425Miles

Appendix D
Analytical Results of Landfill Leachate

Compound Short Creek - Open Nov 2014 Analysis
Short Creek - Open Mar 2015 Analysis
Short Creek - Closed Nov 2014 Analysis
Short Creek - Closed Mar 2015 Analysis
Wheeling POTW Nov 2014 Analysis
Wheeling POTW Mar 2015 Analysis
Aluminum 0.123 0.031 0.007 ND ND ND Antimony ND ND ND ND ND ND Arsenic 0.094 0.047 0.032 ND ND ND Barium 2.49 1.68 1.43 0.727 0.046 0.045 Beryllium ND ND ND ND ND ND Boron 22.5 12.1 9.02 3.78 0.304 0.212 Cadmium ND ND ND ND ND ND Chromium 0.094 0.049 0.026 0.008 ND ND Copper 0.049 0.016 0.011 0.017 0.005 ND Iron 10.8 20.5 8.34 5.99 0.125 0.09 Lead 0.01 ND ND ND ND ND Lithium 0.343 0.225 0.137 0.082 0.025 ND Manganese 0.271 1.25 0.604 0.744 0.567 0.048 Nickel 0.339 0.178 0.11 0.045 ND 0.006 Selenium ND ND ND ND ND ND Silver ND ND ND ND ND ND Strontium 2.21 2.25 1.61 1.45 0.708 0.709 Vanadium 0.04 0.026 0.01 ND ND ND Zinc 0.07 0.036 0.024 0.076 0.023 0.022 Mercury ND ND ND ND ND ND 1,4-Dinitrobenzene ND ND ND ND ND ND 1,4-Napthoquinone ND ND ND ND ND ND 4-Nitroquinoline -1-oxide ND ND ND ND ND ND Pentachloronitrobenzene ND ND ND ND ND ND *Units in picocuries per liter ND – non detected Units equal mg/l unless noted
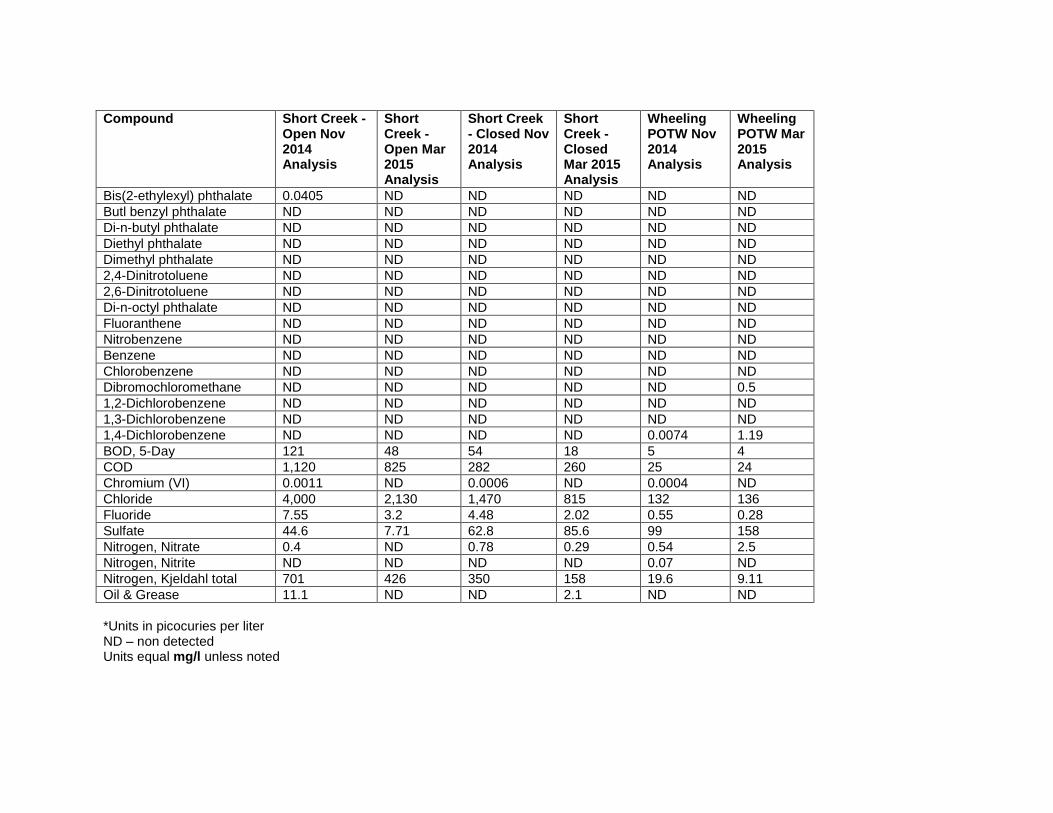
Compound Short Creek -
Open Nov 2014 Analysis
Short Creek - Open Mar 2015 Analysis
Short Creek - Closed Nov 2014 Analysis
Short Creek - Closed Mar 2015 Analysis
Wheeling POTW Nov 2014 Analysis
Wheeling POTW Mar 2015 Analysis
Bis(2-ethylexyl) phthalate 0.0405 ND ND ND ND ND Butl benzyl phthalate ND ND ND ND ND ND Di-n-butyl phthalate ND ND ND ND ND ND Diethyl phthalate ND ND ND ND ND ND Dimethyl phthalate ND ND ND ND ND ND 2,4-Dinitrotoluene ND ND ND ND ND ND 2,6-Dinitrotoluene ND ND ND ND ND ND Di-n-octyl phthalate ND ND ND ND ND ND Fluoranthene ND ND ND ND ND ND Nitrobenzene ND ND ND ND ND ND Benzene ND ND ND ND ND ND Chlorobenzene ND ND ND ND ND ND Dibromochloromethane ND ND ND ND ND 0.5 1,2-Dichlorobenzene ND ND ND ND ND ND 1,3-Dichlorobenzene ND ND ND ND ND ND 1,4-Dichlorobenzene ND ND ND ND 0.0074 1.19 BOD, 5-Day 121 48 54 18 5 4 COD 1,120 825 282 260 25 24 Chromium (VI) 0.0011 ND 0.0006 ND 0.0004 ND Chloride 4,000 2,130 1,470 815 132 136 Fluoride 7.55 3.2 4.48 2.02 0.55 0.28 Sulfate 44.6 7.71 62.8 85.6 99 158 Nitrogen, Nitrate 0.4 ND 0.78 0.29 0.54 2.5 Nitrogen, Nitrite ND ND ND ND 0.07 ND Nitrogen, Kjeldahl total 701 426 350 158 19.6 9.11 Oil & Grease 11.1 ND ND 2.1 ND ND *Units in picocuries per liter ND – non detected Units equal mg/l unless noted
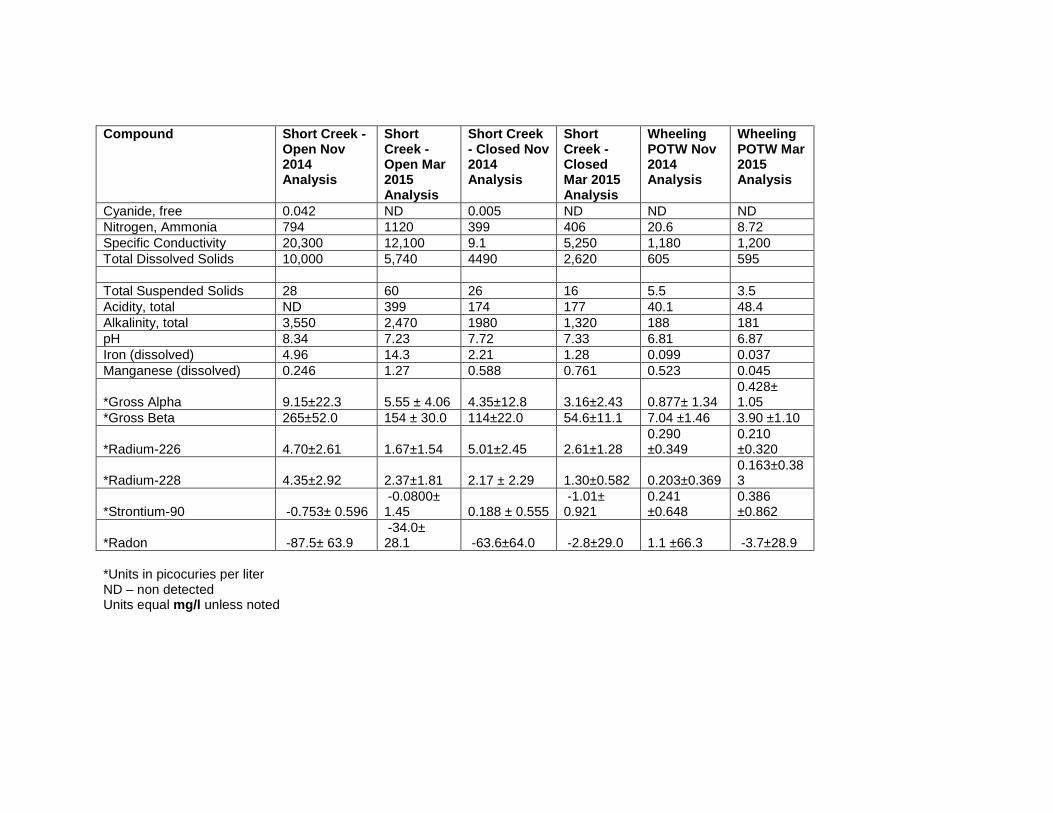
Compound Short Creek -
Open Nov 2014 Analysis
Short Creek - Open Mar 2015 Analysis
Short Creek - Closed Nov 2014 Analysis
Short Creek - Closed Mar 2015 Analysis
Wheeling POTW Nov 2014 Analysis
Wheeling POTW Mar 2015 Analysis
Cyanide, free 0.042 ND 0.005 ND ND ND Nitrogen, Ammonia 794 1120 399 406 20.6 8.72 Specific Conductivity 20,300 12,100 9.1 5,250 1,180 1,200 Total Dissolved Solids 10,000 5,740 4490 2,620 605 595 Total Suspended Solids 28 60 26 16 5.5 3.5 Acidity, total ND 399 174 177 40.1 48.4 Alkalinity, total 3,550 2,470 1980 1,320 188 181 pH 8.34 7.23 7.72 7.33 6.81 6.87 Iron (dissolved) 4.96 14.3 2.21 1.28 0.099 0.037 Manganese (dissolved) 0.246 1.27 0.588 0.761 0.523 0.045
*Gross Alpha 9.15±22.3 5.55 ± 4.06 4.35±12.8 3.16±2.43 0.877± 1.34 0.428± 1.05
*Gross Beta 265±52.0 154 ± 30.0 114±22.0 54.6±11.1 7.04 ±1.46 3.90 ±1.10
*Radium-226 4.70±2.61 1.67±1.54 5.01±2.45 2.61±1.28 0.290 ±0.349
0.210 ±0.320
*Radium-228 4.35±2.92 2.37±1.81 2.17 ± 2.29 1.30±0.582 0.203±0.369 0.163±0.383
*Strontium-90 -0.753± 0.596 -0.0800± 1.45 0.188 ± 0.555
-1.01± 0.921
0.241 ±0.648
0.386 ±0.862
*Radon -87.5± 63.9 -34.0± 28.1 -63.6±64.0 -2.8±29.0 1.1 ±66.3 -3.7±28.9
*Units in picocuries per liter ND – non detected Units equal mg/l unless noted

Compound North Western Nov 2014 Analysis
North Western Mar 2015 Analysis
Parkersburg POTW Nov 2014 Analysis
Parkersburg POTW Mar 2015 Analysis
Aluminum 0.012 0.018 0.042 0.221 Antimony ND ND ND ND Arsenic 0.352 0.423 ND ND Barium 3.08 2.27 0.03 0.044 Beryllium ND ND ND ND Boron 42.8 23.9 0.305 0.082 Cadmium ND ND ND ND Chromium 0.014 0.011 ND ND Copper ND ND 0.013 0.01 Iron 17.5 15.4 0.077 0.497 Lead ND ND ND ND Lithium 0.082 0.06 ND ND Manganese 0.55 1.77 0.031 0.156 Nickel 0.166 0.088 ND ND Selenium ND ND ND ND Silver ND ND ND ND Strontium 5.71 4.37 0.251 0.182 Vanadium 0.009 0.011 ND ND Zinc 0.005 0.004 0.046 0.021 Mercury ND ND ND ND 1,4-Dinitrobenzene ND ND ND ND 1,4-Napthoquinone ND ND ND ND 4-Nitroquinoline -1-oxide ND ND ND ND Pentachloronitrobenzene ND ND ND ND Bis(2-ethylexyl) phthalate ND ND ND ND Butl benzyl phthalate ND ND ND ND Di-n-butyl phthalate ND ND ND ND Diethyl phthalate ND ND ND ND Dimethyl phthalate ND ND ND ND 2,4-Dinitrotoluene ND ND ND ND 2,6-Dinitrotoluene ND ND ND ND Di-n-octyl phthalate ND ND ND ND Fluoranthene ND ND ND ND Nitrobenzene ND ND ND ND Benzene ND 3.05 ND ND Chlorobenzene ND 65 ND ND Dibromochloromethane ND ND 0.00145 ND 1,2-Dichlorobenzene ND ND ND ND 1,3-Dichlorobenzene ND ND ND ND 1,4-Dichlorobenzene ND 6.52 ND ND BOD, 5-Day 74 ND 4 7 *Units in picocuries per liter ND – non detected Units equal mg/l unless noted

Compound North
Western Nov 2014 Analysis
North Western Mar 2015 Analysis
Parkersburg POTW Nov 2014 Analysis
Parkersburg POTW Mar 2015 Analysis
COD 130 410 17 24 Chromium (VI) ND ND 0.0002 ND Chloride 4,420 2,570 141 75 Flouride 0.34 0.83 0.68 0.14 Sulfate 75.6 42.6 74.8 39.8 Nitrogen, Nitrate 1.46 ND 19.8 5.5 Nitrogen, Nitrite ND ND ND ND Nitrogen, Kjeldahl total 410 233 0.82 1.15 Oil & Grease ND ND 2.1 2 Cyanide, free 0.015 ND ND ND Nitrogen, Ammonia 405 233 0.18 ND Specific Conductivity 18,300 11,400 1,020 605 Total Dissolved Solids 9,140 6,040 583 307 Total Suspended Solids 104 30 3 16.5 Acidity, total 152 413 9.9 19 Alkalinity, total 1,940 1,530 98.3 70.8 pH 7.8 6.96 7.13 6.46 Iron (dissolved) 1.27 10.3 0.046 0.061 Manganese (dissolved) 0.528 1.5 0.007 0.005 *Gross Alpha -10.7± 33.1 12.8± 4.34 -1.44 ± 1.48 0.426 ± 0.648 *Gross Beta 1174 ± 214 776 ± 141 8.74 ± 2.48 4.79 ± 1.42 *Radium-226 11.1 ±3.36 5.05 ± 2.10 0.342 ± 0.319 0.310 ± 0.708 *Radium-228 6.33 ± 1.44 3.27 ± 0.868 0.543 ± 0.514 -0.291 ± 0.380 *Strontium-90 0.566 ± 0.815 0.0440 ± 0.747 -0.549 ± 0.901 -0.00400 ± 0.866 *Radon -45.3 ±41.3 34.0 ± 29.5 -45.4 ±41.2 -0.7 ± 27.1 *Units in picocuries per liter ND – non detected Units equal mg/l unless noted

Compound Meadowfill Landfill Dec 2014 Analysis
Meadowfill Landfill Mar 2015 Analysis
Bridgeport POTW Dec 2014 Analysis
Bridgeport POTW Mar 2015 Analysis
Aluminum 0.007 0.376 0.025 0.027 Antimony ND ND 0.033 ND Arsenic ND ND ND ND Barium 0.681 0.612 0.047 0.051 Beryllium ND ND ND ND Boron 3.24 3.92 0.256 0.373 Cadmium ND ND ND ND Chromium ND ND ND ND Copper ND ND ND ND Iron 1.67 18.9 0.095 0.089 Lead ND ND ND ND Lithium 0.461 0.449 ND ND Manganese 12.2 16.8 0.015 0.019 Nickel 0.011 0.01 ND ND Selenium ND ND ND ND Silver ND ND ND ND Strontium 16 9.51 0.249 0.202 Vanadium 0.048 0.044 ND ND Zinc ND 0.007 0.029 0.047 Mercury ND ND ND ND 1,4-Dinitrobenzene ND ND ND ND 1,4-Napthoquinone ND ND ND ND 4-Nitroquinoline -1-oxide ND ND ND ND Pentachloronitrobenzene ND ND ND ND Bis(2-ethylexyl) phthalate ND ND ND ND Butl benzyl phthalate ND ND ND ND Di-n-butyl phthalate ND ND ND ND Diethyl phthalate ND ND ND ND Dimethyl phthalate ND ND ND ND 2,4-Dinitrotoluene ND ND ND ND 2,6-Dinitrotoluene ND ND ND ND Di-n-octyl phthalate ND ND ND ND Fluoranthene ND ND ND ND Nitrobenzene ND ND ND ND Benzene 3.06 3.26 ND ND Chlorobenzene 1.83 1.47 ND ND Dibromochloromethane ND ND ND ND 1,2-Dichlorobenzene ND ND ND ND *Units in picocuries per liter ND – non detected Units equal mg/l unless noted

Compound Meadowfill
Landfill Dec 2014 Analysis
Meadowfill Landfill Mar 2015 Analysis
Bridgeport POTW Dec 2014 Analysis
Bridgeport POTW Mar 2015 Analysis
1,3-Dichlorobenzene ND ND ND ND 1,4-Dichlorobenzene 11.1 9.4 ND 1.03 BOD, 5-Day 285 ND 3 ND COD 335 252 33 25 Chromium (VI) ND ND ND ND Chloride 6,100 5,750 127 124 Fluoride 2.75 ND 0.12 0.3 Sulfate 690 872 78.9 74.6 Nitrogen, Nitrate ND ND 16.5 9.3 Nitrogen, Nitrite ND ND ND ND Nitrogen, Kjeldahl total 9.04 5.16 3.28 1.51 Oil & Grease ND 15.1 ND ND Cyanide, free ND ND ND ND Nitrogen, Ammonia 0.72 3.34 ND 0.08 Specific Conductivity 23,400 22,900 976 957 Total Dissolved Solids 15,400 15,100 522 543 Total Suspended Solids 26 26 9 3.5 Acidity, total 232 264 8.1 7.9 Alkalinity, total 755 848 60.4 72.7 pH 6.83 6.92 6.84 7.07 Iron (dissolved) 0.217 0.215 0.055 0.068 Manganese (dissolved) 12.2 12.6 0.009 0.017
*Gross Alpha 5.36 ± 2.21 3.52 ± 1.77 0.156 ± 1.40 -0.496 ± 1.31
*Gross Beta 136 ± 73.2 280 ± 55.7 5.38 ± 1.63 6.09 ± 1.73 *Radium-226 3.23 ± 2.14 1.26 ± 0.833 1.67 ± 1.72 0.742 ± 1.13
*Radium-228 1.41 ± 1.34 1.18 ± 0.553 0.381 ± 0.389
0.519 ± 0.440
*Strontium-90 0.775 ± .617 -0.131 ± 0.651
0.0520 ± 0.429
-0.0720 ± 0.579
*Radon 38.7 ± 47.4 41.3± 29.9 27.1 ± 47.2 19.7 ± 28.1 *Units in picocuries per liter ND – non detected Units equal mg/l unless noted

Compound Wetzel Co. Landfill Jan 2015 Analysis
Wetzel Co. Landfill Mar/May 2015 Analysis
Wetzel Co. WWTP Jan 2015 Analysis
Wetzel Co. WWTP Mar/May 2015 Analysis
Aluminum 0.026 ND 0.668 0.206 Antimony ND ND ND ND Arsenic ND ND ND ND Barium 1.01 1.04 0.953 0.598 Beryllium ND ND ND ND Boron 1.65 2.16 1.9 1.07 Cadmium ND ND ND ND Chromium ND 0.006 0.005 ND Copper ND ND 0.006 ND Iron 5.42 4.28 3.32 1.32 Lead ND ND ND ND Lithium 0.039 0.041 0.043 0.033 Manganese 2.25 2.52 1.3 1.26 Nickel 0.023 0.025 0.029 0.015 Selenium ND ND ND ND Silver ND ND ND ND Strontium 4.12 3.6 4.22 2.65 Vanadium ND ND 0.006 ND Zinc 0.01 0.01 0.016 0.015 Mercury ND ND ND ND 1,4-Dinitrobenzene ND ND ND ND 1,4-Napthoquinone ND ND ND ND 4-Nitroquinoline -1-oxide ND ND ND ND Pentachloronitrobenzene ND ND ND ND Bis(2-ethylexyl) phthalate ND ND ND ND Butl benzyl phthalate ND ND ND ND Di-n-butyl phthalate ND ND ND ND Diethyl phthalate ND ND ND ND Dimethyl phthalate ND ND ND ND 2,4-Dinitrotoluene ND ND ND ND 2,6-Dinitrotoluene ND ND ND ND Di-n-octyl phthalate ND ND ND ND Fluoranthene ND ND ND ND Nitrobenzene ND ND ND ND Benzene 0.66 ND ND ND Chlorobenzene 3.23 ND ND ND *Units in picocuries per liter ND – non detected Units equal mg/l unless noted

Compound Jan 2015 Analysis
Mar/May 2015 Analysis
Jan 2015 Analysis
Mar/May 2015 Analysis
Dibromochloromethane ND ND ND ND 1,2-Dichlorobenzene ND ND ND ND 1,3-Dichlorobenzene ND ND ND ND 1,4-Dichlorobenzene 1.07 ND ND ND BOD, 5-Day 18 38 19 33 COD 140 180 142 93 Chromium (VI) ND ND ND 0.0013 Chloride 1,300 1,840 1,550 825 Fluoride 1.01 1.35 0.86 0.82 Sulfate 98 78 92.5 77.2 Nitrogen, Nitrate 0.35 0.06 35 16.5 Nitrogen, Nitrite ND 2.5 ND 3.8 Nitrogen, Kjeldahl total 70.2 80.3 37.4 20.8 Oil & Grease 3.1 2 2.2 3.1 Cyanide, free ND ND ND 0.018 Nitrogen, Ammonia 75 87.1 36.3 18.9 Specific Conductivity 6,120 6,410 6,560 3,860 Total Dissolved Solids 3,500 3,570 3,770 2,140 Total Suspended Solids 11 10 42 13 Acidity, total 89.1 130 24.3 36.2 Alkalinity, total 826 983 475 450 pH 7.44 7.57 7.82 7.63 Iron (dissolved) 0.683 0.298 0.113 0.074 Manganese (dissolved) 2.2 2.89 1.12 1.18
*Gross Alpha 6.26 ± 4.40 18.4 ± 15.9 3.56 ± 4.38 9.03 ± 5.85
*Gross Beta 34.3 ± 7.65 56.2 ± 13.7 38.9 ± 8.84 28.3 ± 6.61
*Radium-226 5.47 ± 2.48 1.18 ± 1.01 3.87 ± 2.47 0.582 ± 0.809
*Radium-228 0.751 ± 2.39
1.45 ± 0.529
-0.835 ± 1.31 0.503 ± 0.401
*Strontium-90 -0.107 ± 0.857 1.09 ± 1.08
-0.757 ± 0.831 5.78 ± 1.49
*Radon 4.8 ± 39.8 33.3± 34.9 -41.8 ± 38.4 -25.4 ± 31.9
*Units in picocuries per liter ND – non detected Units equal mg/l unless noted

Compound Charleston Landfill Dec 2014 Analysis
Charleston Landfill Mar 2015 Analysis
Charleston POTW Dec 2014 Analysis
Charleston POTW Mar 2015 Analysis
Aluminum 0.026 0.034 0.017 0.034 Antimony ND ND ND ND Arsenic 0.059 0.056 ND ND Barium 0.891 0.79 0.044 0.048 Beryllium ND ND ND ND Boron 2.45 2.06 0.116 0.117 Cadmium ND 0.001 ND ND Chromium 0.026 0.022 ND ND Copper ND ND ND 0.009 Iron 13.3 22 0.11 0.137 Lead ND ND ND ND Lithium 0.044 0.042 ND ND Manganese 1.13 1.72 0.182 0.01 Nickel 0.069 0.048 ND ND Selenium ND ND ND ND Silver ND ND ND ND Strontium 0.743 1.01 0.146 0.147 Vanadium 0.017 0.013 ND ND Zinc 0.012 0.016 0.046 0.066 Mercury ND ND ND ND 1,4-Dinitrobenzene ND ND ND ND 1,4-Napthoquinone ND ND ND ND 4-Nitroquinoline -1-oxide ND ND ND ND Pentachloronitrobenzene ND ND ND ND Bis(2-ethylexyl) phthalate ND ND ND ND Butl benzyl phthalate ND ND ND ND Di-n-butyl phthalate ND ND ND ND Diethyl phthalate ND ND ND ND Dimethyl phthalate ND ND 0.0024 ND 2,4-Dinitrotoluene ND ND ND ND 2,6-Dinitrotoluene ND ND ND ND Di-n-octyl phthalate ND ND ND ND Fluoranthene ND ND ND ND Nitrobenzene ND ND ND ND Benzene ND 3.48 ND ND Chlorobenzene ND 2.36 ND ND Dibromochloromethane ND ND ND ND 1,2-Dichlorobenzene ND 12.5 ND 1.34 1,3-Dichlorobenzene ND 7.78 ND 0.84 1,4-Dichlorobenzene 11.9 8.02 ND 0.86 BOD, 5-Day ND 102 4 3 COD 362 356 22 31 Chromium (VI) ND ND 0.0008 ND Chloride 190 312 60 81 Fluoride 0.43 0.11 0.37 0.55 ND- Non Detected Units equal mg/l unless noted

Compound Charleston
Landfill Dec 2014 Analysis
Charleston Landfill Mar 2015 Analysis
Charleston POTW Dec 2014 Analysis
Charleston POTW Mar 2015 Analysis
Sulfate 80.5 123 33.3 41.8 Nitrogen, Nitrate 0.62 0.08 0.9 0.13 Nitrogen, Nitrite ND 0.35 1.39 0.13 Nitrogen, Kjeldahl total 302 194 7.68 13.9 Oil & Grease ND ND ND ND Cyanide, free 0.037 ND 0.007 ND Nitrogen, Ammonia 317 187 6.96 12.7 Specific Conductivity 5,280 4,040 534 654 Total Dissolved Solids 2,120 2,140 255 359 Total Suspended Solids 40 49 5.5 4 Acidity, total 378 315 40.5 50.9 Alkalinity, total 1,890 1,140 86.1 110 pH 6.9 7.1 6.26 6.43 Iron (dissolved) 10.5 21.7 0.068 0.08 Manganese (dissolved) 1.09 1.73 0.177 0.005 *Gross Alpha 7.55 ± 3.25 7.14 ± 3.00 1.35 ± 1.46 0.928 ± 1.39 *Gross Beta 124 ± 23.0 77.5 ± 14.4 5.37 ± 1.5 4.64 ± 1.51 *Radium-226 2.83 ± 1.99 1.24 ± 0.999 0.102 ± 0.464 1.83 ± 1.28 *Radium-228 1.79 ± 0.881 1.94 ± 0.933 0.0796 ± .0344 0.704 ± 0.440 *Strontium-90 1.34 ± 0.748 0.760 ± 1.20 0.881 ± 0.781 0.704 ± 0.450 *Radon -14.5 ± 40.1 28.4 ± 25.2 35.3± 41.2 11.9± 24.0 *Units in picocuries per liter ND- Non Detected Units equal mg/l unless noted

Compound Raleigh County Landfill Feb 2015 Analysis
Raleigh County Landfill Mar 2015 Analysis
North Beckley POTW Feb 2014 Analysis
North Beckley POTW Mar 2015 Analysis
Aluminum 0.227 0.244 0.013 0.031 Antimony ND 0.027 ND ND Arsenic 0.035 0.087 ND ND Barium 0.63 0.804 0.038 0.085 Beryllium ND ND ND ND Boron 3.44 5.1 0.107 0.279 Cadmium ND ND ND ND Chromium 0.047 0.042 ND ND Copper 0.007 0.011 0.011 ND Iron 11.5 29.2 0.107 0.205 Lead ND ND ND ND Lithium 0.032 0.054 ND ND Manganese 1.72 3.32 0.004 0.016 Nickel 0.074 0.106 ND 0.008 Selenium ND ND ND ND Silver ND ND ND ND Strontium 0.997 1.32 0.351 0.437 Vanadium ND 0.007 ND ND Zinc 0.066 0.58 0.071 0.032 Mercury ND ND ND ND 1,4-Dinitrobenzene ND ND ND ND 1,4-Napthoquinone ND ND ND ND 4-Nitroquinoline -1-oxide ND ND ND ND Pentachloronitrobenzene ND ND ND ND Bis(2-ethylexyl) phthalate ND ND ND ND Butl benzyl phthalate ND ND ND ND Di-n-butyl phthalate ND ND ND ND Diethyl phthalate 0.0027 0.0203 ND ND Dimethyl phthalate ND ND ND ND 2,4-Dinitrotoluene ND ND ND ND 2,6-Dinitrotoluene ND ND ND ND Di-n-octyl phthalate ND ND ND ND Fluoranthene ND ND ND ND Nitrobenzene ND ND ND ND Benzene ND 1.28 ND ND Chlorobenzene ND ND ND ND Dibromochloromethane ND ND ND ND 1,2-Dichlorobenzene ND ND ND ND 1,3-Dichlorobenzene ND ND ND ND ND – non detected Units equal mg/l unless noted

Compound Dec 2014
Analysis Mar 2015 Analysis
Dec 2014 Analysis
Mar 2015 Analysis
1,4-Dichlorobenzene ND 3.07 ND ND BOD, 5-Day 136 1,230 4 10 COD 102 2,100 29 49 Chromium (VI) ND 0.0019 0.0003 ND Chloride 401 420 154 128 Fluoride 2.84 34.5 0.29 0.37 Sulfate 87.9 64.5 31.1 52.2 Nitrogen, Nitrate ND ND 3 1.62 Nitrogen, Nitrite 0.22 3 ND ND Nitrogen, Kjeldahl total 196 210 1.34 24.4 Oil & Grease ND 2.3 2.3 3.2 Cyanide, free 0.019 0.005 ND ND Nitrogen, Ammonia 187 224 ND 4.21 Specific Conductivity 4,230 5,400 841 965 Total Dissolved Solids 2,080 2,860 423 524 Total Suspended Solids 19.5 138 4 5.5 Acidity, total 88.3 211 10.9 22.6 Alkalinity, total 1,350 1,950 77.3 138 pH 7.71 7.55 6.67 6.99 Iron (dissolved) 3.86 0.77 0.059 0.064 Manganese (dissolved) 1.55 2.97 ND 0.008 *Gross Alpha 6.06 ±4.65 2.61 ±1.37 -0.900 ± 1.34 -0.722 ± 1.04 *Gross Beta 81.4 ± 15.2 121 ± 22.6 4.67 ± 1.03 8.47 ± 2.23 *Radium-226 2.25 ± 1.30 10.6 ± 10.7 0.483 ± 0.738 1.09 ± 0.831 *Radium-228 0.906 ± 0.797 10.2 ± 10.6 0.139 ± 0.490 1.12 ± 0.603
*Strontium-90 3.64 ± 0.917 -0.275 ± 0.764 41.7 ± 6.78 -0.322 ± 0.796
*Radon -18.8±25.4 -37.8 ± 24.2 4.0± 26.2 -7.9 ± 24.8 *Units in picocuries per liter ND – non detected Units equal mg/l unless noted

Appendix E
Analytical Results of Drill Cuttings

Compound Morton 1H lateral
Wentz 1H lateral
McGee Unit 2H lateral
Sheep Run 2H Air
Bierstadt 2H Mud
Aluminum 5,300 4,170 2710 9,950 11,000 Antimony 4.21 4.29 3.99 ND ND Arsenic 36.9 42.8 26.1 4.1 10.4 Barium 122 125 147 378 754 Beryllium 0.674 0.739 0.463 0.755 0.605 Boron 23.4 26.3 20.4 6.3 8.22 Cadmium 7.18 2.57 4.43 0.399 0.524 Chromium 37.2 21.9 17 16.9 20.3 Copper 170 177 95.6 23.4 19.8 Iron 21,500 22,100 17,900 20,000 23,000 Lead 25.4 28.3 29.8 12 15.8 Lithium 4.66 4.69 3.85 18.9 25.2 Manganese 121 132 155 419 221 Nickel 116 98 79.9 20.2 22.4 Selenium 11.6 13.5 9.21 ND ND Silver 1.36 0.789 0.658 ND 0.18 Strontium 4,640 5,560 6,320 120 2,270 Vanadium 209 155 68.7 15.9 21.1 Zinc 405 138 233 44 66.2 Mercury 0.16 0.14 0.106 0.021 0.028 1,4-Dinitrobenzene ND ND ND ND ND 1,4-Napthoquinone ND ND ND ND ND 4-Nitroquinoline -1-oxide ND ND ND ND ND Pentachloronitrobenzene ND ND ND ND ND Bis(2-ethylexyl) phthalate ND ND ND ND ND Butl benzyl phthalate ND ND ND ND ND Di-n-butyl phthalate ND ND ND ND ND Diethyl phthalate ND ND ND ND ND Dimethyl phthalate ND ND ND ND ND 2,4-Dinitrotoluene ND ND ND ND ND 2,6-Dinitrotoluene ND ND ND ND ND
A. Units in picocuries per gram B. ND – non detected C. Units per measurement equal mg/kg

Compound Morton 1H lateral
Wentz 1H lateral
McGee Unit 2H lateral
Sheep Runit 2H Air
Bierstadt 2H Mud
Di-n-octyl phthalate ND ND ND ND ND Fluoranthene ND 0.24 ND ND ND Nitrobenzene ND ND ND ND ND Benzene 773 2,010 1,660 19.5 115 Chlorobenzene ND ND ND ND ND Dibromochloromethane ND ND ND ND 7.36 1,2-Dichlorobenzene ND ND ND ND ND 1,3-Dichlorobenzene ND ND ND ND ND 1,4-Dichlorobenzene ND ND ND ND ND Chromium (VI) 2.68 1.96 1.04 0.12 0.28 Chloride 27,000 35,400 57,000 347 43,800 Flouride 2 2.2 2.2 11 72.2 Sulfate 374 510 514 758 Nitrogen, Nitrate 0.8 1.2 0.8 0.6 0.4 Nitrogen, Nitrite 1.6 nd 2 1 ND Nitrogen, Kjeldahl total 1,970 1,910 1,170 234 539 Oil & Grease 0.039 0.032 0.017 0.1 0.143 Cyanide, free nd nd 0.72 ND ND Nitrogen, Ammonia ND 11.2 11.2 ND 10.9 Specific Conductivity 84700 118000 173,000 14,000 134,000 Alkalinity, total 10,200 6,630 8,440 16,400 7,590 pH 10.7 10.5 9.02 12.1 8.94 Percent Moisture 17 18 29 17 25 Gross Alpha 30.4 ± 9.49 26.3 ± 8.93 40.8 ± 11.7 13.1 ± 6.97 17.8 ± 8.09 Gross Beta 31.2 ± 7.10 34.8 ± 7.78 23.2 ± 6.17 15.8 ± 4.79 18.5 ± 4.92 Radium-226 8.189 ± 1.195 4.442 ± 0.708 6.397 ± 0.815 1.408 ± 0.288 1.996 ± 0.427 Radium-228 0.794 ± 0.469 1.230 ± 0.329 0.458 ± 0.254 1.993 ± 0.432 2.112 ± 0.472 Strontium-90 0.0740 ± 0.565 0.151 ± 0.152 0.0610±0.541 -0.0531± .0918 0.0130 ± 0.0794
A. Units in picocuries per gram B. ND – non detected C. Units per measurement equal mg/kg

Appendix F
Ecotoxicology Study (Compiled by Glenville State College, Department of Land Resources)

Ecotoxicity of leachate from landfills containing shale drill cuttings Milan C. Vavrek
Department of Land Resources Glenville State College
Abstract
To complement the physical, chemical and radiological characterization of leachate from
landfills receiving drill cuttings and to identify potential negative impacts on waters from such
leachate, a series of ecotoxicologically tests were conducted. Ecotoxicology studies the effects
of compounds or potential contaminants on biological systems, providing a mechanism to better
understand the potential risk associated with the characterizations. Ecotoxicity was evaluated
along the pathway of potential contamination from drill cuttings, landfill leachate, and waters
discharged from leachate treatment facilities. Drill cuttings from horizontal shale cuttings
essentially prevented germination of Lactuca sativa ‘Buttercrunch’ seed, a standard species used
in ecotoxicity studies. Moreover, undiluted drill cuttings, regardless of the source (vertical or
horizontal), also resulted in near zero germination. Landfill leachate negatively affected growth
and survival of an aquatic plant species (Lemna minor) and an aquatic invertebrate species
(Daphnia magna). Both species are used commonly for toxicity testing. Generally, leachate
produced from waste containing drill cuttings did not increase leachate toxicity. Treated water
released from Publicly Owned Treatment Works and an onsite treatment facilities receiving
leachate from waste with drill cuttings reduced performance by Daphnia, but not Lemna. The
differences did not appear to relate closely with drill cutting constituents and may relate more
directly to other factors, such as dilution volume at the POTW or treatment processes (e.g.,
extent of chlorination). Landfill leachate was sufficiently treated to improve responses of Lemna
and Daphnia in waters from POTWs and did not differ ecotoxicologically from controls (spring
or nutrient water).
Introduction
Landfill leachate accumulates as precipitation, surface run-off, and water or other liquids
contained in solid waste percolate through the refuse. The water interacts physically, chemically,
and biologically with the waste material (e.g., suspension of solids, dissolution and
decomposition) as it passes through the landfill and combines with other liquid waste.
1

Composition of the leachate is influenced, in part, by waste type, age of the landfill, and how the
waste is handled (Lee et al. 2010, Kjeldsen et al. 2002). Seasonal weather patterns and quantity
of precipitation also contribute to variation in leachate (Bhalla et al. 2013).
Defining the physicochemical characteristics of leachate is essential to assess risk to humans and
the environment from exposure to the leachate. Leachate may potentially contaminate soil, air
and water (Butt et al. 2014). Leachate composition is complex and consists generally of
dissolved organic (carbon-containing) matter, inorganic compounds, heavy metals, and complex
organic compounds (Kjeldsen et al. 2002).
Determining the complete and accurate characteristics of leachate may be hindered by
difficulties in absolute chemical separation and resolution (Thomas 2010, Thomas et al. 2009). To
complement physicochemical analyses, assessment of the bioavailability and biotoxicity of
leachate is needed to better understand the potential consequences of organismal exposure and
environmental contamination. An ecotoxicological approach provides a mechanism to evaluate
the macro effects of a compound on populations and ecosystems (Thomas 2010). A multi-
species approach is often employed, incorporating both terrestrial and aquatic organisms.
Further, species from different trophic levels are used, i.e., producers such as algae and plants,
and consumers such as bacteria, invertebrates and vertebrates. With the use of plants, early
critical stages of development are assessed after exposure to a test substance. Measured plant
responses may include percent germination and seedling survival and growth (US EPA 2012a).
In invertebrate tests, mortality is evaluated. Consequently, the use of organisms to test toxicity
integrates the biological effects of a substance. Standardized protocols testing for biotoxicity
have been developed (e.g., Ecological Effects Test Guidelines, Office of Chemical Safety and
Pollution Prevention, EPA) and databases document toxicity of individual compounds on a
variety of species (e.g., EPA’s ECOTOX). Generally, these tests evaluate acute or subchronic
toxicity, as exposure periods vary from 2 to 28 days. Lastly, ecotoxicological studies evaluate
leachate in its entirety (Linderoth 2006), a combination of compounds that potentially interact
with each other. The interaction may lead to toxicity less or greater than the sum of the
individual chemicals, i.e., a synergistic effect (Newman 2009). Low concentrations of
polycyclic aromatic hydrocarbons in landfill leachate, for example, were not individually toxic.
However, in combination the compounds were cyto- and genotoxic (Ghosh et al. 2015).
2

Ecotoxicological studies have been applied previously to leachate from municipal solid waste
(e.g., Klauck et al. 2013, Tsarpali et al. 2012, Isidori et al. 2003, Ward et al. 2002, Bernard et al.
1996, Devare and Bahadir 1994, Plotkin and Ram 1984). Untreated leachate is toxic to most
organisms (Thomas 2010). In a review of bioassay studies of landfill leachate, ammonia,
alkalinity, pH, conductivity, chloride, heavy metals, and recalcitrant organic compounds were
found to affect test species (Thomas et al. 2009, Kjeldsen et al. 2002). Several studies involving
both chemical and biological assessment found general agreement between physicochemical
parameters and toxicity tests using landfill leachates (Tsarpali and Dailianis 2012, Pablos et al.
2011, Bernard et al. 1997). However, additional studies found little correlation between
chemical and toxicological testing as a result of leachate complexity and biological/chemical
interactions occurring within a landfill (e.g., Thomas et al. 2009).
Studies have also assessed landfill leachate toxicity after treatment. Mackenzie et al. (2003)
documented a reduction in toxicity of leachate after pre-treatments including aeration. In some
cases, biotoxicity risks of the treated leachate existed despite improved physicochemical
parameters (Kalcíková et al. 2011, Thomas et al. 2009). Further, particular combinations of
compounds in leachate may affect treatment processes. The presence of heavy metals, for
example, has been shown to slow degradation of hydrocarbon (Owabor 2011) and
nitrification/denitrification (Wiszniowski 2006). Kashiwada et al. (2005) and Osaki et al. (2006)
found that conventional treatment of leachate effectively removed many toxic compound; heavy
metals were not removed. Thomas et al. (2009) also found that heavy metals persisted after
biological treatment of leachate. However, Slack et al. (2005) summarized several studies that
indicate that the vast majority of heavy metals in waste is immobilized by sorption and
precipitation, and does not leach from the waste.
Oil and gas well drill cuttings add fine grained mineral particles and, potentially, salts, heavy
metals, volatile organic compounds, drilling mud constituents, cutting stabilizer constituents, and
trace amounts of naturally occurring radioactive materials to landfills and subsequently leachate.
Cuttings may be comingled with municipal solid waste or isolated in a separate cell, if by
accepting cuttings the landfill will exceed their monthly tonnage limit (WV HB 107).
Opportunities for contamination of surface- and groundwater from solid waste leachate
incorporating drill cuttings, occur potentially from pooled leachate in a landfill with liner failure,
3

during on-site pretreatment of leachate and transport to Publicly Owned Treatment Works
(POTWs), and lastly from release of treated water from the POTWs.
An ecotoxicity approach has been applied to evaluate the risk of exposure to drill cuttings.
Balgobin et al. (2012), for example, in a study of drilling off shore of Trinidad concluded that
trace metals in drill cuttings and hydrocarbons from drilling fluids were toxic to Metamysidopsis
insularis, a marine species. Similarly, Zamora-Ledezma and García (2013) observed
phytotoxicity of drill cuttings contaminated with mineral oil-based drilling mud from Venezuela.
Souther et al. (2014) concluded, however, that little or no empirical data is available addressing
the biotic risks associated with drill cuttings.
This study provides a mechanism to evaluate potential ecotoxicological hazards of landfill
leachate from waste that contains shale drill cuttings. The intent was to examine the ecotoxicity
along the pathway of potential contamination by assessing drill cuttings before entering a
landfill, leachate produced by the landfill, and water discharged from leachate treatment
facilities. To our knowledge, no ecotoxicological studies have been employed to assess leachate
from landfills accepting both municipal solid waste and shale drill cuttings. The specific
objectives of the study were to:
1. Compare ecotoxicity of vertical and horizontal sections of well drill cuttings that enter
West Virginia landfills;
2. Compare leachate ecotoxicity from landfills that accept and that do not accept drill
cuttings;
3. Contrast ecotoxicity of treated water released from Publicly Owned Treatment Works
(POTWs) or onsite treatment facilities that receive leachate from landfills accepting drill
cuttings from those that do not receive leachate potentially contaminated with drill
cuttings; and
4. Compare ecotoxicity of treated water released from POTWs or onsite treatment facilities
with raw leachate.
Methods
A multi-species approach in ecological testing provided a means to evaluate the ecotoxicological
4

impacts of landfill leachate from waste containing horizontal drill cuttings. Terrestrial and
aquatic organisms and species from different trophic levels (e.g., producers such as plants and
consumers such as invertebrates) were used.
Landfill leachate was collected from six landfills (four which received drill cuttings (Meadowfill,
Northwestern, Short Creek, and Wetzel County) and two which did not (Charleston and Raleigh
County) between 24 November 2014 and 4 February 2015. Until needed, samples were sealed
and refrigerated (4.3 + 0.2 ºC). Water treated by POTWs or onsite treatment facilities that
received landfill leachate from waste that included horizontal drill cuttings (Bridgeport,
Parkersburg, Wetzel, and Wheeling) was collected between 24 November 2014 and 26 January
2015. Water was also sampled from POTWs receiving leachate from landfills without drill
cuttings (Charleston and North Beckley; 9 December 2014 – 4 February 2015). Again, samples
were sealed and refrigerated (4.3 + 0.2 ºC).
Drill cuttings were collected from the lateral portions of three horizontal shale wells (McGee unit
2H well, Robert Williams pad, API #4701706622; Morton 1H well, Cofer pad, API
#4701706559; and Wentz 1H well, Rock Run pad, API #4701706476) and two vertical sections
of wells (Bierstadt Unit 2H Well, Primm Pad, API# 4701706562, with mixed depths of 3000 –
6000 ft; and Sheep Run Unit 2H Well, Fritz Pad, API # 4701706658, with a depth of ca. 450 -
2600 ft) between 28 January 2015 and 20 April 2015. Samples were refrigerated (4.3 + 0.2 ºC).
To assess the ecotoxicity of shale drill cuttings, a germination assay was performed comparing
the effect of vertical and horizontal components of drill cuttings. The germination assay used a
standard, sensitive variety of lettuce and followed a modified protocol from Greene et al. (1988).
A dilution series of 100 %, 30 %, 10 %, 3 % was applied to the drill cuttings. Treatments
included the well type (3 horizontal and 2 vertical) x 4 dilutions x 3 replicates for 60 dishes. In
addition, pure sand (0 % dilution, n = 3) was included as a control, for a grand total of 63 petri
dishes. Sand was used for the dilution, as sand is stable and is not ecotoxic (crystalline silica;
#1113, Quikrete International, Inc., Atlanta, GA). pH was not adjusted, to better simulate
potential seed contamination (sample range 8.7 – 12.0; sample mean + standard error (SE) pH =
9.7 + 0.59). The recommended pH ranges for Lactuca sativa is between 4 and 10. The drained
drill cuttings mixture (100 g) was placed in each petri dish (100 x 15 mm clear polystyrene
5

sterile). Twenty seeds of Lactuca sativa L. ‘Buttercrunch’ (lettuce), Asteraceae, were placed on
the cuttings. Petri dishes were randomized under fluorescent lamps (mean photosynthetic photon
flux (PPF) + SE = 110.4 + 2.93 μmol m-2 s-1) with a 24 hr photoperiod. The average temperature
(+ SE) was 25.2 + 0.12 ºC). The number of germinated seeds were counted after 120 hours.
To compare the ecotoxicity of leachate from landfills that accept shale drill cuttings from those
that do not accept cuttings, tests were conducted using typical experimental species, a floating
freshwater plant, Lemna minor L. (Duckweed, Lemnaceae), and a freshwater crustacean,
Daphnia magna Straus (Water flea, Daphniidae). Additionally, these species were used to
contrast water released from POTWs receiving leaching with and without drill cuttings. Further,
species responses in treated water were compared with raw landfill leachate to examine whether
leachate ecotoxicity is reduced by current treatment practices.
Lemna minor
Landfill leachate supernatant was diluted with Hoagland’s No. 2 basal salts (plant macro- and
micronutrients; Caisson Labs, North Logan, UT). A dilution series of 50 %, 25 %, 12.5 %, 6.25
%, 3.125 %, 1.5 % and 0% was applied (100 ml solution per 250 ml beaker). Preliminary work
indicated 100 % mortality of Lemna minor (Mangroves and More Nursery, Sanford, FL) at 100
% leachate concentration. Consequently, undiluted leachate was not used. pH was not adjusted
(sample range 7.0 – 8.0; sample mean + SE pH = 7.7 + 0.19). pH requirements for general
growth conditions of Lemna range from 5 to 9. Treatments encompassed the different landfill
type (4 receiving drill cuttings and 2 without drill cuttings in the waste) x 7 dilutions x 4
replicates for 168 beakers. In addition, samples of treated leachate (by PTOWs or onsite
treatment facilities; pH range = 7.4 – 7.6; mean + SE = 7.5 + 0.03) were also included (six
treatment facilities x 4 replicates) for a grand total of 192 beakers.
Twelve fronds of Lemna were added to each beaker. To reduce airborne contamination and
control evaporation, watch glasses were placed on the beakers. Beakers were randomized under
fluorescent lamps (mean photosynthetic photon flux (PPF) + SE = 100.4 + 3.42 μmol m-2 s-1)
with a 24 hr photoperiod. The average temperature (+ SE) was 24.5 + 0.34 ºC. The number of
fronds were censused on days 2, 4 and 7. In addition to the number of living fronds, the relative
6
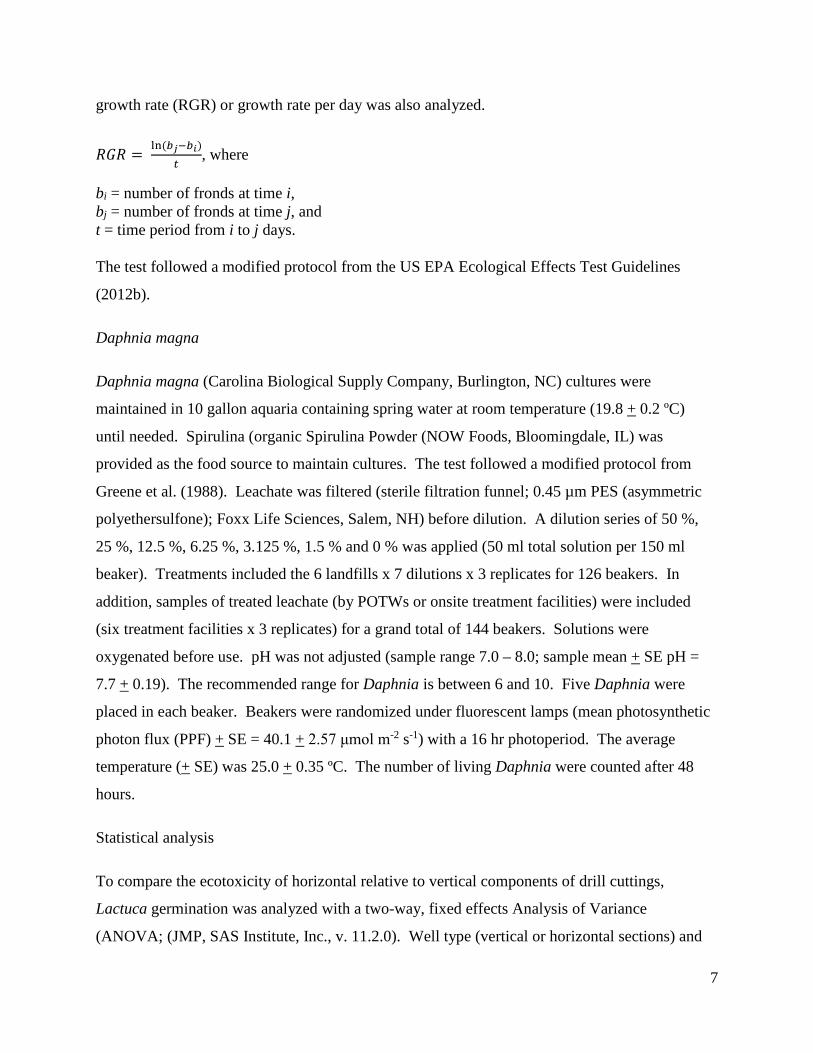
growth rate (RGR) or growth rate per day was also analyzed.
𝑅𝑅𝑅𝑅𝑅𝑅 = ln (𝑏𝑏𝑗𝑗−𝑏𝑏𝑖𝑖)𝑡𝑡
, where
bi = number of fronds at time i, bj = number of fronds at time j, and t = time period from i to j days. The test followed a modified protocol from the US EPA Ecological Effects Test Guidelines
(2012b).
Daphnia magna
Daphnia magna (Carolina Biological Supply Company, Burlington, NC) cultures were
maintained in 10 gallon aquaria containing spring water at room temperature (19.8 + 0.2 ºC)
until needed. Spirulina (organic Spirulina Powder (NOW Foods, Bloomingdale, IL) was
provided as the food source to maintain cultures. The test followed a modified protocol from
Greene et al. (1988). Leachate was filtered (sterile filtration funnel; 0.45 µm PES (asymmetric
polyethersulfone); Foxx Life Sciences, Salem, NH) before dilution. A dilution series of 50 %,
25 %, 12.5 %, 6.25 %, 3.125 %, 1.5 % and 0 % was applied (50 ml total solution per 150 ml
beaker). Treatments included the 6 landfills x 7 dilutions x 3 replicates for 126 beakers. In
addition, samples of treated leachate (by POTWs or onsite treatment facilities) were included
(six treatment facilities x 3 replicates) for a grand total of 144 beakers. Solutions were
oxygenated before use. pH was not adjusted (sample range 7.0 – 8.0; sample mean + SE pH =
7.7 + 0.19). The recommended range for Daphnia is between 6 and 10. Five Daphnia were
placed in each beaker. Beakers were randomized under fluorescent lamps (mean photosynthetic
photon flux (PPF) + SE = 40.1 + 2.57 μmol m-2 s-1) with a 16 hr photoperiod. The average
temperature (+ SE) was 25.0 + 0.35 ºC. The number of living Daphnia were counted after 48
hours.
Statistical analysis
To compare the ecotoxicity of horizontal relative to vertical components of drill cuttings,
Lactuca germination was analyzed with a two-way, fixed effects Analysis of Variance
(ANOVA; (JMP, SAS Institute, Inc., v. 11.2.0). Well type (vertical or horizontal sections) and
7

dilution were the main effects. In a second analysis, to examine differences between wells, well
(nested within well type) was the main effect. Tukey’s range test (Tukey’s HSD) was used to
compare means.
Two-way, fixed effects ANOVAs were conducted to test for ecotoxicological differences in
leachate from landfills that accept shale drill cuttings from those that do not accept cuttings using
Lemna and Daphnia. The presence of drill cuttings and dilution were the main effects. Tukey’s
range test (Tukey’s HSD) was used to compare means. For Lemna, separate analyses were
performed for each of the three census periods (Days 2, 4, and 7).
To compare responses of Lemna and Daphnia to treated water from the POTWs, two-way
ANOVAs were performed with POTW type (with and without drill cuttings) and POTW nested
within POTW type as the main effects. Tukey’s range test (Tukey’s HSD) was used to compare
means. Lastly, to examine the ecotoxicity of treated water released from Publicly Owned
Treatment Works (POTWs) or onsite treatment with raw leachate, a one-way ANOVA was used,
with Dunnett’s test to compare the mean response by dilution with the released treated water.
Results
Analysis of the vertical and horizontal components of drill cuttings that enter West Virginia
landfills
Germination of Lactuca sativa ‘Buttercrunch” was significantly reduced when exposed to
horizontal relative to vertical sections of drill cuttings (p < 0.0001; Fig. 1). On average, seeds
exposed to the vertical sections of drill cuttings yielded 30.4 % germination as opposed to 0.7 %
germination in lateral well cuttings. Across well types, the presence of drill cuttings reduced
germination relative to the controls (sand; p < 0.0013; Fig. 2) and 100 % drill cuttings resulted in
less germination than 3 and 10 % concentrations. No differences in germination were observed
between 3 %, 10 %, and 30 % dilutions. Also, 30 % and 100 % drill cuttings did not differ. The
particular combinations of drill cutting source and dilution also significantly affected seed
germination (p < 0.0259; Fig. 3). Essentially seed germination was zero at 100 % vertical
8
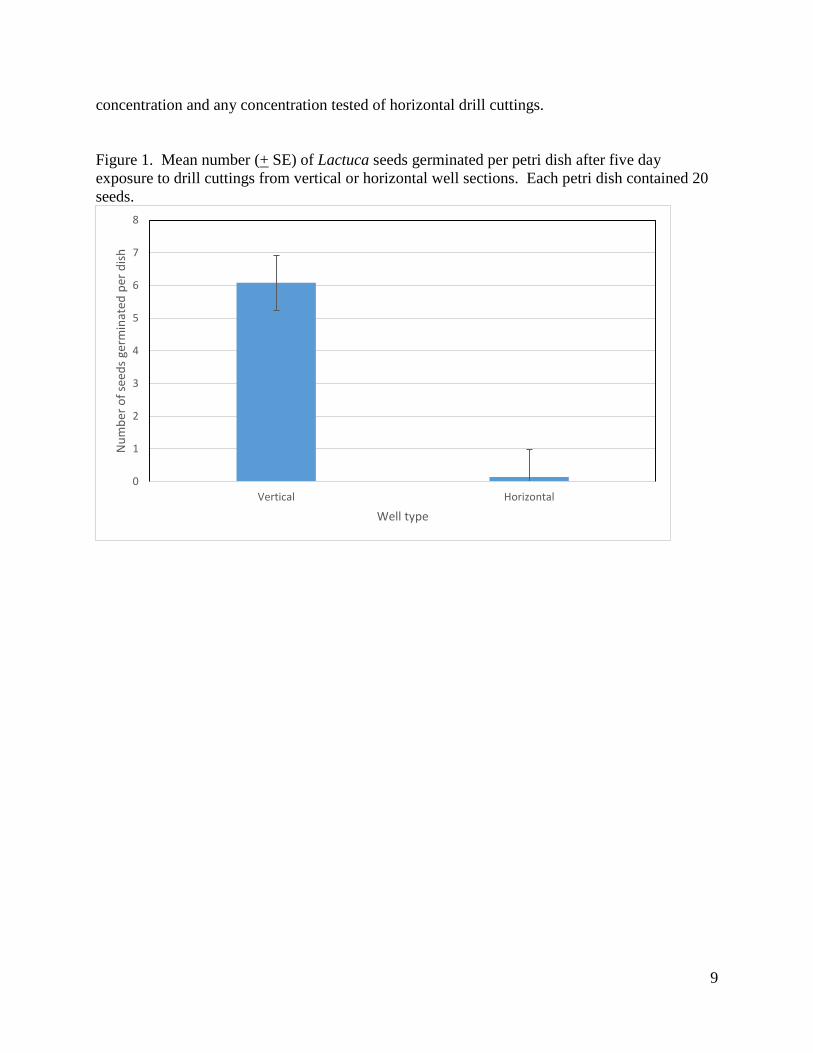
concentration and any concentration tested of horizontal drill cuttings.
Figure 1. Mean number (+ SE) of Lactuca seeds germinated per petri dish after five day exposure to drill cuttings from vertical or horizontal well sections. Each petri dish contained 20 seeds.
0
1
2
3
4
5
6
7
8
Vertical Horizontal
Num
ber o
f see
ds g
erm
inat
ed p
er d
ish
Well type
9

Figure 2. Mean number (+ SE) of Lactuca seeds germinatde per petri dish after five day exposure to serial dilution of drill cuttings. Sand was used to dilute the drill cuttings and served as the control. Each petri dish contained 20 seeds.
Figure 3. Mean number (+ SE) of Lactuca seeds germinated per petri dish after five day exposure to serial dilution of vertical or horizontal drill cutting sections. Sand was used to dilute the drill cuttings and served as the control. Each petri dish contained 20 seeds.
0
2
4
6
8
10
12
14
16
18
0 3 10 30 100
Num
ber o
f see
ds g
erm
inat
ed p
er d
ish
Dilution (%)
0
2
4
6
8
10
12
14
Vertical Horizontal
Num
ber o
f see
ds g
erm
inat
ed p
er d
ish
Well type
3%
10%
30%
100%
10

Drill cuttings from the vertical section of one well (Sheep Run) yielded the greatest germination
relative to all other wells (Figs. 4 and 5) despite high pH (12.0). Drilling of the vertical section
of the Sheep Run well was performed using an air rotary drill. At 100 % concentration,
however, seed germination was essentially zero.
Figure 4. Mean number (+ SE) of Lactuca seeds germinated per petri dish after five day exposure to drill cuttings from vertical and horizontal well sections. Each petri dish contained 20 seeds.
0
2
4
6
8
10
12
14
Bierstadt Sheep run McGee Morton Wentz
Num
ber o
f see
ds g
erm
inat
ed p
er d
ish
Well
11
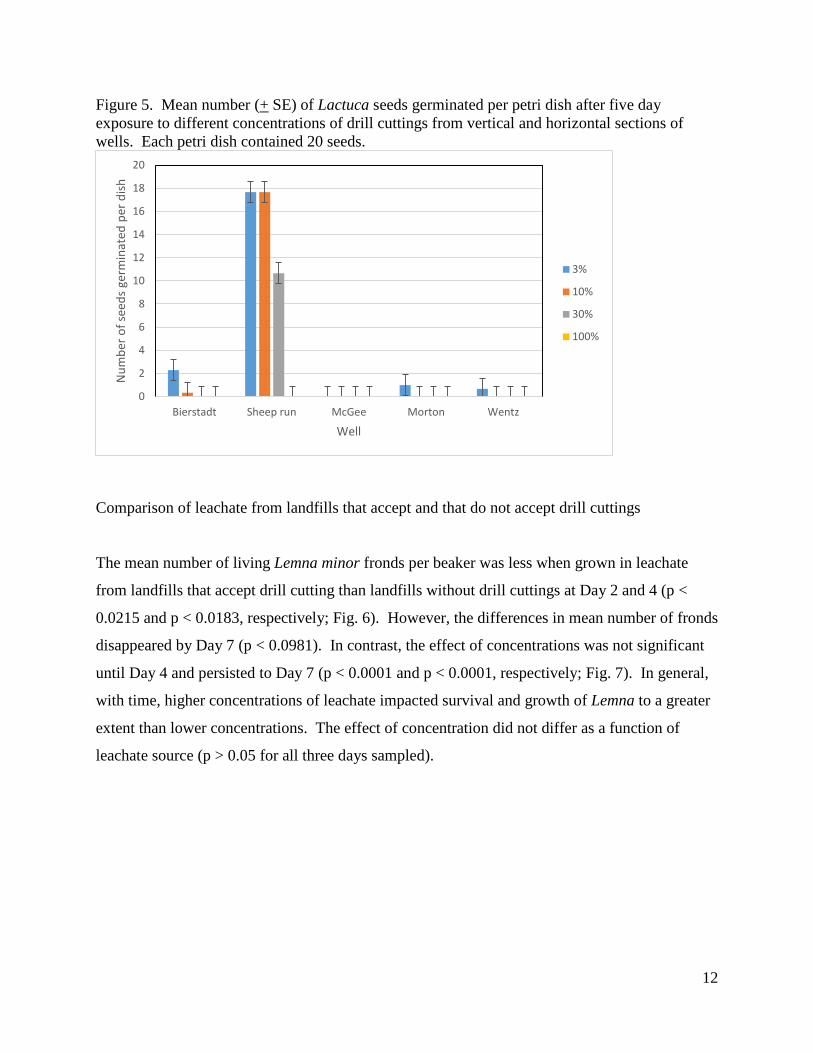
Figure 5. Mean number (+ SE) of Lactuca seeds germinated per petri dish after five day exposure to different concentrations of drill cuttings from vertical and horizontal sections of wells. Each petri dish contained 20 seeds.
Comparison of leachate from landfills that accept and that do not accept drill cuttings
The mean number of living Lemna minor fronds per beaker was less when grown in leachate
from landfills that accept drill cutting than landfills without drill cuttings at Day 2 and 4 (p <
0.0215 and p < 0.0183, respectively; Fig. 6). However, the differences in mean number of fronds
disappeared by Day 7 (p < 0.0981). In contrast, the effect of concentrations was not significant
until Day 4 and persisted to Day 7 (p < 0.0001 and p < 0.0001, respectively; Fig. 7). In general,
with time, higher concentrations of leachate impacted survival and growth of Lemna to a greater
extent than lower concentrations. The effect of concentration did not differ as a function of
leachate source (p > 0.05 for all three days sampled).
0
2
4
6
8
10
12
14
16
18
20
Bierstadt Sheep run McGee Morton Wentz
Num
ber o
f see
ds g
erm
inat
ed p
er d
ish
Well
3%
10%
30%
100%
12

Figure 6. Mean number of Lemna fronds (+ SE) present in leachate from landfills with and without drill cuttings. Each beaker originally contained 12 fronds.
Figure 7. Mean number of Lemna fronds (+ SE) present in a serial dilution of landfill leachate. Each beaker originally contained 12 fronds.
Relative growth rates reflected frond numbers. Initially, mortality resulted in negative growth
0
5
10
15
20
25
No Yes
Num
ber o
f fro
nds/
beak
er
Drill cuttings present
Day 2
Day 4
Day 7
0
5
10
15
20
25
30
35
1.5 3.125 6.25 12.5 25 50
Num
ber o
f fro
nds/
beak
er
Leachate (%)
Day 2
Day 4
Day 7
13
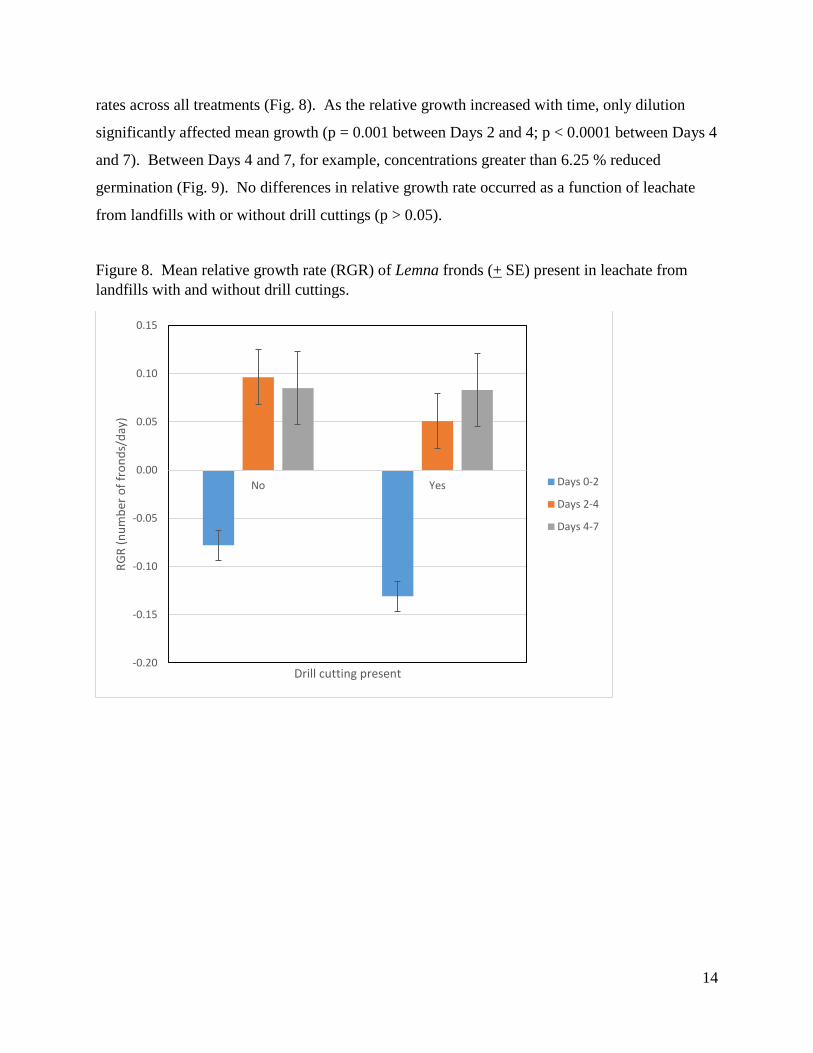
rates across all treatments (Fig. 8). As the relative growth increased with time, only dilution
significantly affected mean growth (p = 0.001 between Days 2 and 4; p < 0.0001 between Days 4
and 7). Between Days 4 and 7, for example, concentrations greater than 6.25 % reduced
germination (Fig. 9). No differences in relative growth rate occurred as a function of leachate
from landfills with or without drill cuttings (p > 0.05).
Figure 8. Mean relative growth rate (RGR) of Lemna fronds (+ SE) present in leachate from landfills with and without drill cuttings.
-0.20
-0.15
-0.10
-0.05
0.00
0.05
0.10
0.15
No Yes
RGR
(num
ber o
f fro
nds/
day)
Drill cutting present
Days 0-2
Days 2-4
Days 4-7
14

Figure 9. Mean relative growth rate (RGR) of Lemna fronds (+ SE) present in a serial dilution of landfill leachate between Days 4 and 7.
Daphnia survival and reproduction were not affected by the source of landfill leachate (i.e., from
landfills that do or do not received drill cuttings; p = 0.6676; Fig. 10). Generally, however,
leachate concentrations greater than 12.5 % significantly reduced the number of Daphnia (Fig.
11). There was no significant interaction between landfill leachate source and dilution (p =
0.2177).
-0.15
-0.10
-0.05
0.00
0.05
0.10
0.15
0.20
0.25
1.5 3.125 6.25 12.5 25 50
RGR
(num
ber o
f fro
nds/
day)
Leachate (%)
15

Figure 10. Mean number of Daphnia (+ SE) present in leachate from landfills with and without drill cuttings. Each beaker originally contained five individuals.
Figure 11. Mean number of Daphnia (+ SE) present in a serial dilution of landfill leachate. Each beaker originally contained five individuals.
0.0
0.5
1.0
1.5
2.0
2.5
3.0
3.5
4.0
No Yes
Num
ber D
aphn
iape
r bea
ker
Drill cuttings
0
1
2
3
4
5
6
7
1.5 3.125 6.25 12.5 25 50
Num
ber D
aphn
iape
r bea
ker
Leachate (%)
16

Treated water released from Publicly Owned Treatment Works (POTWs) or onsite treatment
facilities
The effect of treated water on Lemna growth and reproduction did not differ as a function of
POTW type (those that received leachate from landfills with or without drill cuttings; p > 0.05
for each census day; Fig. 12). However, treated water from POTWs receiving leachate from
landfills with drill cuttings significantly reduced survival and growth of Daphnia (p = 0.005;
Figs. 13). Lemna and Daphnia growing in water from Wetzel and Wheeling were impacted the
most (Figs. 14 and 15). Both of these POTWs accept leachate from landfills with drill cuttings.
Lemna growing in water from Parkersburg POTW and Daphnia growing in water from
Charleston POTW exhibited the greatest growth. Charleston POTW does not receive leachate
contaminated with waste that includes drill cuttings. Parkersburg does, however, receive drill
cuttings. Intermediate performance by Daphnia occurred in water from Bridgeport, Parkersburg,
and North Beckley, which includes two POTWs receiving leachate from landfills with drill
cuttings and one POTW without drill cuttings.
Figure 12. Mean number of Lemna fronds (+ SE) present in treated water released from POTWs or onsite treatment facilities, which received landfill leachate with or without drill cuttings. Each beaker originally contained 12 fronds.
0
5
10
15
20
25
30
35
40
No Yes
Num
ber o
f fro
nds/
beak
er
Drill cuttings present
Day 2
Day 4
Day 7
17
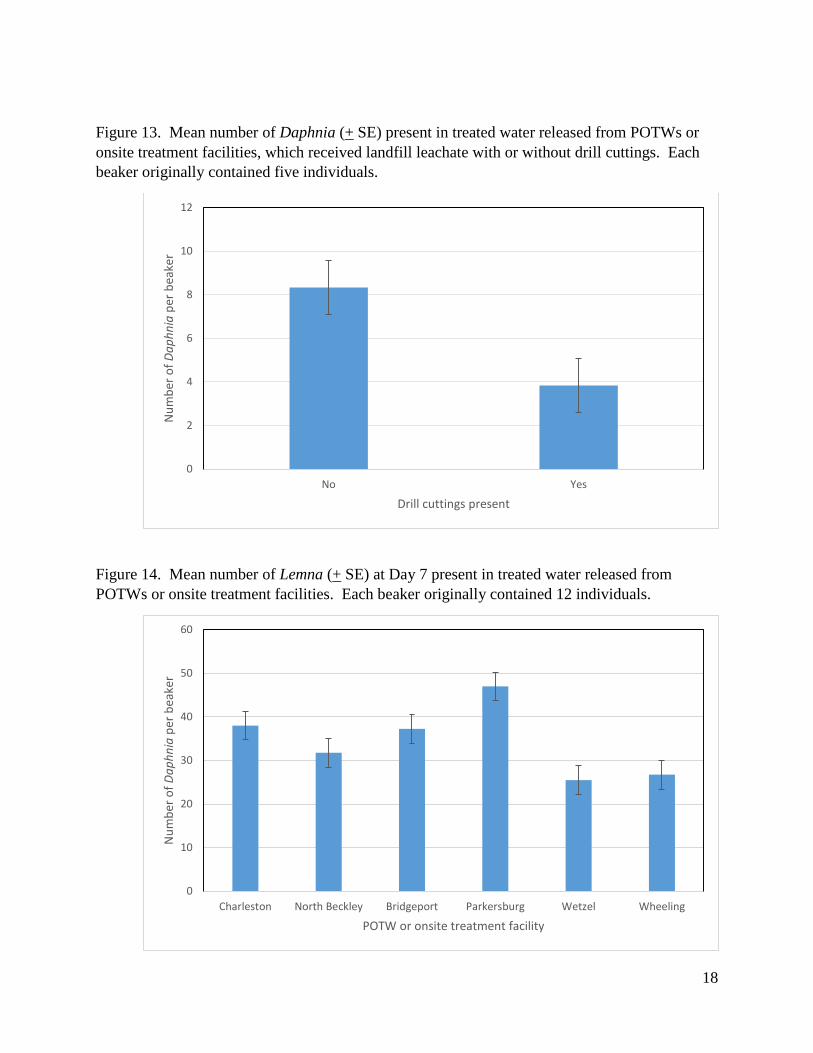
Figure 13. Mean number of Daphnia (+ SE) present in treated water released from POTWs or onsite treatment facilities, which received landfill leachate with or without drill cuttings. Each beaker originally contained five individuals.
Figure 14. Mean number of Lemna (+ SE) at Day 7 present in treated water released from POTWs or onsite treatment facilities. Each beaker originally contained 12 individuals.
0
2
4
6
8
10
12
No Yes
Num
ber o
f Dap
hnia
per b
eake
r
Drill cuttings present
0
10
20
30
40
50
60
Charleston North Beckley Bridgeport Parkersburg Wetzel Wheeling
Num
ber o
f Dap
hnia
per b
eake
r
POTW or onsite treatment facility
18

Figure 15. Mean number of Daphnia (+ SE) present in treated water released from POTWs or onsite treatment facilities. Each beaker originally contained five individuals.
Comparison of ecotoxicity of treated water released from POTWs or onsite treatment facilities
with raw leachate
The numbers of Lemna and Daphnia indicate that water discharged from POTWs or onsite
treatment facilities, in terms of ecotoxicity, yielded significantly greater performance than
leachate concentrations greater than 6.25 %, and did not differ from controls (0 % leachate)
(Figs. 16 and 17).
0
2
4
6
8
10
12
14
Charleston North Beckley Bridgeport Parkersburg Wetzel Wheeling
Num
ber o
f Dap
hnia
per b
eake
r
POTW or onsite treatment facility
19

Figure 16. Mean number of Lemna fronds (+ SE) present in a serial dilution of landfill leachate. Each beaker originally contained 12 fronds.
Figure 17. Mean number of Daphnia (+ SE) present in a serial dilution of landfill leachate. Each beaker originally contained five individuals.
5
10
15
20
25
30
35
40
POTW 0 1.5 3.125 6.25 12.5 25 50
Num
ber o
f fro
nds/
beak
er
Leachate (%)
Day 2
Day 4
Day 7
0
1
2
3
4
5
6
7
8
POTW 0 1.5 3.125 6.25 12.5 25 50
Num
ber o
f Dap
hnia
/bea
ker
Leachate (%)
20

Discussion
To evaluate the potential ecotoxicological impacts of landfill leachate from waste containing
horizontal drill cuttings, complementing the physic-chemical analyses, the biological impacts of
drill cuttings, landfill leachate and treated leachate were assessed Lactuca sativa ‘Buttercrunch’
seeds placed directly onto moist, undiluted gas well drill cuttings resulted in near zero
germination. Limited germination occurred at 3 % dilution, with the exception of the vertical
well section at Sheep Run, which yielded germination at 3, 10 and 30 % dilution. The Sheep
Run well differed from the others in that it was using an air rotary rig through the shallow rock
strata. High pressure compressed air removes the cuttings from the bore hole, rather than drilling
mud. Chemical analysis indicated that the Sheep Run cuttings were lower in several tested
constituents, including arsenic, benzene, and strontium. The presence of these constituents in the
cuttings in the other wells may be due to the geologic composition, petroleum compounds in
shales, or particular drilling mud. Arsenic is a toxic metal potentially impacting cellular energy
pathways (Ratnaike 2003). Strontium has been shown to be toxic to freshwater aquatic
organisms (Mcpherson 2014) and benzene may be carcinogenic with prolonged exposure
(Agency for Toxic Substances and Disease Registry, CDC). The impact of drill cuttings on
biological systems is consistent with previous studies, again linked presumably to metals and oil-
based drilling mud (e.g., Zamora-Ledezma and García 2013 and Balgobin et al. 2012). The high
pH of the drill cuttings affects bioavailability of metals, however. Often, metals (e.g., zinc and
cadmium) become less soluble at high pH, reducing biological impacts. Conversely, increasing
pH has also been shown to increase toxicity of certain metals, such as zinc and copper (Olaniran
et al. 2013). Although the influence of pH on metal toxicity did not appear to play a role in this
study, pH is one mechanism by which physicochemical and ecotoxicological results may differ.
Untreated landfill leachate was toxic to the growth and survival of an aquatic plant species,
Lemna minor (primary producer), and an aquatic invertebrate species, Daphnia magna (primary
consumer), consistent with other studies (e.g., Thomas 2010 and Kjeldsen et al. 2002). Also
similar to previous studies, impacts on survival and growth are likely the result of a combination
of metals, chlorides, and recalcitrant organic compounds present in leachate. The composition of
leachate does not appear to be consistent with the profile of drill cuttings. Some constituents are
similar, e.g., arsenic, benzene, chlorides and in some cases radionuclides, but other profiles are
21

different, such as aluminum, nitrogen, and strontium. The differences in composition may be the
result of a number of differences in landfill waste composition and waste interacting with the
drill cuttings and environmental conditions. For example, benzene degradation rates are low
under low oxygen conditions (van Agteren et al. 2013), such as in landfills. Additionally,
municipal solid waste appears to buffer the high alkalinity of drill cuttings as landfill leachate
was near neutral. Solidification of drill cuttings with fly ash such as performed at Meadowfill
presumably raises pH of the waste to an even greater extent. Nonetheless, the leachate from
Meadowfill did not appear to differ from the other landfills. Consequently, the apparent
ecotoxicity of drill cuttings did not generally impact landfill leachate. Daphnia performance did
not differ between landfill leachate with or without drill cuttings and the initial differences in
Lemna performance disappeared by Day 7 of the experiment.
Differences in performance of Daphnia between POTWs do not appear to be based on chemical
or radiological contaminants in the water. While water released from Wetzel’s onsite waste
water treatment plant (January 2015) exceeded Water Quality Standards (WQS) for several
constituents (iron, manganese, chloride, and nitrates), Wheeling’s POTW did not, yet both
waters yielded the same Daphnia survival and growth. Further, water from POTWs did not
differ ecotoxicologically from controls (spring or nutrient water). The total volume of water
diluting the leachate or treatment processes (e.g., disinfection chemicals) may have been a
contributing factor. Daphnia is, for example, sensitive to hypochlorite (Ton et al. 2012). Other
studies have also assessed landfill leachate toxicity after treatment, documenting mixed results.
In some cases biotoxicity was reduced (e.g., Mackenzie et al. 2003), but not in others (e.g.,
Kalcíková et al. 2011, Thomas et al. 2009). Differences may be due to the extent of heavy metal
immobilization in the landfill (Slack et al. 2005).
A number of inherent limitations are associated with the ecotoxicity tests conducted. Perhaps
most importantly, the ecotoxicological studies performed consisted of subchronic exposure only.
Studies of long-term exposure to unconventional natural gas development have not been
conducted (Werner et al 2015 citing McDermott-Levy et al. 2013). Additionally, inferences can
be drawn only for the limited number of wells, landfills, and POTWs sampled. While samples
should be representative, sampling and analysis is limited by cost. Also, tests were limited to
three experimental species; while the species represent different trophic levels, conclusions
22

cannot be made concerning more complex organisms. Lastly, ecotoxicological studies do not
determine which specific treatment constituent or combination of constituents affected the
biological systems.
Conclusions
This study examined the ecotoxicity of gas well drill cuttings, leachate collected from landfills
accepting drill cuttings, and water released from POTWs or onsite treatment facilities that treated
leachate from landfills with drill cuttings. The ecotoxicological studies complement the physico-
chemical analyses in that ecotoxicity indicates potential bioavailability of contaminants and
subsequent biological impacts. Impacts were assessed using the leachate in its entirety,
capturing any synergistic effects between the various constituents. In contrast, Water Quality
Standards (WQSs) are based on individual compounds only. Therefore, these studies simulate
better the potential impacts of a real world spill in the environment. General conclusions
include:
• Gas well drill cuttings (from both vertical and lateral sections) are toxic to plants
(lettuce).
• Landfill leachate is toxic to plants (duckweed) and invertebrates (water flea).
• Treated landfill leachate (regardless of source) under the test conditions is generally safe
to plants and invertebrates.
• Landfilling appears currently to be an acceptable option to isolate shale drill cuttings and
to protect the environment.
Recommendations
• The biological impact of undiluted drill cuttings and leachate requires the use of best
management practices in the collection, transport and storage of these materials. Release
of cuttings or leachate outside of the landfills will impact natural ecosystems.
• Drill cuttings appear to stabilize and/or interact with waste directly or in the leachate.
The exact interactions and extent of the interactions is not well defined. It is not known,
therefore, whether the buffering capacity of these systems can be overwhelmed as
landfills continue to accept large quantities of drill cuttings, resulting in increased
23

leachate toxicity. Monitoring of leachate from landfills accepting drill cuttings should be
continued.
• Testing should be conducted to identify specific constituents of concern, in terms of
ecotoxicity, so that if needed, specific treatments at POTWs for these compounds can be
implemented in the future.
• Opportunities in which constituents of drill cuttings present in landfill leachate and
subsequent treatment processes can concentrate should be assessed and monitored. For
example, biosolids from POTWs that receive leachate contaminated with drill cuttings
may collect particular contaminants. The Pennsylvania Department of Environmental
Protection TENORM Study Report (2015) suggests that the potential exists for
radiological impacts from the long-term disposal of POTW filter cakes. Concentration of
radioactive materials and other contaminants over time may influence leachate in the
future as filter cakes or biosolids are added back to landfills, and consequently should be
monitored. Additionally, the potential for leachate constituents to concentrate during
treatment indicates that the use of biosolids for land spreading should be monitored.
References
Balgobin, A., A. Azeena, S. Kalim, and N. Ramroop Singh. 2012. Assessment of toxicity of two types of drill cuttings from a drilling rig on the Trinidad East coast using Metamysidopsis insularis. Toxicological and Environmental Chemistry.
Bernard, C., P. Guido, J. Colin, and A. Le Du-Delepierre. 1996. Estimation of the hazard of landfills through toxicity testing of leachates-I. Determination of leachate toxicity with a battery of acute tests. Chemosphere 33: 2303-2320.
Bernard, C., P. Guido, J. Colin, and A. Le Du-Delepierre. 1997. Estimation of the hazard of landfills through toxicity testing of leachates: 2. Comparison of physico-chemical characteristics of landfill leachates with their toxicity determined with a battery of tests. Chemosphere 35: 2783-2796.
Bhalla, B., M.S. Saini, and M.K. Jha. 2013. Effect of age and seasonal variation on leachate characteristics of municipal solid waste landfill. International Journal of Research in Engineering and Technology 2: 223-232.
Butt, T.E., H.M. Gouda, M.I. Baloch, P. Paul, A.A. Javadi, and A. Alam. 2014. Literature review of baseline study for risk analysis – The landfill leachate case. Environment International 63: 149-162.
Devare, M. and M. Bahadir. 1994. Biological monitoring of landfill leachate using plants and
24

luminescent bacteria. Chemosphere 28: 261-271.
Ghosh P., A. Gupta, and I.S. Thakur. 2015. Combined chemical and toxicological evaluation of leachate from municipal solid waste landfill sites of Delhi, India. Environmental Science and Pollution Research International [Epub ahead of print].
Greene, J.C., C.L. Bartels, W.J. Warren-Hicks, B.R. Parkhurst, G.L. Linder, S.A Peterson, and W.E. Miller. 1988. Protocols for short term toxicity screening of hazardous waste sites. US EPA, Corvallis OR, EPA 600/3-88/029, PB88 235 510/AS, ER:-COR-496.
Isidori, M., M. Lavorgna, A. Nardelli, and A. Parrella. 2003. Toxicity identification evaluation of leachates from municipal solid waste landfills: a multispecies approach. Chemosphere 52: 85-94.
Kalcíková, G, M. Vávrová, J. Zagorc-Koncan, and A.Z. Gotvajn. 2011. Evaluation of the hazardous impact of landfill leachates by toxicity and biodegradability tests. Environmental Technology 32: 1345-1353.
Kashiwada, S., K. Osaki, A. Yashuhara, and Y. Ono. 2005. Toxicity studies of landfill leachates using Japanese Medaka (Oryzias latipes). Australian Journal of Ecotoxicology 11: 59-71.
Kjeldsen, P., M.A. Barlaz, A.P. Rooker, A. Baun, A. Ledin, and T.H. Christensen. 2002. Present and long-term composition of MSW landfill leachate: A review. Critical Reviews in Environmental Science and Technology 32: 297-336.
Klauck, C.R., M.A. Siqueira Rodrigues, and L. Basso da Silva. 2013. Toxicological evaluation of landfill leachate using plant (Allium cepa) and fish (Leporinus obtusidens) bioassays. Waste Management and Research 31: 1148-1153.
Lee, A.H., H. Nikraz, Y.T. Hung. 2010. Influence of waste age on landfill leachate quality. International Journal of Environmental Science and Development 1: 347-350.
Linderoth, M. 2006. Biochemical characterization of landfill leachate toxicity in fish. PhD dissertation, Stockholm University.
Mackenzie, S.M., S. Waite, D.J. Metcalfe, and C.B. Joyce. 2003. Landfill leachate ecotoxicity experiments using Lemna minor. Water, Air, and Soil Pollution: Focus 3: 171-179.
McDermott-Levy, R., N. Kaktins, and B. Sattler. 2013. Fracking, the environment, and health. American Journal of Nursing 113: 45-51.
Mcpherson C., G.S. Lawrence, J.R. Elphick, and P.M. Chapman. 2014. Development of a strontium chronic effects benchmark for aquatic life in freshwater. Environmental Toxicology and Chemistry 33: 2472-2478.
Newman, M.C. 2009. Fundamentals of Ecotoxicology, Third Edition. CRC Press.
Olaniran, A.O., A. Balgobind, and B. Pillay. 2013. Bioavailability of heavy metals in soil:
25

Impact on microbial biodegradation of organic compounds and possible improvement strategies. International Journal of Molecular Sciences 14: 10197-10228.
Osaki, K. S. Kashiwada, N. Tatarazako, and Y. Ono. 2006. Toxicity testing of leachate from waste landfills using Medaka (Oryzias latipes) for monitoring environmental safety. Environmental Monitoring and Assessment 117: 73-84.
Owabor, C.N., O.C. Onwuemene, and I. Enaburekhan. 2011. Bioremediation of polycyclic aromatic hydrocarbon contaminated aqueous-soil matrix: Effect of co-contamination. Journal of Applied Sciences and Environmental Management 15: 583-588.
Pablos M.V., F. Martini, C. Fernández, M.M. Babín, I. Herraez, J. Miranda, J. Martínez, G. Carbonell, L. San-Segundo, P. García-Hortigüela, and J.V. Tarazona. 2011. Correlation between physicochemical and ecotoxicological approaches to estimate landfill leachates toxicity. Waste Management 31: 1841-1847.
Pennsylvania Department of Environmental Protection. 2015. Technologically enhanced naturally occurring radioactive materials (TENORM) study report. Prepared by Perma-Fix Environmental Services, Inc.
Plotkin, S. and N.M. Ram. 1984. Multiple bioassays to assess the toxicity of a sanitary landfill leachate. Archives of Environmental Contamination and Toxicology 13: 197-206.
Ratnaike, R.N. 2003. Acute and chronic arsenic toxicity. Postgraduate Medical Journal 79: 391-396.
Slack, R.J., J.R. Gronow, and N. Voulvoulis. 2005. Household hazardous waste in municipal landfills: contaminants in leachate. Science of the Total Environment 337: 119-137.
Souther, S., M.W. Tingley, V.D. Popescu, D.T.S. Hayman, M.E. Ryan, T.A. Graves, B. Hartl, and K. Terrell. 2014. Biotic impacts of energy development from shale: research priorities and knowledge gaps. Frontiers in Ecology and the Environment 12: 330-338.
Thomas, D.J.L. 2010. Understanding the Causes of Toxicity in Treated Landfill Leachate through Whole Effluent Testing. PhD Dissertation, Cranfield University, Cranfield, UK.
Thomas, D.J.L., S.F. Tyrrel, R. Smith, and S. Farrow. 2009. Bioassays for the evaluation of landfill leachate toxicity. Journal of Toxicology and Environmental Health. Part B. 12: 83-105.
Ton, S.S., S.H. Chang, L.Y. Hsu, M.H. Wang, and K.S. Wang. 2012. Evaluation of acute toxicity and teratogenic effects of disinfectants by Daphnia magna embryo assay. Environmental Pollution 168: 54-61.
Tsarpali, V. and S. Dailianis. 2012. Landfill leachate composition and toxic potency in semi-arid areas: an integrated approach with the use of physicochemical and toxicological data. Third International Symposium on Green Chemistry for Environment, Health and Development, 3-5 October 2012, Skiathos Island, Greece.
26
Tsarpali, V., M. Kamilari, S. Dailianis. 2012. Seasonal alterations of landfill leachate composition and toxic potency in semi-arid regions. Journal of Hazardous Materials 233-234: 163-171.
US EPA. 2012a. Ecological effects test guidelines: Early Seedling Growth Toxicity Test, OCSPP 850.4230, Environmental Protection Agency, Office of Chemical Safety and Pollution Prevention, EPA 712-C-010.
US EPA. 2012b. Ecological Effects Test Guidelines, OCSPP 850.4400: Aquatic plant toxicity test using Lemna spp. EPA 712-C-008.
van Agteren, M.H., S. Keuning, and J. Oosterhaven. 2013. Handbook on Biodegradation and Biological Treatment of Hazardous Organic Compounds. Springer Science and Business Media.
Ward, M.L., G. Bitton, T. Townsend, and M. Booth. 2002. Determining toxicity of leachates from Florida municipal solid waste landfills using a battery-of-tests approach. Environmental Toxicology 17: 258–266.
Werner, A.K., S. Vink, K. Watt, and P. Jagals. 2015. Environmental health impacts of unconventional natural gas development: A review of the current strength of evidence. Science of the Total Environment 505: 1127-1141.
Wiszniowski, J., D. Robert, J. Surmaez-Gorska, K. Miksch, and J.V. Weber. 2006. Landfill leachate treatment methods: A review. Environmental Chemistry Letters 4: 51-61.
Zamora-Ledezma, E. and J.V. García. 2013. Mineral oil-based drilling cuttings phytotoxicity assessment using species of temperate and tropical climate. Global Journal of Environmental Research 7: 1-7.
27

Appendix G
Statistical Analysis of Landfill Leachate Data (Compiled by Marshall University, College of Information Technology and Engineering)

Statistical Analysis of Landfill Leachate Compiled By: Marshall University College of Information Technology and Engineering
Joseph Fuller, M.S.
June 30, 2015
Abstract This statistical analysis was conducted in response to evaluating hazardous characteristics of leachate collected from solid waste facilities that receive drill cutting materials. A major question to be answered by this study was to determine if any trends were detectable in landfill leachate that might suggest that exceedances of particular compounds of interest might occur in the future. This study is considered a retrospective study; data received from the WVDEP for analysis was not completely suitable for subjecting it to a time series analysis. As a result, there were several unavoidable limitations that inhibited complete analysis. Since no data was available before the landfills began accepting drill cuttings, pre and post comparisons of constituent amounts were not possible. No measurement data was available after the leachate left the landfills. Data was analyzed using statistical packages R and SAS. Data was censored, reported as an interval rather than a point, due to limitations of lab testing. Basic statistics, including averages, standard deviations, etc., were generated by non-parametric methods since data was censored. ARIMA and Regression analysis were performed to detect trends, and control charts were developed to show the amount of the constituents over time. Trend lines and regression lines were generated for each constituent. Conclusions were reached after applying the most appropriate statistical methods to the data set with the limitations described above. There is no compelling evidence that the amount of any constituent is increasing over time at an alarming rate. Chloride and total dissolved solids have been observed to be trending up at a couple of landfills, but this trend is not seen at other landfills. Other possible compounds have been observed to be potentially trending up, however, the rates are nominal, and are not considered to be of any significance at this time. Many compounds were observed as having very flat or negative trends. It was also concluded that, for constituents with a large amount of missing data, it was deemed irresponsible to make any statement about future trends, as sample sizes were too small for evaluation. A recommendation has been made that a systematic, continued trend and analysis program be implemented as future data is received and reviewed.
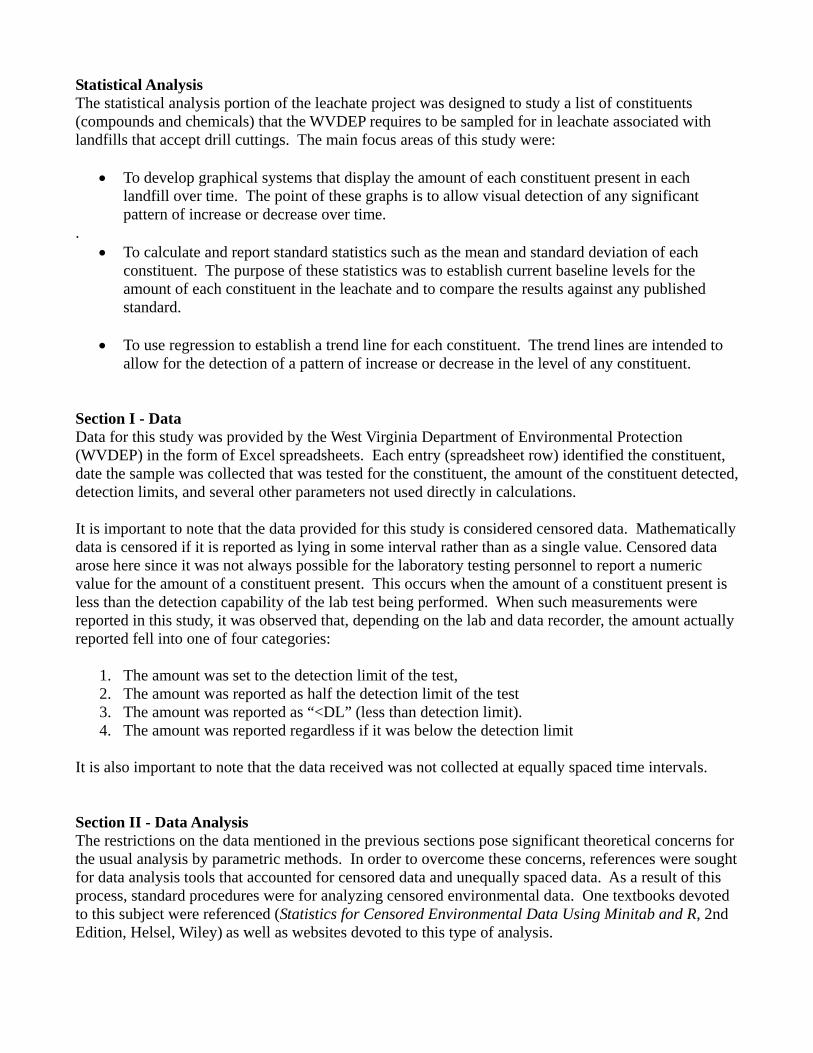
Statistical Analysis The statistical analysis portion of the leachate project was designed to study a list of constituents (compounds and chemicals) that the WVDEP requires to be sampled for in leachate associated with landfills that accept drill cuttings. The main focus areas of this study were:
To develop graphical systems that display the amount of each constituent present in each landfill over time. The point of these graphs is to allow visual detection of any significant pattern of increase or decrease over time.
. To calculate and report standard statistics such as the mean and standard deviation of each
constituent. The purpose of these statistics was to establish current baseline levels for the amount of each constituent in the leachate and to compare the results against any published standard.
To use regression to establish a trend line for each constituent. The trend lines are intended to allow for the detection of a pattern of increase or decrease in the level of any constituent.
Section I - Data Data for this study was provided by the West Virginia Department of Environmental Protection (WVDEP) in the form of Excel spreadsheets. Each entry (spreadsheet row) identified the constituent, date the sample was collected that was tested for the constituent, the amount of the constituent detected, detection limits, and several other parameters not used directly in calculations. It is important to note that the data provided for this study is considered censored data. Mathematically data is censored if it is reported as lying in some interval rather than as a single value. Censored data arose here since it was not always possible for the laboratory testing personnel to report a numeric value for the amount of a constituent present. This occurs when the amount of a constituent present is less than the detection capability of the lab test being performed. When such measurements were reported in this study, it was observed that, depending on the lab and data recorder, the amount actually reported fell into one of four categories:
1. The amount was set to the detection limit of the test, 2. The amount was reported as half the detection limit of the test 3. The amount was reported as “<DL” (less than detection limit). 4. The amount was reported regardless if it was below the detection limit
It is also important to note that the data received was not collected at equally spaced time intervals. Section II - Data Analysis The restrictions on the data mentioned in the previous sections pose significant theoretical concerns for the usual analysis by parametric methods. In order to overcome these concerns, references were sought for data analysis tools that accounted for censored data and unequally spaced data. As a result of this process, standard procedures were for analyzing censored environmental data. One textbooks devoted to this subject were referenced (Statistics for Censored Environmental Data Using Minitab and R, 2nd Edition, Helsel, Wiley) as well as websites devoted to this type of analysis.

Primarily, censored data must be analyzed by non-parametric methods in order to address the theoretical concerns mentioned previously. This represents a departure from the reporting methods seen and learned about from the WVDEP. In many cases, censored observations were replaced with one half the detection limit in order to permit standard analysis. That type of analysis is flawed at best. The analysis type presented here represents theoretically correct and accepted practice for the type of data collected from the landfills. The bulk of the data analysis was done using the statistical package R. R is part of the GNU project and is becoming widely accepted as the standard for statistics analysis. A smaller part of the analysis was done with the proprietary software package called SAS (Statistical Analysis System). SAS has been a standard for statistical analysis for over 50 years. Section III - Preparation for Data Analysis In order to analyze the raw data and average amounts of each constituent, efforts were made to:
Search for established standards of leachate constituents in landfills Look for “before: and “after” data, that is measurements of constituents before and after
landfills started taking drill cuttings The first search was to see if any constituent violated any regulatory amount; the second would allow for detecting an increase (or even decrease) in a constituent since drill cuttings had been accepted. The search included WVDEP documents, US EPA sites, and any other site that might contain such information. Findings during data preparation showed that:
There was no “before” data available for the leachate constituents – that is, no measurements were available for leachate constituent levels before the acceptance of drill cuttings
There are WV limits (47CSR2 – Water Quality Standard) for 33 of the constituents evaluated. However, it is to be expected that these limits are much stricter than would be required for leachate and not directly applicable to the question at hand. For comparison purposes only, a frequency analysis of parameters of interest were compared to a threshold value (47CSR2). This analysis is provided as an attachment.
All landfill leachate is treated on-site or sent to a Publicly Owned Treatment Works (POTW) before being discharged to a surface water body.
Section IV - Data Analysis, Results and Recommendations After collecting and preparing the data and after establishing theoretically sound methods for analysis, the tools provided by R and by SAS were used to analyze the data. It was determined that the study would only address the constituent levels during their time in the landfill since there was no data for the time prior to their introduction, nor any data for the time after they left the landfill. Graphical Analysis – Control charts were developed for each constituent/landfill combination and a trend line from ARIMA was developed. These charts show time on the horizontal axis and measured amount on the vertical axis. Each constituent/landfill combination was examined visually and it was determined:

No constituent, with the possible exception of those shown in Table I, showed evidence of accelerated increase over time.
Most constituents showed steady levels or normally up-down fluctuations over time. With the possible exception of those shown in Table I, there was no indication of the need for
intervention in any of the landfills for any of the constituents evaluated. Trend Analysis – Using the non-parametric methods prescribed for censored data, averages, standards, and correlations were calculated for each parameter/landfill combination. As previously stated, some of the results for some combinations suffer from incomplete or perhaps erroneous data. The averages and standard deviations can serve to establish a baseline amount for each constituent at each landfill. Since there is no “before” data, results can only be presented as a snapshot of the landfill over the time represented by the collected data. The regression lines are more informative since they represent a method of determining if there are upward or downward trends in the data over time. After calculating the regression lines, they were inspected to identify those with positive, statistically significant slopes. A positive slope would indicate an increase in a constituent over time. However, in a normally fluctuating process over time, it is expected that regression line slopes will fluctuate between positive and negative over time as well. A single positive slope is not an indication of constant increase, even if it is statistically significant. However, in the interest of completeness, all of the data was evaluated to find constituents that had complete data and exhibited a positive slope that was statistically significant at the end of the study period.
Table I lists all constituents with statistically significant positive slopes at the end of the study period.
The results are rounded to two decimal places, thus a slope of 0 indicates the actual slope was less than 0.005. The largest slopes observed were associated with chloride and total dissolved solids. Interpretations of the results should be subject to the following cautions:
1. Additional data points could change the results since a normally fluctuating process will also
exhibit a fluctuating slope over time 2. The units of the slope are milligrams per liter per week for non radiological data and picocuries
per liter per week for radiological data. For example, Tables I shows chloride was increasing at the rate of 7.49 milligrams/liter/week at Wetzel County at the end of the study.
3. In most statistical analyses, a p-value <0.05 is considered significant. Any constituent with p-value greater than 0.05 or with a negative slope or with incomplete or suspect data will not appear in Table I. Suspect data is defined as:
i. Consisting of a small number of points (3,4,5, or 6) ii. Not exhibiting an “up-down” pattern over time and/or having 1-5 unusual measurements
that skew the calculation of the slope Additionally it should be noted “statistically significant” does not mean “important”. Many of the slopes in the table are less than 0.005 mg/liter/week.

Table I – Statistically Significant Positive Slopes Landfill Constituent Slope P‐Value
Meadowfill Landfill Ammonia as N 4.22 0.00
Meadowfill Landfill Arsenic 0.00 0.03
Meadowfill Landfill Barium 0.04 0.00
Meadowfill Landfill Chloride 22.20 0.00
Meadowfill Landfill Chromium 0.00 0.00
Meadowfill Landfill Nickel 0.00 0.01
Meadowfill Landfill Total Kjeldahl Nitrogen 5.36 0.01
Meadowfill Landfill Vanadium 0.00 0.00
Northwestern Landfill Fluoride 0.00 0.01
Northwestern Landfill Gross Beta 2.41 0.01
Northwestern Landfill Lithium 0.00 0.00
Northwestern Landfill Strontium 0.00 0.00
S and S Landfill Ammonia as N 0.76 0.00
S and S Landfill Nickel 0.00 0.00
S and S Landfill Total Kjeldahl Nitrogen 0.83 0.00
Short Creek Landfill Ammonia as N .060 0.03
Short Creek Landfill Arsenic 0.00 0.01
Short Creek Landfill Barium 0.00 0.00
Short Creek Landfill Gross Beta 0.56 0.00
Short Creek Landfill Nitrate as N 0.01 0.01
Short Creek Landfill Vanadium 0.00 0.00
Wetzel County Landfill Barium 0.00 0.00
Wetzel County Landfill Chloride 7.49 0.00
Wetzel County Landfill Iron 0.01 0.00
Wetzel County Landfill Manganese 0.01 0.00
Wetzel County Landfill Radium‐226 0.01 0.00
Wetzel County Landfill Strontium 0.01 0.00
Wetzel County Landfill Total Dissolved Solids 13.86 0.00
A complete list of compounds and associated landfill displaying slope and p-value trends is provided in the attachment. Conclusion - With the exception of chloride and total dissolved solids, there are no constituents that appear to be drastically increasing over time. This is based on the fact that there are many negative slopes in the data and that, with the exceptions listed in Table I, the positive slopes are relatively small and explainable by normal process fluctuations over time. Recommendation – Since tracking the constituent levels in the leachate at the landfill is an environmental concern, the leachate should be subjected to the trend analysis of ARIMA as well as the regression analysis presented here. Final remarks – The retrospective data presented for this study presented several limitations for time series analysis. These included incompleteness, irregular sampling intervals, being censored, and possibly some transcription errors. Inasmuch as possible, the data was analyzed to see if there are areas of significant problems for leachate constituents at landfills. Based on this analysis and the possible

exceptions noted in Table I, there appears to be minimal compelling evidence to suggest accelerated trends are occurring. More definitive answers could be obtained by more closely tracking sampling results over a longer time period. Section V - Statistical Results and Methodologies As indicated previously, various statistical methods were used to reach the conclusions stated above. In this section each method used is presented as well as examples of the output from that method. Complete output for every constituent/landfill combination is available upon request to the WVDEP. Control Charts - The first method employed was the method of control charts – often called Shewart Control Charts. These charts are a scatterplot of the lab measurement of a constituent over time. The vertical axis represents the amount of the constituent and the horizontal axis represents time – usually in month/day/year format. The center line on each graph represents the historical mean amount of the constituent. Using this plot, one can see how the measured amounts varied over time. In addition to the center line, the plots contain horizontal lines representing the upper confidence limit (UCL) and the lower confidence limit (LCL). UCL represents three standard deviations above the mean and LCL represents 3 standard deviations below the mean. These limits are often referred to as action limits and typically require intervention as described below:
If a measurement is within one standard deviation of the mean, the process is in control and no intervention
If a measurement is within two standard deviations of the mean, the process should be watched for evidence of going out of control
If a measurement is more than three standard deviations from the mean (that is above UCL or below LCL), the process should be investigated to determine why a measurement would be so far from the mean.
This type of analysis is most appropriately used with equally spaced data points. ARIMA -The second type of analysis used was “Automated Regressive Moving Average”, or ARIMA. In this analysis, the goal is to fit a curve to the time series data and to generate a curve that predicts future values of the constituent. In the ARIMA output, the solid black line represents a scatter plot of the time series, just like the control charts. The solid blue line represents the curve that was fit to the data points. On the far right of the ARIMA output, there is a region containing a light blue region, a dark blue region, and a solid blue line. The solid blue line represents the predicted value of the constituent measurement as determined by the regression curve. The blue and light blue regions define one and two standard deviations from the predicted value. For a time series with equally spaced data and accurate data, the values from the predicted curve allow for determination if the measurements are likely to increase/decrease/stay constant.
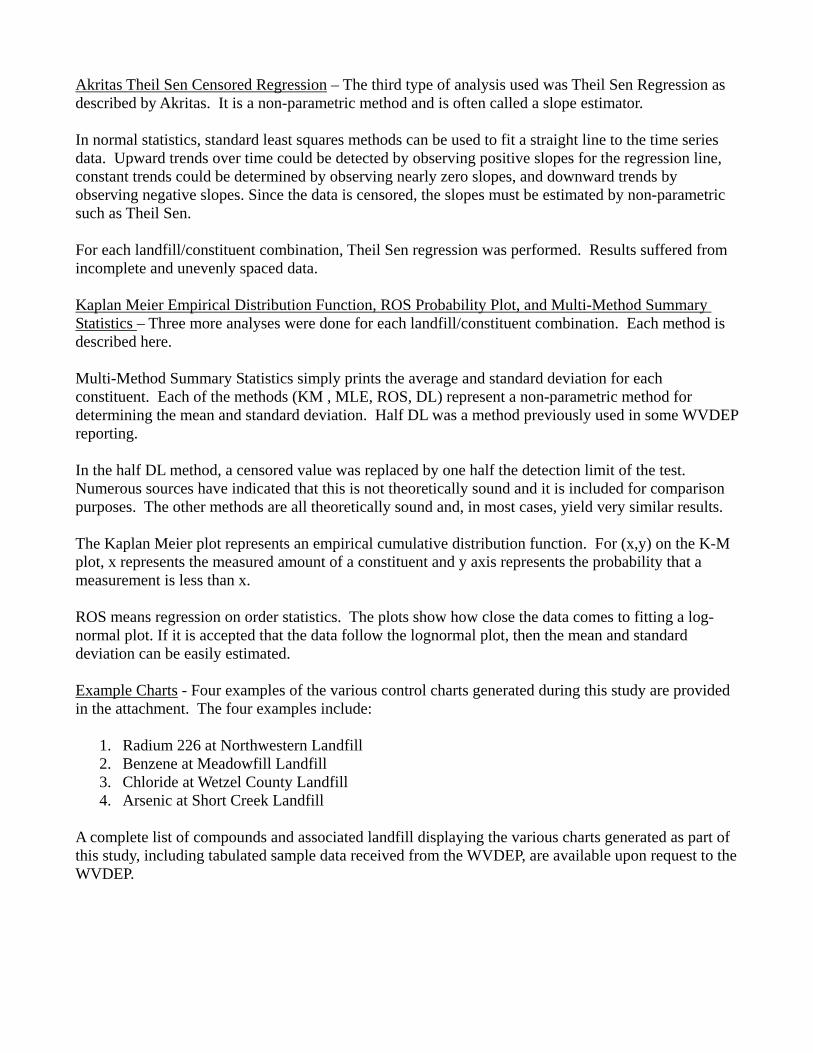
Akritas Theil Sen Censored Regression – The third type of analysis used was Theil Sen Regression as described by Akritas. It is a non-parametric method and is often called a slope estimator. In normal statistics, standard least squares methods can be used to fit a straight line to the time series data. Upward trends over time could be detected by observing positive slopes for the regression line, constant trends could be determined by observing nearly zero slopes, and downward trends by observing negative slopes. Since the data is censored, the slopes must be estimated by non-parametric such as Theil Sen. For each landfill/constituent combination, Theil Sen regression was performed. Results suffered from incomplete and unevenly spaced data. Kaplan Meier Empirical Distribution Function, ROS Probability Plot, and Multi-Method Summary Statistics – Three more analyses were done for each landfill/constituent combination. Each method is described here. Multi-Method Summary Statistics simply prints the average and standard deviation for each constituent. Each of the methods (KM , MLE, ROS, DL) represent a non-parametric method for determining the mean and standard deviation. Half DL was a method previously used in some WVDEP reporting. In the half DL method, a censored value was replaced by one half the detection limit of the test. Numerous sources have indicated that this is not theoretically sound and it is included for comparison purposes. The other methods are all theoretically sound and, in most cases, yield very similar results. The Kaplan Meier plot represents an empirical cumulative distribution function. For (x,y) on the K-M plot, x represents the measured amount of a constituent and y axis represents the probability that a measurement is less than x. ROS means regression on order statistics. The plots show how close the data comes to fitting a log-normal plot. If it is accepted that the data follow the lognormal plot, then the mean and standard deviation can be easily estimated. Example Charts - Four examples of the various control charts generated during this study are provided in the attachment. The four examples include:
1. Radium 226 at Northwestern Landfill 2. Benzene at Meadowfill Landfill 3. Chloride at Wetzel County Landfill 4. Arsenic at Short Creek Landfill
A complete list of compounds and associated landfill displaying the various charts generated as part of this study, including tabulated sample data received from the WVDEP, are available upon request to the WVDEP.

Attachments
Frequency Analysis of Parameters
Slope and P-value Trends Table
Statistical Chart Examples

Frequency Analysis of Parameters
Constituent Comparison Level Units Total Samples Samples Above Samples Below Percent Above (%) Percent Below (%)
1,2‐DICHLOROBENZENE 2700 ug/L 301 0 301 0.00 100.00
1,3‐DICHLOROBENZENE 400 ug/L 301 0 301 0.00 100.00
1,4‐DICHLOROBENZENE 400 ug/L 326 0 326 0.00 100.00
2,4‐DINITROTOLUENE 0.11 ug/L 297 297 0 100.00 0.00
ALUMINUM 0.75 mg/L 355 44 311 12.39 87.61
ANTIMONY 0.014 mg/L 343 233 110 67.93 32.07
ARSENIC 0.01 mg/L 395 342 53 86.58 13.42
BARIUM 1 mg/L 422 144 278 34.12 65.88
BENZENE 0.66 ug/L 329 233 96 70.82 29.18
BERYLLIUM 0.004 mg/L 298 3 295 1.01 98.99
CADMIUM 0.001 mg/L 301 234 67 77.74 22.26
CHLORIDE 230 mg/L 425 414 11 97.41 2.59
CHLOROBENZENE 680 ug/L 319 0 319 0.00 100.00
COPPER 1 mg/L 379 0 379 0.00 100.00
CYANIDE (FREE) 0.005 mg/L 350 346 4 98.86 1.14
FLUORANTHENE 300 ug/L 297 0 297 0.00 100.00
FLUORIDE 1.4 mg/L 420 75 345 17.86 82.14
GROSS ALPHA 15 pCi/L 412 45 367 10.92 89.08
GROSS BETA 1000 pCi/L 418 10 408 2.39 97.61
HEXAVALENT CHROMIUM 0.05 mg/L 293 6 287 2.05 97.95
IRON 1.5 mg/L 124 90 34 72.58 27.42
LEAD 0.05 mg/L 315 0 315 0.00 100.00
MANGANESE 1 mg/L 123 61 62 49.59 50.41
MERCURY 0.5 ug/L 311 12 299 3.86 96.14
NICKEL 0.51 mg/L 422 0 422 0.00 100.00
NITRATE AS N 10 mg/L 395 49 346 12.41 87.59
NITRITE AS N 1 mg/L 333 76 257 22.82 77.18
PH (FIELD) 9 S.U. 161 1 160 0.62 99.38
RADIUM‐226&228 5 pCi/L 409 167 242 40.83 59.17
SELENIUM 0.05 mg/L 363 2 361 0.55 99.45
SILVER 0.001 mg/L 299 299 0 100.00 0.00
STRONTIUM‐90 8 pCi/L 413 1 412 0.24 99.76

Slope and P‐value Trends Table
Landfill Constituent ATS Slope p‐value Comment
Brooke County Landfill 1 4‐DICHLOROBENZENE ‐0.01 0.37 Negative slope
Brooke County Landfill ALUMINUM 0.01 0 Small sample size
Brooke County Landfill AMMONIA AS N ‐0.02 0.85 Negative slope
Brooke County Landfill ANTIMONY 0 0.03 0 slope
Brooke County Landfill ARSENIC 0 0 0 slope
Brooke County Landfill BARIUM 0 0 1‐5 outliers signigicantly affecting results
Brooke County Landfill BENZENE 0.06 0.06 P‐value >0.05
Brooke County Landfill BORON ‐0.01 0 Negative slope
Brooke County Landfill CADMIUM 0 0.4 0 slope
Brooke County Landfill CHLORIDE 0.08 0.9 P‐value >0.05
Brooke County Landfill CHLOROBENZENE 0 0.56 0 slope
Brooke County Landfill CHROMIUM 0 0 0 slope
Brooke County Landfill COPPER 0 0 0 slope
Brooke County Landfill CYANIDE (FREE) 0 0.01 0 slope
Brooke County Landfill FLUORIDE 0 0 0 slope
Brooke County Landfill GROSS ALPHA 0.01 0.48 P‐value >0.05
Brooke County Landfill GROSS BETA ‐0.1 0.12 Negative slope
Brooke County Landfill LEAD 0 0.37 0 slope
Brooke County Landfill LITHIUM 0 0.91 P‐value >0.05
Brooke County Landfill MERCURY ‐20.08 0.66 Negative slope
Brooke County Landfill NICKEL 0 0.13 0 slope
Brooke County Landfill NITRATE AS N ‐0.02 0.01 Negative slope
Brooke County Landfill NITRITE AS N ‐0.04 0.02 Negative slope
Brooke County Landfill RADIUM‐226 0 0.75 Reported as needing reviewslope
Brooke County Landfill RADIUM‐228 0 0.99 0 slope
Brooke County Landfill SELENIUM 0 0.01 0 slope
Brooke County Landfill STRONTIUM 0 0 1‐5 outliers signigicantly affecting results
Brooke County Landfill STRONTIUM‐90 0 0.74 0 slope
Brooke County Landfill SULFATE AS SO4 ‐0.34 0 Negative slope
Brooke County Landfill TOTAL SUSPENDED SOLIDS 0.11 0.01 1‐5 outliers signigicantly affecting results
Brooke County Landfill VANADIUM 0 0 0 slope
Brooke County Landfill ZINC 0 0 0 slope
Brooke County Landfill HARDNESS ‐1.42 0.01 Negative slope
Brooke County Landfill IRON 0 0.66 P‐value >0.05
Brooke County Landfill MANGANESE 0 0.99 0 slope
Brooke County Landfill TOTAL DISSOLVED SOLIDS ‐1.72 0.49 Negative slope
Brooke County Landfill MERCURY TOTAL 0.06 1 P‐value >0.05
Meadowfill Landfill ALUMINUM 0 0.6 0 slope
Meadowfill Landfill AMMONIA AS N 4.22 0 Positive slope, p‐value < 0.05
Meadowfill Landfill ARSENIC 0 0.03 Positive slope, p‐value < 0.05
Meadowfill Landfill BARIUM 0.01 0 1‐5 outliers signigicantly affecting results
Meadowfill Landfill BENZENE 0.12 0 Suspect data in early months
Meadowfill Landfill BIS(2‐ETHYLHEXYL) PHTHALATE ‐0.03 0.92 Negative slope
Meadowfill Landfill BOD 5‐DAY 0.85 0.43 P‐value >0.05
Meadowfill Landfill BORON 0.04 0 Positive slope, p‐value < 0.05
Meadowfill Landfill CHLORIDE 22.2 0 Positive slope, p‐value < 0.05
Meadowfill Landfill CHLOROBENZENE 0.02 0 Suspect data in early months
Meadowfill Landfill CHROMIUM 0 0 Positive slope, p‐value < 0.05
Meadowfill Landfill COPPER 0 0.48 0 slope
Meadowfill Landfill DISSOLVED OXYGEN ‐0.04 0 Negative slope
Meadowfill Landfill FLUORIDE 0.01 0 1‐5 outliers signigicantly affecting results
Meadowfill Landfill GROSS ALPHA 0.13 0 1‐5 outliers signigicantly affecting results
Meadowfill Landfill GROSS BETA 1.77 0 1‐5 outliers signigicantly affecting results

Slope and P‐value Trends Table
Landfill Constituent ATS Slope p‐value Comment
Meadowfill Landfill HEXAVALENT CHROMIUM 0 0.72 0 slope
Meadowfill Landfill LITHIUM 0 0 1‐5 outliers signigicantly affecting results
Meadowfill Landfill MERCURY 0.01 0.21 P‐value >0.05
Meadowfill Landfill NICKEL 0 0.01 Positive slope, p‐value < 0.05
Meadowfill Landfill NITRATE AS N 0 0.42 P‐value >0.05
Meadowfill Landfill NITRITE AS N ‐0.07 0.48 Negative slope
Meadowfill Landfill PH (FIELD) 0 0.25 0 slope
Meadowfill Landfill RADIUM‐226 0.02 0 1‐5 outliers signigicantly affecting results
Meadowfill Landfill RADIUM‐228 0 0.94 P‐value >0.05
Meadowfill Landfill SELENIUM 0 0.07 0 slope
Meadowfill Landfill STRONTIUM 0.02 0 1‐5 outliers signigicantly affecting results
Meadowfill Landfill SULFATE AS SO4 ‐0.71 0.02 Negative slope
Meadowfill Landfill TEMPERATURE (FIELD) 0.08 0.01 Positive slope, p‐value < 0.05
Meadowfill Landfill TOTAL DISSOLVED SOLIDS 57 0 1‐5 outliers signigicantly affecting results
Meadowfill Landfill TOTAL KJELDAHL NITROGEN 5.36 0.01 Positive slope, p‐value < 0.05
Meadowfill Landfill TOTAL SUSPENDED SOLIDS ‐0.19 0.03 Negative slope
Meadowfill Landfill VANADIUM 0 0 Positive slope, p‐value < 0.05
Meadowfill Landfill ZINC 0 0 1‐5 outliers signigicantly affecting results
Northwestern Landfill 1 2‐DICHLOROBENZENE 0.32 0.01 1‐5 outliers signigicantly affecting results
Northwestern Landfill 1 2‐DICHLOROBENZENE 0.32 0.01 1‐5 outliers signigicantly affecting results
Northwestern Landfill 1 4‐DICHLOROBENZENE 0.32 0.01 1‐5 outliers signigicantly affecting results
Northwestern Landfill 4‐DINITROBENZENE 0.32 0.01 1‐5 outliers signigicantly affecting results
Northwestern Landfill 4‐NAPHTHOQUINONE 0.32 0.01 1‐5 outliers signigicantly affecting results
Northwestern Landfill 4‐DINITROTOLUENE 0.32 0.01 1‐5 outliers signigicantly affecting results
Northwestern Landfill 6‐DINITROTOLUENE 0.32 0.01 1‐5 outliers signigicantly affecting results
Northwestern Landfill 4‐NITROQUINOLINE‐1‐OXIDE 0.39 0 1‐5 outliers signigicantly affecting results
Northwestern Landfill ALUMINUM 0.01 0 Suspect data in early months
Northwestern Landfill AMMONIA AS N 0.14 0.28 P‐value >0.05
Northwestern Landfill ARSENIC 0 0.31 P‐value >0.05
Northwestern Landfill BARIUM 0 0.06 P‐value >0.05
Northwestern Landfill BENZENE ‐0.01 0.04 Negative slope
Northwestern Landfill BIS(2‐ETHYLHEXYL) PHTHALATE 0.49 0.53 P‐value >0.05
Northwestern Landfill BOD 5‐DAY 0 0.92 0 slope
Northwestern Landfill BORON 0 0.93 P‐value >0.05
Northwestern Landfill BUTYL BENZYL PHTHALATE 0.32 0.01 1‐5 outliers signigicantly affecting results
Northwestern Landfill CHLORIDE 1.51 0.41 P‐value >0.05
Northwestern Landfill CHLOROBENZENE 0 0.42 P‐value >0.05
Northwestern Landfill CYANIDE (FREE) 0 0.72 0 slope
Northwestern Landfill CYANIDE (TOTAL) 0 0.3 P‐value >0.05
Northwestern Landfill DI‐N‐BUTYL PHTHALATE 0.32 0.01 1‐5 outliers signigicantly affecting results
Northwestern Landfill DI‐N‐OCTYL PHTHALATE 0.32 0.01 1‐5 outliers signigicantly affecting results
Northwestern Landfill DIETHYL PHTHALATE 0.32 0.01 1‐5 outliers signigicantly affecting results
Northwestern Landfill DIMETHYL PHTHALATE 0.32 0.01 1‐5 outliers signigicantly affecting results
Northwestern Landfill FLUORANTHENE 0.32 0.01 1‐5 outliers signigicantly affecting results
Northwestern Landfill FLUORIDE 0 0.01 Positive slope, p‐value < 0.05
Northwestern Landfill GROSS ALPHA 0.03 0.28 P‐value >0.05
Northwestern Landfill GROSS BETA 2.41 0.01 Positive slope, p‐value < 0.05
Northwestern Landfill HEXAVALENT CHROMIUM 0 0.88 P‐value >0.05
Northwestern Landfill LITHIUM 0 0 Positive slope, p‐value < 0.05
Northwestern Landfill NICKEL 0 0.85 0 slope
Northwestern Landfill NITRATE AS N 0.01 0.07 P‐value >0.05
Northwestern Landfill NITRITE AS N 0.02 0 1‐5 outliers signigicantly affecting results
Northwestern Landfill NITROBENZENE 0.32 0.01 1‐5 outliers signigicantly affecting results

Slope and P‐value Trends Table
Landfill Constituent ATS Slope p‐value Comment
Northwestern Landfill PENTACHLORONITROBENZENE 0.32 0.01 1‐5 outliers signigicantly affecting results
Northwestern Landfill RADIUM‐226 0 0.78 P‐value >0.05
Northwestern Landfill RADIUM‐228 ‐0.01 0.02 Negative slope
Northwestern Landfill STRONTIUM 0 0 Positive slope, p‐value < 0.05
Northwestern Landfill SULFATE AS SO4 0.02 0.2 P‐value >0.05
Northwestern Landfill TOTAL DISSOLVED SOLIDS 5.67 0.22 P‐value >0.05
Northwestern Landfill TOTAL KJELDAHL NITROGEN 0.16 0.33 P‐value >0.05
Northwestern Landfill TOTAL SUSPENDED SOLIDS 0.02 0.75 P‐value >0.05
Northwestern Landfill VANADIUM 0 0 Suspect early data
Northwestern Landfill ZINC 0 0.39 0 slope
Short Creek Landfill 1 2‐DICHLOROBENZENE 1.69 0.43 P‐value >0.05
Short Creek Landfill ALUMINUM 0 0.12 0 slope
Short Creek Landfill AMMONIA AS N 0.6 0.03 Positive slope, p‐value < 0.05
Short Creek Landfill ARSENIC 0 0.01 Positive slope, p‐value < 0.05
Short Creek Landfill BARIUM 0 0 Positive slope, p‐value < 0.05
Short Creek Landfill BENZENE ‐0.03 0.07 Negative slope
Short Creek Landfill BIS(2‐ETHYLHEXYL) PHTHALATE ‐0.43 0.73 Negative slope
Short Creek Landfill BORON 0.02 0.06 P‐value >0.05
Short Creek Landfill CHLORIDE 3.09 0.07 P‐value >0.05
Short Creek Landfill CHLOROBENZENE ‐0.01 0 Negative slope
Short Creek Landfill CHROMIUM 0 0.01 1‐5 outliers signigicantly affecting results
Short Creek Landfill COPPER 0 0.83 0 slope
Short Creek Landfill CYANIDE (FREE) 0 0.81 P‐value >0.05
Short Creek Landfill FLUORIDE ‐0.01 0.14 Negative slope
Short Creek Landfill GROSS ALPHA 0.02 0.63 P‐value >0.05
Short Creek Landfill GROSS BETA 0.56 0 Positive slope, p‐value < 0.05
Short Creek Landfill HEXAVALENT CHROMIUM 0 0.73 0 slope
Short Creek Landfill LITHIUM 0 0.09 P‐value >0.05
Short Creek Landfill MERCURY 0 0.71 P‐value >0.05
Short Creek Landfill NICKEL 0 0.09 P‐value >0.05
Short Creek Landfill NITRATE AS N 0.01 0.01 Positive slope, p‐value < 0.05
Short Creek Landfill NITRITE AS N ‐0.01 0.78 Negative slope
Short Creek Landfill RADIUM‐226 0.01 0.06 P‐value >0.05
Short Creek Landfill RADIUM‐228 0 1 0 slope
Short Creek Landfill STRONTIUM 0 0.02 Suspect data in early months
Short Creek Landfill SULFATE AS SO4 0 0.9 0 slope
Short Creek Landfill TOTAL SUSPENDED SOLIDS 0.03 0.63 P‐value >0.05
Short Creek Landfill VANADIUM 0 0 Positive slope, p‐value < 0.05
Short Creek Landfill ZINC 0 0 0 slope
S and S Landfill 4‐NITROQUINOLINE‐1‐OXIDE 0.33 0.56 P‐value >0.05
S and S Landfill ALUMINUM 0 0.19 0 slope
S and S Landfill AMMONIA AS N 0.76 0 Positive slope, p‐value < 0.05
S and S Landfill ARSENIC 0 0.04 1‐5 outliers signigicantly affecting results
S and S Landfill BARIUM 0 0 1‐5 outliers signigicantly affecting results
S and S Landfill BENZENE 0.01 0.1 P‐value >0.05
S and S Landfill BERYLLIUM 0 0.04 1‐5 outliers signigicantly affecting results
S and S Landfill BOD 5‐DAY 0.46 0.02 1‐5 outliers signigicantly affecting results
S and S Landfill BORON 0.01 0 1‐5 outliers signigicantly affecting results
S and S Landfill CADMIUM 0 0.04 1‐5 outliers signigicantly affecting results
S and S Landfill CHLORIDE 5.5 0 1‐5 outliers signigicantly affecting results
S and S Landfill CHLOROBENZENE 0 0.01 1‐5 outliers signigicantly affecting results
S and S Landfill CHROMIUM 0 0 Suspect data in early months

Slope and P‐value Trends Table
Landfill Constituent ATS Slope p‐value Comment
S and S Landfill COPPER 0 0.09 P‐value >0.05
S and S Landfill CYANIDE (FREE) 0 0.95 P‐value >0.05
S and S Landfill DISSOLVED OXYGEN 0 0.63 P‐value >0.05
S and S Landfill FLUORIDE 0 0.03 0 slope
S and S Landfill GROSS ALPHA 0.06 0 1‐5 outliers signigicantly affecting results
S and S Landfill GROSS BETA 0.55 0 1‐5 outliers signigicantly affecting results
S and S Landfill HEXAVALENT CHROMIUM 0 0.62 0 slope
S and S Landfill LITHIUM 0 0 1‐5 outliers signigicantly affecting results
S and S Landfill NICKEL 0 0 Positive slope, p‐value < 0.05
S and S Landfill NITRATE AS N 0.01 0 1‐5 outliers signigicantly affecting results
S and S Landfill NITRITE AS N ‐0.01 0.03 Negative slope
S and S Landfill PH (FIELD) 0 0.79 0 slope
S and S Landfill RADIUM‐226 0.01 0 1‐5 outliers signigicantly affecting results
S and S Landfill RADIUM‐228 0 0.75 0 slope
S and S Landfill STRONTIUM 0.01 0 1‐5 outliers signigicantly affecting results
S and S Landfill STRONTIUM‐90 0 0.81 0 slope
S and S Landfill SULFATE AS SO4 0.13 0.6 P‐value >0.05
S and S Landfill TEMPERATURE (FIELD) 0.01 0.31 P‐value >0.05
S and S Landfill TOTAL DISSOLVED SOLIDS 14.08 0 1‐5 outliers signigicantly affecting results
S and S Landfill TOTAL KJELDAHL NITROGEN 0.83 0 Positive slope, p‐value < 0.05
S and S Landfill TOTAL SUSPENDED SOLIDS ‐0.03 0.44 Negative slope
S and S Landfill VANADIUM 0 0 Suspect data in early months
S and S Landfill ZINC 0 0 1‐5 outliers signigicantly affecting results
Wetzel County landfill 1 4‐DICHLOROBENZENE 0.08 0.41 P‐value >0.05
Wetzel County landfill ALUMINUM 0 0.01 0 slope
Wetzel County landfill AMMONIA AS N 0.37 0 1‐5 outliers signigicantly affecting results
Wetzel County landfill ANTIMONY 0 0 0 slope
Wetzel County landfill ARSENIC 0 0.71 P‐value >0.05
Wetzel County landfill BARIUM 0 0 Positive slope, p‐value < 0.05
Wetzel County landfill BORON 0 0.68 P‐value >0.05
Wetzel County landfill CHLORIDE 7.49 0 Positive slope, p‐value < 0.05
Wetzel County landfill CHLOROBENZENE 0.07 0.47 P‐value >0.05
Wetzel County landfill CHROMIUM 0 0.23 P‐value >0.05
Wetzel County landfill COPPER 0 0 0 slope
Wetzel County landfill CYANIDE (FREE) 0 0.32 0 slope
Wetzel County landfill FLUORIDE ‐0.01 0 Negative slope
Wetzel County landfill GROSS ALPHA 0.04 0.01 1‐5 outliers signigicantly affecting results
Wetzel County landfill GROSS BETA 0.1 0.01 1‐5 outliers signigicantly affecting results
Wetzel County landfill LEAD 0 0.13 0 slope
Wetzel County landfill LITHIUM 0 0.24 0 slope
Wetzel County landfill MERCURY 0 0.99 P‐value >0.05
Wetzel County landfill NICKEL 0 0.2 P‐value >0.05
Wetzel County landfill NITRATE AS N ‐0.26 0 Negative slope
Wetzel County landfill NITRITE AS N ‐0.03 0.14 Negative slope
Wetzel County landfill RADIUM‐226 0.01 0 Positive slope, p‐value < 0.05
Wetzel County landfill RADIUM‐228 0.01 0.01 1‐5 outliers signigicantly affecting results
Wetzel County landfill SELENIUM 0 0.1 0 slope
Wetzel County landfill STRONTIUM 0.01 0 Positive slope, p‐value < 0.05
Wetzel County landfill STRONTIUM‐90 0 0.57 0 slope
Wetzel County landfill SULFATE AS SO4 0.02 0.76 P‐value >0.05
Wetzel County landfill TOTAL SUSPENDED SOLIDS 0 0.91 0 slope
Wetzel County landfill VANADIUM 0 0.29 0 slope
Wetzel County landfill ZINC 0 0 0 slope

Slope and P‐value Trends Table
Landfill Constituent ATS Slope p‐value Comment
Wetzel County landfill ALUMINUM DISSOLVED 0 0.02 0 slope
Wetzel County landfill HARDNESS 3.71 0 1‐5 outliers signigicantly affecting results
Wetzel County landfill IRON 0.01 0 Positive slope, p‐value < 0.05
Wetzel County landfill MANGANESE 0.01 0 Positive slope, p‐value < 0.05
Wetzel County landfill TOTAL DISSOLVED SOLIDS 13.86 0 Positive slope, p‐value < 0.05
Wetzel County landfill MERCURY TOTAL ‐0.18 0.02 Negative slope

Statistical Chart Examples - Radium 226 at Northwestern Landfill

Nor
thw
este
rn L
andf
ill
RA
DIU
M22
6 x
bar.o
ne C
hart
RADIUM226 ( pCi/L )
2011011020110125201102082011022220110426201105172011052420110614201107122011071920110809201108302011091220110919201110112011102520111115201112152011122920120110201201232012021320120227201203122012042420120514201205292012061120120619201207092012072420120813201208272012091020120924201210152012103020121210201212172013011420130128201302112013022720130311201303252013041520130520201306102013061720130708201308122013082620130909201309232013100820131028201311192013112520131209201312302014011320140128
1000
100
200
300
●●
●●
●●
●●
●●
●●
●●
●●
●●
●●
●●
●
●
●●
●●
●
●
●●
●●
●●
●●
●●
●●
●●
●●
●●
●●
●●
●●
●●
●●
●●
●●
LCL
UC
L
CL
●●
●●
●●
●●
●●
●●
●●
●●
●●
●●
●●
●●
●●
●●
●●
●●
●●
●●
●●
●●
●
●
Num
ber o
f gro
ups
= 62
Cen
ter =
8.9
7258
1S
tdD
ev =
41.
3302
8LC
L =
115.
0183
UC
L =
132.
9634
Num
ber b
eyon
d lim
its =
1N
umbe
r vio
latin
g ru
ns =
41
●●
●●
●●
●●
●●
●●
●●
●●
●●
●●
●●
●●
●●
●●
●●
●●
●●
●●
●●
●●
●●
●●
●●
●●
●●
●●
●●
●●
● ●
● ●Va
lue
Rep
orte
d <D
LD
L
Run
Vio
latio
nVa
lue
>UC
L or
<LC
LVa
lue
== D
L

Nor
thw
este
rn L
andf
ill
RA
DIU
M22
6 A
RIM
A(0
,0,0
) with
non
zero
mea
n
010
2030
4050
6070
0100200300
AIC
: 63
9.90
9875
3150
35 |
AIC
c: 6
40.1
1326
5145
544
| B
IC:
644.
1641
4408
5126
M
E
RM
SE
MA
E
M
PE
M
AP
E
M
AS
E
A
CF1
Trai
ning
set
1.3
0298
7e15
40.
8279
5 10
.819
67
252.
0447
258
.627
7 0.
8535
509
0.02
3254
27

050
100
150
050100150200250300
Cen
sore
d Sc
atte
r: A
krita
sTh
eil
Sen
Reg
ress
ion
Tim
e in
Wee
ks
RADIUM226 ( pCi/L )
●●
●●
●●●
●●●
●●
●●
●●
●●
●●
●
●
●●
●●
●
●
●●
●●
●●
●●
●●
●●
●●
●●●
●●
●●
●●
●●
●●
●
Slo
pe: 0
.001
1015
7934
4032
04 |
Tau:
0.0
2485
4574
2993
125
| p:
0.77
9768
2551
5902
9

12
510
2050
100
200
0.00.20.40.60.81.0
Valu
e
Probability
Nor
thw
este
rn L
andf
ill
RA
DIU
M22
6 K
apla
nM
eier
Em
piric
al D
istr
ibut
ion
Func
tion
●●
●●
●●●●●●●●●●●●●●●●●●●●●●●●●●●●●●●●●●●●●●●●●
●●
●●
●●
●
●●
●
●
21
01
2
Nor
mal
Qua
ntile
s
Value
0.52.05.020.050.0200.0
95
90
75
50
25
10
5
Perc
ent C
hanc
e of
Exc
eeda
nce
RO
S Pr
obab
ility
Plo
t
Mul
tim
etho
d Su
mm
ary
Stat
istic
s P
erce
nt C
enso
red:
9.6
7741
9354
8387
1
KM
RO
S
MLE DL
Hal
f DL
med
ian
3.12
3.12
3.13
9686
8632
423
3.12
3.12
mea
n8.
9735
4838
7096
758.
9489
8306
4969
934.
8669
5230
8310
638.
9725
8064
5161
298.
9241
9354
8387
1
sd41
.197
2513
6563
4241
.165
9880
8114
225.
7646
8293
5876
7741
.161
2456
1735
3241
.171
0400
5855
22

Statistical Chart Examples - Benzene at Meadowfill Landfill

Mea
dow
fill L
andf
ill
BEN
ZEN
E x
bar.o
ne C
hart
BENZENE ( ug/L )
2010120220101202201012202011011020110126201102142011022320110315201103292011042020110523201105312011060620110629201107142011072720110816201108302011091420110929201110102011102620111107201111302011120120120111201201312012021420120229201203062012032920120409201204302012050720120531201206062012062820120725201208312012092720121004201210312012110820121129201212062012122720130109201301302013020620130220201303052013032720130410201304222013050720130521201306112013062620130708201307222013080620130827201309102013092420131008201310222013111220131125201312032013121820140113201404092014051220140611201407092014111120141209
1001020
●●
●●
●●
●
●
●●
●●
●●
●●
●●
●●
●●
●●
●●
●
●
●
●●
●
●
●
●
●
●
●
●
●
●
●
●
●
●
●
●
●
●
●
●●
●
●
●
●
●
●
●
●●
●
●
●
●
●●
●
●●
●
●●
●
●
●
●
LCL
UC
L
CL
●●
●
●●
●●
●
●
●●
●●
●
●
●●
●●
●●
●●
●●
●●
●●
●●
●●
●
Num
ber o
f gro
ups
= 77
Cen
ter =
6.7
4805
2S
tdD
ev =
6.1
5629
7LC
L =
11.7
2084
UC
L =
25.2
1694
Num
ber b
eyon
d lim
its =
0N
umbe
r vio
latin
g ru
ns =
34
●●
●●
●●
●●
●●
●●
●●
●●
●●
●●
●●
●●
●●
●●
●●
●●
●●
●●
●●
●●
●●
●●
●●
●●
●●
●●
●
● ●
● ●Va
lue
Rep
orte
d <D
LD
L
Run
Vio
latio
nVa
lue
>UC
L or
<LC
LVa
lue
== D
L
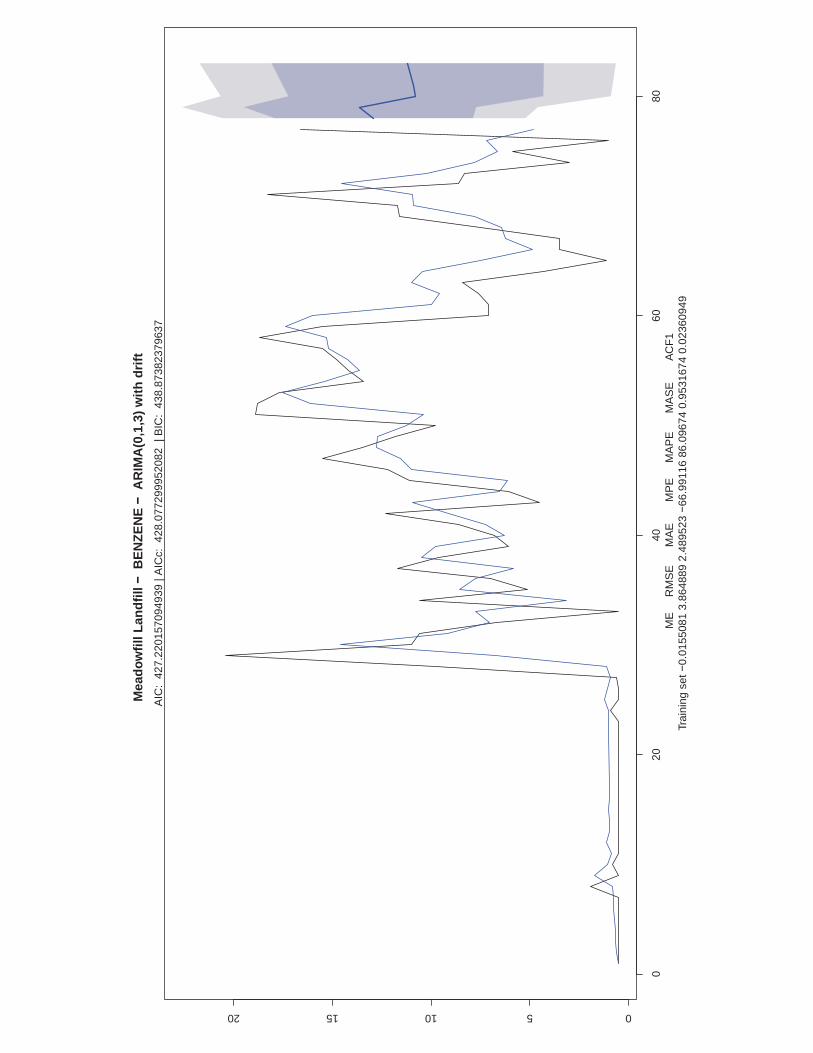
Mea
dow
fill L
andf
ill
BEN
ZEN
E A
RIM
A(0
,1,3
) with
drif
t
020
4060
80
05101520
AIC
: 42
7.22
0157
0949
39 |
AIC
c: 4
28.0
7729
9952
082
| B
IC:
438.
8738
2379
637
M
E
RM
SE
MA
E
M
PE
M
AP
E
M
AS
E
A
CF1
Trai
ning
set
0.
0155
081
3.86
4889
2.4
8952
3 66
.991
16 8
6.09
674
0.95
3167
4 0.
0236
0949

050
100
150
200
05101520
Cen
sore
d Sc
atte
r: A
krita
sTh
eil
Sen
Reg
ress
ion
Tim
e in
Wee
ks
BENZENE ( ug/L )
●
●●
●
●
●
●
●
●
●
●
●
●
●
●
●
●
●
●
●
●
●
●
●
●
●
●●
●
●
●
●
●
●
●
●●
●
●
●
●
●●
●
●●
●
●●
●
●
●
●
Slo
pe: 0
.115
2256
0119
6227
| Ta
u: 0
.440
1913
8755
9809
| p:
8.0
6805
5112
8864
4e09

0.5
1.0
2.0
5.0
10.0
20.0
0.00.20.40.60.81.0
Valu
e
Probability
Mea
dow
fill L
andf
ill
BEN
ZEN
E K
apla
nM
eier
Em
piric
al D
istr
ibut
ion
Func
tion
●
●●●●
●
●●●
●●●●●●●●●●●●●●●●●●●●●●●●●●●●●●●●●●●
●●
●●
●●
●●
●
21
01
2
Nor
mal
Qua
ntile
s
Value
0.51.02.05.010.020.0
95
90
75
50
25
10
5
Perc
ent C
hanc
e of
Exc
eeda
nce
RO
S Pr
obab
ility
Plo
t
Mul
tim
etho
d Su
mm
ary
Stat
istic
s P
erce
nt C
enso
red:
31.
1688
3116
8831
2
KM
RO
S
MLE DL
Hal
f DL
med
ian
6.1
6.1
2.23
1479
6890
4054
6.1
6.1
mea
n6.
7792
2077
9220
787.
0317
4601
0612
416
.296
2875
7770
726.
7480
5194
8051
956.
6701
2987
0129
87
sd6.
1222
8446
8513
865.
8608
1487
7297
411
7.88
9245
2790
996.
1360
7989
0151
256.
2170
4077
8018
38

Statistical Chart Examples - Chloride at Wetzel County Landfill
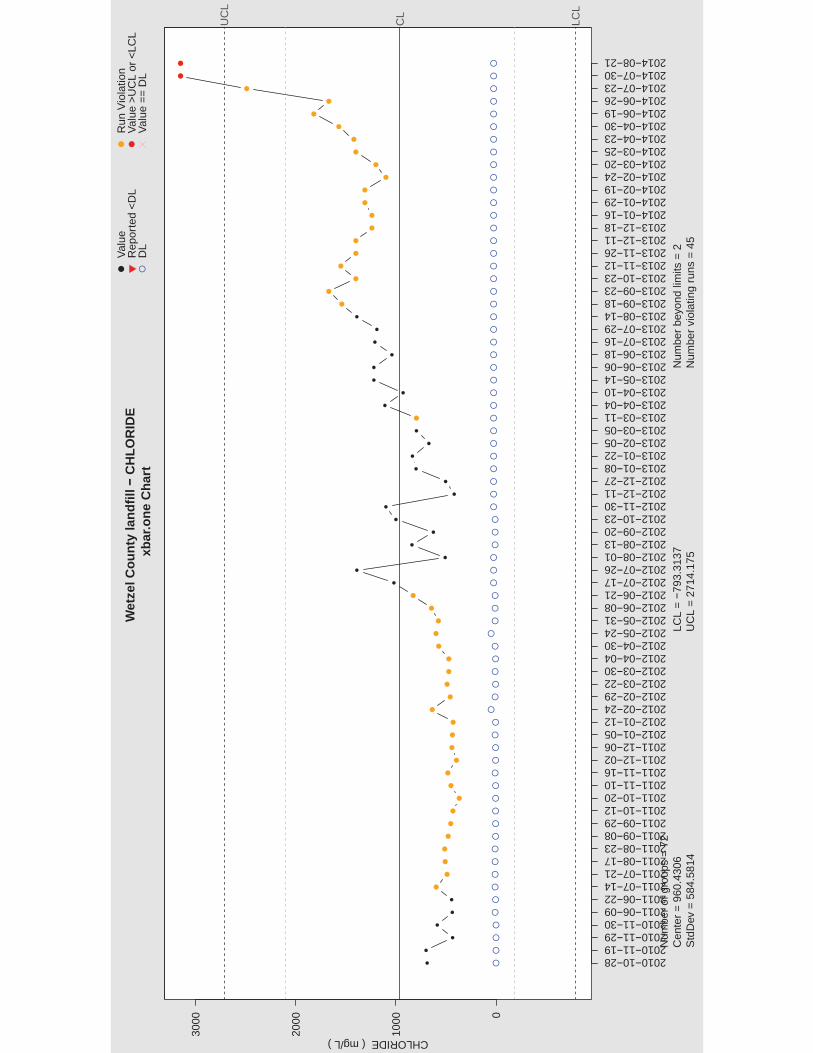
Wet
zel C
ount
y la
ndfil
l C
HLO
RID
E x
bar.o
ne C
hart
CHLORIDE ( mg/L )
201010282010111920101129201011302011060920110622201107142011072120110817201108232011090820110929201110122011102020111110201111162011120220111206201201052012011220120224201202292012032220120330201204042012043020120524201205312012060820120621201207172012072620120801201208132012092020121023201211302012121120121227201301082013012220130205201303052013031120130404201304102013051420130606201306182013071620130729201308142013091820130923201310232013111220131126201312112013121820140116201401292014021920140224201403202014032520140423201404302014061920140626201407232014073020140821
0
1000
2000
3000
●●
●
●
●●
●
●●
●●
●●
●
●●
●●
●●
●
●●
●●
●●
●
●
●
●
●
●
●
●
●
●
●
●
●●
●
●●
●
●
●●
●
●●
●
●
●
●
●
●●
●●
●●
●
●
●●
●
●
●
●
●●
LCL
UC
L
CL
●
●
●
●
●●
●●
●●
●
●
●●
●
●
●
●
●●
●
●●
●●
●●
●●
●●
●●
●
●
●●
●●
●●
●●
●●
●●
Num
ber o
f gro
ups
= 72
Cen
ter =
960
.430
6S
tdD
ev =
584
.581
4LC
L =
793.
3137
UC
L =
2714
.175
Num
ber b
eyon
d lim
its =
2N
umbe
r vio
latin
g ru
ns =
45
●●
●●
●●
●●
●●
●●
●●
●●
●●
●●
●●
●●
●●
●●
●●
●●
●●
●●
●●
●●
●●
●●
●●
●●
●●
●●
●●
●●
●●
●●
●●
●●
●●
●●
●●
●●
● ●
● ●Va
lue
Rep
orte
d <D
LD
L
Run
Vio
latio
nVa
lue
>UC
L or
<LC
LVa
lue
== D
L

Wet
zel C
ount
y la
ndfil
l C
HLO
RID
E A
RIM
A(0
,1,1
) with
drif
t
020
4060
80
1000200030004000
AIC
: 96
6.01
6528
9461
67 |
AIC
c: 9
66.3
7473
7901
391
| B
IC:
972.
8045
6857
7291
M
E
RM
SE
MA
E
M
PE
M
AP
E
M
AS
E
ACF1
Trai
ning
set
0.
3377
253
228.
3947
149
.545
9 7.
1115
12 1
8.72
397
0.96
8419
9 0.
0042
9579
9

050
100
150
200
50010001500200025003000
Cen
sore
d Sc
atte
r: A
krita
sTh
eil
Sen
Reg
ress
ion
Tim
e in
Wee
ks
CHLORIDE ( mg/L )
●●
●●
●●
●
●●●
●●
●
●
●●
●●●●
● ●●●●
●●●
●
●
●
●
●
●
●
●
●
●
●
●●
●
●●
●
●
●●
●
●●
●
●●
●
●
●●
●●
●● ●
●●●
●
●
●
●
●●
Slo
pe: 7
.493
6828
6133
245
| Tau
: 0.
6701
8779
3427
23 |
p: 0

500
1000
2000
0.00.20.40.60.81.0
Valu
e
Probability
Wet
zel C
ount
y la
ndfil
l C
HLO
RID
E K
apla
nM
eier
Em
piric
al D
istr
ibut
ion
Func
tion
●●
●●
●●
●●
●●●●●●●●●●●●●●●
●●●●●●●●●●●
●●●●●●
●●●●●●●●●●●●●●●●●●●●●●●
●●
●●
●
●
●
●●
21
01
2
Nor
mal
Qua
ntile
s
Value
50010002000
95
90
75
50
25
10
5
Perc
ent C
hanc
e of
Exc
eeda
nce
RO
S Pr
obab
ility
Plo
t
Mul
tim
etho
d Su
mm
ary
Stat
istic
s P
erce
nt C
enso
red:
0
KM
RO
S
MLE DL
Hal
f DL
med
ian
795
797
825.
9731
6800
5993
797
797
mea
n96
0.43
0555
5555
5696
0.43
0555
5555
5695
3.27
9287
2829
3896
0.43
0555
5555
5696
0.43
0555
5555
56
sd58
2.52
6716
4613
4558
2.52
6716
4613
4554
9.28
4879
5874
1658
2.52
6716
4613
4558
2.52
6716
4613
45

Statistical Chart Examples - Arsenic at Short Creek Landfill

Shor
t Cre
ek L
andf
ill
AR
SEN
IC
xba
r.one
Cha
rt
ARSENIC ( mg/L )
20101115201011292011010620110113201103042011032120110401201104212011050420110524201106022011062120110815201108292011100620111021201111012011111420111221201201122012012620120409201204202012050720120524201206082012061920120803201208162012090620120918201210082012102520121105201211212012120520121221201301152013012820130206201302192013030420130312201304152013042420130506201305202013060420130618201307032013071520130813201308262013091020130926201310072013101720131111201311252013120420131218
0.00
0.02
0.04
0.06
0.08
●
●●
●
●
●
●
●
●●
●●
●●
●
●●
●
●
●●
●●
●
●
●
●●
●●
●
●
●
●
●
●
●●
●
●●
●●
●
●●
●
●
●
●●
●
●●
●●
●●
●●
●
LCL
UC
L
CL
●●
●●
●●
●●
●
●●
●●
●●
●
Num
ber o
f gro
ups
= 61
Cen
ter =
0.0
4393
443
Std
Dev
= 0
.016
6300
1LC
L =
0.00
5955
606
UC
L =
0.09
3824
46N
umbe
r bey
ond
limits
= 0
Num
ber v
iola
ting
runs
= 1
6
●●
●●
●●
●●
●●
●●
●●
●●
●●
●●
●●
●●
●●
●●
●●
●●
●●
●●
●●
●●
●●
●●
●●
●●
●●
●●
●●
●●
●●
●●
● ●
● ●Va
lue
Rep
orte
d <D
LD
L
Run
Vio
latio
nVa
lue
>UC
L or
<LC
LVa
lue
== D
L

Shor
t Cre
ek L
andf
ill
AR
SEN
IC
AR
IMA
(0,1
,1)
010
2030
4050
60
0.020.040.060.08
AIC
: 34
0.44
1627
6328
01 |
AIC
c:
340.
2311
0131
7012
| B
IC:
336.
2529
3850
8357
M
E
R
MS
E
MA
E
M
PE
M
AP
E
M
AS
E
A
CF1
Trai
ning
set
0.
0010
0804
1 0.
0135
7985
0.0
0979
4306
9.
5523
54 2
6.63
042
0.99
6031
1 0.
0843
6937

050
100
150
0.020.030.040.050.060.070.080.09
Cen
sore
d Sc
atte
r: A
krita
sTh
eil
Sen
Reg
ress
ion
Tim
e in
Wee
ks
ARSENIC ( mg/L )
●
●●
●
●
●
●●
●●
●●
●●
●
●
●●
●●
●
●
●
●●
●●
●
●
●
●
●●
●●●
●
●●
●
●
●
●●
●
●●
●●
●●
●●
●
Slo
pe: 0
.000
1252
4383
9636
868
| Tau
: 0.
2349
7267
7595
628
| p:
0.00
6502
9065
7798
247

0.02
0.04
0.06
0.08
0.00.20.40.60.81.0
Valu
e
Probability
Shor
t Cre
ek L
andf
ill
AR
SEN
IC
Kap
lan
Mei
er E
mpi
rical
Dis
trib
utio
n Fu
nctio
n
●●
●●
●●●●●●●●●●
●●●●●●●●●●●●●
●●●●●●●●●●●●
●●●●
●●
●●
●
●●
●
●●
●
21
01
2
Nor
mal
Qua
ntile
s
Value
0.020.040.060.08
95
90
75
50
25
10
5
Perc
ent C
hanc
e of
Exc
eeda
nce
RO
S Pr
obab
ility
Plo
t
Mul
tim
etho
d Su
mm
ary
Stat
istic
s P
erce
nt C
enso
red:
11.
4754
0983
6065
6
KM
RO
S
MLE DL
Hal
f DL
med
ian
0.04
0.04
0.04
0030
9261
8416
180.
040.
04
mea
n0.
0450
8196
7213
1148
0.04
4208
2378
2098
420.
0439
3102
3981
1151
0.04
3934
4262
2950
820.
0427
8688
5245
9016
sd0.
0151
4062
2101
7616
0.01
6193
0248
7393
530.
0198
5887
7424
8133
0.01
6560
8663
7473
920.
0184
5093
9230
0215

Appendix H
Radioactivity Associated with Marcellus Shale Exploration and Disposal of Related Material (Compiled by Marshall University Center for Environmental, Geotechnical and Applied Sciences)
Radioactivity Associated with Marcellus Shale Exploration and Disposal of Related Material
June 30, 2015
Prepared for:
West Virginia Department of Environmental Protection
Dr. Terry Polen, Ombudsman
601 57th Street, SE
Charleston, WV 25304
Submitted by:
Marshall University Center for Environmental, Geotechnical and Applied Sciences
Marshall University
One John Marshall Drive
Huntington, WV 25755-2585

Abstract
During the West Virginia 2014 legislative session, House Bill 4411 and Senate Bill 474 were passed. This legislation charged the WVDEP to undertake horizontal drilling waste disposal studies. Part of this study included the study of the “Hazardous characteristics of leachate collected from solid waste facilities receiving drill cuttings and drilling waste, including, at a minimum, the presence of heavy metals, petroleum related chemicals, barium, chlorides, radium and radon”. This portion of the study addresses the radioactive concerns of leachate of landfills that accept drill cuttings. During the study, samples were tested for Gross alpha, Gross beta, Radium-226, Radium-228, Strontium-90 and Radon.
Four landfills with the highest monthly tonnages for drill cuttings were selected for evaluation. For comparison purposes, two additional landfills were selected that have not historically received drill cutting materials. The waste water treatment systems that service these facilities were also evaluated as part of this study. Each of these locations had samples taken twice. Once during the fall/winter 2014 and once during the spring 2015.
For further comparison and evaluation, drill cuttings were collected and analyzed for the same parameters. Two sets of drill cuttings from vertical drilling operations were collected, one during the air drilling segment, the second during the mud drilling segment. Three representative sets of drill cuttings from horizontal drilling activities within the Marcellus Shale formation were collected.
For comparison purposes, comparison levels were set by using West Virginia (WV) Water Quality Standards (WQS) and other sources. Both landfills that accept drill cuttings and landfills that don’t had results that exceeded the comparison levels established by the study. Only one sample for a Publicly Owned Treatment Works (POTW)/Onsite Treatment Facility exceeded a comparison level and that was for a POTW that services a landfill that does not accept drill cuttings. All horizontal drill cutting samples exceeded the combined radium comparison level. None of the vertical drill cuttings exceeded the comparison levels. The following conclusions have been made concerning the radioactive concerns of drill cuttings being deposited at landfills in West Virginia:
1. Radioactive compounds are present in landfill leachate above WQS. 2. Radioactive compound levels in landfill leachate are at similar levels at both landfills
that accept drill cuttings, and landfills that don’t accept drill cuttings. 3. Radioactive compounds were not recorded at any of the POTW’s associated with
landfills that accept drill cuttings above the WQS. 4. Drill cuttings from the Marcellus Shale formation contain radioactive compounds at
levels higher than the overlying strata, and are likely contributing to radioactive compounds present in landfill leachate. However, radioactive compounds are found at landfills that don’t accept drill cuttings, therefore it can be expected that radioactive compounds present in landfill leachate, at landfills that accept drill cuttings, are also the result of other materials being accepted in the landfill.

5. Radon in landfill leachate is present, however, no WQS or drinking water standard has been set. Radon levels recorded are significantly below proposed federal drinking water standards.
Introduction/Background
During the West Virginia 2014 legislative session, House Bill 4411 and Senate Bill 474 were passed, updating requirements for legal disposal of drill cuttings and associated drilling waste from natural gas well sites. This waste disposal is regulated by the West Virginia Department of Environmental Protection (WVDEP). This legislation charged the WVDEP to undertake horizontal drilling waste disposal studies, which included four specific topics. A fifth specific topic was added by the legislature after passage of the Bill. This report addresses the radioactive aspects of study topic one. Study topic one asks the WVDEP to study the “Hazardous characteristics of leachate collected from solid waste facilities receiving drill cuttings and drilling waste, including, at a minimum, the presence of heavy metals, petroleum related chemicals, barium, chlorides, radium and radon”. This report addresses the radioactive concerns associated with the legislative request and WVDEP study.
Radioactivity
Radioactivity is defined as “the phenomenon, exhibited by and being a property of certain elements, of spontaneously emitting radiation resulting from changes in the nuclei of atoms of the element” (Definition of Radioactivity, 2015). Radioactivity permeates the environment. Depending on the specific locations, radiation levels vary.
Naturally Occurring Radioactive Material (NORM) are present throughout the environment. Individuals come in contact with NORM in various activities. With respect to natural gas drilling operations, the production of Technologically Enhanced NORM (TENORM) occurs. TENORM is produced when drilling operations bring to the surface NORM that naturally occurs in material such as Marcellus shale (United States Environmental Protection Agency, 2015).
Radioactive units
There are different units of measure for radiation depending on what aspect is being measured. The Centers for Disease Control and Prevention (CDC) give the following definitions for measuring radiation:
Measuring Emitted Radiation
“When the amount of radiation being emitted or given off is discussed, the unit of measure used is the conventional unit Curie (Ci) or the International System (SI) unit Becquerel (Bq).
A radioactive atom gives off or emits radioactivity because the nucleus has too many particles, too much energy, or too much mass to be stable. The nucleus breaks down, or disintegrates, in an attempt to reach a nonradioactive (stable) state. As the nucleus disintegrates, energy is released in the form of radiation.

The Ci or Bq is used to express the number of disintegrations of radioactive atoms in a radioactive material over a period of time. For example, one Ci is equal to 37 billion (37 X 109) disintegrations per second. The Ci is being replaced by the Bq. Since one Bq is equal to one disintegration per second, one Ci is equal to 37 billion (37 X 109) Bq.
Ci or Bq may be used to refer to the amount of radioactive materials released into the environment. For example, during the Chernobyl power plant accident that took place in the former Soviet Union, an estimated total of 81 million Ci of radioactive cesium (a type of radioactive material) was released.” (Centers for Disease Control and Prevention, 2014)
Measuring Radiation Dose
“When a person is exposed to radiation, energy is deposited in the tissues of the body. The amount of energy deposited per unit of weight of human tissue is called the absorbed dose. Absorbed dose is measured using the conventional Radiation Absorbed Dose (rad) or the SI Gray (Gy).
The rad was the conventional unit of measurement, but it has been replaced by the Gy. One Gy is equal to 100 rad.” (Centers for Disease Control and Prevention, 2014)
Measuring Biological Risk
“A person's biological risk (that is, the risk that a person will suffer health effects from an exposure to radiation) is measured using the conventional unit Roentgen Equivalent Man (rem) or the SI unit Sievert (Sv).
To determine a person's biological risk, scientists have assigned a number to each type of ionizing radiation (alpha and beta particles, gamma rays, and x-rays) depending on that type's ability to transfer energy to the cells of the body. This number is known as the Quality Factor (Q).
When a person is exposed to radiation, scientists can multiply the dose in rad by the quality factor for the type of radiation present and estimate a person's biological risk in rems. Thus, risk in rem = rad X Q.
The rem has been replaced by the Sv. One Sv is equal to 100 rem.” (Centers for Disease Control and Prevention, 2014)
Measuring Radiation Exposure
The traditional unit for measuring radiation exposure is the Roentgen (R). It is an expression of the amount of x- and gamma-ray measurements. (Shapiro, 2002)

Comparison of Marcellus shale to other shale units and associated geologic layers regarding NORM levels
Marcellus shale is a Middle Devonian shale in the Appalachian basin. It extends east-west from eastern New York to central Ohio and north-south from north-central New York to northern Tennessee. Its thickness ranges up to 700 feet, with the thickest areas on the east and thinnest areas on the west. (United States Geological Survey, 2013)
“Black shale, such as the Marcellus, often contains trace levels of 238U, 235U, 40K, and 232Th in higher concentrations than found in less organic-rich grey shales, sandstone, or limestone. This is because: 1) 238U and 235U preferentially bond to organic matter, like algae that die and settle to the bottom of the ocean; and 2) 40K and 232Th preferentially bond to clays, which compose much of the sediment at the ocean floor. Ultimately, because “black shales” contain more organic matter and clays, they are generally more radioactive than other shales or sedimentary rocks.” (Museum of the Earth, 2011)
The decay sequence for Uranium-238 (U 238) and Thorium-232(Th 232) is shown figure 1. As the figure shows, U 238 and Th 232 are the parent radioactive elements that the other radioactive elements derive from. Radioactivity within the Marcellus shale is considered consistent throughout the extent of the shale. (Resnikoff, Alexandrova, & Travers, 2010, p. 5)
Figure 1: Radioactive Decay in Thorium and Uranium Series (World Nuclear Association, 2015)

As isotopes of radium are formed within the Marcellus shale, they can form salts. Radium and these salts are soluble in water (United States Environmental Protection Agency, 2012). As liquids are used in the drilling process, this dissolved radium is brought to the surface. If liquids (i.e. drilling mud) are recycled in the drilling process, which is often the case, the concentration of dissolved radium increases.
Identification of elements associated with NORM, and the properties of such elements
The following radioactive elements were sampled for during this study: Radium-226, Radium-228, Strontium-90 and Radon. The properties associated with these elements are listed below:
Radium (Radium-226 / Radium-228):
“Radium is a naturally radioactive, silvery-white metal when freshly cut. It blackens on exposure to air.
Purified radium and some radium compounds glow in the dark (luminesce). The radiation emitted by radium can also cause certain materials, called "phosphors" to emit light. Mixtures of radium salts and appropriate phosphors were widely used for clock dials and gauges before the risks of radium exposure were understood.
Metallic radium is highly chemically reactive. It forms compounds that are very similar to barium compounds, making separation of the two elements difficult.
The various isotopes of radium originate from the radioactive decay of uranium or thorium. Radium-226 is found in the uranium-238 decay series, and radium-228 and -224 are found in the thorium-232 decay series.
Radium-226, the most common isotope, is an alpha emitter, with accompanying gamma radiation, and has a half-life of about 1600 years. Radium-228, is principally a beta emitter and has a half-life of 5.76 years. Radium-224, an alpha emitter, has a half-life of 3.66 days. Radium decays to form isotopes of the radioactive gas radon, which is not chemically reactive. Stable lead is the final product of this lengthy radioactive decay series.” (United States Environmental Protection Agency, 2012)
Strontium-90:
“Non-radioactive strontium and its radioactive isotopes have the same physical properties. Strontium is a soft metal similar to lead. Strontium is chemically very reactive, and is only found in compounds in nature.
When freshly cut, it has a silvery luster, but rapidly reacts with air and turns yellow. Finely cut strontium will burst into flame in air. Because of these qualities, it is generally stored in kerosene.
Strontium-90 emits a beta particle with, no gamma radiation, as it decays to yttrium-90 (also a beta-emitter). Strontium-90 has a half-life of 29.1 years. It behaves chemically much like

calcium, and therefore tends to concentrate in the bones and teeth.” (United States Environmental Protection Agency, 2012)
Strontium-90 does not occur naturally but is the by-product of the fission of uranium and plutonium in nuclear reactors and in nuclear weapons. (United States Environmental Protection Agency, 2012)
Radon:
“Radon is a noble gas, which means it is basically inert (does not combine with other chemicals). Radon is a heavy gas and tends to collect in basements or other low places in housing. It has no color, odor, or taste. Radon-222 is produced by the decay of radium, has a half-life of 3.8 days, and emits an alpha particle as it decays to polonium-218, and eventually to stable lead. Radon-220, is the decay product of thorium – it is sometimes called thoron, has a half-life of 54.5 seconds and emits an alpha particle in its decay to polonium-216.” (United States Environmental Protection Agency, 2013)
In addition the four radioactive elements, Gross alpha and Gross beta test were performed on the samples collected. These tests measure the amount of alpha and beta particles. The tests themselves do not identify what radioactive elements emitted the alpha or beta particles, only that they are present. These test can be looked at as a screening method.
Hazardous characteristics of radioactive elements studied
According to the United States Environmental Protection Agency (US EPA), the hazardous characteristics of the radioactive elements sampled for are as follows:
Radium-226/228
“Radium emits several different kinds of radiation, in particular, alpha particles and gamma rays. Alpha particles are generally only harmful if emitted inside the body. However, both internal and external exposure to gamma radiation is harmful. Gamma rays can penetrate the body, so gamma emitters like radium can result in exposures even when the source is a distance away.
Long-term exposure to radium increases the risk of developing several diseases. Inhaled or ingested radium increases the risk of developing such diseases as lymphoma, bone cancer, and diseases that affect the formation of blood, such as leukemia and aplastic anemia. These effects usually take years to develop. External exposure to radium's gamma radiation increases the risk of cancer to varying degrees in all tissues and organs.
However, the greatest health risk from radium is from exposure to its radioactive decay product radon. It is common in many soils and can collect in homes and other buildings.” (United States Environmental Protection Agency, 2012)

Strontium-90
“Strontium-90 is chemically similar to calcium, and tends to deposit in bone and blood-forming tissue (bone marrow). Thus, strontium-90 is referred to as a "bone seeker." Internal exposure to Sr-90 is linked to bone cancer, cancer of the soft tissue near the bone, and leukemia.
Risk of cancer increases with increased exposure to Sr-90. The risk depends on the concentration of Sr-90 in the environment, and on the exposure conditions.” (United States Environmental Protection Agency, 2012)
Radon
“Almost all risk from radon comes from breathing air containing radon and its decay products. The health risk of ingesting (swallowing) radon, in water for example, is much smaller than the risk of inhaling radon and its decay products.
When radon is inhaled, the alpha particles from its radioactive decay directly strike sensitive lung tissue causing damage that can lead to lung cancer. However, since radon is a gas, most of it is exhaled. The radiation dose comes largely from radon's decay products. They enter the lungs on dust particles that lodge in the airways of the lungs. These radionuclides decay quickly, exposing lung tissue to damage and producing other radionuclides that continue damaging the lung tissue.
There is no safe level of radon any exposure poses some risk of cancer. The National Academy of Sciences (NAS) studied and reported on the causes of lung cancer in two 1999 reports. They concluded that radon in indoor air is the second leading cause of lung cancer in the U.S. after cigarette smoking.
The NAS estimated that 15,000-22,000 Americans die every year from radon-related lung cancer. When people who smoke are exposed to radon as well, the risk of developing lung cancer is significantly higher than the risk of smoking alone.
The NAS also estimated that radon in drinking water causes an additional 180 cancer deaths per year. However, almost 90% of those deaths were from lung cancer caused by inhaling radon released to the indoor air from water. Only about 10% of the deaths were from cancers of internal organs, mostly the stomach, caused by ingesting radon in water.” (United States Environmental Protection Agency, 2013)
This study sampled for radon levels in the landfill leachate and discharge from POTWs/Onsite Treatment Works. Drill cuttings were not sampled for Radon, since they are solids. Radon air samples were not taken because it was not within the scope of this study.
Radioactivity effects of drill cuttings being collected/disposed in one location
Landfills that accept drill cuttings are required to sample for radioactive materials once a month. They sample for Gross alpha, Gross beta, Radium-226, Radium-228 and Strontium-90. Marshall University’s College of Information Technology and Engineering (CITE) analyzed these

sample results to determine if any statistical trends could be determined. Based on the quality of the data and their analysis, they concluded:
- No radioactive constituent showed evidence of accelerated increase over time - Radioactive constituents showed steady levels or normal up-down fluctuations over time
The following radioactive constituents showed slight positive trends:
- Northwestern Landfill: Gross beta - Short Creek Landfill: Gross beta - Wetzel County Landfill: Radium-226
The following is general analysis of the sampling:
- Gross alpha - 89% of the time below comparison level of 15 pCi/l - Gross beta – 98% of the time below comparison level of 1000 pCi/l - Combined Radium-226/228 – 59% of the time below comparison level of 5 pCi/l - Strontium-90 – 99% of the time was below comparison level of 8 pCi/l
Evaluation of radioactive monitoring required at landfills accepting drill cuttings
When drill cuttings from horizontal wells arrives at a landfill, the following monitoring and sampling requirements are currently in place:
Remote monitors: In 2014, the Solid Waste Management Act – WV Code 22-15-8 required monitoring of drill cuttings as they enter the landfill using remote radiation sensors. WV DEP established the rules in 33CSR1. In section 5.6.d.4 it states: “If a load of drilling cuttings or associated drilling waste is confirmed to be less than ten microroentgens per hour (10 µR/hr.) above average local background level, the waste may be disposed of in the facility. If the load of waste is confirmed to be equal to or greater than 10 µR/hr. above average local background level, the combined concentration of Radium-226 and Radium-228 must be determined. The combined concentration must be analyzed by a State approved method. If the combined concentration in the waste is less than five picocuries per gram (5pCi/gr.) above average local background level, the waste may be disposed in the facility. If the values are greater than 5pCi/gr. above average local background level, the load must be rejected.”
Monthly Sampling of Leachate: WV DEP has required landfills that collect drill cuttings to sample and test for Gross Alpha, Gross Beta, Radium-226, Radium-228 and Strontium-90 on a monthly schedule. This data has been collected and stored by WV DEP. This sampling requirement does not have limits that would trigger cleanup or enforcement actions. Landfills are not required to sample for radioactive compounds or gross alpha or gross beta at their groundwater monitoring wells.
Publically Owned Treatment Works (POTW) or Onsite Treatment: POTWs or onsite treatment facilities are not required to monitor or report the discharge of radioactive elements or gross

alpha or gross beta as part of their National Pollutant Discharge Elimination System (NPDES) permit.
Standards for perspective and comparison
Water Quality Standards (WQS) for radioactive parameters (liquids): In order to provide perspective and comparison for the liquids associated with leachate and POTW/Onsite Treatment Works discharges, the West Virginia WQS, West Virginia Code 47CSR2 is provided for applicable radioactive parameters. This standard establishes allowable limits of particular compounds allowed to be discharged directly into WV streams. The standard for Radium-226 and Radium-228 is 5 pCi/l combined. The standard for Strontium-90 is 10 pCi/l dissolved, except for the Ohio River main stream, which is 8pCi/l total. Since all but one of the discharges sampled in this study discharge directly to the Ohio River, the 8pCi/l value was used. Gross total alpha is 15pCi/l and gross beta is 1000 pCi/l.
There is not a WQS for Radon. However, US EPA proposed a regulation on November 2, 1999 in the Federal Register (64 FR 59246) to set levels for Radon in water and establish enforcement. As part of this proposed rule, water systems at or below 300 pCi/l would not be required to treat for Radon. (United States Environmental Protection Agency, 2014) For purposes of this study, the 300 pCi/l was used for comparison purposes.
Standards for radioactive parameters (solids): In order to provide perspective and comparison of the solids associated with drill cuttings, the following levels have been used. For combined Radium-226 and Radium-228 a level of 5 pCi/g is used for comparison. The level has been established as part of the screening method within WV Code 22-15-8, Solid Waste Management Act, for drill cuttings entering a landfill. It must be noted that, within the context of the Act, this screening level is only initiated if the load of drill waste triggers the remote radiation sensors, which are set at 10 µR/hr. The 5 pcCi/g level is in line with cleanup standards set by the US EPA at CERCLA (Superfund) sites (40 CFR Part 192).
WV does not have a standard for Strontium-90. However, at the Brookhaven National Laboratory in New York, the cleanup levels were established for residential land use at 15 pCi/g. This level was established based on impacts to groundwater at the site (The Interstate Technology and Regulatory Council: Radionuclides Team, 2002). For comparison purposes, a level of 15pCi/g will be used.
No standards are established for soils for Gross Alpha and Gross Beta.
Sampling completed during the project
The four landfills with the highest monthly tonnages for drill cuttings were selected for evaluation. For comparison purposes, two additional landfills were selected that have not historically received drill cutting materials. The waste water treatment systems that service these facilities were also evaluated as part of this study. The six landfills and associated information are provided on the following table:

Landfill / Location Waste Water Treatment Facility / Discharge Stream
Drill Cutting Disposal Information
Leachate Characteristics
Short Creek Landfill / Wheeling
Wheeling POTW / Ohio River
Drill cuttings mixed with municipal solid waste
Leachate collected separately from active disposal cell and closed cell1
Wetzel County Landfill / New Martinsville
On-site Waste Water Treatment Facility / Ohio River
Drill cuttings mixed with municipal solid waste
All leachate passes through on-site treatment facility
Northwestern Landfill / Parkersburg
Parkersburg POTW / Ohio River
Drill cuttings mixed with municipal solid waste
Leachate collected from active disposal cell
Meadowfill Landfill / Bridgeport
Bridgeport POTW / Simpson Creek
Drill cuttings placed in separate cell
Leachate collected from separate cell2
Charleston Landfill / Charleston
Charleston POTW / Kanawha River
Does not currently accept drill cutting materials
Leachate collected from active disposal cell
Raleigh County Landfill / Beckley
North Beckley POTW / Cranberry Creek
Does not currently accept drill cutting materials
Leachate collected from active disposal cell
1 Active cell includes drill cuttings; closed cell did not historically receive drill cuttings 2 Leachate not subject to municipal solid waste contact
Below are the results from sampling taken during this study. Highlighted results exceed the WV WQS.
Gross Alpha Landfill Leachate Fall/Winter 2014/15 Spring 2015 Associated POTW Fall/Winter 2014/15 Spring 2015
Meadowfill 5.36 ± 2.21 (2.86) 3.52 ± 1.77 (2.50) Bridgeport 0.156 ± 1.40 (2.99) -0.496 ± 1.31 (2.86)
Northwestern -10.7 ± 33.1 (65.8) 12.8 ± 4.34 (4.52) Parkersburg -1.44 ± 1.48 (3.25) 0.426 ± 0.648 (1.20)
Short Creek 9.15 ± 22.3 (42.5) 5.55 ± 4.06 (6.62) Wheeling 0.877 ± 1.34 (2.48) 0.428 ± 1.05 (2.01)
Wetzel County 6.26 ± 4.40 (7.32) 18.4 ± 15.9 (27.3) On-Site 3.56 ± 4.38 (7.93) 9.03 ± 5.85 (9.21)
Charleston Landfill 7.55 ± 3.25 (2.94) 7.14 ± 3.00 (4.11) Charleston 1.35 ± 1.46 (2.88) 0.928 ± 1.39 (2.97)
Raleigh County Landfill 6.06 ± 4.65 (7.86) 2.61 ± 1.37 (1.96) North Beckley -0.900 ± 1.34 (2.97) -0.722 ± 1.04 (2.18)
Short Creek Closed Cell 4.35 ± 12.8 (24.3) 3.16 ± 2.43 (4.07)
Units are pCi/L Act ± Unc (MDC)
WQS: 15 pCi/l

Gross Beta Landfill Leachate Fall/Winter 2014/15 Spring 2015 Associated POTW Fall/Winter 2014/15 Spring 2015
Meadowfill 136 ± 73.2 (120) 280 ± 55.7 (29.3) Bridgeport 5.38 ± 1.63 (2.07) 6.09 ± 1.73 (2.08)
Northwestern 1,174 ± 214 (24.3) 776 ± 141 (16.0) Parkersburg 8.74 ± 2.48 (2.97) 4.79 ± 1.42 (1.81)
Short Creek 265 ± 52.0 (21.9) 154 ± 30.0 (12.8) Wheeling 7.04 ± 1.46 (0.900) 3.90 ± 1.10 (1.31)
Wetzel County 34.3 ± 7.65 (6.10) 56.2 ± 13.7 (13.6) On-Site 38.9 ± 8.84 (7.18) 28.3 ± 6.61 (5.75)
Charleston Landfill 124 ± 23.0 (5.19) 77.5 ± 14.4 (2.86) Charleston 5.37 ± 1.50 (1.44) 4.64 ± 1.51 (1.87)
Raleigh County Landfill 81.4 ± 15.2 (3.43) 121 ± 22.6 (5.34) North Beckley 4.67 ± 1.03 (0.811) 8.47 ± 2.23 (2.60)
Short Creek Closed Cell 114 ± 22.0 (8.04) 54.6 ± 11.1 (7.01)
Units are pCi/L Act ± Unc (MDC)
WQS: 1000pCi/l
Radium-226 Landfill Leachate Fall/Winter 2014/15 Spring 2015 Associated POTW Fall/Winter 2014/15 Spring 2015
Meadowfill 3.23 ± 2.14 (0.973) 1.26 ± 0.833 (0.378)
Bridgeport 1.67 ± 1.72 (0.906) 0.742 ± 1.13 (0.670)
Northwestern 11.1 ± 3.36 (0.613) 5.05 ± 2.10 (0.570)
Parkersburg 0.342 ± 0.319 (0.420) 0.310 ± 0.708 (0.420)
Short Creek 4.70 ± 2.61 (0.979) 1.67 ± 1.54 (0.907)
Wheeling 0.290 ± 0.349 (0.533) 0.210 ± 0.320 (0.515)
Wetzel County 5.47 ± 2.48 (0.741) 1.18 ± 1.01 (1.22)
On-Site 3.87 ± 2.47 (2.57) 0.582 ± 0.809 (1.16)
Charleston Landfill 2.83 ± 1.99 (0.958) 1.24 ± 0.999 (0.558)
Charleston 0.102 ± 0.464 (0.943) 1.83 ± 1.28 (0.618)
Raleigh County Landfill 2.25 ± 1.30 (0.507) 10.6 ± 10.7 (14.0)
North Beckley 0.483 ± 0.738 (0.437) 1.09 ± 0.831 (0.967)
Short Creek Closed Cell 5.01 ± 2.45 (0.798) 2.61 ± 1.28 (0.416)
Units are pCi/L Act ± Unc (MDC)
WQS: 5 pCi/l (combined with 228)

Radium-228 Landfill Leachate Fall/Winter 2014/15 Spring 2015 Associated POTW Fall/Winter 2014/15 Spring 2015
Meadowfill 1.41 ± 1.34 (2.66) 1.18 ± 0.553 (0.923)
Bridgeport 0.381 ± 0.389 (0.787) 0.519 ± 0.440 (0.885)
Northwestern 6.33 ± 1.44 (1.18) 3.27 ± 0.868 (0.921)
Parkersburg 0.543 ± 0.514 (1.02) -0.291 ± 0.380 (0.969)
Short Creek 4.35 ± 2.92 (5.39) 2.37 ± 1.81 (3.56) Wheeling 0.203 ± 0.369 (0.798) 0.163 ± 0.383 (0.849)
Wetzel County 0.751 ± 2.39 (5.23) 1.45 ± 0.529 (0.771)
On-Site -0.835 ± 1.31 (3.09) 0.503 ± 0.401 (0.791)
Charleston Landfill 1.79 ± 0.881 (1.43) 1.94 ± 0.933 (1.49)
Charleston 0.0796 ± 0.344 (0.759) 0.704 ± 0.440 (0.806)
Raleigh County Landfill 0.906 ± 0.797 (1.59) 10.2 ± 10.6 (20.9) North Beckley 0.139 ± 0.490 (1.08) 1.12 ± 0.603 (1.06)
Short Creek Closed Cell 2.17 ± 2.29 (4.51) 1.30 ± 0.582 (0.959)
Units are pCi/L Act ± Unc (MDC)
WQS: 5 pCi/l (combined with 226)
Strontium-90 Landfill Leachate Fall/Winter 2014/15 Spring 2015 Associated POTW Fall/Winter 2014/15 Spring 2015
Meadowfill 0.775 ± 0.617 (1.05) -0.131 ± 0.651 (1.14)
Bridgeport 0.0520 ± 0.429 (0.775) -0.0720 ± 0.579 (1.01)
Northwestern 0.566 ± 0.815 (1.37) 0.0440 ± 0.747 (1.29)
Parkersburg -0.549 ± 0.901 (1.58) -0.00400 ± 0.866 (1.58)
Short Creek -0.753 ± 0.596 (1.11) -0.0800 ± 1.45 (2.66)
Wheeling 0.241 ± 0.648 (1.16) 0.386 ± 0.862 (1.54)
Wetzel County -0.107 ± 0.857 (1.48) 1.09 ± 1.08 (1.94) On-Site -0.757 ± 0.831 (1.46) 5.78 ± 1.49 (1.78)
Charleston Landfill 1.34 ± 0.748 (1.22) 0.760 ± 1.20 (2.13)
Charleston 0.881 ± 0.781 (1.60) 0.704 ± 0.440 (0.806)
Raleigh County Landfill 3.64 ± 0.917 (1.05) -0.275 ± 0.764 (1.33)
North Beckley 41.7 ± 6.78 (1.15) -0.322 ± 0.796 (1.39)
Short Creek Closed Cell 0.188 ± 0.555 (0.998) -1.01 ± 0.921 (1.73)
Units are pCi/L Act ± Unc (MDC)
WQS: 8 pCi/l (Ohio River)

Radon Landfill Leachate Fall/Winter 2014/15 Spring 2015 Associated POTW Fall/Winter 2014/15 Spring 2015
Meadowfill 38.7 ± 47.4 (78.6) 41.3 ± 29.9 (47.0)
Bridgeport 27.1 ± 47.2 (79.3) 19.7 ± 28.1 (47.1)
Northwestern -45.3 ± 41.3 (74.6) 34.0 ± 29.5 (47.5)
Parkersburg -45.4 ± 41.2 (74.4) -0.7 ± 27.1 (47.6)
Short Creek -87.5 ± 63.9 (117) -34.0 ± 28.1 (51.0)
Wheeling 1.1 ± 66.3 (116) -3.7 ± 28.9 (50.8)
Wetzel County 4.8 ± 39.8 (69.0) 33.3 ± 34.9 (57.3) On-Site -41.8 ± 38.4 (69.4) -25.4 ± 31.9 (57.5)
Charleston Landfill -14.5 ± 40.1 (69.6) 28.4 ± 25.2 (40.8) Charleston 35.3 ± 41.2 (68.3) 11.9 ± 24.0 (40.8)
Raleigh County Landfill -18.8 ± 25.4 (45.9) -37.8 ± 24.2 (44.1)
North Beckley 4.0 ± 26.2 (45.4) -7.9 ± 24.8 (43.9)
Short Creek Closed Cell -63.6 ± 64.0 (117) -2.8 ± 29.0 (50.9)
Units are pCi/L Act ± Unc (MDC)
EPA Proposed: 300 pCi/l
Drill cuttings were sampled from five wells while drilling operations were being conducted. Two sets of drill cuttings from vertical drilling operations were collected, one during the air drilling segment, the second during the mud drilling segment. Three representative sets of drill cuttings from horizontal drilling activities within the Marcellus Shale formation were collected. The five drilling locations used for this study are depicted on the map provided. Information on each well sampled is provided on the following table:
Well I.D. / Well Pad API Number Sampling Depths (approximate)
Drilling Details
Morton 1H 47-017-06559 6,856 ft. Horizontal drilling within Marcellus Shale, mud drilled
McGee Unit 2H 47-017-06622 6,506 ft. Horizontal drilling within Marcellus Shale, mud drilled
Wentz 1H 47-017-06476 8,119 ft. Horizontal drilling within Marcellus Shale, mud drilled
Sheep Run 2H 47-017-06658 650 to 990 ft. Vertical air drilling Bierstadt 2H 47-017-06562 3,000 to 6,000 ft. Vertical mud drilling
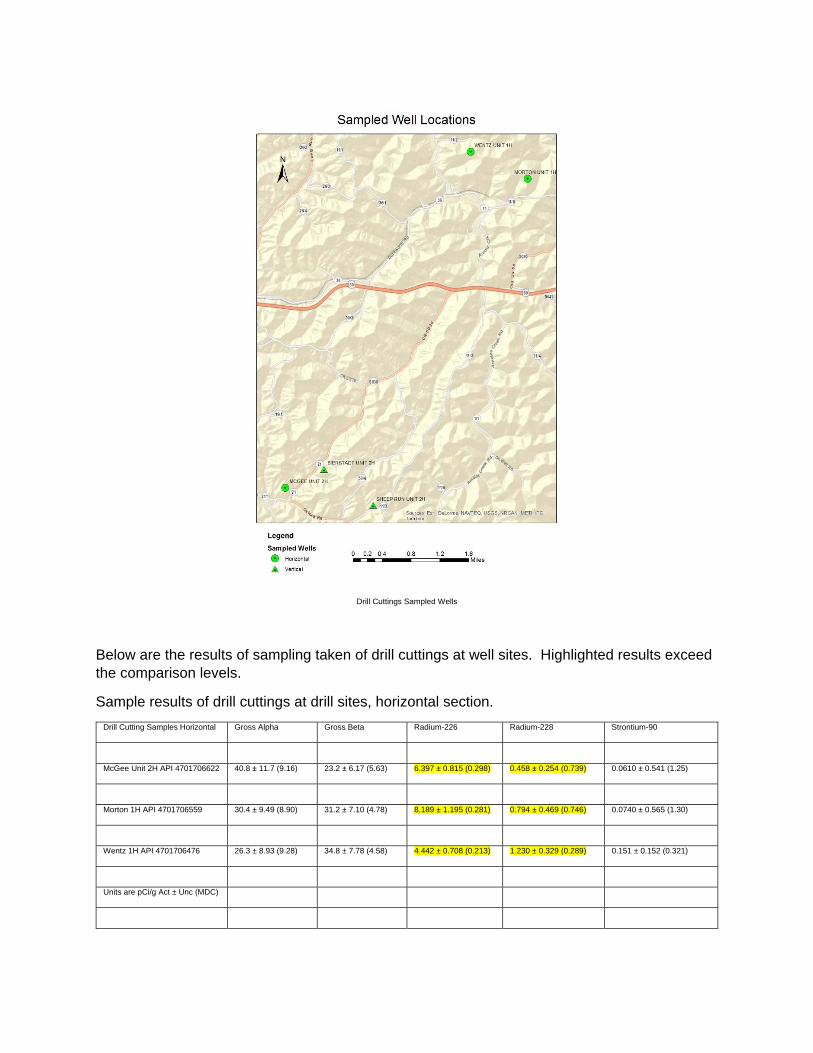
Drill Cuttings Sampled Wells
Below are the results of sampling taken of drill cuttings at well sites. Highlighted results exceed the comparison levels.
Sample results of drill cuttings at drill sites, horizontal section. Drill Cutting Samples Horizontal Gross Alpha Gross Beta Radium-226 Radium-228 Strontium-90
McGee Unit 2H API 4701706622 40.8 ± 11.7 (9.16) 23.2 ± 6.17 (5.63) 6.397 ± 0.815 (0.298) 0.458 ± 0.254 (0.739) 0.0610 ± 0.541 (1.25)
Morton 1H API 4701706559 30.4 ± 9.49 (8.90) 31.2 ± 7.10 (4.78) 8.189 ± 1.195 (0.281) 0.794 ± 0.469 (0.746) 0.0740 ± 0.565 (1.30)
Wentz 1H API 4701706476 26.3 ± 8.93 (9.28) 34.8 ± 7.78 (4.58) 4.442 ± 0.708 (0.213) 1.230 ± 0.329 (0.289) 0.151 ± 0.152 (0.321)
Units are pCi/g Act ± Unc (MDC)

Sample results of drill cuttings at drill sites, vertical section. Drill Cutting Samples Vertical Gross Alpha Gross Beta Radium-226 Radium-228 Strontium-90
Bierstadt 2H 4701706562 (Mud) 17.8 ± 8.09 (11.0) 18.5 ± 4.92 (4.70) 1.996 ± 0.427 (0.217) 2.112 ± 0.472 (0.234) 0.0130 ± 0.0794 (0.195)
Sheep Run 2H API 4701706658 (Air)
13.1 ± 6.97 (10.8) 15.8 ± 4.79 (5.57) 1.408 ± 0.288 (0.182) 1.993 ± 0.432 (0.160) -0.0531 ± 0.0918 (0.254)
Units are pCi/g Act ± Unc (MDC)

Conclusions and Recommendations
Conclusions
1. Radioactive compounds are present in landfill leachate above WQS.
2. Radioactive compound levels in landfill leachate are at similar levels at both landfills that accept drill cuttings, and landfills that don’t accept drill cuttings.
3. Radioactive compounds were not recorded at any of the POTW’s associated with landfills that accept drill cuttings above the WQS.
4. Drill cuttings from the Marcellus Shale formation contain radioactive compounds at
levels higher than the overlying strata, and are likely contributing to radioactive compounds present in landfill leachate. However, radioactive compounds are found at landfills that don’t accept drill cuttings, therefore it can be expected that radioactive compounds present in landfill leachate, at landfills that accept drill cuttings, are also the result of other materials being accepted in the landfill.
5. Radon in landfill leachate is present, however, no WQS or drinking water standard
has been set. Radon levels recorded are significantly below proposed federal drinking water standards.
Recommendations
1. Monitoring for radiological compounds in landfill leachate should continue, as it cannot be determined if continued disposal of drill cuttings will over time increase radiological compound levels. Frequency of monitoring should be reduced, as no trends have been observed that suggest radiological compounds have increased at a significant rate during the short-term time period of drill cuttings being accepted into landfills. While a slight increase in gross beta and radium 226 has been observed, these slight increases can be tracked as part of continued monitoring.
2. Strontium-90 should not be monitored, as it has not been shown to be a radiological compound of concern for landfill leachate where drill cuttings are being accepted.
3. Periodic monitoring of landfill groundwater monitoring wells for radiological
parameters should be considered, to monitor long-term radiological compounds that may impact groundwater in the immediate vicinity.
4. As part of the renewal process for NPDES permitting at POTW’s or waste water
treatment facilities associated with landfills that accept drill cuttings, testing of radiological compounds should be considered to ensure levels are not approaching the WQS.

References Centers for Disease Control and Prevention. (2014, October 17). Measuring Radiation. Retrieved from
Emergency Preparedness and Response: http://www.bt.cdc.gov/radiation/measurement.asp
Definition of Radioactivity. (2015). Retrieved from Dictionary.com:
http://dictionary.reference.com/browse/radioactivity
Museum of the Earth. (2011). Understanding Naturally Occurring Radioactive Material in the Marcellus
Shale. Marcellus Shale, 1‐8.
Resnikoff, M., Alexandrova, E., & Travers, J. (2010). Radioactivity in Marcellus Shale. New York:
Radioactive Waste Management Associates.
Shapiro, J. (2002). Radiation Protection: A Guide For Scientists, Regulators, And Physicians (4th ed.).
Cambridge: Harvard University Press.
The Interstate Technology and Regulatory Council: Radionuclides Team. (2002). Determining Cleanup
Goals at Radioactively Contaminated Sites: Case Studies.
United States Environmental Protection Agency. (2012, March 6). Radium. Retrieved from Radiation
Protection: http://www.epa.gov/radiation/radionuclides/radium.html
United States Environmental Protection Agency. (2012, April 24). Strontium. Retrieved from Radiation
Protection: http://www.epa.gov/radiation/radionuclides/strontium.html
United States Environmental Protection Agency. (2013, February 13). Radon. Retrieved from Radiation
Protection: http://www.epa.gov/radiation/radionuclides/radon.html
United States Environmental Protection Agency. (2014, June 30). Proposed Radon in Drinking Water
Regulation. Retrieved from Radon:
http://water.epa.gov/lawsregs/rulesregs/sdwa/radon/regulations.cfm
United States Environmental Protection Agency. (2015, April 21). Technologically‐Enhanced, Naturally‐
Occurring Radioactive Materials. Retrieved from Radiation Protection:
http://www.epa.gov/radiation/tenorm/index.html
United States Geological Survey. (2013). Characterization of the Marcellus Shale Based on Computer‐
Assisted Correlation of Wireline Logs in Virginia and West Virginia. Reston: United States
Geological Survey.
World Nuclear Association. (2015). Radioactive Decay in Thorium and Uranium Series.

Appendix I
Evaluation of the Feasibility of a Gas Industry Owned and Operated Dedicated Drill Cuttings Landfill (Compiled by Marshall University Center for Business and Economic Research)

Evaluation of the Feasibility of a Gas Industry Owned and Operated Dedicated Drill Cuttings Landfill
i
Evaluation of the Feasibility of a Gas Industry Owned and Operated Dedicated Drill Cuttings Landfill
June 26, 2015

Evaluation of the Feasibility of a Gas Industry Owned and Operated Dedicated Drill Cuttings Landfill
ii
Evaluation of the Feasibility of a Gas Industry Owned and Operated Dedicated Drill Cuttings Landfill
Christine Risch
Director of Resource & Energy Economics
Jennifer M. Shand, Ph.D. Director
Justin Matthews Research Associate
Alicia Copley
Research Assistant
Prepared for: West Virginia Department of Environmental Protection
907 Third Avenue, Suite 240 | Huntington, WV 25701
p 304.528.7201 | f 304.522.0024 | [email protected]
The contents of this report reflect the views of the authors, who are responsible for the accuracy of the data presented herein. The views expressed in this report are those of the authors and do not reflect the official policy or position of Marshall University or its governing bodies. The use of trade names, if applicable, does not signify endorsement by the authors.

Evaluation of the Feasibility of a Gas Industry Owned and Operated Dedicated Drill Cuttings Landfill
iii
Table of Contents Abstract ......................................................................................................................................................... 1
Introduction .................................................................................................................................................. 2
Regulation of Horizontal Well Drill Cuttings Disposal ............................................................................... 2
Alternative Disposal Options .................................................................................................................... 2
Background ............................................................................................................................................... 2
Data and Methodology ................................................................................................................................. 3
Production of Drill Cuttings from Gas Wells ............................................................................................. 3
Factors influencing future Marcellus and Utica Well Drilling ................................................................... 6
Marcellus Shale Build-Out Scenarios ........................................................................................................ 8
Disposal of Drill Cuttings at West Virginia Landfills .................................................................................. 9
Sources of Drill Cuttings ...................................................................................................................... 11
Motivation for supply of out-of-state tonnage ................................................................................... 12
Landfill Capacity Usage ........................................................................................................................... 13
Feasibility Analysis of a Gas Industry Owned and Operated Landfill .......................................................... 15
Key Considerations and Assumptions ..................................................................................................... 15
Landfill Costs ........................................................................................................................................... 17
Construction and Operating Expenditures ......................................................................................... 17
Landfill closure .................................................................................................................................... 19
Existing Landfill Expenditure Comparison ........................................................................................... 21
Industry Specialization ............................................................................................................................ 22
Transport Analysis ................................................................................................................................... 23
Distance Analysis ................................................................................................................................. 24
Central Location Analyses ................................................................................................................... 26
Summary ................................................................................................................................................. 26
Conclusions and Recommendations ........................................................................................................... 27

Evaluation of the Feasibility of a Gas Industry Owned and Operated Dedicated Drill Cuttings Landfill
iv
Table of Tables
Table 1: Completed Marcellus Wells in West Virginia .................................................................................. 4 Table 2: Completed Marcellus Wells in West Virginia - Largest 10 Counties by Production, 2007 to 2013 6 Table 3: Drilling Mud Share of Wastestream Composition by West Virginia Wasteshed in 2013 ............... 9 Table 4: In-State vs. Out-of-State Drill Cuttings Tonnage by Source .......................................................... 12 Table 5: Accepted Drill Cuttings Waste for WV Landfills by Source State (Tons) ....................................... 13 Table 6: WV Landfills Accepting Drill Cuttings Waste – Annual Tonnage ................................................... 14 Table 7: Landfills with Dedicated Drill Cutting Cells – Acreage Permitted and Used ................................. 14 Table 8: Landfill Feasibility Analysis – Summary of Assumptions* ............................................................. 16 Table 9: Estimated Total Landfill Construction Costs ................................................................................. 18 Table 10: Landfill Pre-construction Processes and Estimates ..................................................................... 18 Table 11: Landfill Construction Processes and Estimates ........................................................................... 18 Table 12: Landfill Excavation Processes and Estimates .............................................................................. 18 Table 13: Landfill Support Facility Construction Estimates ......................................................................... 19 Table 14: Estimated Landfill Operating Costs ............................................................................................. 19 Table 15: Estimated Total Landfill Closure Costs ........................................................................................ 20 Table 16: Landfill Closure Processes and Estimates ................................................................................... 20 Table 17: Landfill Site Security and Maintenance Estimates ...................................................................... 21 Table 18: Environmental Monitoring Estimates ......................................................................................... 21 Table 19: Industry Occupations within Gas vs. Waste Management Industries (Total Employment) ....... 22 Table 20: Average Distance Travelled – Gas Well to Landfill ...................................................................... 24
Table of Figures
Figure 1: Drilled Marcellus Shale area in West Virginia ................................................................................ 5 Figure 2: Recent Marcellus Area vs. Henry Hub Gas Prices ($/mmBtu) ....................................................... 7 Figure 3: Months from Permitting to Completion for WV Horizontal Marcellus Wells ............................... 8 Figure 4: Map of Completed Marcellus Wells and Primary Landfills Receiving Drill Cuttings .................... 10 Figure 5: Monthly Drill Cuttings Disposal in WV Landfills, Tons in 2013 & 2014 ........................................ 11 Figure 6: Cost Raster for Distance Analysis ................................................................................................. 24 Figure 7: Least-Cost Path for Distance Analysis .......................................................................................... 25 Figure 8: ESRI Network Analysis .................................................................................................................. 25

Evaluation of the Feasibility of a Gas Industry Owned and Operated Dedicated Drill Cuttings Landfill
1
Evaluation of the Feasibility of a Gas Industry Owned and Operated Dedicated Drill Cuttings Landfill
Abstract This analysis was conducted in response to a question posed by the WV Legislature regarding the feasibility of establishing separate disposal locations for drill cuttings which are funded, constructed, owned and/or operated by the oil and gas industry in West Virginia. This analysis is an estimate of the physical space required for future drill cuttings disposal as well as the cost of developing that space at current per well rates of disposal. Results place the minimum amount of needed landfill capacity at 125 acres, with a cost of $40 million for construction plus another $40 million for closure costs. Data analysis also indicates that the primary receiving landfills are currently using approximately one percent of permitted acreage for drill cuttings disposal annually. In addition, the approximate minimum average distance drill cuttings are currently transported from the well site to a landfill is 22.3 miles. If new industry-operated landfills were substituted for existing ones at least two new fills would be needed to allow well operators access to disposal locations where average transit distances are not increased. Having more than two new central landfills, or adding additional fills, could reduce the average transport distance if optimally sited.

Evaluation of the Feasibility of a Gas Industry Owned and Operated Dedicated Drill Cuttings Landfill
2
Introduction Regulation of Horizontal Well Drill Cuttings Disposal The West Virginia Department of Environmental Protection (WVDEP) regulates horizontal gas well operations via the Natural Gas Horizontal Well Control Act - W. Va. Code § 22-6A – also known as the “Horizontal Well Act”. This regulation led to the term “6A wells” to describe horizontal wells that fall under this law. The Horizontal Well Act requires that “all drill cuttings and associated drilling mud generated from horizontal well sites shall be disposed of in an approved solid waste facility, or if the surface owner consents, the drill cuttings and associated drilling mud may be managed on-site in a manner approved by the secretary (§22-6A-8).”
As defined by the WVDEP, a “6A well is any natural gas well drilled using a horizontal drilling method, and which disturbs three acres or more of surface, excluding pipelines, gathering lines and roads, or utilizes more than two hundred ten thousand gallons of water (5,000 bbls) in any thirty day period” (§22-6A-3). Conventional vertical wells drilled to the Marcellus formation are thus excluded from this definition.
This analysis focuses on drill cuttings produced from completion of wells in the Marcellus formation, although wells drilled in the Utica and other shale formations are also 6A wells. There are also shallow horizontal wells in West Virginia that do not fall under the regulation. These shallower wells target other formations above the Marcellus and are often located outside of the active Marcellus fairway of drilling activity.
Alternative Disposal Options In terms of disposal priorities, landfill disposal ranks lowest on the West Virginia Solid Waste Management Board’s (WV SWMB) waste management hierarchy. Source reduction and reuse are considered to be better options. According to the WV SWMB’s 2015 Management Report the solid waste management hierarchy is: source reduction, reuse, recycling, and landfilling.
Non-6A gas wells are allowed to utilize on-site pits for disposal for drill cuttings. While a 6A well operator is also allowed to use on-site disposal of drill cuttings with landowner approval, as of mid- 2015 no operator had requested to do so under this rule. Clearly, landfill disposal of cuttings from 6A wells is considered more feasible than getting permitted for on-site disposal. Although there are no specific guidelines in State code specifying how on-site disposal compliance would be different for a 6A well, the allowance that “if the surface owner consents, the drill cuttings and associated drilling mud may be managed on-site in a manner approved by the secretary” represents uncertainty in practice. Drill cuttings from Ohio and Pennsylvania are sometimes disposed of in landfills in West Virginia. WV-based gas operators also utilize landfills in Ohio and Pennsylvania for disposal of cuttings when location is more favorable.
Background This analysis was required as part of an amendment to Act 15 of WV State Code, the Solid Waste Management Act (§22-15-8). Item (3) of (j) instructs the WVDEP to submit a report examining “the

Evaluation of the Feasibility of a Gas Industry Owned and Operated Dedicated Drill Cuttings Landfill
3
technical and economic feasibility and benefits of establishing additional and/or separate disposal locations which are funded, constructed, owned and/or operated by the oil and gas industry.” The question of “technical and economic feasibility” is based on an estimate of the physical space that would be required for future drill cuttings disposal as well as the cost of developing that space. This necessitates producing an estimate of the number of future well completions that would produce drill cuttings for disposal. The essential question is the feasibility of vertically integrating drill cuttings disposal into oil and gas industry operations. Vertical integration is “a means of coordinating the different stages of an industry chain when bilateral trading is not beneficial.”1 In other words, if it is more cost efficient to internalize an activity then a business can take on that function. Otherwise, the business will choose to outsource the activity. Vertical integration can raise costs by requiring additional specialization to perform the new task or function2, in this case waste disposal. Vertical integration is costly and risky to implement. As such, it is in a business’ best interest to pursue only if doing so will substantially reduce uncertainty or costs in the existing market arrangement, or provide some additional benefit or profit.3
Data and Methodology This analysis develops a range of values for possible future well completions. These two values are combined with data and information from landfills that accept drill cuttings to develop an estimate of the amount of landfill capacity that would be needed if cuttings were produced and disposed of at current rates throughout the entire Marcellus build-out period. The cost of building new landfill capacity is also estimated, to represent the magnitude of investment that would be required.
Data for the analyses derive from the West Virginia Geological and Economic Survey, the West Virginia Department of Environmental Protection, the U.S. Energy Information Administration, the West Virginia Solid Waste Management Board, U.S. Bureau of Labor Statistics Occupational Employment Statistics for 2014, the Ohio Environmental Protection Agency, the Pennsylvania Department of Environmental Protection, and estimates from a 2005 MSM Management Report.
Production of Drill Cuttings from Gas Wells The tonnage of cuttings produced from a gas well is a function of the diameter of the borehole, the length of the borehole, the weight of the rock being drilled and the presence of drilling mud. As the vertical section of a well increases in depth the diameter of the borehole gets smaller, with the horizontal section of a well having the smallest diameter.
1 Stuckey, J. and D. White (1993). “When and When not to Vertically Integrate”. The McKinsey Quarterly, No. 3. http://www.mckinsey.com/insights/strategy/when_and_when_not_to_vertically_integrate 2 Grossman, G. and E. Helpman (2001). “Integration vs. Outsource in Industry Equilibrium” CESifo Working Paper, No. 460. http://www.econstor.eu/bitstream/10419/75839/1/cesifo_wp460.pdf 3 Stuckey and White (1993).

Evaluation of the Feasibility of a Gas Industry Owned and Operated Dedicated Drill Cuttings Landfill
4
For Marcellus wells, a portion of the larger top-hole section of a well is often drilled using air. As drilling progresses, drilling mud is added. The tonnage of cuttings thus produced depends on an operator’s engineering decision for borehole diameter in both sections of a well and at what depth in the vertical section drilling mud is added.
Industry sources frequently cite 1,500 tons of drill cuttings as the volume of production from a typical Marcellus well.4 In practice, volumes range from around 800 tons5 to more than 1,500 tons per well depending on the depth of the well and the length of the horizontal section.
The length of the horizontal section of 6A well completed in West Virginia has increased steadily since these wells were first drilled in 2007. This is illustrated in the following table. The implied, or approximate, horizontal length of each 6A well was calculated by subtracting total vertical depth from total measured depth.
Table 1: Completed Marcellus Wells in West Virginia
Year # of Completed Horizontal Marcellus
Wells
Average Total Measured Depth
(ft.)
Average Total Vertical Depth
(ft.)
Implied Average Horizontal Length
(ft.) 2007 3 7,879 6,032 1,847 2008 11 9,235 6,633 2,602 2009 61 10,856 7,058 3,797 2010 132 11,748 7,075 4,673 2011 220 12,154 6,988 5,166 2012 304 12,752 6,889 5,863 2013 271 13,432 6,992 6,441
2014* Data not complete 14,163 6,883 7,280 Source: West Virginia Geological and Economic Survey.
Completed 6A wells, also known as deviated wells, are concentrated in the north and west sections of the Marcellus Shale Drilling Fairway. The following graphic illustrates the location of these wells, as well as the vertical Marcellus wells drilled prior to the move to horizontal drilling.
4 Clean Earth (n.d.). "Recycling & Reuse of Marcellus Shale Drill Cuttings." 5 Maloney, K and David Yoxtheimer (2012). “Production and Disposal of Waste materials from Gas and Oil Extraction from the Marcellus Shale Play in Pennsylvania,” Environmental Practice, 14 (4).
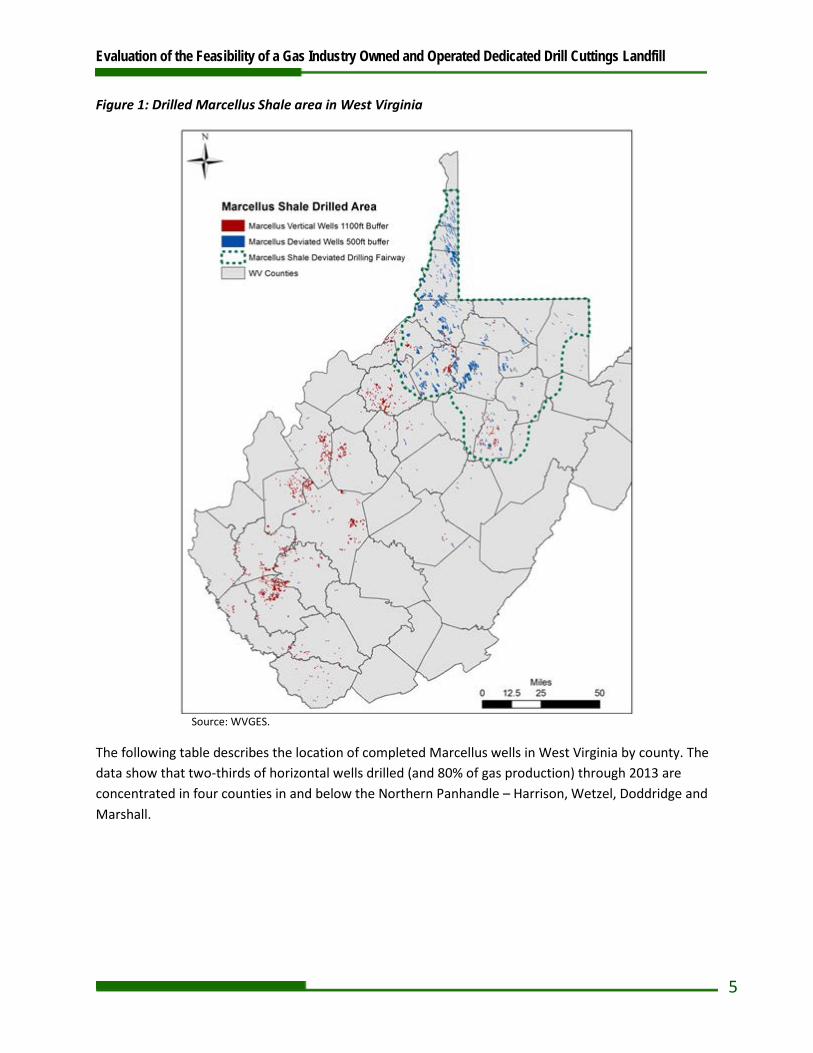
Evaluation of the Feasibility of a Gas Industry Owned and Operated Dedicated Drill Cuttings Landfill
5
Figure 1: Drilled Marcellus Shale area in West Virginia
Source: WVGES.
The following table describes the location of completed Marcellus wells in West Virginia by county. The data show that two-thirds of horizontal wells drilled (and 80% of gas production) through 2013 are concentrated in four counties in and below the Northern Panhandle – Harrison, Wetzel, Doddridge and Marshall.

Evaluation of the Feasibility of a Gas Industry Owned and Operated Dedicated Drill Cuttings Landfill
6
Table 2: Completed Marcellus Wells in West Virginia - Largest 10 Counties by Production, 2007 to 2013
County Number of Completed
Horizontal Wells, 2007-2013
Total Gas Production Reported,
2007-2013 (mcf) Harrison 177 327,084,457 Wetzel 173 221,123,200 Doddridge 150 168,938,241 Marshall 176 161,510,319 Upshur 48 43,021,218 Marion 39 40,072,535 Taylor 37 37,786,106 Tyler 26 29,277,705 Ohio 52 23,134,071 Ritchie 22 17,572,154 Other Counties6 102 39,897,427
Factors influencing future Marcellus and Utica Well Drilling The rate of future horizontal gas well completion impacts future production of drill cuttings that would be disposed of in West Virginia landfill. Several factors influence the rate of well completion, and make projection of future completions uncertain. These include:
1. Price of natural gas. The price of natural gas has been low nationwide, and many pricing points in the Marcellus region have frequently traded below the Henry Hub benchmark. This suppresses interest in completing new wells.
2. Geography. Marcellus gas production economics are somewhat better in southwestern Pennsylvania and West Virginia due to the presence of plant liquids. Where infrastructure is available, producers are able to market propane and ethane in addition to pipeline gas.
3. Infrastructure. Pipeline capacity and midstream services continue to expand for gas and ethane in the southwest Marcellus region, although additional infrastructure is still needed in this area. As this access to market increases drilling activity may eventually trend upward.
4. Well spacing. The trend toward longer horizontal well sections means fewer wells are drilled per cubic foot of production.7 In the Marcellus region, new well gas production per rig has increased every year since 2007, although the rate of increase has slowed in the last couple of years.8 This trend is expected to continue, but the magnitude will depend in part on state-level legislation such as pooling laws that would induce more acreage to be developed.
6 Other counties with at least one completed horizontal well and reported production are (in order of production) Monongalia, Barbour, Preston, Brooke, Lewis, Lincoln, Jackson, Logan, McDowell, Gilmer and Mason. 7 It is possible that the tonnage of drill cuttings produced per cubic foot of gas production is also lower, but this theory needs to be tested and quantified. 8 Energy Information Administration, Marcellus Region Drilling Productivity Report, May 2015.

Evaluation of the Feasibility of a Gas Industry Owned and Operated Dedicated Drill Cuttings Landfill
7
In the short-term, the rate of completions is expected to slow in response to low prices, which is an indicator of over-supply of gas in the region. A picture of some recent Marcellus area prices versus the Henry Hub benchmark spot price is shown in the following figure. Some Marcellus gas producers are receiving prices that are considerably below what is currently the national benchmark for natural gas. Price depends on well location and the price hub at which they are located. The figure below shows some recent prices for Zone 4 Marcellus gas, a hub in northeast Pennsylvania, and Dominion South, a hub in southwest Pennsylvania. Both regions have frequently been trading at one-half of the Henry Hub price, a situation that does not promote expansion of drilling activity.
Figure 2: Recent Marcellus Area vs. Henry Hub Gas Prices ($/mmBtu)
Source: Energy Information Administration, Natural Gas Weekly, 2014 and 2015. The increasing amount of time from initial well permitting to completion is one possible response being observed to lower gas prices. The average time from permitting date to well completion rose more than 20 percent, from about nine months in 2010 to around 11 months in 2013.9 Partial data for 2014 indicate that this time may still be increasing, possibly indicating an interest in postponing completion with the hope of seeing market conditions improve.
9 Gas well data reported to the WVDEP and WVGES.
$-
$0.50
$1.00
$1.50
$2.00
$2.50
$3.00
$3.50
$4.00
12/3/2014 1/3/2015 2/3/2015 3/3/2015 4/3/2015 5/3/2015
Select Marcellus Area Vs. Henry Hub Gas Prices
Henry Hub Spot Zone 4 Marcellus Dominion South
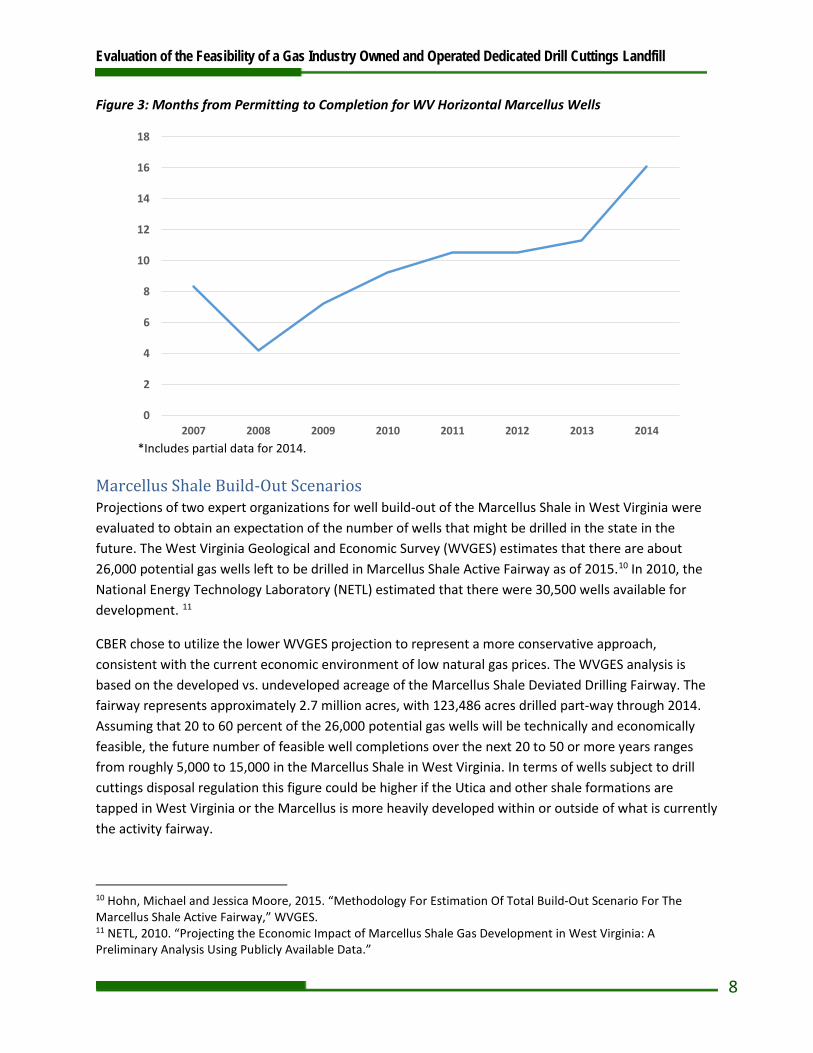
Evaluation of the Feasibility of a Gas Industry Owned and Operated Dedicated Drill Cuttings Landfill
8
Figure 3: Months from Permitting to Completion for WV Horizontal Marcellus Wells
*Includes partial data for 2014.
Marcellus Shale Build-Out Scenarios Projections of two expert organizations for well build-out of the Marcellus Shale in West Virginia were evaluated to obtain an expectation of the number of wells that might be drilled in the state in the future. The West Virginia Geological and Economic Survey (WVGES) estimates that there are about 26,000 potential gas wells left to be drilled in Marcellus Shale Active Fairway as of 2015.10 In 2010, the National Energy Technology Laboratory (NETL) estimated that there were 30,500 wells available for development. 11
CBER chose to utilize the lower WVGES projection to represent a more conservative approach, consistent with the current economic environment of low natural gas prices. The WVGES analysis is based on the developed vs. undeveloped acreage of the Marcellus Shale Deviated Drilling Fairway. The fairway represents approximately 2.7 million acres, with 123,486 acres drilled part-way through 2014. Assuming that 20 to 60 percent of the 26,000 potential gas wells will be technically and economically feasible, the future number of feasible well completions over the next 20 to 50 or more years ranges from roughly 5,000 to 15,000 in the Marcellus Shale in West Virginia. In terms of wells subject to drill cuttings disposal regulation this figure could be higher if the Utica and other shale formations are tapped in West Virginia or the Marcellus is more heavily developed within or outside of what is currently the activity fairway.
10 Hohn, Michael and Jessica Moore, 2015. “Methodology For Estimation Of Total Build-Out Scenario For The Marcellus Shale Active Fairway,” WVGES. 11 NETL, 2010. “Projecting the Economic Impact of Marcellus Shale Gas Development in West Virginia: A Preliminary Analysis Using Publicly Available Data.”
0
2
4
6
8
10
12
14
16
18
2007 2008 2009 2010 2011 2012 2013 2014

Evaluation of the Feasibility of a Gas Industry Owned and Operated Dedicated Drill Cuttings Landfill
9
Disposal of Drill Cuttings at West Virginia Landfills Gas well operators pay tipping fees to landfills to cover the costs of drill cuttings disposal, which vary by the liquid content of the cuttings. Because drill cuttings are inherently wet, solidification material must be added prior to landfill disposal. This may occur at the well site or at the landfill. This added material is typically either fly ash from power plants, lime or sawdust, which increases the tonnage that is disposed of in a landfill. 12 When including solidification material, the average combined weight of cuttings material disposed of per well is approximately 2,100 tons. The methodology for this estimation is explained later in the report.
The West Virginia Solid Waste Management Board (WVSWMD) tracks the amount of drill cuttings disposed of in each of seven “wastesheds” within the state. At current acceptance rates drill cuttings have comprised as much as 45% of total waste deposited in landfills in Wasteshed A.13 The drill cuttings share of total waste accepted by wasteshed is shown in the following table for the year 2013. As expected, cuttings are a larger share for Wastesheds A, B and C due to location in or near the Marcellus production area.
Table 3: Drilling Mud Share of Wastestream Composition by West Virginia Wasteshed in 2013
Wasteshed14 Share of Total Waste Serving Landfill(s) A 44.7% Wetzel County, Short Creek, Brooke County B 6.1% Tucker County, S & S Grading, Meadowfill C 22.4% Northwestern E 0.0% LCS F 0.3% Greenbrier County, Pocahontas County, Nicholas County G 0.0% Raleigh County, HAM, Copper Ridge, Mercer County H 1.6% Charleston, Disposal Services, Sycamore
Source: West Virginia Solid Waste Management Plan 2015.
The following figure depicts the location of landfills receiving drill cuttings as well as the approximate location of horizontal Marcellus wells completed in 2010 through 2013.
12 Information provided in a site tour of Meadowfill landfill. 13 WVSWMB (2015). “West Virginia Solid Waste Management Plan 2015.” 14 There is no Wasteshed D listed in the report.
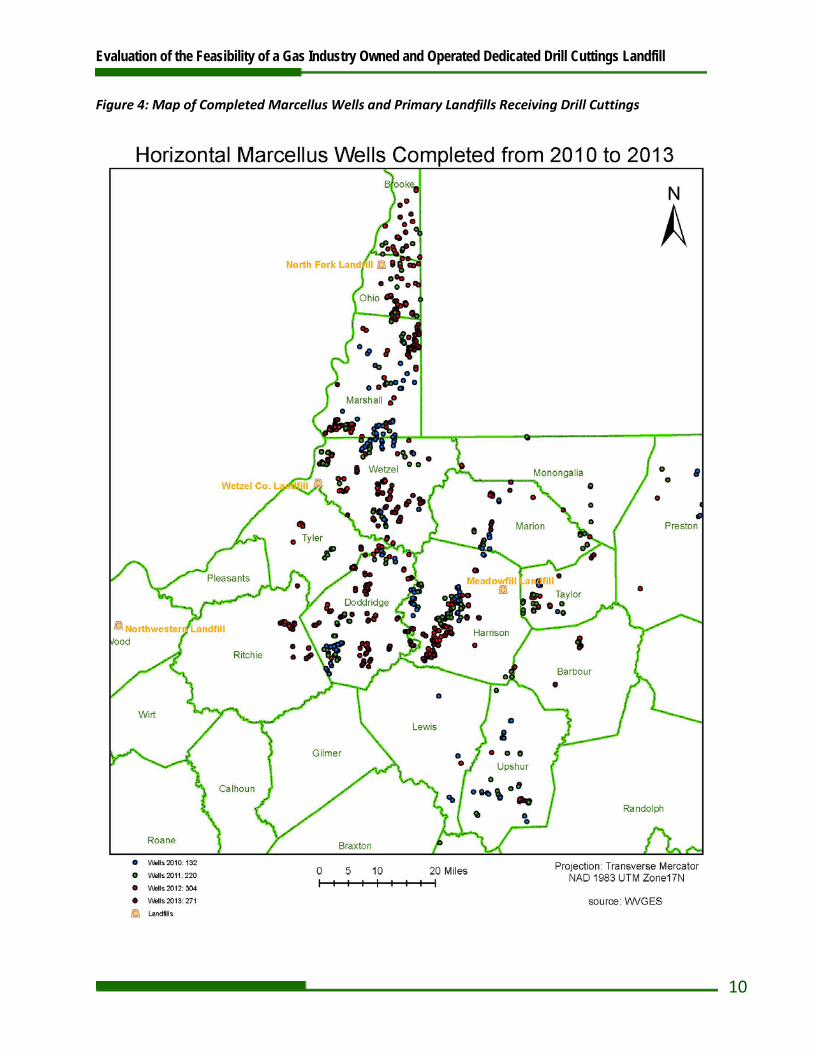
Evaluation of the Feasibility of a Gas Industry Owned and Operated Dedicated Drill Cuttings Landfill
10
Figure 4: Map of Completed Marcellus Wells and Primary Landfills Receiving Drill Cuttings

Evaluation of the Feasibility of a Gas Industry Owned and Operated Dedicated Drill Cuttings Landfill
11
Sources of Drill Cuttings The majority of drill cuttings disposed of in WV landfills, 82 percent to 86 percent in recent years, are from gas wells drilled in the state. Cuttings are also accepted from wells in Ohio and Pennsylvania, with tonnages varying by month.
Figure 5: Monthly Drill Cuttings Disposal in WV Landfills, Tons in 2013 & 2014
Source: Monthly Tonnage Reports filed with the WVDEP. Most out-of-state cuttings come from two counties in eastern Ohio, Monroe and Noble Counties.15 This is likely due to the proximity of Wetzel County and Northwestern landfills to those counties. Both of these counties have completed wells in both the Utica and Marcellus Shale, so it is likely that some Utica Shale cuttings have been deposited in West Virginia landfills. The table on the next page contains the tonnages for 2013 and 2014.
15 Monthly Tonnage Reports filed with the WVDEP.
- 10,000 20,000 30,000 40,000 50,000 60,000 70,000 80,000 90,000
Total
In-State
Out-of-State

Evaluation of the Feasibility of a Gas Industry Owned and Operated Dedicated Drill Cuttings Landfill
12
Table 4: In-State vs. Out-of-State Drill Cuttings Tonnage by Source
Tonnage by Source % of Total 2013 2014 2013 2014
West Virginia 574,195 560,021 82% 86% Doddridge Co. 140,492 214,498 20% 32%
Wetzel Co. 150,070 115,085 21% 17% Harrison Co. 132,291 69,421 18% 10% Marshall Co. 33,529 37,742 5% 6%
Other WV 117,813 123,275 16% 19% Out-of-State Ohio 130,755 93,704 18% 14%
Monroe Co. 59,565 55,459 8% 8% Noble Co. 38,058 17,087 5% 3%
Trumbull Co. 16,454 2,187 2% 0% Other Ohio 16,678 18,970 2% 3%
Pennsylvania 10,291 10,354 1% 2%
Motivation for supply of out-of-state tonnage The proximity of the Northwestern and Wetzel County landfills to eastern Ohio drilling sites makes them attractive for disposal to producers in that area. Gas producers in Ohio and Pennsylvania are not required to dispose of all drill cuttings in landfills. For both states, landfill disposal is only required for cuttings that are contaminated with certain pollutants.
In Ohio, cuttings disposal depends on the phase of drilling. “Cuttings generated during the phase of drilling that involves air, water, clay or other inert materials are considered earthen material and are not regulated as a solid waste. Drill cuttings coming into contact with refined oil-based substances or other sources of contaminants that are sent off-site for disposal are classified as a solid waste under Ohio Environmental Protection Agency (Ohio EPA) regulations. Drill cuttings that have come into contact with refined oil-based substances may be disposed of at a licensed solid waste landfill.”16
Pennsylvania law allows on-site pit disposal or land application of drill cuttings from above the casing seat as long as the cuttings “are not contaminated with pollutional material, including brines, drilling muds, stimulation fluids, well servicing fluids, oil, production fluids or drilling fluids other than tophole water, fresh water or gases,” in addition to other conditions.17
16 Ohio EPA Fact Sheet: Drill Cuttings from Oil and Gas Exploration in the Marcellus and Utica Shale Regions of Ohio, January 2014. 17 PA §78.61.

Evaluation of the Feasibility of a Gas Industry Owned and Operated Dedicated Drill Cuttings Landfill
13
The Wetzel County landfill has the lowest tipping fees of any landfill in West Virginia, potentially placing that facility in a favorable competitive position for receipt of drill cuttings.18
Table 5: Accepted Drill Cuttings Waste for WV Landfills by Source State (Tons)
Tipping Fee $/ton
2013 Drill Cuttings Tonnage 2014 Drill Cuttings Tonnage Landfill WV OH PA WV OH PA
BROOKE/VALERO $37.00 6,921 4,948 884 1,112 5,252 372 SHORT CREEK $32.50 45,215 17,991 5,523 20,128 2,423 3,550 WETZEL CO. $31.25 206,879 53,743 - 182,671 56,582 358 MEADOWFILL $45.35 304,973 136 3,582 295,257 198 6,074 NORTHWESTERN $42.05 10,207 53,937 302 60,853 29,248 -
* S&S not shown because that fill is no longer accepting drill cuttings.
West Virginia gas operators have indicated in permits filed with the WVDEP that they may utilize landfills located in Ohio and Pennsylvania. These fills include Apex Environmental, American 02-12954 and County Wide fills in Ohio and Westmoreland Waste, Carbon Limestone, Arden, Pine Grove, Yukon and Bulger landfills in Pennsylvania. Most of these landfills are located near the northern panhandle of West Virginia, and thus compete with the Brooke County and Short Creek landfills. The Meadowfill, Wetzel County and Northwestern fills are located further from competing disposal service providers.
Landfill Capacity Usage Under special legislation, landfills in the state are allowed to exceed their monthly tonnage limits to accept drill cuttings, as long as it is not located within a karst region as determined by the WVGES and a certificate of need was obtained by March 8, 2014.19 This allowance requires the landfill to place the cuttings in a separate cell dedicated solely to the disposal of drill cuttings and drilling waste. Further, the legislation explicitly states that “no solid waste facility may exclude or refuse to take municipal solid waste in the quantity up to and including its permitted tonnage limit while the facility is allowed to lawfully receive drill cuttings or drilling waste above its permitted tonnage limits.”
The following table shows the tonnages accepted at the six West Virginia landfills that received drill cuttings in 2013 and 2014. Annual permitted tonnage is the maximum total tonnage allowed to be accepted for each fill, as put in place by the Secretary of the WVDEP.20 Drill cuttings are considered to
18 WVSWMB 2015. 19 WV §22-15-8. 20 WV §22-15-8.

Evaluation of the Feasibility of a Gas Industry Owned and Operated Dedicated Drill Cuttings Landfill
14
be “special waste.”21 22 The Meadowfill landfill receives the largest volume of drill cuttings, likely due to its favorable location near the Harrison and Doddridge County wells and lack of other fills in the area.
Table 6: WV Landfills Accepting Drill Cuttings Waste – Annual Tonnage23
Annual Permitted Tonnage24
2013 Tonnage Totals 2014 Tonnage Totals Landfill Drill
Cuttings Solid
Waste Total Drill
Cuttings Solid
Waste Total
BROOKE/VALERO 240,000 12,753 53,097 65,850 6,736 88,478 95,214 SHORT CREEK 360,000 68,729 295,438 364,167 26,102 290,129 316,230 WETZEL CO. 119,988 260,622 74,281 334,903 239,611 73,682 313,293 MEADOWFILL 360,000 308,692 166,198 474,890 300,830 198,193 499,023 S & S 119,988 5,664 62,604 68,268 360 68,144 68,504 NORTHWESTERN 360,000 64,446 223,082 287,528 90,101 215,562 305,663
Total 1,559,976 720,906 874,700 1,595,606 663,740 934,189 1,598,628
The Meadowfill landfill has operated a dedicated cell for disposal of drill cuttings since 2013. Both the Northwestern and Wetzel County fills have plans to open dedicated drill cutting cells in 2015.25 These three landfills are using approximately one percent of permitted acreage per year for drill cuttings disposal on average. Total acreage at the landfills exceed permitted acreage, so as additional acreage is permitted for disposal this share could change.
Table 7: Landfills with Dedicated Drill Cutting Cells – Acreage Permitted and Used26
Landfill Annual
Tonnage Limit
Avg Tonnage Accepted
2013/2014
% of Tonnage Limit Accepted in 2013/2014
Permitted Acreage
Acres for Cuttings per year/% of
Permitted Acreage Wetzel County 119,988 324,098 270% 190 acres 2 acres/1.1%27 Meadowfill 360,000 486,957 135% 178 acres 1.7 acres/0.9%28 Northwestern 360,000 296,596 82% 133 acres 1.3 acres /1.0%29
21 Ibid. 22 The makeup of special waste for the state of WV is 4.98% industrial waste, 1.49% industrial sludge, 8.76% construction and demolition waste, 3.89% petroleum contaminated soil, 3.30% other special waste, 2.87% miscellaneous waste and 19.47% drilling mud. 23 Monthly Tonnage Reports filed with the WVDEP. 24 Monthly permitted tonnage X 12. 25 WVSWMB (2015). 26 WV Solid Waste Management Plan 2015. 27 Based on projected use of 4-acre drill cuttings cell over two years. 28 Based on use of 4.2-acre drill cuttings cell over two and a half years. 29 Based on projected use of 4-acre drill cuttings cell over three years.

Evaluation of the Feasibility of a Gas Industry Owned and Operated Dedicated Drill Cuttings Landfill
15
Feasibility Analysis of a Gas Industry Owned and Operated Landfill Landfill management at fills permitted by the WVDEP occurs under the direction of a specialized waste management firm. When given the choice, a gas operator would simply contract such services to a waste management specialist, as evidenced by the lack of landfills owned and operated by the gas industry. The most salient benefit of establishing a separate landfill sited specifically to receive drill cuttings would be preservation of existing disposal capacity of existing fills for future waste disposal.
Key Considerations and Assumptions To evaluate the feasibility of developing a new landfill it is necessary to evaluate the size of a landfill(s) required to hold the volume of drill cuttings expected to be produced. Several steps were taken in producing this volume estimate. Factors required to be considered include:
1. Marcellus Shale Build-out scenarios – The extent of development of the Marcellus Shale in West Virginia is the primary factor impacting the amount of drill cuttings that will be generated. As discussed earlier in this report, two expert organizations have similar projections:
a. WVGES – 26,000 wells in Marcellus Shale Active Fairway b. NETL – 30,500 wells available for development
2. Number of feasible wells – As the entire Marcellus resource is not technically and economically feasible to develop, only a portion of the resource will be drilled and produce drill cuttings.
3. Annual rates of well completion – The number of wells drilled per year provides an expectation of the number of years drill cuttings will be produced. This information is not explicitly modeled in this analysis, but the number of wells drilled per year is generally not expected to exceed the 230 to 260 completions per year seen from 2010 to 2013.
4. Years to full build out – This is based on the number of wells completed per year and the number of feasible wells. This variable is used to provide estimates of total landfill operating costs over what could be the life of the waste facilities. The ultimate value depends on whether Utica is tapped in WV or the Marcellus is more heavily developed.
5. Tons of drill cuttings per well – This factor is used to calculate the estimate of the total volume of drill cuttings that will potentially be supplied for landfill disposal. As discussed earlier in the report the tonnage of drill cuttings produced per well is:
a. 1,000 to 1,500 tons/well - at well site b. Approx. 2,100 tons/well - at landfill with added solidification material
6. Total Tonnage of Drill Cuttings Produced - This volume depends on the level of well build-out, as well as the amount of cuttings received from out-of-state. This analysis evaluates supply of cuttings from Ohio and Pennsylvania in the same proportion as received in recent years, although it is possible that out-of-state cuttings would fall to zero with a centrally located landfill(s) in West Virginia that are too far from the wells in those states to be competitive.
7. Landfill space rate of usage – This rate is applied to the total tonnage expected to be produced to obtain the required acreage of landfill space.
8. Landfill acreage required – This factor determines the size of the landfill(s) required to be built to hold produced drill cuttings and is based on the 150,000 tons/acre factor.

Evaluation of the Feasibility of a Gas Industry Owned and Operated Dedicated Drill Cuttings Landfill
16
The following table summarizes the assumptions resulting from analysis of the above described factors. These estimates of Marcellus well build out and resulting production of drill cuttings were then used to develop estimates of the cost to build a landfill capable of holding the cuttings.
Table 8: Landfill Feasibility Analysis – Summary of Assumptions*
Factor Low Scenario High Scenario Portion of Feasible Wells Drilled – selected to represent low and high outcomes
20% 60%
Number of Completed Wells - share of 26,000 possible total, rounded for simplicity
5,000 wells 15,000 wells
Tons of In-State Drill Cuttings – based on 2,100 tons of cuttings and added material/well
11 million 32 million
Tons of Out-of-State Drill Cuttings – based on same proportion as received in recent years (25% in 2013 and 19% in 2014)
2 to 3 million 4 to 6 million
Years to Full Build Out - based on annual well completions of less than 250 per year
20 to 30 years 50+ years
Landfill Space Rate of Usage - based on current or planned acreage usage data from the Meadowfill, Northwestern and Wetzel County landfills combined with received tonnage for each fill in 2013 and 2014.
150,000 tons 150,000 tons
Acres of Landfill Capacity – based on 150,000 tons/acre. The low scenario assumes the landfill(s) would be oversized by about 50% to account for uncertainty in volume.
125 acres 250 acres
*Figures are rounded for simplicity.

Evaluation of the Feasibility of a Gas Industry Owned and Operated Dedicated Drill Cuttings Landfill
17
Landfill Costs Construction of a new landfill is a highly capital intensive process. Outlays are site specific and the final design and costs of a particular landfill will depend on terrain, soil type, climatic factors, site restrictions and regulatory factors. Environmental factors such as the type of waste disposed, preprocessing and potential for groundwater contamination are also taken into consideration when constructing a new landfill. Total landfill construction outlays include life cycle costs, or costs incurred from the time the landfill is conceived through the post closure period. Among these include: preconstruction/planning, engineering, legal, licensing, and land acquisition; excavation; construction; operating; closure; and post-closure30.
Estimates were based on data obtained from a report completed by MSM Management, a journal for municipal solid waste professionals. Construction expenditures have been broken down into the following “groups” for each of the two scenarios of the analysis: pre-construction; construction; excavation and support facility construction (i.e. office buildings, fencing, roads and etc.). Data were obtained from a 2005 MSM Management report31 and costs were estimated using current dollars.
Construction and Operating Expenditures Based on the required categories, as outlined below, the total capital required to construct a 125-acre and 250-acre landfill are $40,212,487 and $77,954,974 respectively. Under both scenarios excavation is the most costly process in landfill construction. This includes establishing and constructing perimeter berms, creation of the clay liner as well as building the leachate collection system which includes various piping, collection sumps and a storage system; all at a cost per acre of $229,019. It should be noted that the excavation estimates are much higher than the construction estimates, which consists of clearing, grubbing, surveying, soil removal and blasting ($72,920 per acre). Annual operating costs are estimated to be $600,000 for each facility regardless of size as the rate of waste acceptance is assumed to be the same. It is the length of operating time that is more variable, depending on build out of the Marcellus resource. Line by line estimates for each process are outlined in the following tables.
30 Eilrich, F., Gerald A. Doeksen and Herb Van Fleet. “An Economic Analysis of Landfill Costs to Demonstrate the Economies of Size and Determine the Feasibility of a Community Owned Landfill in Rural Oklahoma”. February 2003. http://ageconsearch.umn.edu/bitstream/35091/1/sp03ei01.pdf 31 Duffy, Daniel. “Landfill Economics: Part I Siting”. MSW Management. May/June 2005. “Landfill Economics: Part II Getting Down to Business”. MSW Management. July/August 2005. “Landfill Economics: Part III Closing Up Shop”. MSW Management. September/October 2005. http://distributedenergy.com/MSW/Editorial/Landfill_Economics_Part_I_Siting_1535.aspx http://foresternetwork.com/daily/waste/landfill-management/landfill-economics-part-ii-getting-down-to-business-part-i/ http://www.mswmanagement.com/MSW/Editorial/Landfill_Economics_Part_III_Closing_Up_Shop_1504.aspx
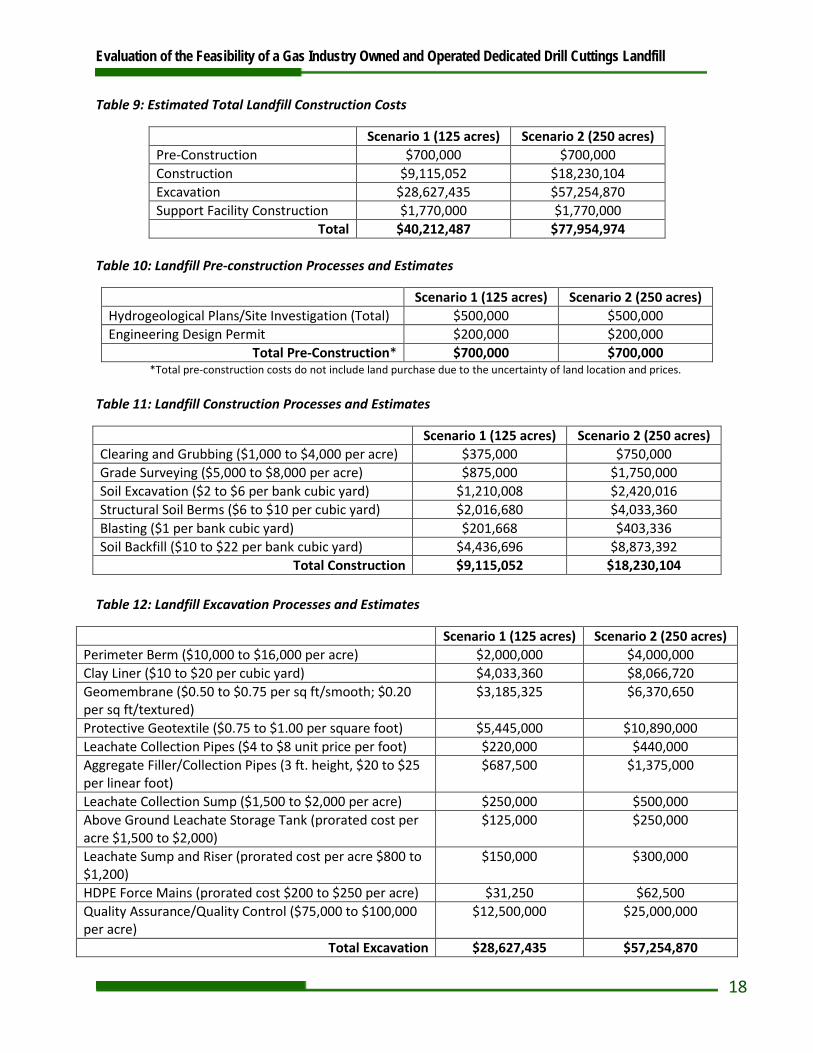
Evaluation of the Feasibility of a Gas Industry Owned and Operated Dedicated Drill Cuttings Landfill
18
Table 9: Estimated Total Landfill Construction Costs
Scenario 1 (125 acres) Scenario 2 (250 acres) Pre-Construction $700,000 $700,000 Construction $9,115,052 $18,230,104 Excavation $28,627,435 $57,254,870 Support Facility Construction $1,770,000 $1,770,000
Total $40,212,487 $77,954,974
Table 10: Landfill Pre-construction Processes and Estimates
Scenario 1 (125 acres) Scenario 2 (250 acres) Hydrogeological Plans/Site Investigation (Total) $500,000 $500,000 Engineering Design Permit $200,000 $200,000
Total Pre-Construction* $700,000 $700,000 *Total pre-construction costs do not include land purchase due to the uncertainty of land location and prices.
Table 11: Landfill Construction Processes and Estimates
Scenario 1 (125 acres) Scenario 2 (250 acres) Clearing and Grubbing ($1,000 to $4,000 per acre) $375,000 $750,000 Grade Surveying ($5,000 to $8,000 per acre) $875,000 $1,750,000 Soil Excavation ($2 to $6 per bank cubic yard) $1,210,008 $2,420,016 Structural Soil Berms ($6 to $10 per cubic yard) $2,016,680 $4,033,360 Blasting ($1 per bank cubic yard) $201,668 $403,336 Soil Backfill ($10 to $22 per bank cubic yard) $4,436,696 $8,873,392
Total Construction $9,115,052 $18,230,104
Table 12: Landfill Excavation Processes and Estimates
Scenario 1 (125 acres) Scenario 2 (250 acres) Perimeter Berm ($10,000 to $16,000 per acre) $2,000,000 $4,000,000 Clay Liner ($10 to $20 per cubic yard) $4,033,360 $8,066,720 Geomembrane ($0.50 to $0.75 per sq ft/smooth; $0.20 per sq ft/textured)
$3,185,325 $6,370,650
Protective Geotextile ($0.75 to $1.00 per square foot) $5,445,000 $10,890,000 Leachate Collection Pipes ($4 to $8 unit price per foot) $220,000 $440,000 Aggregate Filler/Collection Pipes (3 ft. height, $20 to $25 per linear foot)
$687,500 $1,375,000
Leachate Collection Sump ($1,500 to $2,000 per acre) $250,000 $500,000 Above Ground Leachate Storage Tank (prorated cost per acre $1,500 to $2,000)
$125,000 $250,000
Leachate Sump and Riser (prorated cost per acre $800 to $1,200)
$150,000 $300,000
HDPE Force Mains (prorated cost $200 to $250 per acre) $31,250 $62,500 Quality Assurance/Quality Control ($75,000 to $100,000 per acre)
$12,500,000 $25,000,000
Total Excavation $28,627,435 $57,254,870
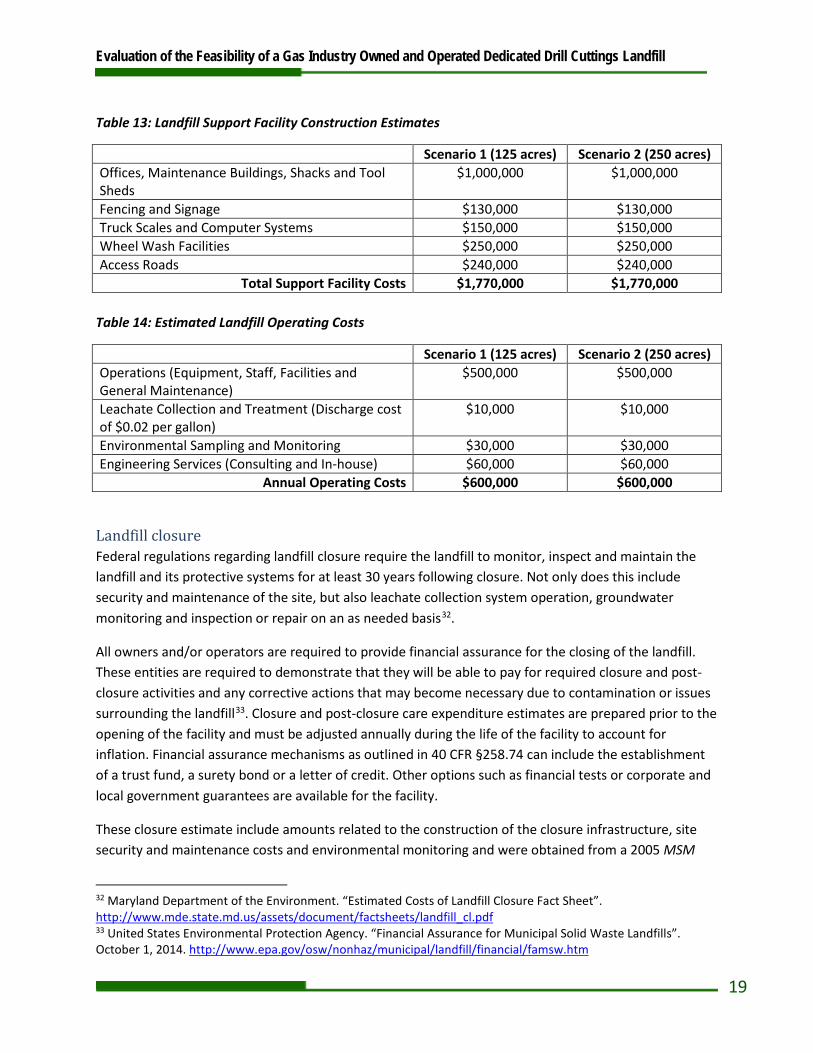
Evaluation of the Feasibility of a Gas Industry Owned and Operated Dedicated Drill Cuttings Landfill
19
Table 13: Landfill Support Facility Construction Estimates
Scenario 1 (125 acres) Scenario 2 (250 acres) Offices, Maintenance Buildings, Shacks and Tool Sheds
$1,000,000 $1,000,000
Fencing and Signage $130,000 $130,000 Truck Scales and Computer Systems $150,000 $150,000 Wheel Wash Facilities $250,000 $250,000 Access Roads $240,000 $240,000
Total Support Facility Costs $1,770,000 $1,770,000
Table 14: Estimated Landfill Operating Costs
Scenario 1 (125 acres) Scenario 2 (250 acres) Operations (Equipment, Staff, Facilities and General Maintenance)
$500,000 $500,000
Leachate Collection and Treatment (Discharge cost of $0.02 per gallon)
$10,000 $10,000
Environmental Sampling and Monitoring $30,000 $30,000 Engineering Services (Consulting and In-house) $60,000 $60,000
Annual Operating Costs $600,000 $600,000
Landfill closure Federal regulations regarding landfill closure require the landfill to monitor, inspect and maintain the landfill and its protective systems for at least 30 years following closure. Not only does this include security and maintenance of the site, but also leachate collection system operation, groundwater monitoring and inspection or repair on an as needed basis32.
All owners and/or operators are required to provide financial assurance for the closing of the landfill. These entities are required to demonstrate that they will be able to pay for required closure and post-closure activities and any corrective actions that may become necessary due to contamination or issues surrounding the landfill33. Closure and post-closure care expenditure estimates are prepared prior to the opening of the facility and must be adjusted annually during the life of the facility to account for inflation. Financial assurance mechanisms as outlined in 40 CFR §258.74 can include the establishment of a trust fund, a surety bond or a letter of credit. Other options such as financial tests or corporate and local government guarantees are available for the facility.
These closure estimate include amounts related to the construction of the closure infrastructure, site security and maintenance costs and environmental monitoring and were obtained from a 2005 MSM
32 Maryland Department of the Environment. “Estimated Costs of Landfill Closure Fact Sheet”. http://www.mde.state.md.us/assets/document/factsheets/landfill_cl.pdf 33 United States Environmental Protection Agency. “Financial Assurance for Municipal Solid Waste Landfills”. October 1, 2014. http://www.epa.gov/osw/nonhaz/municipal/landfill/financial/famsw.htm

Evaluation of the Feasibility of a Gas Industry Owned and Operated Dedicated Drill Cuttings Landfill
20
Management report34. Outlays were estimated at a yearly amount as well as a 30 year total using current dollars.
Based on these estimates, as outlined below, the closure and post-closure costs (landfill site security and maintenance and environmental monitoring) of a 125-acre and 250-acre landfill are $45,649,500 and $90,537,000 respectively. Of the total estimate, closure of the landfill represents the largest component. At a cost per acre of $325,000 this process includes final surveying, gas management system implementation and the required caps, seals in addition to soiling and seeding. Site security, maintenance and environmental monitoring are performed yearly over the 30 year closure period and are significantly lower than closure costs.
Table 15: Estimated Total Landfill Closure Costs
Scenario 1 (125 acres) Scenario 2 (250 acres) Closure $40,625,000 $81,250,000 Site Security and Maintenance $4,448,500 $8,711,000 Environmental Monitoring $576,000 $576,000
Total $45,649,500 $90,537,000
Table 16: Landfill Closure Processes and Estimates
Scenario 1 (125 acres) Scenario 2 (250 acres) Final Grade Surveying ($3,000 to $6,000 per acre) $625,000 $1,250,000 Gas Management Layer ($24,000 to $32,000 per acre)
$4,000,000 $8,000,000
Clay Cap Construction ($26,000 to $51,000 per acre) $6,375,000 $12,750,000 Composite Cap System ($18,000 to $23,000 per acre)
$2,875,000 $5,750,000
Geomembrane Cap ($33,000 to $44,000 per acre) $5,500,000 $11,000,000 Soil Cover ($13,000 to $26,000 per acre) $3,250,000 $6,500,000 Seeding, Mulch and Fertilizer ($1,000 to $2,000 per acre)
$250,000 $500,000
Gas Management System ($29,000 to $35,000 per acre)
$4,375,000 $8,750,000
Water Runoff Control System ($5,000 to $7,000 per acre)
$875,000 $1,750,000
Total Overhead and Quality Control ($75,000 to $100,000 per acre)
$12,500,000 $25,000,000
Total Closure Costs $40,625,000 $81,250,000
34 Duffy, Daniel. “Landfill Economics: Part I Siting”. MSW Management. May/June 2005. “Landfill Economics: Part II Getting Down to Business”. MSW Management. July/August 2005. “Landfill Economics: Part III Closing Up Shop”. MSW Management. September/October 2005. http://distributedenergy.com/MSW/Editorial/Landfill_Economics_Part_I_Siting_1535.aspx http://foresternetwork.com/daily/waste/landfill-management/landfill-economics-part-ii-getting-down-to-business-part-i/ http://www.mswmanagement.com/MSW/Editorial/Landfill_Economics_Part_III_Closing_Up_Shop_1504.aspx

Evaluation of the Feasibility of a Gas Industry Owned and Operated Dedicated Drill Cuttings Landfill
21
Table 17: Landfill Site Security and Maintenance Estimates
Scenario 1 (125 acres) Scenario 2 (250 acres) Yearly 30 Year
Total Yearly 30 Year
Total Entrance Gate Maintenance $200 $6,000 $200 $6,000 Security $6,000 $180,000 $6,000 $180,000 Cover Maintenance ($9,000 to $17,000 per acre) $70,833 $2,125,000 $141,666 $4,250,000 Leachate System Maintenance ($13,500 to $17,100 per acre)
$71,250 $2,137,500 $142,500 $4,275,000
Total Security and Maintenance $148,283 $4,448,500 $290,366 $8,711,000
Table 18: Environmental Monitoring Estimates
Scenario 1 (125 acres) Scenario 2 (250 acres) Yearly 30 Year
Total Yearly 30 Year
Total Groundwater Monitoring $4,000 $120,000 $4,000 $120,000 Surface Water Monitoring $3,000 $90,000 $3,000 $90,000 Leachate Monitoring $3,000 $90,000 $3,000 $90,000 Landfill Gas Monitoring $1,200 $36,000 $1,200 $36,000. Statistical Analysis $8,000 $240,000 $8,000 $240,000
Total Environmental Monitoring $19,200 $576,000 $19,200 $576,000
The costs associated with landfill construction and closure would be staggered over time. Sections of the landfill would be prepared for disposal as needed over time, which would reduce the amount of the investment needed up-front.
Existing Landfill Expenditure Comparison These estimated landfill expenditures are similar to previously constructed landfills. For example, in 1990 a 23 acre landfill in Escambia County, Florida required a little over $6 million dollars for completion35. In 1993, The Georgia Environmental Protection Division approved a plan to expand a landfill in Athens-Clark County. The project consisted of two phases and was designed to meet standards regarding water and methane monitoring systems, an underdrain system, geomembrane liners and a leachate collection system. The 11 acre phase I, stage 1 project cost approximately $5.2 million36. In
35 Escambia County, Florida Department of Public Works. “Saufley Field Road C&D Landfill Closure & Stormwater Improvements”. Application for the SWANA 2014 Landfill Remediation Excellence Award Application. 2014. http://swana.org/portals/0/awards/2014/Landfill%20Remediation/Escambia%20County%20LandfillRemediation.pdf 36 Athens-Clark County Municipal Solid Waste Division. “Athens-Clark County Landfill Fact Sheet”. January 2012. https://athensclarkecounty.com/DocumentCenter/View/10871
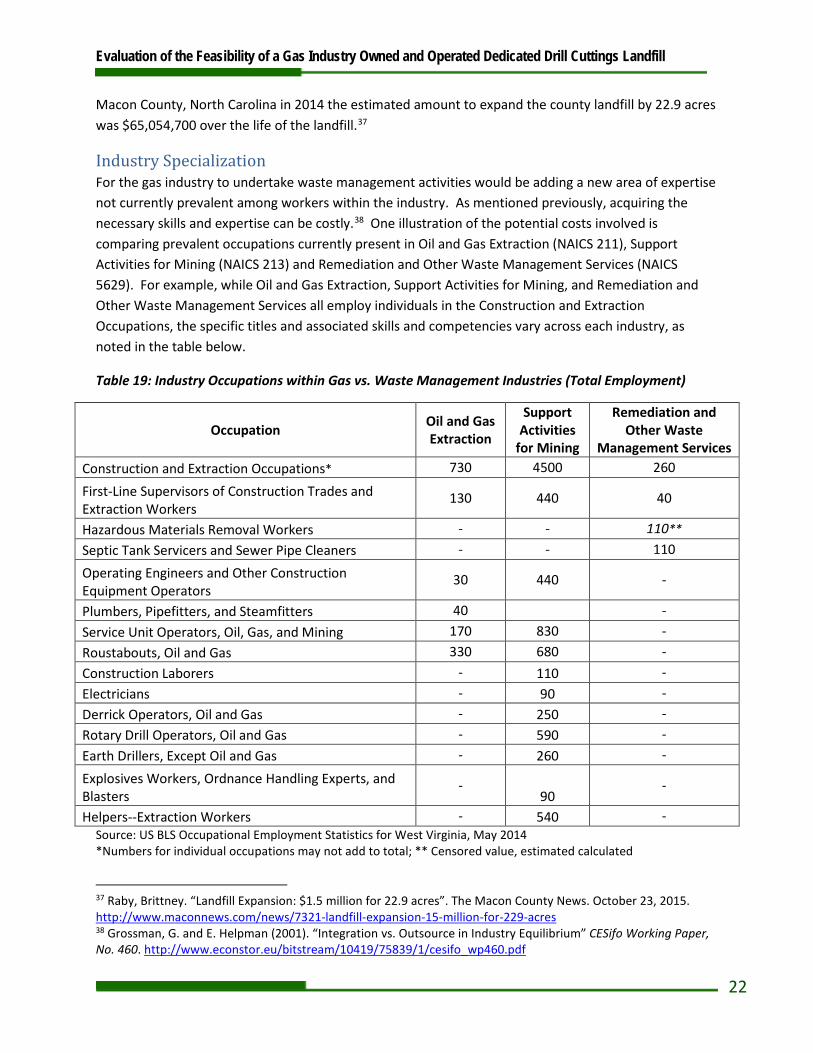
Evaluation of the Feasibility of a Gas Industry Owned and Operated Dedicated Drill Cuttings Landfill
22
Macon County, North Carolina in 2014 the estimated amount to expand the county landfill by 22.9 acres was $65,054,700 over the life of the landfill.37
Industry Specialization For the gas industry to undertake waste management activities would be adding a new area of expertise not currently prevalent among workers within the industry. As mentioned previously, acquiring the necessary skills and expertise can be costly.38 One illustration of the potential costs involved is comparing prevalent occupations currently present in Oil and Gas Extraction (NAICS 211), Support Activities for Mining (NAICS 213) and Remediation and Other Waste Management Services (NAICS 5629). For example, while Oil and Gas Extraction, Support Activities for Mining, and Remediation and Other Waste Management Services all employ individuals in the Construction and Extraction Occupations, the specific titles and associated skills and competencies vary across each industry, as noted in the table below.
Table 19: Industry Occupations within Gas vs. Waste Management Industries (Total Employment)
Occupation Oil and Gas Extraction
Support Activities
for Mining
Remediation and Other Waste
Management Services Construction and Extraction Occupations* 730 4500 260
First-Line Supervisors of Construction Trades and Extraction Workers
130 440 40
Hazardous Materials Removal Workers - - 110** Septic Tank Servicers and Sewer Pipe Cleaners - - 110
Operating Engineers and Other Construction Equipment Operators
30 440 -
Plumbers, Pipefitters, and Steamfitters 40 - Service Unit Operators, Oil, Gas, and Mining 170 830 - Roustabouts, Oil and Gas 330 680 - Construction Laborers - 110 - Electricians - 90 - Derrick Operators, Oil and Gas - 250 - Rotary Drill Operators, Oil and Gas - 590 - Earth Drillers, Except Oil and Gas - 260 -
Explosives Workers, Ordnance Handling Experts, and Blasters
- 90
-
Helpers--Extraction Workers - 540 - Source: US BLS Occupational Employment Statistics for West Virginia, May 2014 *Numbers for individual occupations may not add to total; ** Censored value, estimated calculated
37 Raby, Brittney. “Landfill Expansion: $1.5 million for 22.9 acres”. The Macon County News. October 23, 2015. http://www.maconnews.com/news/7321-landfill-expansion-15-million-for-229-acres 38 Grossman, G. and E. Helpman (2001). “Integration vs. Outsource in Industry Equilibrium” CESifo Working Paper, No. 460. http://www.econstor.eu/bitstream/10419/75839/1/cesifo_wp460.pdf

Evaluation of the Feasibility of a Gas Industry Owned and Operated Dedicated Drill Cuttings Landfill
23
Of particular note, nearly half of the employees in the Remediation and Other Waste Management Services industry are Hazardous Materials Removal Workers, which are not present in the Extraction and Support Activities industries in West Virginia. If specialized skills are required for proper operation and maintenance of a landfill, the operating company would have to hire these specialized employees.
Transport Analysis A move to require disposal of drill cuttings in gas industry-owned and operated landfills would change the location of disposal and thus the distance cuttings must be transported. Gas well operators dispose of produced drill cuttings in three primary landfills - Meadowfill, Northwestern, and Wetzel County – with smaller volumes deposited at the Short Creek/North Fork and Brooke County fills. As shown earlier in the report (see “Map of Completed Marcellus Wells and Primary Landfills Receiving Drill Cuttings”) the Meadowfill and Wetzel County and are located quite centrally to the active Marcellus fairway. These two landfills receive the largest shares of cuttings, possibly due to tipping fees differentials as well as lack of disposal locations in the southern part of the Marcellus fairway.
As part of the feasibility study, to characterize considerations related to transport costs, the Center for Environmental, Geotechnical and Applied Sciences (CEGAS) at Marshall University conducted a transport analysis of the distance travelled from well sites to landfills. This analysis provides a means of evaluating the significance of landfill proximity to current and future well sites. This analysis assumes that operators select a landfill that allows them to minimize the distance the cuttings must be transported. Based on the approximate location of gas wells completed in 2010 through 2013, and assuming these wells chose the closest landfill for disposal, the average distance transported to the nearest landfill would have been 22.3 miles. This calculation was based on geographic information system (GIS) analysis of road distance based on available routes.
CEGAS utilized ESRI GIS software to analyze the distance from completed gas wells to existing landfills that accept drill cuttings (it does not show the actual landfill that a particular well site used to dispose of their drill cuttings) and to find distance to one or two theoretical central or centroid landfills. The details of this distance analysis are described below. It should be noted that the distance analysis only takes into account the distance from a particular well to a landfill. This analysis shows the shortest path from a particular well to a landfill, but does not take into account the type of road, speed limits or condition of roads. The analysis was conducted to show one or two theoretical central or centroid landfills, based only on the location of completed wells, and a best fit centroid and associated distances to that centroid. Since the analysis did not take into account available property, geologic conditions, regulatory issues and political situations, it is not intended to be a recommendation for a landfill site.
The following table shows the variation in average distance traveled, using this distance minimization approach, if gas wells were required to utilize one versus two new centrally located landfills built to hold drill cuttings.

Evaluation of the Feasibility of a Gas Industry Owned and Operated Dedicated Drill Cuttings Landfill
24
Table 20: Average Distance Travelled – Gas Well to Landfill
From Existing Marcellus Wells to Closest Landfill –
Approximate Actual Distance
From Future Marcellus Wells to One Central Landfill – Hypothetical Distance
From Future Marcellus Wells to Two Central Landfills –
Hypothetical Distance 22.3 miles 34.3 miles 24.4
In reality, gas wells were not required to dispose of drill cuttings in landfills until 2012, and not all wells use the closest landfill due to contractual relationships with hauling companies or landfill tipping fee differentials. In other words, drilling companies are likely seeking to minimize total costs of drilling and disposal, of which distance to landfill is but one component. It is thus highly likely that the average travel distance may exceed those shown in the table. Nonetheless, the analysis demonstrates the geographic dispersion of completed Marcellus wells, and provides reasonable approximation of future dispersion. Applying these same locations shows that an increase in transport distance would likely occur with an industry owned and operated disposal system that only resulted in one or two new landfills. A system of disposal that offered three or more landfill choices could reduce the average distance travelled compared to current options.
The following describes the GIS analysis process used to calculate the transport distances shown in the table above.
Distance Analysis Cost (Distance) Raster. The first step in a GIS distance analysis is to create a Cost Raster. In this analysis, the cost is distance. The following cost surface model was developed to represent factors or combination of factors that affect travel across an area. The process takes 4 to 5 minutes to calculate results. The inputs are a geodatabase workspace and the road area. The ESRI road network was used. The output of the analysis is a cost raster for use as an input for the least-cost path analysis.
Figure 6: Cost Raster for Distance Analysis

Evaluation of the Feasibility of a Gas Industry Owned and Operated Dedicated Drill Cuttings Landfill
25
Least-Cost Path. The following model was developed to give the least-cost path from the wells to the landfill following the road network indicated. The process takes around 15 to 20 hours depending the area of analysis. The output is a feature class. This process gives distance from a source to a destination as a series of segments (not a single vector).
Figure 7: Least-Cost Path for Distance Analysis
To determine the shortest distance from well to landfill, the following analysis was completed, using ESRI Network Analysis. Using this method, a unique distance from the source to the destination was calculated – in this analysis, from the gas wells to the nearest landfill. The process takes 2 or 3 hours.
Figure 8: ESRI Network Analysis

Evaluation of the Feasibility of a Gas Industry Owned and Operated Dedicated Drill Cuttings Landfill
26
Central Location Analyses Using the ESRI Network Analysis extension, a network data set was built and analysis objects such as routes, wells, and a list of candidates was added. Working with the Location-Allocation tool, the place (centroid) for the wells was determined and the distance from this centroid to each well was calculated.
Summary Current practice in West Virginia is to accept drill cuttings at landfills, both from in-state and out-of-state operations. While on-site disposal with landowner permission is technically also allowed, currently drilling operators do not utilize this option. To provide insight into the feasibility of a consolidated, gas-operator owned and operated landfill facility, data on drill cuttings volume, well completions, landfill capacity and construction costs were analyzed. The analysis provides a range of costs for constructing and operating a landfill.
The analysis indicates that over the next 20 to 30 years, anticipated build out may generate from 14 million to 38 million tons of drill cuttings across West Virginia, Ohio and Pennsylvania for disposal in West Virginia landfills. Total capital and construction costs for a consolidated landfill are estimated to be about $40 million to $78 million, depending on acreage. Annual operating costs for the landfill range from $12 million to more than $30 million, with closure costs ranging from $40 to $81 million.
A precise estimate of the required investment in a dedicated landfill is not possible due to high potential variability of future well completions. Due to this uncertainty, the analysis relies on a large range of possible acreage required. A more thorough engineering and market analysis would be required prior to developing plans to construct such a facility.
Other uncertainties include the time required to site and construct a landfill. As it would take at least five years to site and construct a landfill39 permitted to receive drill cuttings, the current disposal system would need to remain in place. The timeframe of landfill management for disposal and post-closure monitoring is also important as this monitoring will extend for years beyond the Marcellus build-out. The difficulties inherent when siting a new landfill are also not evaluated, but may be non-trivial as community resistance or receptiveness to the siting of a new facility is unknown.
In order to be economically feasible, gas operators would need access to the necessary capital for construction, and revenues from operating the landfill would need to be sufficient to recover costs. Revenues will be determined by tipping fees charged and intensity of usage. It is possible that future demand for disposal may be different because of a new, specialty landfill(s) located in North Central West Virginia. Questions which remain to be answered and are not considered in this analysis include:
• Would cuttings from out-of-state locations be allowed at the new fill(s)?
39 Duffy, Daniel. “Landfill Economics: Part I Siting”. MSW Management. May/June 2005.

Evaluation of the Feasibility of a Gas Industry Owned and Operated Dedicated Drill Cuttings Landfill
27
• Would West Virginia-located gas operators be required to use the new fill(s) or can they choose to use disposal services in other states or existing landfills in WV if those are geographically closer to their well site?
• If out-of-state disposal remains an option, will the centralized fill(s) be competitive? • Would it be more or less feasible to site multiple small fills vs. one or two large fills?
Conclusions and Recommendations Overall, the analysis indicates that building and maintaining a consolidated facility will incur substantial costs to gas operators. Further, several factors influence whether resulting revenues will be sufficient to cover these costs. These factors include not only the number of well completions and volume of cuttings produced, but also the market setting in which this landfill or landfills would operate. Additionally, waste management is outside of the gas industry’s expertise and doing business in the waste industry might require reclassification in terms of a primary industry of operation.
The large capital and construction costs associated with a new landfill(s) of the size required here may require gas operators to divert resources that would otherwise be used for drilling into the construction and operation of the landfill. Making such an investment is only feasible if it substantially reduces risk to the company, provides some additional source of revenues to offset costs of the investment, or otherwise provides some market advantage. That many gas operators currently utilize contract hauling for drill cuttings, for example, indicates that outsourcing is less costly and less risky under current market structure and conditions.
Analysis of the distance that drill cuttings are transported to landfills shows that an increase in transport distance would likely occur with an industry owned and operated disposal system that only resulted in one or two new landfills, unless existing landfills are allowed to continue to receive cuttings. Increased travel time and distance travelled are potential outcomes of proposed mandates that should be considered when evaluating feasibility.
The primary specific conclusions of the study are:
• Siting and constructing a new landfill will take at least five years, possibly longer. In the meantime, gas operators will have to rely on existing landfills for disposal.
• At current rates of disposal, the minimum cost of investment estimated to be needed (for 125 acres of landfill capacity) is $40 million for construction plus another $40 million for closure costs.
• The primary receiving landfills (Meadowfill, Wetzel and Northwestern) are using approximately one percent of permitted acreage for drill cuttings disposal annually.
• The approximate minimum average distance drill cuttings are currently transported from the well site to a landfill is 22.3 miles.
• At least two new industry-operated landfills would need to be constructed to allow well operators access to disposal locations where average transit distances do not exceed current distances. Having only one centrally located landfill could increase the average distance travelled from the gas well to the landfill by 12 miles or more. Having more than two new central landfills could reduce the average distance travelled, if optimally sited.
Evaluation of the Feasibility of a Gas Industry Owned and Operated Dedicated Drill Cuttings Landfill
28
The analysis also recommends further study to help determine whether the current per well rate of drill cuttings disposal can be lowered, reducing pressure on existing landfill capacity. The recommendation is to:
• Evaluate policy options that would reduce disposal volume by leaving some cuttings at the drilling site, specifically by allowing on-site disposal of cuttings material produced prior to addition of drilling mud, similar to policies in the states of Pennsylvania and Ohio.
In terms of the waste management hierarchy espoused by the West Virginia Solid Waste Management Board and many other states, reuse of waste material and reduction of waste are priorities over disposal. The above recommendation supports that waste management philosophy.

Appendix J
Geotechnical Assessment and Recommendations – Marcellus Shale Reuse (Compiled by West Virginia Department of Transportation, Division of Highways)

WEST VIRGINIA DEPARTMENT OF TRANSPORTATION
Division of Highways 1900 Kanawha Boulevard East • Building Five • Room 110
Earl Ray Tomblin Charleston, West Virginia 25305-0430 • (304) 558-3505 Paul A. Mattox, Jr., P.E.
Governor Secretary of Transportation
Commissioner of Highways
June 9, 2015
E.E.O./AFFIRMATIVE ACTION EMPLOYER
Dr. Terry L. Polen, DM MBA, PE, QEP
WVDEP, Ombudsman
601 57th
Street, SE
Charleston, WV 25304
RE: Geotechnical Assessment and Recommendations
Marcellus Shale Reuse
Dear Dr. Polen:
We are pleased to provide you with our assessment for the reuse of the Marcellus Shale Cuttings
as a roadway embankment fill material. We received large “as-produced” samples of cuttings
from both the vertical and horizontal drilling methods and performed moisture determinations
and classification testing. The results of our assessment indicate that the material is too wet in its
as-produced state and would likely perform poorly if the material was dried to its optimum
moisture as a roadway fill.
Geotechnical Laboratory Investigation
Geotechnical testing included Moisture Determinations, Atterburg Limits Testing, and Grain
Size Analysis. These tests were performed in accordance with AASHTO procedures and allow
for assessment of the engineering behavior of the material. All the material tested was classified
as AASHTO A-4 material which is a non-plastic silt. The average moisture content of all
samples tested is 30% by weight. The laboratory testing results are included at the end of this
letter.
Assessment and Recommendations
Based on our visual examination and laboratory testing, we do not recommend using either
Marcellus Shale cuttings or the vertical cuttings as a fill material in our road embankments. We
make this assessment based on the high moisture content of the as-produced material and its silt-
like behavior. Silt is prone to “pumping” during compaction even if the moisture content is near
optimum. Pumping is where the material moves undesirably under the weight of compaction
equipment making it more difficult to compact. Also, silt is susceptible to frost heave that


Project Number Date Sampled
Authorization Number Date Received
Location Date Tested
Boring No. Pad Name Tare Tare+Wet Tare+Dry Wet Weight Dry Weight Water Weight Moisture%
B-1 Morton 247.9 886 743.2 638.1 495.3 142.8 28.8
B-2 McGee 222.7 930.6 739.8 707.9 517.1 190.8 36.9
B-3 Rock Run 1 215.1 818.3 723.9 603.2 508.8 94.4 18.6
B-4 Rock Run 2 220.8 778.7 684.6 557.9 463.8 94.1 20.3
WEST VIRGINIS DIVISION OF HIGHWAYS
MATERIALS CONTROL SOILS & TESTING
NATURAL MOISTURE CONTENT SUMMARY
3/27/2015
4/7/2015Marcellus Shale
47-017-0646
1/25/2015Research

Project Number Date Sampled
Authorization Number Date Received
Location Date Tested
Boring No. Elevation Tare Tare+Wet Tare+Dry Wet Weight Dry Weight Water Weight Moisture%
Sheep Run 470-650' 116.3 651.8 522.1 535.5 405.8 129.7 32
Sheep Run 650-990' 109.9 889.5 734.3 779.6 624.4 155.2 24.9
Sheep Run 650-990' 111.4 704.7 598.4 593.3 487 106.3 21.8
Bierstadt 3000' 117.9 674 525.9 556.1 408 148.1 36.3
Bierstadt 3500' 117.1 734.1 600.2 617 483.1 133.9 27.7
Bierstadt 4000' 118.8 749.8 592 631 473.2 157.8 33.3
Bierstadt 4500' 121.1 648.5 519.2 527.4 398.1 129.3 32.5
Bierstadt 5000' 119.5 679.3 519.4 559.8 399.9 159.9 40
Bierstadt 5500' 115.5 587.4 470.3 471.9 354.8 117.1 33
Bierstadt 6000' 119.8 783.7 600.7 663.9 480.9 183 38.1
WEST VIRGINIS DIVISION OF HIGHWAYS
MATERIALS CONTROL SOILS & TESTING
NATURAL MOISTURE CONTENT SUMMARY
4/23/2015
5/10/2015
Research
47-017-0646
Marcellus Shale
Unknown

Tested By: Justin Moffitt
LIQUID AND PLASTIC LIMITS TEST REPORTP
LA
ST
ICIT
Y I
ND
EX
0
10
20
30
40
50
60
LIQUID LIMIT0 10 20 30 40 50 60 70 80 90 100 110
CL-ML
CL or OL
CH or OH
ML or OL MH or OH
Dashed line indicates the approximate
upper limit boundary for natural soils
4
7
WA
TE
R C
ON
TE
NT
0
4
8
12
16
20
24
28
32
36
40
NUMBER OF BLOWS5 6 7 8 9 10 20 25 30 40
MATERIAL DESCRIPTION LL PL PI %<#40 %<#200 USCS
Project No. Client: Remarks:
Project:
Source of Sample: Marcellus Shale CuttingsSample Number: B-1
West Virginia Dept. of Highways
Charleston, West Virginia Figure
Drill Cuttings NV NP NP 92.5 66.2 ML
1A WvDoh
Marcellus Shale Cuttings

West VirginiaDept. of Highways
Charleston, West Virginia
(no specification provided)*
PL= LL= PI=
USCS (D 2487)= AASHTO (M 145)=
D90= D85= D60=D50= D30= D15=D10= Cu= Cc=
Remarks
Drill Cuttings
1"3/4"1/2"3/8"#4#8#10
0.0353 mm.0.0230 mm.0.0135 mm.0.0097 mm.0.0069 mm.0.0035 mm.0.0015 mm.
100.0100.0100.0100.0100.0100.0100.0
48.237.931.727.525.320.917.8
NP NV NP
ML A-4(0)
0.3325 0.2221 0.05680.0378 0.0119
3/27/2015 4/7/2015
Justin Moffitt
1/25/2015
WvDoh
Marcellus Shale Cuttings
1A
Material Description
Atterberg Limits (ASTM D 4318)
Classification
Coefficients
Date Received: Date Tested:
Tested By:
Checked By:
Title:
Date Sampled:Source of Sample: Marcellus Shale CuttingsSample Number: B-1
Client:
Project:
Project No: Figure
TEST RESULTS
Opening Percent Spec.* Pass?
Size Finer (Percent) (X=Fail)
PE
RC
EN
T F
INE
R
0
10
20
30
40
50
60
70
80
90
100
GRAIN SIZE - mm.
0.0010.010.1110100
% +3"Coarse
% Gravel
Fine Coarse Medium
% Sand
Fine Silt
% Fines
Clay
0.0 0.0 0.0 0.0 7.5 26.3 42.9 23.3
6 in
.
3 in
.
2 in
.
1½
in.
1 in
.
¾ in
.
½ in
.
3/8
in.
#4
#1
0
#2
0
#3
0
#4
0
#6
0
#1
00
#1
40
#2
00
Particle Size Distribution Report