wto and china’s agricultural policies€¦ · wto and china’s agricultural policies jikun huang...
TRANSCRIPT
WTO and China’s Agricultural Policies
Jikun Huang
Center for Chinese Agricultural Policy
Chinese Academy of Sciences

There had been great debate on China’s WTO accession before China joined WTO in 2001
Who wins? Who loses?
• WINNERS:
-- Off farm workers (in most industries)
-- Consumers—both rural and urban
-- Users of liberalized inputs and technologies
• LOSERS:
-- Farmers?
[Which is important to understand, since there
are more than 200 million farming households]
More concerns when China made big
commitments to WTO accession in 2001
– Market accession
– Domestic support
– Export subsidy
– …
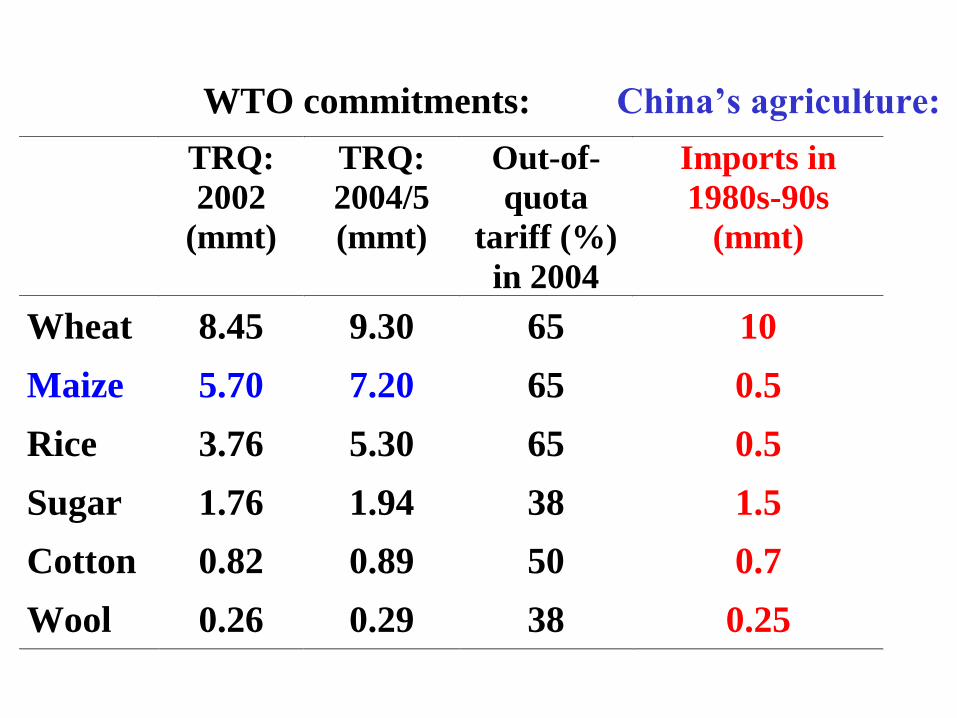
WTO commitments: China’s agriculture:
TRQ:
2002
(mmt)
TRQ:
2004/5
(mmt)
Out-of-
quota
tariff (%)
in 2004
Imports in
1980s-90s
(mmt)
Wheat 8.45 9.30 65 10
Maize 5.70 7.20 65 0.5
Rice 3.76 5.30 65 0.5
Sugar 1.76 1.94 38 1.5
Cotton 0.82 0.89 50 0.7
Wool 0.26 0.29 38 0.25
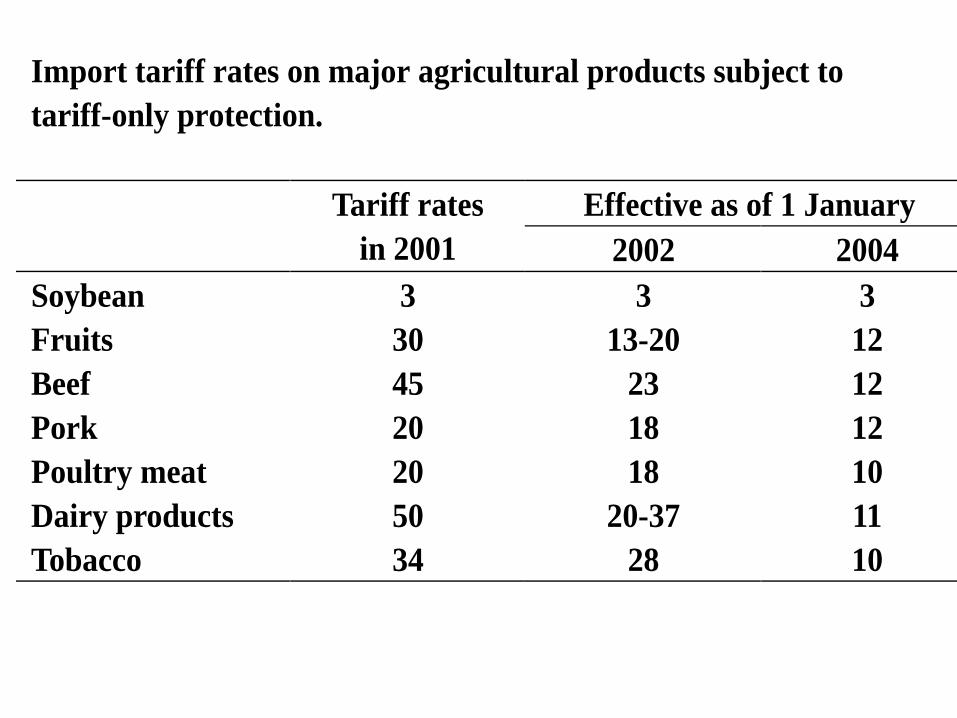
Import tariff rates on major agricultural products subject to
tariff-only protection.
Effective as of 1 January
Tariff rates
in 2001 2002 2004
Soybean 3 3 3
Fruits 30 13-20 12
Beef 45 23 12
Pork 20 18 12
Poultry meat 20 18 10
Dairy products 50 20-37 11
Tobacco 34 28 10
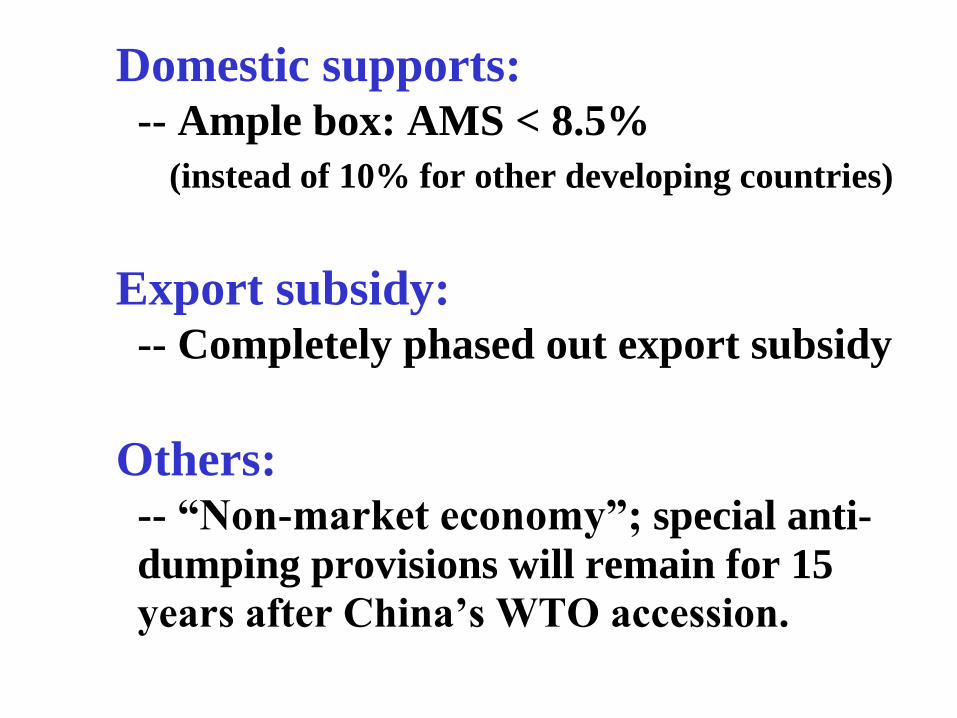
Domestic supports: -- Ample box: AMS < 8.5%
(instead of 10% for other developing countries)
Export subsidy: -- Completely phased out export subsidy
Others: -- “Non-market economy”; special anti-
dumping provisions will remain for 15
years after China’s WTO accession.
So, there was great fear of likely and
substantial negative impacts of
China’s WTO accession on its
agriculture and farmer’s income
after 2001.
Has this happened since 2001?
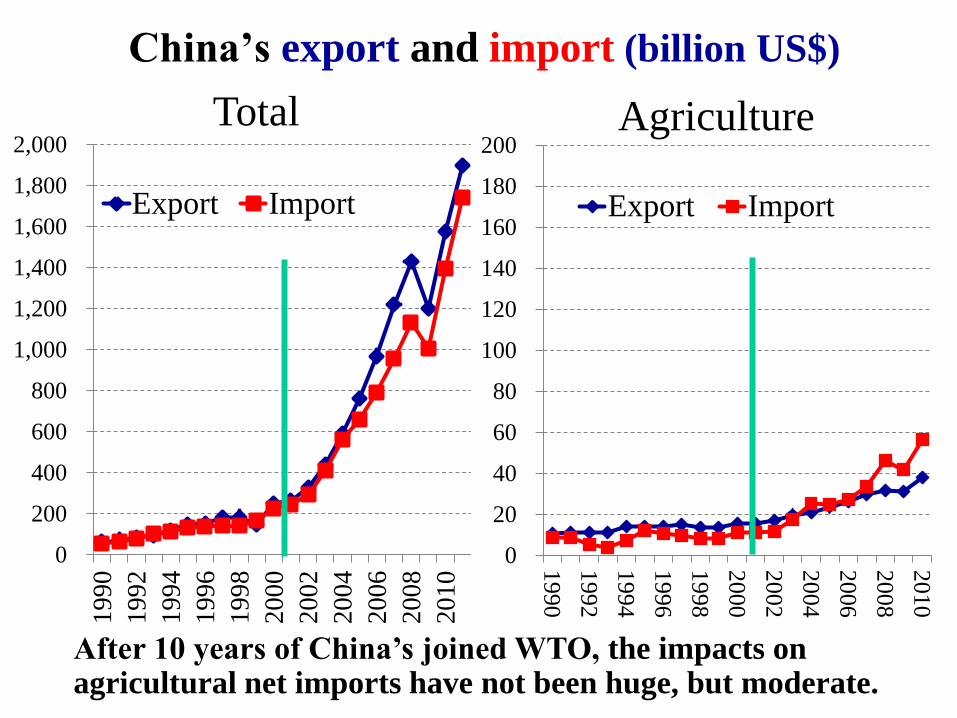
China’s export and import (billion US$)
0
200
400
600
800
1,000
1,200
1,400
1,600
1,800
2,000
19
90
1992
19
94
19
96
19
98
20
00
20
02
20
04
20
06
20
08
2010
Export Import
0
20
40
60
80
100
120
140
160
180
200
1990
1992
1994
1996
1998
2000
2002
2004
2006
2008
2010
Export Import
Total Agriculture
After 10 years of China’s joined WTO, the impacts on agricultural net imports have not been huge, but moderate.
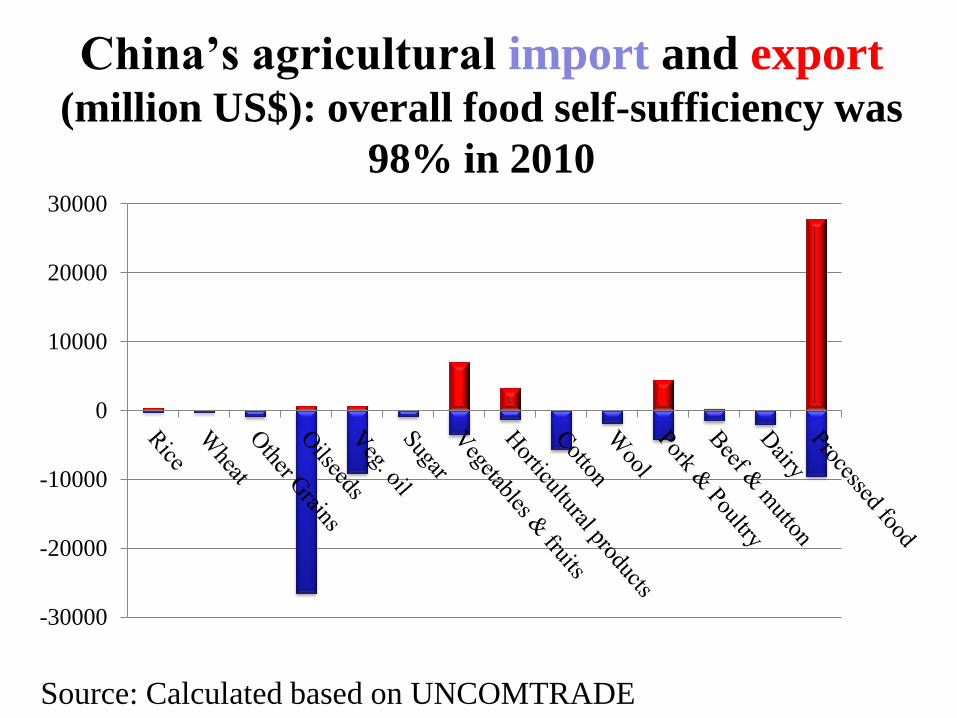
China’s agricultural import and export (million US$): overall food self-sufficiency was
98% in 2010
-30000
-20000
-10000
0
10000
20000
30000
Source: Calculated based on UNCOMTRADE
data

Agricultural export and import (billion US$)
-30.0
-25.0
-20.0
-15.0
-10.0
-5.0
0.0
5.0
10.0
15.0
20.0
Land intentive Labor intensive
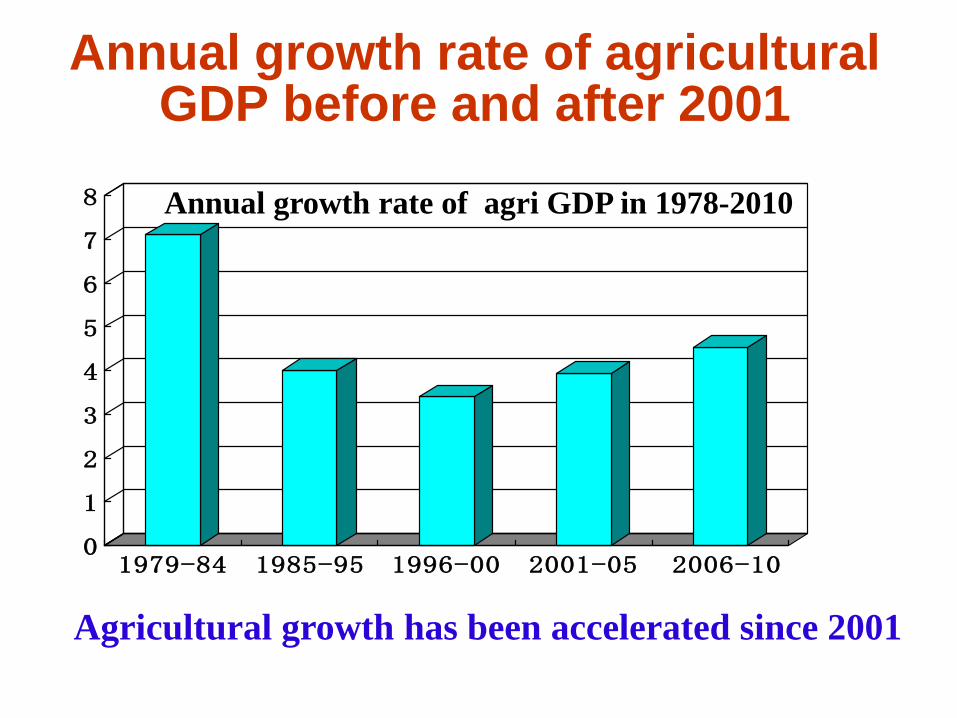
Annual growth rate of agricultural GDP before and after 2001
0
1
2
3
4
5
6
7
8
1979-84 1985-95 1996-00 2001-05 2006-10
Agricultural growth has been accelerated since 2001
Annual growth rate of agri GDP in 1978-2010
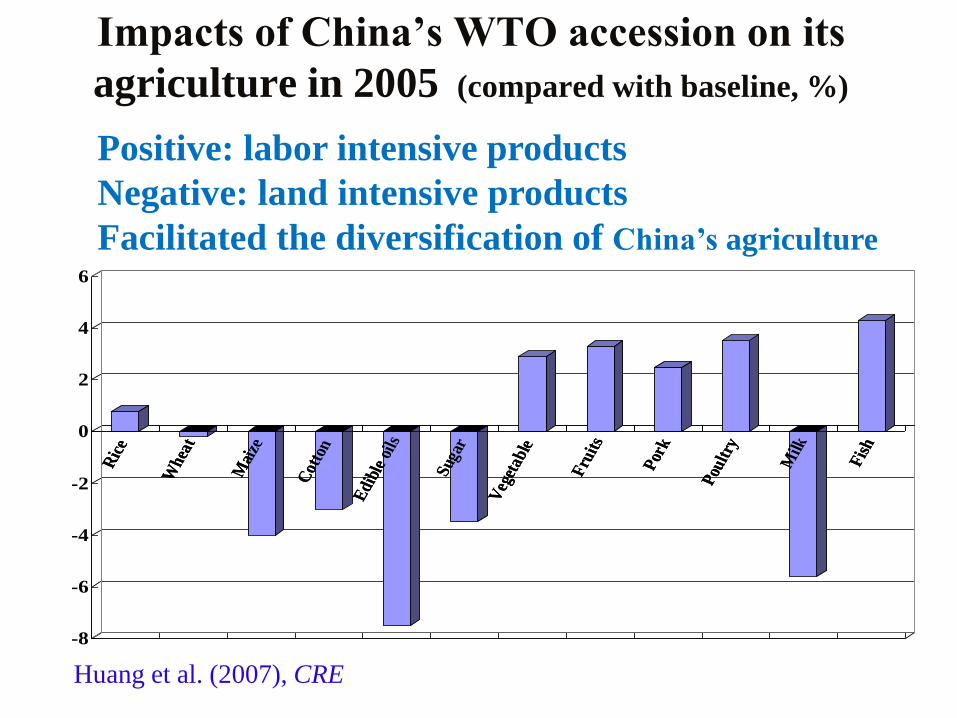
Impacts of China’s WTO accession on its
agriculture in 2005 (compared with baseline, %) R
ice
Whea
t
Mai
ze
Cot
ton
Edi
ble
oils
Sug
ar
Veg
etab
le
Fru
its
Por
k
Pou
ltry
Milk
Fis
h
-8
-6
-4
-2
0
2
4
6
Ric
e
Whea
t
Mai
ze
Cot
ton
Edi
ble
oils
Sug
ar
Veg
etab
le
Fru
its
Por
k
Pou
ltry
Milk
Fis
h
Huang et al. (2007), CRE
Positive: labor intensive products
Negative: land intensive products
Facilitated the diversification of China’s agriculture
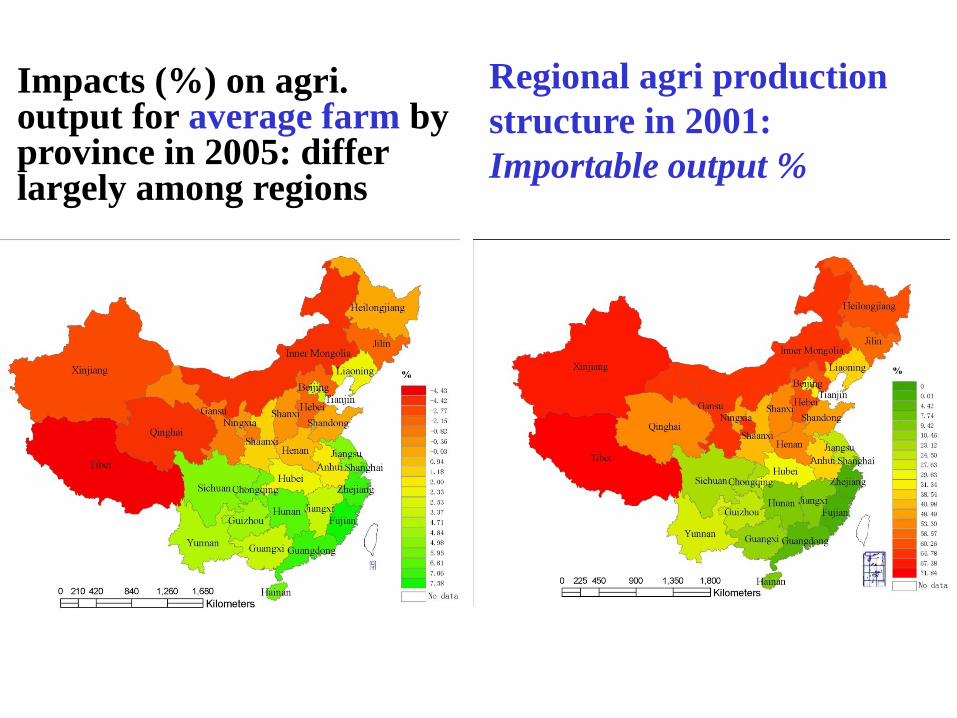
Impacts (%) on agri. output for average farm by province in 2005: differ largely among regions
Regional agri production
structure in 2001:
Importable output %
Why the impact has been moderate?
• Impacts depends on several sets of factors:
ONE: Protection at border?
TWO: How closely into the economy are
households integrated?
THREE: Policy responses…
The rest of presentation
Market liberalization:
- Domestic market reform and integration
- Trade liberalization and falling distortion at
border
Policy responses
Concluding remarks
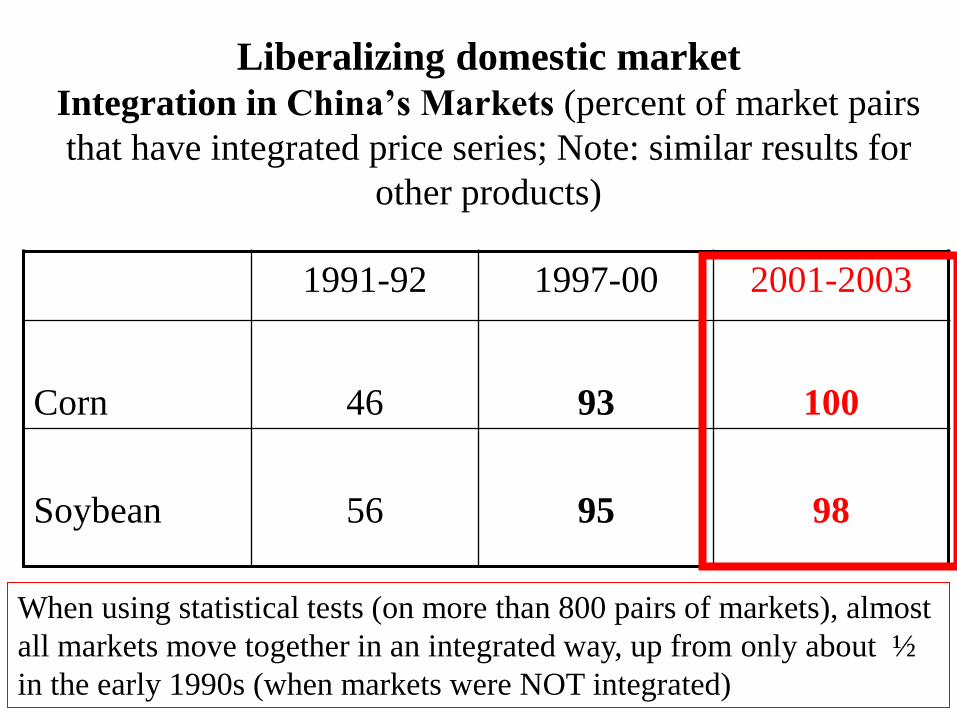
Liberalizing domestic market
Integration in China’s Markets (percent of market pairs
that have integrated price series; Note: similar results for
other products)
1991-92 1997-00 2001-2003
Corn
46
93
100
Soybean
56
95
98
When using statistical tests (on more than 800 pairs of markets), almost
all markets move together in an integrated way, up from only about ½
in the early 1990s (when markets were NOT integrated)
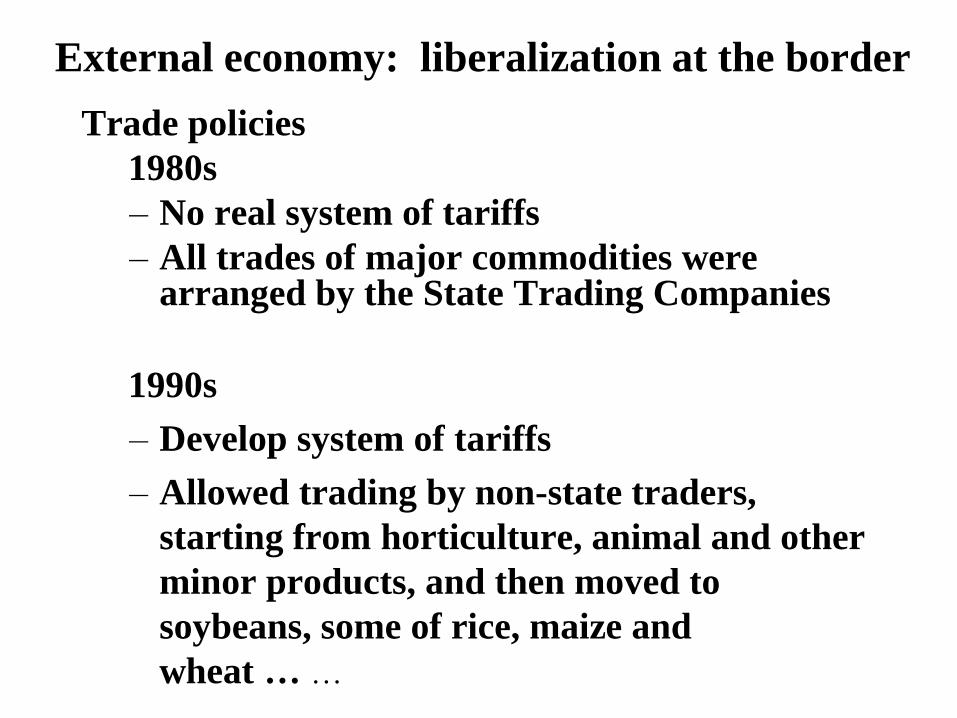
External economy: liberalization at the border
Trade policies
1980s
– No real system of tariffs
– All trades of major commodities were arranged by the State Trading Companies
1990s
– Develop system of tariffs
– Allowed trading by non-state traders,
starting from horticulture, animal and other
minor products, and then moved to
soybeans, some of rice, maize and
wheat … …

Late reform period things changed
-- Promotion of Trading Companies -- Tariffication and reduction of tariff Agricultural tariff rate (%):
0
5
10
15
20
25
30
35
40
45
1992 1998 2001 2005
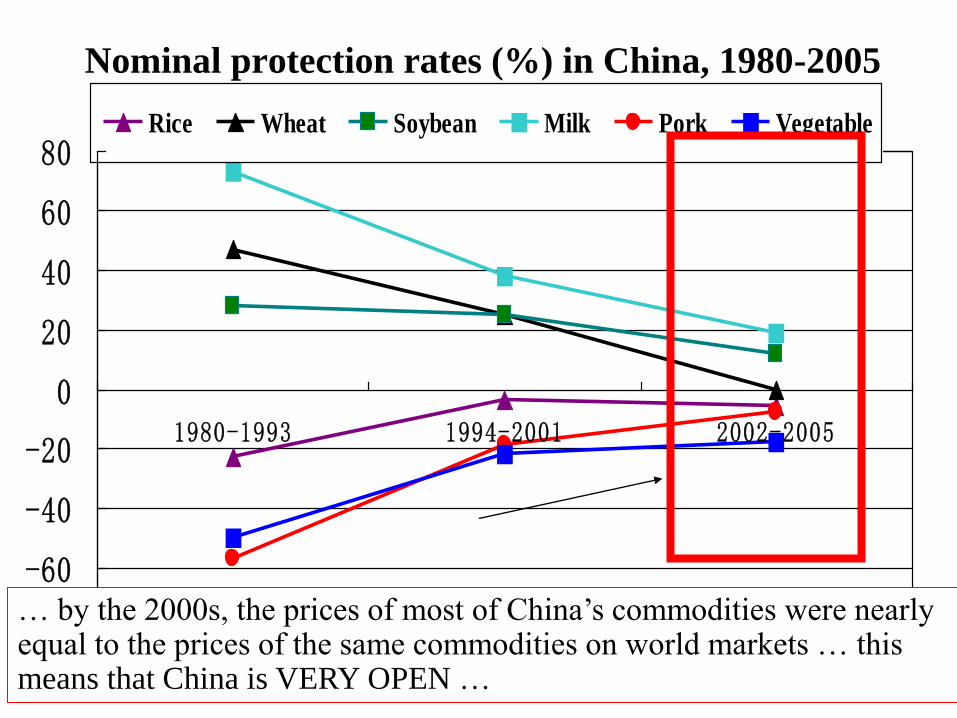
Nominal protection rates (%) in China, 1980-2005
-80
-60
-40
-20
0
20
40
60
80
1980-1993 1994-2001 2002-2005
Rice Wheat Soybean Milk Pork Vegetable
… by the 2000s, the prices of most of China’s commodities were nearly equal to the prices of the same commodities on world markets … this means that China is VERY OPEN …
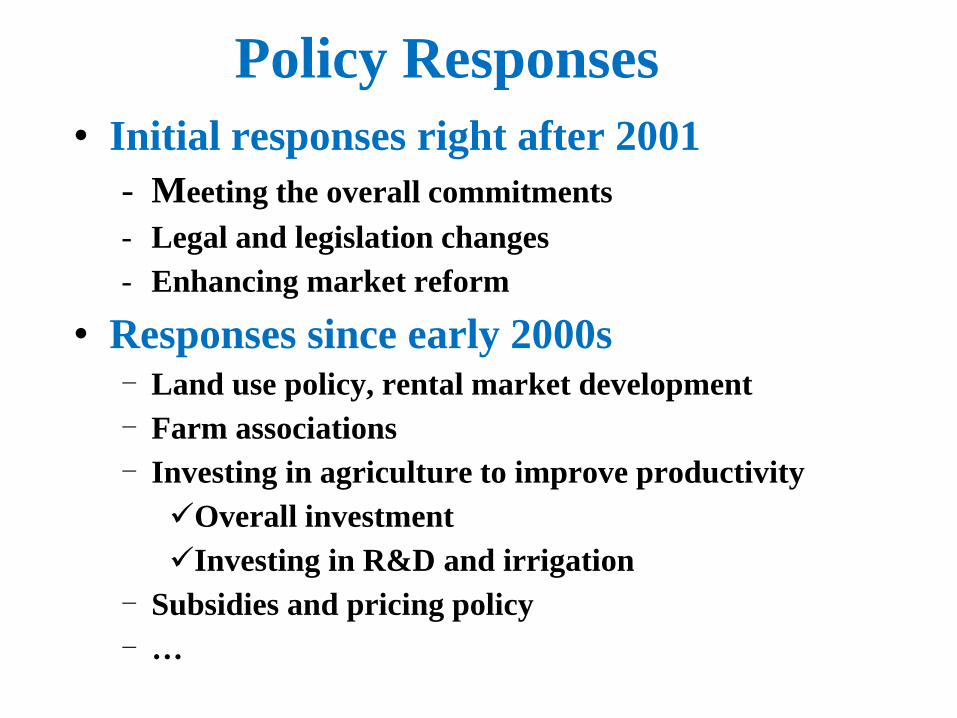
Policy Responses
• Initial responses right after 2001
- Meeting the overall commitments
- Legal and legislation changes
- Enhancing market reform
• Responses since early 2000s - Land use policy, rental market development
- Farm associations
- Investing in agriculture to improve productivity
Overall investment
Investing in R&D and irrigation
- Subsidies and pricing policy
- …
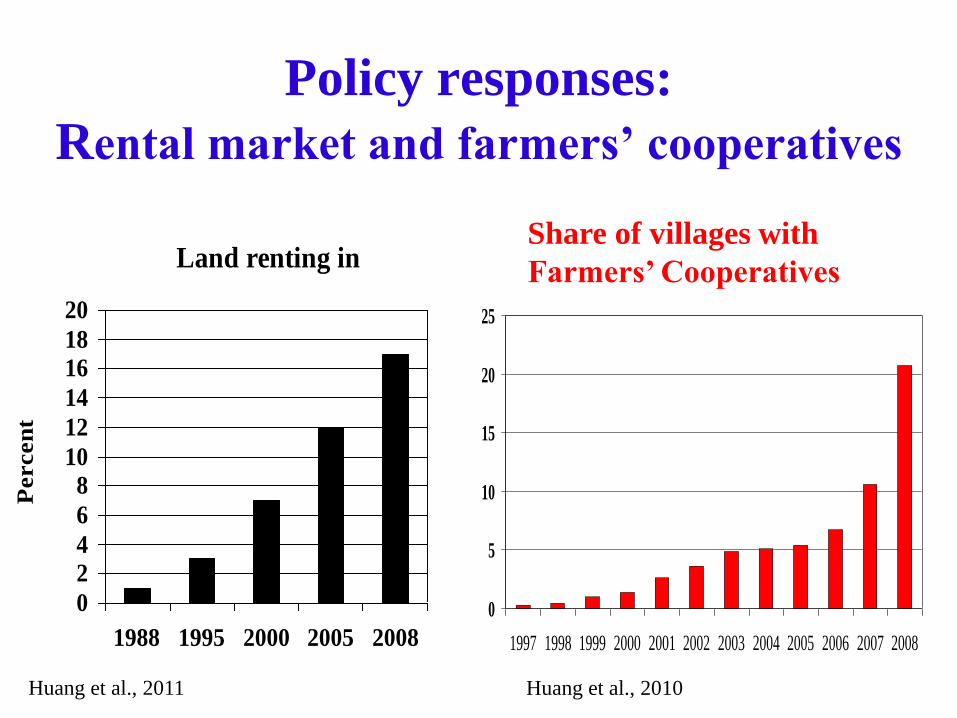
Policy responses:
Rental market and farmers’ cooperatives
Land renting in
0
2
4
6
8
10
12
14
16
18
20
1988 1995 2000 2005 2008
Percen
t
0
5
10
15
20
25
1997 1998 1999 2000 2001 2002 2003 2004 2005 2006 2007 2008
Share of villages with
Farmers’ Cooperatives
Huang et al., 2011 Huang et al., 2010
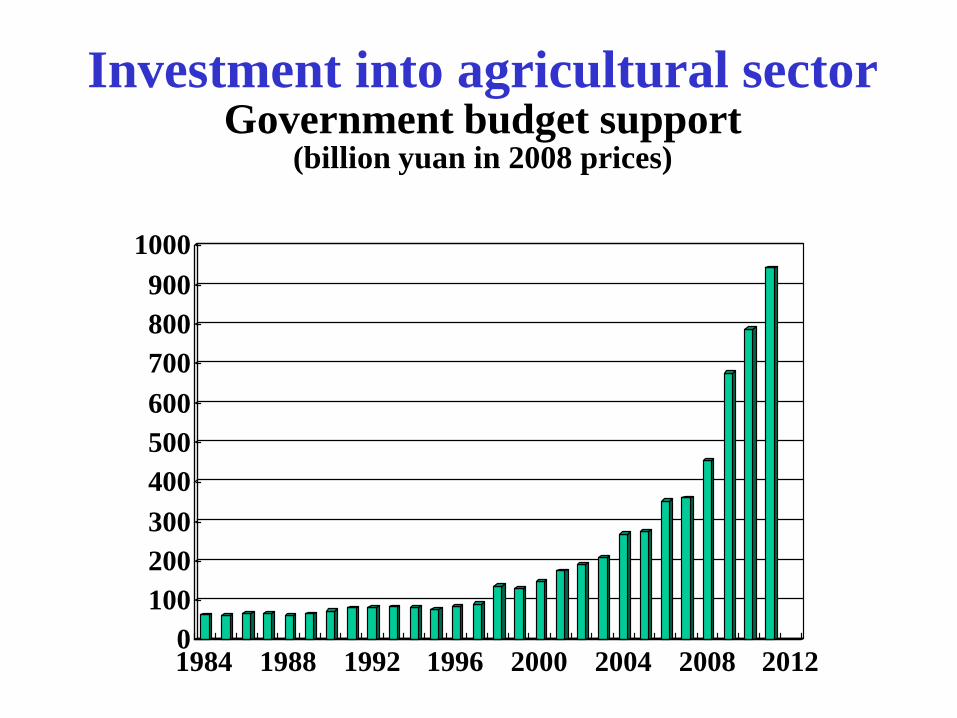
Investment into agricultural sector Government budget support
(billion yuan in 2008 prices)
0
100
200
300
400
500
600
700
800
900
1000
1984 1988 1992 1996 2000 2004 2008 2012
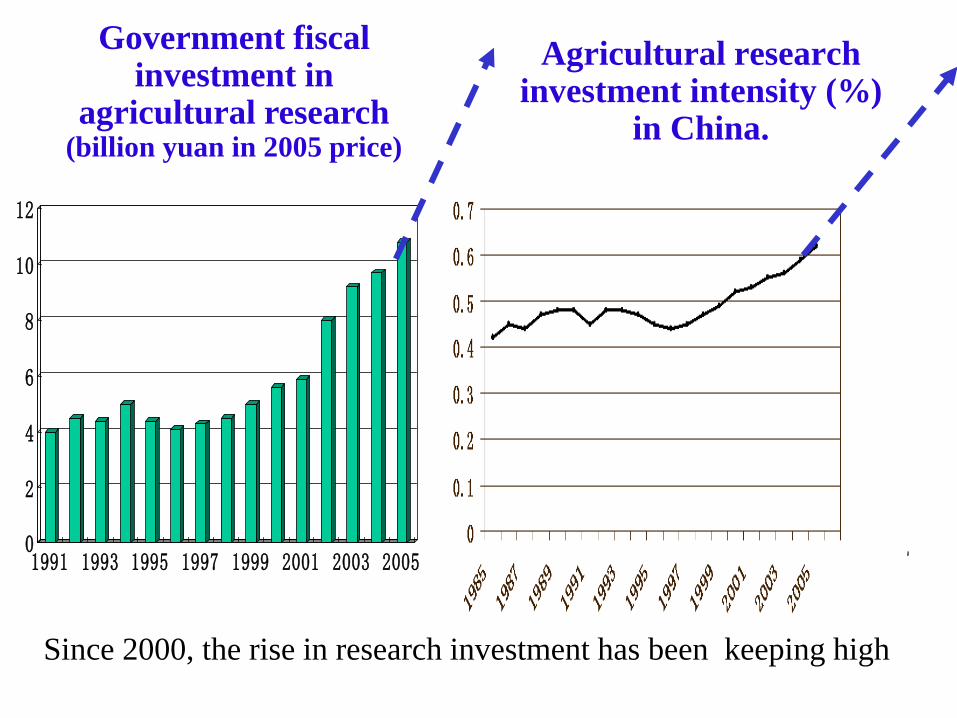
Agricultural research investment intensity (%)
in China.
0
2
4
6
8
10
12
1991 1993 1995 1997 1999 2001 2003 2005
Government fiscal investment in
agricultural research (billion yuan in 2005 price)
Since 2000, the rise in research investment has been keeping high
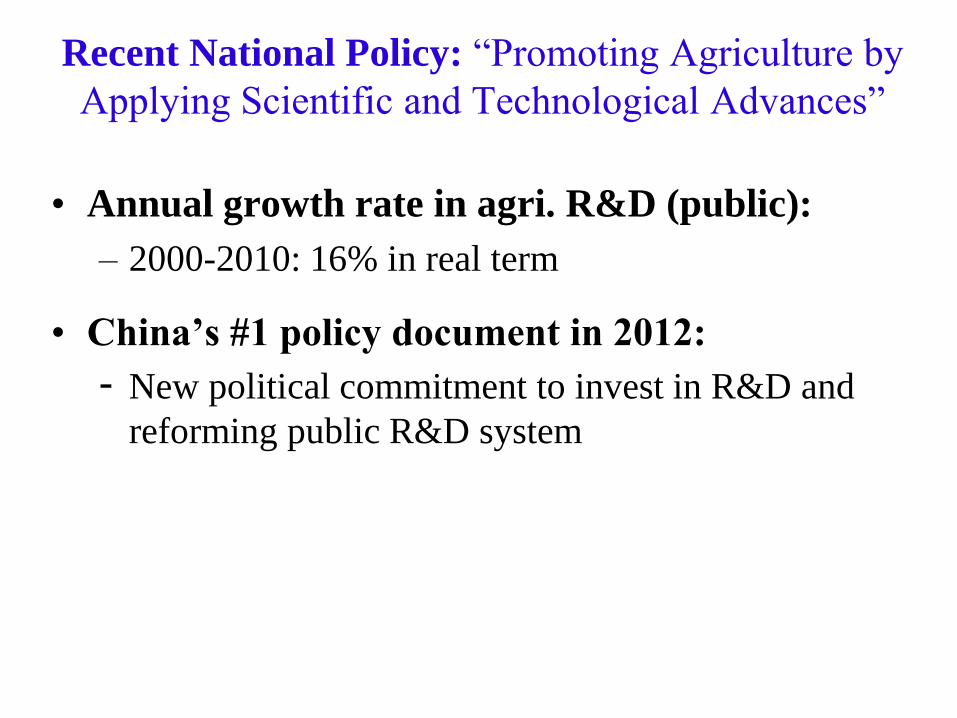
Recent National Policy: “Promoting Agriculture by
Applying Scientific and Technological Advances”
• Annual growth rate in agri. R&D (public):
– 2000-2010: 16% in real term
• China’s #1 policy document in 2012:
- New political commitment to invest in R&D and
reforming public R&D system
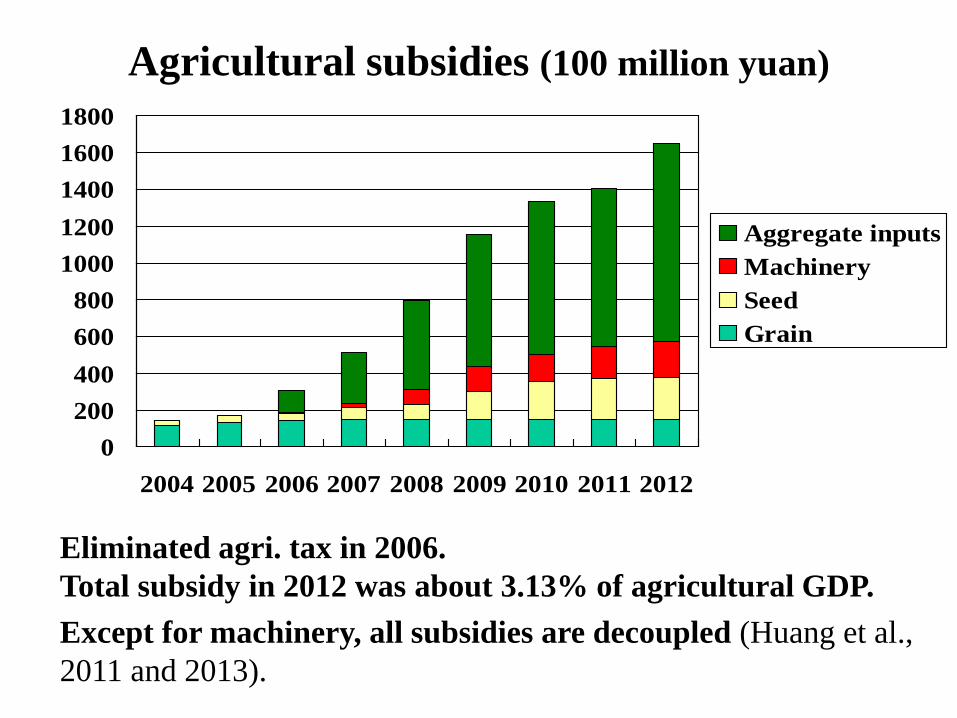
Agricultural subsidies (100 million yuan)
Eliminated agri. tax in 2006.
Total subsidy in 2012 was about 3.13% of agricultural GDP.
Except for machinery, all subsidies are decoupled (Huang et al.,
2011 and 2013).
0
200
400
600
800
1000
1200
1400
1600
1800
2004 2005 2006 2007 2008 2009 2010 2011 2012
Aggregate inputs
Machinery
Seed
Grain
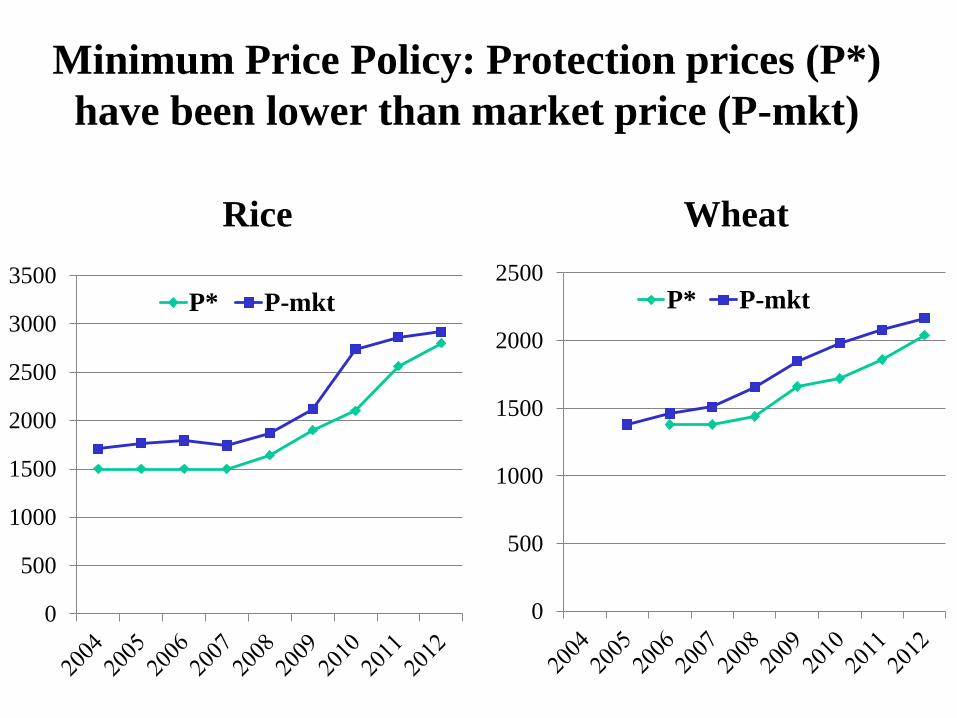
Minimum Price Policy: Protection prices (P*)
have been lower than market price (P-mkt)
0
500
1000
1500
2000
2500
3000
3500
P* P-mkt
Rice
0
500
1000
1500
2000
2500
P* P-mkt
Wheat
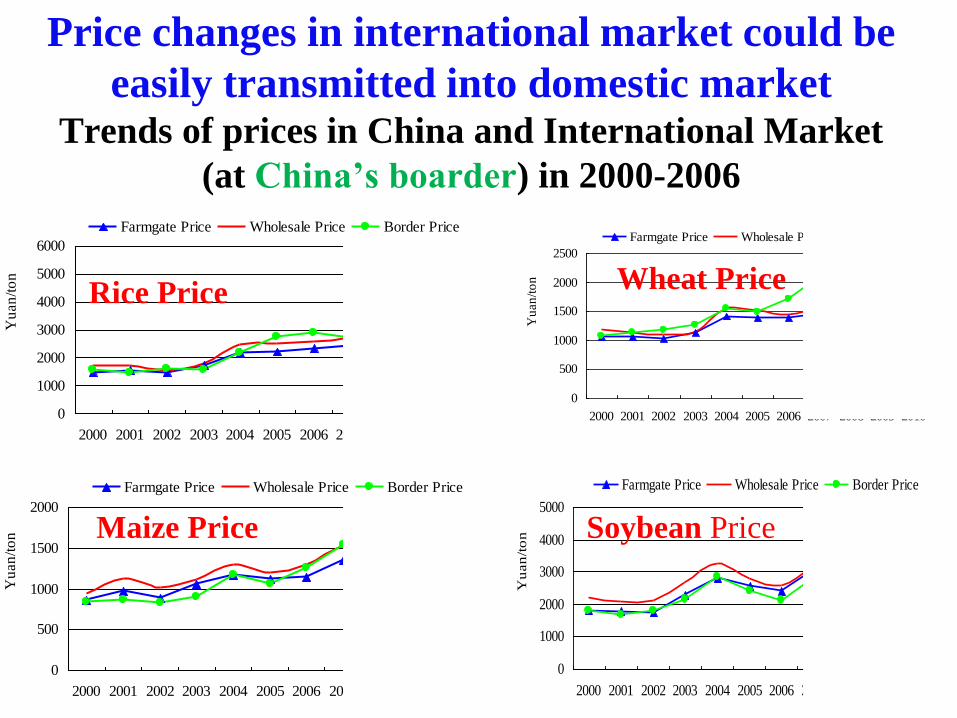
Price changes in international market could be
easily transmitted into domestic market Trends of prices in China and International Market
(at China’s boarder) in 2000-2006
0
1000
2000
3000
4000
5000
2000 2001 2002 2003 2004 2005 2006 2007 2008 2009 2010
Yu
an
/to
n
Farmgate Price Wholesale Price Border Price
0
1000
2000
3000
4000
5000
6000
2000 2001 2002 2003 2004 2005 2006 2007 2008 2009 2010
Yu
an
/to
n
Farmgate Price Wholesale Price Border Price
0
500
1000
1500
2000
2500
2000 2001 2002 2003 2004 2005 2006 2007 2008 2009 2010
Yu
an
/to
n
Farmgate Price Wholesale Price Border Price
0
500
1000
1500
2000
2000 2001 2002 2003 2004 2005 2006 2007 2008 2009 2010
Yu
an
/to
n
Farmgate Price Wholesale Price Border Price
Rice Price Wheat Price
Maize Price Soybean Price
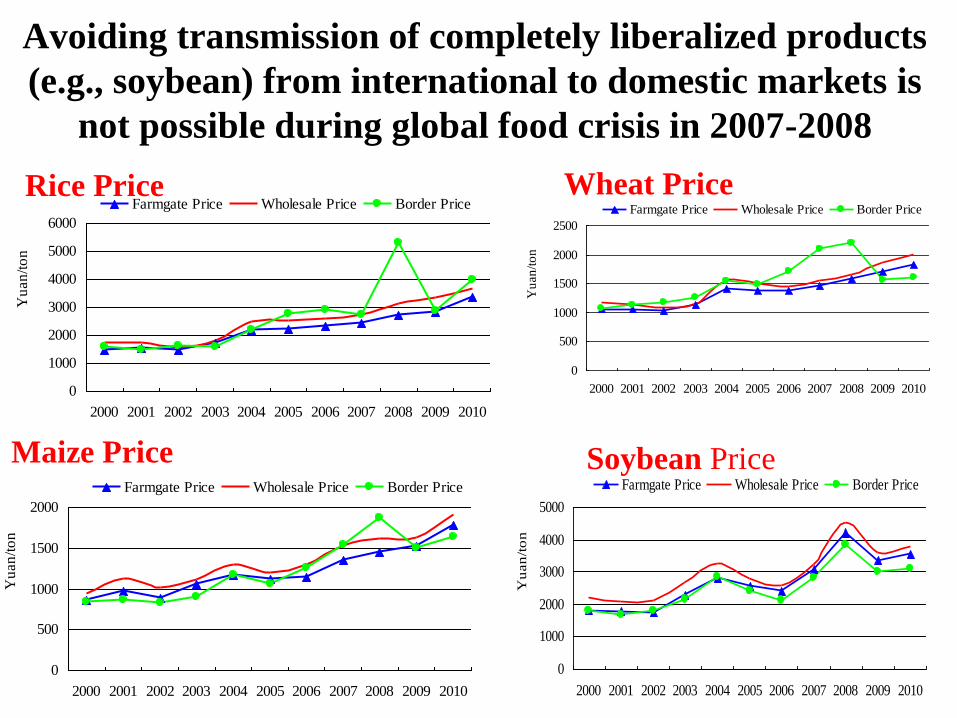
Avoiding transmission of completely liberalized products
(e.g., soybean) from international to domestic markets is
not possible during global food crisis in 2007-2008
0
1000
2000
3000
4000
5000
2000 2001 2002 2003 2004 2005 2006 2007 2008 2009 2010
Yu
an
/to
n
Farmgate Price Wholesale Price Border Price
0
1000
2000
3000
4000
5000
6000
2000 2001 2002 2003 2004 2005 2006 2007 2008 2009 2010
Yu
an
/to
n
Farmgate Price Wholesale Price Border Price
0
500
1000
1500
2000
2500
2000 2001 2002 2003 2004 2005 2006 2007 2008 2009 2010
Yu
an
/to
n
Farmgate Price Wholesale Price Border Price
0
500
1000
1500
2000
2000 2001 2002 2003 2004 2005 2006 2007 2008 2009 2010
Yu
an
/to
n
Farmgate Price Wholesale Price Border Price
Rice Price Wheat Price
Maize Price Soybean Price
Concluding Remarks
• China’s agriculture has changed from the planned to much less distorted economy. By the time China joined WTO, domestic prices of most products approached to the world prices.
• Despite its’ significant WTO commitments, the over impacts of China’s WTO accession have been very moderate.
• However, income disparity among regions has been enlarged with trade liberalization.
• Market reform and trade liberalization before China’s WTO accession and policy responses have facilitated its adapting to the global economy.
Concluding Remarks
• China has also significantly increased its investment in agricultural infrastructure, technologies, and subsidies.
• While most of subsidies are decoupled, China may consider to alter these fiscal budget for other policies (e.g., income transfer and productivity enhanced investment).
• To deal with future food price spikes, a new global governance system is needed to coordinate actions among major food importers and exporters in the world market.