wsaa seawater desalination · pdf filesouthern seawater desalination plant (wa) perth 50 18...
TRANSCRIPT
WSAA SEAWATER DESALINATIONINFORMATION PACK TWO

CONTENTS > 02 Summary points > 02 Seawater desalination > 04 Facts about Australia’s major seawater desalination plants > 07 Contractual agreements > 08 Conclusion > 09 References

WSAA VISION FOR URBAN WATER SERVICES
The Water Services Association of Australia publishes this series of information packs
on behalf of the Australian urban water industry to present the current situation on
key issues of relevance to the industry.
The urban water industry is striving to achieve four outcomes by the year 2030.
By working together with a common goal WSAA members intend to be:
> The most efficient trusted and valued service providers
in Australia
> A compelling voice in national policy making
> A valued partner in urban and land use planning
to enrich communities
As well as taking a strong role in the:
> Stewardship of the urban water cycle
The urban water industry is committed to ensuring customers and communities have
the water they need to live their lives. To achieve this we support a diversified portfolio
of water sources accepting that some water sources have multiple roles. :01
CUSTOMER DRIVEN, ENRICHING LIFE
ABOUT WATER SERVICES ASSOCIATION OF AUSTRALIA (WSAA)
WSAA is the industry body that supports the Australian urban water industry. Its members and associate
members provide water and sewage services to approximately 16 million Australians and many of Australia’s
largest industrial and commercial enterprises. WSAA is always willing to innovate and seek new and smarter
ways of doing things and prides itself on making decisions that are based on sound knowledge
and research.

SEAWATER DESALINATION
Seawater desalination is the removal of salt and impurities from seawater to produce fresh drinking water. Most desalination plants built recently in Australia use a process called reverse osmosis.
Seawater is pumped into the desalination plant from the ocean and passes through two levels of initial filtration to remove most of the large and small particles and impurities. The filtered seawater then enters the reverse osmosis plant where it passes through special membranes that act like microscopic strainers. The pores in the membranes are so tiny that only fresh water flows through leaving behind bacteria, viruses, other impurities and salt.
Around 40% of the water that goes through the desalination plant comes out as fresh drinking water. The remainder is pumped back into the ocean. As it is more salty than normal seawater, special diffusers ensure it mixes quickly and thoroughly back into the sea.
:02
> Desalination is providing resiliency to water supplies.
> Australia’s climate has shifted. There is a high risk that extreme weather events like heatwaves, heavy rainfall, bushfires and cyclones will become even more intense in Australia over the coming decades.
> Seawater desalination plants operate independent of rainfall and can be implemented on a scale that can make a significant difference to overall supply reliability.
> Extreme events can affect water quality in dams, rendering the water unusable. In these situations, such as those experienced in South East Queensland in 2011 and 2013, seawater desalination plants can provide a critical back up supply.
> Major coastal cities in Australia have invested in desalination plants to improve water security.
> In Perth, the climate requires desalination plants to operate as baseload water supplies (ie they operate all the time). They are a ‘must have’ for water supplies. In other cities, desalination plants provide critical back up during dry periods but when it’s raining they can be switched off to reduce operational costs to customers.
> Desalination is an energy intensive process when compared to the bulk supply of surface water from dams in closed catchments.
> All seawater desalination plants in Australia offset their energy impacts by purchasing renewable energy certificates or buying renewable energy from wind farms. Outfall diffusers are designed so that salty brine does not harm the environment.
SUMMARY POINTS

There are a number of reasons Australian cities have invested in seawater desalination:
> The shift in the Australian climate.
> Seawater desalination plants can operate independent of rainfall and can be implemented at a scale that can make a significant difference to overall supply reliability.
> They can be integrated into existing water supply networks without too much difficulty and hence contribute to a diverse, resilient urban water system.
> Australia’s major cities are all located on the coast.
Climate risk Crucially for public water supply in Australia’s most populous areas, the current climate risk includes up to 10% less rainfall across southern Australia by 2030 and 20% by 2050, and more extreme events including drought, floods and bushfires (CSIRO & BOM 2007, 2011). Failing to mitigate these risks appropriately can result in asset damage, disruption to services, breaches of licences, significant financial costs and increased scrutiny from customers, communities and governments. For further details see WSAA’s paper and fact sheet on ‘Climate Change Adaptation in the Australian Urban Water Industry’ (2012).
Diverse, resilient urban water systems Adaptive planning is the industry’s way of managing risk associated with variables which influence demand for water including climate and population growth. Adaptive planning includes the:
> Identification of flexible portfolios of water supply and water efficiency options at the local, regional and city scale.
> Scenario planning, combined with risk assessment.
> Development of severe drought contingency plans.
Importantly, the assessments and resulting outcomes of the above approach are ‘location-dependent’. Climate, weather, geography, population growth, and so on vary. It is not a ‘one size fits all.’ At the local scale or the city-scale, a grid-connected, diverse set of water sources, underpinned by efficient water use, offers significant resilience.
In major coastal cities, large-scale seawater desalination plants operate independently of rainfall. They are part of a mix of water sources that meet the demand for water to maintain green, liveable communities and a productive economy, whatever the weather. For further details see WSAA’s information pack ‘Water Security’ (2013).
:03
During floods, desalinated water provides a high degree of resiliency and reliability. Increased storm intensity generally means greater volumes of runoff and flow within a catchment. Reservoir levels will rise and may result in spill and disruption to reservoir operations. When large amounts of silt affected the drinking water catchments supplying Brisbane in 2011 and 2013 water from the Gold Coast Desalination Plant was brought on line, to meet demand without the need for emergency restrictions.
CASE STUDY ONE – THE IMPACT OF INTENSE STORMS – SOUTH EAST QUEENSLAND
FACTS ABOUT AUSTRALIA’S MAJOR SEAWATER DESALINATION PLANTS
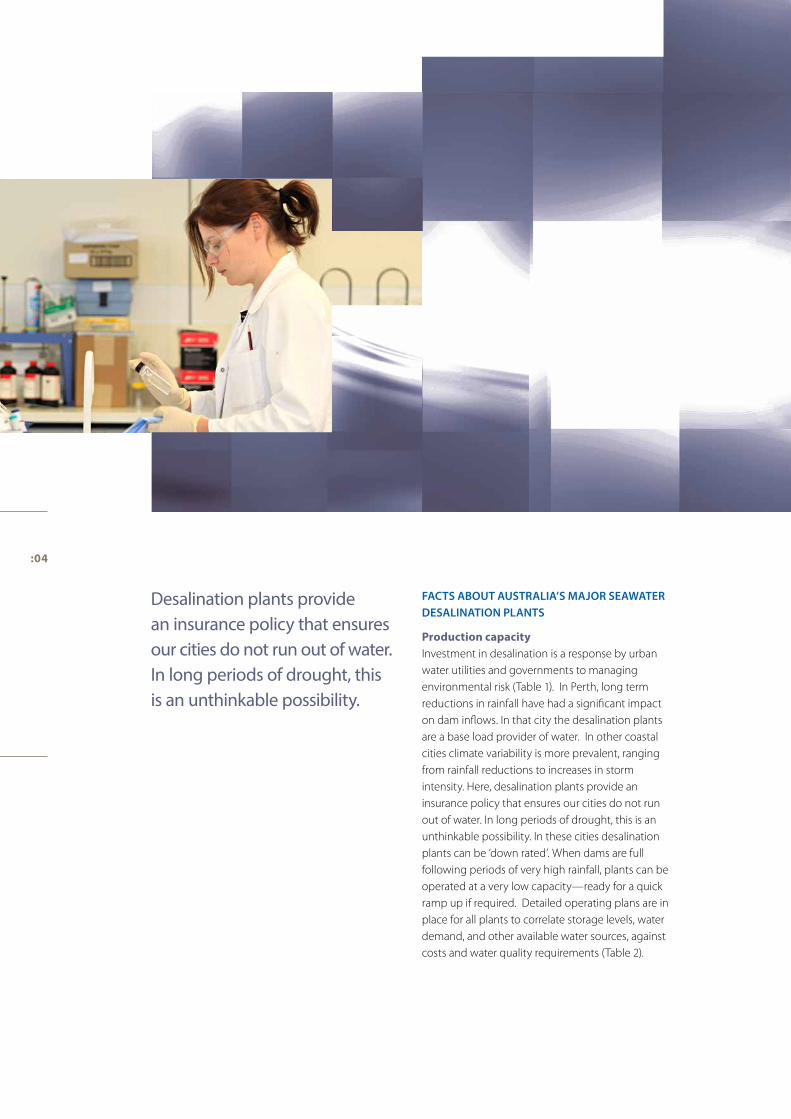
Production capacity Investment in desalination is a response by urban water utilities and governments to managing environmental risk (Table 1). In Perth, long term reductions in rainfall have had a significant impact on dam inflows. In that city the desalination plants are a base load provider of water. In other coastal cities climate variability is more prevalent, ranging from rainfall reductions to increases in storm intensity. Here, desalination plants provide an insurance policy that ensures our cities do not run out of water. In long periods of drought, this is an unthinkable possibility. In these cities desalination plants can be ‘down rated’. When dams are full following periods of very high rainfall, plants can be operated at a very low capacity—ready for a quick ramp up if required. Detailed operating plans are in place for all plants to correlate storage levels, water demand, and other available water sources, against costs and water quality requirements (Table 2).
Desalination plants provide an insurance policy that ensures our cities do not run out of water. In long periods of drought, this is an unthinkable possibility.
:04

:05
Plant SuppliesCurrent situation (March 2013)
Current capacity to meet total customer demand
Wonthaggi Desalination Plant (VIC)
Melbourne Plant on standby If storage levels are below 65% on 31 March, Melbourne Water are bound to provide advice to the Minister that the maximum water order of 150GL/yr is required
Perth Seawater Desalination Plant (WA)
Perth Plant operating at full capacity
Baseload supply
Southern Seawater Desalination Plant (WA)
Perth Plant operating at full capacity
Expect to operate at 50-80GL/yr on average with ability to provide 100GL in drought conditions
Kurnell Desalination Plant (NSW)
Sydney Plant on standby If total dam storage levels are below 70% the plant will operate at full production capacity until storages reach 80%
Gold Coast Desalination Plant (QLD)
SE Queensland Plant on standby If SE Queensland’s dam capacity drops below 60% the plant will move from standby mode to full production
Port Stanvac Desalination Plant (SA)
Adelaide Proving/testing period until end of 2014
At the end of December 2014 if traditional sources eg dams and river supply are available the desalination plant will be sparingly used and may remain in standby mode.
Plant SuppliesCapacity used /yr (GL)
Current capacity to meet total customer demand
Additional capacity (GL) if current plant operations expanded
Wonthaggi Desalination Plant (VIC)
Melbourne 150 33% of demand 50
Perth Seawater Desalination Plant (WA)
Perth 45 17 – 25% of demand 0
Southern Seawater Desalination Plant (WA)
Perth 50 18 – 25% of demand The Stage 2 expansion is underway. This will increase capacity to 80GL upon completion with the ability to provide up to 100GL in a drought.
Kurnell Desalination Plant (NSW)
Sydney 90 15 – 20% of demand 90
Gold Coast Desalination Plant (QLD)
SE Queensland 45 18% of demand 0
Port Stanvac Desalination Plant (SA)
Adelaide 100 Up to 50% of demand Plant extension was completed in December 2012 from 50 to 100GL
TABLE 1 CURRENT INVESTMENT IN DESALINATION PLANTS
TABLE 2 CURRENT OPERATING STRATEGIES FOR DESALINATION PLANTS
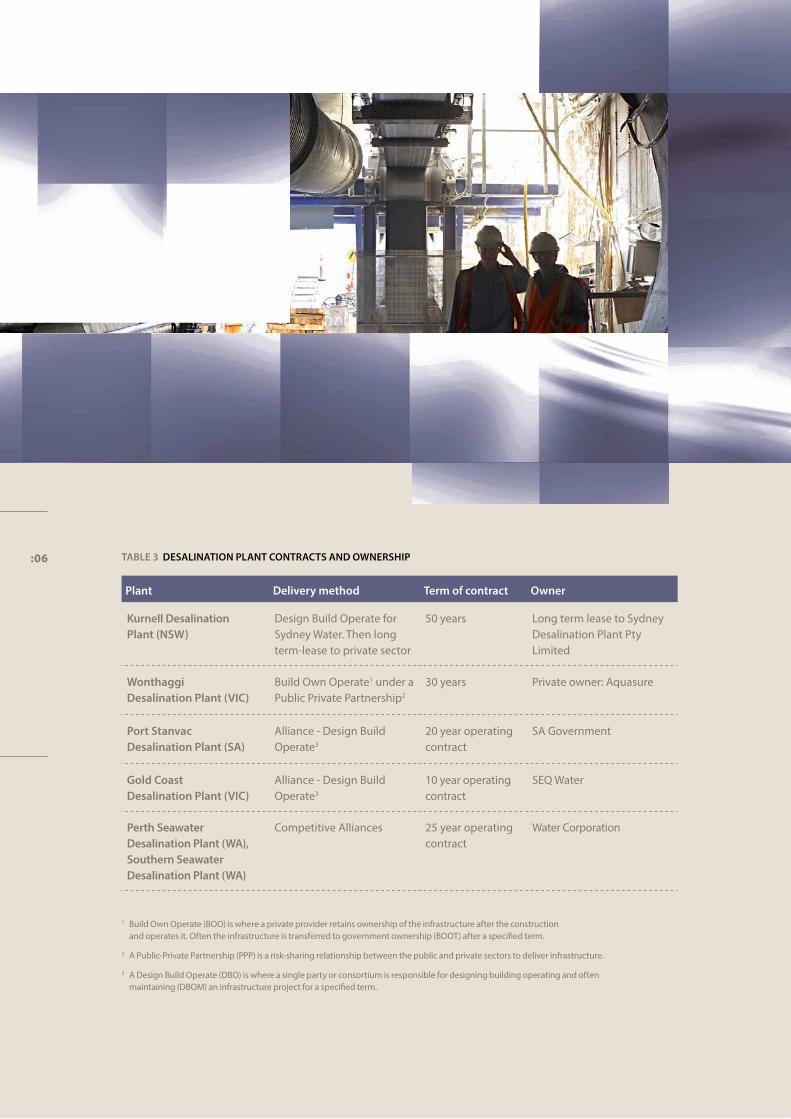
:06 TABLE 3 DESALINATION PLANT CONTRACTS AND OWNERSHIP
Plant Delivery method Term of contract Owner
Kurnell Desalination Plant (NSW)
Design Build Operate for Sydney Water. Then long term-lease to private sector
50 years Long term lease to Sydney Desalination Plant Pty Limited
Wonthaggi Desalination Plant (VIC)
Build Own Operate1 under a Public Private Partnership2
30 years Private owner: Aquasure
Port Stanvac Desalination Plant (SA)
Alliance - Design Build Operate3
20 year operating contract
SA Government
Gold Coast Desalination Plant (VIC)
Alliance - Design Build Operate3
10 year operating contract
SEQ Water
Perth Seawater Desalination Plant (WA), Southern Seawater Desalination Plant (WA)
Competitive Alliances 25 year operating contract
Water Corporation
1 Build Own Operate (BOO) is where a private provider retains ownership of the infrastructure after the construction and operates it. Often the infrastructure is transferred to government ownership (BOOT) after a specified term.
2 A Public-Private Partnership (PPP) is a risk-sharing relationship between the public and private sectors to deliver infrastructure.
3 A Design Build Operate (DBO) is where a single party or consortium is responsible for designing building operating and often maintaining (DBOM) an infrastructure project for a specified term.
Contractual arrangements Government owned water authorities make the decision to run a desalination plant, and the volume of water to produce. Despite this some plants are privately owned or operated. State government policy determines the specific contractual arrangements regarding the ownership and operation of desalination plants. Table 3 shows contracts and ownership arrangements currently in place.
Financial cost Drinking water from dams costs approximately $0.30 – $0.90 /kL. The cost to desalinate seawater to drinking water quality is $1.50 - $5.00 /kL. The cost difference is due to the higher cost of desalination plants over conventional water treatment plants. This is due to higher treatment requirements with the associated increased energy use..
Non-operating plants Jumping from zero desalinated water in Australian cities in 2005 to 500GL capacity now, has cost $10.1b. In just eight years it has been the most significant collective spend on water infrastructure in our major cities in 50 years.
The relative difference in costs between dams and desalination is magnified because most large dams were built, and partially paid for, many years ago. Current water users have been receiving cheap water from the old infrastructure paid for by older generations, but are now paying for the current ‘spike’ in new infrastructure costs. These costs to some extent will equalise over time.
Reducing production from desalination plants when dam storage levels are high is a sensible approach. It can make operational savings that may be passed on to customers by using the cheapest water first, and delaying use of the more expensive water. However, even when desalination plants are not producing water, the costs of preserving, maintaining and financing these plants still need to be met. The fixed costs represent the value of water security.
Recent price rises after many years of relatively low increases, alongside energy price increases, has seen a rise in customer hardship cases. Water utilities offer a wide range of programs to assist customers in genuine hardship.
:07
:08
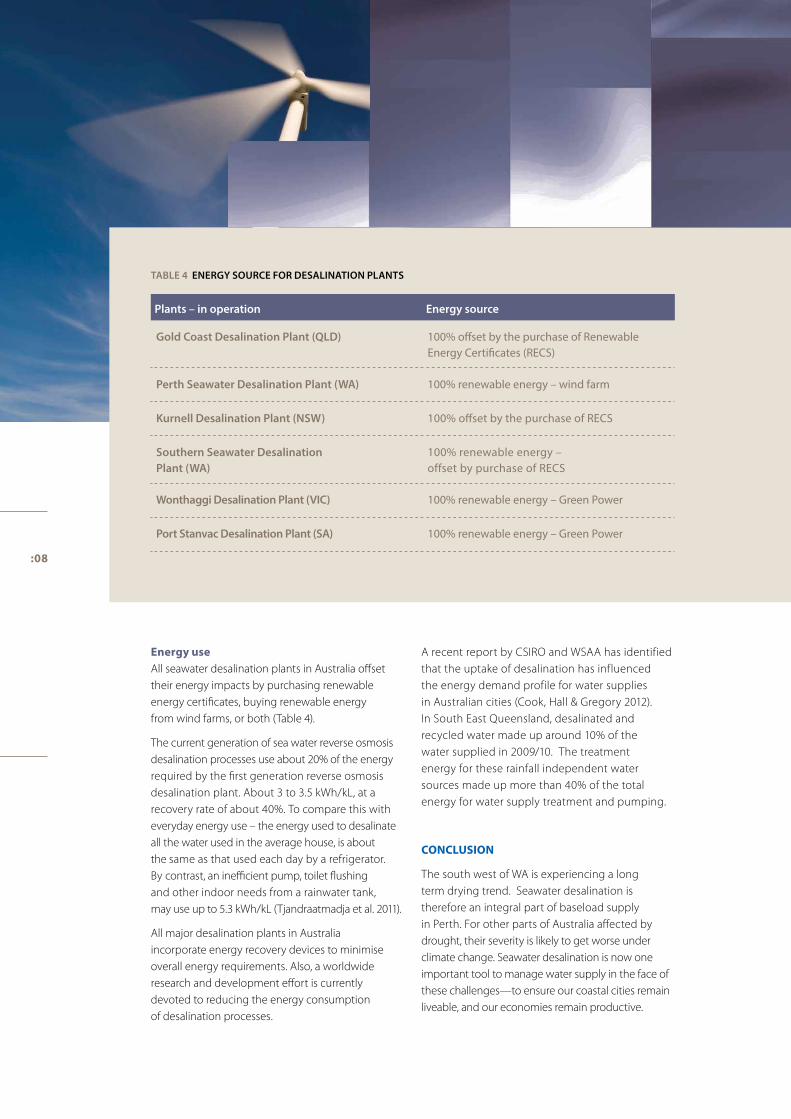
Energy use All seawater desalination plants in Australia offset their energy impacts by purchasing renewable energy certificates, buying renewable energy from wind farms, or both (Table 4).
The current generation of sea water reverse osmosis desalination processes use about 20% of the energy required by the first generation reverse osmosis desalination plant. About 3 to 3.5 kWh/kL, at a recovery rate of about 40%. To compare this with everyday energy use – the energy used to desalinate all the water used in the average house, is about the same as that used each day by a refrigerator. By contrast, an inefficient pump, toilet flushing and other indoor needs from a rainwater tank, may use up to 5.3 kWh/kL (Tjandraatmadja et al. 2011).
All major desalination plants in Australia incorporate energy recovery devices to minimise overall energy requirements. Also, a worldwide research and development effort is currently devoted to reducing the energy consumption of desalination processes.
A recent report by CSIRO and WSAA has identified that the uptake of desalination has influenced the energy demand profile for water supplies in Australian cities (Cook, Hall & Gregory 2012). In South East Queensland, desalinated and recycled water made up around 10% of the water supplied in 2009/10. The treatment energy for these rainfall independent water sources made up more than 40% of the total energy for water supply treatment and pumping.
CONCLUSION
The south west of WA is experiencing a long term drying trend. Seawater desalination is therefore an integral part of baseload supply in Perth. For other parts of Australia affected by drought, their severity is likely to get worse under climate change. Seawater desalination is now one important tool to manage water supply in the face of these challenges—to ensure our coastal cities remain liveable, and our economies remain productive.
TABLE 4 ENERGY SOURCE FOR DESALINATION PLANTS
Plants – in operation Energy source
Gold Coast Desalination Plant (QLD) 100% offset by the purchase of Renewable Energy Certificates (RECS)
Perth Seawater Desalination Plant (WA) 100% renewable energy – wind farm
Kurnell Desalination Plant (NSW) 100% offset by the purchase of RECS
Southern Seawater Desalination Plant (WA)
100% renewable energy – offset by purchase of RECS
Wonthaggi Desalination Plant (VIC) 100% renewable energy – Green Power
Port Stanvac Desalination Plant (SA) 100% renewable energy – Green Power

REFERENCES
Cook, S, Hall, M & Gregory, A (2012), ‘Energy use in the provision and consumption of urban water in Australia: an update’, CSIRO Water for a Healthy Country Flagship, Australia, prepared for the Water Services Association of Australia.
CSIRO and Bureau of Meteorology (2007), ‘Climate change in Australia’, technical report, 140 pp, www.climatechangeinaustralia.gov.au.
National Climate Centre, Bureau of Meteorology (2011), ‘Frequent heavy rain events in late 2010/early 2011 lead to widespread flooding across eastern Australia’, Special Climate Statement 24.
Tjandraatmadja, G, Pollard, C, Sharma, A and Gardner, T (2011), ‘Dissecting rainwater pump energy use in urban households’, Science Forum and Stakeholder Engagement: Building Linkages, Collaboration and Science Quality, (eds) D.K., Begbie and S.L., Wakem, Urban Water Security Research Alliance, September 2011, Brisbane, Queensland, pp 35.
WSAA (2012), ‘Climate change adaptation in the Australian urban water industry’, Water Services Association of Australia.
WSAA (2013), ‘Urban water security’, Water Services Association of Australia.
PHOTOGRAPHY ACKNOWLEDGEMENTS
SA Water Sydney Water Water Corporation

Melbourne Office Level 8 Suite 802 401 Docklands Drive Docklands VIC 3008
Telephone 03 8605 7666 Facsimile 03 8605 7612
Copyright This document is copyright. No part of this document may be reproduced or transmitted apart from that permitted under the Copyright Act 1968, without the express, written permission of the Water Services Association of Australia Ltd.
Disclaimer The Water Services Association of Australia Ltd and individual contributors are not responsible for the results of any actions taken on the basis of information contained in this publication. WSAA and individual contributors disclaim all and any liability to any person in respect of anything, and the consequences of anything, done or omitted to be done by a person in reliance upon the whole or part of this publication.
Water Services Association of Australia Ltd 2013 ALL RIGHTS RESERVED
Sydney Office Suite 1 Level 30 9 Castlereagh Street Sydney NSW 2001
GPO Box 915 Sydney NSW 2001
Telephone 02 9221 5966 Facsimile 02 9221 5977
www.wsaa.asn.au
Check website for new Sydney office details after November 2013