world_payments_report_2009.pdf - the bankwatch · world non-cash payments markets and trends ......
TRANSCRIPT

World Payments
REPORT2009

TABLE OF CONTENTS 3 Preface
4 Summary of Key Findings
World Non-cash Payments Markets and Trends
7 Non-cash Payments Volumes Continue to Grow
16 Payments Innovation in Asia is Taking Many Forms
SEPA Update
25 Further Progress has been Made Towards SEPA, Despite the Financial Crisis
32 SEPA - Unresolved Issues and Practical Challenges
Global Transaction Services
39 GTS Products are Core to Corporate and Financial Institution Clients
44 Regulation, Client Needs and IT are Key Drivers of the Shifting GTS Landscape
47 Successful GTS Businesses are Employing Astute Strategies
53 What Does the Future Hold for GTS?
55 Methodology
56 Glossary

Now in its fifth year, The World Payments Report from Capgemini, The Royal Bank of Scotland (RBS), and the European Financial Management & Marketing Association (Efma) this year looks at the payments business amid weak global economic conditions and a challenging time for the banking industry.
Payments and other transaction services (cash management, trade finance, cards issuing and acquiring and securities services) are important to banks’ economics and customer relationships. These services generate recurrent revenues—providing assurance for the bottom line at a time when interest income is being squeezed—as well as providing an important source of liquidity. The services are also a mainstay of customer relationships and excellence in transactions can ensure a wider relationship (and returns) for the bank as a whole.
Given these dynamics, the World Payments Report 2009 looks at the trends in global payments volumes, but also explores the attraction of transaction services as a business. We specifically discuss the key success factors in establishing and operating a successful Global Transaction Services (GTS) business, drawing in particular on 36 interviews we conducted with 16 major players and 20 of their corporate clients.
As with past reports, we also provide an update on the Single Euro Payments Area (SEPA), which continues to be driven by the political will to drive a unified financial system for Europe. The last year or so was marked by significant legal, market and regulatory achievements on the road to SEPA implementation, but, as we explain, roadblocks remain—and banks, corporates, public administrations and other potential users of SEPA instruments need to overcome a range of concerns for migration to speed up.
We hope this year’s report provides useful insights.
Preface
Bertrand LavayssièreManaging Director Global Financial Services
Capgemini
Brian StevensonChief Executive Global Transaction Services
The Royal Bank of Scotland
Patrick DesmarèsSecretary General
European Financial Management & Marketing Association
3

Summary of Key FindingsDemand will always exist for global payments services, which underpin and facilitate a range of economic activities, including the transfer (often across borders) of goods and services. However, the health of the global economy is obviously a key determinant of which services are used, to what degree and by which constituents. The World Payments Report 2009 looks at the global payments arena against the backdrop of the most severe financial crisis and economic downturn in recent memory. The following are among our key findings:
� The worldwide volume of payments made using non-cash instruments (direct debits, credit transfers, cards and cheques) grew 8.6% to 250 billion transactions in 2007. The use of cards continues to be the single strongest driver of volumes. Global card transactions (credit and debit) grew 14.5% in 2007.
� The ten largest markets accounted for 92% of all non-cash payments transactions in 2007, with the global market dominated by the US and the Eurozone. Together, they accounted for 61% of all transactions. Beyond these two, the market is still highly fragmented, but developing economies are growing their share every year. In Europe, countries that are committed to promoting and investing in non-cash payments have achieved healthy growth in transactions numbers.
� Payments volumes held up in 2007, but only 2008 data will confirm how well the numbers held up in the face of the financial crisis. Early indications suggest US and European card usage was fairly strong in 2008, but 2008-09 data and forecasts on activities such as workers’ remittances and world exports are showing signs of weakness that could ultimately slow down growth in overall payments volumes.
� A range of initiatives in Asia have demonstrated that payments innovation is a potential source of revenue for banks. Emerging payment methods can also help banks to attract and then retain new clients, reduce the use of cash, create new offers, reach unbanked markets and decrease operational costs. But banks must fight to stay relevant and consider a variety of business models or the benefits could be lost to other service providers.
4

WoRld PAyMENTS REPoRT 2009
� Progress towards a Single Euro Payments Area (SEPA) has continued, despite the financial crisis. In Europe, the strong political will to drive a unified financial system remained intact, so efforts continued in earnest to move ahead with SEPA implementation:
– A year after the launch of SEPA Credit Transfers (SCTs) major banks are SCT-compliant and SCT volumes continue to grow, albeit overall volumes are minimal so far and mainly cross border.
– SEPA Direct Debits (SDDs) and the e-Mandate service will launch November 2nd, 2009. Arguments over Multilateral Balancing Payments (MBPs) have been settled for now.
– The European Payments Council (EPC) is continuing with the SEPA Cards Framework (SCF) and multiple schemes appear certain to exist. The major global schemes are likely to dominate in the short term.
– The Payment Services Directive (PSD), European legislation that goes beyond SEPA but is a prerequisite for SEPA’s proper functioning, should be largely in place in time for the November 2009 national transposition deadline.
� Obstacles to SEPA implementation continue to exist:
– SEPA cards face operational hurdles, such as issues over scheme compliance. The ongoing uncertainties surrounding interchange fees could also present a significant practical hurdle to the SCF.
– For SEPA migration to speed up, banks need to be more convinced of the business case for moving aggressively, corporates need more information to justify the investments (e.g., in information technology, IT) required for SEPA compliance and public authorities need to become SEPA advocates.
– The risk of a mini-SEPA1 remains real unless stakeholders get certainty on key issues: an end-date for full migration to SEPA; evidence that SEPA solutions can provide tangible improvements in operational performance; and clarity on standards to be used for SEPA payments (e.g., around data) so participants can prioritise IT investments and SEPA-implementation plans.
� For banks, Transaction Services (primarily payments services, cash management and trade finance, along sometimes with cards issuing and acquiring and securities services) has become an even more attractive business in light of the financial crisis, because it has ‘crisis resiliency’, still generating relatively stable revenue from fees when economic conditions are weak.
– Among Global Transaction Services (GTS) divisions—integrated businesses that handle all services in a large-scale integrated organisation dedicated to large corporates and financial institutions—an estimated 50%-65% of revenues has historically come from interest on balances or float, with fee income representing the remainder.
– Some GTS divisions suffered from deteriorating market conditions and reduced business volumes in the first quarter of 2009, but our analysis shows GTS still accounts for a significant share (5%-20%) of group revenues, and remains an important source of revenue for banks, with a cost/income ratio as low as 50%.
� For banks that want to build or maintain a GTS franchise and generate value with new products and services, especially within the constantly changing and ever more regulated payments environment, decisions around four parameters are critical:
– Ambitions. Banks with a GTS vision must make a candid assessment from the outset of their ability to build a critical mass of payment transactions, clients and geographies, and fulfil their GTS ambitions.
– Corporate Structure. GTS operations need to be structured in a way that enables the bank to nurture the business and demonstrate strategic commitment to its goals. There is merit to structuring GTS as a stand-alone division, but some banks also use a matrix organisation.
– Investment. An inevitable part of the evolution for any GTS division is deciding whether to invest in the bank’s network and infrastructure, establish capability partnerships or outsource in order to build or consolidate a strong GTS position and deliver solutions.
– Offering. Banks must also commit to, and invest in, renewing and adapting a range of products and services to meet the evolving needs of corporates and financial institutions, provide added value for their clients, and keep the bank from being relegated to commoditised transactions processing.
1 In a mini-SEPA, legacy national instruments would continue to be used for domestic transactions while SEPA instruments are used for cross-border transactions.
5WoRld PAyMENTS REPoRT 2009

6

SECTioN TiTlE l1SECTioN TiTlE l2
7WoRld PAyMENTS REPoRT 2009
CHAPTER 1 HIGHLIGHTS
� The worldwide volume of payments made using non-cash instruments (direct debits, credit transfers, cards and cheques) grew 8.6% to 250 billion transactions in 2007. The use of cards continues to be the single strongest driver of volume growth. Global card transactions (credit and debit) grew 14.5% in 2007. Indeed, cards (especially debit cards) are driving growth everywhere.
� The ten largest markets accounted for 92% of all non-cash payments transactions in 2007 (when they represented 84% of global GDP). However, the global market remains dominated by the US and Eurozone2, which together accounted for 61% of transactions. Beyond the top two, the market is still highly fragmented, but developing economies continue to grow their share of global transactions every year.
� In Europe, the use of non-cash payments instruments is clearly greatest in countries where all stakeholders in the payments value chain (banks, merchants, and customers) are committed to their development and use. Strong growth in non-cash payments markets could be achieved throughout Europe with this kind of commitment. However, without facilitation, the volume of non-cash payments is unlikely to expand beyond any growth in GDP, and its growth is likely to slow in a downturn.
� Initial indications show the payments business has withstood the financial crisis well, though only 2008 data will confirm how resilient the payments sector was as the crisis progressed. Early numbers suggest US and European card usage was fairly strong in 2008, although 2008-09 data and forecasts on sub-segment activities such as workers’ remittances and world exports are showing signs of weakness that could ultimately reduce overall payments volumes.
� Unlike in the US, where cash in circulation has decreased by 7.4% in 2007, cash is still increasing in Europe, albeit at a slower rate of 7.8% (compared to an annual 11% growth rate from 2002 to 2007).
World Non-cash Payments Markets and TrendsChapter 1
Non-cash Payments Volumes Continue to Grow
2 In this report, ‘the Eurozone’ refers to the thirteen countries that were members of the Eurozone in 2007: Austria, Belgium, Finland, France, Germany, Greece, Ireland, Italy, Luxembourg, Portugal, Netherlands, Slovenia, and Spain. Also see glossary for this and other payments terms.

8
GLOBAL USE OF NON-CASh PAyMENT INSTRUMENTS IS STILL GROWING STEAdILy
Global non-cash payments volumes have grown continuously in recent years, and 2007 was no exception. The volume of payments grew 8.6%, to 250 billion transactions (see Figure 1.1). over the 2001-07 period, the volume of non-cash transactions grew by a sustained 8.6%, outpacing the 3% growth in world gross domestic product (GdP).
The use of cards continues to be the single strongest driver of global non-cash payments volumes. Global card transactions (credit and debit) grew 14.5% in 2007, and at a steady rate of 15.7% in 2001-07.
The number of cards also increased in 2007, especially in latin America (+28.2%) and CEMEA (Central Europe, Middle East and Africa, +21.3%). The number of debit cards was up 17.2%, and credit cards up 5%.
The use of credit transfers and direct debits also grew in 2007, by 6.9% and 9.5%, respectively. The global use of cheques continues to decrease, and was down 6.8% in 2007.
The ten largest markets accounted for 92% of all non-cash payments transactions in 2007 (when they represented 84% of global GdP). Still, the global market remains dominated by the US and Eurozone, which together accounted for 61% of transactions in 2007 (see Figure 1.3), little changed from a year earlier.
Figure 1.1 Number of Worldwide Non-cash Transactions by Region (billions), 2001–2007
221
545
20072001
5174
108
19
36
81
89
91%
6%
153 250
80%
15%
Total Worldwide Non-cash
Transactions
■ CEMEA without Russia
■ Rest of Asia
■ Latin America without Brazil
■ BRIC
■ Japan + Australia +
South Korea + Singapore
■ North America (US + Canada)
■ Europe (including Eurozone)
Source: ECB DWH—2007 figures, released Nov. 2008; Bank for International Settlements—Red Book—2007 figures, released March 2009; IMF database; Central Bank Sources; Capgemini research and analysis, 2009.
in mature economies overall, non-cash payments continued to grow at a steady pace (around 5%) in 2007, and accounted for 80% of worldwide volumes.
Figure 1.2 Total Worldwide Non-cash Transactions CAGR, 2001–2007
6%
5% CAGR 6.2%
16%
26%
19%
16%
25%
Total Worldwide Non-cash Transactions +8.6%
■ CEMEA without Russia
■ Rest of Asia
■ Latin America without Brazil
■ BRIC
■ Japan + Australia + South Korea + Singapore
■ North America (US + Canada)
■ Europe (including Eurozone)
Developing Economies
Mature Economies
Source: ECB DWH—2007 figures, released Nov. 2008; Bank for International Settlements—Red Book—2007 figures, released March 2009; IMF database; Central Bank Sources; Capgemini research and analysis, 2009.

WoRld PAyMENTS REPoRT 2009 9
Figure 1.3 Number of Non-cash Transactions in the Top 10 Non-cash Markets (billions), 2007
0 10 20 30 40 50 60 70 80 90 100
Russia
Australia
South Korea
Japan
Brazil
Canada
United Kingdom
China
Eurozone
USA
4
5
7
7
8
9
15
22
55
99
Source: ECB DWH—2007 figures, released Nov. 2008; Bank for International Settlements—Red Book—2007 figures, released March 2009; IMF database; Central Bank Sources; Capgemini research and analysis, 2009.
Region% of
Worldwide MarketCAGR
2001–2007% of
Global Population% of
Global GDP
USA 39% 5% 5% 28%
Eurozone 22% 7% 5% 24%
China 9% 44% 21% 6%
United Kingdom 6% 5% 1% 6%
Canada 3% 6% 0.5% 3%
Brazil 3% 9% 3% 3%
Japan 3% 10% 2% 9%
South Korea 3% 19% 1% 2%
Australia 2% 23% 0.3% 2%
Russia 2% 34% 2% 3%
Total 92% 8% 40% 84%
WoRld NoN-CASh PAyMENTS MARkETS ANd TRENdS

10
US, EUROPE STILL dOMINATE GLOBAL PAyMENTS
The US accounted for 39% of global payments in 2007, with volumes having grown steadily at about 5% a year since 2001. data also show a tangible move toward replacing cash in the US. For example, while cash-in-circulation fell 7.4%:
� debit card volumes jumped 16.2%; � Credit card transactions increased by 5.6%; � Credit transfers increased by 7% and direct debits grew by 18%; � Cheque volumes did decline (-7.4%) in 2007, largely ref lecting the increasing popularity of online bill payment and efforts by US banks to reduce cheque usage.
The trends in non-cash payments volumes in Europe are plotted in Figures 1.4 and 1.5. our European analysis is based on a 17-country sample3 that accounted for more than 95% of the volume and value of European non-cash payments transactions in 2007, much the same as in 2006.
in Europe, the three largest non-cash payment markets are still Germany, France and the Uk, but the use of non-cash instruments varies greatly by country. The countries in our sample fall into three groups: � Countries with a high number of transactions per inhabitant and strong rates of usage growth. Examples are Finland and the Netherlands, which have worked hard to drive payments dematerialization, as well as Austria and luxembourg. � Countries that are lagging because of low investment. in italy, Poland and Greece, for example, the number of payments per capita has stagnated below 60 per year. � Countries with moderate growth. This includes France, which has strikingly dropped from having the most non-cash payments per capita in 2001 to being ranked sixth in 2007. in Spain, the number of transactions per capita declined more than expected in 2007 (see WPR 2008 for forecasts), because the economy started to slow markedly in the second half of that year.
3 The 17-country sample includes the 13 countries that were members of the Eurozone in 2007 (Austria, Belgium, Finland, France, Germany, Greece, Ireland, Italy, Luxembourg, Portugal, Netherlands, Slovenia, and Spain), plus 4 non-Eurozone countries (the UK, Denmark, Sweden and Poland).

11WoRld PAyMENTS REPoRT 2009
Figure 1.4 Number of Non-cash Transactions in Europe (millions), 2001–2007
0
2,000
4,000
6,000
8,000
10,000
12,000
14,000
16,000
18,000
20,000
Pol
and
Den
mar
k
Sw
eden
Uni
ted
Kin
gdom
Slo
veni
a
Luxe
mb
ourg
Gre
ece
Irela
nd
Por
tuga
l
Finl
and
Aus
tria
Bel
giumIta
ly
Net
herla
nds
Sp
ain
Fran
ce
Ger
man
y8%*
4%
16%5%
3%
13%5% 11% 6%14%
12% 19% 6%
5%
10%8% 17%
Growth rate2006−2007 7%* 4% 9% 6% 4% 7%7% 9% 6% 11% 8% 15% 3% 3% 12% 10% 18%
Eurozone Non-Eurozone
CAGR 2001−2007 ■ 2001 ■ 2002 ■ 2003 ■ 2004 ■ 2005 ■ 2006 ■ 2007
*A 2007 change in Germany’s methodology for collecting certain payments data causes a break in the time series, and means 2007 data is not directly comparable with previous years. The 2007 estimate for non-cash transaction volumes was calculated using the same growth rate as for 2006-07 (6.57%).
Source: ECB DWH—2007 figures, released Nov. 2008; Bank for International Settlements—Red Book—2007 figures, released March 2009; IMF database; Central Bank Sources; Capgemini research and analysis, 2009.
Figure 1.5 Evolution of Non-cash Transactions per Inhabitant per Country in Europe, 2002–2007
0
50
100
150
200
250
300
350
200720062005200420032002
USA
Finland
Denmark
Netherlands
Austria
Luxembourg
France
United Kingdom
Sweden
Germany
Belgium
Ireland
Portugal
Slovenia
Spain
Italy
Poland
Greece
*A 2007 change in Germany’s methodology for collecting certain payments data causes a break in the time series, and means 2007 data is not directly comparable with previous years. The 2007 estimate for non-cash transaction volumes was calculated using the same growth rate as for 2006-07 (6.57%).
Source: ECB DWH—2007 figures, released Nov. 2008; Bank for International Settlements—Red Book—2007 figures, released March 2009; IMF database; Central Bank Sources; Capgemini research and analysis, 2009.
WoRld NoN-CASh PAyMENTS MARkETS ANd TRENdS

12
Cards remain the preferred means of non-cash payment throughout Europe, where card transactions rose 9.6% in 2007. however, different instruments are favoured in different countries (see Figure 1.6): � Credit transfers are a preferred instrument in most countries, except for Portugal, France and Spain. � direct debits are used in all countries, but adoption remains low in a few (e.g., Poland, Finland). � Cheques are being used less and less, but are still commonplace in France and the Uk. By contrast, cheques are largely extinct in the Netherlands, Austria and Finland.
� Card usage still has significant room to expand in Germany, Austria and Slovenia, where cards currently account for 20% or less of total non-cash payments.
Non-cash payments markets could achieve sustained growth throughout Europe if all stakeholders in the payments value chain (banks, merchants, and customers) are committed to their development and use. however, the effort required in each market will depend largely on its current state and could therefore involve a range of initiatives, from investing in infrastructure and security protocols to educating customers, providing incentives for clients, and developing innovative solutions. if the requisite enabling actions do not transpire, the volume of non-cash payments is unlikely to expand beyond any growth in GdP, and its growth is likely to slow in a downturn.
The PSd should spur competition among payments stakeholders and contribute to the growth in non-cash payments, because it will encourage more payment institutions (Pis) to enter the payments space. This should, in turn, drive innovation. For instance, the primary option for the unbanked today is cash, but Pis could offer innovative non-cash options to these clients (see Asia feature, page 16).
dEvELOPING ECONOMIES ARE GROWING IN MARKET ShARE
Apart from the US and Europe, the payments market is still highly fragmented, but developing economies continue to grow their share of global transactions every year. in just six years (between 2001 and 2007), their share has jumped from 9% to 20%, led by CEMEA and BRiC (Brazil, Russia, india and China), in which annual growth was around 25% during the 2001-07 period.
BRiC’s share of the global non-cash payments market was 15% in 2007, up 3 percentage points from 2006, driven by sharply higher transaction volumes in Russia (+47.7%), and China (+30.3%).
india’s non-cash payments volumes are smaller than in other BRiC nations. The country still relies heavily on cash, and 73.7% of all non-cash payments in 2007 were made by cheque. Still, non-cash payments volumes grew 14.6% in 2007, with 16% paid via cards, and volumes grew a sustained 12.7% a year in 2001-07. This ref lected a strong political push to develop non-cash payments, notably through the indiapay electronic card payment and clearing house initiative.
in China, while the economy remains largely cash-reliant, the non-cash payments market is f lourishing. Volumes grew a sustained 43.6% over the 2001-07 period, helped by the country’s development of infrastructure to facilitate non-cash transactions. Cards are the most developed non-cash instrument in China—as they are in Russia and Brazil. There were around 1.5 billion cards in China in 2007, generating 93.7% of all non-cash payments transactions. Cards have become the most popular non-cash payment instrument of the Chinese public in retail consumption.
PAyMENTS vOLUMES CONTINUEd TO GROW IN 2008
Recently published data confirm that non-cash payments continued to grow in 2008, despite the crisis. This resilience suggests the strength of the non-cash payments market depends more on infrastructure, end-user education (e.g., individuals, corporates, SMEs) and user preferences than on overall market conditions.
For instance, card purchase transactions rose 11.2% globally, with robust card usage in the US (according to data from American Express, discover, MasterCard and Visa) and in Europe (American Express, diners Club, MasterCard and Visa). Figures show: � US general purpose card transactions grew 7.7% in 2008, with the number by debit card up 12.1% and by credit card up 1.7%. � debit cards accounted for 57.5% of total non-cash purchase transactions in 2008, up from 22.9% just ten years earlier. debit cards first overtook credit cards as the preferred means of US consumer payments in 2004, and their rise has been notable ever since. Still, the economic downturn made credit cards even less popular in 2008, and the debit cards’ share of transactions grew by 5 percentage points from 2007. � European general purpose card transactions grew 11.4% in 2008.
however, not all payments markets will be unaffected by the crisis. For instance, data from the World Trade organisation (WTo) suggest the value of workers’ remittances may have hit a plateau in 2008, and forecasts suggest a decrease is likely in 2009 (see Figure 1.7).

13WoRld PAyMENTS REPoRT 2009
Figure 1.6 Breakdown of Payment Instruments per Country in Number of Non-cash Transactions (millions), 2007
0
2,000
4,000
6,000
8,000
10,000
12,000
14,000
16,000
18,000
20,000
Po
lan
d
Den
mar
k
Sw
eden
Un
ited
Kin
gd
om
Slo
ven
ia
Lu
xem
bo
urg
Gre
ece
Irel
and
Po
rtu
gal
Fin
lan
d
Au
stri
a
Bel
giu
m
Ital
y
Net
her
lan
ds
Sp
ain
Fra
nce
Ger
man
y
■ Cards ■ Credit Transfers ■ Direct Debits ■ Cheques
Eurozone Non-Eurozone
Source: ECB DWH—2007 figures, released Nov. 2008; Bank for International Settlements—Red Book—2007 figures, released March 2009; IMF database; Central Bank Sources; Capgemini research and analysis, 2009.
Average share of non-cash payment transactions per instrument
Cheques Direct Debits Credit Transfers Cards
8.5% 26.1% 29.3% 36.1%
Figure 1.7 Worldwide Workers’ Remittances Market Evolution, Receiving Regions ($ billions), 1990–2009
0
40
80
120
160
200
240
280
320
2009
*
2008
*
2007
2006
2005
2004
2003
2002
2001
2000
1999
1998
1997
1996
1995
1994
1993
1992
1991
1990
— Europe — Africa — Latin America — Asia — Total
* 2008, estimate; 2009, forecast.
Source: World Bank Migration; Remittances Factbook 2008; Capgemini research and analysis, 2009.
WoRld NoN-CASh PAyMENTS MARkETS ANd TRENdS

14
The economic crisis could also have an impact on trade finance. The value of global quarterly exports, which is a key driver of trade finance, had been growing through 2007 (+20.3% from 2006 Q4 to 2007 Q4), but started to retrench in the fourth quarter of 2008 (-10.5% from 2007 Q4 to 2008 Q4, see Figure 1.8). ironically, though, the increasingly uncertain trade environment may actually prompt companies to increase their use of trade finance, which currently covers only about 20% of total global trade volumes.
RATE OF EURO CASh-IN-CIRCULATION GROWTh SLOWEd IN 2007
Euro cash-in-circulation has increased 11% each year since the euro was introduced in 2002 (see Figure 1.9), even without the €500 and €200 notes, which are the most hoarded (in the Eurozone and in neighbouring Eastern European countries). however, the rate of year-on-year growth slowed in 2007 to 7.8%, which compares to the 6.1% increase in the number of non-cash transactions per inhabitant (to 173).
in comparison, cash in circulation in the US decreased by 7.4% in 2007, while the number of non-cash transactions per inhabitant increased by 4.7% (to 328).
CONCLUSION
� The global non-cash payments market continues to grow steadily, and shows no signs from the data available so far of having been deeply affected by the global economic crisis. � in Europe, the market’s growth has been somewhat muted, but actions implemented by active non-cash payments markets, such as Finland and the Netherlands, could be replicated elsewhere to boost the use of various instruments.

15WoRld PAyMENTS REPoRT 2009
Figure 1.8 Quarterly World Exports ($ billions), 2005–2008
0
500
1,000
1,500
2,000
2,500
3,000
3,500
4,000
4,500
5,000
Q408Q308Q208Q108Q407Q307Q207Q107Q406Q306Q206Q106Q405Q305Q205Q105
Source: World Trade Organisation Secretariat; Capgemini research and analysis, 2009.
Figure 1.9 Comparison of Cash-in-Circulation vs. Non-cash Transactions per Inhabitant in the Eurozone, 2002–2007
200720062005200420032002
173163155
148138
129
CAGR +11%
+6.1%
+7.8%
438406
367335
304
263
CAGR +4%
� Non-cash transactions per inhabitant � Cash-in-circulation, excluding €500 and €200 notes (€ billions)
Source: ECB DWH—2007 figures, released Nov. 2008; IMF database; Central Bank Sources; Capgemini research and analysis, 2009.
WoRld NoN-CASh PAyMENTS MARkETS ANd TRENdS

16
Payments innovation has thrived in Asia for many reasons, including the wealth of available technology options and the high level of mobile penetration among the general population. Notably, the many payments initiatives have also taken a variety of business-model forms. The Asian market therefore offers some valuable insights on the success factors for developing different payment tools and the opportunities for banks to generate new revenues from emerging payments methods.
The needs of each Asian market vary, depending on the mobile penetration rate, standard of living, wage levels, acceptance of new technology, consumer needs, and so on. Alternative service providers (telecom operators, transit agencies, and other service providers), technology vendors/phone manufacturers and banks have tailored their solutions accordingly, but some commonalities exist. For example:
� Mobile payments rely on two main technologies:
– Near-field communication (NFC, short-range wireless technology) is being used for contactless payments. For instance, NFC-enabled phones can be linked to bank accounts, allowing for direct debits from the user. NFC phones can also be pre-loaded with credit.
– SMS (short message service) for over-the-air m-payments allows payments to be initiated by sending text messages and an authentication code.
� Contactless payments exist in two main forms:
– Contactless transit cards used for transport payments with added e-wallet capabilities.
– Contactless debit/credit cards, which function as regular debit/credit cards with NFC capabilities.
Other types of initiatives are also being actively explored in the region, including online payments and biometric authentication for payments (using fingerprints or voice recognition).
Selected mobile, contactless and other types of payments efforts are outlined in Figure 1, which groups the initiatives by technology, and specifies the role of different stakeholders in terms of scheme ownership and money storage. The scheme owner is the primary interface with the customer and generally the main recipient of revenues. The owner can be a bank or an alternative service provider (telecom operator, transit agency or other service provider). The money storage criteria distinguish between money stored in bank accounts and other pre-paid accounts.
Payments Innovation in Asia is Taking Many Forms

17WoRld PAyMENTS REPoRT 2009
Figure 1 Selected Payments Initiatives in Asia
Initiative Country Launch Date
Customer Base
Scheme Owner
Money Storage
M-p
aym
en
ts
Co
ntac
tless
m
-pay
men
ts u
sing
NFC
* NTT doCoMoOsaifu Keitai
JapanJuly 2004
28.6 millionDepends on the application
Phone bill or service provider account
Union Mobile Pay
ChinaDecember 2008
NABank accounts and UMPay
Bank account
Citibank and vodafone India
IndiaJuly 2009
20,000Citibank, Vodafone Essar Ltd, India
Bank account
Ove
r-th
e-ai
r
m-p
aym
ents
usi
ng S
MS
*
Obopay IndiaMarch 2008
NAObopay and partners
Bank account
Smart Money PhilippinesDecember 2000
2.5 millionSmart and Banco de Oro
Account held by Banco de Oro
G-Cash PhilippinesNovember 2004
1.5 million Globe TelecomGlobe Telecom account
Paymate and Indian banks
India 2006 NAPaymate and Indian banks
Bank account
Co
nta
ctl
ess
pay
me
nts
Co
ntac
tless
tra
nsit
card
w
ith p
aym
ents
cap
abili
ties
Octopus Hong Kong 199719 million cards in circulation
Octopus Cards Card account
EZ Link Singapore 200210 million cards issued
EZ Link Card account
Easycard Taiwan 200216 million cards issued
Taipei Smart Card Corp
Card account
Co
ntac
tless
cr
edit
/ d
ebit
card MasterCard
PayPass
Philippines, Malaysia, South Korea, Taiwan
2003100,000 in Taiwan
Card scheme Bank account
visa payWaveHong Kong, South Korea, Malaysia, Singapore, Taiwan
20021 million in Taiwan
Card scheme Bank account
E-payments Alipay China 2004About 200 million
Alipay and partner banks
Partnerships with all leading banks in China
Biometric Authentication
Bank danamon Indonesia NA About 4 million Bank Bank account
* NFC, near-field communication (short-range wireless technology); SMS, short message service (text messaging).Source: Capgemini research and analysis, 2009.
18
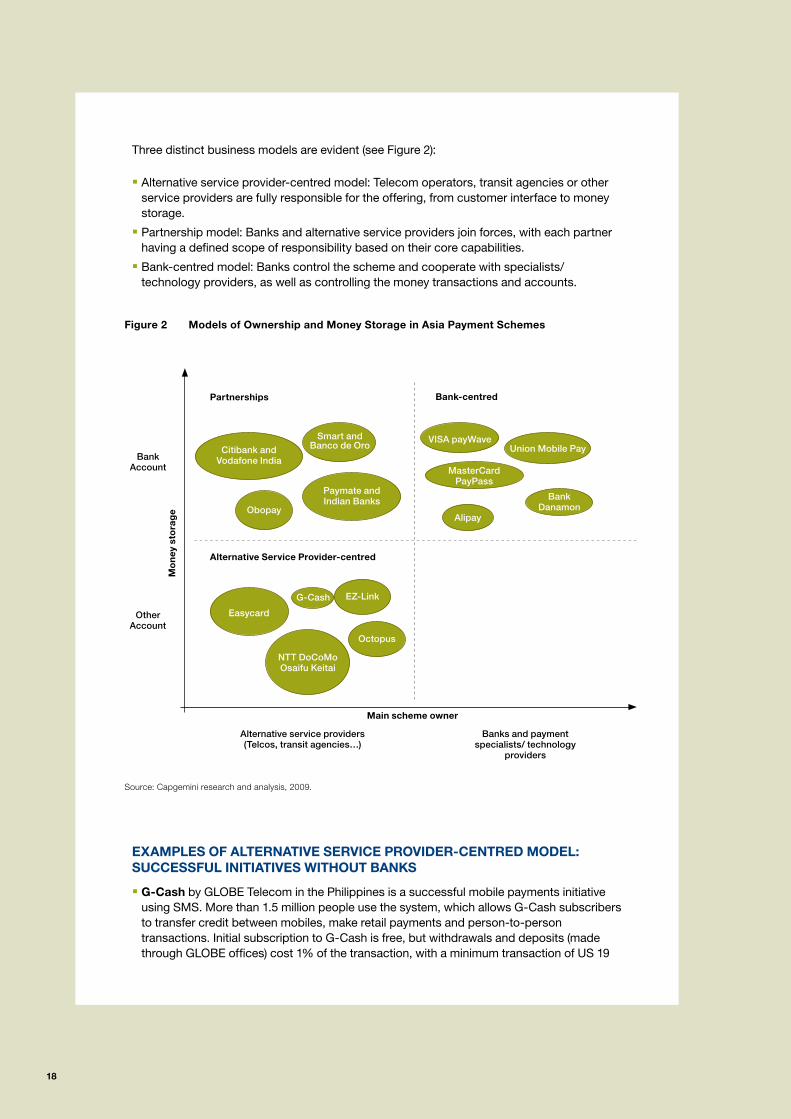
Three distinct business models are evident (see Figure 2):
� Alternative service provider-centred model: Telecom operators, transit agencies or other service providers are fully responsible for the offering, from customer interface to money storage.
� Partnership model: Banks and alternative service providers join forces, with each partner having a defined scope of responsibility based on their core capabilities.
� Bank-centred model: Banks control the scheme and cooperate with specialists/ technology providers, as well as controlling the money transactions and accounts.
ExAMPLES OF ALTERNATIvE SERvICE PROvIdER-CENTREd MOdEL: SUCCESSFUL INITIATIvES WIThOUT BANKS
� G-Cash by GLOBE Telecom in the Philippines is a successful mobile payments initiative using SMS. More than 1.5 million people use the system, which allows G-Cash subscribers to transfer credit between mobiles, make retail payments and person-to-person transactions. Initial subscription to G-Cash is free, but withdrawals and deposits (made through GLOBE offices) cost 1% of the transaction, with a minimum transaction of US 19
Figure 2 Models of Ownership and Money Storage in Asia Payment Schemes
Source: Capgemini research and analysis, 2009.
Alternative service providers (Telcos, transit agencies…)
Banks and payment specialists/ technology
providers
Bank Account
Citibank and Vodafone India
Paymate and Indian Banks
VISA payWave
Alipay
Bank Danamon
Union Mobile Pay
Mo
ney
sto
rag
e
Main scheme owner
Partnerships
Alternative Service Provider-centred
Bank-centred
MasterCard PayPass
Obopay
G-Cash EZ-Link
Octopus
Easycard
NTT DoCoMo Osaifu Keitai
Smart and Banco de Oro
Other Account

19WoRld PAyMENTS REPoRT 2009
cents. Each customer-initiated SMS costs 2c. Scheme rules limit the account balance to US$189. Transaction security is managed through an identification (ID) and personal identification number (PIN) code. The service thrives for several reasons. First, much of the Philippine population lacks access to a bank account, so this option fills a gap in payment options, and is especially favoured for low-value transactions. Second, the alternative service provider (telecom operator in this case) did not have to invest heavily to spur usage, because mobile and SMS usage is high anyway. The mobile penetration rate is about 60% in the Philippines, where 200 million text messages are sent on an average day.
� The Octopus card in Hong Kong is a contactless transit card with added payments-processing capabilities. This ‘smart card’ reduces transactions processing time in restaurants, supermarkets, car parks and other points-of-sale (as it originally did for transportation payments). While the Hong Kong population stands at 7 million people, there are more than 19 million Octopus cards in circulation, as tourists and other travelers can get the card quickly and easily. 10 million transactions are processed per day, representing a total value of HK$87 million (US$11 million). More than 50,000 card readers are spread across Hong Kong, and 2,000 merchants accept Octopus. Card holders can top up balances from Octopus ATMs with cash, by electronic funds transfer, at any merchant accepting Octopus cards, or automatically by subscribing to Octopus Automatic Add Value Service. Any account from the 22 banks involved in this service can be debited. The average balance held by customers is HK$65 (US$8). The popularity of Octopus can largely be attributed to the fact that consumers were already used to the transport card before other services were added. The enhanced Octopus card therefore provided a fast but familiar, secure and widely accepted means of payment.
� NTT doCoMo’s Osaifu-Keitai mobiles (mobile phones with wallet functions) contain a chip that can be used to perform contactless payments. Card holders wave their mobile near the reader and money is debited from an electronic purse or a networked bank account. More than 28.6 million Osaifu-Keitai mobiles are in circulation and 608,000 shops accept these payments. Services are provided by NTT DoCoMo or by another service provider. Users just download the requisite application to the phone. Japan is the recognised leader in m-payments, and customers are early adopters of such technologies, so they quickly saw the benefits (speed and ease of use) of using a single device for payments, instead of handling a range of different cards. Other telecom operators in Japan also offer Osaifu-Keitai mobiles.
SAMPLE PARTNERShIPS BETWEEN BANKS ANd ALTERNATIvE SERvICE PROvIdERS
� In the Philippines, Smart Money and Banco de Oro provide an over-the-air m-payment service used by more than 2.5 million subscribers. Smart Money links the user’s phone to a cash account held by Banco de Oro and enables retail payments, remittances and credit transfers. Fees vary from US 2 cents to 1% of the transaction value. Like G-Cash, privacy is protected by an ID and a PIN code. Banco de Oro’s role is to manage accounts and perform transactions. By law, the bank is responsible for security and fraud management. As noted, Filipinos are heavy SMS users and many do not have a bank account, so this service is popular, for example with workers who want to send remittances quickly and not rely on bank branches.
� In India, Paymate has teamed with Indian Banks (e.g., Standard Chartered Bank of India, State Bank of India) to provide an m-payment service using SMS. The transaction platform links the user’s phone to a bank account, a credit card or a prepaid account. Bill payments, retail payments and online payments can be performed easily by entering a PIN code. The money can also be withdrawn from multiple bank accounts registered by the user. Paymate is accepted by more than 15,000 merchants in India, where the number of mobile users has topped 250 million and the number of new mobile subscribers is growing
20
all the time (15.4 million were added in January 2009 alone). Notably, mobile devices offer greater coverage than banks in rural zones, so they make banking services available to many customers who would otherwise go un-served. For example, Paymate offers city workers an easy way to send remittances to their home villages.
� Citibank India and vodafone Essar Ltd are conducting a pilot project of m-payments using NFC mobile phones. Also involved are Nokia, which provides the NFC-enabled phones, and MasterCard, which will provide its MasterCard PayPass payment and security infrastructure. The initiative—Citi Tap and Pay—is being rolled out in Bangalore where Citibank has 400,000 credit card holders, of which 20,000 already have an NFC-enabled phone. The service links the user’s phone to a Citibank MasterCard (credit/debit) and allows customers to make payments in 500 merchant establishments. Depending on the success of this initiative, Citibank aims to roll out this service in other cities across India.
BANK-CENTREd MOdEL: A vARIETy OF INITIATIvES
� visa payWave and MasterCard PayPass are contactless credit/debit cards issued by banks. They use NFC technology to perform contactless payments while acting as regular credit/debit cards elsewhere. These initiatives, coming from global players, are progressively being rolled out worldwide but Asian markets were first (along with the US) to test these initiatives as they are recognised as being receptive to innovations. Visa says it now has more than 26 Visa payWave issuers in Asia (Malaysia, Korea, Singapore, Hong Kong, Taiwan), making the Asian market far more advanced than Europe, for example, in which there are only five such issuers. These cards are convenient and can save the consumer time. However, there are costs associated with usage. Merchants have to invest in special card readers if they plan to accept these cards. In addition, interchange fees are involved as they are for regular credit/debit cards. This may have an impact on consumer prices if merchants seek to incorporate these transaction-processing fees into their retail prices. Still, merchant reward programs tied to these cards could encourage usage. Partnerships between banks, issuers, acquirers and MasterCard/Visa are key to the success of these initiatives.
� Bank danamon in Indonesia launched a biometric service targeted to micro-entrepreneurs. Biometric identification (in this case fingerprints) is used to make loans and perform banking transactions. While a similar Citibank initiative in Singapore failed because the biometric technology provider (Pay-by-Touch) filed for bankruptcy, Bank Danamon has shown that biometric authentication can be a useful tool in catering to unbanked segments of the population, including those who are illiterate. The next step in biometric-related initiatives will be the ability for consumers to perform payments in stores using only their fingerprints.
� Alipay, started in 2004, provides online payments services to Chinese consumers. Alipay partners with all leading banks in China to offer an escrow service for payments, where funds are debited from bank accounts or via credit/debit cards linked to the Alipay account. Alipay managed to grow quickly and become the leading online payments provider in China, largely because it is the standard payment means for its sister company Taobao, which has already reached a critical mass of users. (Both are subsidiaries of the Alibaba Group.) Taobao is the leading online marketplace in China, ahead of Ebay, and Alipay service is free for registered users of both Taobao and Alipay. Fees are charged for non-registered users or for those who use only Alipay over a limited volume of trading. As of July 2009, Alipay has more than 200 million registered users in China alone.

21WoRld PAyMENTS REPoRT 2009
We identified two main trends in the business case for payments innovations, whatever the structure of the operating model (see Figure 3):
� Newcomers focus on low-value transactions and pricing across a large (and often pre-established) customer base;
� Established players focus on utilising their experience and infrastructure to provide enhanced payment services and experience for customers.
IMPLICATIONS FOR BANK STRATEGy
Telecom operators and other payments service providers have pioneered most new payment services in Asia, drawing on their large customer bases. G-Cash and Octopus are among the many that have been very successful. Banks own few of the new initiatives to date, but they are pursuing various efforts (e.g., payments with biometric authentication and NFC payments). Bank initiatives are generally expensive to implement, though, as they often imply additional transaction-processing fees and require heavy investment in equipment deployment (fingerprint and NFC readers) for which merchants may not be willing to assume
Figure 3 Customer Base and Infrastructure/Experience as Factors in Payments Business Models in Asia
Source: Capgemini research and analysis, 2009.
Paymate and Indian Banks
VISA payWave
Alipay
Cu
sto
mer
bas
e/ L
oca
l lev
el o
f pen
etra
tio
n
Payments experience/ Infrastructure density and reach
High customer base-oriented – Newcomers
Two main business models:
Infrastructure-oriented – Established payments service providers
MasterCard PayPass
Obopay
EZ-Link
Octopus
Easycard
NTT DoCoMo Osaifu Keitai
Smart and Banco de Oro
Bank Danamon
Union Mobile Pay
Citibank and Vodafone India
G-Cash

22
the cost. For bank schemes to thrive, in fact, they need to attract the endorsement of key stakeholders—Visa or MasterCard in contactless credit/debit cards, issuers and acquirers—to bring in enough funds for investments and to drive acceptance. Alternative service providers, by contrast, build on an existing customer base that is already well established and thus mainly need to drive people into using their services.
To become successful, banks therefore need to decide first on their position in the value chain:
� Partnerships with telecom operators or other service providers will help them assume the benefits of mobile penetration. At first, banks can provide a processing and account-management structure. Consumers who become familiar with their account via e.g., Obopay or G-Cash may then migrate towards retail banking.
� Banks that are willing to create a business on their own should design an offer that will target a specific group of customers and provide users with value-added services. Technology is not the only attraction for customers. (Moneo in France, for example, developed an electronic purse that has failed to catch on because merchants and users apparently do not believe the technology benefits warrant the associated costs).
Emerging payment means provide banks with a real opportunity to gain and lock in new clients, reduce the use of cash, create new offers, reach unbanked markets and decrease operational costs. But banks must fight to stay relevant, and proactively position themselves to capture potential sources of revenue that could otherwise be lost to telecom operators and other service providers.
In order to succeed, then, bank initiatives must be able to do the following:
� Bring value-added services to customers (individuals and merchants), e.g., in terms of quicker transaction times for cards.
� Take advantage of a critical mass of users and acceptors or quickly reach it (like Octopus).
� Leverage other drivers of demand by e.g., getting support from key players (large corporates, public administrations) or improving an existing service.
� Be interoperable, at least on a national level.
� Focus on frequent low-value transactions that do not require authentication.
� Partner with other stakeholders and leverage their capabilities.
� Create a business model that will benefit all stakeholders.
In pursuing business opportunities in emerging payment means, all parties involved and especially banks must remember however that there are regulatory and security issues to consider. For instance, domestic and international bank regulations include strict anti-money laundering and fraud provisions that may be challenging to meet in the electronic and mobile payments environment where not all countries have the same disclosure requirements. Going forward, systems must certainly be capable of ensuring regulatory compliance across multiple delivery channels and countries to facilitate remittances, for example.

23WoRld PAyMENTS REPoRT 2009
To date, banks tend to handle the security issues as they would for legacy payments services. Service providers usually set limits for transactions and deposits, and limits are imposed on transit-card balances. If a scheme is owned by multiple parties, a clear framework has to be defined to identify the responsibilities for each stakeholder.
Central banks, such as the Reserve Bank of India, are starting to issue specific guidelines and legal frameworks to clarify the roles and responsibilities of each stakeholder regarding anti-money laundering issues, risk management and delivery of service. More international standardisation could help to reduce the costs of investments and improve interoperability eventually, but is probably not appropriate yet.
Existing regulations vary by country to reflect divergent market characteristics (in payments instruments and customer needs and habits), making it hard to standardise even within Asia, let alone globally. Even in Europe, where new payment means are part of the SEPA agenda (e-SEPA), the number of standards is still a hurdle in developing interoperable m-payment and e-payments services.
But even when designing operating rules, regulators are not concerned with business models, so it is left to banks to develop a business model that is compliant with laws and regulations but still economically viable. Except for contactless credit/debit card initiatives, which are being rolled out worldwide by Mastercard/Visa, the current lack of standardisation essentially limits initiatives to a domestic market at least initially.
CONCLUSION
Asia’s innovation in payment methods has produced many successful initiatives, from m-payments to contactless cards. In the process, both alternative service providers and banks have been able to provide convenient payment services for consumers. However, these initiatives have often been developed with a domestic or metropolitan focus, using proprietary standards, making it difficult for them to expand into regional or global solutions.
These initiatives have demonstrated, though, that payments innovation is a potential source of revenue for banks but also for alternative service providers. However, more than bringing in new technology, banks must define a viable business model (scheme owner, security issues, investments, revenue-sharing) in cooperation with operators and service providers—and do it soon—if they are to capture the opportunity in emerging payment means.

24

SECTioN TiTlE l1SECTioN TiTlE l2
25WoRld PAyMENTS REPoRT 2009
SEPA Update
CHAPTER 1 HIGHLIGHTS
The emergence of the financial crisis might have hampered the progress of SEPA implementation, given the growing concern among regulators about the health of the financial services industry, and the pressure on banks to focus on bolstering risk, compliance, and governance activities. In Europe, however, the political will to drive a unified payment system is strong, so efforts continued in earnest to move ahead with SEPA. In fact, the last year or so was marked by significant legal, market and regulatory achievements on the road to SEPA implementation.
� A year after the launch of SCTs, major banks are SCT-compliant and SCT volumes continue to grow, albeit to date those volumes are still minimal in relative terms and mainly cross border. It remains to be seen how long it will take SEPA volumes to reach critical mass, but SEPA instruments still need further enhancement to match certain aspects of some legacy alternatives. The current disparity is hindering adoption.
� The EPC continues to develop and clarify the Rulebooks for SDDs. A launch date of November 2nd, 2009, has been set for the SDD schemes and the e-Mandate service, breaking any immediate deadlock over implementation. Progress has also been made to address problems with migrating legacy mandates to SEPA mandates, and conditions for MBPs have been set for the short term.
� The EPC is continuing work to realise the SCF, but there are questions about the final ambition regarding card schemes. There is no Rulebook for cards, which are a far more complex proposition than credit transfers or direct debits. As a result, it is still difficult to see the role for SEPA-specific cards. It seems multiple schemes are bound to persist, at least for the foreseeable future, and the future of European initiatives to rival global schemes (EAPS, Payfair, Monnet) is not certain.
� The process of transposing the PSD into the national laws of participating countries is well under way, and should generally be complete in time for the November 2009 deadline. PSD implementation is a complex undertaking and all key stakeholders have worked actively in the last year to try and overcome potential ambiguity and inconsistency in the PSD’s application.
� Some progress has been made on the SEPA clearing infrastructure, but there is limited demand for SEPA processing in general as yet. However, in the long term, it is still believed that fewer clearing and settlement providers will be needed, so consolidation is expected to proceed largely in line with overall SEPA migration.
� The EPC is also looking for solutions to make SEPA easier for end-users, for example by defining e- and m-payment frameworks. E-SEPA is still on the agenda, but it is not yet clear what the demand will be. If the EPC concentrates on issues of standardisation in this area, it could facilitate the operational implementation of any e-SEPA innovations.
Chapter 1
Further Progress has been Made Towards SEPA, Despite the Financial Crisis

26
INTROdUCTION
SEPA is an ambitious concept with lofty goals, and stakeholders have always known implementation would be complex. it is not surprising then, that progress has been consistently marked by both milestones and obstacles. in this chapter, we focus on what has been achieved in the last year or so to solidify the future of SEPA. We look in more detail at unresolved issues and practical hurdles to SEPA implementation in the next chapter.
SCT MIGRATION CONTINUES ThOUGh TRANSACTION vOLUMES REMAIN SMALL
SCTs, available since January 28th 2008, have proven to be a success in terms of reachability (i.e., enough banks are capable of receiving these payments). The EPC reports 4,500 banks in 31 countries were offering SCT services as of April 2009, and those providers accounted for about 95% of all payment volumes in Europe. This confirms that major players are indeed SCT-compliant.
however, usage is still minimal. only 3.1% of all eligible non-cash payments in Europe were processed as SCTs as of April 2009, and most of those involved cross-border transactions. This starkly demonstrates how distant still is the SEPA goal of fully replacing domestic payments instruments with SEPA services.
Some countries have been more eager to embrace SCTs. For example, the European Central Bank (ECB) says Slovenia migrated most of its credit-transfer traffic to SCTs in March 2009, ahead of a systems overhaul. And in luxembourg, SCTs accounted for about 85% of all credit transfers in the second half of 2008. SCTs have also caught on for euro transfers in some non-euro countries. The ECB reports that of euro CTs in denmark and latvia, 56.3% and 41.9%, respectively, were in SCTs in the second half of 2008. By contrast, SCTs as a percentage of all credit transfers were minimal in major euro countries, such as Belgium (2.7%), Spain (1.5%), and France and Germany (less than 1%).
No date has yet been set for abolishing domestic instruments and migrating entirely to SEPA services, and stakeholders generally agree SEPA volumes will not reach a critical mass as long as domestic and SEPA services are allowed to operate in parallel.
Moreover, SCTs cannot yet match the customer experience of some existing domestic CT services. For example, some online banking applications do not offer seamless access to SCTs as if they were domestic payments, and some communities are suggesting that enhancements may be necessary to accommodate the specific needs of, say, pension or tax payments.
ThE EPC CONTINUES TO dEvELOP ANd CLARIFy ThE Sdd RULEBOOK
The EPC spent much of 2008 and early-2009 focused on defining the Sdd scheme, and has also confirmed November 2nd 2009 as the launch date of both variants of the scheme (Sdd Core and Sdd Business-to-Business (B2B)) and the e-Mandate service.
The SEPA Core direct debit Scheme Rulebook v3.3 has been approved and published, and a new version of Sdd B2B Rulebook (v1.2) was approved in June 2009. The most notable recent additions are references to the e-Mandate service, the adherence process and criteria for SEPA participation.
The e-Mandate service, an optional feature, can replace the paperwork in the Mandate Flow, allowing debtors to issue, amend and cancel a direct debit mandate electronically, while the collection process stays the same as in the existing Core Sdd scheme. The e-Mandate service enables: � Creditors to automate the entire mandate process and store and access information more easily. � debtors to use remote banking services. � Banks to offer new services and use existing remote banking infrastructure.
Separately, progress has been made to address problems with migrating legacy mandates to SEPA mandates. it is critical to ensure the continued legal validity of existing direct debit mandates under SEPA, especially in Member States with high volumes of direct debits. having to re-sign billions of new mandates would be extremely burdensome and the associated costs prohibitive.
The issue needs to be resolved in a way that preserves legal and commercial certainty. in some cases, it has become clear that national legislative measures will need to be introduced (ideally in parallel with the PSd transposition process), meaning national authorities may have an active role to play in these cases.

27WoRld PAyMENTS REPoRT 2009
Thirteen Member States4 have already made sure customers of legacy mandates will not have to agree to a brand new mandate (“re-sign”) to use SEPA dds (although Finland will require existing mandates to be re-signed if a customer requests it). in these States existing direct debit mandates will either remain valid for Sdds or their validity will be assured via legislative amendments. other countries are also expected to take the necessary steps to avoid large-scale mandate re-signing.
The position for Germany—in which 40% of all non-cash payments take place via direct debit—is not yet fully resolved. The mandates on current direct debits (lastschrift) are very different from Sdd Mandates, so numerous changes will be required to make them SEPA-compliant (and if there is no legislative intervention legacy mandates would need to be re-signed). German banks are concerned at the complexity and cost of making the shift, and are urging legislators to remove any barriers to the quick and easy migration of national dd mandates. At this point, though, it is not clear whether the government will agree to facilitate this change or not.
Debate on MbP has been settleD, for now
The Multilateral Balancing Payment (MBP) had threatened to hinder Sdd implementation, but has been settled for the time being at least. This bank-to-bank transaction-based interchange fee for direct debits only exists in some countries today, but is seen as very important by many providers in those countries.
The European Commission (EC) and ECB initially argued MBPs seemed unnecessary for Sdd and appeared potentially incompatible with European Union (EU) antitrust rules. however, after lengthy discussions between the EC, the ECB and the EPC, a breakthrough on this topic was achieved in April 2009. The EC decided that the revised version of EU Regulation 2560/2001 would include approval for a default maximum MBP of 8.8 cents on any cross-border euro direct debit transactions for an interim three-year period until November 2012.
Additionally, any national MBP that exists before the launch of Sdds can be applied to Sdds used nationally for three years (until october 31st, 2012). during those years, any reduction or abolition of a national MBP must also apply to Sdds.
The following countries currently use national interchange fees, so will be affected directly by the rule change: italy, Portugal, France, Belgium and Spain. Where the MBP is currently higher than 8.8 cents, banks will have to redefine their business model.
While the EC ruling provides clear guidelines for the short term, it remains to be seen how Sdd participants will react from November 2012.
in a further measure designed to support the successful launch of Sdd, the revised Regulation 2560/2001 also includes a requirement that all banks that are members of euro direct debit schemes today must make sure they are at least reachable for Sdds (Core)—Eurozone banks by November 2010, and other SEPA-area banks by November 2014.
ThERE ARE dOUBTS CONCERNING ThE vIABILITy OF A NEW PAN-EUROPEAN CARd SChEME
in the SCF, the EPC has defined the principles and rules needed to underpin SEPA-wide acceptance of cards. The main objectives of the framework have been 1) to make sure cards can be accepted on a Europe-wide basis under the same conditions as in their native countries, 2) to ensure merchants are equally free to accept any SEPA-compliant card brand, and 3) to increase competition by unbundling the scheme/brand-management of a card scheme from the processing activities.
Until quite recently, the EPC envisaged a number of ways for banks and other stakeholders to achieve SEPA-card schemes compliance (as outlined in last year’s WPR), but statements in mid-2008 seemed to accept a “mini-SEPA” situation in which national schemes can continue for domestic payments, with a simple link into as few as one other European card scheme for cross-border SEPA card transactions. This might be a workable interim solution, but it is clearly far less ambitious than the EC’s original vision of “any card at any terminal”. The EPC also clarified that the SCF is not intended to be restricted to four-party systems (as originally seemed to be the case).
The EC and ECB appear to have developed a deeper understanding of the complexities involved in creating a new Pan-European card scheme and they have apparently realised the current requirements on interoperability arguably favour a duopoly of Visa/MasterCard schemes.
4 Austria, Belgium, Bulgaria, Denmark, Estonia, France, Ireland, Italy, Netherlands, Portugal, Slovakia, Romania and Sweden.
SEPA UPdATE

28
Additionally, it appears that some banks are questioning whether the business model for a new European card scheme is viable, especially after EC scrutiny recently forced MasterCard to reduce its cross-border interchange fees in Europe. At this point, it is not clear whether initiatives by EAPS, Payfair, and Monnet can create a scheme able to rival Visa/MasterCard.
in the meantime, existing national card schemes are being adapted to unbundle, as required for SCF compliance, their governance, processing and other functions to ensure enhanced transparency in service offerings and pricing in each area. Among the card schemes that have already declared themselves compliant are Girocard in Germany, Banksys in Belgium, GiE CB in France and Bancomat in italy.
The bottom line is that the environment for SEPA cards is far from settled, and participants still face a range of practical considerations (see next chapter).
Besides scheme compliance, operational issues for cards have been clarified, though. The EPC published the SEPA Cards Standardisation Volume (v3.2), which provides functional, technical and security specifications for SCF-compliant cards. it consists of data, definitions, supported technologies, descriptions of processes and messages, data elements and security requirements. it also covers Certification and Approval and establishes a framework of security requirements.
The EPC and others are also working diligently on other efforts to further standardisation, and thus support the SCF, but the Framework is not a “Rulebook” (in the sense of those for SCT or Sdd) so each participant is still free to choose their own standards—and, in fact, to interpret a number of other issues unilaterally. A revised version of the Framework, due to be published by the end of 2009, should help clarify and explain the content of the original.
Meanwhile, the SCF-related migration to Europay MasterCard Visa (EMV) chip standards is due to be completed in 2010, although 2012 now looks to be more likely, given that some countries (e.g., Netherlands, Spain) are making relatively slow progress. Consequently, the average level of EMV compliance in Europe (at 62% of cards) is still relatively low, especially given that EMV implementation began back in 2003.
PSd WILL GENERALLy BE TRANSPOSEd INTO NATIONAL LAWS ON TIME
The PSd is a prerequisite for full SEPA implementation, but also has a much wider set of objectives, given it is intended to provide a common legal framework for a wide range of payment services denominated in European Economic Area (EEA)5 currencies across all the EEA countries.
Since the final text of the PSd was published on december 5th 2007, the EC has been working with Member States to ensure a timely and consistent implementation across the EEA. The PSd must be transposed into national law by the 27 EU Member States in time for a common in-force date of November 1st 2009 (the precise position of the three non-EU members of the EEA is still being clarified) and most of those States report they are on schedule. The Uk, Bulgaria and denmark have completed the process, and whilst there are indications that a few countries may be implementing slightly late, Sweden is so far the only country to have officially forecast a delay, with a current target date of April 2010. however, it is clear that many of the countries will not have completed their transpositions until late Q3 or early Q4, meaning that banks cannot afford to wait until official final texts are available before progressing with their PSd compliance activities.
The EC has been taking steps to ensure a coherent approach among Member States and to help each country to overcome hurdles to implementation.
This focus on consistency is critical given the potential for discrepancies. To begin with, there are the Member State derogations (options) that were negotiated into the final PSd text. These derogations allow countries to make their own decisions on 23 specific issues. For instance, each country can decide whether or not to treat “micro-enterprises” (defined as those with fewer than 10 employees and annual turnover of €2m or less) as corporates or consumers for the purposes of certain requirements. in addition though, it is generally acknowledged that the final text of the PSd contained numerous provisions or definitions that are somewhat ambiguous, so there is a risk that countries will interpret these in different ways.
5 The European Economic Area (EEA) comprises the 27 EU Member States plus three non-EU countries (Iceland, Liechtenstein and Norway).

29WoRld PAyMENTS REPoRT 2009
The activities of the EC to try to ensure maximum consistency have included the creation of its interactive PSd website6 and the establishment of the EC-chaired PSd Transposition Working Group to provide a forum for Member States to discuss the specific implementation issues each faces as they move from existing payments markets, laws and regulations to PSd compliance. The Working Group has already met nine times and plans at least one more meeting to further consistency in the implementation phase.
A prime example of an area of potential divergence is how to deal with “leg-out” payment transactions where either the payer’s or payee’s payment service provider (PSP) is not located within the EEA. The PSd does not apply to such transactions, beyond requirements regarding value dating and availability of funds (as specified in PSd Article 73). however, some Member States have decided to go beyond the scope of the PSd and extend additional requirements to these transactions, and/or to transactions involving non-EEA currencies. As a result, there is potential for inconsistent treatment of these transactions.
This uncertainty, coupled with the November 2009 deadline, creates significant planning challenges for PSPs.
banking inDustry seeks to Clarify key issues: the PsD exPert grouP
The banking industry has also sought to anticipate and help settle potential inconsistencies in PSd implementation, and has been investing significant time and resource in working within individual national communities and at the EU level to promote timely, consistent and balanced interpretations and implementations.
in particular, The European Banking Federation (EBF) established the European banking industry PSd Expert Group (PSd EG) in late 2007. Since then, the PSd EG—which includes participation from the European Association of Co-operative Banks (EACB), the EPC, a wide range of national banking industry groups, and Visa and Mastercard—has developed an extensive dialogue with the EC and Member State authorities on practical issues of PSd implementation.
For example, the PSd EG was instrumental in highlighting to the EC and Member States the need to agree to a common in-force date for the PSd. it also championed a resolution for the consistent interpretation of the key term of “Payment Account” (where the PSd EG successfully argued that a principles-based approach focused on the underlying purpose and functionality of an account would be most appropriate and avoid ambiguity).
The PSd EG also recently published high-level ‘best practice’ guidance for banks that face PSd implementation. This guidance document explores the implications and application of certain provisions at a very practical level and thus is a significant contributor to helping ensure consistent and efficient implementation across the EEA—hence helping to ensure that the PSd is implemented in line with its original objectives.
key PsD Provisions will iMPaCt banks DireCtly
Many provisions in the PSd have a direct impact on banks. They are mainly clustered around themes that are central to the ambitions EU and national regulators have for a transparent, competitive, consumer protective and efficient single EU market for payment services. To highlight a few key examples:
� Transparency. The PSd is very explicit about transparency and information requirements. PSPs must provide or make available to their consumer customers a detailed list of information before and/or after a payment is executed (such as the maximum execution time, charges payable, and the exchange rate used, if applicable). Greater contractual f lexibility applies with respect to information provided to corporates.
� Execution Time. The PSd requires PSPs to ensure payments are executed no later than the end of the business day following the deemed day of receipt (i.e., d+1). Until January 1st 2012 payers and their PSPs may agree on a period of no longer than three business days (d+3). A further business day is allowed for paper-initiated transactions. in certain cases, up to four business days (d+4) are allowed (if agreed on).
� Value Dating. A payee’s PSP must make funds available to the payee as soon as those funds are received and must also value date the payment that day (assuming the funds arrive on a business day for the PSP).
6 http://ec.europa.eu/internal_market/payments/framework/transposition_en.htm
SEPA UPdATE

30
SOME PROGRESS hAS BEEN MAdE ON ThE CLEARING INFRASTRUCTURE
SEPA aims to enable payment processors to develop a service capable of reaching all banks in Europe. The EPC initially envisaged that one or more competing PE-AChs (Pan-European Automated Clearing houses) would emerge, but whilst there are now a significant number of processors qualifying as SEPA Clearing and Settlement Mechanisms (CSMs), only the Euro Banking Association (EBA) Clearing’s STEP2 SCT system currently operates as a PE-ACh—reflecting the low and largely cross-border volumes seen to date. however, it is not clear at this point when SEPA volumes will rise sufficiently to encourage additional providers to embrace the PE-ACh concept to the full.
At this stage, there are two main alternative European clearing initiatives under way:
� Bilateral links: Vocalink and Equens, for instance, are each working to develop a pan-European ACh offer. They provide transactions services in several European countries (Benelux, France, Germany, Scandinavia, Southern Europe) and partner with several European banks/financial institutions and corporates. however, this initiative currently falls somewhat short on reachability standards. The EBA STEP2 system is currently best in class by this measure as it reaches 98% of the banks that have signed the EPC SCT Adherence Agreement. it is heavily used in Europe, with 300 banks connected directly. in 2008, the EBA STEP2 SCT Service processed close to 270,000 SEPA-compliant credit transfers on an average day. By contrast, and to give some idea of the relative scale once SEPA migration has begun in earnest, Vocalink’s automated platform processes over 90 million transactions on a peak day, and half a billion in a month. Equens processed 8.9 billion payments in 2008 (12.5% of market share in the Eurozone).
�Multilateral links: The European Automated Clearing house Association (EAChA) is working on interconnecting many AChs. however, this requires a level of interoperability between banks and AChs that may perhaps in practice be difficult to attain amid today’s many disparate standards.
� Full Amount Principle. The PSP of the payer, the payee and any intermediary provider must transfer intact transaction amounts and refrain from deducting charges from the principal. (Payees can, however, agree with their PSPs to pay their fees by way of deductions).
� Refunds. in some circumstances, a payer is entitled to a refund from their PSP of a payee-initiated authorised payment transaction up to eight weeks after the payment. The PSP must, within 10 days of receiving a request for a refund, either refund the full amount of the transaction, or where this is not applicable, provide reasons for their refusal to the payer.
From a banking perspective then, the PSd may have a major practical impact on various areas:
– Payment products, services and information channels—and the underlying customer terms and conditions—may need to be modified to ensure compliance; – Some iT systems and operational processes may need to be amended to ensure compliance with the execution-time requirements; – Risk management procedures will need to be reviewed and possibly amended; – Third-party supplier agreements will need to be examined (e.g., ACh, technical service providers); – internal staff education and training is likely to be necessary; – Business models and revenues may be affected (including reduction of ‘f loat’ income in some cases).
While the PSd touches a variety of payment-related processes, systems and contracts, the specific impact on any individual bank will of course depend on a number of factors, including the set-up of bank operations (centralised vs. decentralised), the types of services it offers, and the make-up of its customer base.
in addition though, the PSd offers banks potential strategic opportunities (e.g., expansion into new markets or new customer segments).
As for corporates, the near-term priority is to understand how the services they use and the related terms and conditions may be changing. Multi-country corporates should benefit from a greater level of standardisation, but for some others, the main short-term benefits of PSd may not be so immediately obvious.

31WoRld PAyMENTS REPoRT 2009
The EPC is looking at several European initiatives as part of the process to determine what might be the appropriate e-payment framework, including the dutch idEAl initiative. idEAl allows dutch bank account holders to use their own online banking facilities in online retail environments as an alternative to paying by credit card. The process is user-friendly, simple, cost-effective and highly secure. At the online retailer, customers can opt for the idEAl payment method by clicking on the idEAl logo, which forwards them directly to their own bank’s website.
E-Invoicing. Electronic invoicing has the potential to complement SEPA as a premium service of value particularly to multinationals and public sector organisations that are hoping to replace paper invoices, automate supply chains, use existing technology, cut costs, reduce invoicing and payments errors through straight-through processing (STP), and support “green” policy agendas.
The Nordic countries lead the way in e-invoicing, but they do not use electronic signatures and there are no standardised formats for e-invoicing in the EU. Banks already offer basic corporate e-invoicing services (e.g., electronic invoices, integrated payments), but could develop their services further by, for instance, addressing the SME sector or extending internet banking facilities.
Amongst other initiatives in the market on this topic—including the work of the EC’s e-invoicing Expert Group—the EBA has an active E-invoicing Working Group (EiWG) focused on the following key objectives:
– To visualise an interoperable platform for the mass adoption of e-invoicing in Europe; – To design a network model to facilitate pan-European e-invoicing based on standards and a rulebook geared towards supporting interbank exchanges and exchanges between banks and non-bank service providers as well as with other affiliated e-invoicing initiatives.
in summary, therefore, the future shape of the Clearing and Settlement landscape remains an open issue at this point, and further significant progress (e.g., interoperability) is likely to be tied to the pace at which SEPA migration happens.
E-SEPA REMAINS ON ThE EPC AGENdA
The EPC and other stakeholders are continuing to develop rules and standards for emerging payment methods, such as m-payments and e-payments. The EPC has offered few specific initiatives of late, given the priority focus on rolling out Sdd and other existing planned initiatives, but nevertheless the e-SEPA landscape is beginning to take shape. however, the challenge with these new payments means is to design frameworks and enable business models that offer benefits and value to all stakeholders.
M-Payments. The EPC is looking at initiatives from banks, operators and manufacturers to define an m-payments framework and develop mobile channels for initiating and receiving SEPA payments. As such, it is developing a Roadmap for m-Payments. The objective is to set up technical requirements and standards specifications, but it does not intend to provide any insight on m-payments business models, which will be left entirely to banks and operators to define.
however, several standards exist, so the EPC will need to clarify preferred standards in close cooperation with the GSM Association (Global System for Mobile Communications trade body) before m-payments can reach their potential, and numerous strategic and operational issues will need to be settled as m-payments business models develop—from the sharing of investments and revenues to the challenges of managing security and network interoperability (see earlier Asia feature, page 16).
E-Payments. The EPC is working on the technical side of the e-payments framework in conjunction with the e-operating Model and the e-mandate solution for the Sdd. The e-payment framework, which should be finalised by the end of 2009, will allow customers to use their own internet banking applications to initiate payments at an online merchant.
SEPA UPdATE

Clearly, progress has been made on positioning the building blocks needed for SEPA to succeed in the long run. But it seems that for every milestone reached, there are still issues left to address. In this chapter, we look at some of the practical realities that still present obstacles to full SEPA implementation.
� SEPA cards face certain hurdles, such as issues over scheme compliance. It is too soon to contemplate any additional type of end-date for cards beyond the currently agreed deadline of end-2010 for migration to EMV standards (for cards, POS terminals and ATMs), even though some market players are already arguing in favour of it. Interchange fees and standardisation present significant practical hurdles to the SCF, with MasterCard having reached an interim solution for calculating fees (after being forced to act by the EC).
� For SEPA migration to speed up, each set of stakeholders needs to overcome their concerns. Banks need to be convinced of the business case for moving forward aggressively and corporates need more information to justify the necessary investments (e.g., in IT) required for SEPA compliance. Public administrations, prime potential users, have yet to become SEPA advocates.
� The risk of a mini-SEPA remains real, unless stakeholders get certainty on key overarching issues.
– First, a wide range of stakeholders are increasingly agreeing that setting an end-date for full migration to the SCT and SDD Schemes will be an essential step. Earlier in 2009, a European Parliament resolution called for an end-date of no later than end-2012 and the EC has since launched a wide-ranging public consultation on the end-date question.
– Second, SEPA solutions must demonstrate their potential to offer tangible improvements in operational performance. National authorities may have a role to play at a practical level to support and ease SEPA implementation in their local markets.
– Third, banks and corporates need clarity on all the standards to be used for SEPA payments (e.g., around data) in order to prioritise relevant IT investments and progress with SEPA implementation plans.
CHAPTER 2 HIGHLIGHTS
Chapter 2
SEPA - Unresolved Issues and Practical Challenges
32

33WoRld PAyMENTS REPoRT 2009
branded cards. (This was a so-called “fallback” fee, charged if no other interchange agreement was in effect.) MasterCard appealed, but decided in April 2009 to adopt an interim solution pending outcome of that appeal. its approach employs the ‘avoided-cost test’ methodology used in economic theory to assess efficient interchange fees. This method (also known as the ‘tourist test’ or ‘balancing fee’), sets a cap for fees such that merchants do not pay more than for a cash transaction.
in this case, the benefits are deemed to be derived for merchants in avoiding the costs of handling cash, but cash is not used for all payment situations and hence not all cards transactions are covered by this calculation. MasterCard so far bases its ‘avoided-cost test’ calculations on studies by the central banks of the Netherlands, Belgium and Sweden. As a result, it has fixed its cross-border intra-EEU MiF at 0.2% for debit card transactions and 0.3% for credit card transactions. in general, the methodology has led to a weighted-average MiF that is the lowest world-wide both for credit- and debit-card transactions.
The EC has accepted MasterCard’s approach, at least for now, but the ‘avoided-cost test’ benchmark is not relevant in every case—and the banking industry is certainly not keen to see it used across Europe. For banks, the MiF has been an important source of revenue, so they are understandably eager to protect it. But they also argue quite pragmatically that the MiF covers the cost of providing a wide variety of economic benefits to merchants, including payments guarantee, and services related to e.g., security and anti-money-laundering provisions.
Banks also argue that the role of acquirers has not been taken into account and the ‘avoided-cost test’ MiF therefore excludes the merchant services charge covered by existing MiFs. And anyway, banks say, the “avoided costs” cannot be averaged over countries when by-country differences in card activity, costs and operations are so wide (from the cost of terminal location/acquisition to the perceived value in card usage).
INTROdUCTION
SEPA is a far-reaching initiative: customers (consumers, corporates and public administrations), PSPs and regulators could all gain from full SEPA implementation eventually, but each set of stakeholders naturally has their own perspective, and aligning those interests is rarely easy. in addition, there are practical hurdles to implementation even when the principles have been agreed.
in this chapter, we look at a few of the hurdles that still exist on the path to full SEPA implementation. Each must be resolved to ensure SEPA reaches its full potential. We also provide our own perspective on how some issues could best be resolved in the short term to make SEPA happen.
SEPA CARdS FACE OPERATIONAL hURdLES ANd LACK A dEAdLINE FOR COMPLIANCE
As we have noted, the SCF faces unique challenges because the cards business is complex and some well-established global card schemes are already in place, making the role and functioning of any SEPA cards schemes quite challenging. Even beyond that, though, SEPA cards also need to overcome some practical challenges.
First, scheme compliance is an issue, because it is foreseen at this point that every scheme will be responsible for declaring itself compliant. Self-assessment will not provide a homogeneous evaluation of compliance milestones and does not readily provide transparency into how the scheme is really functioning or what will be done to arbitrate on compliance if the need arises.
Second, multilateral interchange fees (MIFs) are still under discussion. The EC argues a general per-transaction MiF appears incompatible with EU antitrust rules for cards transactions. (Essentially, the EC says MiFs restrict price competition because merchants cannot negotiate these fees away.)
in late-2007, the EC prohibited MasterCard’s multilateral intra-EEA interchange fee for cross-border transactions conducted with MasterCard-
SEPA UPdATE

34
the most competitive economy globally. According to the lisbon Agenda, the integration of euro payments markets is a major pre-requisite for the realisation of this vision. SEPA is therefore a necessary step towards strengthening the European economy as a whole. As such, SEPA’s goals can sometimes appear to run counter to an individual bank’s efforts to provide customers with the best possible service in an economically viable way.
Nevertheless, SEPA is seen as a catalyst for change and is expected to help shake up the competitive landscape, allowing for more agile stakeholders, pan-European reach, and increased competition. SEPA will also offer new business opportunities, help to attract new clients through new services and state-of-the-art offerings and consolidate the ranks of payments market players.
Banks we interviewed in June 2009 (36 interviews conducted with 16 major players and 20 of their corporate clients) agreed the business case for implementing SEPA is difficult to assess. Right now, it is evident that revenues will be directly affected by e.g., losses in f loat income and lower transaction prices. it is less clear, however, what the eventual cost savings or other financial benefits from new opportunities might be.
For example, while there is potential for banks to create value-added services (e.g., international Bank Account Number-Bank identifier Code (iBAN-BiC) translators and conversion and control tools, SEPA transition support, mandate management and gathering solutions), the demand for such products is not yet much in evidence. it remains to be seen whether this simply ref lects the fact that significant migration of payment volumes to SEPA has yet to start—i.e., corporates are simply not ready for these services—or whether banks are not yet offering the full range of such solutions that would fully meet corporates’ requirements.
The financial crisis and the global economic slowdown have also helped to divert attention from SEPA, as some banks have concentrated more on what is core to driving their existing business. As a result, some have decided to delay investments in SEPA infrastructure and systems for six months to a year, hoping to get a clearer idea of what the impact will be on market models—even though this is arguably a short-sighted approach since these banks will inevitably have to play catch-up later.
Given the number of variables that underpin the ‘avoided-cost test’, its use seems likely to intensify the debate over fees, rather than helping to resolve it. Clearly, though, banks will have to rethink their business models before migrating to SEPA SCF if the interchange issue is not favourably settled. At this point, though, stakeholders seem unlikely to reach a compromise on interchange fees anytime soon, especially given the vehement attempts of regulators and consumer advocates to reduce or abolish such charges.
The third practical challenge for SEPA cards is the lack of a deadline for migration. The EC has said it would be premature to contemplate an end-date for migrating to SEPA cards when none of the requisite standards have been finalised (card-to-terminal, terminal-to-acquirer, acquirer-to-issuer and certification framework).
At some point, an end-date will obviously need to be discussed and has been requested by some market players, but a more robust version of the “Volume” (functional, technical and security specifications) and the framework (standards definitions) will need to be finalised first.
TO SPEEd SEPA MIGRATION, STAKEhOLdER BUy-IN NEEdS TO BE MORE ENThUSIASTIC
SEPA has admittedly only launched on a relatively small scale so far, but the rate of migration has been slow and it seems many banks and customers (corporates and individuals) are not yet convinced of SEPA’s merits. Public Sector authorities could potentially drive significant SEPA usage, but they too have been slow to migrate. it remains a challenge to coalesce buy-in for SEPA since each set of stakeholders harbours different concerns and priorities.
Many banks are still unsure of the business Case
Banks are certainly not ignoring SEPA implementation, but many are hesitant to pursue SEPA because of the implementation costs and concerns that their business models will be affected negatively. After all, SEPA is not an initiative solely driven by market demands or bank economics; it is a set of rules designed to support efforts to unify the pan-European payments market. The overall goals were defined by EU governments in the lisbon Agenda, which envisages the EU internal market as

35WoRld PAyMENTS REPoRT 2009
Corporates generally agree implementation efforts could be completed in about two years (12 months for study and iT impact analysis and 12-18 months for execution), but iT is clearly a major issue. For example, changes to master data (iBAN-BiC protocols) create an intense challenge.
Some problems remain mainly at the national level in the use of iBAN-BiC. For instance, 95% of heavy transactions users in France still use the RiB format. Banks there have not required them to switch to iBAN-BiC, so corporates have not volunteered to invest in the new iT systems required for SEPA. Many corporates in France use conversion tools instead, but this is a short-term fix, and if a new customer sends iBAN-BiC banking references, these corporate cannot manage them—a position that may become increasingly untenable as time goes by since iBAN-BiC will evolve and automatic conversion will not be sufficient anymore.
Corporate executives cited a few specific prerequisites for SEPA to succeed from their perspective: �More clarity on the impact of the SEPA/PSd, i.e., more communication and information from banks and European authorities; �More clarity on the benefits of using Sdds, and ways to safeguard the advantages that currently exist in national payment means; � Card standardisation; � A single European ACh for all participating countries.
interestingly, SEPA was viewed in a more positive way by non-European, global corporates we interviewed than by domestic European corporates—SEPA is seen as facilitating a reduction in their transaction costs, reducing business difference between countries, and allowing a better integration in Enterprise Resource Planning (ERP) systems.
Most European banks have nevertheless already invested in SEPA to some extent, recognising the move toward SEPA is ultimately inevitable, making investment mandatory for one or more reasons: � Projects must be done eventually so should be done as quickly and cheaply as possible; � investments in the ongoing restructuring of pre-existing iT platforms and organisations can help mitigate costs associated with legacy systems; � it is an opportunity to consolidate, integrate and modernise outdated infrastructure.
Bank executives cited a few specific prerequisites for SEPA success from their perspective: � A clear end-date for overall migration and for individual legacy payment means; � A more complete scope covering more means of payment (m-payments, e-payments) and elimination of other means; � More involvement from corporates and a stronger link with corporate financial applications.
CorPorates still neeD to be ConvinCeD of the benefits of Migrating to sePa instruMents
Corporates are also unsure of SEPA’s benefits, so have generally stayed on the sidelines for now (corporates we surveyed gave SEPA implementation only 3 out of 10 on the priority scale). The corporates we surveyed cited the potential benefits in the following order: � improved reconciliation capabilities; � Reorganisation / optimisation opportunities; � decline in transaction costs (though one respondent said transaction costs could increase as individual incentive deals disappear); � Alignment of domestic / cross-border transaction prices; � Enhancement of card acceptance and lower fees.
None of the corporates cited account reduction possibilities.
As long as corporates are unclear of the business benefits of SEPA, they are likely to delay switching to SEPA payment instruments, at least in the short term—and especially in the absence of a stated end-date for migration.
SEPA UPdATE

36
RESOLvING SOME OvERARChING ISSUES CAN hELP SPUR SEPA MIGRATION ANd UNLOCK ITS POTENTIAL
SEPA is a positive initiative that will create the conditions for enhanced competition in payments services. it will also generate, through harmonisation, more efficient payment systems and is also expected to deliver tangible benefits for the economy and society as a whole.
however, SEPA migration needs to gather pace soon to avoid the following risks: � A mini-SEPA (in which SEPA instruments are used only for cross-border transactions) could emerge if no end-date is set to spur migration. � SEPA implementation could become even more complex if discussions are allowed to continue endlessly and an end-date is put off until all pertinent regulatory frameworks are finalised. � Product and service offerings could remain under-developed if the mandatory investments become too high. Additional compliance and regulatory demands could leave some financial institutions with little discretionary investment spend to dedicate to systems and infrastructure that will position them to grow.
The bank and corporate executives we interviewed agreed that beyond any concerns that are specific to certain stakeholders, three overarching issues need to be resolved to ensure SEPA meets its full potential as soon as possible. They are:
1. An end-date must be set for migration;2. SEPA must offer operational performance
advantages;3. Certain standards (e.g., around data) must still
be finalised.
PubliC seCtor CoulD be a Catalyst for sePa PayMents, but few have aCteD yet
Public administrations (PAs) could be catalysts in creating the critical mass needed to accelerate SEPA uptake as the public sector accounts for a significant chunk of payments transactions in SEPA countries (about 20% according to the EC). however, most public administrations have thus far been slow to use SCTs (less than 1% in countries like Belgium, Germany, France, Spain and Slovenia).
Some countries have been more proactive. italy for instance began in April 2009 to align its government payment services with SEPA requirements. however, even if public administrations do migrate to SEPA instruments, those volumes will not contribute to the market’s critical mass if the payments are processed by public entities (e.g., central banks) not via the regular payments system. This is the case in italy, Spain, France and Germany for salaries paid by public entities and social securities payments.
in 2009, the EC conducted a survey on the preparedness and SEPA migration status of public administrations, focused on SCTs. The survey responses showed only eleven of the 16 Eurozone Member States have a national migration plan for the public sector. Six of them have coordinated their work in the form of a common national migration plan and eight dedicated central steering bodies to drive SEPA migration by public administrations. A target cut-off date for legacy credit transfers has been established by public administrations in seven Member States: �Mid-2010 for the Netherlands (only for central government departments, excluding the tax authority); � End-2010 for Belgium and Austria (both for federal administration) and Finland (for phasing out all legacy CTs, not only usage by PAs); � End-2011 for France and Slovakia (for all PA) and Cyprus (for NCB – the payment service provider for Treasury and Social insurance).

37WoRld PAyMENTS REPoRT 2009
1. Full Migration to SEPA may not be Feasible without a Clear End-Date
if national credit transfers and direct debit schemes are allowed to remain alongside SCTs and Sdds for an extended period, SEPA instruments could end up being used only for cross-border transactions (i.e., mini-SEPA) and it would create considerable expense for market participants to maintain parallel systems.
Many European bodies essentially agree on the need for an end-date—including the European Parliament, which called on the EC earlier this year to set a clear and appropriate end-date, which should be no later than december 31st 2012. The EC launched a wide-ranging public consultation in June concerning whether a deadline is needed, when it should be, and under what terms. it is hoped that this will lead to some degree of clarity on the way forward by the end of 2009, but numerous different issues must be addressed—from the enforcement jurisdiction (national vs. EU level) to determining the criteria for some existing important niche services continuing.
2. SEPA Must Demonstrate Real Operational Performance Advantages
in unifying the European payments market, SEPA is intended to significantly reduce the need for corporates to have multiple accounts, systems and processes, thus reducing their costs and increasing efficiencies. however, before migrating, stakeholders are generally looking for reassurance that banks’ SEPA services are able to offer operational performance (e.g., STP, iBAN-BiC, reconciliations, interoperability) that is as good, if not better, than they experience today in national arenas.
it seems likely that some additional enhancements may need to be incorporated in the SCT scheme, in addition to those that have already been added since its launch, to facilitate the migration of certain important payment types—such as pension payments and tax payments—in some countries.
To give another example, an optional originator identification code was added to the SEPA data format for credit transfers last year. it allows payees to reconcile payments information with invoices or other supporting documentation. in the case of returns, for instance, the originator could automatically reconcile them and the bank would return the information to the customer with the refund. it would also allow corporates to make one payment to cover multiple invoices. however, multiple standards for structuring such codes exist in the market. A more uniform approach on this topic, based on discussions between the banking and corporate communities, may be required as a further incentive to encourage multinational corporates to migrate to SEPA.
Another example could be iBAN-BiC conversion and control support through national central banks, which could be very helpful in achieving operational-performance improvements and easing implementation (e.g., with centrally updated data files).
3. Clarity on Some Aspects of Standards for SEPA Payments is still Needed
Banks and corporates need clarity on the standards to be used for SEPA payments in order to prioritise relevant iT investments and progress with SEPA implementation plans.
Much work has already been done in this area, particularly in the bank-to-bank space. iSo20022 is the most advanced standard available on the market, but is still being developed (e.g., account statements have just been developed and are due for July 2009 release). The adoption cycle of new standards is also very long and complex and in addition, iSo20022 covers a large scope of services and therefore offers transposition options and allows interpretation.
SEPA UPdATE

INTROdUCTION
Transaction services—primarily cash management and payments services—have long been core to the relationship between banks and their customers. After all, most customers initiate a banking relationship based on some type of transactional activity, and the success of that experience often determines the extent to which the relationship grows. For banks, transaction services have always generated important revenues, but the financial crisis has boosted the value banks place on this business.
Banks are especially keen now to capture the steady returns and fee-based revenues of transaction services after the financial crisis reduced the returns from—and appetite for—more volatile and risky businesses and increased the need to attract and retain deposits.
however, while transaction services may not be exotic, success in the business is far from assured. Scale is critical, along with a steadfast commitment to investing in the business and developing its products, services and capabilities.
in recent years, many banks have set up GTS divisions to handle cash management, trade finance and payments services in a globalised, integrated organisation. despite the “global” descriptor, some of these entities are actually focused more on serving regional needs than global ones, but each is of a significantly larger scale than the typical domestic player (except in the US where the domestic market itself is so large). Whatever their geographic focus, GTS businesses are designed to serve a wide range of client needs and leverage cross-selling opportunities between different bank product lines.
in this section of the report, we discuss the key success factors in establishing and operating a successful GTS business (sometimes called Global Transaction Banking, GTB). it draws in particular on 36 interviews we conducted during June of 2009 with 16 major banking players and 20 of their corporate clients.
in the first chapter, we discuss what changing economic conditions have meant for the GTS business, and why GTS should continue to be an attractive business for banks. in the next chapter, we illustrate the kind of major variables (regulatory environment including major initiatives like SEPA, customer expectations and iT requirements) that can cause the GTS landscape to shift and can create important decision points on the GTS business-development path for banks. The last chapter looks at the kinds of strategic decisions being made by GTS businesses in response to the evolving operating conditions—decisions that have a direct impact on success.
Global Transaction Services
38

SECTioN TiTlE l1SECTioN TiTlE l2
39WoRld PAyMENTS REPoRT 2009
CHAPTER 1 HIGHLIGHTS
� GTS products and services (primarily cash management and payments services, trade finance, and sometimes including cards issuing and acquiring and securities services) help corporates and financial institutions to meet their fundamental needs to optimise their working capital and secure exchanges of merchandise and payment flows.
� GTS has become an especially attractive business in light of the financial crisis, because GTS can still generate relatively stable revenue from fees when economic conditions are weak. Among interviewed banks, GTS divisions have historically generated an estimated 50%-65% of revenues from interest on balances, while fees represent the remainder.
� Some GTS divisions suffered from deteriorating market conditions and reduced business volumes in the first quarter of 2009, but our analysis shows GTS still accounts for a significant share (5%-20%) of group revenues, making it an important source of revenue for banks.
Chapter 1
GTS Products are Core to Corporate and Financial Institution Clients

40
service its own organisation for cash management and payment services, including SMEs, and occasionally the retail client base.
however, the primary focus of GTS is large multinational corporates, which have specific demands that drive banks to develop tailored offers and sophisticated products. Financial institutions are also important clients, as they deliver scale.
The businesses of GTS leaders are characterised by: � A worldwide client base, composed of multinational corporations and investors; � Global-market operating environment, featuring cross-border f lows; �high transaction volumes, requiring an industrial approach to enable the reduction of processing costs.
however, some GTS segments are more concentrated than others. For example, securities services and trade finance are highly concentrated markets. According to a 2008 Capgemini analysis, the 20 leading banks account for 55% of trade-finance net banking income (estimated to be worth $18 billion worldwide), while the remainder is shared by some 400 players. Within the Uk, two leading global banks account for around 50% of the market. other GTS markets, such as cash management, are still fragmented. The global cards acquiring / issuing business is also fragmented as card schemes are structured to ref lect domestic market constraints and consumer habits and very few players have multi-country capabilities.
GTS PROdUCTS ANd SERvICES MEET FUNdAMENTAL NEEdS FOR CORPORATES ANd FINANCIAL INSTITUTIONS
Transaction services are essential for corporations and Financial institutions (Fis) to optimise their working capital and to secure payment f lows and exchanges of merchandise for their clients. For instance: � Cash management and payments services help corporates and Fis to manage their cash positions and control liquidity f lows. Examples include cash concentration, cash pooling, payments, payables and receivables services and foreign exchange. � in trade finance, banks help corporates to mitigate risk linked to international transactions. key products include letters of credit and credit insurance. � Cards issuing and acquiring caters to large multi-national corporations seeking card acquiring services for their retail operations or card-based travel and entertainment solutions for employees. � Securities services address the needs of investors through products such as custody, securities borrowing and lending and fund services.
An analysis of bank offerings shows that while all banks providing GTS services cover payments, cash management and trade finance, each has its own range of products and services (see Figure 3.6).
GTS is a product business and does not generally ‘own’ customer relationships. Rather, relationship managers from other customer-facing divisions in the organisation generally ‘own’ the customers and introduce product specialists and sales people from GTS to their customers. A GTS division will also

41WoRld PAyMENTS REPoRT 2009
Product pricing is crucial to the economics of the GTS business. Bank executives generally agree current GTS prices include a premium for risk, but say prices could still be more actively adjusted to new market conditions and future regulation. For instance, pricing for liquidity could be clearer and banks could be compensated explicitly or implicitly via pricing for assumed risk. This could include charges for intraday liquidity. Some banks told us they were negotiating with clients over new fees that would better ref lect the current market environment.
Banks also noted counterparty and settlement risk remain a top priority, even more so than before the crisis. one bank told us it has invested in powerful new iT filters to enable end-to-end transaction follow-up to mitigate settlement risk. At the same time, creditworthiness standards for clients have become more rigorous.
GTS BUSINESS IS PROFITABLE FOR BANKS, dESPITE ThE FINANCIAL CRISIS
our analysis shows the GTS divisions of banks have generally performed well in recent years (see Figures 3.1-3.4). Some were impacted by deteriorating market conditions and reduced business volumes in the first quarter of 2009, but the business is clearly still a source of revenue for banks. GTS revenues have grown among the selection of five global leaders we studied and the ratio between quarterly GTS and group revenues shows GTS still accounts for a significant share (5%-20%) of group revenues.
GTS IS A RELATIvELy STABLE SOURCE OF REvENUE
GTS products and services generate revenues for banks in two forms:
– Service fees charged to customers based on transaction volume; – Interest from balances, generated from customers’ cash positions or from float, which is revenue generated on payments that have yet to clear (though not all banks generate f loat revenue).
Among banks we interviewed: � GTS divisions have historically generated an estimated 50%-65% of revenues from interest on balances or f loat, while fees represent 35%-50%. The fee component clearly becomes more important in times when interest income is falling. � GTS costs are mostly iT, operations and staff costs. Those costs can be directed or allocated in a variety of ways, depending on a bank’s organisational and corporate structure (e.g., to what degree infrastructure and systems are shared with other divisions). � The average observed cost/income ratio is estimated to be between 50% and 65%. This suggests banks could probably increase their investment in GTS without threatening the profitability of the business—especially if that investment generates future sources of revenue and efficiency through innovation and optimised processing capabilities.
GloBAl TRANSACTioN SERViCES

Figure 3.2 Three Selected GTS Leaders1: Quarterly Net Income2 of GTS division (€ millions3) vs. Quarterly Net Income of Bank Group (€ millions3)
-900
-700
-500
-300
-100
100
300
500
700
900
Q109Q408Q308Q208Q108
0 0
-18,000
-14,000
-10,000
-6,000
-2,000
2,000
6,000
10,000
14,000
18,000
— US Global Bank 2— US Global Bank 3
GTS DivisionGroup
— EU Global Bank 2
GTS
Net
Inco
me
Gro
up N
et In
com
e
1 Major global transaction services (GTS) businesses that run as standalone bank divisions and disclose quarterly GTS results.2 Total revenues net of all expenses.3 Non-Eurozone banks’ dollar or pound-based results were converted using five-year average ECB Euro Foreign exchange rates.
Source: Company financial reports.
Figure 3.1 Five Selected GTS Leaders1: Annual Net Income2 (€ millions3), 2004–2008
0
500
1000
1500
2000
2500
20082007200620052004
— US Global Bank 1— US Global Bank 2— US Global Bank 3
— EU Global Bank 1— EU Global Bank 2
1 Major global transaction services (GTS) businesses that run as standalone bank divisions and disclose GTS results; EU Global Bank 1 did not disclose results prior to 2007.2 Total revenues net of all expenses. 3 Non-Eurozone banks’ dollar or pound-based results were converted using five year average ECB Euro Foreign exchange rates.
Source: Company financial reports.
42

WoRld PAyMENTS REPoRT 2009
Figure 3.3 Five Selected GTS Leaders1: Annual Net Revenues2 (€ millions3), 2004–2008
— US Global Bank 1— US Global Bank 2— US Global Bank 3
— EU Global Bank 1— EU Global Bank 2
0
1,000
2,000
3,000
4,000
5,000
6,000
7,000
8,000
20082007200620052004
1 Major global transaction services (GTS) businesses that run as standalone bank divisions and disclose GTS results; EU Global Bank 1 did not disclose results prior to 2007.2 Total revenues net of interest expenses.3 Non-Eurozone banks’ dollar or pound-based results were converted using five-year average ECB Euro Foreign exchange rates.
Source: Company financial reports.
Figure 3.4 Five Selected GTS Leaders1: Ratio of Annual GTS Net Revenues2 to Bank Group Net Revenues2, (%)
— US Global Bank 1— US Global Bank 2— US Global Bank 3
— EU Global Bank 1— EU Global Bank 2
0%
5%
10%
15%
20%
25%
20082007200620052004
10% 10%
5%
7%6%
7%8%
9%8% 8%
10%11% 11% 11%
12%
18%
21%
10% 10% 10% 10% 10%
1 Major global transaction services (GTS) businesses that run as standalone bank divisions and disclose GTS results; EU Global Bank 1 did not disclose results prior to 2007.2 Total revenues net of interest expenses.
Source: Company financial reports; Capgemini research and analysis, 2009.
43
GloBAl TRANSACTioN SERViCES
WoRld PAyMENTS REPoRT 2009

The GTS landscape is constantly shifting, both within geographic boundaries and across the payments universe as a whole. GTS players must respond to each shift, often proactively and always deliberately, to ensure they can retain and build their GTS franchise. The most significant drivers of change in the payments business are:
� Regulations can be complex and tend to change often because transaction services relate to many areas of economic activity. As a result, GTS activities are governed or affected—explicitly or implicitly—by numerous national and segment-specific oversight bodies.
� User demands are constantly evolving. Corporates expect quality execution of transactions and expect low prices on commoditised activities. However, they also want value-added services that can help them reduce costs, increase efficiency and mitigate risk in their own financial supply chains.
� IT investments are significant just to keep up with mandated changes in transaction services, let alone to improve the quality and speed of delivery or provide additional capabilities—and especially to seize the kind of opportunities offered by radical industry-changing initiatives such as SEPA.
CHAPTER 2 HIGHLIGHTS
Chapter 2
Regulation, Client Needs and IT are Key Drivers of the Shifting GTS Landscape
44

45WoRld PAyMENTS REPoRT 2009
CORPORATES dEMANd CONTINUOUS IMPROvEMENT IN GTS ExECUTION
Corporates, above all, demand quality execution of transactions and expect must-have products at low prices. however, they are also looking continually for ways to reduce costs, increase efficiency and mitigate risk—especially in today’s trying market conditions.
For example, GTS customers are increasingly sensitive to risk, so are reassessing their banking relationships to ensure their banks are both reliable and capable of f lawless execution. Corporates are also demanding enhanced reporting, transparency, and real-time information (e.g., to trace payments and get current account balances) and are very focused on how these enhancements can add value to e.g., basic cash management to improve liquidity management. Corporates are also keen to see more integration in the financial supply chain and show continued interest in solutions involving payment and collection factories.
New entrants, such as Pis are well placed to offer some specific value-added services, such as iBAN-BiC translators or transition support for SEPA or mandate management for Sdd, because they are not hampered by legacy infrastructures and processes. however, while new entrants could be agile competitors to banks in certain areas, corporates we interviewed said they are too risk-averse right now to migrate much of their payments business to newcomers or non-banks.
in general, interviewed corporates cited three critical criteria in their selection of a GTS provider: global capabilities, competitive pricing and secure execution (including robustness and back-up facilities).
The needs of corporates also depend though on their geographical organisation:
� Companies with multi-country operations want standardisation across borders, facilitated, unified business procedures and a single processing platform, together with local capabilities; � decentralised corporates are more demanding of local capabilities. For instance, corporates that need domestic services, such as payroll handling or cheque emitting and cashing facilities for employees, would favour a GTS division affiliated with a retail bank network.
REGULATORy BACKGROUNd FOR GTS IS COMPLEx ANd CONSTANTLy ChANGING
GTS comes under close regulatory scrutiny because it covers so much economic activity—facilitating the transfer of securities, goods or services and associated payments, often in cross-border settings. however, GTS executives say the constant changes in regulation are often even more challenging than the regulations themselves.
For banks, regulation can potentially affect numerous facets of GTS activity. it can require banks to restructure their organisations or re-evaluate their sales and transaction processes. it may also threaten business models. For example, the PSd will have a direct impact on revenues via its provisions regarding f loat and value-dating (see SEPA Update section) while standards like Basel ii can change the amount of available capital for banks participating in activities such as trade finance. To offset the impact of regulation, and differentiate their offerings, banks will therefore need to develop value-added services.
Regulators are also becoming more demanding and intrusive in the wake of the global financial crisis, especially in places where states have acquired stakes in major banking institutions. While regulators had once been willing to see banks self-regulate based on common frameworks, there is a shift to more exacting monitoring of risk. one bank we interviewed even voiced concern that some countries would become more isolationist in reaction to the financial crisis—a trend that could create yet more reporting costs for banks if compliance requirements continue to expand.
Bank executives generally agree their biggest regulatory challenge lies in the multitude of rules applied globally to prevent financial fraud, money laundering and terrorist financing. These efforts require compliance on numerous different transaction-monitoring and due-diligence rules (e.g., ‘know your Customer’). Regionally, executives say iAT (international ACh Transactions) rules in the US are also a major issue, while banks in Europe are particularly concerned with the costs and challenges of complying with SEPA and the PSd (see SEPA Update section).
GloBAl TRANSACTioN SERViCES

46
GTS BUSINESS REQUIRES ONGOING INvESTMENT, ESPECIALLy IN IT
Given the demanding and evolving regulatory and client pressures of the GTS business, providers need f lexible, centralised GTS platforms:
� Flexibility is needed to handle the evolution in existing activities and the introduction of myriad innovations e.g., around mobile and e-payments. in Europe, SEPA naturally creates a larger market, potentially solidifying the business case and making it more attractive for individual banks to develop European solutions. � Centralisation is increasingly critical to meet corporate demands for increased payments integration and automation.
investments to manage mandatory changes represent a large share of every GTS division’s investments. indeed, the bank executives we interviewed said mandatory investments were never less than one-third of the total amount invested in GTS every year and at times accounted for the entirety of a year’s GTS investment.
of course, the actual amounts invested depend greatly on the scope and reach of the bank. Among those we interviewed, the amount ranged from €15 million to €200 million a year—dedicated mostly to renovating iT infrastructure or platforms and service offerings but also to integrating and optimising platforms and enhancing e-banking capabilities.
European banks and global players all reported investments in SEPA, with the average being around €20 million per year, mostly in systems and iT—again with large variations depending on bank specifics. however, while SEPA investments are measurable and immediate, they say, a business case is difficult to make as the returns are difficult to quantify and the first effects will not be felt for 5 to 7 years.
The challenge for banks is turning infrastructure investment (mandatory and discretionary) into profits, or at least to ensure the volumes processed are sufficient to cover the amortised cost of the GTS infrastructure (iT, systems and staff) and its long-term fixed costs.

WoRld PAyMENTS REPoRT 2009
To navigate the shifting GTS landscape successfully, and generate value for the bank as a whole, GTS businesses must demonstrate both strategic commitment and flexibility. We identified four actions as being especially important to the success of any GTS franchise:
� Asking if goals are feasible. Banks with GTS ambitions must make a candid assessment from the outset of their ability to build on a critical mass of payment transactions and fulfil their GTS ambitions.
� Establishing an appropriate corporate organisational structure. GTS operations need to be structured in a way that enables the bank to nurture the business and demonstrate strategic commitment to its goals. There is merit to structuring GTS as a stand-alone division, but some banks also use a matrix organisation.
� Making informed investment choices. An inevitable part of the evolution for any GTS division is deciding whether to invest in the bank’s network and infrastructure, or establish capability partnerships, or outsource in order to build or consolidate a strong GTS position and deliver solutions.
� Building an adaptable offering. Banks must also commit to, and invest in, renewing and adapting the range of products and services to meet the evolving needs of corporates, provide added value for clients, and keep the bank from being relegated to commoditised transactions processing.
CHAPTER 3 HIGHLIGHTS
Chapter 3
Successful GTS Businesses are Employing Astute Strategies
47WoRld PAyMENTS REPoRT 2009

48
� it helps banks to cater better to the wide range of services demanded by large corporations, thus helping to preserve the loyalty of these clients. � GTS sub-segments are compatible as they share certain operational and risk-management characteristics. � Banks with GTS divisions are likely to be perceived by the market (clients, investors and analysts) as more stable than banks with no such steady fee-based revenues.
The trend toward standalone GTS divisions was started by global players but regional players are also starting to favour the standalone model as they seek to create a coherent scale transaction services business that can better serve their clients.
As noted, there is no single GTS organisational model as each bank has developed its own, driven by the synergies that could be built internally. however, Figure 3.5 shows there is a core of GTS services on which banks can build, depending on the available capabilities and opportunities. Some expand into closely related synergistic businesses, or businesses that lie up or down the value chain.
Among possible extensions of core GTS businesses, card payments is a particularly attractive business, certainly compared with commoditised and low-growth securities processing, especially if retail cards are included, as credit card payments are demonstrating sustained growth (see World non-cash payments markets and trends section).
tie-in to Clients anD other bank businesses is CruCial
Success in GTS also depends on the bank’s ability to forge ties between GTS and other bank divisions and clients. For instance, GTS will benefit from the bank’s overall reputation at times when clients are concerned with the reliability of their partner banks, as they are currently.
Another corporate interviewee indicated lending has become a prime condition for a banking partner. And with corporates expected to allocate payments business even more often to their main lending banks, the bank’s coverage and organisation of relationship management and the principles of profit-sharing among divisions will become crucial.
in terms of client relationships, for example, some corporates told us they wanted a GTS generalist as a point of contact to identify and approach product specialists when needed, though large corporates may want instead to contact specialists and deal
CLEAR ANd REALISTIC STRATEGIC AMBITION IS ThE FIRST PREREQUISITE FOR GTS SUCCESS
GTS is by definition an extensive operation, but exactly how much scale is required for banks to justify the investment in capabilities, industrialise processes and leverage scale still varies. often, the GTS operation grows out of an existing Corporate and investment Banking (CiB) division, pragmatically created to meet specific customer demands. Nevertheless, each bank still has to define its own parameters for critical mass—whether it is in terms of transactions volume, geographic scope or transaction value—largely depending on the position of the original CiB franchise.
Currently, most of the largest GTS players are US-based, and they have succeeded by building on their extensive presence in a large domestic market. The largest players in Europe have also built on strong footprints in their home markets. Nevertheless, the global payments market remains fragmented and it is sometimes difficult even for large players with far-reaching networks and capabilities to compete with regional or domestic players on very specific offers. in Europe, this may change though as SEPA should harmonise the payments landscape, thus spurring cross-border competition and bank expansion.
To succeed, each bank must assess from the outset whether it can succeed in building a global or regional transaction services business based on its existing operations, networks and partnerships, and its willingness to invest in them further.
CORPORATE STRUCTURE FOR GTS MUST BE RELEvANT ANd APPROPRIATE
Even though the sub-segments of GTS may be heterogeneous in nature, there are widely believed to be potential advantages in setting up a single business unit for cash management and payments, trade finance, as well as securities services and cards acquiring and issuing.
The benefits of setting up a consolidated GTS business include the following: � it helps banks to define strategic objectives for the business, and make investment decisions accordingly. it also signals the bank’s commitment to the GTS business to investors and clients and gives GTS latitude to develop as a business. � it enables the bank to leverage the commercial synergies that exist between trade finance, cash management and payments.

49WoRld PAyMENTS REPoRT 2009
teams directly. The “bundling” of transaction services and lending also makes credit a major selling point of transaction services for banks, and banks sometimes have to adjust GTS product prices to account for the total volume of business funnelled into the bank. This may impact GTS revenue when banks are deleveraging, because clients whose credit lines are cut may also take their transactions business to other lenders.
in terms of the profit & loss (P&l) statement, the best practice emerging from discussions with GTS specialists is to share profits with other business lines (retail or commercial banking) to foster a cooperative approach. in some of the banks we interviewed, GTS is also seen largely as an internal supplier of services, notably for retail activities.
Figure 3.5 Banks Can Expand Core GTS Businesses into Synergistic and Related Businesses
Source: Capgemini research and analysis, 2009.
Securities and Custody Services
Cards Acquiring
Su
pp
ly Ch
ain
Fore
ign
Exc
han
ge
Core GTS Services:
Cash and liquidity management
Payments
Trade finance
Synergies with
securities activities
Downstream: additional services
Upstream: enhanced services
Synergies with retail banking activities
GloBAl TRANSACTioN SERViCES

50
Different organisational tyPes are eviDent now
While there are benefits to the standalone model for GTS, other models also exist. We looked at the transaction service offerings and organisations among a selection of banks offering GTS products (see Figure 3.6) and identified three distinct types of GTS organisations at banks (see Figure 3.7). They are:
� Type 1: GTS is structured in a standalone corporate division, with associated P&l and control over investments and platforms. � Type 2: GTS is a matrix organisation. There is a bank-wide GTS reporting line, often with a “shadow” P&l that is not publicly disclosed. GTS coordination is global, but regions are in charge of delivering GTS services. � Type 3: GTS does not exist as such, but services are provided on a regional or business-line basis.
We gathered additional insight on these types from our bank interviewees and found the following: � Among interviewed Type 1 banks:
– GTS always covers the trade finance and cash management business lines. Securities services are included in GTS for most. only one of the interviewed banks includes global corporate cards services; and another also covers capital market sales and card acquiring. – The depth of GTS responsibilities varies. All of the GTS divisions studied cover marketing and sales. Client relationships are shared with other divisions at two banks, while iT, infrastructure and operations are shared at the majority of banks. – Type-1 GTS divisions are not consistent in their global reach, as some players have chosen to limit their reach more regionally. The largest Type-1 bank covers 100 countries; the smallest covers 10.
� Among interviewed Type 2 banks: – P&l is not consolidated for GTS. Responsibility for offers is centralised at the group level, while regions and countries are responsible for delivery. A GTS unit is in charge of coordinating GTS efforts across the group.
� Among interviewed Type 3 banks: – Services are provided by region and/or by product line.
Notably, all global banks have either a Type-1 or Type-2 GTS organisation. Both models provide a structure for GTS that enables the bank to demonstrate and develop its strategic commitment to the business, and forge ties between bank divisions that will help GTS to thrive.
INdUSTRIAL ChOICES hAvE TO BE MAdE
Given the size of required investments and the critical mass needed to stay in the GTS business, banks must choose whether to invest in their network and infrastructure to build or consolidate a strong global or regional position or establish capability partnerships to deliver GTS solutions. however, that decision requires a sharp vision of what is within the core business of the bank and what is not.
in the circumstances, the debate over sourcing will certainly continue and cost will inevitably play a role in any decision, given that outsourcing swaps fixed costs for variable costs and insourcing / co-sourcing provides a way to spread fixed costs (e.g., across greater transaction volumes) and recoup investment outlays faster. To make a good strategic decision on sourcing, banks therefore need a clear picture of their current cost base and their potential to expand scale. Some banks, for example, are already positioning themselves to insource SEPA transaction volumes.
however, sourcing decisions can also create risks, which banks must consider. insourcing, for example, tends to increase complexity and risk-management challenges. There are no examples yet of a major insourcing deal between banks in the market, but a number of players have entered into deals for specific services or targeted capabilities.
Banks have not started insourcing operations as quickly as expected, but some banks we interviewed expect the trend to pick up with Sdd implementation, which will force smaller players to rely on bigger institutions to provide services when they cannot justify the required investments themselves. As EU and country-specific deadlines are set, and public sector entities begin to drive volumes into new transaction types, we expect to see an acceleration in sourcing decisions and models within the region.
The sourcing debate also raises questions about the position of Pis relative to banks. Corporates told us they believe these players could add value in the medium term, but banks do not see a direct threat from them. in fact, many banks see value in partnering with Pis to provide innovative solutions (e.g., around m-payments) or cover specific value-added services such as mandate management. in the cards business, there have been examples of deals between acquiring banks and processors, and banks have also partnered with processors to offer SEPA-compliant services such as Sdd transaction processing. Pis are also potentially clients for banks, as they are gateways to payment systems managed by banks.

51WoRld PAyMENTS REPoRT 2009
Figure 3.6 Transaction Services Offerings and Organisational Model of Selected Players
Bank
Services DetailReporting Division
Geographical Coverage
PaymentsCash
ManagementTrade
FinanceCards
Other Services
Type 1: Banks with corporate GTS structures
US Global Bank 1 X X X Issuing1 Foreign Exchange CIB 30+ countries
US Global Bank 2 X X X Issuing Securities Services Commercial Banking 100+ countries
US Global Bank 3 X X X Issuing Securities Services Corporate 40+ countries
EU Global Bank 1 X X XIssuing,
Acquiring/ Corporate 50+ countries
EU Global Bank 2 X X X AcquiringSecurities Services
Capital MarketsCIB 30+ countries
EU Regional Bank 1 X X X Issuing Securities Services Commercial Banking Northern Europe
CEE Regional Bank 1 X X X / / Commercial BankingCentral and Eastern
Europe
Type 2: Banks with matrix structures
EU Global Bank 3 X X X / Securities Services Corporate 70+ countries
EU Global Bank 4 X X X / Foreign ExchangeRetail and Commercial
Banking30+ countries
EU Regional Bank 2 X X X / / CorporateCentral and Eastern
Europe
EU Regional Bank 3 X X X /Securities Services
Capital MarketsCommercial Banking Europe
Pacific Regional Bank 1 X X / Issuing / Corporate Pacific Region
Type 3: Banks with services provided by separate business lines
EU Regional Bank 4 X X X / / CIB Western Europe
EU Regional Bank 5 X X X Issuing Securities Services CIB Western Europe
EU Regional Bank 6 X X X / Securities Services Commercial Banking Northern Europe
EU Regional Bank 7 X X X / / Retail Banking Western Europe
CEE Regional Bank 2 X / X /Factoring
Securities ServicesCIB, Commercial
BankingCentral and Eastern
Europe
India Local Bank 1 X / X / / Commercial banking Domestic
India Local Bank 2 X / X / / Commercial banking Domestic
US Local Bank 1 X X / Issuing / Commercial banking Domestic
EU Regional Bank 8 X / / / / Commercial bankingWestern Europe,
Latin America
EU Regional Bank 9 X / / / / NA Western Europe
Germany Local Bank 1 X X / / Internet Systems Commercial banking Domestic
China Local Bank 1 X / X / / Commercial banking Domestic
1 Issuing refers to issuing of corporate/commercial cards.Source: Company reports and web sites; Capgemini research and analysis, 2009.
GloBAl TRANSACTioN SERViCES

52
OFFERINGS NEEd TO EvOLvE ANd SATISFy A RANGE OF CLIENT NEEdS
From our discussions it appears large amounts of money are being devoted by banks to technical infrastructure, but not so much to renewing and adapting their range of products and services. Currently, given heightened sensitivity to risk, corporates say they would be reluctant to award their transactions business to inexperienced new entrants, but the competition is getting ready nevertheless.
Banks will need to develop value-added services to retain their corporate clients in the long term and to secure future sources of revenue. This is especially true for European-centred banks as SEPA will likely standardise prices. if banks do not provide the services their clients expect, new entrants will do so, relegating banks to the highly commoditised business of transaction processing.
GTS divisions will also need to develop corporate solutions for dealing with counterparty-risk concerns, increasing efficiency and optimising working capital (as discussed in the last chapter).
To meet the many needs of large corporate clients, particularly in the context of SEPA, banks must be able to demonstrate the following: � Strategic vision and commitment to the GTS business; � innovation in service offerings; � Global geographic coverage with local support; � dedicated sales and support teams; � Competitive pricing; � SEPA value-added services (e.g., Sdd mandate management, e-invoicing, iBAN-BiC services); � Resilience and back-up facilities.
Figure 3.7 GTS Organisational Types
Source: Capgemini research and analysis, 2009.
Global players
EU Regional Banks 4 to 9
EU Global Bank 4 US Global Banks 1, 2, 3
EU Global Bank 5 EU Global Banks 1, 2
CEE Regional Bank 1
EU Regional Bank 1
Germany Local Bank 1
China Local Bank 1
US Local Bank 1 Pacific Regional Bank 1
India Local Banks 1, 2 EU Regional Bank 3
CEE Regional Bank 2 EU Regional Bank 2
Geographical Reach
GTS Integration Level
Type 1: Banks with corporate GTS structures
Type 2: Banks with matrix structures
Type 3: Banks with services provided by separate business lines
Regional/ Domestic players

WoRld PAyMENTS REPoRT 2009
Conclusion
What Does the Future Hold for GTS?
GTS OuTLOOk IS POSITIvE wITH DEmAnD ExPECTED TO GROw
GTS executives we interviewed say the GTS business will certainly benefit from the current “back to basics” trend in banking, and they see the following shifts in the landscape:
� Cash / liquidity management activity is expected to perform well because of increased liquidity inflows from corporates, which are seeking to optimise their working capital and face a reduction in sources of external funding amid tighter credit conditions.
� Trade finance has begun to suffer from the decline in global trade volumes since the beginning of 2009. Some banks say the decline has yet to affect their trade-finance revenue because they have raised prices to reflect increased risk levels, offsetting the impact of lower volumes.
� The number of payment transactions is steadily growing (see World non-cash payments markets and trends section), automatically increasing revenues for banks that have a payments-oriented product mix. However, some banks we interviewed reported a fall in cross-border payments volumes since the beginning of 2009.
In short, the crisis has strengthened the position of GTS as a fee-based revenue-generating business that can provide liquidity in times when sources of bank financing are scarce.
SCALE IS CRITICAL TO SuCCESS SO numbER Of PROvIDERS wILL COnSOLIDATE
While the outlook for GTS demand is relatively favourable, revenues are likely to come under pressure from increased competition and changing regulations and market conditions. Pure transactions processing is being commoditised, so banks will certainly need to find new sources of income, such as added-value services for large corporates.
With scale being so critical to the viability of GTS competitors, industry consolidation is inevitable. In fact, bankers we interviewed expect no more than five truly global transaction services players to remain in five years’ time. New industrial models will inevitably emerge, with increased sourcing deals likely between key players. For regional players, building a successful GTS franchise will require continued commitment to the business, and an adequate investment effort in product development and processing capabilities to provide corporate customers with services that fully meet their needs.
In the European market, it is clear the SEPA initiative will be a key driver for building and achieving scale—taking advantage of the opportunities that SEPA presents in this respect will be a future critical success factor for a GTS business operating in the Eurozone.
53WoRld PAyMENTS REPoRT 2009

54

55WoRld PAyMENTS REPoRT 2009
This year’s World Payments Report offers insights on the payments segments in the following areas: � North America: US and Canada; � Europe:
– The thirteen countries that were members of the Eurozone in 2007: Austria, Belgium, Finland, France, Germany, Greece, ireland, italy, luxembourg, Portugal, Netherlands, Slovenia, and Spain. (Cyprus and Malta joined in 2008 and Slovakia in 2009.) – Four non-Eurozone countries: the Uk, denmark, Sweden and Poland.
� Asia-Pacific: Australia, China, india, Japan, Singapore, hong kong and South korea; � latin America: Brazil and Mexico; � Central Europe, Middle-East, Africa (CEMEA): Russia, Ukraine, Turkey, South Africa, Saudi Arabia and Africa.
Several sources were used for the analyses. Figures for the US, Canada, Japan, hong kong and Singapore were taken from the latest Bank for international Settlements payment statistics (Red Book, 2008). The source of figures for the Eurozone was the ECB’s payment statistics (ECB Statistical data Warehouse, 2008). it should be noted the ECB makes regular and retroactive updates of its payment statistics. For the remaining countries, figures were taken from central bank publications and websites. Macroeconomic indicators (GdP and population) were collected from the World Bank and international Monetary Fund (iMF).
due to the numerous revisions in official data made by the ECB, prior-year data may diverge from data initially reported in the 2008 WPR. Also note a 2007 change in Germany’s methodology for collecting certain payments data causes a break in the time series, and means 2007 data is not directly comparable with previous years. The 2007 estimate for German non-cash transaction volumes was calculated using the same growth rate as for 2006-07 (6.57%).
in order to provide regional and global data sets, estimates have been calculated for those countries not specifically researched, and then grouped under the appropriate regional heading: other Asian countries, other latin America countries, and other CEMEA countries.
For worldwide macro descriptive graphs (number of transactions per region) seven regions were defined: Europe without Russia, North America, Japan-Australia-South korea-Singapore, BRiC (Brazil, Russia, india, China), latin America without Brazil, Rest of Asia, and CEMEA, grouped by geographic, economic, and non-cash payment market maturity criteria.
For European macro descriptive graphs (volumes, payment means, and number of transactions), seventeen countries were surveyed: all Eurozone countries as described above and the four non-Eurozone countries (the Uk, denmark, Sweden and Poland).
The source used for the Workers’ Remittances Market Evolution is the World Bank Migration and Remittances Factbook 2008 and for the World Exports Evolution, the World Trade organisation Secretariat.
2008 data for cards transaction in the US and in Europe was published by Visa, MasterCard, American Express, discover and JCB and diners Club.
For Figure 1.9, the analysis of cash-in-circulation versus non-cash transactions was conducted on all Eurozone countries to give the widest possible view. Notes of €200 and €500 were excluded from the study, as these large-currency notes are largely used for hoarding rather than for payments. Several sources were used to determine the number of non-cash transactions per inhabitant. Figures on non-cash transactions were taken from the latest ECB payment statistics (ECB Statistical data Warehouse, 2008), macroeconomic indicators are from the World Bank, and cash figures were provided by the ECB and National Central Banks.
The methodology for this report also incorporates 36 interviews, conducted in June 2009 with 16 major GTS banks and 20 of their corporate clients.
Methodology

56
AChAutomated Clearing House
ATMAutomated Teller Machine
B2BBusiness-to-Business
BICBank Identifier Code (ISO 9362 Norm)
Biometric AuthenticationBiometrics use unique physical characteristics (e.g., finger prints, hand and palm geometry, iris recognition) to verify identity
BRICRefers collectively to the countries of Brazil, Russia, India, and China
CAGRCompound Annual Growth Rate
CEMEACentral Europe, Middle-East, Africa
C/ICost/income ratio
Contactless PaymentContactless payment devices use radio frequency identification (RFID) technology to let users make purchases by holding an RFID-enabled device such as a mobile phone in proximity to a reader
Critical MassIn the SEPA context, the level of SEPA product adoption needed to ensure an irreversible move to SEPA instruments. Critical mass is generally not quantified in national migration plans
CSMClearing and Settlement Mechanism
dDate of receipt of a payment order (in the context of the PSD’s execution time requirements)
ddDirect Debit
EACB European Association of Co-operative Banks
EBAEuro Banking Association
EBF European Banking Federation
ECEuropean Commission
ECBEuropean Central Bank
ECB dWhEuropean Central Bank’s Statistical Data Warehouse (DWH), the official ECB publication covering the main payment and securities settlement systems in EU Member States
EEAEuropean Economic Area
EfmaEuropean Financial Management & Marketing Association
EGExpert Group
e-invoicingelectronic (e-) invoicing is a solution for secure exchange of invoice data between suppliers and buyers
Glossary
EMv chipEuropay MasterCard Visa chip – a global standard for cards, POS and ATM terminals in relation to credit and debit card payments
EPCEuropean Payments Council
EUEuropean Union
EU27The 27 members of the European Union
EurozoneThe Eurozone comprises the Member States of the EU that have adopted the euro as their national currency. Eurozone data in the first Chapter of this report covers the thirteen countries that were members in 2007 – Austria, Belgium, Finland, France, Germany, Greece, Ireland, Italy, Luxembourg, Netherlands, Portugal, Spain and Slovenia. Since then, Cyprus, Malta and Slovakia have also joined, bringing the number of Eurozone members to 16 as of 2009
GdPGross Domestic Product
GTSGlobal Transaction Services, sometimes known as Global Transaction Banking (GTB)
IATInternational ACH Transactions
IBANInternational Bank Account Number (ISO 13616 Norm)
IMFInternational Monetary Fund

57WoRld PAyMENTS REPoRT 2009
Interchange feeThe fee paid by the acquirer to the issuer mainly to reimburse for payment guarantees, fraud management, and issuer processing costs
ISOInternational Organisation for Standardisation
ISO 20022Abbreviated term referring to the ISO message scheme used by SEPA instruments
Legacy paymentsTerm used to describe domestic payment instruments that pre-date SEPA
M-paymentsMobile payments
MandateIn payments, the “mandate” is the authorisation required
MBPMultilateral Balancing Payment is the multilateral interchange fee on direct debits
MIFMultilateral Interchange Fee
NFCNear-Field Communications (short-range wireless technology) used for contactless payments. When an NFC device (e.g., smartcard or mobile phone) passes close to a reader, data is transmitted between the two
Non-Cash PaymentsPayments made with instruments other than notes and coins, i.e., using credit transfers, direct debits, credit or debit cards or cheques
P&LProfit & Loss
PA Public Administration
PE-AChPan-European ACH, a clearing house that processes domestic and cross-border SEPA payments alike, and has full reach to all Scheme Participants across SEPA
PIPayment Institution
PINPersonal Identification Number
POSPoint-of-Sale
PSdPayment Services Directive
PSPPayment Service Provider
Red BookAn official publication of the Bank for International Settlements (BIS)
RIBRelevé d’Identité Bancaire, French bank account details
ROIReturn on Investment
SCFSEPA Cards Framework
SCTSEPA Credit Transfer
SddSEPA Direct Debit
SEPAThe Single Euro Payments Area is a domain in which the EU31 is standardising all euro payments and collections so they can be treated as domestic transactions
SEPA InstrumentsEuro payments instruments that comply with the SEPA Rulebooks
SMEsSmall and Medium-sized Enterprises
SMSShort Message Service (more commonly known as text-messaging)
STEP2The EBA’s pan-European retail payments platform for SEPA Credit Transfers and Direct Debits
STPStraight-Through Processing
SWIFTSociety for Worldwide Interbank Financial Telecommunication
xMLExtensible Mark-up Language; facilitates the sharing of structured data across information systems

58
Capgemini, one of the world’s foremost providers of consulting, technology and outsourcing services, enables its clients to transform and perform through technologies. Capgemini provides its clients with insights and capabilities that boost their freedom to achieve superior results through a unique way of working, the Collaborative Business Experience. The Group relies on its global delivery model called Rightshore®, which aims to get the right balance of the best talent from multiple locations, working as one team to create and deliver the optimum solution for clients. Present in more than 30 countries, Capgemini reported 2008 global revenues of EUR 8.7 billion and employs over 90,000 people worldwide.
We bring deep industry experience, enhanced service offerings and next generation global delivery to serve the financial services industry. With a network of 12,000 professionals serving over 900 clients worldwide, we move businesses forward with leading services and best practices in banking, insurance, capital markets and investments.
We leverage our Global Payments Centre of Excellence to consistently deliver leading payments services for strategic value. our global Centres of Excellence capture industry insights, best practices and the latest trends in techniques, tools and technology to continually upgrade solutions, help service new and existing clients, and provide visionary yet practical thought leadership.
For more information or to download our reports, visit www.capgemini.com/financialservices
The RBS group is a large international banking and financial services company. headquartered in Edinburgh, the Group operates in the United kingdom, Europe, the Americas and Asia, serving more than 40 million customers. The Group provides a wide range of products and services to personal, commercial and large corporate and institutional customers through its two principal subsidiaries, The Royal Bank of Scotland and NatWest, as well as through a number of other well known brands including, Citizens, Ulster Bank, Coutts, direct line and Churchill.
Global Transaction Services (GTS) at RBS is a global top-five business for international payments. The business comprises three key areas: global cash and liquidity management, global trade services and merchant acquiring and commercial cards. GTS is established globally with on ground presence in over 38 countries and partner bank agreements worldwide.
Visit www.rbs.com
Efma promotes innovation in retail finance in Europe by fostering debate and discussion among the main players involved in change. Formed in 1971, Efma comprises 2,450 different brands in financial services worldwide today, including 80% of the largest European banking groups.
Through regular events, publications, and its comprehensive website, the association provides retail financial service professionals with answers to their questions about the main issues at stake in their business: multiple distribution strategies, customer approach, CRM, product and service marketing and improving profitability.
Efma is above all a dynamic association, providing a great opportunity for discussion and exchanges without any commercial constraints. it provides its members with a wide range of exclusive services as well as discount rates on non-gratuitous activities. The loyalty of its members, as well as their permanent financial support are the best proof of its efficiency.
For more information, www.efma.com
About Us
We thank all the banks and corporations who participated
in interviews as part of our research for this report. The following companies are
among the participants who agreed to be publicly named:
Banks:
Australia and New Zealand Banking Group
Barclays
BNP Paribas
Calyon
Citigroup
Deutsche Bank
ING
JPMorgan Chase
Nordea
SEB
UniCredit
We also thank the following contributors to this report: Shamira Alidina,
Andy Brown, Karen Cohen, Andrew Copeman, Marc Fargeas, Alexander Galanidis,
Rob Jamieson, Gerald Kountul, Marion Lecorbeiller, Kamal Mishra,
Simon Newstead, Axelle Reynier, Laurent Saiag, Thomas Sasse, Momar Sock,
Christophe Vergne, Rishi Vijay, Martina Weimert, Paul Whitmore, and Jackie Wiles.
Corporates:
ACOSS
Daimler
Equens
France Telecom
S2P
© 2009 Capgemini and The Royal Bank of Scotland plc (RBS). All Rights Reserved. Capgemini and RBS, their services mentioned herein as well as their respective logos, are trademarks or registered trademarks of their respective companies. All other company, product and service names mentioned are the trademarks of their respective owners and are used herein with no intention of trademark infringement. No part of this document may be reproduced or copied in any form or by any means without written permission from Capgemini and RBS.
disclaimer The information contained herein is general in nature and is not intended, and should not be construed, as professional advice or opinion provided to the user. This document does not purport to be a complete statement of the approaches or steps, which may vary accordingly to individual factors and circumstances, necessary for a business to accomplish any particular business goal. This document is provided for informational purposes only; it is meant solely to provide helpful information to the user. This document is not a recommendation of any particular approach and should not be relied upon to address or solve any particular matter. The information provided herein is on an “as-is” basis. Capgemini, RBS and Efma disclaim any and all warranties of any kind concerning any information provided in this report.

For more information, please contact:Capgemini [email protected] [email protected] Efma [email protected]
For press inquiries, please contact:Emma Hedges [email protected] Karen Cohen [email protected] Alidina [email protected]
Visit www.wpr09.com
www.capgemini.com/wpr09
www.rbs.com