world views, political attitudes and risk perception
TRANSCRIPT

RISK: Health, Safety & Environment (1990-2002) RISK: Health, Safety & Environment (1990-2002)
Volume 9 Number 2 Article 6
March 1998
World Views, Political Attitudes and Risk Perception World Views, Political Attitudes and Risk Perception
Lennart Sjöberg
Follow this and additional works at: https://scholars.unh.edu/risk
Part of the Cognition and Perception Commons, and the Sociology Commons
Repository Citation Repository Citation Lennart World Views, Political Attitudes and Risk Perception, 9 RISK 137 (1998).
This Article is brought to you for free and open access by the University of New Hampshire – Franklin Pierce School of Law at University of New Hampshire Scholars' Repository. It has been accepted for inclusion in RISK: Health, Safety & Environment (1990-2002) by an authorized editor of University of New Hampshire Scholars' Repository. For more information, please contact [email protected].

World Views, Political Attitudes and Risk Perception World Views, Political Attitudes and Risk Perception
Cover Page Footnote Cover Page Footnote This article summarizes some of the findings for a study that was conducted within a CEC project coordinated by Dr. Jean Brenot, IPSN, Paris.
This article is available in RISK: Health, Safety & Environment (1990-2002): https://scholars.unh.edu/risk/vol9/iss2/6
World Views, Political Attitudesand Risk Perception*
Lennart Sj6berg**
IntroductionIn 1982, Douglas and Wildavsky published a widely acclaimed
book in which they suggested a link between risk perception andCultural Theory concepts. 1 Proponents claim that it can explainindividual differences in risk perception better than other approaches,such as personality and political attitudes. 2 The theory, with a basis inanthropology, 3 has been regarded as a serious alternative to thepsychological, so-called psychometric approach,4 for explainingperceived risk, although comparisons of the two approaches consistentlydemonstrate that the psychometric model is superior when it comes toexplanatory power. 5 Yet, the Cultural Theory approach has seemedworthwhile since it claims to explain risk perception with variableswhich are semantically much more distinct from perceived risk than thepsychometric scales, and perhaps due to its attractive face validity. Itseems perfectly sensible, and the need for empirical study of itsexplanatory value is great.
Cultural Theory is a complex conceptual structure and much workon the theory has been concerned with theoretical analysis or has used* I am indebted to Professor Robert Levine for his help in recruiting respondents
and collecting data. The study was conducted within a CEC project coordinated byDr. Jean Brenot, IPSN, Paris.** Dr. Sji5berg is Professor of Psychology and Head, Center for Risk Research ofthe Stockholm School of Economics. Email: [email protected] Mary Douglas & Aaron Wildavsky, Risk and Culture (1982).2 See Aaron Wildavsky & Karl Dake, Theories of Risk Perception: Who Fears
What and Why? 119 (4) Daedalus 41 (1990).
3 See Asa Boholm, Risk Perception and Social Anthropology: Critique ofCultural Theory, 61 Ethnos 64 (1996).4 See Baruch Fichoff et al., How Safe is Safe Enough? A Psychometric Study ofAttitudes Towards Technological Risks and Benefits, 9 Pol'y Sci. 127 (1978).5 See Lennart Sjdberg, A Discussion of the Limitations of the Psychometric andCultural Theory Approaches to Risk Perception, 68 Radiation Protection Dosimetry219 (1996).
9 Rislk Health, Safety & Environment 137 [Spring 1998]

qualitative approaches to observing the phenomena postulated. Here Ideal only with the quantitative approach launched by Dake. 6 Dakedevised scales in a questionnaire format for measuring the three majordimensions of egalitarianism, individualism and hierarchy, and alsosome more experimental items for measuring fatalism. 7 Wildavskyand Dake reported promising results with the scales in an Americansample. 8 These scales have been adopted to various cultures; muchEuropean work has been done using a British version of the scales. Thescales have been denoted scales of cultural biases or World View scales;I shall use both terms in the present paper.
Researchers in several countries now use the scales in attempts tocarry out cross-cultural replications. The question then arises just how
well the World View scales explain risk perception. Dake originallyreported only bivariate correlations and excluded several hazards whichdid not correlate significantly with the world views. In a survey of later,mainly European, work the explanatory power of the world views,
based on multiple regression analyses, was only about 5%.9 Similarresults were obtained in a recent British study. 10 In my view, 5% is avery low level of explanatory power and not very promising.
Some1 1 argue that more reliable world view scales probably wouldshow much stronger relationships to risk perception, but, takingreliability estimates of the current scales12 into account, the correctedcorrelations will increase only from 5% to 7% explained variance. 13
6 Karl Dake, Technology on Trial: Orienting Dispositions Toward Environmentaland Health Hazards, (unpublished Ph.D. thesis, University of California, Berkeley,1990). See also, Karl Dake, Orienting Dispositions in the Perception of Risk, 22 J.Cross-Cultural Psychol. 61 (1991).7 A definite fatalism scale for the U.S. version was not available for the presentstudy; hence fatalism items were not included.8 See Wildavsky & Dake, supra note 2.
9 See Lennart Sj6berg, Explaining Risk Perception: An Empirical andQuantitative Evaluation of Cultural Theory, 2 Risk Decision & Pol. 113 (1997).10 See Marris, Langford, and O'Riordan, infra note 11.11 See e.g., Claire Marris et al., Integrating Sociological and PsychologicalApproaches to Public Perceptions of Environmental Risks: Detailed Results from aQuestionnaire Study, CSERGE Working Paper, Norwich University of East Anglia,Centre for Social and Economic Research into the Global Environment (1996).12 Reliabilities were not reported by Dake, but for his American scales reliabilityestimates can be found in the present paper.13 See Sjaberg, supra note 9.

Sji~berg WorldViews 139
Hence, the moderate reliability of the present scales is not a credibleexplanation of low correlations with risk perception.
Others argue that correlations are inadequate as measurement ofstrength of relationship and use various other statistics such as regression
coefficients and the comparison of extreme groups. Yet, regression
coefficients are scale unit contingent, and extreme groups can always be
selected so as to demonstrate an "effect" provided that they are chosen
so as to be sufficiently extreme. If regressions are linear and
homoscedastic, the Pearson coefficient, bivariate or multivariate, gives afair measure of strength of relationship. In the present work I will use
regression models to study the strength of the relationship between risk
perception and other variables, which will be measured as bivariate or
multivariate correlations.Most of the work on cultural biases reported above used the British
version of the scales. Serious doubts about the validity of the scales
and/or the theory were raised based on the findings. The need forfurther study with the American scales in the U.S. was obvious. It ispossible that the scales work better in their culture of origin and that
some essential characteristics are lost in attempts at transferring them toother cultures.
For these reasons, I have performed a study in the U.S. using theoriginal scales from Dake's dissertation. Several other scales were added
to throw further light on how to explain individual differences in riskperception. Ratings of perceived risk were added since Dake's data
were exclusively based on societal concerns. Concerns seem to be onlypartly related to risk perception. It is important to get informationabout the relationship between perceived risk and world views more
directly, hence the inclusion of risk ratings in the present study. Amajor alternative to explaining perceived risk is that of trust, 14 hence
trust ratings were added. Negative affectivity' 5 , or ratings ofsatisfaction with various everyday life events or facilities, seemed to be
14 Lennart Sjbeberg, Perceived Competence and Motivation in Industry andGovernment as Factors in Risk Perception, paper presented at The BellinghamInternational Conference on Social Trust in Risk Management, organized by theDepartment of Psychology, Western University of Washington, July 1996.15 See T. A. Judge & C. L. Hulin, Job Satirfction as a Reflection of Disposition:A Multiple Source Cause Analysis, 56 Organizational Behav. & Hum. DecisionProcesses 388 (1993).
9 Risk. Health, Safety & Environment 137 [Spring 1998]

an interesting further possibility to explore. It is reasonable to assume
that negative affectivity is expressed through judgments of large risks.
This dimension has not previously been discussed in the context of riskperception. I also added a section measuring risk perception in a format
which has been used in several international comparison studies.16 Themain purpose of this section was to get some information about thelevel of perceived risk of the particular group of respondents.
A major alternative to the World View scales is that of political
attitudes. Dake did consider such attitudes in his work and reported
that his scales were superior in explaining perceived risk. However, hedid not mention the major alternative offered in work by Rothman andLichter on many different kinds of elite groups. 17
Dake's operationalization of political ideology was as follows. He
asked subjects to rate themselves in terms of a liberal/conservative
dimension. To this he added ratings of support of 20 policies, eleven
scored as liberal and nine as conservative (the Libcon scale). Of these 20
policies, fourteen were not explicitly concerned with business oreconomics. In the Rothman-Lichter scales, purporting to measure
political ideology as well, only five of fourteen items were not business
or economics oriented. Hence, the items used by Dake appear to be
much more heterogenous than the Rothman-Lichter scales and to cover
a much wider range of issues. Thus they may have been considerablyless reliable when used to form a scale and it may be the case that items
oriented towards policies concerning business and economics are moreeffective in predicting risk perception than more general items
(although one of Dake's items in fact mentions nuclear policy explicitlyand therefore contributes to some semantic overlap with the risk rating
of nuclear power). It seemed important for these reasons to further
investigate the role of various political attitudes in risk perception.In summary, the purpose of the present paper was to study the
relationship between U.S. World View scales and risk perception, and
16 See e.g., Tibor Englander et al., A Comparative Analysis of Risk Perception inHungary and the United States, 1 Soc. Behav. 55 (1986); Maryla Goszczynska et al.,Risk Perception in Poland: A Comparison with Three Other Countries, 4 J.Behavioral Decision Making 179 (1991); Karl H. Teigen et al., Societal Risks as Seenby a Norwegian Public, 1 J. Behavioral Decision Making 111 (1988).17 See Sennley Rothman & S.Robert Lichter, Elite Ideology and Risk Perceptionin Nuclear Energy Policy, 81 Am. Pol. Sci. Rev. 383 (1987).

Sjaberg. WorldViews 141
also to investigate a number of alternative explanatory concepts. The
study is partly a replication of Dake's basic work and is particularly
motivated by the weak results his scales have achieved in several
European studies.
Method
In this investigation I included several scales, viz. the following:
(1) Dake's "Concerns about society today," 36 in all. They were
judged on 1-7 category scales, from "No problem at all" to "A very
extreme problem". They were all phrased as originally in Dake's work
with one exception. The item "Threat of Soviet expansion" was
changed to "Threat due to instability of the Russian Federation".(2) The same 36 concerns, but now judged with regard to trust.
The respondents were asked to state their degree of confidence in how
well officials (federal, state or local) handle the problems, whether they
were trustworthy and competent. Judgements were made on 7 category
scales from "Handled extremely well" to "Handled extremely badly".(3) 24 items for measuring the three cultural biases, 8 for each bias.
They had the form of statements, and subjects were asked to rate to
which extent they agreed or disagreed, on 7 category scales from"Strongly disagree" to "Strongly agree".
(4) Thirteen items, also in the form of statements and rated in the
same manner as the cultural bias statements, measuring the Rothman-Lichter dimensions of political attitude. There were 8 items for
measuring liberalism and 5 for alienation.(5) Twenty items for measuring the Libcon scale of Constantini and
Craik. 18 This scale consists of 20 policies and the subjects are
instructed to state to which extent they agree or disagree with each ofthem, on a 4 category scale from "Not at all supportive" to "Supportvery much". After appropriate reversals of conservative policy items, a
scale of liberalism is achieved, called the Libcon scale.(6) A measure of negative affectivity. 19 25 items were judged with
regard to how satisfactory they were, on 7 category scales from
"Extremely unsatisfactory" to "Extremely satisfactory". These were
18 See Edmond Constantini & Kenneth H. Craik, Personality and Politicians:California Party Leaders, 1960-1976, 38 J. Personality & Soc. Psychol. 641 (1980).19 Judge & Hulin, supra note 15.
9 Risk Health, Safety & Environment 137 [Spring 1998]

general items intended to measure a general tendency to be unsatisfiedwith various things in life.
(7) 51 risk items, sampling various technology and environmentrisks. They were judged on 21 step scales, going from 0 ("Non-existentrisk") to 100 ("Extremely large risk"). These items have been used in anumber of international comparison studies.
(8) Background data: gender, age, education, type of business ororganization where the respondent was employed, one item measuringself-rated political orientation (liberal vs. conservative), ethnicity, andfamily income.
Subjects were 141 members of a church organization in Fresno,California. The subjects were each paid $10 for responding to thequestionnaire, money which was donated to their church. Of theserespondents, 50 were male and 91 female. Their average age was 51.7years, 88% were Caucasians and 79% were college graduates. About60% described their political opinion as liberal. Modal family incomein 1994 was U.S. $42,000. The average rating of the 51 risks was 41.34,very close to the US value cited in previous comparative work (seeabove), which was 41.35. It should be noted that this is a high level ofrated risk, considerably higher than observed in Scandinavia.
Results
Reliabilities (Cronbach's alpha) of the cultural bias scales were0.603, 0.728 and 0.689 for hierarchy, individualistic and egalitarianscales, respectively. These values are better than what was obtained forthe British version in several studies described in a previous report.2 0
The Libcon scale21 gave a reliability of 0.777, and the Rothman-Lichter scales 0.615 and 0.555 for liberalism and alienation. Negativeaffectivity was measured with an alpha of 0.762, average trust with0.946. Average concern was also used and had an alpha value of 0.916.
Initially, cultural biases, average trust, and political attitudes (threescales) were correlated with societal concerns; see Table 1.
20 See Sjbberg, supra note 9.21 See Constantini & Craik, supra note 18.

Sjisberg: World Views 143
Table 1Correlating Societal Concerns, Cultural Biases, Affect, Trust, and Political Attitudes
Concern
.. 2.
1. Decline in nationalwealth
2. U.S. interference inforeign affairs
3. Civil disobediencee.g. illegal politicalacts)
4. The lack of a stableinvestment climate
5. Absence of strongnational leadership
6. Threat due toinstability of theRussian Federation
7. Economic inflation8. Environmental
pollution9. Middle East conflict10. Poverty and
unemployment11. Decline in moral
values12. Federal over-
regulation13. Dangers
associated withnuclear energy (e.g.nuclear waste)
14. Loss of respect forauthority
15. Misuse of scientificand expert knowledge
16. Excessivepermissiveness insociety
17. Decline in publicconfidence in mostmajor institutions
18. Increased crime
-0.03 0.20
0.31 0.03
-0.18 0.42
0.04 0.24
0.27 -0.04
-0.06 0.19
0.18 0.090.29 -0.17
0.23 -0.15
0.57 -0.44
0.06 0.13
-0.13 0.40
0.29 -0.23
0.22 0.04
0.00 -0.16
0.34 0.01
0.26 -0.09
0.08 -0.19
0.28 -0.01
0.09 -0.10-0.14 -0.15
-0.14 0.02
-0.35 -0.03
0.24 0.02
0.21 0.05
-0.17 -0.08
-0.05 0.32 0.31 -0.02
0.25 -0.10 -0.04 -0.15
0.02 0.19 0.32 -0.14
0.34 0.01 0.15 -0.02
0.06 -0.18
0.38 0.10
0.05 -0.35
0.28 -0.24
0.48 0.04
0.06 -0.17
0.37 0.000.28 0.27
0.14 0.20
0.37 0.51
0.23 -0.13
0.27 -0.44
0.34 0.28
0.11 -0.28
0.36 0.13
0.30 -0.12
-0.03
0.37
-0.04
0.01
0.20
-0.08
0.180.14
0.070.39
-0.04
0.05
0.13
-0.02
0.09
0.01
0.20
0.02
0.37
0.29
0.05
0.20
0.07-0.19
-0.04-0.44
0.13
0.42
-0.19
0.23
-0.10
0.18
0.35 0.02 0.19 -0.01
-0.10 0.20 0.26 -0.05 0.12 -0.18 0.02 0.19
9 Risk. Health, Safety & Environment 137 [Spring 1998]

Table 1 (continued)
Concern
42'z±Z,
19. Worldwide 0.28 -0.25overpopulation andstarvation
20. National debt 0.10 -0.0321. Foreign attack on -0.15 0.36
the U.S.22. Corruption in the 0.24 -0.06
political process23. Lack of law and order 0.03 0.2624. Downfall of U.S. as -0.06 0.25
a major world power25. Breakdown in 0.25 -0.01
social/interpersonalharmony
26. Decline in 0.17 0.06productivity andinnovation
27. Rapid economic 0.22 0.03growth
28. Threat of nuclear 0.20 -0.05war and annihilation
29. Concentration of 0.42 -0.25power in "big"government andindustry
30. Dangers 0.36 -0.16associated withtechnology
31. Strikes and -0.12 0.27boycotts
32. Racial injustice 0.59 -0.4133. Breakdown in 0.30 -0.21
cooperation anddecision-makingprocesses
34. Energy shortages 0.19 -0.1035. Demonstrations -0.17 0.18
and protests36. Restriction of civil 0.43 -0.33
liberties
-0.16 -0.13
0.05 -0.020.39 0.04
-0.05 -0.13
0.220.32
0.05
0.08
-0.02-0.00
-0.14
-0.13
0.01 -0.17
-0.04 0.06
-0.13 -0.14
-0.19 -0.19
0.24 0.07
-0.36 -0.04-0.15 0.00
-0.03 -0.220.26 0.03
-0.29 -0.11
0.14 0.23 0.15 -0.21
-0.06 0.11 0.03-0.32 -0.17 0.25
0.08 0.24 -0.13
-0.20 0.04 0.16-0.30 -0.14 0.27
0.10 0.18 -0.06
0.34 0.00 -0.05 0.07
0.03 0.21 -0.07
0.11 -0.10 -0.04
0.50 0.22 0.37 -0.22
0.37 0.19 0.32 -0.20
0.06 -0.22 -0.08
0.31 0.51 0.310.44 0.13 0.18
0.41-0.04
0.47
0.09 0.12-0.17 -0.23
0.32 0.38
0.22
-OA1-0.20
-0.18
0.19
-0A1
Zn *
Sj5berg: WorldViews 145
58.3% of the correlations between societal concerns and culturalbiases were statistically significant. The affect scale was on the wholeunrelated to concerns, while trust was the variable which had the mostpervasive relationship with concerns. Political attitudes were related toconcerns at about the same level (only somewhat lower) as the culturalbiases. It is striking that the Rothman-Lichter scales, which did so wellin their study for explaining perceived nuclear power risk, performed ina very mediocre manner in the present study.
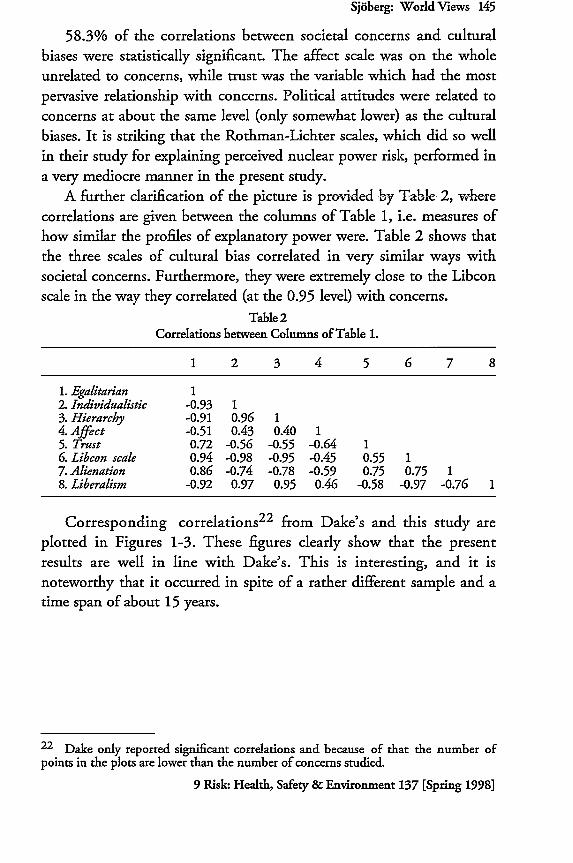
A further clarification of the picture is provided by Table 2, wherecorrelations are given between the columns of Table 1, i.e. measures ofhow similar the profiles of explanatory power were. Table 2 shows thatthe three scales of cultural bias correlated in very similar ways withsocietal concerns. Furthermore, they were extremely close to the Libconscale in the way they correlated (at the 0.95 level) with concerns.
Table 2Correlations between Columns of Table 1.
1 2 3 4 5 6 7 8
1. Egalitarian 12. Individualistic -0.93 13. Hierarchy -0.91 0.96 14. Affect -0.51 0.43 0.40 15. Trust 0.72 -0.56 -0.55 -0.64 16. Libcon scale 0.94 -0.98 -0.95 -0.45 0.55 17. Alienation 0.86 -0.74 -0.78 -0.59 0.75 0.75 18. Liberalism -0.92 0.97 0.95 0.46 -0.58 -0.97 -0.76 1
Corresponding correlations22 from Dake's and this study areplotted in Figures 1-3. These figures clearly show that the presentresults are well in line with Dake's. This is interesting, and it isnoteworthy that it occurred in spite of a rather different sample and atime span of about 15 years.
22 Dake only reported significant correlations and because of that the number ofpoints in the plots are lower than the number of concerns studied.
9 Risk. Health, Safety & Environment 137 [Spring 1998]

Figure 1 - Egalitarianism
0.2
0.0
0
o -0.2
-0.6 '-0.6 -0.4 -0.2 0.0 0.2
Correlations, Dake's Results
Figure 2 - Individualism
0.6
0.4 4
S0.2
0.0
0' -0.2 •
-0.4
-0.6 -0.4 -0.2 0.0 0.2
Correlations, Dake's Results
0.4 0.6
o.4 0.6
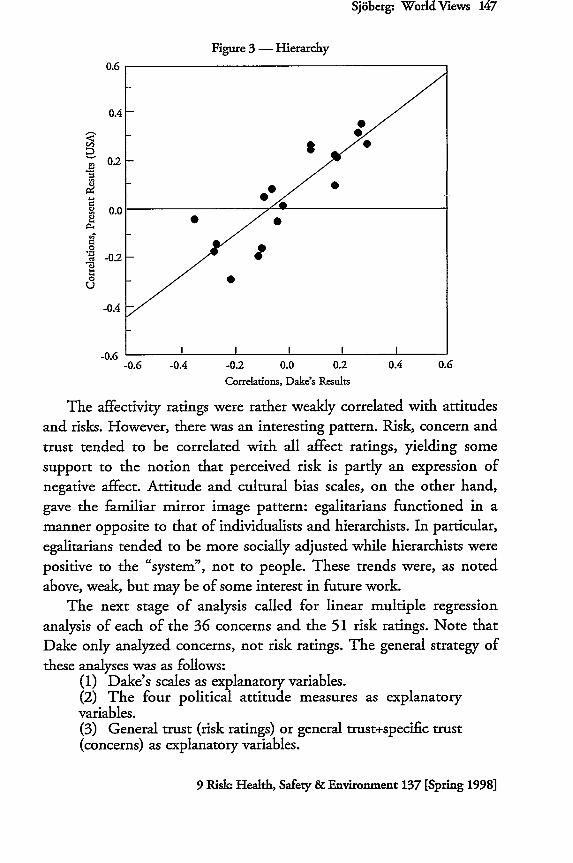
Sjiberg- WorldViews 147
Figure 3 -Hierarchy0.6
0.4
0.2
t -0.2
0U
-0.4
-0.6-0.6 -0.4 -0.2 0.0 0.2 0.4 0.6
Correlations, Dale's Results
The affectivity ratings were rather weakly correlated with attitudesand risks. However, there was an interesting pattern. Risk, concern and
trust tended to be correlated with all affect ratings, yielding somesupport to the notion that perceived risk is partly an expression ofnegative affect. Attitude and cultural bias scales, on the other hand,gave the familiar mirror image pattern: egalitarians functioned in amanner opposite to that of individualists and hierarchists. In particular,
egalitarians tended to be more socially adjusted while hierarchists werepositive to the "system", not to people. These trends were, as notedabove, weak, but may be of some interest in future work.
The next stage of analysis called for linear multiple regressionanalysis of each of the 36 concerns and the 51 risk ratings. Note thatDake only analyzed concerns, not risk ratings. The general strategy ofthese analyses was as follows:
(1) Dake's scales as explanatory variables.(2) The four political attitude measures as explanatoryvariables.(3) General trust (risk ratings) or general trust+specific trust(concerns) as explanatory variables.
9 Risk. Health, Safety & Environment 137 [Spring 1998]

(4) Risk sensitivity, concern sensitivity, negative affect andtrust as explanatory variables (The first two variables weremean ratings of risks and concerns, from which therespective dependent variable had been deleted).(5) Same as (4), but with Dake's three dimensions added.
The mean proportion of explained variance under the 5 stages is givenin Table 3.
Table 3Average explained variance of concerns and risks
Dake scales Political Trust, Trust, Trustattitudes affect, affect,
sensitivity sensitivity& Dakescales
Societal concerns 0.093 0.071 0.231 0.357 0.395Risk ratings 0.034 0.027 0.026 0.479 0.487
The added share of explained variance for the Dake scales in the laststep of the analyses was only 0.038 for societal concerns and even less,0.008, for risk ratings.
DiscussionA methodological comment is in order. The group of subjects had a
higher than average education. However, education is only weaklycorrelated with risk perception, and hence not a seriously biasing factor.A more serious problem is the high proportion of female respondentssince it is well known that women tend to give higher risk ratings thanmen. Hence, the levels of perceived risk in the present data are probablybiased upwards. However, there is no reason to believe that correlationsare biased in a serious and systematic manner. The fact thatrespondents were active in a church organization does not causesuspicion that they may have been deviating from the general U.S.population in some important manners; it would have been otherwise inmany European nations.
The following conclusions are drawn from the present results:(1) The present sample successfully replicated the patternof correlations between societal concerns and cultural biasesas reported by Dake.

Sjidberg- WorldViews 149
(2) Cultural biases explained only a minor share of riskratings, but a somewhat larger share of concerns. The lattershare was larger than what could be expected on the basis ofprevious results but still rather minor. The addedexplanatory power due to the Dake scales was verymarginal, a few percent at the most.(3) Political attitudes were somewhat worse as explanatoryvariables than cultural biases, but not much. In particular,they could not explain the perceived risk of nuclear power;the proportion of explained variance was only 0.049 forconcern over this hazard.(4) The Dake scales and political attitudes had very similarexplanatory power across the 36 concerns. The two sets ofexplained variance correlated 0.895. Thus, whatever smallexplanatory power they had was largely in common. TheDake scales clearly belong to the general realm of politicalattitudes, where they are a variation on familiar themes.(5) Trust was important as an explanatory construct forsocietal concerns.(6) The most important explanatory variables for both riskperception and societal concerns were connected with scaleuse or sensitivity to risks and societal problems in general.The high levels of explained variance (about 40%) also showthat the dependent variables could be explained, and thatthe present data had enough individual variation to justifymeaningful analysis.
The concerns best explained by the Dake scales were not
technology related. They were:(1) poverty and unemployment,(2) racial injustice,(3) restrictions of civil liberties,(4) civil disobedience,(5) power concentration in "big" government and industry.
The few technology risk items among the societal concerns were
explained at the average level. The World View scales therefore do notseem particularly well suited for the task of explaining technology and
environment concerns and perceived risks. This is an important finding
because Cultural Theory has been particularly interesting to some
practitioners for the reason that it can allegedly explain risk perceptionof technology and environment related issues.
In my view the most likely explanation of the present results andthose reviewed in my previous work2 3 is that Cultural Theory simply
23 Sj~berg, supra note 9.
9 Riskl Health, Safety & Environment 137 [Spring 1998]
is wrong. Cultural biases are not major factors in risk perception, butmake a very minor contribution to its explanation. Variability withinthe general public in a country is probably due to factors other thancultural biases, perhaps trust24 and recreancy25 to some extent. Thefact that some people seem to function according to the theory2 6,stressed by Marris et al., is possibly interesting, but virtually all datashow very clearly that inter-individual differences in risk perceptionmust be explained in other ways.
Part of the differences between researchers may be due to differentways of using and interpreting statistics. I have relied on averageproportion of explained variance while Marris et al. preferred to stressmaximum explained variance. Of course, the maximum value across aset of, say, 36 societal concerns could be quite high in spite of an over-all mediocre performance of the explanatory variables. In my view it ismore informative to stress the average in order not to give a misleadingpicture of the power of the scales in explaining risk perception. Inaddition, significance testing continues to be a major source ofestablishing empirical findings27 in this field as in so many others. Yet,it is obvious that significance tells very little about how well a set ofvariables can explain a phenomenon. Some researchers seem to believethat non-significance implies a zero correlation (Dake did not evenreport his non-significant correlations), and that statistical significanceequals substantial importance. Both beliefs are erroneous.
An example of the varying attitudes to statistical evidence isprovided by the paper by Peters and Slovic.28 They used some Dakeitems and some additional ones to measure cultural biases. Peters andSlovic investigated correlations between the scales and various risk
24 Sj~berg, supra note 14.25 See William R. Freudenburg & S.K. Pastor, Public Response to Technological
Risks: Toward a Sociological Perspective, 33 The Soc. Q. 389 (1992).26 Marris, Langford & O'Riordan, supra note 11.27 See Frank L. Schmidt, Statistical Significance Testing and Cumulative
Knowledge in Psychology: Implications for Training of Researchers, 1 Psychol.Methods 115 (1996).28 See E. Peters, & Paul Slovic, The Role of Affect and World Views as OrientingDispositions in the Perception and Acceptance of Nuclear Power, 26 J. Applied Soc.Psychol. 1427 (1996) (Results are from a large-sample survey study with a rather lowresponse rate. The authors do not state if the respondents were biased with regard toeducation and income.).

Sjiaberg- World Views 151
judgments and found a number of, mostly very weak, but often
statistically significant correlations, which they describe in the text in a
somewhat optimistic manner. For example, the correlations between
the egalitarian subscale and technology concerns were -0.22, -0.10, -0.01 and 0.02, a not very impressive set of correlations. Nonetheless theauthors wrote "these data confirm the hypothesis that the Egalitarian
factor will be strongly related to concerns about technology." Other
examples of optimistic bias in interpretations could be given.29
Let us look at how much variance in risk perception was explained
by the World Views. For concerns, the mean share of varianceaccounted for by the fatalist/hierarchy, individualist and egalitarian
subscales were 0.037, 0.020 and 0.036, respectively. With the scales in
the same order, the corresponding values for health risks were 0.005,
0.005 and 0.022. It is surprising that Peters and Slovic describe thesetrivial results as "strong" relationships.
Marris et al. argue that the overall pattern of relationships supportCultural Theory and they do not seem troubled by the low correlations
explaining only some 5% of the variance. But such low correlations can
easily arise due to confounding with other variables they did not checkfor by computing partial correlations, such as gender or educationallevel. A theory worth its salt must explain a sizable proportion of thephenomenon it purports to explain.
Is there any hope at all to explain risk perception with general valuedimensions? Usually general value dimensions have been unable toexplain more than a tiny fraction of risk perception. The most
ambitious attempt so far to devise culturally comparable valuedimensions is due to Schwartz. 3 0 Indeed, I have found that the
Schwartz scales functioned somewhat better than other value scales inaccounting for perceived risk, but they still explained only a small
fraction of the data.3 1
We have conducted a major study of risk perception of householdwaste in which we included Schwartz's complete scale, with a
29 Sjaberg, supra note 9.30 See S. H. Schwartz, Universal in the Content and Structure of Values:Theoretical Advances and Empirical Tests in 20 Countries 25 Advances inExperimental Soc. Psychol. 1 (1992).31 Sjbberg, supra note 9.
9 Risle Health, Safety & Environment 137 [Spring 1998]

representative sample of the Swedish population, on the basis of areview of the literature on household waste and human behavior 3 2
carried out by our co-workers. Results show that the Schwartzdimensions are only weakly related to risk perception, 3 3 in goodagreement with results reported here.
A major exception to the assertion that general value dimensions donot explain risk is given in the work by Rothman and Lichter.34 Theywere able to explain more than 40% of the variance of perceived risk ofnuclear power plant operation on the basis of two ideologicaldimensions which they termed liberalism and alienation, in data fromseveral elite groups, excluding nuclear scientists. These elite groupsvaried widely, from military to liberal media leaders and it is likely thatthey, on the whole, varied much more than the general public in termsof perceived risk. The present results, however, do not support theRothman-Lichter approach of political attitudes to the explanation ofrisk perception. The reason for the discrepancy may be that theirmeasure of risk perception was quite different from the one used hereand possibly more semantically close to political attitudes.
In conclusion, it has been found that the World View scales accountfor only a very minor share of the variance of risk perception. Otherapproaches are clearly called for, and have been found, in one case, toaccount for some 60% of the variance of perceived risk.35
32 Gina Pinsky & Lotte Andersson, Motivational Factors in Waste-RelatedBehavior. A Review, AFR-Report 24, (Swedish Waste Research Council 1993).33 Lotte Andersson, Motivating Environmentally Responsible Behavior. AnEmpirical Study, AFR-Report, 50 (Swedish Waste Research Council 1994).34 See Rothman & Lichter, supra note 17.35 Lennart Sjbberg & Britt-Marie Drottz-Sjdberg, Risk Perception of NuclearWaste: Experts and the Public, RHIZIKON: Risk Research Report, 16. Center forRisk Research, Stockholm School of Economics (1994); See also, Sj6berg, supranote 5.